the political economy of corporate fraud: a theory and ... · pdf filewe also find that highly...
TRANSCRIPT

The Political Economy of Corporate
Fraud: A Theory and Empirical Tests
By
Bruce Bueno de Mesquita
(Politics Department, New York University and
Hoover Institution, Stanford University)
Alastair Smith
(Politics Department, New York University)
September 2004

1
Abstract
Guided by a theory of governance known as the selectorate theory (Bueno de Mesquita et
al, 2003), we examine how governance structures within publicly traded companies
affects corporate performance, the ease with which corporate executives lose their jobs
for poor performance, and the incentives of executives to misstate corporate performance
to protect their jobs. Firms are classified according to the number of individuals who
have a say in who should lead them (the selectorate) and the size of the group of
supporters a leader needs to gain or maintain control (the winning coalition). Using
publicly available data, we develop measures of these concepts within the corporate
setting and show that these governance structures influence corporate performance and
compensation packages used to reward management and stockholders. We compare
compensation packages and reported performance with those expected given governance
structures. Deviations from expectations provide predictors of fraudulent reporting that
allow for discrimination between firms that subsequently commit fraud (within two
years) and those that do not.

2
The Political Economy of Corporate Fraud: A Theory and Empirical Tests
I Introduction
Cases of fraudulent corporate reporting by managers who then cash out their
holdings are widely thought to corroborate the risk highlighted in principal-agent models
of the firm.1 The risk is that inadequate governance-constraints free managers to
expropriate the investments of financial backers (Coase 1937; Jensen and Meckling 1976;
Fama and Jensen 1983a, b; Baumol 1959; Marris 1964; Williamson 1964; Grossman and
Hart 1988; see Schleifer and Vishny 1997 for review). Yet, to our knowledge the
principal-agent framework has thus far not been shown to account for or adequately
predict accounting fraud. Alexander and Cohen (1996) and Baucus and Near (1991), to
be sure, examine how corporate performance and governance influences the likelihood
that firms engage in economic crime, but they do not focus specifically on accounting
fraud. Hansen, McDonald, Messier and Bell (1996) use a neural network to attempt to
predict accounting fraud but, as is the nature of neural network models, they do not
provide micro-foundations for their predictions.
In developed equity markets with adequate legal protection for investors, we
believe that securities fraud (also referred to as accounting fraud) is typically the result of
management trying to preserve shareholder value in order to protect their jobs in the face
of poor performance rather than as a result of a desire to defraud investors per se.
1 For instance, both President George W. Bush in his weekly radio address (June 29, 2002) and Federal Reserve chairman Allan Greenspan in testimony before Congress (New York Times, July 17 2002, p. A17) called for curbs on greed and in a recent Harris Interactive poll 90% of the public thought the recent collapses of such companies as Enron and Worldcom were the result of unfettered management greed (Roper Center 2002).
3
Building on this assumption, we model the likelihood of fraudulent reporting as a
function of each corporation’s reported performance; ownership oversight; and
institutionally induced incentives to govern truthfully. We then test key propositions and
offer out-of-sample evidence of the potential of the model discussed here – referred to as
the selectorate model (Bueno de Mesquita, Smith, Siverson, and Morrow [hereafter
BdM2S2] 2003)– to predict fraudulent corporate reporting among publicly-traded US
firms.
The paper proceeds as follows. Section II explains the model. Like others, we
focus on the principal-agent relationship between shareholders and firm managers (Berle
and Means 1932, Schleifer and Vishny 1997). However, we diverge from the standard
view that the agency problem arises because unconstrained managers maximize their
compensation at the expense of shareholders (Fama and Jensen 1983a, b; Aggarwal and
Samwick 1999). Rather, we assume that the primary interest of managers is to retain their
jobs and that the agency problem arises because of this motivation. Job retention is
thought to be primary because managers value their long-term income stream over short-
term gains and because they attach value to exercising control (Caplow 1968; Holmstrom
1999). The selectorate model shows how variations in internal governance structures
influence the tradeoff between management’s urge to increase its compensation and its
desire to retain its corporate leadership position.
Others, of course, consider job retention as a potential motivator of actions by
firm managers. Jensen and Ruback (1983) drew attention to the costs for firms associated
with efforts by unsuccessful managers to retain their jobs. Jensen and Meckling (1976)
and Fama (1980) investigated how the contractual risk of termination creates incentives

4
for managers to try to produce good corporate performance. While studies, such as
Weisbach (19880), Yermack (1996) and Denis et al (1997), find evidence that poor
performance increases the risk of CEO turnover, executive dismissal remains relatively
uncommon. These studies highlight the role of management structure and firm ownership
in shaping the threat of dismissal. Dismissals for poor performance are relatively rare.
Weisbach (1988) estimates that if firms are ranked by stock return performance then,
even in the lowest decile of firms, the CEO turnover rate is only 6.1%. As Jensen (1993)
observes, boards of directors are generally captured by management, making it difficult
for boards to dismiss managers. Warner, Watts, and Wruck (1988) demonstrate, however,
that boards are willing to dismiss managers when faced with truly bad performance.
These results are reinforced by Martin and McConnell (1991) in the context of corporate
takeovers. As we emphasize, one reason for committing fraud is to cover up the firm’s
true record to avoid dismissal. If fraud is perpetrated successfully, it goes undetected and
so few dismissals are observed. Only when circumstances preclude a successful cover-up
is fraud likely to be uncovered. Dismissal follows once the truly disastrous circumstances
of the firm come to light. Whether discovered ex post or not, the threat of dismissal can
be the primary ex ante motivation for management’s conduct.
Thus, a feature of the selectorate model is to highlight how and when the threat of
termination following poor corporate performance encourages management to commit
fraud rather than report the true record of the firm. Unlike the model proposed here,
previous studies have not investigated the endogenous relationship between internal
corporate governance structures, job security, and compensation in the face of incentives
to misreport results.
5
Section III describes the data we use based on a random sample of publicly traded
firms in the United States, as well as all publicly traded American firms alleged to have
committed securities fraud over the period from 1989-2001. In Section IV we use the
data to test propositions derived from the model. The evidence supports the proposition
that senior managers who depend on a large coalition to retain their jobs are more likely
to engage in fraudulent reporting than are managers who govern with the support of a
small coalition. We also find that highly diffuse ownership and highly concentrated
ownership both make fraud less likely, while intermediate levels of concentration of
ownership substantially increase the risk of fraud. The results on ownership concentration
reinforce empirical findings by McConnell and Servaes (1990) and theoretical
implications derived by Stulz (1988) regarding corporate performance, albeit in a rather
different context from that of the selectorate model.
The model implies and the evidence supports the expectation that in periods
leading up to the commission of fraud, senior managers are under-compensated relative
to expectations given the firm’s governance structure and reported corporate
performance. This finding undermines the view that there is a straightforward link
between greed and fraud. The empirical analysis highlights a specific pattern of dividend
payments, executive compensation, and growth in market capitalization that is indicative
of firms that are likely to commit fraud.
In Section V we report the out-of-sample predictive capabilities of the model. We
show that it can be a reliable tool for identifying the risk of fraud in specific firms,
providing one to two years of early warning. In fact, the subset of firms in our highest ex
ante risk category were subsequently alleged to have commit fraud over eighty percent of

6
the time while those in the lowest ex ante risk grouping subsequently are alleged to have
committed fraud less than 2.5 percent of the time. Section VI provides conclusions.
Section II The Model
The essential features of any organization’s governance structure can be depicted
within a two-dimensional space where one axis is the size of the organization’s
selectorate (S) and the other dimension is the size of its winning coalition (W), W < S.
The selectorate is the set of people responsible for choosing the leadership – for
convenience referred to here as the CEO of a firm – and with the prospect of themselves
gaining access to special privileges or benefits as a result of their support for the
incumbent or a new management team. The winning coalition is the subset of the
selectorate whose support is essential for the leadership to remain in its position of
authority. In the CEO’s quest to keep his or her job, these two political institutions – W
and S – influence corporate policies and the risk of misreporting financial results.
The focus of the game is political competition for control of the firm. The
incumbent corporate leader, L, attempts to defeat challenger C who seeks to become
CEO.2 Both the challenger and CEO offer an allocation of private (g) and public (x)
goods subject to the budget constraint: gW + px ≤ R. R represents the resources
(revenues) corporate leaders can allocate, g is the provision of private goods that are
benefits only to those “inside” the firm’s governance structure (e.g. senior management,
members of the board of directors), with W being the size of the coalition who receive
these goods, x is the provision of public goods; that is benefits equally received by each
2 For technical convenience, we assume there is an infinite pool of potential challengers so the incumbent faces a different rival in each period.

7
share held by the owners of the firm, and p is the price of providing public goods. The
public goods, x, include such things as dividends and growth in market capitalization.
While the provision of x benefits all shareholders, it does not satisfy the non-rival aspects
of true public goods. However for ease of language we refer to these non-excludible
benefits as public goods. We also abuse notation by referring to W as both the set of
supporters in the winning coalition and the size of this set.
The selectors choose to retain the CEO or to replace her with a rival. Selectors,
who could in principle be elevated to the board or senior management to form a new
winning coalition, receive benefits from both private and public goods. In particular we
assume selectors have additively separable, continuous, concave utility functions V(x, g).
We denote the partial derivatives of V(x,g) with respect to x and g as Vx(x,g) and
Vg(x,g), respectively. Corporate leaders receive a payoff of Ψ>0 if they retain their job.
This is the value they attach to exercising control. Additionally the leader receives
benefits equivalent to the size of any resources she retains for her personal disposal. We
can think of these retained resources as the CEO’s salary and other benefits. Deposed
CEOs or rivals who fail to attain control receive a payoff of zero.
Additional to the material benefits of being CEO, we assume corporate leaders
have different affinities (idiosyncratic likes and dislikes) towards each selector. Affinities
play an important role in shaping the survival of leaders so we pause to discuss our
assumptions and the incentives they create within the game.
We assume that initially a potential leader’s affinities are unknown and that each
possible order of affinities over the pool of selectors is equally likely. In some
specifications of the selectorate theory (BdM2S2 2002) we explicitly include these

8
affinities as part of players’ payoffs. Here we treat them lexicographically and use them
only to break ties if all else is equal. Once a potential leader becomes CEO, affinities are
learned and become common knowledge. In all subsequent rounds the CEO forms her
coalition with those selectors with whom she has the greatest affinity. The revelation of
affinities reflects the risk of defecting to a challenger. An incumbent CEO can credibly
commit to including current members of her coalition in future coalitions; she is after all
already including her most preferred (highest affinity) selectors. In contrast, the
challenger realigns his coalition once his affinities are revealed. Hence while a selector’s
decision to join the challenger’s transitional coalition might be essential in the rival’s
ascendance, the challenger can not guarantee that selector long term membership in his
coalition and the associated private goods paid to members of the coalition. As Weisbach
(1988 p.432) states it “Inside directors’ careers are tied to the CEO’s and hence insiders
generally are unable or unwilling to remove incumbent CEOs.”
a. The Game
The game is infinitely repeated, with all payoffs discounted by a common
discount factor δ. The stage game is as follows:
1) The incumbent CEO (L) and rival (C) simultaneously announce compensation
schemes and coalitions. The CEO’s coalition (WL) is the W selectors with whom she has
the highest affinity. The CEO announces compensation of gL private and xL public goods.
The rival challenger announces a coalition (WC) of size W and compensation of gC
private and xC public goods.
9
2) Selectors choose between the CEO and the rival. The CEO is replaced by the
challenger if and only if fewer than W members of WL support the incumbent and W
members of WC support the rival.
3) The affinities of the leader chosen in step 2 (be that the incumbent or the rival) are
revealed and become common knowledge.
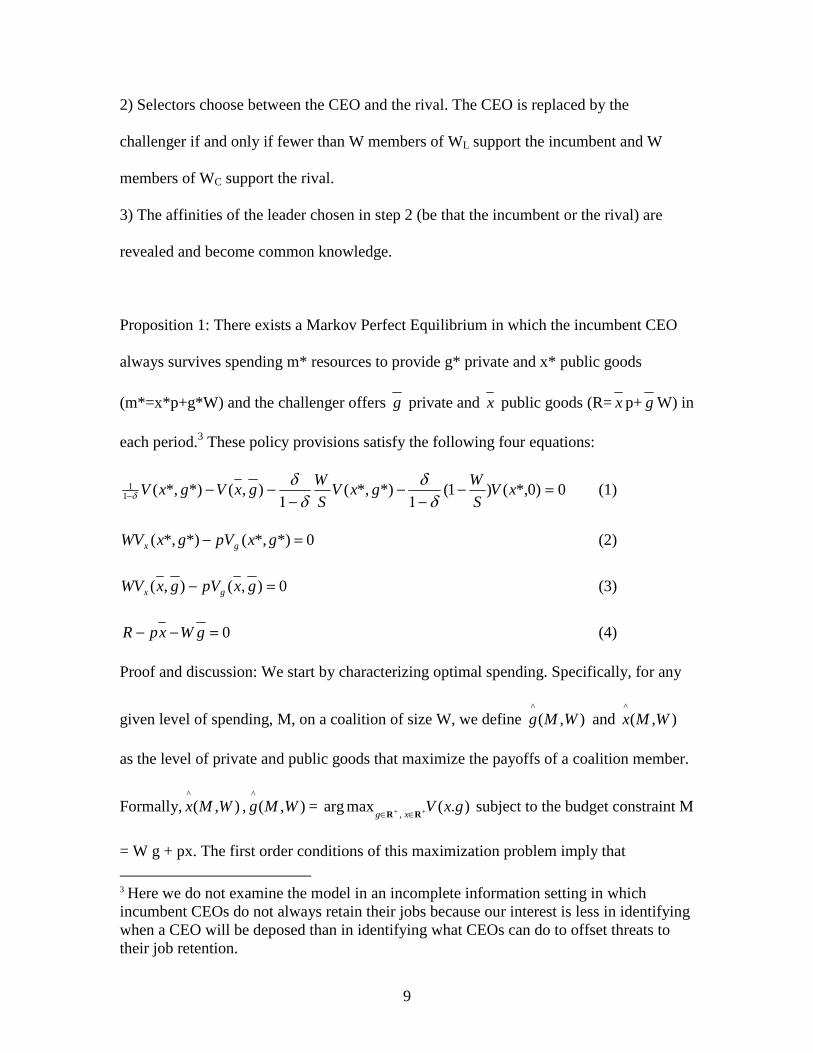
Proposition 1: There exists a Markov Perfect Equilibrium in which the incumbent CEO
always survives spending m* resources to provide g* private and x* public goods
(m*=x*p+g*W) and the challenger offers g private and x public goods (R= x p+ g W) in
each period.3 These policy provisions satisfy the following four equations:
0)0*,()1(*)*,(),(*)*,(11 =−
−1−
−1−−− xV
S
WgxV
S
WgxVgxV
δδ
δδ
δ (1)
0*)*,(*)*,( =− gxpVgxWV gx (2)
0),(),( =− gxpVgxWV gx (3)
0=−− gWxpR (4)
Proof and discussion: We start by characterizing optimal spending. Specifically, for any
given level of spending, M, on a coalition of size W, we define ),(^
WMg and ),(^
WMx
as the level of private and public goods that maximize the payoffs of a coalition member.
Formally, ),(^
WMx , ),(^
WMg = ).(maxarg,
gxVxg ++ ∈∈ RR
subject to the budget constraint M
= W g + px. The first order conditions of this maximization problem imply that
3 Here we do not examine the model in an incomplete information setting in which incumbent CEOs do not always retain their jobs because our interest is less in identifying when a CEO will be deposed than in identifying what CEOs can do to offset threats to their job retention.

10
WVx(x,g) = pVg(x,g). Equations (2) and (3) ensure both the incumbent and rival
maximize the payoff to coalition members for the given level of resource expenditure.
We define the indirect utility function associated with these optimal compensations as
v(M, W) = V (^
x (M,W), ^
g (M,W)) and the value of receiving only the public benefits
associated with this compensation scheme as u(M, W) = V(^
x (M,W), 0).
By the deposition rule in step 2 of the stage game, to come to power the rival
needs to convince at least one member of the incumbent’s coalition to defect. The rival
then makes the best possible offer he can in order to persuade at least one current
coalition member to defect to him. In the immediate period the challenger can do no
better than offer to spend all resources optimally; that is, ^
x (R,W) and ^
g (R,W), providing
v(R,W) rewards to his coalition. Should the rival succeed in displacing the incumbent
CEO then in the next period he will provide g* private goods and x* public goods to the
coalition of W selectors for whom he has the highest affinity. Since the rival’s affinities
are not known and all possible affinity orderings are equally likely, the probability of any
individual selector being included in the rival’s future winning coalition is S
W. With
probability (S
W−1 ) a selector is excluded from the rival’s future coalition. Therefore, the
present value of the rival’s best possible compensation scheme is:
)*,()1()*,(),( WmuS
WWmv
S
WWRv −
−1+
−1+
δδ
δδ
.
The first term represents the best possible immediate compensation the rival can
offer. The second represents the discounted value of being included in the rival’s

11
coalition in every future period. The probability of such inclusion is S
W. The third term is
the discounted value of being excluded from the rival’s coalition in future rounds.
Exclusion occurs with probability (S
W−1 ).
If the CEO is retained, then members of her coalition receive the immediate
benefits of her compensation plus the net present value of receiving payoff of v(m*,W) in
the form of x* public and g* private goods in each future period. Hence selectors in WL
remain loyal to the CEO provided that:
VxL, gL +δ
1−δvm∗, W ≥ vR, W + δ
1−δWS
vm∗, W + δ
1−δ1 −
WSum∗,W
(5). This decision defines optimal voting in undominated strategies by coalition
members.4
The incumbent CEO does best while keeping her job by satisfying equation (5)
with equality through optimal spending, equation (2). The stationarity of MPE implies
that the CEO’s behavior in the current period is identical to behavior in future periods.
Therefore,
11−δ
vm∗, W = vR, W + δ
1−δWS
vm∗, W + δ
1−δ1 −
WSum∗, W
(6).
Equation (6) is simply equations (1)-(4) written in terms of the indirect utility function.
Since the CEO minimizes expenditures while maintaining office, the challenger can not
improve his prospects of attaining the top job and the selectors choose optimally between
candidates for the CEO position, equations (1)-(4) characterize a MPE.5
4 Those selectors outside of WL obviously vote for the challenger since this gives them increased immediate returns and the prospect of inclusion in future winning coalitions. 5 The above model provides the simplest exposition of the selectorate theory. Elsewhere we relax the strict assumptions on the choice of coalition membership used here. We also
12
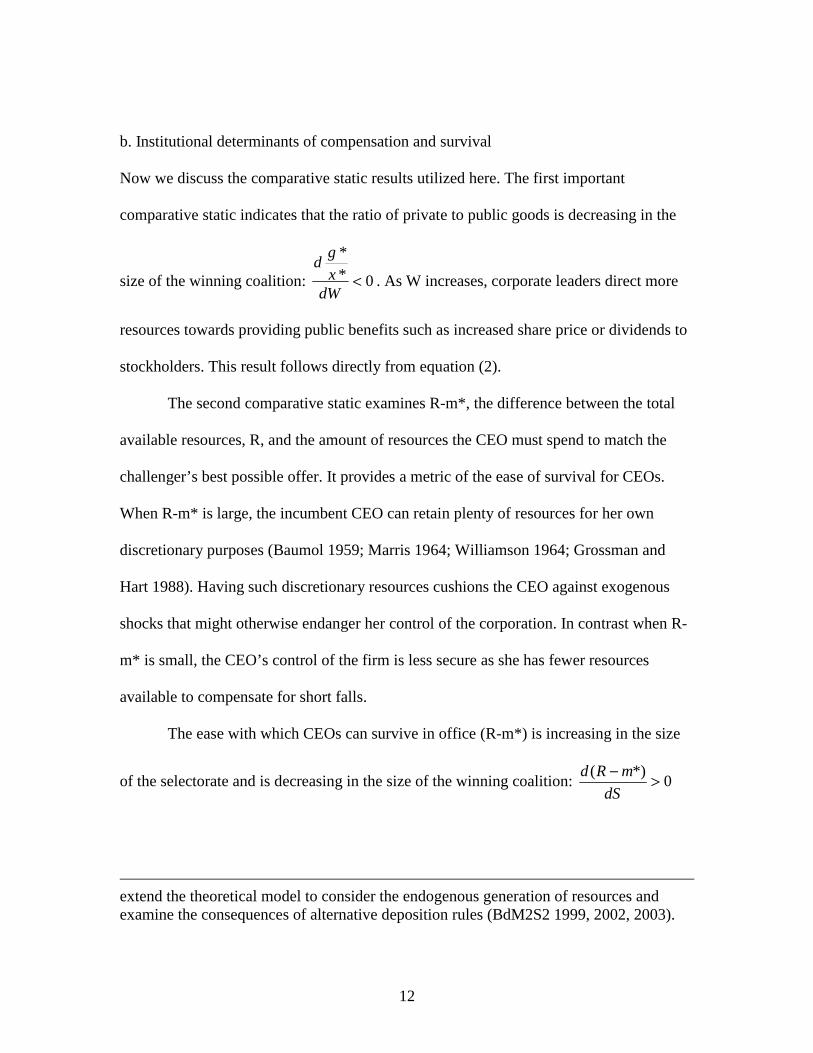
b. Institutional determinants of compensation and survival
Now we discuss the comparative static results utilized here. The first important
comparative static indicates that the ratio of private to public goods is decreasing in the
size of the winning coalition: 0*
*
<dW
x
gd
. As W increases, corporate leaders direct more
resources towards providing public benefits such as increased share price or dividends to
stockholders. This result follows directly from equation (2).
The second comparative static examines R-m*, the difference between the total
available resources, R, and the amount of resources the CEO must spend to match the
challenger’s best possible offer. It provides a metric of the ease of survival for CEOs.
When R-m* is large, the incumbent CEO can retain plenty of resources for her own
discretionary purposes (Baumol 1959; Marris 1964; Williamson 1964; Grossman and
Hart 1988). Having such discretionary resources cushions the CEO against exogenous
shocks that might otherwise endanger her control of the corporation. In contrast when R-
m* is small, the CEO’s control of the firm is less secure as she has fewer resources
available to compensate for short falls.
The ease with which CEOs can survive in office (R-m*) is increasing in the size
of the selectorate and is decreasing in the size of the winning coalition: 0*)( >−
dS
mRd
extend the theoretical model to consider the endogenous generation of resources and examine the consequences of alternative deposition rules (BdM2S2 1999, 2002, 2003).

13
and 0*)( <−
dW
mRd.6 This indicates that CEOs who depend on a relatively large coalition
of, say, directors, are at greater risk of deposition as a result of poor performance than are
those who depend on a small coalition. As a consequence, the former group of CEO’s has
the greatest incentive to misrepresent performance to preserve their jobs.
Selectorate size also influences the risk to a CEO’s tenure. When ownership is
diffuse (S is large), such that current insiders have little prospect of also being insiders
under new management, CEO’s jobs are relatively safe despite poor performance.
However, as ownership becomes concentrated in fewer hands (S is small), such that
current insiders are more likely to be included within a new management team,
supporters become less loyal and CEO’s have increased incentives to misrepresent
performance to protect their jobs.
Section III Data and Measurement
Our data set consists of 372 randomly selected US publicly traded firms plus 91
firms alleged to have committed fraud. Fraud allegations are based on firms investigated
by the SEC for material misstatements in their financial reports. The compilation of cases
was provided by Arthur Andersen, LLP for 1989-1999 and updated with comparable data
from Stanford’s securities fraud web site maintained by Joseph Grundfest for 2000-2001
6 These comparative static results are most easily seen by rearranging equation (6)
to produce identity I=v(m*,W)-v(R,W)+(δ/(1-δ))(1-W/S)( v(m*,W)- u(m*,W))=0, with partial derivatives Im =vm(m*,W) +(δ/(1-δ))(1-W/S)( vm(m*,W)- um(m*,W)) > 0, IW=vW(m*,W)-vW(R,W)-(δ/(1-δ))(1/S)( v(m*,W)- u(m*,W)) )+ (δ/(1-δ))(1-W/S)(vW(m*,W)- uW(m*,W)) < 0, and IS= (δ/(1-δ))( W/S2)( v(m*,W)- u(m*,W)) >0. By Cramer’s rule, dm*/dW= -IW/IM >0 and dm*/dW= -IW/IM < 0.
14
(http://securities.stanford.edu/info.html). The unit of analysis is the company year, with
that being the frequency of SEC mandated financial reports.
The dependent variable, Future Fraud, is coded as 1 in year t if the firm was
subsequently alleged by the SEC to have committed securities fraud in year t+1 or t+2.
Otherwise, Future Fraud is coded as zero. In the process of testing our theoretical
perspective, we initially compare the compensation and performance of honest firms with
policies within fraudulent firms. For these comparisons, we define fraudulent firms as
those alleged to commit fraud in year t, t+1 or t+2.
The dataset over-represents the known instance of fraud since we use the
population of such cases, but only a sample of firm-years. We have complete data for
1,395 observations, with 141 instances for which Future Fraud=1. As we use logit
analysis for the principal tests of the predictive capacity of the model, the mix of sample
and population does not alter the underlying estimated probability function though, of
course, it does alter the actual predicted probability values. To partially correct for this,
we will report predicted results based on the percentile in which predicted values fall.
In addition to the distributional issues already addressed, the dependent variable
must also suffer from selection effects. The reported instances of fraud surely understate
its true occurrence. Consequently, it is likely that our predictions include an unknown
number of seemingly false positives; that is, cases for which the theory correctly predicts
a high probability of fraud but with no allegation of fraud having been levied against the
company. There is also a prospect of false negatives; that is, firm years predicted to have
a low probability of fraudulent reporting with no allegation of fraud having been made
against the firm but where there was an unknowable (to the observer) successful cover up

15
of false financial statements. Firm managers would not commit fraud unless they had a
sufficient belief that their actions would go undetected. Therefore, we must believe that
the cases of alleged fraud are only a subset of all frauds. There does not appear to be any
basis for making judgments about the distribution of false positives or false negatives.
Data regarding the independent variables are all constructed from publicly
available information derived from 10K’s and proxy forms filed with the SEC and in a
very few instances from annual reports. The data were coded from Edgar and from the
Disclosure database.
Unfortunately, firms do not directly report coalition or selectorate size. We next
examine how publicly reported measures of management structure and ownership serve
as indicators for the number of supporters a CEO is beholden to (W) and the size of the
pool from which these supporters are drawn (S). In general we rely on multiple indicators
since no single measure alone completely captures the underlying theoretical concepts.
We start with indicators of coalition size-- that is the number of insiders whose
support the CEO needs to maintain control of the company. Estimates of coalition size
(W) are based on the following three indicators: (1) Number of Officers and Directors
(#OfficersDirectors); (2) Number of Officers Receiving Stock (#StockOfficers); and (3)
Number of External Directors (#Ex. Dir).
These indicators provide estimates of the number of individual who play a
prominent role in supporting and implementing the CEO’s policies. The first measure is a
direct count of the number of corporate officers and directors. Unfortunately, not all of
these officers and directors need play a critical role in determining political control of the
firm. Some might simply carry out functions on behalf of the firm in exchange for
16
monetary compensation, in much the same manner that regular employees work for the
firm. The second measure, number of officers receiving stock, attempts to restrict the
measure of coalition size to political insiders by counting only those executives with an
important role within the politics of the firm that they receive stock options.
The third measure of coalition size is the number of external director. These
individuals were part of the first measure. They are less likely to be important insiders
relative to officers or internal directors so that for a given number of officers and
directors, the more external directors, the smaller the winning coalition is likely to be.
To gain further leverage on the role of external directors in our estimates of fraud
we include their compensation and their compensation squared. External directors who
are paid little more than a nominal fee for attending meetings are unlikely to be corporate
insiders. As their compensation increases it becomes likely that they are in the winning
coalition. However, if external directors’ compensation is substantial (indicative of a
private goods focus), then the theory suggests the winning coalition is quite small.
Although studies such as Weisbach (1988), Denis et al (1997) and Yermack (1996) have
highlighted the importance of external directors relative to company insiders in shaping
company performance and CEO retention, they have not considered this non-
monotonicity and contingency based on compensation. Given the additional complexities
that these contingencies imply, in our initial tests of private and public goods we restrict
our attention to the former two measures only.
Because we investigate only publicly traded companies, the data necessarily
reflect truncated variance on W. The largest winning coalitions in businesses are
probably associated with partnerships, a set of companies that do not report the data

17
required for our estimates. In large accounting partnerships, for instance, this number can
readily be in the thousands. This truncation in our data operates against the theory and so
makes the tests particularly demanding in that there must be sufficient impact of small
changes in coalition size to discern the predicted effects. Given that W is relatively small
in our entire sample, much of the variance in the ease with which CEOs are deposed for
poor performance stems from how the Selectorate size shapes the risk of exclusion from
future coalitions (1-W/S).
The Selectorate (S) reflects the size of the pool from which a CEO could form her
winning coalition. When the selectorate is large, the CEO has great discretion in whom to
include in her coalition. This discretion means that coalition members under the current
corporate leadership are reluctant to defect because they know that under new
management they are not assured of the well-compensated executive or board positions
they currently enjoy (Hermalin and Weisbach 1988, 1998).
We estimate Selectorate size (S) as: (1) The logarithm of outstanding shares
(Ln(shares)); (2) Of total stock not held by small investors (the “man on the street”), the
proportion held by the largest stockholder (Big Owner, (Big Owner)2); (3) Concentration
of shares held by officers, directors and institutions (Concentration, Concentration2); and
(4) The proportion of stock held by institutional investors relative to the number of
individuals who own at least one percent of the company’s shares; that is, the proportion
of large owners who are outsiders but have a large stake in the firm (Inst. Owner).
These measures deserve justification. The first measure is the order of magnitude
of the number of outstanding shares. At first glance this variable might appear of little
relevance since a one percent stake is still one percent whether it is as a result of holding
18
one of a hundred shares or 10,000 of a million shares. Yet the number of shares to issue is
a strategic policy decision that has important implications. In addition to a firm
repurchasing its own stock, or raising new capital through additional stock offerings, the
most common reason for a change in the number of outstanding shares is stock splits.
Stock splits, of course, do not alter the percentage of the firm owned by any given
shareholder. Yet stock splits are frequently followed by an increase in share prices
(Grinblatt, Masulis and Titman 1984; McNichols and Dravid 1990). Many recent
attempts to explain this phenomenon focus on stock splits as a signal of future
performance (Peterson, Millar and Rimbey 1996). Additionally, stock splits also
influence the liquidity of shares and hence the breadth of ownership (Dolley 1933; Barker
1956; Lakonishok and Lev 1987; Baker and Gallagher 1980).
It is worth pausing to examine, through stylized examples, why the number of
outstanding shares influences selectorate size. While the number of shares in publicly
traded firms is typically in the tens of millions, we start by considering an extreme case in
which the company only issues 100 shares. With such a limited number of shares only a
small number of extremely rich individuals or institutional investors could afford to
purchase a share. Anyone seeking to become CEO must find support from within this
pool of 100 supporters—the selectorate is relatively small. Since the typical firm in our
sample has about 12 officers and directors, each shareholder has about a 12 percent
chance of inclusion in a future coalition.
Suppose instead that the company issued one million shares owned by a million
individuals. The selectorate is now many orders of magnitude larger. This makes the
CEO’s problem of finding and maintaining 12 loyal supporters much easier since each

19
insider realizes that given the enormous pool of potential supporters he or she has only a
negligible chance of receiving the valuable private compensations associated with board
or executive positions under a new corporate leader. Given this massive selectorate, the
CEO faces little risk of deposition even in the face of appalling performance.
The number of outstanding shares shapes the size of the selectorate. While the
above examples illustrate the point, they are obviously unrealistic. Each share is not held
by a separate individual. Ownership tends to be concentrated among a few individuals
and institutions. In reality only these large owners have a significant prospect of coalition
membership. The “man on the street,” owning only a handful of shares, has almost no
prospect of board membership. In practice this means that the effective size of the
selectorate is much smaller than the number of shares and depends strongly on the extent
to which shares become concentrated. Our measures (2) through (4) are indicators of the
effective number of individual or institutional investors who form the selectorate. As
ownership becomes more concentrated, the selectorate becomes smaller. This contraction
in the pool of potential candidates for board and executive positions makes insiders more
willing to depose CEOs who perform poorly (Shleifer and Vishny 1986). It is this
increased jeopardy that creates incentives to misrepresent performance.
Although increasing ownership concentration reduces selectorate size and hence
increases the risk to under-performing CEOs, at high levels of share concentration the
effects are offset as the CEO becomes the effective owner of the company. Just as a sole
proprietor has no incentive to depose herself or misrepresent her performance, as
ownership becomes extremely concentrated neither does the CEO. Of course this does
not mean that the CEO needs to own 50% of the stock. A controlling share can be much

20
smaller if the remaining shares are distributed diffusely. To account for this non-
monotonicity at high level of concentration, we included quadratic terms for several of
our concentration measures. There is considerable extant evidence regarding this non-
monotonicity in ownership concentration (Stulz 1988; McConnell and Servaes 1990;
Wruck 1989; Morck, Shleifer and Vishny 1988).
The selectorate theory predicts that governance institutions affect corporate policy
and compensation packages. Public goods are goods that are attributable to all share
holders. We have two such measures: dividends (as a percentage of market capitalization)
and market capitalization. Private goods are those benefits received only by winning
coalition members. Again we use multiple indicators for this concept: (1) Perquisites
(non-salary) compensation paid to internal directors, (2) external directors and senior
management (Perqs); (3) Cash payments to external directors (Ex. Dir. Cash, (Ex. Dir.
Cash)2); and (4) The proportion of allocations that go to private goods (Private Ratio).
As previously discussed the second measure-- cash payments to external directors -- has a
contingent influence on the number of external directors. The final variable measures
private goods as a proportion of both private and public rewards, where private goods are
measured as salary and other compensation for internal directors, external directors and
senior management and public goods are measured as market capitalization.
In addition to these variables, we also include in our analyses two stock options
indicators (Stk. Opt. Int. Directors and Stk. Opt. Executives) that measure how many
options are received by internal directors and by the top five senior managers as these
21
variables play a prominent role in current debate over firm governance.7 The details
behind the construction of each variable are reported in the Appendix while Table 1
provides the summary statistics.
Tables 1 About Here
Section IV Empirical Tests of Corporate Performance
Before considering the probability that a company will commit fraud, we examine
key hypotheses derived from the theoretical model. These tests are restricted to firms
whose audits within two years of a given observation have not been alleged to be
fraudulent. We do so to establish baseline expectations as to how firms behave. We will
use these baselines to compare firms alleged to have committed fraud to their apparently
more honest counterparts. Each of these tests includes fixed effects dummy variables for
the year so that we control for general market trends.
a. Private and Public Goods
The selectorate theory indicates that private goods decline as the size of the
winning coalition increases ( 0*
*
<dW
x
gd
). The theory is ambiguous about the net effect of
S on private goods allocations. The ambiguity arises because selectorate size influences
how much the CEO gets in private benefits in a manner opposite to its impact on rewards
to coalition members, a subtlety of the theory not explored here, but borne out in other
investigations (BdM2S2 2003).
7 For instance, Yermack (1997) provides evidence that managers time the release of corporate reports and grants of stocks to increase management’s take.

22
Table 2 shows two different specifications designed to test the effect that coalition
size has on private goods as a proportion of overall rewards. Both tests use two variables
to approximate coalition size: #OfficersDirectors and #StockOfficers. The first variable,
the number of officers and directors, varies between 2 and 31. The number of officers
who receive stock options, the second indicator, varies between 0 and 25. The correlation
between the two indicators is 0.37 (N = 2,136). As we have no basis for preferring one
coalition indicator over the other, we are interested in the hypothesis that they are jointly
negative in their effect on private goods provision. This, in fact, is the case in each of the
tests. For instance, the joint hypothesis test in the first model that both indicators of W are
less than zero yields an F(2, 1545) = 6.62 which is significant at 0.0014.8
Table 2 About Here
How are we to interpret the substantive implication of this result? Imagine a
corporation whose coalition increases by three members (about a one standard deviation).
The average firm allocates about four percent of its total benefits to private rewards to
senior officers and directors. Increasing the size of the winning coalition by three
members reduces these private payments from 4 percent to about 3 percent.9
8 The correlation between our third indicator of W, #Ext. Dir and #Off. Dir. is 0.82 (N = 2136). Specifying any two of the three indicators of W in the regression with Private Ratio as the dependent variable produces two negative coefficients and a highly significant result for the test that they are jointly negative.
9 There is also indirect evidence in the literature that corporate governance structures influence the relative value of private and public goods. Barclay and Holderness (1989, 1992) find that large blocks of shares trade at premium prices relative to smaller stock quantities. Presumably, only large stockholders have a realistic chance of future membership in the winning coalition. This evidence is reinforced by comparisons of shares that grant only dividend rights with those that also grant voting rights. Voting shares offer their owners the chance to enter the winning coalition, thereby gaining access to private goods, and they trade at higher prices (Lease, McConnell and Mikkelson 1983, 1984; DeAngelo and DeAngelo 1985; Zingales 1995). Although these differences

23
In addition to the two variables used to specify W, table 2 offers two models
based on different ways of estimating the impact of selectorate size.10 The first uses the
logarithm of total outstanding shares. In contrast the second model focuses on the lagged
logarithm of outstanding shares and also changes in the number of shares relative to the
previous year. We see later, when we explore additional measures of selectorate size, that
changes in the structure of company ownership can significantly influence corporate
actions. Neither of the selectorate indicators in models 1 and 2, nor alternative measures
reported later, alter the impact of coalition size on private goods allocations.
The second hypothesis draws attention to whether shareholder value is increasing
or decreasing over time. We examine the change in market capitalization as a function of
coalition size. The theory showed that as coalition size increases CEOs place a greater
emphasis on public rather than private goods (d(g*/x*)/dW<0). They also retain fewer
discretionary resources and expend more resources to provide rewards (d(R-m*)/dW<0).
Further, though not modeled here, BdM2S2 (2003) show that endogenously generated
resources increase as coalition size increases (dR/dW>0).11 The theory predicts that
corporate leaders who depend on a large coalition must be more attentive to overall
corporate performance than those who answer to a small coalition.
Probably the best indicator of overall corporate performance is the rate of growth
in market capitalization. To measure this growth we compare the logarithm of market
between voting and non-voting stock are typically small in the US, in the comparative context the difference can be much larger, 82% in Italy for example (Zingales 1994). 10 When we examine fraud we expand the number of ways of estimating selectorate size. For the sake of brevity we do not report all of the alternative indicators of S in table 2 as selectorate size is not the focus of the hypotheses. 11 Ryngaert (1988), Malatesta and Walkling (1988), DeAngelo and Rice (1983) and Jarrell and Poulsen (1988) show that such measures as poison pills to deter takeovers and supermajority rules that make replacing the management team more difficult reduce company value.
24
capitalization in year t with its value in the prior year. The inclusion of year fixed effects
in these regressions is particularly important to control for bull or bear market conditions.
We are interested in the marginal impact on growth associated with variation in coalition
size. Extant studies, Morck, Shleifer and Vishny (1988) for instance, have already
demonstrated a link between profitability and governance structure. However, the
literature is not unanimous in its conclusions. Yermack’s (1996) paper finds that
increasing board size reduces firm value, as measured by Tobin’s Q.12
Models 3 and 4, reported in table 2, show that coalition size is an important
independent determinant of growth in market capitalization. In fact, the substantive
impact of increasing the size of W by three members is to increase growth in market
capitalization by about 10 percent. Again the inclusion of different selectorate measures
does not materially alter the effect of the winning coalition’s size.
Thus far we have discussed growth in market capitalization and the proportionate
allocation of private goods. Firms can also reward shareholders with dividends. Models 5
and 6, shown in table 2, assess the effect of coalition size on dividends as a proportion of
dividends and market capitalization. The theory provides no guidance about how public
rewards are divided between dividends and monies reinvested to spur growth in market
capitalization. Coalition size does not materially influence dividends although, as we saw,
it influences growth. Tests on the combined value of dividends and market capitalization
show that increasing coalition size sharply increases the total value of public rewards.
12 Himmelberg, Hubbard and Palia’s (1999) reanalysis of Demsetz and Lehn’s (1985) study of the impact of management on firm value, as measured by Tobin’s Q, shows that the inclusion of fixed effects for each firm to model unexplained heterogeneity reduces the statistical impact of governance institutions on performance. We observe a similar result if we repeat our analyses with fixed effects. However, this result is unsurprising as our time series are generally short, on average 3.2 years, many companies experience little change in our measures of W.
25
b. Deviations from Expected Performance
When a company fails to perform up to expectation, CEOs have incentives to take
actions to protect their now-at-risk jobs. They can argue that the firm is the victim of
unforeseeable exogenous shocks for which they should not be held accountable. This
may not be adequate to protect them. Instead, they might misrepresent the corporation’s
true performance. This possibility highlights a crucial difference between dividends and
private compensation on the one hand and market capitalization on the other. Dividend
payments can only be made if the funds are available. Writing bad checks is unlikely to
save the CEO. Therefore, it is unlikely that large dividend payments are used to mask
problems. Similarly, the payment of salaries and other private benefits requires sufficient
cash on hand to meet obligations. Failing to meet these obligations reveals the company’s
problems and so fails to protect management. But it is difficult for outsiders to know the
true volume of sales, revenue, costs, and profits. Market capitalization reflects these
factors. Indeed, these are the factors that when falsely reported but subsequently detected,
result in accusations of accounting fraud.
If revenues are exaggerated or costs are understated, then senior executives can
temporarily lead the marketplace to misjudge the true worth of a company, making the
company appear falsely to have met or exceeded expectations. This, we believe, is the
essential motivation behind corporate fraud. We now test implications of these claims.
Figure 1 illustrates one way the theory can be used to predict fraud. The graph
plots the variable Private Ratio – private goods as a proportion of total compensation – on
the horizontal axis and the empirically predicted level of Private Ratio given each firm’s

26
governance structure (as estimated in model 1) on the vertical axis. The right-hand panel,
labeled “Fraudulent,” shows the graph for firms alleged to commit fraud in the current
year or either of the two subsequent years. The left-hand panel shows the same graph, but
for “Honest” firms, those against whom no allegations were made. The differences
between the figures are striking in two ways.
Focusing just on the horizontal axis, with few exceptions fraudulent firms actually
pay few private benefits. According to the theory this is a consequence of two features of
large coalition organizations. Such organizations are expected to produce more public
and fewer private benefits than are small coalition organizations. Additionally, executives
are at greater risk of losing their jobs in large coalition organizations if performance is
below expectations. Therefore, we expect that the firms that are most likely to commit
fraud also are likely to produce few private goods.
The horizontal axis is insufficient to assess whether differences in private goods
allocations can be attributed to the decision to commit fraud. The vertical axis, however,
completes the story. Focusing on the vertical axis, we see that fraudulent firms average
fewer private goods payments than are expected given their governance structure. This is
seen by observing the distribution of points above and below the 45◦ line. In the panel
displaying honest firms, firms fall equally on either side by construction. Recall that the
predicted values are based only on honest firms. The fraudulent firms could have been
distributed in any way relative to the 45◦ line. The theory anticipates that they will be
disproportionately above the line, indicating smaller actual payments (x-axis) than
predicted payments (y-axis). This is what the panel shows for fraudulent firms.
Controlling for coalition size, firms that commit fraud tend to produce fewer private
27
goods than expected. While these findings are consistent with the theoretical arguments,
we now move to more systematic tests of the story related by Figure 1.
Figure 1 About Here
Using models 1, 3, and 5 we calculate the expected level of private goods, growth
in market capitalization, and dividend payments as a proportion of public goods. For each
firm we record the difference between the observed level and the predicted value on each
of these variables. That residual amount tells us whether the specific firm in a given year
is over or underperforming relative to expectations given its governance structure. We
then compare these residual values for the set of firms that were subsequently alleged to
have committed fraud in the current year or either of the next two years to firms not
alleged to be involved in fraud in this period.
Two of the three residual values for each firm reflect quantities whose true value
is difficult to hide: private compensation rewards and dividend payments. Therefore, we
expect in these cases to observe residuals that reflect underperformance in the set of firms
alleged to have committed fraud. When it comes to comparing growth in market
capitalization, if we are correct that fraudulent firms lie in ways that inflate their value,
we should either see no statistical difference between those alleged to have committed
fraud and those who apparently report performance honestly or we should see that
fraudulent firms report especially large growth in market capitalization to compensate for
their under-delivery of private goods or dividends. Table 3 shows the comparisons.
Table 3 About Here
The evidence in table 3 supports the predictions. What is more, the table
emphasizes a result that casts doubt on accounts of venality as the primary cause of
28
fraud.13 Firms that will be accused of fraud for their financial reports in the current year
or the next two years provide fewer private benefits and fewer dividends than is expected
of firms with their governance characteristics. Senior executives are receiving less, not
more, than their counterparts in otherwise equivalent companies. However, in terms of
growth in market capitalization, these firms are indistinguishable from honest companies
with comparable governance arrangements.
Table 3 suggests that it is possible to tell the difference ex ante between firms
likely to commit fraud and those who are not. To test this implication more carefully, we
now turn to a strictly prospective dependent variable: Future Fraud. The data for the
independent variables are all observed in year t and so can be known before fraud has
occurred. Table 4 examines the likelihood of Future Fraud as a function of the degree to
which a firm deviates from expected performance and as a function of the size of the
winning coalition and the selectorate. The theory indicates that payment of dividends and
private goods below expectation and growth in market capitalization equal to or above
expectation heighten the risk of fraud. Furthermore, the marginal effect of large coalition
size beyond its impact on private and public goods allocations is to put failed executives
at risk. Therefore, executives in corporations that depend on a large coalition are more
likely to misstate financial reports.
Table 4 About Here
The results are consistent with expectations. While supportive of the theory, the
specification in table 4 is not optimal as it imposes significant artificial constraints on
13 That is not to say that fraud is never motivated by personal greed among managers. The case of Tyco, for example, is otherwise difficult to explain. However, as the New Yorker (February 17, 2003. “SPEND! SPEND! SPEND!” p. 132) concludes, Tyco’s fraud is qualitatively different from accounting frauds such as Enron’s and Worldcom’s.
29
how we estimate the impact of governance structure on the risk of fraud. We shift now to
a fuller specification of the model and its implications for predicting fraud.
Section V Predicting Fraud: In Sample and Out of Sample Tests
The selectorate model indicates that W, S, g, and x shape the risk of fraud, with g
and x being partially dependent on W. Now we propose a statistical specification that
includes indicators of all four elements in an attempt to provide ex ante estimates of the
risk of fraud one or two years into the future. After demonstrating the general fit between
the model and fraud in all cases, we divide the data into two samples. Specifically, we
estimate the model on all observations between 1989 and 1996 and use these estimates to
predict the likelihood of fraud in each company-year for the period after 1996. For
presentational convenience we place our predictions in five risk categories, ranging from
lowest (0) to highest (4) estimated probability of fraud. The category breakpoints are
determined by assigning 70 percent of in-sample firm years to the lowest risk category;
15 percent to the second lowest risk group; 7.5 percent to the middle group; 5 percent and
2.5 percent to the two highest risk categories.14
We estimate a logit model with Future Fraud as the dependent variable. The
independent variables are DIV/Public, Private Ratio, Perqs, Ex. Dir. Cash,
(Ex.Dir.Cash)2, #Ex. Dir, Inst. Owner, Ln(shares), Big Owner, (Big Owner)2,
Concentration, Concentration2, #OfficersDirectors, #StockOfficers, Stk. Opt. Int.
14 Dividing the predicted values from the logit into quintiles yields comparable results, with observed fraud increasing significantly from quintile to quintile.

30
Directors, and Stk. Opts. Executives. Growth in market capitalization is not included to
preserve observations.15
a. Full Sample Estimates
Model 8, the full sample logit analysis, is consistent with expectations for each
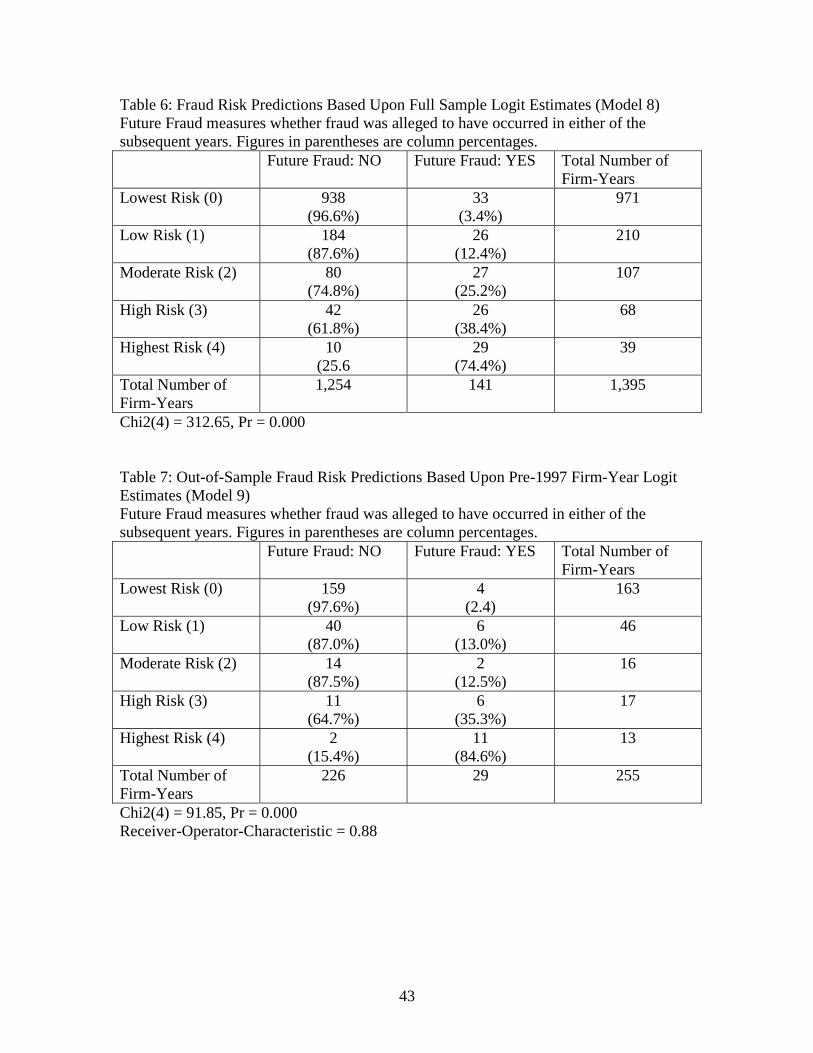
variable as seen in table 5. Its reliability is seen most clearly by looking at table 6 which
shows the ex ante fraud risk and the incidence of fraud in the following two years. The
table shows that the theory successfully discriminates between firms at risk and those that
are not. Of firms predicted to be at greatest risk, 74 percent committed fraud within one
of the following two years. Approximately 40% of all frauds fall within the highest two
categories of risk. Yet only 7.5 percent of firm-years occur in these categories. The model
not only predicts fraud successfully, but also successfully predicts honesty. Of 971 firm-
years with the lowest risk of fraud only 3.4% are subsequently accused of fraud. Such
strong results may be the product of over-fitting the model to the data. To test the
genuine predictive power of the model we repeat the analyses using only information on
firms prior to 1997. These estimates are also reported in table 5, and labeled as “Model 9:
Out-of-Sample” We use these estimates to predict the pattern in subsequent years.
Tables 5 and 6 About Here
b. Out-of-Sample Estimates
Table 7 reports the risk of and the incidence of fraud by company year, paralleling
table 6, but now only for out-of-sample observations. Of out-of-sample cases that fall
15 Including growth in market capitalization leads to results consistent with expectations but greatly reduces the total number of observations because it requires knowledge of data for the previous year in addition to the current year.

31
within the highest risk category, 85 percent subsequently committed fraud. Almost 60
percent of all out-of-sample frauds fall into the two highest risk categories. Likewise, the
model successfully identifies honest firms. Fewer than 2.5 percent of firms in the lowest
risk category subsequently were accused of fraud. The model apparently discriminates
between honest and fraudulent firms. A statistic for summarizing that ability to
discriminate is the Receiver Operator Characteristic (ROC) that estimates the ratio of
signal to noise. A score of 0.50 indicates no discrimination. A score of 1.00 reflects
perfect discrimination. The ROC score for the out-of-sample test is 0.88, supporting
statistically what is evident from looking at table 7.16
c. Illustration of Performance on Specific Firms
The statistical findings encourage the belief that the selectorate theory provides a
reliable tool for anticipating variations in corporate conduct and, in particular, the
likelihood of fraudulent reporting. Table 8 provides a list of the ten largest companies
accused of fraud during the time period for which we have data. This list includes many
of the most notorious instances, including Enron, Waste Management, Rite Aid, and
16 We conducted additional out-of-sample tests in which we randomly assigned
approximately half the firms to be in-sample and the remaining firms to be out-of-sample.
We then estimated the model in table 5 based on the firms that were in-sample and used
these estimates to predict the out-of-sample firms. We repeated this experiment 1,000
times. This is a far more demanding, less realistic, and less practically useful test than
that reported in the text. The average ROC for the out-of-sample prediction was 0.785,
with a standard deviation of 0.039.
32
others. The table shows the year-by-year prediction of the risk of fraud for each of these
companies, with all predictions after 1996 being strictly out-of-sample. The out-of-
sample results are shaded to draw attention to them. Cells for years in which fraud
allegedly occurred contain an F as well as the predicted score. Of course, it is the score in
either of the two years before fraud that are of greatest interest as these are the ex ante
predictions for the period when fraud allegedly occurred. Cells that contain “ND”
indicate that missing data precluded estimating a risk score for that company year.
Companies are listed in alphabetical order.
Table 8 About Here
The companies listed in Table 8 have been accused of 25 instances of securities
frauds during the period covered. Thirteen of these allegedly happened between 1997 and
1999, our out-of-sample period. Three more frauds for these companies, involving Cisco
Systems, Xerox, and Enron, are alleged to have occurred in the year 2000. Thus, the out-
of-sample predicted period includes 16 cases plus any allegations for these companies. Of
these 16 largest, most notorious frauds involving massive numbers of shareholders and
firms with extremely large market capitalization, 13 had a score of 4 at least one year in
advance and all 16 had scores of 3 or 4 at least one year in advance. Eight provided 2
years of advance warning in the highest risk category.
The table also shows that during periods when these firms were not engaged in
fraud, their scores often reflect their good behavior. The estimates for Xerox, for
instance, between 1991 and 1994 suggest a very low risk company. Xerox was not
accused of fraud for any of its reporting prior to 1998. The model shows that Xerox was
slipping in its anticipated behavior, with scores of 2 in 1995 and 1996. Thus the model

33
finds reason for growing, though still moderate concern about Xerox well before the
markets suspected misconduct. A similar pattern of low risk behavior is reflected in the
record for Rite Aid, with its risk jumping from 0 in 1993 to 2, then 3, then 4, the highest
category, in 1996. Several years later, Rite Aid was accused of having committed fraud in
1998 and 1999. These illustrative cases suggest that the prudent use of the selectorate
model could make a significant difference in identifying fraud risks.
Section VI Conclusion
The selectorate theory was used to derive hypotheses about how corporate
governance institutions influence corporate actions. We showed that the theory provides
an explanation for the amount paid in dividends and in salaries to senior management
during years of honest reporting and years immediately preceding fraudulent reporting. In
the latter years, senior management receive less compensation than expected given their
corporate governance structure, but reported performance and, therefore, the firm’s
growth in market capitalization looks as expected given honest reporting. This wedge
between lower than expected dividends and compensation for executives and normal
growth in market capitalization is an early warning indicator of an elevated risk of fraud.
Our model contributes to the literature on strategic accounting (Caplan 1999; Morton
1993; Shibano 1990) by identifying governance structures and reported performance
statements that are consistent with strategic CEOs’ attempts to protect their jobs.
We tested the theory’s potential to predict fraud in advance. Our out-of-sample
tests indicate that the model significantly reduces uncertainty about which firms are likely
to commit fraud and which are likely to report their performance honestly. The signal to

34
noise ratio in the out-of-sample test is 0.88 with more than 80 percent of company-years
in the highest risk category involving subsequent allegations of fraud.
Our results call into question accounts in which greedy executives act to enrich
themselves at the expense of shareholders. Rather, the theory and the evidence support
the idea that fraud is more often committed to protect shareholder value, not out of
altruism, but to protect the jobs of a firm’s senior executives. At the same time, the
results highlight features of corporate governance structure and the appropriate balance
between compensation and that structure that is most likely to reduce the risk of fraud.
35
References
Aggarwal, Rajesh K., Andrew A. Samwick. 1999. The Other Side of the Trade-off: The Impact of Risk on Executive Compensation. Journal of Political Economy 107(1):65-105. Alexander, Cindy R. and Mark A. Cohen. 1996. New Evidence on the Origins of Corporate Crime. Managerial and Decision Economics 17: 421-435. Baker, H. Kent, and Patricia L. Gallagher. 1980. Management’s View of Stock Splits. Financial Management 9: 73-77. Barker, C. Austin. 1956. Effective Stock Splits. Harvard Business Review 34: 101-106. Barclay, Michael, and Clifford Holderness, 1989, Private benefits from control of public corporations, Journal of Financial Economics 25, 371-395. Barclay, Michael, and Clifford Holderness, 1992, The law and large-block trades, The Journal of Law and Economics 35, 265-294. Baucus, Melissa S. and Janet P. Near. 1991. Can Illegal Corporate Behavior Be Predicted? An Event History Analysis. The Academy of Management Journal 34(1): 9-36. Baumol, William, 1959, Business Behavior, Value and Growth (Macmillan, New York). Berle, Adolf, and Gardiner Means, 1932, The Modern Corporation and Private Property (Macmillan, New York). Bueno de Mesquita, Bruce, Alastair Smith, Randolph M. Siverson and James D. Morrow. 2003. The Logic of Political Survival. Cambridge MA: The MIT Press. Bueno de Mesquita, Bruce, James D. Morrow, Randolph M. Siverson and Alastair Smith. 2002. Political Institutions, Policy Choice and the Survival of Leaders.” British Journal of Political Science 32: 559-590. Bueno de Mesquita, Bruce, James D. Morrow, Randolph M. Siverson and Alastair Smith. 1999. “An Institutional Explanation of the Democratic Peace.” American Political Science Review 93: 791-807. Caplan, Dennis. 1999. “Internal Controls and the Detection of Management Fraud.” Journal of Accounting Research 37(1): 101-117. Caplow, Theodore. 1968. Two against one: coalitions in triads. Englewood Cliffs, NJ: Prentice Hall. Coase, Ronald, 1937, The nature of the firm, Economica 4, 386-405.

36
DeAngelo, Harry, and Linda DeAngelo, 1985, Managerial ownership of voting rights, Journal of Financial Economics 14, 33-69. DeAngelo, Harry, and Edward Rice, 1983, Antitakeover amendments and stockholder wealth, Journal of Financial Economics II, 329-360. Demsetz, H., and K. Lehn. 1985. The structure of corporate ownership: causes and consequences. Journal of Political Economy 93, 1155-1177. Denis, David J., Diane K. Denis, & Atulya Sarin. 1997. Ownership Structure and Top Executive Turnover. Journal of Financial Economics, 45, 193-221. Dolley, James C. 1933. Common Stock Split-ups, Motives and Effects. Harvard Business Review 12: 70-81. Grinblatt, M., R. Masulis and S. Titman. 1984. The Valuation Effects Stock Splits and Stock Dividends. Journal of Financial Economics 13: 461-490. Grossman, Sanford, and Oliver Hart, 1988, One share-one vote and the market for corporate control, Journal of Financial Economics 20, 175-202. Hansen, J. V., J. B. McDonald, W. F. Messier, Jr., and T. B. Bell. 1996. A Generalized Qualitative-Response Model and the Analysis of Management Fraud. Management Science 42(7): 1022-1032. Hermalin, Benjamin E. and Michael S. Weisbach. 1988. The determinants of board composition. RAND Journal of Economics 19(4): 589-606. Hermalin, Benjamin E. and Michael S. Weisbach. 1998. Endogenously Chosen Boards of Directors and Their Monitoring of the CEO. The American Economic Review 88(1): 96-118. Himmelberg, Charles P., R. Glenn Hubbard, and Darius Palia. 1999. Understanding the determinants of managerial ownership and the link between ownership and performance. Journal of Financial Economics 53(1999): 353-384. Holmstrom, Bengt. 1999. Managerial Incentive Problems: A Dynamic Perspective. Review of Economic Studies. 66(1): 169-182. Fama, Eugene, 1980, Agency problems and the theory of the firm, Journal of Political Economy 88: 288-307. Fama, Eugene, and Michael Jensen, 1983a, Separation of ownership and control, Journal of Law and Economics 26, 301-325. Fama, Eugene, and Michael Jensen, 1983b, Agency problems and residuals claims, Journal of Law, and Economics 26, 327-349.
37
Jarrell, Gregg, and Annette Poulsen, 1988, Shark repellents and stock prices: The effects of anti takeover amendments since 1980, Journal of Financial Economics 19, 127-168. Jensen, Michael, 1993, The modern industrial revolution, exit, and the failure of internal control systems, Journal of Finance 48, 831-880. Jensen, Michael, and William Meckling, 1976, Theory of the firm: Managerial behavior, agency costs, and ownership structure, Journal of Financial Economics 3, 305-360. Jensen, Michael, and Richard Ruback, 1983, The market for corporate control: The scientific evidence, Journal of Financial Economics 11,5-50. Lakonishok, Josef and Baruch Lev. 1987. Stock Splits and Stock Dividends: Why, Who and When. Journal of Finance 42: 913-932. Lease, Ronald, John McConnell, and Wayne Mikkelson, 1983, The market value of control in publicly traded corporations, Journal of Financial Economics 11, 439-471. Lease, Ronald, John McConnell, and Wayne Mikkelson, 1984, The market value of differential voting rights in closely held corporations, Journal of Business 57, 443-467 Malatesta, Paul, and Ralph Walkling, 1988, Poison Pill Securities: Stockholder Wealth, Profitability, and Ownership Structure, Journal of Financial Economics 20, 347-376. Marris, Robin, 1964, The Economic Theory of Managerial Capitalism (Free Press of Glencoe, Illinois). Martin, Kenneth, and John McConnell, 1991, Corporate performance, corporate takeovers, and management turnover, Journal of Finance 46, 671-688.
McConnell, John, and Henri Servaes, 1990, Additional evidence on equity ownership and corporate value, Journal of Financial Economics 27, 595-612. McNichols, M. and A. Dravid. 1990. Stock Dividends, Stock Splits, and Signaling. Journal of Finance 45: 857-879. Morck, Randall, Andrei Shleifer, and Robert Vishny, 1988, Management ownership and market valuation: An empirical analysis, Journal of Financial Economics 20, 293-315. Morton, Sanford. 1993. Strategic Auditing for Fraud. Accounting Review. 68(4): 825-839. Peterson, Craig A., James A. Millar and James N. Rimbey. 1996. The Economic Consequences of Accounting for Stock Splits and Large Stock Dividends. The Accounting Review 71(2): 241-253. Roper Center. 2002. Harris Interactive poll. USHARRIS.072502, R2A. July 30, 2002. Ryngaert, Michael, 1988, The effect of poison pill securities on shareholder wealth, Journal of Financial Economics 20, 377-417. Shibano, Toshiyuki. 1990. Assessing Audit Risk from Errors and Irregularities. Journal of Accounting Research. 28: 110-140.
38
Shleifer, Andrei, and Robert Vishny, 1986, Large shareholders and corporate control, Journal of Political Economy 94, 461-488. Shleifer, Andrei, and Robert W. Vishny. 1997. A Survey of Corporate Governance. Journal of Finance LII (2): 737-783. Stulz, Rene, 1988, Managerial control of voting rights, Journal of Financial Economics 20, 25-59. Warner, Jerold, Ron Watts, and Karen Wruck, 1988, Stock prices and top management changes, Journal of Financial Economics 20, 461-492. Weisbach, Michael I. 1988. Outside Directors and CEO Turnover. Journal of Financial Economics 20 (1988) 431-460. Williamson, Oliver, 1964, The Economics of Discretionary Behavior: Managerial Objectives in a Theory of the Firm (Prentice Hall, Englewood Cliffs, N.J.). Wruck, Karen, 1989, Equity ownership concentration and firm value, Journal of Financial Economics 23, 3-28. Yermack, David, 1997, Good timing: CEO stock option awards and company news announcements, Journal of Finance 52, 449-476. Yermack, David. 1996. Higher market valuation of companies with a small board of directors. Journal of Financial Economics 40 (1996) 185-211 Zingales, Luigi, 1994, The value of the voting right: A study of the Milan stock exchange experience, The Review of Financial Studies 7, 125-148.

39
Table 1: Summary Statistics (based on the 1,395 observations reported in Model 8) Variable Mean Standard Deviation Minimum Maximum Future Fraud 0.101 0.302 0 1 Perqs 0.758 5.806 0 186.364 DIV/Public 0.0012 0.0042 0 0.115 Private Ratio 0.037 0.068 0 0.761 Ext. Dir. Cash 0.068 0.121 0 1.200 #Ext. Dir 5.9441 3.2169 0 24 Owner 0.077 0.130 0.0008 1.01 Ln(share) 16.262 1.532 9.440 21.281 Big Owner 0.0055 0.0064 0 0.159 Concentration 0.151 0.155 0 0.882 #OfficersDirectors 12.527 4.332 2 31 #Stock Officers 2.579 2.721 0 25 Stk. Opt. Int. Directors 0.169 1.382 0 34 Stk. Opt. Executives 0.2104 1.096 0 28.642

40
Table 2: Governance Structures and the Performance of Firms. Regression analysis with fixed effect year dummies performed only on those firm not alleged to be fraudulent in the current year or two years into the future. Model 1 Model 2 Model 3 Model 4 Model 5 Model 6
Fixed-effect year dummies. Private Ratio Private Ratio Ln(MarketCap.) Ln(MarketCap.) DIV/Public (*1000)
DIV/Public (*1000)
#OfficerDirectors -0.00064 (0.0005)
-0.00074 (0.00066)
0.017* (0.007)
0.013* (0.007)
.086** (0.035)
.061 (.052)
#StockOfficers -0.00222** (0.00077)
-0.0028** (0.0010)
0.018* (0.010)
0.014 (0.010)
-.030 (.055)
-.047 (.083)
Ln(share) -0.015** (0.001)
0.069** (0.024)
-.010 (.100)
Ln(share)t-1 -0.0139** (0.0018)
0.022 (0.025)
.062 (.144)
%age Change in shares -0.042** (0.012)
1.004** (0.124)
.408 (.956)
Ln(MarketCap.)t-1 0.934** (0.020)
0.960** (0.020)
Constant 0.299** (0.021)
0.285** (0.027)
-0.172 (0.269)
0.117 (0.267)
0.464 (1.463)
-.245 (2.110)
Observations 1559 1057 1063 1061 1561 1057
Joint hypothesis test: #OfficerDirectors=0 and #StockOfficers=0
F(2,1545) = 6.62, p=0.0014
F(2,1044)= 5.25, p = 0.0054
F(2,1050)= 5.12, p = 0.0061
F(2,1047) = 3.08, p = 0.0462
F(2,1547) = 2.99, p= 0.0507
F(2,1044) = 0.73, p = 0.4834
** p<.01, * p<.05, one tailed tests. Standard errors in parentheses.
41
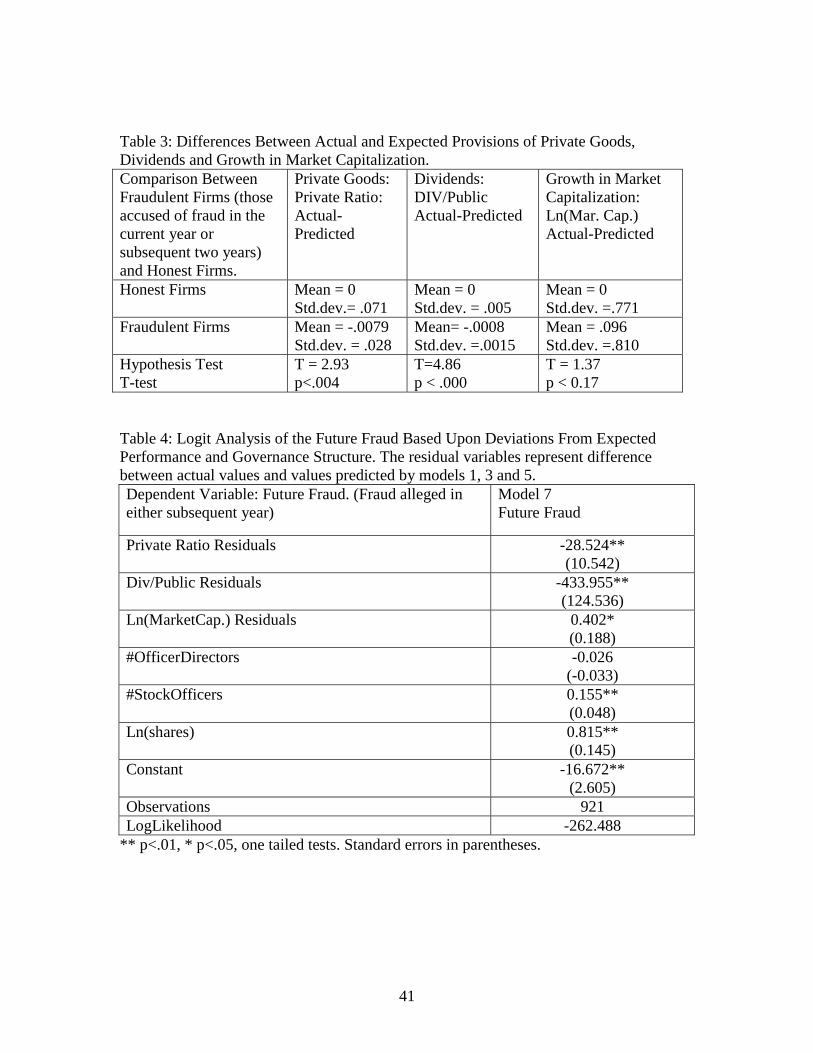
Table 3: Differences Between Actual and Expected Provisions of Private Goods, Dividends and Growth in Market Capitalization. Comparison Between Fraudulent Firms (those accused of fraud in the current year or subsequent two years) and Honest Firms.
Private Goods: Private Ratio: Actual-Predicted
Dividends: DIV/Public Actual-Predicted
Growth in Market Capitalization: Ln(Mar. Cap.) Actual-Predicted
Honest Firms Mean = 0 Std.dev.= .071
Mean = 0 Std.dev. = .005
Mean = 0 Std.dev. =.771
Fraudulent Firms Mean = -.0079 Std.dev. = .028
Mean= -.0008 Std.dev. =.0015
Mean = .096 Std.dev. =.810
Hypothesis Test T-test
T = 2.93 p<.004
T=4.86 p < .000
T = 1.37 p < 0.17
Table 4: Logit Analysis of the Future Fraud Based Upon Deviations From Expected Performance and Governance Structure. The residual variables represent difference between actual values and values predicted by models 1, 3 and 5. Dependent Variable: Future Fraud. (Fraud alleged in either subsequent year)
Model 7 Future Fraud
Private Ratio Residuals -28.524** (10.542)
Div/Public Residuals -433.955** (124.536)
Ln(MarketCap.) Residuals 0.402* (0.188)
#OfficerDirectors -0.026 (-0.033)
#StockOfficers 0.155** (0.048)
Ln(shares) 0.815** (0.145)
Constant -16.672** (2.605)
Observations 921 LogLikelihood -262.488
** p<.01, * p<.05, one tailed tests. Standard errors in parentheses.
42
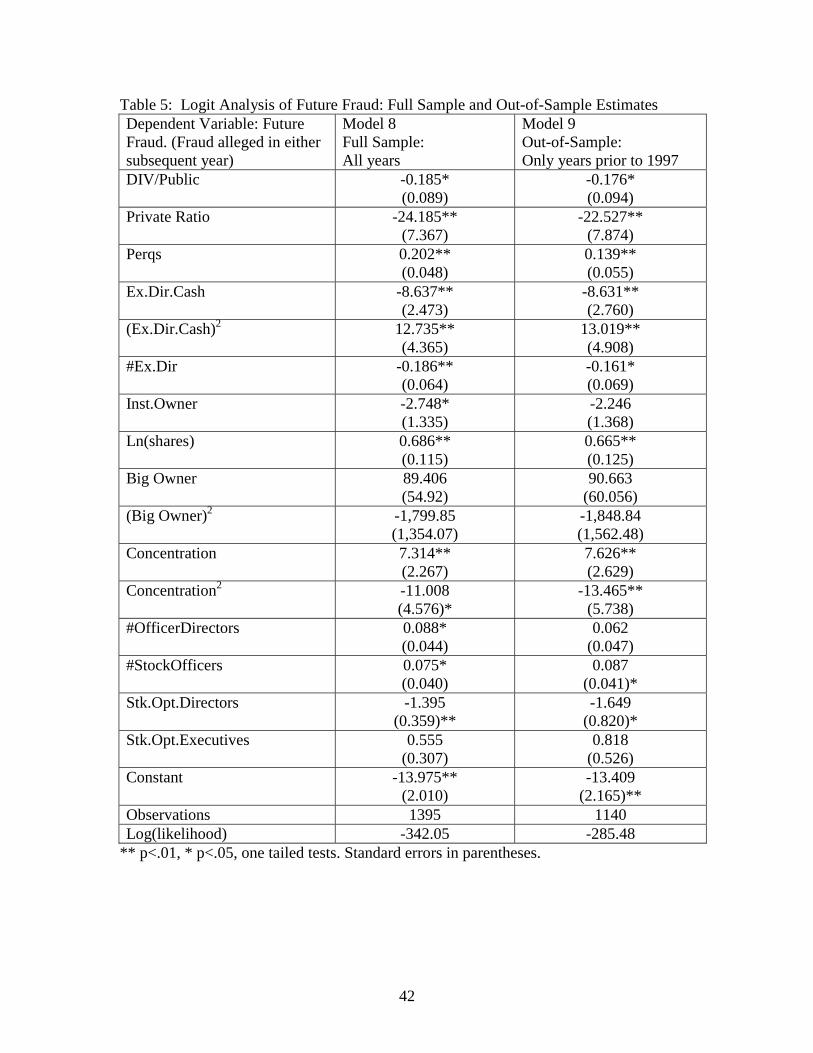
Table 5: Logit Analysis of Future Fraud: Full Sample and Out-of-Sample Estimates Dependent Variable: Future Fraud. (Fraud alleged in either subsequent year)
Model 8 Full Sample: All years
Model 9 Out-of-Sample: Only years prior to 1997
DIV/Public -0.185* (0.089)
-0.176* (0.094)
Private Ratio -24.185** (7.367)
-22.527** (7.874)
Perqs 0.202** (0.048)
0.139** (0.055)
Ex.Dir.Cash -8.637** (2.473)
-8.631** (2.760)
(Ex.Dir.Cash)2 12.735** (4.365)
13.019** (4.908)
#Ex.Dir -0.186** (0.064)
-0.161* (0.069)
Inst.Owner -2.748* (1.335)
-2.246 (1.368)
Ln(shares) 0.686** (0.115)
0.665** (0.125)
Big Owner 89.406 (54.92)
90.663 (60.056)
(Big Owner)2 -1,799.85 (1,354.07)
-1,848.84 (1,562.48)
Concentration 7.314** (2.267)
7.626** (2.629)
Concentration2 -11.008 (4.576)*
-13.465** (5.738)
#OfficerDirectors
0.088* (0.044)
0.062 (0.047)
#StockOfficers 0.075* (0.040)
0.087 (0.041)*
Stk.Opt.Directors
-1.395 (0.359)**
-1.649 (0.820)*
Stk.Opt.Executives 0.555 (0.307)
0.818 (0.526)
Constant -13.975** (2.010)
-13.409 (2.165)**
Observations 1395 1140 Log(likelihood) -342.05 -285.48
** p<.01, * p<.05, one tailed tests. Standard errors in parentheses.
43
Table 6: Fraud Risk Predictions Based Upon Full Sample Logit Estimates (Model 8) Future Fraud measures whether fraud was alleged to have occurred in either of the subsequent years. Figures in parentheses are column percentages. Future Fraud: NO Future Fraud: YES Total Number of
Firm-Years Lowest Risk (0) 938
(96.6%) 33
(3.4%) 971
Low Risk (1) 184 (87.6%)
26 (12.4%)
210
Moderate Risk (2) 80 (74.8%)
27 (25.2%)
107
High Risk (3) 42 (61.8%)
26 (38.4%)
68
Highest Risk (4) 10 (25.6
29 (74.4%)
39
Total Number of Firm-Years
1,254 141 1,395
Chi2(4) = 312.65, Pr = 0.000 Table 7: Out-of-Sample Fraud Risk Predictions Based Upon Pre-1997 Firm-Year Logit Estimates (Model 9) Future Fraud measures whether fraud was alleged to have occurred in either of the subsequent years. Figures in parentheses are column percentages. Future Fraud: NO Future Fraud: YES Total Number of
Firm-Years Lowest Risk (0) 159
(97.6%) 4
(2.4) 163
Low Risk (1) 40 (87.0%)
6 (13.0%)
46
Moderate Risk (2) 14 (87.5%)
2 (12.5%)
16
High Risk (3) 11 (64.7%)
6 (35.3%)
17
Highest Risk (4) 2 (15.4%)
11 (84.6%)
13
Total Number of Firm-Years
226 29 255
Chi2(4) = 91.85, Pr = 0.000 Receiver-Operator-Characteristic = 0.88

44
Table 8: Predictions for Recent, Notorious Cases of Alleged Fraud. (F = Fraud Alleged; 0 = Lowest Fraud Risk; 1 = Low Fraud Risk; 2 = Moderate Fraud Risk; 3 = High Fraud Risk; 4 = Highest Fraud Risk; ND = No Data)
Company 1991 1992 1993 1994 1995 1996 1997 1998 1999
Bank of America ND ND 0 4 1 4 4 0 F 0
Boston Scientific ND ND 3 3 3 3 4 F F ND
Cendant ND 1 4 3 ND 3 F 0 F 0 0
Cisco ND ND ND 3 ND 3 ND 3 F
Enron 1 0 3 1 2 3 4 4 F 4 F
Informix 0 3 3 3 F 4 F 4 F 2 F ND 4
Medaphis 1 1 2 3 F 4 F 4 F 3 F 1 ND
Rite Aid 1 1 0 2 3 4 3 4 F 2 F
Waste Management 4 4 F 4 F 3 F 2 F 4 F 4 F 1 0
Xerox 0 0 0 0 2 2 4 4 F 4 F
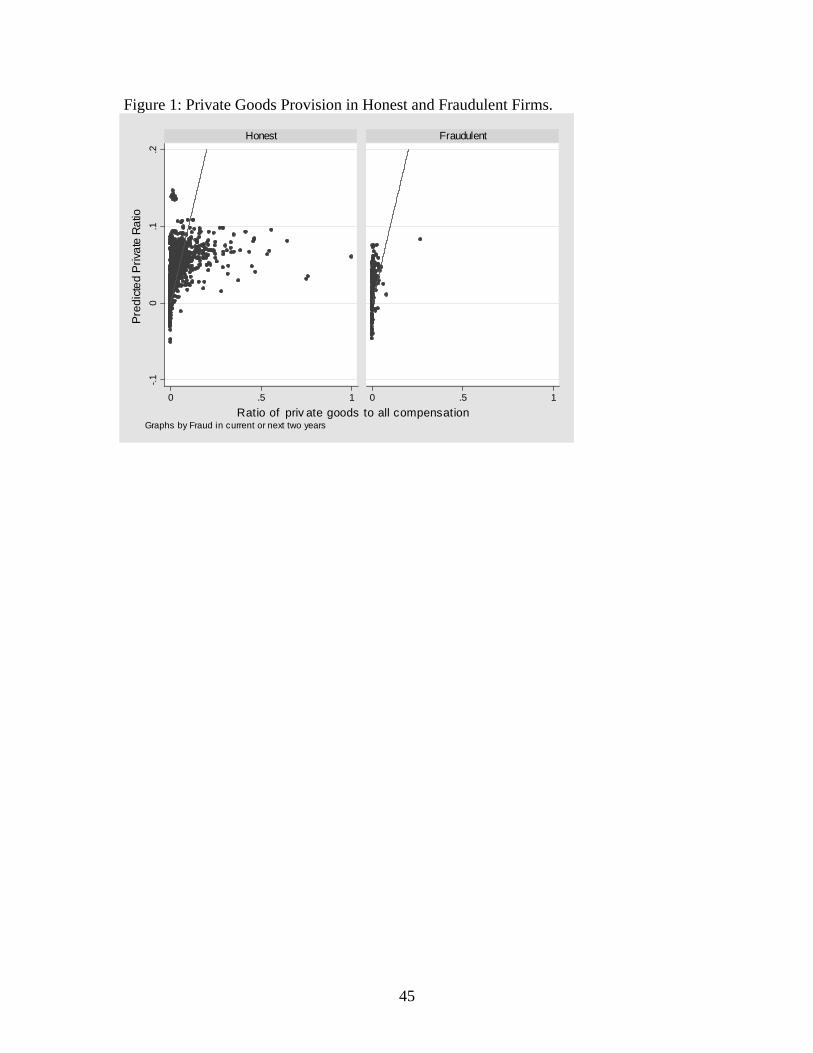
45
Figure 1: Private Goods Provision in Honest and Fraudulent Firms.
-.10
.1.2
0 .5 1 0 .5 1
Honest FraudulentP
redi
cte
d P
riva
te R
atio
Ratio of priv ate goods to all compensationGraphs by Fraud in current or next two years

46
Appendix: Description and Construction of Variables Identifying or sorting Variables:
Company name; Ticker; Date of the Report; Net income per share; Shares outstanding
(Shares) =Total company shares actually in the market place. (This does not include
shares that have been issued, but reserved for such things as options or future sale.) Share
price on last day of reported period; Fraudyn = 1 if fraud alleged for the given year, 0 if
fraud was not alleged for the given year.
Variables related to external directors:
Number of external directors (#Ext. Dir) = Number of directors who are not officers or
employees of the company. Being “Secretary” of the board of directors does not
constitute being an employee.
Cash compensation (Ext. Dir. Cash) = Fee per board meeting * number of board meetings
in year t.
Ext. director stock options (Ext. Dir. Stock) =Total number of stock options given, if any,
to the outside directors in the year.
Other compensation (Ext. Dir. Other) = All other compensation (exclusive of SARs), if
any, paid to the outside directors as a group. This may include payment for
committee participation, insurance benefits, onetime cash payment for joining the
board, etc.
Variables related to internal directors:
Number of internal directors (#Int. Dir)
Aggregate salary of internal directors (Int. Dir. Cash)

47
Int. director stock options (Int. Dir. Stock) =Total stock options given in the year to all
internal directors, if any.
Other compensation (Ext. Dir. Other) =All other compensation (exclusive of SARs), if
any, paid to the internal directors as a group.
Variables related to management/executive officers:
Top five salary (Top5Sal)= Aggregate salary of the top five (5) employees (or fewer if
the company does not have five employees).
Top five % of common shares owned (T5%Stock) = Aggregate number of shares owned
by the top five executives divided by the total number of shares outstanding.
Top five stock options (T5Stock) =Aggregate number of stock options given in the year
to the top five executives.
Top five other compensation (T5Other) = Aggregate amount of other compensation
received by the top five executives.
Number of officers listed (#Officers) =Total number of all officers of the company listed
in 10K.
All officers stock options (Off%Stock) =Total number of stock options given, if any, to
all officers in the year.
Number of officers receiving stock options (#Stock Off.) =Total number of identified
officers who received stock options during the year
Variables related to distribution of common stock:
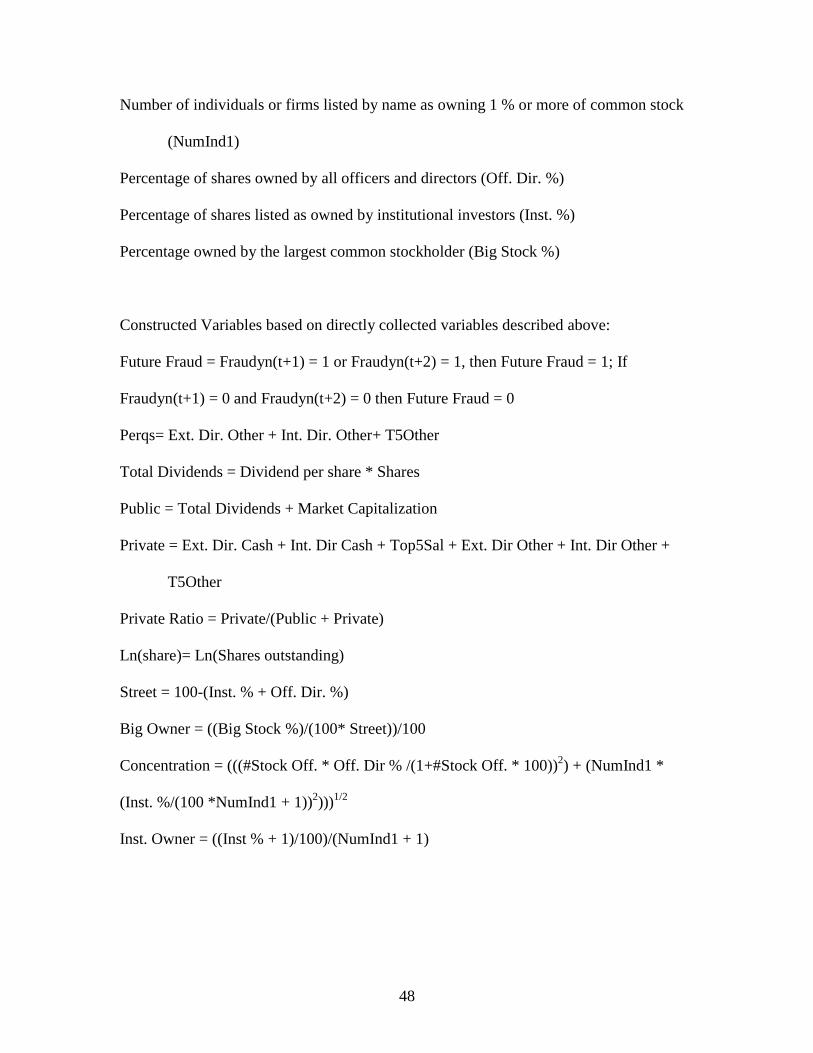
48
Number of individuals or firms listed by name as owning 1 % or more of common stock
(NumInd1)
Percentage of shares owned by all officers and directors (Off. Dir. %)
Percentage of shares listed as owned by institutional investors (Inst. %)
Percentage owned by the largest common stockholder (Big Stock %)
Constructed Variables based on directly collected variables described above:
Future Fraud = Fraudyn(t+1) = 1 or Fraudyn(t+2) = 1, then Future Fraud = 1; If
Fraudyn(t+1) = 0 and Fraudyn(t+2) = 0 then Future Fraud = 0
Perqs= Ext. Dir. Other + Int. Dir. Other+ T5Other
Total Dividends = Dividend per share * Shares
Public = Total Dividends + Market Capitalization
Private = Ext. Dir. Cash + Int. Dir Cash + Top5Sal + Ext. Dir Other + Int. Dir Other +
T5Other
Private Ratio = Private/(Public + Private)
Ln(share)= Ln(Shares outstanding)
Street = 100-(Inst. % + Off. Dir. %)
Big Owner = ((Big Stock %)/(100* Street))/100
Concentration = (((#Stock Off. * Off. Dir % /(1+#Stock Off. * 100))2) + (NumInd1 *
(Inst. %/(100 *NumInd1 + 1))2)))1/2
Inst. Owner = ((Inst % + 1)/100)/(NumInd1 + 1)