the polls—trends twenty years of public opinion …€¦ · public opinion quarterly, vol. 71,...
TRANSCRIPT

Public Opinion Quarterly, Vol. 71, No. 3, Fall 2007, pp. 444–470
THE POLLS—TRENDSTWENTY YEARS OF PUBLIC OPINION ABOUT GLOBALWARMING
MATTHEW C. NISBETTERESA MYERS
Abstract Over the past 20 years, there have been dozens of newsorganization, academic, and nonpartisan public opinion surveys on globalwarming, yet there exists no authoritative summary of their collectivefindings. In this article, we provide a systematic review of trends inpublic opinion about global warming. We sifted through hundreds ofpolling questions culled from more than 70 surveys administered overthe past 20 years. In compiling the available trends, we summarize publicopinion across several key dimensions including (a) public awareness ofthe issue of global warming; (b) public understanding of the causesof global warming and the specifics of the policy debate; (c) publicperceptions of the certainty of the science and the level of agreementamong experts; (d) public concern about the impacts of global warming;(e) public support for policy action in light of potential economic costs;and (f) public support for the Kyoto climate treaty.
Perhaps no other contemporary issue portends as many wide-ranging impactsas global warming. Spanning local, national, and international politics, globalwarming forces consideration of contentious policy measures that require majorsocietal, economic, and lifestyle changes. Given the political stakes involved,the scientific findings specific to global warming have been selectively inter-preted in ways that fit the political goals of elected officials, interest groups,and even scientists. The use and abuse of public opinion data is no exceptionto this trend. Over the past 20 years, there have been dozens of news organiza-tion, academic, and nonpartisan public opinion surveys on the topic, yet thereexists no authoritative summary of their collective findings. As a consequence,survey results often become an ideological Rorschach Test, with one side in the
MATTHEW C. NISBET, Ph.D., is assistant professor in the School of Communication, AmericanUniversity, Washington, DC, USA. TERESA MYERS is a doctoral student, School of Communication,The Ohio State University, Columbus, OH, USA. Address correspondence to Matthew C. Nisbet;e-mail: [email protected]
doi: 10.1093/poq/nfm031 Advanced Access publication August 23, 2007C© The Author 2007. Published by Oxford University Press on behalf of the American Association for Public Opinion Research.All rights reserved. For permissions, please e-mail: [email protected]

Polls Trends: Public Opinion About Global Warming 445
policy debate citing polls as reflective of a public demanding action on globalwarming, while the other side claiming that polls reveal an American citizenryunwilling to bear the economic costs of cutting greenhouse gas emissions.
In this paper, our goal is to provide a reliable and systematic review of trendsin public opinion about global warming. We sifted through hundreds of pollingquestions culled from more than 70 surveys administered over the past 20 years.In compiling the available trends, we summarize public opinion across severalkey dimensions including (a) public awareness of the issue of global warming;(b) public understanding of the causes of global warming and the specifics ofthe policy debate; (c) public perceptions of the certainty of the science andthe level of agreement among experts; (d) public concern about the impactsof global warming; (e) public support for policy action in light of potentialeconomic costs; and (f) public support for the Kyoto climate treaty.
Awareness of Global Warming as a Problem
Across dimensions of public opinion, we observed strong connections betweenpatterns in media attention to global warming and shifts in poll trends. In noarea is the connection clearer than the public’s “discovery” of global warmingas a problem. Given minimal news attention1 to the issue during the first halfof the 1980s, it is not surprising that when surveyed in 1986, only 39 percentof the public reported having “heard or read anything about the greenhouseeffect.” However, by September 1988, following record summer heat and amajor upswing in media attention, awareness of the issue had spread to 58percent of the public. As media attention to the issue increased, by the early1990s, the segment of the public who had heard or read about global warmingreached a stable upper limit, as responses varied slightly within the 80 percentrange for the next decade, topping 90 percent in 2006 (table 1).
Featuring slightly different question wording and response categories, otherpolls offer alternative indicators of public awareness. In 1997, a combined 65percent of the public reported hearing either a lot or some about global warming.Following up and down swings in media attention, during the summer of 2001,awareness of global warming had increased to a combined 75 percent of the pub-lic, with this figure dropping to 66 percent in 2003 and then rising to 78 percentin 2006 and 89 percent in 2007 (table 2). Measured slightly differently, surveysconducted by the Program on International Public Attitudes (PIPA) found thata combined 63 percent of Americans in 2004 and 72 percent of Americans in2005 reported hearing either a great deal or some about global warming.2
1. Throughout this analysis, when we refer to shifts in media attention to global warming, werely on several historical studies of patterns in news coverage (McComas and Shanahan, 1999;Shanahan and Nisbet, 2002; Trumbo, 1995). These studies have tracked coverage in the majornewspapers as well as at the broadcast television networks.2. PIPA asked: “How much have you heard about global warming or climate change? A greatdeal, a fair amount, only a little, or nothing at all?” In June 2004, 15 percent reported a great

446 Nisbet and Myers
Tabl
e1.
Hav
eyo
uhe
ard
orre
adan
ythi
ngab
outt
he“g
reen
hous
eef
fect
,”or
not?
LA
Cam
brid
gea
Har
risb
Pare
ntsc
Ana
lysi
sdC
ambr
idge
eC
ambr
idge
fC
ambr
idge
a,g
CB
ShH
arri
sIT
iT
imes
jH
arri
sIT
iH
arri
sIT
iPe
w
07/8
610
/86
09/8
809
/88
05/8
902
/90
09/9
211
/97
08/0
004
/01
08/0
109
/02
05/0
6
Yes
(%)
3945
5858
6874
8285
8982
8885
91N
o(%
)55
5540
4228
2217
1410
1411
149
Not
62
45
11
14
∗1
∗
sure
(%)
1
N1,
500
1,27
31,
000
1,00
11,
502
1,25
01,
250
953
1,01
081
31,
017
1,01
11,
001
a Sam
ple
size
isap
prox
imat
e.bH
ave
you
hear
dor
read
muc
hab
out.
..gr
eenh
ouse
effe
ct?
c Hav
eyo
uhe
ard
orre
adan
ythi
ngab
outt
hegr
eenh
ouse
effe
ct?
dH
ave
you
hear
dan
ythi
ngab
outa
“gre
enho
use
effe
ct”?
e Hav
eyo
uhe
ard
anyt
hing
abou
tthe
gree
nhou
seef
fect
inth
eat
mos
pher
eth
atco
uld
caus
egl
obal
war
min
g?f O
nth
esu
bjec
tof
envi
ronm
ent,
have
you
hear
dan
ythi
ngab
outt
hegr
eenh
ouse
effe
ctin
the
atm
osph
ere
that
coul
dca
use
glob
alw
arm
ing?
gH
ave
you
hear
dor
read
anyt
hing
abou
tthe
enha
nced
gree
nhou
seef
fect
,als
oca
lled
glob
alw
arm
ing?
hG
loba
lwar
min
gis
ate
rmus
edto
desc
ribe
chan
ges
inth
eea
rth’
scl
imat
e.H
owm
uch
have
you
hear
dor
read
abou
tglo
balw
arm
ing—
alo
t,so
me,
notm
uch,
orno
thin
gat
all?
i Hav
eyo
uev
erse
en,h
eard
,or
read
abou
tthe
theo
ryof
glob
alw
arm
ing—
that
aver
age
tem
pera
ture
sar
eri
sing
slow
lyan
dw
illco
ntin
ueto
rise
mai
nly
beca
use
ofth
ebu
rnin
gof
coal
,oil,
and
othe
rfu
els?
j Hav
eyo
uhe
ard
orre
adan
ythi
ngab
outt
heis
sue
ofgl
obal
war
min
g?∗ L
ess
than
.5%
.

Polls Trends: Public Opinion About Global Warming 447
Table 2. Global warming is a term used to describe changes in the earth’sclimate. How much have you heard or read about global warming—a lot,some, not much, or nothing at all?
CBS
11/97 06/01 9/03a 5/06a 4/07a
A lot (%) 27 37 27 41 42Some (%) 38 38 39 37 47Not much (%) 20 19 23 16 9Nothing at all (%) 14 6 10 6 3Don’t know (%) 1 – 1 – –
N 953 1050 675 1241 1052
aGlobal warming is a term used to describe changes in the temperature of the earth’s atmospherewhich could result in changes in the environment. How much have you heard or read about globalwarming—a lot, some, not much, or nothing at all?
In contrast to global warming generally, public awareness of the KyotoProtocol has remained relatively low. Consider that in November 1997, a monthbefore the Kyoto meetings, just 7 percent of the public reported hearing either alot or a fair amount about the pending conference. Even in the months followingthe meeting, according to a PIPA survey employing slightly different questionwording, only a combined 25 percent of the public had either heard a great dealor some about Kyoto (table 3).
Public Knowledge of Global Warming
Twenty years after scientists and journalists first alerted the public to the po-tential problem of global warming, few Americans are confident that they fullygrasp the complexities of the issue, and on questions measuring actual knowl-edge about either the science or the policy involved, the public scores very low.As of 1992, only 11 percent of the public answered that they understood theissue of global warming “very well,” and across Gallup surveys taken eachyear between 2001 and 2005, this figure ranged between only 15 percent and18 percent of respondents, increasing to 22 percent of respondents in 2007(table 4). Asked slightly differently, in separate polls taken in 2006 and 2007,ABC News found that only 11 percent of Americans felt they knew “a lot”about global warming, an increase from 5 percent in 1997 (table 5).
deal, 48 percent a fair amount, 28 percent only a little, and 10 percent nothing all. In June 2005,responses broke down in the same order as 22 percent, 50 percent, 20 percent, and 8 percent. (N =688; N = 812). Surveys were conducted by Knowledge Networks using a RDD recruited sample ofits nationally representative panel of citizens provided Web TV access to complete on-line surveys.

448 Nisbet and Myers
Table 3. Later this year (1997) an international conference on global warming,including representatives from governments around the world, will be held inKyoto, Japan. How much, if anything, have you heard about this conference,known as the Kyoto conference? A lot, a fair amount, not very much, not at all.
Gallup 11/97 PIPAa,b 02/98–04/98
A lot/great deal (%) 2 5A fair amount/some (%) 5 20Not very much (%) 22 39Not/nothing at all (%) 70 35Don’t know/refused (%) ∗ 2
N 1,004 2,747
aAs you may know recently there was a world conference in Kyoto on the problem of globalwarming. How much have you heard about this conference . . . a great deal, some, not very much,or nothing at all?
bThe poll was conducted in three waves: a first wave of 1,201 respondents February 13–17,1998, a second wave of 600 respondents March 15–17, 1998, and a third wave of 946 April 16–20,1998.
∗Less than .5%.
Table 4. Next, thinking about the issue of global warming, sometimes calledthe “greenhouse effect”, how well do you feel you understand this issue-wouldyou say very well, fairy well, not very well, or not at all?
Gallup
01/92 11/97 03/01 03/02 03/03 03/04 03/05 03/11–03/14/07
Very well (%) 11 16 15 17 15 18 16 22Fairly well (%) 42 45 54 52 53 50 54 54Not very 22 28 24 25 27 26 24 19
well (%)Not at all (%) 22 10 6 6 5 6 6 4No opinion (%) 3 1 1 ∗ – – ∗ –
N 1,032 1,003 1,060 1,006 1,003 1,005 1,004 1,009
∗Less than .5%.
Table 5. How much do you feel you know about global warming, a lot, amoderate amount, a little, or nothing?
OSU ABC
10/97 2/98 03/06 04/07
A lot (%) 5 5 11 11Moderate amount (%) 38 39 47 51Little (%) 51 46 36 33Nothing (%) 7 10 6 4
N 688 753 1,002 1,002

Polls Trends: Public Opinion About Global Warming 449
Table 6. (And for each these statements, just check the box that comes closestto your opinion of how true it is—definitely true, probably true, probably nottrue, definitely not true. In your opinion, how true is this?) . . . Every time weuse coal or oil or gas, we contribute to the greenhouse effect.
GSS
01/94–05/94 02/00–05/00
Definitely true (correct) (%) 14 18Probably true (correct) (%) 47 44Probably not true (%) 21 19Definitely not true (%) 4 5Can’t choose (%) 14 15
N 2,992 2,817
Table 7. (And for each these statements, just check the box that comes closestto your opinion of how true it is—definitely true, probably true, probably nottrue, definitely not true. In your opinion, how true is this?) . . . The greenhouseeffect is caused by a hole in the earth’s atmosphere.
GSS
01/94–05/94 02/00–05/00
Definitely true (%) 16 17Probably true (%) 41 37Probably not true (correct) (%) 16 18Definitely not true (correct) (%) 11 12Can’t choose (%) 17 16
N 2,992 2,817
In terms of measures of actual knowledge, when quizzed by the GeneralSocial Survey (GSS) in 1994 and again in 2000, 61 percent and 62 percent ofthe public could at least answer correctly that using coal or gas contributed to thegreenhouse effect (table 6). Yet in 1994, when asked by the GSS, 57 percent ofthe public still confused the issue with ozone depletion, erroneously believingthat the greenhouse effect was caused by a hole in the earth’s atmosphere.This erroneous belief remained at 54 percent in 2000 (table 7).3 Beyond thebasic science of global warming, the public is similarly in the dark when it
3. Confusion over the linkages between the greenhouse effect and ozone depletion are also ap-parent in the following February 1994 question asked by Harris: “The Ozone hole is due to . . .”with 5 percent answering “the greenhouse effect,” 13 percent answering an “increase in chlo-rofluorocarbons or CFCs,” 13 percent answering the “burning of tropical rainforests,” 2 percentanswering the “burning of tropical rainforests,” 56 percent answering “all of the above,” and 24percent answering “Not sure,” (N = 1,255).

450 Nisbet and Myers
Table 8. Just based on your impressions, do you think President Bush favorsor opposes the United States participating in the Kyoto agreement to reduceglobal warming?
PIPA
10/02 09/04a 06/05a
Favors United States participating (%) 48 42 43Opposes United States participating (correct answer) (%) 42 48 43No answer (%) 11 11 14
N 1,091 1,195 812
aSurvey conducted by Knowledge Networks using a RDD recruited sample of its nationallyrepresentative panel of citizens provided Web TV access to complete on-line surveys.
comes to understanding the U.S. position on the Kyoto Protocol. In surveystaken in 2002, 2004, and 2005, when asked about the specifics of the Bushadministration’s decision on whether or not to participate in the Kyoto Treaty,less than half of Americans correctly answered that the Bush administrationhad decided to withdraw U.S. support (table 8).
Belief in the Reality of Global Warming and in ScientificConsensus
Although a strong majority of Americans believe that global warming is real,that temperatures are rising, and that the release of carbon dioxide is a cause,the public remains relatively uncertain about whether the majority of scientistsagree on the matter. Depending on how the question is asked, belief thatscientists have reached a consensus view ranges from only a third of Americansto more than 60 percent.
Specific to judgments about whether or not the greenhouse effect or globalwarming is real, as early as 1992, 68 percent answered in the affirmative. Yetthis number declined in 1994 to 57 percent, a trend likely promoted by thestrategic communication efforts of conservative think tanks to boost skepticismabout the problem (McCright and Dunlap, 2000).4 However, when asked aboutthe topic slightly differently, in 2000, 2001, and 2002, more than 70 percent of
4. Cambridge Reports/Research International asked: “Some people believe that the enhancedgreenhouse effect—or the gradual warming of the earth’s atmosphere—is caused by carbon dioxideand other gases accumulating in the atmosphere and preventing heat from the earth’s surface fromescaping into space. They also believe that global warming could lead to harmful changes in oceanlevels and weather patterns. Other people think the evidence that points to a gradual warming ofthe earth’s atmosphere is far from conclusive and feel that predictions about harmful changes inocean levels and weather patterns are exaggerated. Given what you have heard and know, do youthink the enhanced greenhouse effect or global warming really exists? (N = 1,250 for both years).
Polls Trends: Public Opinion About Global Warming 451
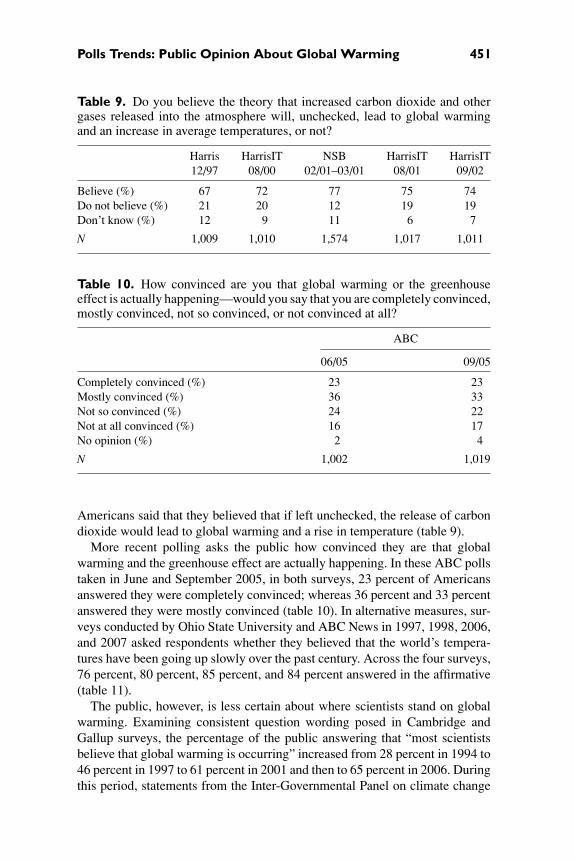
Table 9. Do you believe the theory that increased carbon dioxide and othergases released into the atmosphere will, unchecked, lead to global warmingand an increase in average temperatures, or not?
Harris HarrisIT NSB HarrisIT HarrisIT12/97 08/00 02/01–03/01 08/01 09/02
Believe (%) 67 72 77 75 74Do not believe (%) 21 20 12 19 19Don’t know (%) 12 9 11 6 7
N 1,009 1,010 1,574 1,017 1,011
Table 10. How convinced are you that global warming or the greenhouseeffect is actually happening—would you say that you are completely convinced,mostly convinced, not so convinced, or not convinced at all?
ABC
06/05 09/05
Completely convinced (%) 23 23Mostly convinced (%) 36 33Not so convinced (%) 24 22Not at all convinced (%) 16 17No opinion (%) 2 4
N 1,002 1,019
Americans said that they believed that if left unchecked, the release of carbondioxide would lead to global warming and a rise in temperature (table 9).
More recent polling asks the public how convinced they are that globalwarming and the greenhouse effect are actually happening. In these ABC pollstaken in June and September 2005, in both surveys, 23 percent of Americansanswered they were completely convinced; whereas 36 percent and 33 percentanswered they were mostly convinced (table 10). In alternative measures, sur-veys conducted by Ohio State University and ABC News in 1997, 1998, 2006,and 2007 asked respondents whether they believed that the world’s tempera-tures have been going up slowly over the past century. Across the four surveys,76 percent, 80 percent, 85 percent, and 84 percent answered in the affirmative(table 11).
The public, however, is less certain about where scientists stand on globalwarming. Examining consistent question wording posed in Cambridge andGallup surveys, the percentage of the public answering that “most scientistsbelieve that global warming is occurring” increased from 28 percent in 1994 to46 percent in 1997 to 61 percent in 2001 and then to 65 percent in 2006. Duringthis period, statements from the Inter-Governmental Panel on climate change

452 Nisbet and Myers
Table 11. You may have heard about the idea that the world’s temperaturesmay have been going up slowly over the past 100 years. What is your personalopinion on this—do you think this has probably been happening, or do youthink it probably hasn’t been happening?”
OSU ABC
10/97 2/98 03/06 04/07
Probably happening (%) 76 80 85 84Probably not happening (%) 22 18 13 13Don’t know (%) 2 2 2 3
N 688 753 1,002 1,002
Table 12. On the environmental issue known as global warming, just yourimpression, which one of the following statements do you think is most accu-rate: Most scientists believe that global warming is occurring, most scientistsbelieve that global warming is not occurring, or most scientists are unsure aboutwhether global warming is occurring or not?
Cambridge Gallup
09/94a 11/97b 03/01b 03/06b
Most believe is occurring (%) 28 46 61 65Most believe is not occurring (%) 8 12 4 3Most unsure (%) 58 37 30 29No opinion (%) 6 5 5 3
N 1,250 1,019 1,060 1,000
aSample size is approximate.bJust your impression, which one of the following statements do you think is most accurate? Most
scientists believe that global warming is occurring. Most scientists believe that global warming isnot occurring. Most scientists are unsure about whether global warming is occurring or not.
shifted in 1995 from a tentative “balance of evidence” view that humans wereinfluencing global climate to a much stronger consensus view issued in 2001(table 12). Yet in 2004 and 2005, when PIPA asked about the perception ofexpert agreement slightly differently, they found that only 43 percent and 52percent of the public across the two years believed that there was a “consensusamong the great majority of scientists that global warming exists and could dosignificant damage” (table 13). Similarly, according to polls by OSU and ABCNews only 35 percent of respondents in 1997, 30 percent in 1998, 35 percentin 2006, and 40 percent in 2007 believed that “most scientists agree with oneanother about whether or not global warming is happening,” compared to62 percent, 67 percent and 64 percent of respondents across the two surveyswho perceived “a lot of disagreement” (table 14). Trust in scientists likely

Polls Trends: Public Opinion About Global Warming 453
Table 13. Which of the following statements is closest to your own opinion?There is a consensus among the great majority of scientists that global warmingexists and could do significant damage. There is a consensus among the greatmajority of scientists that global warming does not exist and therefore posesno significant threat. Scientists are divided on the existences of global warmingand its impact.
PIPA
06/04a 06/05a
Consensus that GW exists and poses threat (%) 43 52Consensus that GW does not exist and poses no threat (%) 4 5Scientists are divided on existence and impact (%) 50 39No opinion (%) 4 4
N 688 812
aSurvey conducted by Knowledge Networks using a RDD recruited sample of its nationallyrepresentative panel of citizens provided Web TV access to complete on-line surveys.
Table 14. Do you think most scientists agree with one another about whetheror not global warming is happening, or do you think there is a lot of disagree-ment among scientists on this issue?
OSU ABC
10/97 02/98 03/06 04/07
Most agree (%) 35 30 35 40A lot of disagreement (%) 62 67 64 56No opinion (%) 3 3 1 3
N 688 753 1,002 1,002
remains a factor in perceptions of the scientific evidence relative to globalwarming. According to ABC News polls taken in 2006 and 2007, in each year,only 32 percent of Americans answered that they trust the things scientists sayabout the environment “completely” or “a lot” compared to 24 percent and 27percent who trust what scientists say “little” or “not at all.” (table 15).
Related to the topic of scientific uncertainty, when asked by Gallup in sur-veys taken between 1997 and 2006 to evaluate the performance of the newsmedia in accurately conveying the seriousness of global warming, the pub-lic appears split, with approximately a third believing that news coverage is“generally exaggerated,” approximately a third believing that news coverage is“generally correct,” and a final third believing that in news coverage the prob-lem is “generally underestimated.” In this final category, however, there doesappear to be some significant change since 1999, with the proportion of Amer-icans believing that news reports generally underestimate the global warming

454 Nisbet and Myers
Table 15. How much do you trust the things that scientists say about theenvironment—completely, a lot, a moderate amount, a little, or not at all?
ABC
03/06 04/07
Completely (%) 5 5A Lot (%) 27 27Moderate amount (%) 41 43A Little (%) 22 19Not at all (%) 5 5N 1,002 1,002
Table 16. Thinking about what is said in the news, in your view is the seri-ousness of global warming—generally exaggerated, generally correct, or is itgenerally underestimated?
Gallup
11/97 03/01 03/02 03/03 03/04 3/05 3/06 3/11–3/14/07
Generallyexaggerated (%)
31 30 31 33 38 31 30 33
Generallycorrect (%)
34 34 32 29 25 29 28 29
Generally under-estimated (%)
27 32 32 33 33 35 38 35
Don’t know/refused (%)
8 4 5 5 4 5 4 4
N 1,003 1,060 1,006 1,003 1,005 1,004 1,000 1,009
problem shifting from 27 percent in 1997 to 38 percent and 35 percent in 2006and 2007, respectively (table 16).
The Perceived Immediacy of Global Warming Impacts
Scientists have long lamented the problems of communicating to the public theurgency of global warming. Several studies have documented the tendency ofAmericans to discount the threat of climate change due to its “creeping nature,”an environmental problem with consequences that are perceived to be far off inthe future (Moser and Dilling, 2004). Poll trends back up these conclusions. Forexample, Gallup asked respondents to evaluate the timeline for global warmingeffects. Queried in 1997, and then each year between 2001 and 2005, only abare majority of Americans answered that the effects of global warming hadalready begun, with this figure rising to 60 percent in 2007 (table 17). Othersurvey trends show that only about a third of the public believe that globalwarming will pose a threat within their lifetime (table 18).

Polls Trends: Public Opinion About Global Warming 455
Tabl
e17
.W
hich
ofth
efo
llow
ing
stat
emen
tsre
flect
syo
urvi
ewof
whe
nth
eef
fect
sof
glob
alw
arm
ing
will
begi
nto
happ
en?
The
yha
veal
read
ybe
gun
toha
ppen
.The
yw
illst
arth
appe
ning
with
ina
few
year
s.T
hey
will
star
thap
peni
ngw
ithin
your
lifet
ime.
The
yw
illno
thap
pen
with
inyo
urlif
etim
e,bu
tthe
yw
illef
fect
futu
rege
nera
tions
.The
yw
illne
ver
happ
en.
Gal
lup
11/9
703
/01
03/0
203
/03
03/0
403
/05
03/0
603
/23–
3/25
/07
Hav
eal
read
ybe
gun
(%)
4854
5351
5154
5860
Will
star
twith
infe
wye
ars
(%)
34
56
55
54
Will
star
twith
inlif
etim
e(%
)14
1313
1212
1010
7W
illno
thap
pen
inlif
etim
e,bu
teff
ectf
utur
ege
nera
tions
(%)
1918
1717
1819
1515
Nev
erha
ppen
(%)
97
910
119
811
Don
’tkn
ow/r
efus
ed(%
)7
43
43
33
3
N1,
003
1,06
01,
006
1,00
31,
005
1,00
41,
000
1,00
7

456 Nisbet and Myers
Table 18. Do you think that global warming will pose a threat to you or yourway of life in your lifetime?
Gallup Gallupa ABCb Gallupa
11/97 03/01 03/02 06/05 03/06
Yes (%) 25 31 33 33 35No (%) 69 66 65 66 62Don’t know/refused (%) 8 3 2 1 2
N 1,003 1,060 1,006 1,002 1,000
aDo you think that global warming will pose a serious threat to you or your way of life in yourlifetime?
bDo you think the effects of global warming will pose a serious threat to you or your way of lifein your lifetime, or not? Yes, will pose a threat; no, will not pose a threat; no opinion.
In 1993, 1994, and 2000, the GSS measured public perceptions not only ofthe dangers of the greenhouse effect for the environment but also the perceiveddangers to the respondent and his/her family. Regardless of whether or notthe environment or the individual is referenced in the question, the percent-age breakdowns for these questions are remarkably consistent and do not shiftappreciably across 1993, 1994, and 2000. Approximately 15 percent of thepublic believed that both the environmental and the personal impacts of thegreenhouse effect were “extremely dangerous,” up to approximately 25 per-cent believed the impacts to be “very dangerous,” 34–36 percent “somewhatdangerous,” 10–15 percent “not very dangerous,” and 3 percent or less believethe impacts to be “not dangerous at all”(table 19).
Concern about Global Warming Compared to OtherProblems and Issues
One series of surveys show that the “personal importance” of global warminghas increased considerably over the past decade, with the proportion of Amer-icans who say that global warming is either personally “extremely important”or “very important” shifting from 27 percent in 1997 to 52 percent in 2007(table 20). Yet how does this perceived importance compare to concern overother environmental issues?
One source for contextualizing the public’s concern is a set of itemsadministered by Gallup across years spanning 1989 to 2006. In these sur-veys, Gallup asked respondents how much they “worry” about a number ofspecific environmental problems. For the greenhouse effect or global warming,between 1989 and 1991, about a third of respondents indicated that they worried“a great deal” about the issue. When next asked in the fall of 1997, this figurehad dropped to 24 percent, but then increased to 34 percent in 1999 and to

Polls Trends: Public Opinion About Global Warming 457
Table 19. In general, do you think that a rise in the world’s temperature causedby the “greenhouse effect” is . . . extremely dangerous for the environment, verydangerous, somewhat dangerous, not very dangerous, or, not at all dangerousfor the environment?
GSS
02/93–03/93 01/94–05/94 02/00–05/00
Environment Familya Environment Familya Environment
Extremelydangerous (%)
17 15 14 13 17
Very dangerous (%) 24 24 21 20 26Somewhat
dangerous (%)34 34 36 36 34
Not very dangerous (%) 12 15 14 16 10Not dangerous at all for
the environment/family (%)
2 3 2 3 2
Can’t choose (%) 10 11 13 13 13
N 1,557 1,557 2,992 2,992 2,817
aIn general, do you think that a rise in the world’s temperature caused by the “greenhouse effect”is . . . extremely dangerous for you and your family, very dangerous, somewhat dangerous, not verydangerous, or, not at all dangerous for you and your family?
Table 20. How important is the issue of global warming to you personally—extremely important, very important, somewhat important, not too important,or not at all important?
OSU ABC
10/97 02/98 03/06 04/07
Extremely important (%) 7 9 17 18Very important (%) 20 21 33 34Somewhat important (%) 47 49 32 30Not too important (%) 20 15 18 17Not at all important (%) 6 5 8 9
N 688 753 1,002 1,002
40 percent in 2000. However, after the terrorist attacks of 2001, the percentagewho worried a “great deal” dipped again to 29 percent in 2002, remaining at28 percent in 2003 and 2004. Public concern appeared to rebound in 2006 and2007, with 36 percent and 41 percent saying that they worried a “great deal”(table 21).

458 Nisbet and Myers
Tabl
e21
.I’
mgo
ing
tore
adyo
ua
list
ofen
viro
nmen
tal
prob
lem
s,A
sI
read
each
one,
plea
sete
llm
eif
you
pers
onal
lyw
orry
abou
tth
ispr
oble
ma
grea
tde
al,
afa
iram
ount
,on
lya
little
,or
not
atal
l.Fi
rst,
how
muc
hdo
you
pers
onal
lyw
orry
abou
t..
.th
e“g
reen
hous
eef
fect
”or
glob
alw
arm
ing?
Gal
lup
05/8
904
/90
04/9
110
/97
03/9
904
/99
04/0
003
/01
03/0
203
/03
03/0
403
/06
03/1
1–3/
14/0
7
Gre
atde
al(%
)35
3035
2428
3440
3329
2828
3641
Fair
amou
nt(%
)28
2727
2631
3432
3029
3025
2624
Onl
ya
little
(%)
1820
2229
2318
1522
2323
2821
18N
otat
all(
%)
1216
1217
1612
1213
1717
1915
16N
oop
inio
n(%
)7
65
42
21
22
22
11
N1,
239
1,22
31,
007
1,00
81,
069
1,02
51,
004
1,06
01,
006
1,00
31,
005
1,00
01,
009

Polls Trends: Public Opinion About Global Warming 459
Despite renewed public concern, when asked specifically about a range ofenvironmental issues, global warming remains at the lower end of worries,especially in comparison to water-related pollution. In 2006 and 2007, signif-icantly more Americans worried a “great deal” about “pollution of drinkingwater” (54 percent and 58 percent, respectively), “pollution of rivers, lakes, andreservoirs” (51 percent, 53 percent), “contamination of soil and water by toxicwaste” (52 percent, 52 percent), and the “maintenance of the nation’s supplyof fresh water for household needs” (49 percent, 51 percent) than about globalwarming (36 percent, 41 percent) (Carroll, 2006, 2007; Saad, 2006).
However, the relative salience of global warming as an environmentalproblem appears to also vary according to how it is measured. In 2006 and2007, instead of prompting respondents with a list of issues, ABC News askedrespondents in an open-ended fashion to name “the single biggest environ-mental problem the world faces at this time?” In 2006, global warming rankedfirst, as 16 percent of respondents named the issue the biggest environmental
Table 22. What in your opinion is the single biggest environmental problemthe world faces at this time?
ABC
03/06 04/07
Global warming/greenhouse effect/climate change (%) 16 33Air pollution (%) 13 13Energy problems/dependence fossil fuels/lack of oil (%) 8 6Toxic substances in environment (%) 7 6Water pollution (%) 6 5Pollution (unspecified) (%) 4 4Misc. pollution mentions (%) 3 4Destruction/fragmentation/loss of habitat, rain forests, wetlands,
forests, open spaces, overdevelopment, logging, and mining (%)7 4
Waste/landfills/not enough recycling (%) 9 3Overpopulation/overconsumption (%) 4 3Oil drilling/oil tankers (%) 2 1Saving natural resources (%) 3 1Tsunami/tidal wave/earthquake/natural disasters (%) 1 ∗
Acid rain (%) ∗ ∗
Spread of invasive nonnative species (%) ∗ ∗
Extinction of species (%) ∗ 0None (%) 2 1Other (%) 8 7No opinion (%) 7 8
N 1,002 1,002
∗Less than .5%.

460 Nisbet and Myers
problem, with the proportion of respondents more than doubling to 33 percentin 2007 (table 22).
Weighing the Costs of Action in Dealing with Global Warming
At the center of the public policy debate over global warming has been theperceived trade-offs between immediate action and the likely costs to citizensand the economy. Cambridge Research International were the first to gaugethe public’s view on this matter with a series of poll questions that began in1986. According to these surveys, in the late 1980s the public expressed apreference for immediate action rather than simply more research. Yet duringthe early 1990s, as many advocates and political figures pushed the need formore research while exaggerating the possible negative economic impacts,public preference for immediate policy action sharply declined. This shift,however, should be interpreted cautiously given the slight changes in questionwording across these surveys (table 23).
However, by the end of the decade, bolstered by a historically strong econ-omy, public support for immediate action rebounded. In 1998, according to aPIPA survey, 39 percent felt that global warming was a serious enough problemthat action should be taken even if it involved significant costs, while 44 percentpreferred steps that would be lower in cost, and only 15 percent took the po-sition that no steps with economic costs should be taken. Still, by 2004, facedwith a weaker economy and the competing priorities of war and terrorism,23 percent now favored the “no costs” position, and this response remained thepreferred choice among 21 percent of Americans in 2005 (table 24).
CBS and PIPA survey questions administered in 1997, 2004, and 2005reveal that the public’s evaluation of policy options varies by the responsecategories that are offered. In these examples, respondents are forced to indicatewhich of two statements about action versus costs are closer to their opinion.The statements dichotomize policy choices into either helping or hurting theeconomy. Given these response options, more than two-thirds of the publicacross these three years indicated that they believed efforts to curb greenhousegases would make the economy more competitive, compared to the less than athird of Americans who believed such efforts would cost too much money andhurt the economy (table 25).
Acceptance of Specific Economic Impacts, Taxes,and Regulatory Programs
Several surveys have asked Americans about support for policy action thatmight generate specific kinds of economic impacts, or that might create cer-tain incentives for cutting emissions. Public support appears strongest for reg-ulations that require emission limits on industry and automobiles and thatwould mandate the production of hybrid cars. The public favors tax incentive

Polls Trends: Public Opinion About Global Warming 461
Tabl
e23
.So
me
peop
leha
veex
pres
sed
conc
ern
that
the
gree
nhou
seef
fect
coul
dre
sult
inso
me
ofth
ew
orld
’sm
ost
prod
uctiv
eag
ricu
ltura
lare
asbe
com
ing
too
arid
for
farm
ing.
Whi
chof
the
follo
win
gvi
ews
abou
tthe
gree
nhou
seef
fect
iscl
oses
tto
your
own
opin
ion?
...
(1)
Bas
edon
the
scie
ntifi
cco
mm
unity
’scu
rren
tund
erst
andi
ngof
the
gree
nhou
seef
fect
,the
fede
ralg
over
nmen
tsho
uld
pass
envi
ronm
enta
llaw
sto
help
solv
eth
epr
oble
m.(
2)T
hefe
dera
lgov
ernm
ents
houl
dpa
ssso
me
initi
alla
ws
now
tobe
gin
tocu
rbth
egr
eenh
ouse
effe
ctbu
tsh
ould
avoi
dco
stly
cont
rol
prog
ram
sun
tilm
ore
rese
arch
isdo
neto
find
out
exac
tlyw
hat
caus
esth
egr
eenh
ouse
effe
ctan
dw
hati
tsim
pact
will
be.(
3)B
efor
epa
ssin
gan
yne
wen
viro
nmen
tall
aws
tohe
lpcu
rbth
egr
eenh
ouse
effe
ct,t
hefe
dera
lgov
ernm
ents
houl
dfin
ance
mor
ere
sear
chef
fort
sto
find
oute
xact
lyw
hatc
ause
sth
egr
eenh
ouse
effe
ctan
dw
hati
tsim
pact
will
be.
Cam
brid
ge
07/8
6a,b
07/8
8a,b
07/8
9a,b
12/9
0a09
/91a
09/9
2a09
/93a
09/9
4a
Bas
edon
the
scie
ntifi
cco
mm
unity
’scu
rren
tund
erst
andi
ngof
the
gree
nhou
seef
fect
,the
fede
ralg
over
nmen
tsho
uld
pass
envi
ronm
enta
llaw
sto
help
solv
eth
epr
oble
m(%
)
1829
2814
1415
1210
The
fede
ralg
over
nmen
tsho
uld
pass
som
ein
itial
law
sno
wto
begi
nto
curb
the
gree
nhou
seef
fect
buts
houl
dav
oid
cost
lyco
ntro
lpro
gram
sun
tilm
ore
rese
arch
isdo
neto
find
out
exac
tlyw
hatc
ause
sth
egr
eenh
ouse
effe
ctan
dw
hati
tsim
pact
will
be(%
)
2830
2839
4235
3333
Bef
ore
pass
ing
any
new
envi
ronm
enta
llaw
sto
help
curb
the
gree
nhou
seef
fect
,the
fede
ralg
over
nmen
tsho
uld
finan
cem
ore
rese
arch
effo
rts
tofin
dou
texa
ctly
wha
tcau
ses
the
gree
nhou
seef
fect
and
wha
tits
impa
ctw
illbe
(%)
3224
3142
4045
4648
Don
’tkn
ow(%
)22
1713
64
59
9
N1,
500
1,50
01,
500
1,25
01,
250
1,25
01,
250
1,25
0
a Sam
ple
size
isap
prox
imat
e.bIn
terv
iew
met
hod
isfa
ce-t
o-fa
ce.

462 Nisbet and Myers
Table 24. There is a controversy over what the countries of the world, in-cluding the United States, should do about the problem of global warming.I’m going to read you three statements. Please tell me which statement comesclosest to your own point of view. [ARO] (1) Until we are sure that globalwarming is really a problem, we should not take any steps that would haveeconomic costs. (2) The problem of global warming should be addressed, butits effects will be gradual, so we can deal with the problem gradually by takingsteps that are low in cost. (3) Global warming is a serious and pressing problem.We should begin taking steps even if this involves significant costs.
PIPA
10/98 06/04a 06/05a
Should begin taking steps now even ifinvolves significant costs (%)
39 31 34
Problem of global warming should be addressedbut effects will be gradual, we can deal withproblem by taking steps low in cost (%)
44 45 42
Should not take any steps that would haveeconomic costs (%)
15 23 21
Don’t know (%) 2 1 2
N 600 753 812
aSurvey conducted by Knowledge Networks using a RDD recruited sample of its nationallyrepresentative panel of citizens provided Web TV access to complete on-line surveys.
Table 25. Which comes closer to your opinion?
CBS PIPA
11/97 06/04a 06/05a
Efforts in the United States to reduce the release ofgreenhouse gases will cost too much money andhurt the U.S. economy (%)
20 29 23
The U.S. economy will become more competitivebecause these efforts will result in more efficientenergy use, saving money in the long run (%)
67 67 71
No answer (%) 11 5 7
N 953 753 812
aSurvey conducted by Knowledge Networks using a RDD recruited sample of its nationallyrepresentative panel of citizens provided Web TV access to complete on-line surveys.
policies that encourage industry to increase energy efficiency but opposes in-creased taxes on gasoline or electricity that are intended to alter the behavior ofconsumers. Americans strongly favor increased investment in solar and windenergy but are split on expanding nuclear energy.

Polls Trends: Public Opinion About Global Warming 463
Table 26. (Now I am going to read you some things that might happen if theUnited States was the only country to take actions to prevent the greenhouseeffect. As I read each one please tell me whether or not you think the UnitedStates should single-handedly take the actions to prevent the greenhouse effect,even if that thing happens.) . . . If it increased unemployment in the UnitedStates
Cambridge Gallup HarrisIT
Unemployment Unemployment Inflation Utility bill
12/90a 09/92a,b 10/97c 03/01d 03/01e
Yes, should take 45 42 34 54 47actions (%)
No, should not takeactions (%)
45 50 54 39 49
Depends (vol.) (%) – – 5 – –Don’t know/not sure (%) 9 8 7 7 4
N 1,250 1,250 1,008 1,025 1,025
aSample size is approximate.bWould you, personally, be willing or not willing to have the United States take steps to reduce
global warming if each of the following things happened as a result . . . if unemployment went upa great deal?
c(Would you personally be willing to support tough government actions to help reduce globalwarming even if each of the following things happened as a result or wouldn’t you be willing todo so?) . . . Unemployment increased.
d(Would you personally be willing to support tough government actions to help reduce globalwarming even if each of the following things happened as a result or wouldn’t you be willing todo so?) . . . There was a mild increase in inflation.
eWould you personally be willing to support tough government actions to help reduce globalwarming even if each of the following things happened as a result or wouldn’t you be willing todo so? . . . Your utility bills went up.
A series of poll items taken in 1990, 1992, and 1997 asked respondentswhether the United States should take actions to prevent the greenhouse effecteven if it resulted in increased unemployment. With this economic impact inmind, in 1990 and 1992, 45 percent and 42 percent of respondents favoredtaking action, while in 1997, 34 percent favored action. However, notice thedifferences in question wording. In contrast to 1990 and 1997, respondentsin 1992 are asked not if they would still favor action if it simply “increasedunemployment,” but if “unemployment went up a great deal.” Relative to othereconomic impacts, in 2001, Harris asked whether the public would prefer“tough government actions” even if they resulted in inflation (54 percent sup-ported, 39 percent opposed), or if utility bills went up (47 percent supported,49 percent opposed) (table 26).
A second series of polls by Cambridge queried the public specifically abouttaxing gasoline, oil, and natural gas as an incentive to shift away from the use

464 Nisbet and Myers
Table 27. To help prevent the greenhouse effect, would you favor or opposetaxing oil, coal, and natural gas to provide economic incentives for shiftingaway from the use of fossil fuels?
Cambridge
07/89a 12/90a 09/91a 09/92a,c 09/93a,c 09/94a,c
Favor (%) 47 65 62 56 52 43Oppose (%) 32 28 31 37 40 49Don’t know (%) 22 6 7 7 8 8
N 1,500 1,250 1,250 1,250 1,250 1,250
aSample size is approximate.bInterview method is face-to-face.cTo help prevent global warming, would you favor or oppose taxing oil, coal, and natural gas
that would raise the costs of these fuels, thus providing an incentive to shift away from the use offossil fuels?
Table 28. For each of the following please tell me whether you favor or opposeit as a way for the federal government to try to reduce future global warming?Increased taxes on electricity so that people use less.
ABC 03/06 ABC 03/07
Taxes on Taxes on Taxes on Taxes onelectricity gasolinea electricity gasolinea
Favor (%) 19 32 20 31Oppose (%) 81 67 79 68No opinion (%) ∗ 1 1 1
N 1,002 1,002 1,002 1,002
aIncrease taxes on gasoline so that people either drive less, or buy cars that use less gas.∗Less than .5%.
of fossil fuels. Across the questions asked in 1989, 1990, and 1991, publicsupport for such taxes was measured at 47 percent, 65 percent, and 62 percent,respectively. In the survey items asked over the next three years, 1992 to1994, there was a slight change in question wording. For these years, publicsupport for gasoline, oil, and natural gas taxes was 56 percent, 52 percent,and 43 percent, respectively (table 27). ABC News polls taken in 2006 and2007 provide more recent data relative to support for gas and energy taxes. Asa way for the Federal government to reduce future global warming, only 19percent and 20 percent of Americans across the two years support increasedtaxes on electricity and only 32 percent and 31 percent support increased taxeson gasoline (table 28).

Polls Trends: Public Opinion About Global Warming 465
Other recent surveys have asked about emissions standards for automobilesand industry, mandatory limits on CO2 emissions from industry, and invest-ment in alternative energy sources. In these Gallup polls taken across yearssince 2001, more than 70 percent of Americans have consistently favored set-ting higher auto emission standards and roughly 80 percent have consistentlyfavored higher standards for industry. More than 75 percent of Americans saythey support mandatory limits on CO2 emissions and a similar proportion sup-port spending more government money on solar and wind energy. In 2006 and2007, 55 percent and 50 percent of Americans support expanding the use ofnuclear energy, a slight increase over the 41 percent support registered in 2001(table 29).
Turning to the choice between financial incentives versus government re-quirements as a way to curb emissions and increase energy efficiency, accord-ing to PIPA polls from 2004 and 2005, more than 70 percent of the publicacross these two years favored tax incentives for utilities to sell solar and windpower to consumers, tax credits and rebates for households that upgrade toenergy efficient appliances, tax credits for purchasing a hybrid car, and man-dates requiring manufacturers to produce hybrids as half of all new cars by2010 (table 30). In 2006 and 2007, ABC News asked directly about the choicebetween tax breaks and government requirements. Across both years, specificto increasing the energy efficiency of cars and appliances, the public is roughlysplit in its preference between incentives and mandates. Relative to the energyefficiency of homes and offices, 51 percent support tax breaks compared to33 percent and 30 percent who support government requirements. However,when it comes to lowering greenhouse gas emissions from industry, the publichas a clear preference, with 61 percent and 62 percent across the two yearssupporting government requirements (table 31).
Public Evaluations of the Kyoto Protocol
Besides domestic policy measures to counter global warming, the public hasbeen asked across surveys their views on the longstanding efforts to negotiateinternational agreements on greenhouse gas emissions. As early as 1990, 8out of 10 Americans believed that the United States should take the leadinternationally in preventing the greenhouse effect.5 However, more than10 years later, when asked about U.S. participation in the Kyoto climate agree-ment, given earlier findings relative to low levels of attention and knowledgeabout the treaty, it is not surprising that several surveys show that many citizens
5. In December of 1990, Cambridge asked: “Do you think the United States should take steps toprevent the greenhouse effect, even if other countries in the world do not take such steps?” with80 percent answering “yes,” 14 percent answering “no,” and 5 percent answering “not sure” (N =1,250).

466 Nisbet and Myers
Table 29. Next I am going to read some specific environmental proposals.For each one, please say whether you generally favor or oppose it. How aboutsetting higher auto emission standards for automobiles?
Expanding Developing ControlsAuto Industry nuclear solar and on CO2
emissions emissionsa energyb windc emissionsd
Gallup 03/01 (%)Favor 75 81 41 79Oppose 23 17 55 19No opinion 2 2 5 2
N 1,060 1,060 1,060 1,060Gallup 03/02 (%)
Favor 72 83 45Oppose 26 16 55No opinion 2 1 –
N 1,006 1,006 1,006Gallup 03/03 (%)
Favor 73 80 45 79Oppose 24 19 51 19No opinion 3 1 6 2
N 1,003 1,003 1,003 1,003Gallup 03/06 (%)
Favor 73 77 55 77 77Oppose 25 22 40 21 21No opinion 2 2 5 2 2
N 1,006 1,006 1,006 1,006 1,006Gallup 03/07 (%)
Favor 79 84 50 81 81Oppose 18 15 46 17 17No opinion 3 1 4 2 2
N 1,009 1,009 1,009 1,009 1,009
aHow about setting higher emission standards for business and industry?bExpanding the use of nuclear energy?cHow about imposing mandatory controls on carbon dioxide emissions and other greenhouse
gases?dSpending more government money on developing solar and wind power?
did not hold an opinion on the matter or that results differed across questionwording.
Consider surveys conducted by the Chicago Council on Foreign Relations(CCFR), PIPA, and Gallup between 2002 and 2005. In each of the polls,respondents were asked if they believed the United States should participatein the Kyoto agreement on global warming. In the CCFR survey from 2002,

Polls Trends: Public Opinion About Global Warming 467
Table 30. Here is a list of possible approaches for reducing greenhouse gasemissions that may contribute to climate change. For each one please saywhether you favor or oppose it: Provide tax incentives to utility companies toencourage them to sell environmentally clean energy, such as solar and windpower, to consumers.
Utility tax Individual tax Hybrid Hybrid taxincentives incentivesa by 2010b creditc
PIPAd 06/04Favor (%) 75 80 71 78Oppose (%) 21 17 28 20No answer (%) 3 4 1 2
N 753 753 753 753PIPAd 06/05
Favor (%) 81 81 70 77Oppose (%) 16 16 26 19No answer (%) 3 3 4 4
N 812 812 812 812
aGive cash incentives like tax credits and rebates to individual households that upgrade to moreenergy efficient appliances like refrigerators and air conditioners.
bWould you favor or oppose requiring that by 2010, half of all new cars produced are hybrid-electric or some other type that is very fuel efficient?
cDo you favor or oppose continuing the tax credit for purchasing a hybrid-electric car?dSurvey conducted by Knowledge Networks using a RDD recruited sample of its nationally
representative panel of citizens provided Web TV access to complete on-line surveys.
and the PIPA surveys from 2004 and 2005, 64 percent, 65 percent, and 73percent support participation (table 32). Yet consider two Gallup surveys thatdiffer slightly in question wording, in both polls only 42 percent of Americansanswered that the United States should abide by the treaty, while 36 percentand 35 percent in the two surveys volunteered that they were “unsure” or had“no opinion” (table 33).
Question wording effects are apparent across other surveys asking respon-dents to directly evaluate Bush’s 2001 decision to withdraw from Kyoto. Intwo Gallup questions from April and June of that year, Bush’s rationale that theKyoto treaty would hurt the economy while demanding too little of developingcountries was presented. In these polls, 41 percent and 40 percent said theyapproved of Bush’s decision to withdraw, while 48 percent disapproved. Incontrast, when Pew asked in April 2001 about the decision to withdraw fromKyoto and when Gallup queried respondents in a separate July 2001 surveyusing the same question wording, no rationale was given. In these cases, inthe absence of a specified justification, approval of Bush’s decision rested at25 percent and 32 percent respectively, with disapproval at 47 percent and51 percent (table 34).

468 Nisbet and Myers
Table 31. For the next items, please tell me for each one whether it’s somethingthe government should require by law, encourage with tax breaks but notrequire, or stay out of entirely? Building cars that use less gasoline.
Cars Appliances Homes and Lower releasesuse less use less offices use less from powergasoline electricitya energyb plantsc
ABC 03/06Require (%) 45 42 33 61Encourage (%) 40 41 51 26Stay out (%) 15 17 15 11No opinion (%) 1 1 1 2
N 1,002 1,002 1,002 1,002ABC 03/07
Require (%) 42 36 30 62Encourage (%) 44 43 51 26Stay out (%) 14 19 17 10No opinion (%) ∗ 1 9 9
N 1,002 1,002 1,002 1,002
aBuilding air conditioners, refrigerators, and other appliances that use less electricity.bBuilding new homes and offices that use less energy for heating and cooling.cLowering the amount of greenhouse gases that power plants are allowed to release into the air.∗Less than .5%.
Table 32. Based on what you know, do you think the United States should orshould not participate in the following treaties and agreements? . . . The Kyotoagreement to reduce global warming.
CCFR PIPA
06/02a 07/04b 06/05b
Should participate (%) 64 65 73Should not participate (%) 21 16 16Don’t know/refused (%) 15 18 11
N 3,262∗ 1,195 812
aConsists of 2,862 telephone interviews and 400 in-person face-to-face interviews for a total of3,262 adults.
bSurvey conducted by Knowledge Networks using a RDD recruited sample of its nationallyrepresentative panel of citizens provided Web TV access to complete on-line surveys.
∗Less than .5%.

Polls Trends: Public Opinion About Global Warming 469
Table 33. Next, turning to the agreement on global warming that was drawnup at a world conference in Kyoto, Japan several years ago . . . Based on whatyou have heard or read, do you think the United States should—or should not—agree to abide by the provisions of the Kyoto agreement on global warming?“No opinion” volunteered.
Gallup
03/04 03/05
Should abide (%) 42 42Should not abide (%) 22 23No opinion (%) 36 35
N 1,005 1,004
Table 34. President (George W.) Bush recently announced that the UnitedStates will not adhere to the Kyoto international treaty, which sets voluntarylimits on the production of carbon dioxide and other global warming relatedgases. Bush said that the treaty places too much of an economic burden on theUnited States while demanding little of developing countries. Do you approveor disapprove of Bush’s decision for the United States not to adhere to theKyoto Treaty?
Gallup Pew Gallup
04/01 04/01a 06/01 07/01a
Approve (%) 41 25 40 32Disapprove (%) 48 47 48 51No opinion (%) 11 28 11 17
N 1,025 1,202 998 1,038
aAs you may know, George W. Bush has decided that the United States should withdraw itssupport from the global warming agreement, adopted in Kyoto, Japan in 1997. Do you approve ordisapprove of this decision?
Appendix
DATA SOURCES AND ABBREVIATIONS
Many of the survey questions and results cited in this report were locatedfrom the public opinion online search engine (“Polls and Surveys”) of Lexis-Nexis, the Kaiser Health Poll Archive, and the data archive at Odum Instituteof the University of North Carolina. Keywords such as “climate change,”“global warming,” “greenhouse effect,” “greenhouse gas” or “Kyoto” wereused for the search. Further polls were retrieved from the data archives of“pollingreport.com” or through a Web search. The surveys cited are based

470 Nisbet and Myers
on nationally representative adult samples with sample size of approximately1,000 or more, with exceptions as noted. The questions cited were drawn fromsurveys conducted by the following survey organizations, news organizations,or policy centers:
ABC: ABC NewsAnalysis: Analysis GroupCambridge: Cambridge Reports, Research InternationalCCFR: Chicago Council on Foreign RelationsCBS: CBS NewsGallup: Gallup OrganizationGSS: General Social SurveyHarris: Louis Harris & AssociatesHarrisIT: Harris InteractiveKaiser: Henry J. Kaiser Foundation, Harvard School of Public Health.
Survey conducted by Princeton Survey Research AssociatesLA Times: Los Angeles TimesNBC: NBC NewsNewsweek: Newsweek magazineNSB: National Science Board, Survey of Public Attitudes about Sci-
ence and TechnologyOSU: Krosnick, J.A. & Visser P.S., 1997/1998. American public opin-
ion on global warming. Survey conducted by the Ohio StateUniversity Survey Research Unit
Parents: Parents Magazine. Survey conducted by Kane, Parsons & Asso-ciates
Pew: Pew Research Center. Survey conducted by Princeton SurveyResearch Associates
PIPA: The Program on International Policy Attitudes
References
Carroll, J. 2007, April. Polluted Drinking Water is Public’s Top Environmental Concern. Washing-ton, DC: Gallup News Service.
Carroll, J. 2006, April. Carroll, J. 2007, April. Polluted Drinking Water is Public’s Top Environ-mental Concern. Washington, DC: Gallup News Service.
McCright, A.M., and R.E. Dunlap. 2000. “Challenging global warming as a problem: An analysisof the conservative movement’s counter-claims.” Social Problems 50(3):348–373.
Moser, S., and L. Dilling. 2004. “Making Climate Hot: Communicating the Urgency and Challengeof Global Climate Change.” Environment 46(10):32–46.
Saad, L. 2006. Americans Still Not Concerned About Global Warming. Washington, DC: GallupNews Service.
Shanahan, J., and M.C. Nisbet. 2002. Media Coverage of Climate Change and Global Warming.Report to the NASA Goddard Space Flight Center. Ithaca, NY: Dept. of Communication, CornellUniversity.
Trumbo, C. 1995. “Longitudinal Modeling of Public Issues with the Agenda-Setting Process: TheCase of Global Warming.” Journalism and Communication Monographs 152.