the population registered in spain in the continuous ... · the population registered in spain in...
TRANSCRIPT
21 April 2020
Preview of the Continuous Register Statistics January 1st, 2019 - Provisional data (1/16)
Preview of the Continuous Register Statistics January 1st, 2019 Provisional data
The population registered in Spain in the Continuous Register increases by 405,048 people during 2019, standing at 47.4 million
Of the total population, 88.6% have Spanish nationality and 11.4% have foreign nationality
The total number of people registered in the Continuous Register1 in Spain as at 01 January 2020 was 47,431,256 inhabitants, according to the Preview of the Continuous Register Statistics. This figure represents an increase of 405,048 people (0.9%) as compared with the data as at 01 January 20192.
Of this total, 42,008,058 had Spanish nationality (88.6%) and 5,423,198 had foreign nationality (11.4%).
The figures published today are a provisional preview. The final figures, once the procedure to obtain them has been put into place (suspended while the high alert period continues), and following the favourable report from the Registration Council, will be presented to the Government of the Nation as soon as possible for approval by Royal Decree, which will be published in the Official State Gazette.
During 2019, the net number of Spaniards has increased by 18,728 people (0.04%) and the number of foreigners has increased by 386,320 (7.7%). Among the latter, those belonging to the European Union (EU-28) increased by 43,031 (2.3%) and those non-EU nationals grew by 343,289 persons (10.7%).
This is the fourth consecutive year in which the total population of Spain increased. By nationality, it should be noted that for the first time, the number of Spaniards reached 42 million. As for foreigners, their number grew for the third consecutive year, with the increase seen in 2019 being greater than that of previous years.
1 In this press release, the reference to the population and the registered population should always be understood as the population obtained from the Continuous Register, which is the coordination file of the municipal registers managed by the INE, and after applying the counting criteria established in the regulated procedure for obtaining the proposal of official population figures. The population refers to those persons who reside in Spain, that is to say, it does not include Spaniards resident abroad for whom the INE has a differentiated statistic, known as the Statistics on the Register of Spaniards Resident Abroad. 2 The variations produced with respect to the Continuous Register Statistics as at 01 January 2019 are due to different causes that are detailed in the Explanatory Note at the end of this press release.
Preview of the Continuous Register Statistics January 1st, 2019 - Provisional data (2/16)
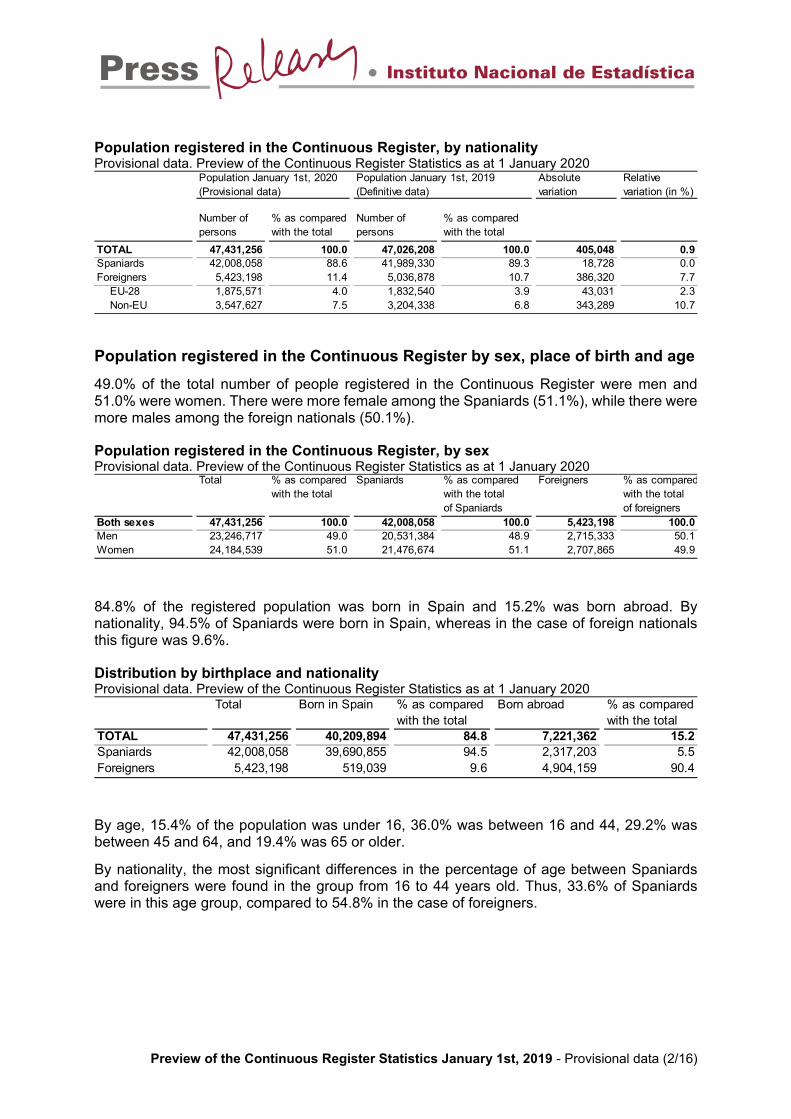
Population registered in the Continuous Register, by nationality Provisional data. Preview of the Continuous Register Statistics as at 1 January 2020
Population registered in the Continuous Register by sex, place of birth and age
49.0% of the total number of people registered in the Continuous Register were men and 51.0% were women. There were more female among the Spaniards (51.1%), while there were more males among the foreign nationals (50.1%).
Population registered in the Continuous Register, by sex Provisional data. Preview of the Continuous Register Statistics as at 1 January 2020
84.8% of the registered population was born in Spain and 15.2% was born abroad. By nationality, 94.5% of Spaniards were born in Spain, whereas in the case of foreign nationals this figure was 9.6%.
Distribution by birthplace and nationality Provisional data. Preview of the Continuous Register Statistics as at 1 January 2020
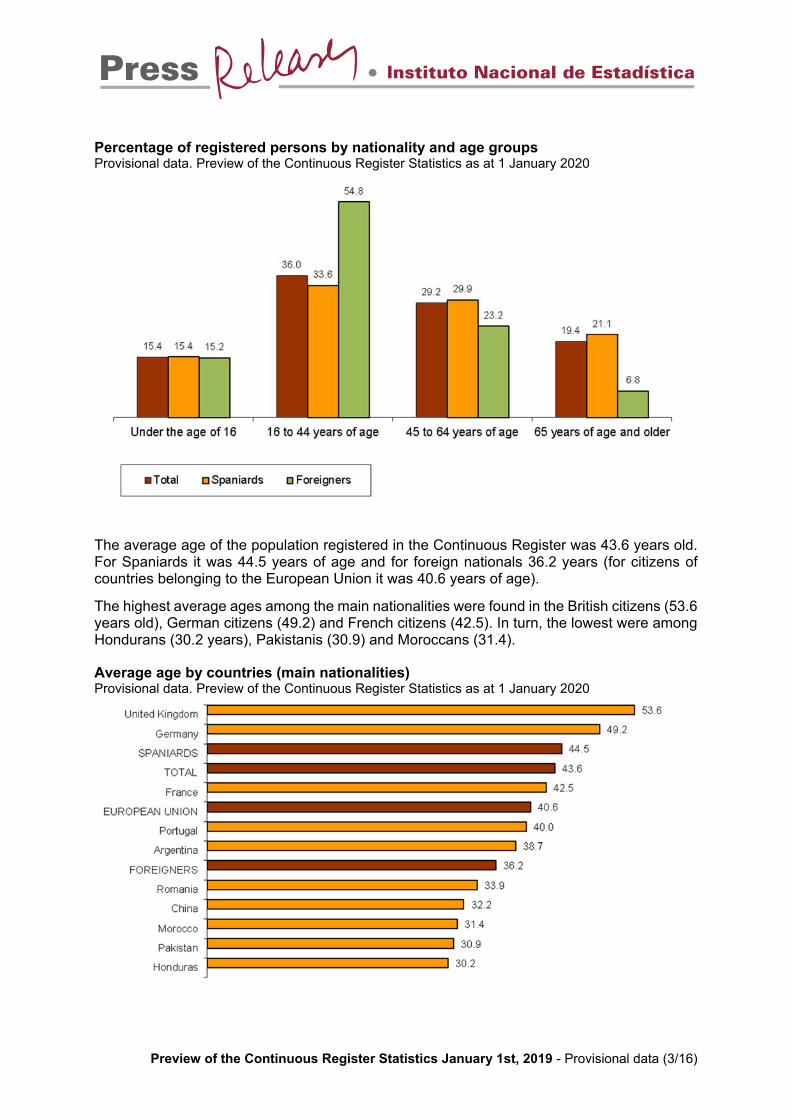
By age, 15.4% of the population was under 16, 36.0% was between 16 and 44, 29.2% was between 45 and 64, and 19.4% was 65 or older.
By nationality, the most significant differences in the percentage of age between Spaniards and foreigners were found in the group from 16 to 44 years old. Thus, 33.6% of Spaniards were in this age group, compared to 54.8% in the case of foreigners.
Absolute variation
Relative variation (in %)
Number of persons
% as compared with the total
Number of persons
% as compared with the total
TOTAL 47,431,256 100.0 47,026,208 100.0 405,048 0.9Spaniards 42,008,058 88.6 41,989,330 89.3 18,728 0.0Foreigners 5,423,198 11.4 5,036,878 10.7 386,320 7.7 EU-28 1,875,571 4.0 1,832,540 3.9 43,031 2.3 Non-EU 3,547,627 7.5 3,204,338 6.8 343,289 10.7
Population January 1st, 2020 (Provisional data)
Population January 1st, 2019 (Definitive data)
Total % as compared Spaniards % as compared Foreigners % as comparedwith the total with the total with the total
of Spaniards of foreignersBoth sexes 47,431,256 100.0 42,008,058 100.0 5,423,198 100.0Men 23,246,717 49.0 20,531,384 48.9 2,715,333 50.1Women 24,184,539 51.0 21,476,674 51.1 2,707,865 49.9
Total Born in Spain % as compared Born abroad % as comparedwith the total with the total
TOTAL 47,431,256 40,209,894 84.8 7,221,362 15.2Spaniards 42,008,058 39,690,855 94.5 2,317,203 5.5Foreigners 5,423,198 519,039 9.6 4,904,159 90.4
Preview of the Continuous Register Statistics January 1st, 2019 - Provisional data (3/16)
Percentage of registered persons by nationality and age groups Provisional data. Preview of the Continuous Register Statistics as at 1 January 2020
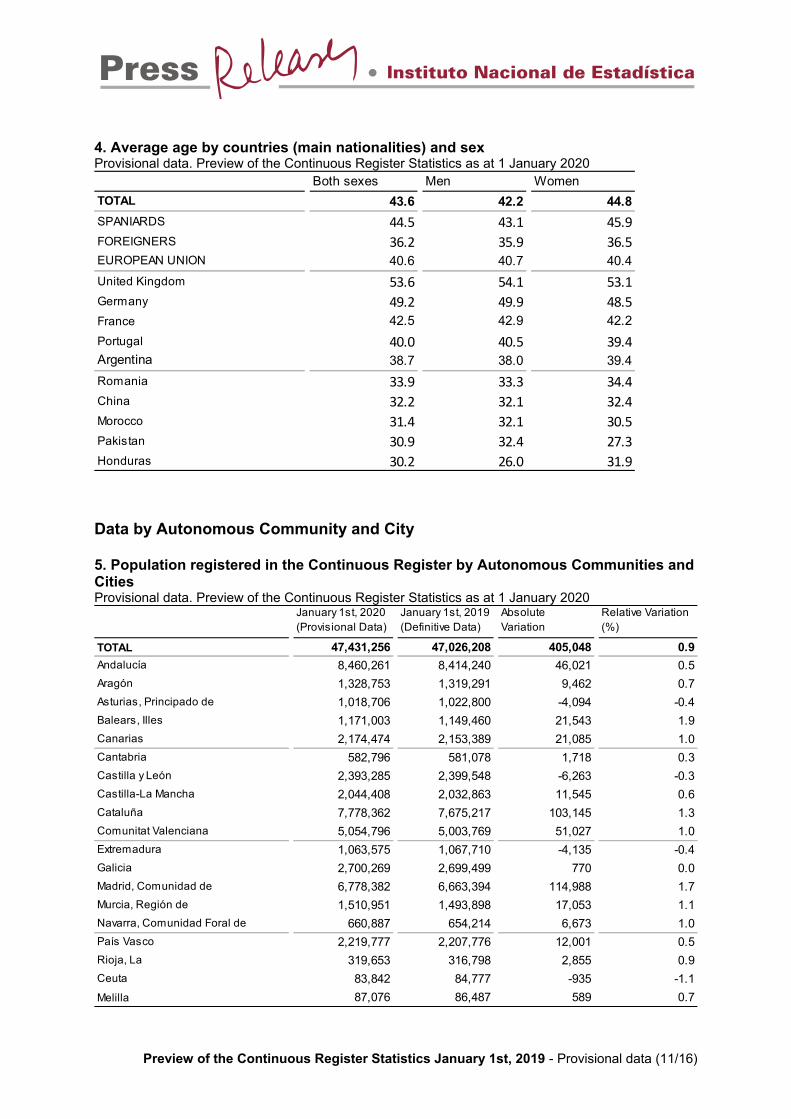
The average age of the population registered in the Continuous Register was 43.6 years old. For Spaniards it was 44.5 years of age and for foreign nationals 36.2 years (for citizens of countries belonging to the European Union it was 40.6 years of age).
The highest average ages among the main nationalities were found in the British citizens (53.6 years old), German citizens (49.2) and French citizens (42.5). In turn, the lowest were among Hondurans (30.2 years), Pakistanis (30.9) and Moroccans (31.4).
Average age by countries (main nationalities) Provisional data. Preview of the Continuous Register Statistics as at 1 January 2020

Preview of the Continuous Register Statistics January 1st, 2019 - Provisional data (4/16)
Data by Autonomous Communities and Cities
The most populated Autonomous Communities as of January 1, 2020 were Andalucía, Cataluña and Comunidad de Madrid.
In turn, those with the lowest population were La Rioja, Cantabria and Comunidad Foral de Navarra.
Registered population by Autonomous Communities and Cities (Thousands) Provisional data. Preview of the Continuous Register Statistics as at 1 January 2020
In the past year, the registered population has increased in all autonomous communities, except for three.
Comunidad de Madrid (114,988 more people), Cataluña (103,145 more) and Comunitat Valenciana (51,027 more) experienced the greatest population increases in absolute terms between 01 January 2019 and 01 January 2020.
In turn, decreases were recorded in Castilla y León (6,263 fewer people), Extremadura (4,135 fewer) and Principado de Asturias (4,094 fewer).
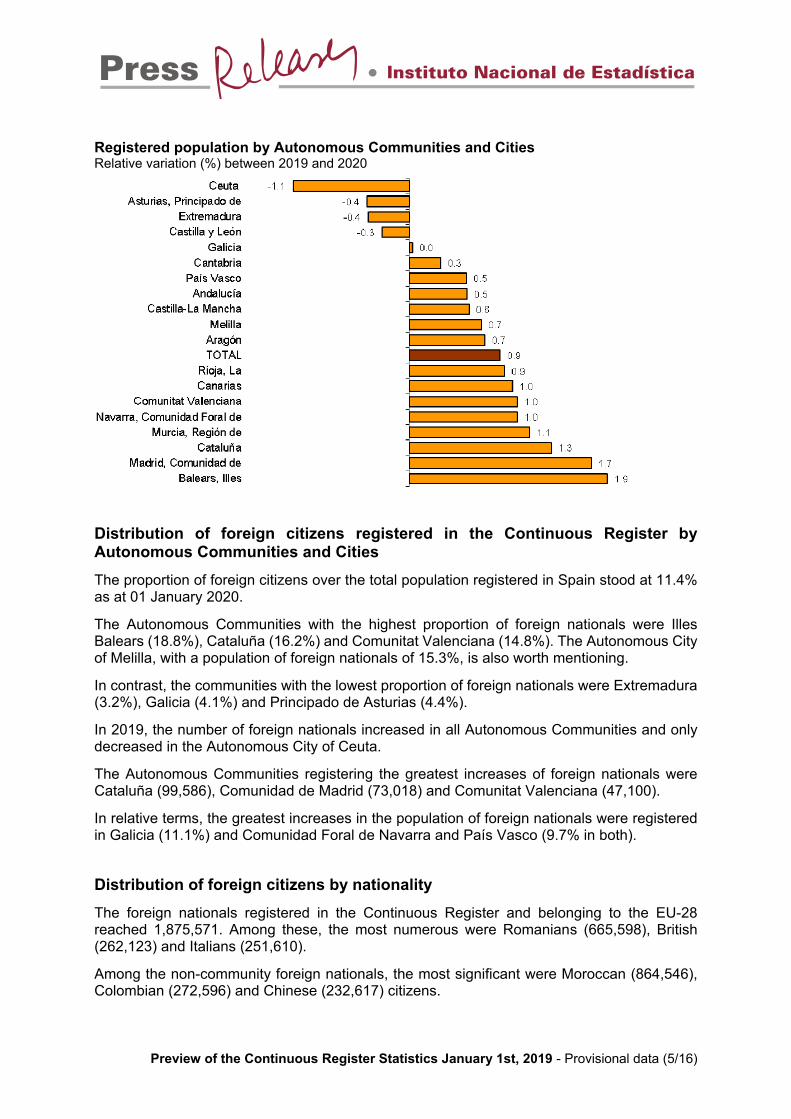
In relative terms, the largest population increases were recorded in Illes Balears (1.9%), Comunidad de Madrid (1.7%) and Cataluña (1.3%). In contrast, Principado de Asturias and Extremadura (both with –0.4%) and Castilla y León (–0.3%) showed decreases, along with the autonomous city of Ceuta (–1.1%).
Preview of the Continuous Register Statistics January 1st, 2019 - Provisional data (5/16)
Registered population by Autonomous Communities and Cities Relative variation (%) between 2019 and 2020
Distribution of foreign citizens registered in the Continuous Register by Autonomous Communities and Cities
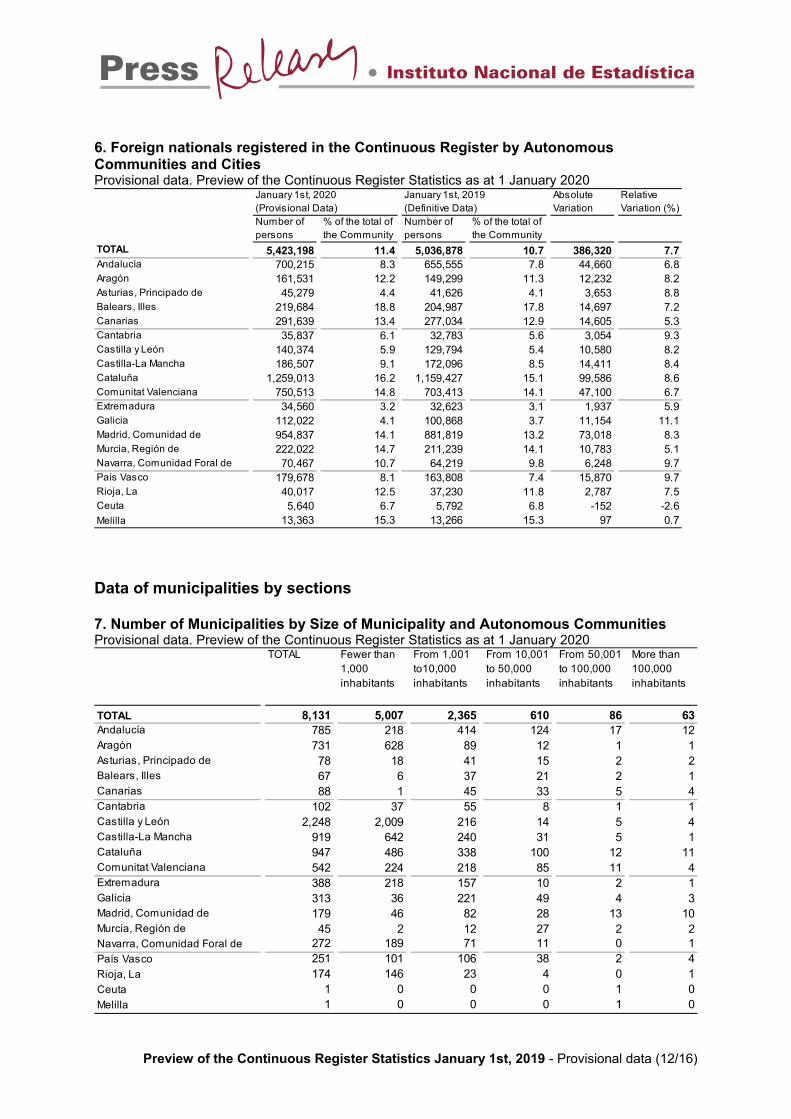
The proportion of foreign citizens over the total population registered in Spain stood at 11.4% as at 01 January 2020.
The Autonomous Communities with the highest proportion of foreign nationals were Illes Balears (18.8%), Cataluña (16.2%) and Comunitat Valenciana (14.8%). The Autonomous City of Melilla, with a population of foreign nationals of 15.3%, is also worth mentioning.
In contrast, the communities with the lowest proportion of foreign nationals were Extremadura (3.2%), Galicia (4.1%) and Principado de Asturias (4.4%).
In 2019, the number of foreign nationals increased in all Autonomous Communities and only decreased in the Autonomous City of Ceuta.
The Autonomous Communities registering the greatest increases of foreign nationals were Cataluña (99,586), Comunidad de Madrid (73,018) and Comunitat Valenciana (47,100).
In relative terms, the greatest increases in the population of foreign nationals were registered in Galicia (11.1%) and Comunidad Foral de Navarra and País Vasco (9.7% in both).
Distribution of foreign citizens by nationality
The foreign nationals registered in the Continuous Register and belonging to the EU-28 reached 1,875,571. Among these, the most numerous were Romanians (665,598), British (262,123) and Italians (251,610).
Among the non-community foreign nationals, the most significant were Moroccan (864,546), Colombian (272,596) and Chinese (232,617) citizens.

Preview of the Continuous Register Statistics January 1st, 2019 - Provisional data (6/16)
Foreign nationals registered by country (main nationalities) Provisional data. Preview of the Continuous Register Statistics as at 1 January 2020
Among the main nationalities, the largest increases during 2019 were recorded among citizens from Colombia (65,877 more), and Morocco and Venezuela (50,959 in both).
The largest decreases were among those from Romania (-6,387), Bolivia (-3,217) and Ecuador (-1,019).
In relative terms, and among the nationalities with the highest number of foreigners, the greatest population increases were registered among the citizens of Venezuela (37.0%), Colombia (31.9%) and Peru (26.6%).
In turn, Bolivia (-3.4%), Romania (-1.0%) and Ecuador (-0.8%) showed the greatest decreases.
Foreign nationals registered by country (main nationalities) Provisional data. Preview of the Continuous Register Statistics as at 1 January 2020
Absolute Variation
Relative Variation
Number of persons
% of the total of foreigners
Number of persons
% of the total of foreigners
(in %)
TOTAL 5,423,198 100.0 5,036,878 100.0 386,320 7.7Morocco 864,546 15.9 813,587 16.2 50,959 6.3
Rumania 665,598 12.3 671,985 13.3 -6,387 -1.0
Colombia 272,596 5.0 206,719 4.1 65,877 31.9
United Kingdom 262,123 4.8 250,392 5.0 11,731 4.7
Italy 251,610 4.6 228,283 4.5 23,327 10.2
China 232,617 4.3 224,559 4.5 8,058 3.6
Venezuela 188,735 3.5 137,776 2.7 50,959 37.0
Ecuador 130,795 2.4 131,814 2.6 -1,019 -0.8
Bulgaria 122,003 2.2 122,813 2.4 -810 -0.7
Honduras 121,695 2.2 96,382 1.9 25,313 26.3
Ukraine 115,023 2.1 111,726 2.2 3,297 3.0
Germany 111,625 2.1 111,911 2.2 -286 -0.3
France 107,913 2.0 103,517 2.1 4,396 4.2
Peru 106,588 2.0 84,179 1.7 22,409 26.6
Brazil 98,480 1.8 90,304 1.8 8,176 9.1
Pakistan 97,599 1.8 88,935 1.8 8,664 9.7
Portugal 97,044 1.8 93,440 1.9 3,604 3.9
Bolivia 92,500 1.7 95,717 1.9 -3,217 -3.4
Argentina 88,894 1.6 77,649 1.5 11,245 14.5
Paraguay 86,895 1.6 80,218 1.6 6,677 8.3
Foreign population January 1st, 2020 (Provisional Data)
Foreign population January 1st, 2019 (Definitive Data)
Preview of the Continuous Register Statistics January 1st, 2019 - Provisional data (7/16)
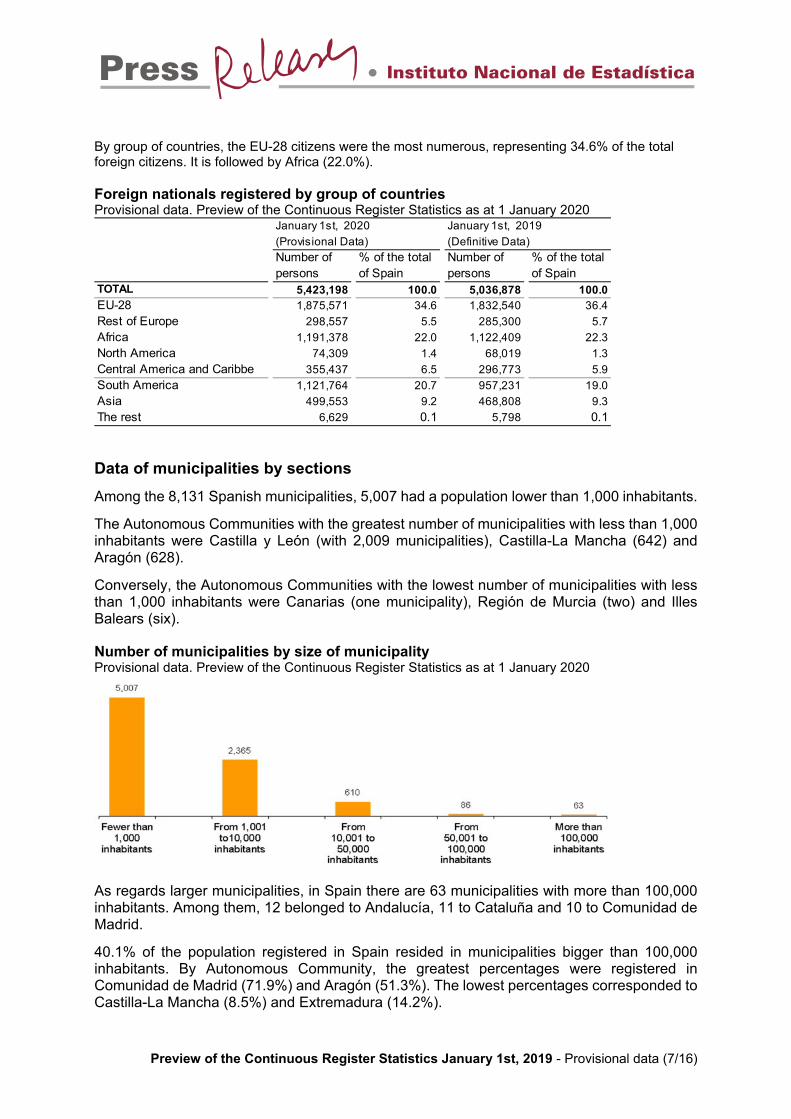
By group of countries, the EU-28 citizens were the most numerous, representing 34.6% of the total foreign citizens. It is followed by Africa (22.0%).
Foreign nationals registered by group of countries Provisional data. Preview of the Continuous Register Statistics as at 1 January 2020
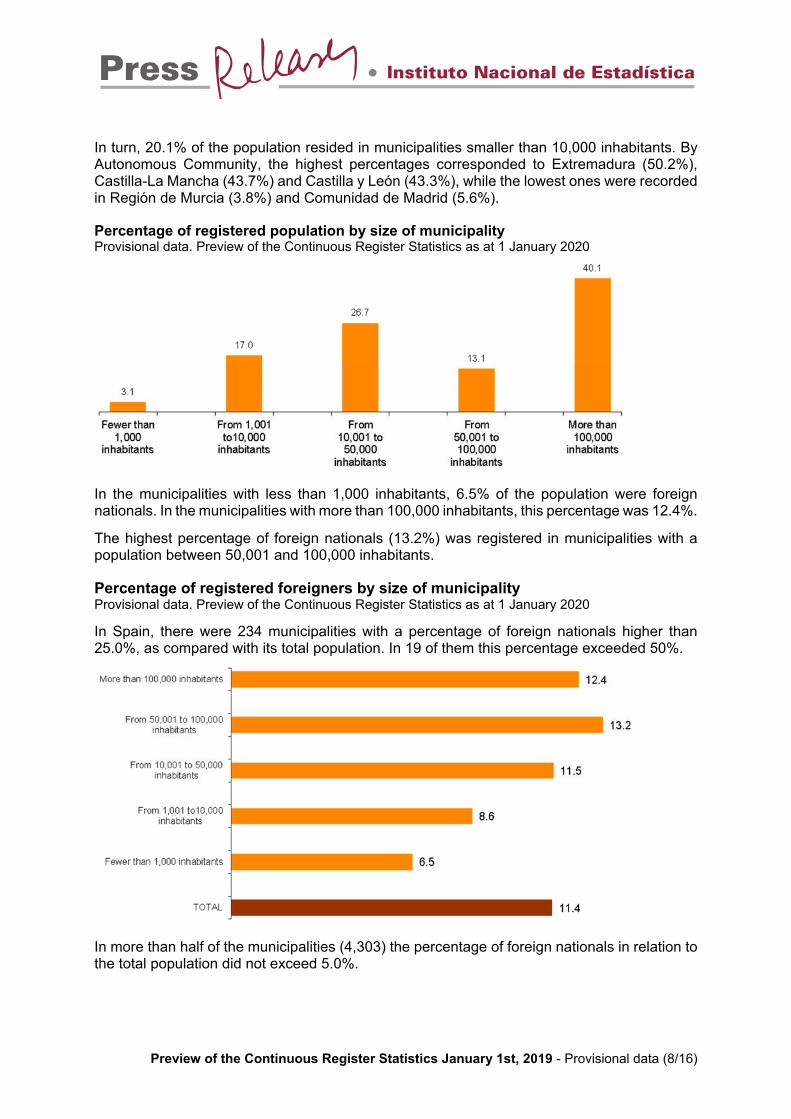
Data of municipalities by sections
Among the 8,131 Spanish municipalities, 5,007 had a population lower than 1,000 inhabitants.
The Autonomous Communities with the greatest number of municipalities with less than 1,000 inhabitants were Castilla y León (with 2,009 municipalities), Castilla-La Mancha (642) and Aragón (628).
Conversely, the Autonomous Communities with the lowest number of municipalities with less than 1,000 inhabitants were Canarias (one municipality), Región de Murcia (two) and Illes Balears (six).
Number of municipalities by size of municipality Provisional data. Preview of the Continuous Register Statistics as at 1 January 2020
As regards larger municipalities, in Spain there are 63 municipalities with more than 100,000 inhabitants. Among them, 12 belonged to Andalucía, 11 to Cataluña and 10 to Comunidad de Madrid.
40.1% of the population registered in Spain resided in municipalities bigger than 100,000 inhabitants. By Autonomous Community, the greatest percentages were registered in Comunidad de Madrid (71.9%) and Aragón (51.3%). The lowest percentages corresponded to Castilla-La Mancha (8.5%) and Extremadura (14.2%).
January 1st, 2020 January 1st, 2019
(Provisional Data) (Definitive Data)
TOTAL 5,423,198 100.0 5,036,878 100.0EU-28 1,875,571 34.6 1,832,540 36.4
Rest of Europe 298,557 5.5 285,300 5.7
Africa 1,191,378 22.0 1,122,409 22.3
North America 74,309 1.4 68,019 1.3
Central America and Caribbe 355,437 6.5 296,773 5.9
South America 1,121,764 20.7 957,231 19.0
Asia 499,553 9.2 468,808 9.3
The rest 6,629 0.1 5,798 0.1
Number of persons
% of the total of Spain
Number of persons
% of the total of Spain
Preview of the Continuous Register Statistics January 1st, 2019 - Provisional data (8/16)
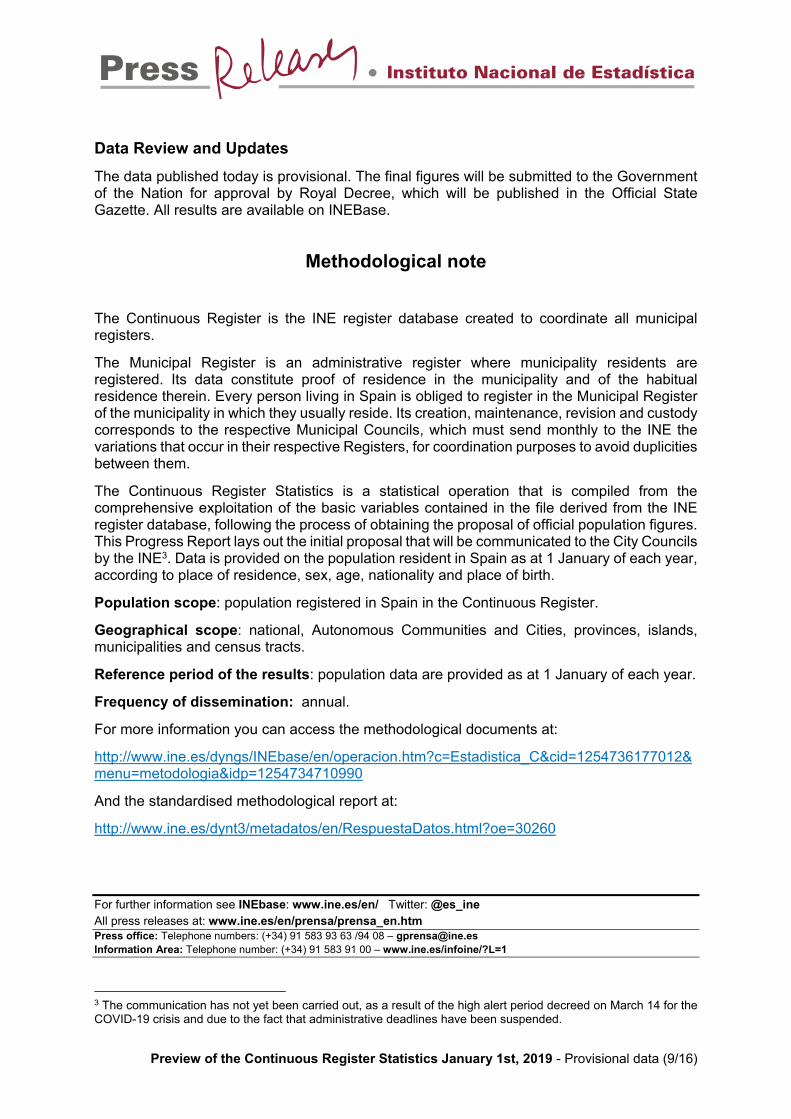
In turn, 20.1% of the population resided in municipalities smaller than 10,000 inhabitants. By Autonomous Community, the highest percentages corresponded to Extremadura (50.2%), Castilla-La Mancha (43.7%) and Castilla y León (43.3%), while the lowest ones were recorded in Región de Murcia (3.8%) and Comunidad de Madrid (5.6%).
Percentage of registered population by size of municipality Provisional data. Preview of the Continuous Register Statistics as at 1 January 2020
In the municipalities with less than 1,000 inhabitants, 6.5% of the population were foreign nationals. In the municipalities with more than 100,000 inhabitants, this percentage was 12.4%.
The highest percentage of foreign nationals (13.2%) was registered in municipalities with a population between 50,001 and 100,000 inhabitants.
Percentage of registered foreigners by size of municipality Provisional data. Preview of the Continuous Register Statistics as at 1 January 2020
In Spain, there were 234 municipalities with a percentage of foreign nationals higher than 25.0%, as compared with its total population. In 19 of them this percentage exceeded 50%.
In more than half of the municipalities (4,303) the percentage of foreign nationals in relation to the total population did not exceed 5.0%.
Preview of the Continuous Register Statistics January 1st, 2019 - Provisional data (9/16)
Data Review and Updates
The data published today is provisional. The final figures will be submitted to the Government of the Nation for approval by Royal Decree, which will be published in the Official State Gazette. All results are available on INEBase.
Methodological note
The Continuous Register is the INE register database created to coordinate all municipal registers.
The Municipal Register is an administrative register where municipality residents are registered. Its data constitute proof of residence in the municipality and of the habitual residence therein. Every person living in Spain is obliged to register in the Municipal Register of the municipality in which they usually reside. Its creation, maintenance, revision and custody corresponds to the respective Municipal Councils, which must send monthly to the INE the variations that occur in their respective Registers, for coordination purposes to avoid duplicities between them.
The Continuous Register Statistics is a statistical operation that is compiled from the comprehensive exploitation of the basic variables contained in the file derived from the INE register database, following the process of obtaining the proposal of official population figures. This Progress Report lays out the initial proposal that will be communicated to the City Councils by the INE3. Data is provided on the population resident in Spain as at 1 January of each year, according to place of residence, sex, age, nationality and place of birth.
Population scope: population registered in Spain in the Continuous Register.
Geographical scope: national, Autonomous Communities and Cities, provinces, islands, municipalities and census tracts.
Reference period of the results: population data are provided as at 1 January of each year.
Frequency of dissemination: annual.
For more information you can access the methodological documents at:
http://www.ine.es/dyngs/INEbase/en/operacion.htm?c=Estadistica_C&cid=1254736177012&menu=metodologia&idp=1254734710990
And the standardised methodological report at:
http://www.ine.es/dynt3/metadatos/en/RespuestaDatos.html?oe=30260
For further information see INEbase: www.ine.es/en/ Twitter: @es_ine All press releases at: www.ine.es/en/prensa/prensa_en.htm Press office: Telephone numbers: (+34) 91 583 93 63 /94 08 – [email protected] Information Area: Telephone number: (+34) 91 583 91 00 – www.ine.es/infoine/?L=1
3 The communication has not yet been carried out, as a result of the high alert period decreed on March 14 for the COVID-19 crisis and due to the fact that administrative deadlines have been suspended.
Preview of the Continuous Register Statistics January 1st, 2019 - Provisional data (10/16)
Annex. Tables
National Data
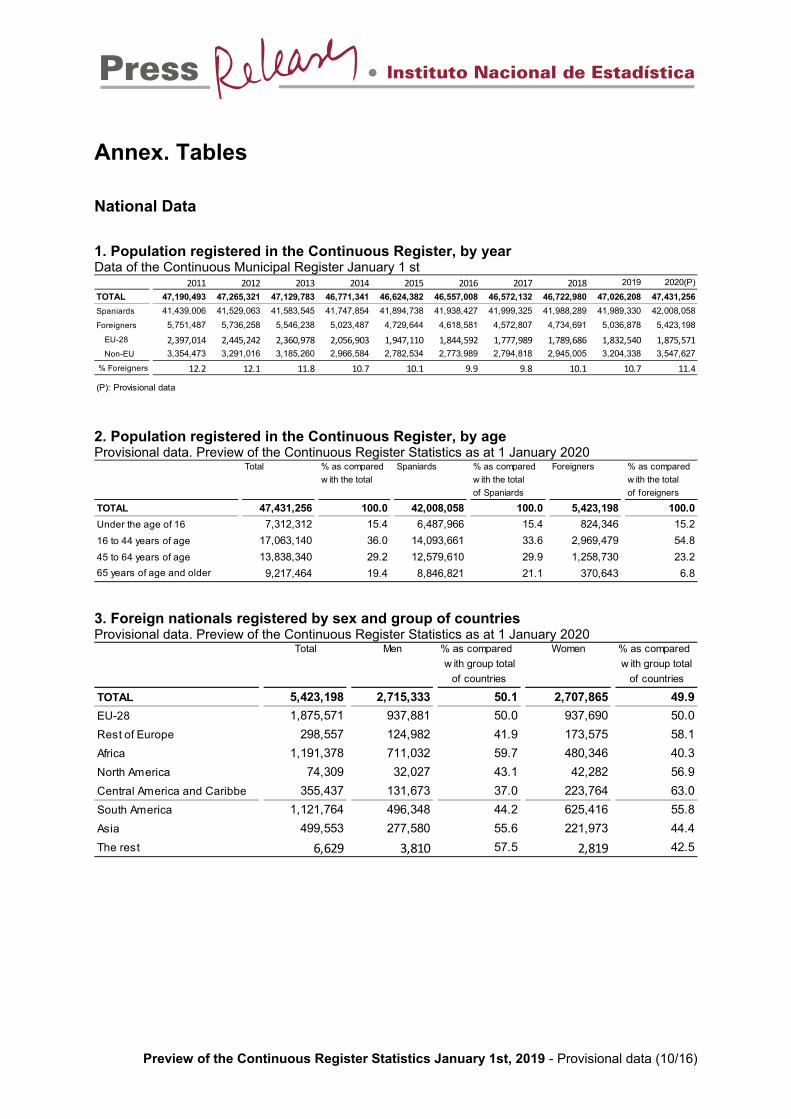
1. Population registered in the Continuous Register, by year Data of the Continuous Municipal Register January 1 st
2. Population registered in the Continuous Register, by age Provisional data. Preview of the Continuous Register Statistics as at 1 January 2020
3. Foreign nationals registered by sex and group of countries Provisional data. Preview of the Continuous Register Statistics as at 1 January 2020
2011 2012 2013 2014 2015 2016 2017 2018 2019 2020(P)
TOTAL 47,190,493 47,265,321 47,129,783 46,771,341 46,624,382 46,557,008 46,572,132 46,722,980 47,026,208 47,431,256
Spaniards 41,439,006 41,529,063 41,583,545 41,747,854 41,894,738 41,938,427 41,999,325 41,988,289 41,989,330 42,008,058
Foreigners 5,751,487 5,736,258 5,546,238 5,023,487 4,729,644 4,618,581 4,572,807 4,734,691 5,036,878 5,423,198
EU-28 2,397,014 2,445,242 2,360,978 2,056,903 1,947,110 1,844,592 1,777,989 1,789,686 1,832,540 1,875,571
Non-EU 3,354,473 3,291,016 3,185,260 2,966,584 2,782,534 2,773,989 2,794,818 2,945,005 3,204,338 3,547,627
% Foreigners 12.2 12.1 11.8 10.7 10.1 9.9 9.8 10.1 10.7 11.4
(P): Provisional data
Total % as compared Spaniards % as compared Foreigners % as compared
w ith the total w ith the total w ith the total
of Spaniards of foreigners
TOTAL 47,431,256 100.0 42,008,058 100.0 5,423,198 100.0
Under the age of 16 7,312,312 15.4 6,487,966 15.4 824,346 15.2
16 to 44 years of age 17,063,140 36.0 14,093,661 33.6 2,969,479 54.8
45 to 64 years of age 13,838,340 29.2 12,579,610 29.9 1,258,730 23.2
65 years of age and older 9,217,464 19.4 8,846,821 21.1 370,643 6.8
Total Men % as compared Women % as compared
w ith group total w ith group total
of countries of countries
TOTAL 5,423,198 2,715,333 50.1 2,707,865 49.9
EU-28 1,875,571 937,881 50.0 937,690 50.0
Rest of Europe 298,557 124,982 41.9 173,575 58.1
Africa 1,191,378 711,032 59.7 480,346 40.3
North America 74,309 32,027 43.1 42,282 56.9
Central America and Caribbe 355,437 131,673 37.0 223,764 63.0
South America 1,121,764 496,348 44.2 625,416 55.8
Asia 499,553 277,580 55.6 221,973 44.4
The rest 6,629 3,810 57.5 2,819 42.5
Preview of the Continuous Register Statistics January 1st, 2019 - Provisional data (11/16)
4. Average age by countries (main nationalities) and sex Provisional data. Preview of the Continuous Register Statistics as at 1 January 2020
Data by Autonomous Community and City 5. Population registered in the Continuous Register by Autonomous Communities and Cities Provisional data. Preview of the Continuous Register Statistics as at 1 January 2020
Both sexes Men Women
TOTAL 43.6 42.2 44.8
SPANIARDS 44.5 43.1 45.9FOREIGNERS 36.2 35.9 36.5EUROPEAN UNION 40.6 40.7 40.4
United Kingdom 53.6 54.1 53.1Germany 49.2 49.9 48.5France 42.5 42.9 42.2
Portugal 40.0 40.5 39.4Argentina 38.7 38.0 39.4
Romania 33.9 33.3 34.4China 32.2 32.1 32.4Morocco 31.4 32.1 30.5Pakistan 30.9 32.4 27.3Honduras 30.2 26.0 31.9
January 1st, 2020 (Provisional Data)
January 1st, 2019 (Definitive Data)
Absolute Variation
Relative Variation (%)
TOTAL 47,431,256 47,026,208 405,048 0.9
Andalucía 8,460,261 8,414,240 46,021 0.5
Aragón 1,328,753 1,319,291 9,462 0.7
Asturias, Principado de 1,018,706 1,022,800 -4,094 -0.4
Balears, Illes 1,171,003 1,149,460 21,543 1.9
Canarias 2,174,474 2,153,389 21,085 1.0
Cantabria 582,796 581,078 1,718 0.3
Castilla y León 2,393,285 2,399,548 -6,263 -0.3
Castilla-La Mancha 2,044,408 2,032,863 11,545 0.6
Cataluña 7,778,362 7,675,217 103,145 1.3
Comunitat Valenciana 5,054,796 5,003,769 51,027 1.0
Extremadura 1,063,575 1,067,710 -4,135 -0.4
Galicia 2,700,269 2,699,499 770 0.0
Madrid, Comunidad de 6,778,382 6,663,394 114,988 1.7
Murcia, Región de 1,510,951 1,493,898 17,053 1.1
Navarra, Comunidad Foral de 660,887 654,214 6,673 1.0
País Vasco 2,219,777 2,207,776 12,001 0.5
Rioja, La 319,653 316,798 2,855 0.9
Ceuta 83,842 84,777 -935 -1.1
Melilla 87,076 86,487 589 0.7
Preview of the Continuous Register Statistics January 1st, 2019 - Provisional data (12/16)
6. Foreign nationals registered in the Continuous Register by Autonomous Communities and Cities Provisional data. Preview of the Continuous Register Statistics as at 1 January 2020
Data of municipalities by sections 7. Number of Municipalities by Size of Municipality and Autonomous Communities Provisional data. Preview of the Continuous Register Statistics as at 1 January 2020
TOTAL Fewer than 1,000 inhabitants
From 1,001 to10,000 inhabitants
From 10,001 to 50,000 inhabitants
From 50,001 to 100,000 inhabitants
More than 100,000 inhabitants
TOTAL 8,131 5,007 2,365 610 86 63Andalucía 785 218 414 124 17 12Aragón 731 628 89 12 1 1Asturias, Principado de 78 18 41 15 2 2Balears, Illes 67 6 37 21 2 1Canarias 88 1 45 33 5 4Cantabria 102 37 55 8 1 1Castilla y León 2,248 2,009 216 14 5 4Castilla-La Mancha 919 642 240 31 5 1Cataluña 947 486 338 100 12 11Comunitat Valenciana 542 224 218 85 11 4Extremadura 388 218 157 10 2 1Galicia 313 36 221 49 4 3Madrid, Comunidad de 179 46 82 28 13 10Murcia, Región de 45 2 12 27 2 2Navarra, Comunidad Foral de 272 189 71 11 0 1País Vasco 251 101 106 38 2 4Rioja, La 174 146 23 4 0 1Ceuta 1 0 0 0 1 0Melilla 1 0 0 0 1 0
Absolute Variation
Relative Variation (%)
Number of persons
% of the total of the Community
Number of persons
% of the total of the Community
TOTAL 5,423,198 11.4 5,036,878 10.7 386,320 7.7Andalucía 700,215 8.3 655,555 7.8 44,660 6.8Aragón 161,531 12.2 149,299 11.3 12,232 8.2Asturias, Principado de 45,279 4.4 41,626 4.1 3,653 8.8Balears, Illes 219,684 18.8 204,987 17.8 14,697 7.2Canarias 291,639 13.4 277,034 12.9 14,605 5.3Cantabria 35,837 6.1 32,783 5.6 3,054 9.3Castilla y León 140,374 5.9 129,794 5.4 10,580 8.2Castilla-La Mancha 186,507 9.1 172,096 8.5 14,411 8.4Cataluña 1,259,013 16.2 1,159,427 15.1 99,586 8.6Comunitat Valenciana 750,513 14.8 703,413 14.1 47,100 6.7Extremadura 34,560 3.2 32,623 3.1 1,937 5.9Galicia 112,022 4.1 100,868 3.7 11,154 11.1Madrid, Comunidad de 954,837 14.1 881,819 13.2 73,018 8.3Murcia, Región de 222,022 14.7 211,239 14.1 10,783 5.1Navarra, Comunidad Foral de 70,467 10.7 64,219 9.8 6,248 9.7País Vasco 179,678 8.1 163,808 7.4 15,870 9.7Rioja, La 40,017 12.5 37,230 11.8 2,787 7.5Ceuta 5,640 6.7 5,792 6.8 -152 -2.6Melilla 13,363 15.3 13,266 15.3 97 0.7
January 1st, 2020 (Provisional Data)
January 1st, 2019 (Definitive Data)

Preview of the Continuous Register Statistics January 1st, 2019 - Provisional data (13/16)
8. Percentage of Population registered by Size of municipality and Autonomous Community Provisional data. Preview of the Continuous Register Statistics as at 1 January 2020
9. Percentage of Foreign Nationals registered by Size of municipality and Autonomous Community Provisional data. Preview of the Continuous Register Statistics as at 1 January 2020
TOTAL Fewer than 1,000 inhabitants
From 1,001 to10,000 inhabitants
From 10,001 to 50,000 inhabitants
From 50,001 to 100,000 inhabitants
More than 100,000 inhabitants
TOTAL 100 3.1 17.0 26.7 13.1 40.1Andalucía 100 1.3 17.9 29.8 15.2 35.7Aragón 100 11.0 18.2 15.5 4.1 51.3Asturias, Principado de 100 0.9 13.6 24.6 12.7 48.3Balears, Illes 100 0.3 14.3 40.5 8.8 36.1Canarias 100 0.0 10.0 35.9 15.0 39.1Cantabria 100 3.4 31.9 26.1 8.9 29.8Castilla y León 100 18.3 25.0 12.5 13.1 31.1Castilla-La Mancha 100 7.8 36.0 28.8 18.9 8.5Cataluña 100 2.5 15.7 27.9 11.1 42.9Comunitat Valenciana 100 1.7 15.6 37.2 14.9 30.6Extremadura 100 9.8 40.4 21.0 14.6 14.2Galicia 100 1.0 28.2 34.0 12.8 24.1Madrid, Comunidad de 100 0.3 5.3 8.7 13.9 71.9Murcia, Región de 100 0.1 3.7 40.4 11.2 44.7Navarra, Comunidad Foral de 100 8.3 33.5 27.4 .. 30.9País Vasco 100 2.1 16.6 34.7 6.3 40.3Rioja, La 100 8.8 24.1 19.4 .. 47.7Ceuta 100 .. .. .. 100.0 ..Melilla 100 .. .. .. 100.0 ..
TOTAL Fewer than 1,000 inhabitants
From 1,001 to10,000 inhabitants
From 10,001 to 50,000 inhabitants
From 50,001 to 100,000 inhabitants
More than 100,000 inhabitants
TOTAL 11.4 6.5 8.6 11.5 13.2 12.4Andalucía 8.3 7.3 6.6 7.5 14.8 7.0Aragón 12.2 8.9 14.3 13.6 10.9 11.8Asturias, Principado de 4.4 2.1 3.5 2.7 3.6 5.9Balears, Illes 18.8 21.0 15.4 19.3 29.2 16.9Canarias 13.4 22.4 8.8 17.2 25.2 6.6Cantabria 6.1 2.9 4.1 5.8 7.2 8.7Castilla y León 5.9 4.3 6.3 6.5 6.1 6.1Castilla-La Mancha 9.1 7.1 9.4 10.3 9.3 5.6Cataluña 16.2 9.5 11.3 15.4 13.2 19.6Comunitat Valenciana 14.8 11.5 13.9 14.7 18.5 13.9Extremadura 3.2 1.9 2.8 4.7 3.0 3.6Galicia 4.1 2.9 2.9 3.9 4.8 5.7Madrid, Comunidad de 14.1 10.1 13.3 11.8 12.0 14.8Murcia, Región de 14.7 4.9 10.4 17.3 16.9 12.2Navarra, Comunidad Foral de 10.7 5.0 11.4 10.6 .. 11.4País Vasco 8.1 5.3 6.7 7.2 8.7 9.5Rioja, La 12.5 9.2 14.3 14.5 .. 11.4Ceuta 6.7 .. .. .. 6.7 ..Melilla 15.3 .. .. .. 15.3 ..

Preview of the Continuous Register Statistics January 1st, 2019 - Provisional data (14/16)
10. Number of municipalities by percentage of Foreign Nationals registered in the Continuous Register Provisional data. Preview of the Continuous Register Statistics as at 1 January 2020
Total 0%-5% 5%-10% 10%-15% 15%-20% 20%-25% 25%-50% +50%
TOTAL 8,131 4,303 1,910 1,011 454 219 215 19Andalucía 785 495 145 48 21 29 43 4Aragón 731 263 237 109 68 35 19 0Asturias, Principado de 78 69 9 0 0 0 0 0Balears, Illes 67 0 6 17 23 11 10 0Canarias 88 21 28 14 6 6 13 0Cantabria 102 78 23 1 0 0 0 0Castilla y León 2,248 1,651 355 146 54 19 22 1Castilla-La Mancha 919 413 248 150 74 16 16 2Cataluña 947 236 313 220 89 53 35 1Comunitat Valenciana 542 130 187 104 42 27 41 11Extremadura 388 352 30 3 1 1 1 0Galicia 313 271 36 6 0 0 0 0Madrid, Comunidad de 179 11 45 78 34 8 3 0Murcia, Región de 45 4 14 12 5 4 6 0Navarra, Comunidad Foral de 272 135 73 41 15 7 1 0País Vasco 251 103 113 32 3 0 0 0Rioja, La 174 71 47 30 18 3 5 0Ceuta 1 0 1 0 0 0 0 0Melilla 1 0 0 0 1 0 0 0

Preview of the Continuous Register Statistics January 1st, 2019 - Provisional data (15/16)
Explanatory note
Causes of the variation in the figures between two consecutive years
The procedure for obtaining the Population Figures resulting from the Revision of the Municipal Register as at 1 January comprises different phases, and is regulated by the Resolution of 20 July 20184 of the Presidency of the National Statistics Institute and the Directorate General of Regional and Local Cooperation by which technical instructions are issued to the Municipal Councils on the annual revision of the Municipal Register and on the procedure for obtaining the proposal of official population figures5.
Based on this procedure it must be clarified that the change produced regarding the previous figures, as at 01 January 2019, are mainly due to the following reasons:
1. Natural increase registered in the Continuous Register
Difference between registrations due to birth and deregistrations due to death registered in the Continuous Register. They may be from the year 2019 or prior.
2. Balance by Residential Variation Statistics
Difference between registrations and deregistrations due to changes of residence that may have any variation date prior to 01 January 2020. Those corresponding to the year 2019 will later make up the Residential Variations Statistics6.
3. Balance of Expirations for Non-Community Foreign Nationals without a Permanent Residence Permit7 (NCFNWPRP)
NCFNWPRP have the obligation, established in article 16.1 of Law 7/1985 Regulating the Bases of the Local Regime, to renew their registration every two years. If they do not do so, their registration must be cancelled due to expiry. If the registration is pending at the time of obtaining the population figures (that is, the INE has not received the renewal or deregistration sent by the Municipal Council), it is not recorded.
This is a consolidated procedure that has been in use since the year 2006. The balance is obtained as the difference between those registrations that had to be renewed during 2019, which have been cancelled due to expiration or have not been renewed, and those pending,
4 This Resolution applies from the revision to 1-1-2019, but it has not suppposed a substantial change in the procedure for obtaining the proposed population figures. It incorporates only the actions that had been applied as a result of various Registration Council agreements, subsequent to the previous Resolution of 2005, and it primarily affects the requirement for file exchange through the IDA-Padrón internet application, and the establishment of an annual calendar. 5 BOE 20-09-2018. RESOLUTION of 13 September 2018, of the Undersecretariat of the Ministry of the Presidency, Relations with the Courts and Equality by which the publication of the aforementioned Resolution is ordered. 6 In the Methodology of the Residential Variations Statistics, the causes and types of variation that are incorporated can be verified: (http://www.ine.es/dyngs/INEbase/en/operacion.htm?c=Estadistica_C&cid=1254736177013&menu=metodologia&idp=1254734710990). 7 Formerly called permanent residence.

Preview of the Continuous Register Statistics January 1st, 2019 - Provisional data (16/16)
which were not included in the previous year, for which their renewal was received during 2019, and which have been recorded.
4. Balance of checks for Community Foreign Nationals or Non-Community Foreign Nationals with Long-Term Residence Permit (non-NCFNWPRP)
In 2009, by virtue of an agreement of the Registration Council, a procedure was established for the periodic verification of the continuity of residence in the municipality by the municipal councils for community or non-community foreign nationals with permanent residence permits, every 2 or 5 years, depending on whether or not they are registered in the Central Register of Foreign Nationals8.
Starting from the figures as at 1 January 2013, the Registration Council reported favourably on the application of a progressive criterion of not counting non-NCFNWPRP foreigners for whom the residence requested had not been confirmed, consisting of increasing annually the percentage of processing required, until it is applied without restrictions as from the figures as at 1 January 2017, so that since then none of the non-NCFNWPRP registrations pending verification are counted (that is, those for which there is no change in the INE that proves the continuity of the residence or the cancellation sent by the Municipal Council)9.
As with the NCFNWPRP procedure, the balance is obtained as the difference between the non-NCFNWPRP not counted because they have not yet been verified, or have been cancelled, corresponding to the year 2019 and those counted, pending from the previous year, for which the continuity of residence in 2019 has been verified.
5. Balance of the Rest of Non-residential and Procedure Variations
This balance is the difference between the rest of variations not considered in the previous sections, such as, registrations by omission and cancellations by undue registration of Spaniards who, unlike those of foreigners, are not included in the Residential Variations Statistics as they are not considered migratory movements but adjustment in the register, cancellations due to duplicates in the Register, registers that present incidences that impede their recording, etc.
6. Changes in nationality
In addition to the above, and considering the nationality, it must be borne in mind that variations in the number of Spaniards or in the number of foreigners have implicit all the changes of nationality that have been registered in the Continuous Register throughout the year, being much more numerous the changes of nationality from foreigners to Spaniards.
8 This procedure is currently regulated in section 7 of the Resolution of 30 January 2015 of the President of the National Statistics Institute and the Director General for the Coordination of Competencies with the Autonomous Communities and Local Entities, by which technical instructions are issued to the Municipal Councils on the management of the Municipal Register (BOE 24-3-2015 http://www.boe.es/diario_boe/txt.php?id=BOE-A-2015-3109). 9 See section III. Information taken into account by the INE to obtain the proposed population figure of the Resolution of 20 July 2018.