the potential economic consequences of a highly · pdf filethe potential economic consequences...
TRANSCRIPT
Jill Manzo Midwest Economic Policy Institute
Frank Manzo IV, MPP Illinois Economic Policy Institute
Robert Bruno, PhD Project for Middle Class Renewal
University of Illinois at Urbana-Champaign
The Potential Economic
Consequences of a
Highly Automated
Construction Industry
What If Construction Becomes
the Next Manufacturing?
January 2018

The Potential Economic Consequences of a Highly Automated Construction Industry
i
Executive Summary
What if construction is the next manufacturing, with automation replacing hundreds of thousands of middle-class workers over the next generation? In the future, technological changes that displace human labor in the
construction industry could have consequences for workers, families, and the U.S. economy. This report is a
theoretical assessment of the potential economic impacts of a highly automated construction industry.
The Rise of Capital in the Construction Industry
• Automation has increased productivity, reduced costs, and improved quality.
• Contractors are addressing worker shortages by utilizing more machinery, equipment, and robots.
• Blue-collar labor costs, including wages and fringe benefits paid to workers in construction occupations,
have been declining as a share of total construction costs for decades.
• Capital’s share of the construction market increased by 6.9 percentage points in Illinois, 2.8 percentage
points in Indiana, 2.8 percentage points in Iowa, 1.9 percentage points in Minnesota, and 9.6 percentage points in Wisconsin from 1997 to 2015.
• Robots are now able to lay more bricks per day, build more yards of road per day, and construct buildings
in fewer days than human labor.
The Potential Economic Consequences of a Highly Automated Construction Industry
• Approximately 49 percent of all construction tasks can be automated.
• The estimated automation potential is 35 percent for laborers, 50 percent for carpenters, 42 percent for
electricians, 50 percent for plumbers, and 88 percent for operating engineers.
• Nearly 2.7 million construction workers could be displaced or replaced by 2057, including 435,000
carpenters, 411,000 laborers, and 404,000 operating engineers.
• In the Midwest, the number of displaced or replaced construction workers could reach as high as 96,000
in Illinois and 55,000 in Minnesota.
• The most common jobs for workers who separate from the construction trades are currently in
transportation and material moving; production; building and grounds crew; installation, maintenance,
and repair; and food preparation and service occupations.
• Construction worker displacement could reduce labor income by a net of $31.5 billion (in current dollars)
as former construction workers are forced to find jobs in these other, generally lower-paying, occupations.
• An increasingly capital-intensive construction industry over the next 40 years would have consequences
that mirror the impact of automation in manufacturing, with another 498,000 jobs and $45.4 billion (in
current dollars) in output lost in the United States from reduced demand.
• Drops in consumer demand could cause 18,000 job losses in Illinois, 13,000 job losses in Indiana, 7,000 job losses in Iowa, 9,000 job losses in Minnesota, and 11,000 job losses in Wisconsin.
Three Public Policy Recommendations
1. Apprenticeship programs in the building trades should be utilized and adapted to train new workers and
re-skill employees as specific trades become more automated. Since joint labor-management programs
currently graduate 79 percent of all apprentices in the United States, lawmakers should be discouraged from restricting collective bargaining or repealing state prevailing wage laws that fund these programs.
2. States and local communities should collaborate with educational institutions to invest in vocational
training and worker re-training to prepare individuals for the jobs of the future.
3. As construction becomes more automated, lawmakers should consider taxing capital owned by
contractors and investing the proceeds into young and displaced workers.
An increasingly capital-intensive construction industry could cause both economic prosperity and economic
hardship. It is imperative that lawmakers, public officials, and industry stakeholders start preparing for this
potential economic change. Proactive steps can be taken to ensure that the benefits of a highly automated construction industry are shared broadly across the economy.

The Potential Economic Consequences of a Highly Automated Construction Industry
ii
Table of Contents
Executive Summary i Introduction 1 The Fourth Industrial Revolution 2 Technological Advances are Good for Businesses, But Can Be Bad for Workers 2 Capital Has Been on the Rise in the Construction Industry 3 Technological Changes in Construction over Recent Years 6 The Potential Economic Consequences of a Highly Automated Construction Industry 6 Three Public Policy Recommendations 14 Conclusion 16 Sources 17 Cover Photo Credits 20 Appendix 21
About the Authors
Jill Manzo is the Midwest Researcher at the Midwest Economic Policy Institute (MEPI). She earned a Bachelor
of Arts in Political Science and International Studies from Iowa State University. Her research interests include
income inequality, infrastructure investment, economic development, education policy, and the overall labor force. Since 2015, she has authored or co-authored over 20 reports on topics ranging from infrastructure funding
to prevailing wage laws to public education and public health. She can be contacted at [email protected].
Frank Manzo IV, MPP is the Policy Director of the Illinois Economic Policy Institute (ILEPI). He earned a Master
of Public Policy from the University of Chicago Harris School of Public Policy and a Bachelor of Arts in Economics
and Political Science from the University of Illinois at Urbana-Champaign. He specializes in labor market
analysis, economic development, infrastructure investment, the low-wage labor force, and public finance. He can
be contacted at [email protected].
Robert Bruno, PhD is a Professor at the University of Illinois at Urbana-Champaign School of Labor and
Employment Relations and the Director of the School’s Labor Education Program. He also directs the Project for
Middle Class Renewal at the University of Illinois at Urbana-Champaign. His research focuses broadly on
working-class, middle-class, and union studies issues. He earned his Doctor of Philosophy in Political Theory
from New York University and his Master of Arts in Political Science from Bowling Green State University. He
can be contacted at [email protected].

The Potential Economic Consequences of a Highly Automated Construction Industry
1
Introduction
The world is changing fast. Technological advances have made it easier to build products, produce more
food for a growing population, and connect people across the globe. The computer was invented 74 years
ago, the World Wide Web was invented 27 years ago, and the earliest smartphone was invented 25 years
ago. Today, these innovations are the backbone of developed economies, where technology is used by a vast majority of citizens. Technological advances will continue to connect the world and drive virtually all
aspects of a competitive global economy.
As the United States continues to grow, infrastructure investments and improvements will be needed to
meet new demands and compete globally. The American Society of Civil Engineers has given the United
States a D+ grade in its 2017 Infrastructure Report Card and has estimated that $2.0 trillion is needed over
the next 10 years (ASCE, 2017). Every year, drivers in the United States spend 5.5 billion hours in traffic,
resulting in $120 billion in fuel costs and lost time per year. Businesses pay $27 billion annually in
additional freight costs due to poor conditions of transportation systems. Approximately 240,000 water
main breaks occur each year due to deteriorating water systems. The electric grid’s low resilience results
in outages that cost the United States’ economy between $18 billion and $33 billion each year (U.S.
Department of the Treasury, 2014). Public investments in transportation, water, telecommunications, and
energy infrastructure are needed to grow the country’s economy and keep the United States competitive in
the global economy.
Future infrastructure needs will result in more public and private construction projects. As of 2017, the
construction industry employs more than 6 million workers, including over 4 million blue-collar workers
(AGC, 2017). Construction firms, however, report difficulties in filling job vacancies, with nearly 200,000
construction jobs across the country left unfilled due to a lack of skilled applicants (Glaser & Molla, 2017).
With future infrastructure needs driving investment, workers of all construction trades are expected to
remain in high demand across the country.
From the perspective of contractors, one potential long-term solution to address the shortage of
construction workers is to utilize forms of automation like robots, drones, and other capital equipment.
Large equipment, handheld tablets, and other technologies currently help men and women build
infrastructure efficiently and effectively. In the future, workers may perform construction tasks behind
computers, controlling network-connected equipment alongside robots when building the world’s
infrastructure.
There has, however, been a growing concern among many workers, experts, and elected officials on the
long-term effects of construction positions becoming less reliant on human labor. The introduction of
technologies replacing men and women in the construction industry could be devastating to workers,
families, and the U.S. economy as a whole. Displaced workers will face unemployment spells and will need
to find new sources of income. Preparing for this potential economic change is imperative.
This Midwest Economic Policy Institute (MEPI) and Project for Middle Class Renewal (PMCR) at the
University of Illinois at Urbana-Champaign report explores the future of the building trades in the age of
automation. The report is a theoretical assessment of the potential economic impacts of a highly automated
construction industry. The report begins with an introduction to the “Fourth Industrial Revolution” and
discusses how technological advances can be good for businesses but bad for certain workers. Then,
construction trends over the past two decades are examined and recent technological changes in the
industry are surveyed. The potential economic impacts of a highly automated construction industry are
subsequently assessed, with an emphasis on the consequences for displaced construction workers in the

The Potential Economic Consequences of a Highly Automated Construction Industry
2
United States. Finally, the report concludes with public policy recommendations before recapping key
findings.
The Fourth Industrial Revolution
The world is currently in the “Fourth Industrial Revolution,” characterized by genetic developments,
artificial intelligence (AI), robotics, autonomous consumer goods, 3D printing, and biotechnology (Leopold
et al., 2016).1 This “robot revolution” is altering the world, making life more efficient than ever for humans.
People can now find information with the tip of their finger on smartphones, couples can procreate with
the help of in vitro fertilization, and people can make transactions using credit cards and have products
delivered right to their doorsteps.
One important change due to the Fourth Industrial Revolution is the effect that IT-technologies, robotics,
and automation have had on the workforce. Jobs that once needed manual labor are being replaced by
automated technologies that can do the job faster and more efficiently. Automation has already played a
major role in displacing manufacturing workers. As technology advances, it will progressively impact more
industries.
How many jobs are at risk of automation? Oxford University researchers have estimated that 47 percent of
United States’ jobs could be automated within the next two decades due to intelligent machines becoming
more sophisticated and specialized (Frey & Osborne, 2013). Researchers at PricewaterhouseCoopers have
estimated that robots and artificial intelligence could replace 38 percent of United States’ jobs by the early
2030s (PwC, 2017). Some economists think that 3.4 million U.S. jobs could be lost by 2025 due to advances
in technology, artificial intelligence, machine-learning, and 3D printing and robotics. (McRae, 2017). The
majority of these lost jobs will be in office and administrative positions, fast food, retail, manufacturing
production, transportation, and construction and extraction.
Jobs that are popular now are expected to become more automated in the future. Machines and robotics
have displaced manufacturing workers. Touch screens have replaced many cashiers at restaurants and
stores. Artificial intelligence– such as a voicebot– is used to make sales calls, replacing salespeople. Surgical
robots are used in knee replacement surgery and vision correction surgery. Self-driving trucks are expected
to take over the jobs of truck drivers in the future. Careers that people have today will be very different in
the next 40 years; according to ManpowerGroup, 65 percent of the jobs Generation Z will perform do not
yet exist (ManpowerGroup, 2016).
Technological Advances are Good for Businesses, But Can Be Bad for Workers
Technology is good for business. It has increased productivity, reduced operating costs, improved quality,
and increased manufacturing flexibility for businesses around the world. Automation technology has also
significantly improved in recent years, with faster, smaller, and more affordable machines. More and more
companies are using advanced machinery in their warehouses and factories to increase their
competitiveness and reduce their production costs.
1 The “First Industrial Revolution” was characterized by urbanization and the steam engine; the “Second Industrial Revolution” was an era of mass production, advancements in electricity such as the light bulb, and the internal combustion engine; and the “Third Industrial Revolution” was the age of digital technology, with the development of the personal computer and the Internet.

The Potential Economic Consequences of a Highly Automated Construction Industry
3
Automated production systems have reduced labor costs for businesses. While human labor typically
works shifts of 8 hours, machines can work nonstop. Once a machine is programmed, it can easily switch
between processes and programs to produce and design a product with minimal effort. Robots also do not
have emotional or physical limitations like human labor, which can lower costs. Machines do not need
health insurance, do not need retirement plans, do not need breaks to rest or sleep, and do not need raises
to afford a comfortable life. As a result, the Boston Consulting Group has estimated that a robot taking over
a welder’s job can save a company an estimated $17 per hour (Cocco, 2016). As researchers from the
Massachusetts Institute of Technology Sloan School of Management put it: “There has never been a worse
time to be competing with machines, but there has never been a better time to be a talented entrepreneur”
(Brynjolsson & McAfee, 2012).
Workers in specific industries are negatively impacted by automated technology replacing manual labor.
Recent research has found that, for every robot per thousand workers in a local economy, approximately
5.6 jobs are lost. In terms of the employment rate, one more robot per thousand workers has been found to
statistically reduce the local employment-to-population ratio by between 0.18 and 0.34 percentage points
(Acemoglu & Restrepo, 2017). Similarly, one more robot per thousand workers was found to reduce local
worker wages by between 0.25 and 0.50 percent (Acemoglu & Restrepo, 2017).
The sector most negatively impacted by automation in the United States thus far has been the
manufacturing sector. A recent study estimated that the United States has lost between 360,000 and
670,000 jobs specifically due to robots, mainly in manufacturing. Researchers at the Center for Business
and Economic Research at Ball State University arrived at an even bolder conclusion: about 87 percent of
manufacturing jobs lost between 2000 and 2010– about 4.9 million jobs– were actually due to technological
advancements increasing productivity, rather than trade, which accounted for the other 13 percent (Hicks
& Devaraj, 2017). These job losses are expected to continue as automated machinery becomes more
sophisticated, with the Bureau of Labor Statistics projecting that the manufacturing sector will lose another
814,100 total jobs over the next decade as new technologies are invented that can carry out tasks once
performed by human labor (BLS, 2015).
The positions being replaced by automation are typically in middle-class occupations. The workers
displaced by production processes controlled by computer codes often have to find jobs in other, lower-
paying sectors. Occupations that have offered employment opportunities for displaced manufacturing
workers include food and retail, office and administrative support, transportation, and construction and
extraction. These industries are likely to see increased automation, resulting in further displacement. This
change will be gradual, but the effects of displacing workers from middle-class jobs will impose significant
costs on the economy.
Capital Has Been on the Rise in the Construction Industry
Construction has increasingly become a more capital-intensive industry. Blue-collar labor costs, including
wages and fringe benefits paid to workers in construction occupations, have been declining as a share of
total construction costs for decades (Manzo et al., 2016). Conversely, white-collar labor costs, expenditures
on machinery and supplies, and contractor profits have risen over time (U.S. Census, 2012).
Figures 1 and 2 evaluate data from the Bureau of Economic Analysis (BEA) at the U.S. Department of
Commerce on capital’s share of construction industry output and labor’s share of construction industry
output. Data are analyzed for the United States as a whole, as well as for five Midwest states: Illinois,
Indiana, Iowa, Minnesota, and Wisconsin.

The Potential Economic Consequences of a Highly Automated Construction Industry
4
Capital is defined by “gross operating surplus” values reported by the BEA. Gross operating surplus includes
owners’ incomes, corporate profits, capital gains, business transfer payments (especially for insurance),
and– importantly– consumption of fixed capital. Fixed capital includes durable physical assets that are
owned or used for more than one year, such as machinery, equipment, vehicles, and the value of land and
office buildings. Machinery and automation are a component of capital.
Labor is more straightforward and is defined by “compensation of employees” values reported by the BEA.
Compensation of employees includes wages, salaries, commissions, tips, bonuses, contributions to pension
plans and insurance plans, and employer contributions for government social insurance programs such as
Social Security. Note that labor includes income for both blue-collar construction workers and white-collar
employees in the industry, such as lawyers, architects, and engineers.
From 1997 to 2015, construction industry output grew by an average of 4.3 percent per year across the
United States (Figure 1). However, the annualized rate of labor growth was lower than the annualized rate
of capital growth in the industry. On average, over nearly two decades, capital increased by 5.2 percent per
year in the U.S. construction industry while labor grew by just 3.9 percent per year. The higher rate of
capital growth relative to output (value added) growth may have contributed to increased inequality within
the construction industry since 1997.2
Construction markets in the Midwest experienced the same phenomenon (Figure 1). The annualized rate
of capital growth in construction exceeded the rate of labor growth and the overall rate of industry output
growth in all five Midwest states. Most notably, capital grew by 5.6 percent per year in Wisconsin’s
construction industry, nearly double the increase in labor compensation (2.9 percent per year). The data
reveal that construction machinery and fixed capital costs and contractor profits have experienced
significant gains in the Midwest over recent decades.
Figure 1: Growth Rates of Output, Labor, and Capital in Construction by State, 1997-2015 Construction
Industry Output
Annualized Value Added (Output)
Growth
Annualized Labor
Growth
Annualized Capital Growth
United States 4.3% 3.9% 5.2%
Illinois 3.0% 2.4% 4.2%
Indiana 2.6% 2.4% 3.1%
Iowa 5.3% 5.0% 5.8%
Minnesota 4.2% 4.0% 4.5%
Wisconsin 3.7% 2.9% 5.6%
Source(s): BEA, 2017 – “Regional Data: Annual Gross Domestic Product (GDP) by State.”
Figure 2 shows capital’s share of construction industry output in the United States and the five Midwest
states since 1997. Whereas Figure 1 examines growth of output, labor, and capital, Figure 2 considers how
much of the industry is “captured” by capital. That is, Figure 1 assessed how much the economic pie was
increasing while Figure 2 considers the slices of the pie.
Capital has captured a larger share of construction industry output over recent years (Figure 2). In the
United States as a whole, capital’s share of construction output was 31.8 percent in 1997. Capital’s share
rose during the housing bubble but declined in the Great Recession that followed. By 2015, capital
accounted for 37.0 percent of industry output, an increase of 5.2 percentage points. Similarly, from 1997 to
2 In his 2014 book, Capital in the Twenty-First Century, labor economist Thomas Piketty argues that inequality occurs when the rate of return on capital is greater than the rate of return on economic growth. In an economy where the former exceeds the latter, wealth accumulates in the hands of the very few– namely, the Top 1 Percent (Piketty, 2014).

The Potential Economic Consequences of a Highly Automated Construction Industry
5
Figure 2: Change in Capital Share of Construction Industry by State, 1997-2015
Source(s): BEA, 2017 – “Regional Data: Annual Gross Domestic Product (GDP) by State.”
20.0%
25.0%
30.0%
35.0%
40.0%
45.0%
19
971
998
19
992
000
20
012
002
20
032
004
20
052
006
20
072
008
20
092
010
20
112
012
20
132
014
20
15
Capital Share of the Construction Industry, United States, 1997-2015
United States Trend (US)
20.0%
25.0%
30.0%
35.0%
40.0%
45.0%
19
971
998
19
992
000
20
012
002
20
032
004
20
052
006
20
072
008
20
092
010
20
112
012
20
132
014
20
15
Capital Share of the Construction Industry, Iowa, 1997-2015
Iowa Trend (IA)
20.0%
25.0%
30.0%
35.0%
40.0%
45.0%
19
971
998
19
992
000
20
012
002
20
032
004
20
052
006
20
072
008
20
092
010
20
112
012
20
132
014
20
15
Capital Share of the Construction Industry, Minnesota, 1997-2015
Minnesota Trend (MN)
20.0%
25.0%
30.0%
35.0%
40.0%
45.0%
19
97
19
981
999
20
002
001
20
02
20
03
20
04
20
052
006
20
07
20
082
009
20
10
20
112
012
20
13
20
142
015
Capital Share of the Construction Industry, Illinois, 1997-2015
Illinois Trend (IL)
20.0%
25.0%
30.0%
35.0%
40.0%
45.0%
19
97
19
98
19
99
20
00
20
01
20
02
20
03
20
04
20
05
20
06
20
07
20
08
20
09
20
10
20
11
20
12
20
13
20
14
20
15
Capital Share of the Construction Industry, Indiana, 1997-2015
Indiana Trend (IN)
20.0%
25.0%
30.0%
35.0%
40.0%
45.0%
19
971
998
19
992
000
20
012
002
20
032
004
20
052
006
20
072
008
20
092
010
20
112
012
20
132
014
20
15
Capital Share of the Construction Industry, Wisconsin, 1997-2015
Wisconsin Trend (WI)

The Potential Economic Consequences of a Highly Automated Construction Industry
6
2015, capital’s share of the construction market increased by 6.9 percentage points in Illinois, 2.8
percentage points in Indiana, 2.8 percentage points in Iowa, 1.9 percentage points in Minnesota, and
9.6 percentage points in Wisconsin. A higher capital share of construction output implies a lower
labor share, meaning that the rise in capital is due to increased contractor incomes and profits or
increased use of machinery and equipment (or both) relative to wage rates for the average employee.
Technological Changes in Construction Over Recent Years
The future of construction has already begun, with technological changes playing a part in the recent
rise of capital in the industry. For example, a robotic bricklayer called the Semi-Automated Mason–
or SAM– was created by New York-based Construction Robotics while another Perth-based company,
Fastbrick Robotics, created a robotic bricklayer called the Hadrian X. SAM can lay 3,000 bricks a day
and Hadrian X can lay 1,000 bricks a day while manual labor can lay only 500 bricks a day, on average
(Murphy, 2017; Pash, 2016). A Dutch company has also created a “Road Printer” that lays brick
paving like carpet. The machine can lay approximately 400 yards of road per day with the assistance
of only one to three operators (Orlove, 2012).
Virtual reality (VR) technology, augmented reality (AR) technology, and drones can allow a
construction team to detect errors ahead of time to avoid costly mistakes. VR, AR, and drones have
the potential to improve workplace safety, such as letting managers and workers view jobsite
conditions without subjecting them to safety hazards (Construction Dive, 2017). These new
inventions have made public and private construction easier and safer. Not only are projects done
faster with automation, projects are also completed with more accuracy and precision while reducing
the cost– reportedly doubling output for construction firms. VR, AR, and drones in the high-risk
construction industry are already reducing injuries and fatalities on jobsites but are also replacing
manual labor.
In China, a variety of automatic construction machines have constructed projects in the country faster
and cheaper. Winsun, a Chinese company, has built 10 small houses and a 6-story building using 3D
printing. The 3D printer builds segments of a structure using a mixture of concrete and construction
waste. These segments are then constructed together onsite. According to Winson, their 3D printer
allows them to save up to 60 percent on materials costs and requires 80 percent less labor (Peetros,
2016). Furthermore, in 2015, a 57-story building was constructed in 19 days in China using
automated technology (The Guardian, 2015).
These technological advancements have made construction more capital-intensive and less labor-
intensive. Due to these and other innovations, the World Economic Forum estimates that about
500,000 construction jobs will be compromised across the world in just a few years, by 2020 (Everly,
2017). Over a longer period of time, automation, robots, and technological changes may put millions
of construction workers out of a job, both around the world and right here in the United States.
The Potential Economic Consequences of a Highly Automated Construction Industry
The construction industry could look vastly different in a generation. Today, men and women work
on hazardous construction sites, wear helmets and clothes that obey safety regulations, and use small
and large equipment that help complete projects on budget and on time. If capital continues to

The Potential Economic Consequences of a Highly Automated Construction Industry
7
capture an increasing share of construction output due to technological advances, then, in 40 years,
men and women may be controlling drones and robotic equipment in a building from afar. While
humans may control the equipment that is used to finish a project, manual labor could be less
prominent in the building trades. Humans may instead be working on the maintenance of the
automated technology that builds the world’s buildings, roads, and utilities systems.
McKinsey & Company, a management consulting firm, has estimated the percent of tasks in each
occupation that can be automated (Manyika et al., 2017a). While the authors estimate that only 5 percent of jobs can be completely replaced by technology, specific tasks are likely to be automated in
the future. Workers may still be employed in each job classification, but total employment in each
occupation could shrink as humans focus only on the tasks that cannot be automated.
Figure 3 presents background information on the construction industry today and projections for the
future in the United States. Information on average annual wages and current employment figures
are provided by the May 2016 Occupational Employment Statistics (OES) dataset from the Bureau of
Labor Statistics (BLS) at the U.S. Department of Labor. Projected employment is based on the average
employment growth projection for all jobs over the next ten years; the total number of jobs in the
U.S. economy is expected to increase by 6.5 percent over the next decade. Although construction jobs
are expected to grow faster than the national average over the next ten years, this analysis
conservatively assumes that construction job growth will mirror national job growth. Current
decadal employment growth projections are then applied to the three following decades to arrive at
a predicted employment estimate for 2057. Finally, the last column presents the percent of each
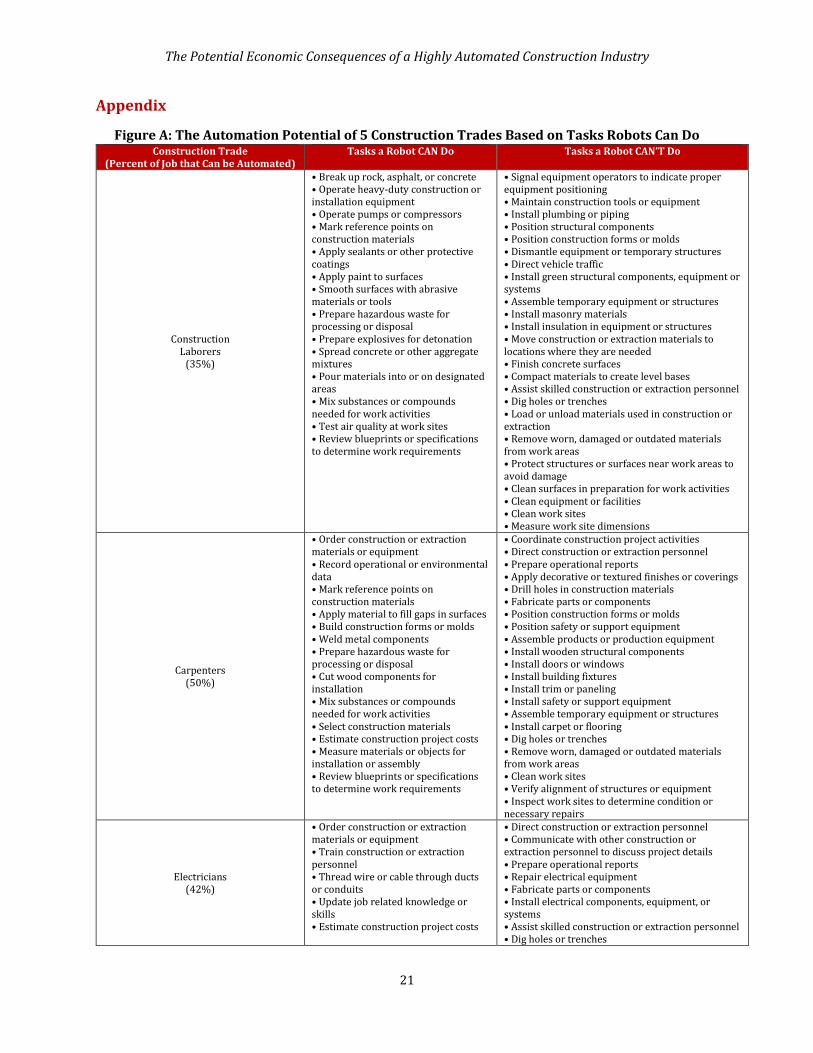
construction trade that can be automated, according to estimates from McKinsey & Company. See the
Appendix for a breakdown of tasks that a robot can and cannot do in the laborers, carpenters,
electricians, operating engineers, and plumbers, pipefitters, and steamfitters occupations.
Based on these conservative assumptions, there will be approximately 5.4 million construction
trades workers in the United States by 2057, up from 4.2 million blue-collar construction workers
today. However, this increase of more than one million middle-class construction trades workers is
based on current technologies. Increased automation would lower these estimates (Figure 3).
Figure 3 also presents projected employment estimates and current annual income averages for 10
occupations: 9 construction trades and an aggregated group of all other construction occupations.
As of May 2016, average annual wages in these trades range from $37,890 per year for construction
laborers to $56,650 per year for electricians. The mean annual income from wages is a middle-class
rate of $47,580 across the United States.
Moreover, Figure 3 includes automation risk estimates on the percent of a given occupation that can
be automated. Approximately 49 percent of all construction tasks can be automated, but risks are
higher for certain trades. While a machine cannot currently assemble temporary equipment or
estimate materials needed for the project, it can order construction materials and equipment, apply
material to surface, mix substances, review blueprints, and perform many other tasks that humans
currently complete (Johnson, 2017). Construction-related careers such as roofers, electricians,
carpenters, and plumbers will see minimal amounts of robots taking over their jobs because they
need human labor to solve unique challenges in uncertain environments. However, construction jobs
that include running machinery, such as operating engineers, will have a higher risk of automation.
For example, artificial intelligence-controlled machines may be able to displace crane operators and
bulldozer drivers within the next few decades (Figure 3).

The Potential Economic Consequences of a Highly Automated Construction Industry
8
Figure 3: Wages, Employment, and Automation Potential by Construction Trade Blue-Collar
Construction Occupation
Average Annual Wages
(May 2016)
Current Employment (May 2016)*
Projected Employment
(2057)*
McKinsey & Co. Automation Potential**
Construction Trades Workers $47,580 4,217,000 5,425,000 49%
Construction Laborers $37,890 912,000 1,173,000 35%
Carpenters $48,340 677,000 871,000 50%
Electricians $56,650 607,000 781,000 42%
Plumbers, Pipefitters, & Steamfitters $56,030 412,000 530,000 50%
Operating Engineers $50,560 357,000 459,000 88%
Painters $41,510 217,000 280,000 90%
Cement Masons & Concrete Finishers $43,720 174,000 224,000 88%
Sheet Metal Workers $51,080 134,000 173,000 39%
Roofers $42,080 116,000 150,000 31%
All Other Construction Occupations $48,290 610,000 785,000 35%
Source(s): BLS, 2017 – “May 2016 State Occupational Employment and Wage Estimates;” Johnson, 2017 – McKinsey & Company estimates;
BLS, 2015 – “Occupational Employment Projections to 2024” – decadal rate for all occupations (+6.5%) used over four periods.
*Employment estimates are rounded to the nearest thousand and may not add up perfectly.
**The automation potential for all Construction Trades Workers is implied from the weighted average risk for the specific trades.
Figure 4 assumes that, over the long run, machines will replace workers at the same level of McKinsey
& Company’s estimates on the percent of a job that can be automated. If these tasks already can be
automated, it can be assumed that– as technological advances become cheaper and more efficient
during the next 40 years– they will be automated, leaving the other tasks that robots cannot do up to
employed human labor. Consequently, Figure 4 factors in projected job growth (based on current
technology) and multiplies that estimate by expected share of tasks automated.
Figure 4: Potential Impacts of a Highly Automated Construction Industry on Workers, 2057 Blue-Collar
Construction Occupation
Jobs Gap due to Automation (Existing
and Expected)*
Number of Jobs
Remaining*
Total Displacement
of Existing Jobs*
Labor Income Lost or Forgone
(Current Dollars) Construction Trades Workers 2,677,000 2,745,000 1,472,000 $127.51 billion
Construction Laborers 411,000 763,000 149,000 $15.56 billion
Carpenters 435,000 435,000 242,000 $21.05 billion
Electricians 328,000 453,000 154,000 $18.58 billion
Plumbers, Pipefitters, & Steamfitters 265,000 265,000 147,000 $14.84 billion
Operating Engineers 404,000 55,000 302,000 $20.42 billion
Painters 252,000 28,000 189,000 $10.44 billion
Cement Masons & Concrete Finishers 197,000 27,000 147,000 $8.61 billion
Sheet Metal Workers 67,000 106,000 29,000 $3.45 billion
Roofers 46,000 103,000 13,000 $1.95 billion
All Other Construction Occupations 275,000 510,000 100,000 $13.26 billion
Source(s): Authors’ estimates using BLS, 2017 – “May 2016 State Occupational Employment and Wage Estimates;” Johnson, 2017 – McKinsey
& Company estimates; BLS, 2015 – “Occupational Employment Projections to 2024” – decadal rate for all occupations (+6.5%).
*All employment estimates are rounded to the nearest thousand and may not add up perfectly.
After considering both projected industry growth and technological advancements, it is estimated
that the number of construction trades workers could shrink to 2.7 million workers by 2057, as
construction becomes a more capital-intensive industry (Figure 4). This would displace nearly 1.5

The Potential Economic Consequences of a Highly Automated Construction Industry
9
million workers from existing blue-collar construction occupations. The total jobs gap would be even
higher, with workers laid off from existing jobs (i.e., displaced current workers) and hundreds of
thousands of jobs forgone for tasks that become automated but would have otherwise been
completed by human workers (i.e., replaced potential workers). The decline in good, middle-class
construction job opportunities would result in a projected $127.5 billion drop in construction labor
income from construction workers (Figure 4).
Figure 4 also presents the jobs gap, number of displaced jobs, and labor income loss for each of the 10 construction occupations. If automation takes over routine tasks and replace construction
workers, there may be 435,000 fewer carpenters, 411,000 fewer laborers, and 404,000 fewer
operating engineers in 2057 than there would be with current technologies. The U.S. economy would
lose $21.1 billion in the forgone labor income of carpenters, $20.4 billion in the forgone income of
operating engineers, and $15.6 billion in the forgone income of laborers. Painters and cement masons
face a higher risk of automation; only 28,000 painting jobs and 27,000 cement mason jobs could
remain in the U.S. economy by 2057.
Figure 4 is partially at odds with another 2017 report by McKinsey & Company, which found that
construction could add 2.7 million jobs by 2030 for two reasons (Manyika et al., 2017b). First, the
second McKinsey & Company report makes projections for 2030, while this analysis– and the earlier
McKinsey & Company study from 2017 (Manyika et al., 2017a)– considers consequences by the late
2050s, when technology could be even more advanced. Moreover, the second McKinsey & Company
report assumes that the United States will both close the current infrastructure funding gap and
invest in new infrastructure to combat climate change based on the Paris Climate Accord. While the
McKinsey & Company assumption is a desirable outcome– and, in fact, demonstrates the need for
more infrastructure investment to boost construction employment– this analysis is more
conservative by assuming that construction will grow only at the same pace as the national economy.
Figure 5 uses the previous assumptions– including the average total employment growth for each
state– to provide estimates for five Midwest states. Based on these inputs, the projected number of
blue-collar construction workers by 2057, with current technologies, will be approximately 201,000
in Illinois, 148,000 in Indiana, 85,000 in Iowa, 108,000 in Minnesota, and 112,000 in Wisconsin.
However, between 48 percent and 51 percent of tasks performed by these workers can be completed
by robots, depending on the occupational mix of the construction workforce in each state (Figure 5).
Figure 5: Wages, Employment, and Automation Potential of Construction Occupations by State Construction Occupations
By State
Average Annual Wages
(May 2016)
Current Employment (May 2016)*
Projected Employment
(2057)*
McKinsey & Co. Automation Potential**
Illinois $63,790 160,000 201,000 48%
Indiana $46,820 101,000 148,000 48%
Iowa $42,670 61,000 85,000 48%
Minnesota $55,280 91,000 108,000 51%
Wisconsin $50,030 88,000 112,000 49%
Source(s): BLS, 2017 – “May 2016 State Occupational Employment and Wage Estimates;” Johnson, 2017 – McKinsey & Company estimates;
IDES, 2017 – Illinois projected decadal growth for all jobs (+5.9%); HoosierData, 2017 - Indiana projected decadal growth for all jobs (+10.1%);
IWD, 2017 – Iowa projected decadal growth for all jobs (+8.6%); MN DEED – Minnesota projected decadal growth for all jobs (+4.3%);
WORKnet – Wisconsin projected decadal growth for all jobs (+6.0%).
*Employment estimates are rounded to the nearest thousand and may not add up perfectly.
**The automation potential for all Construction Trades Workers is implied from the weighted average risk for the specific trades.

The Potential Economic Consequences of a Highly Automated Construction Industry
10
After considering both projected industry growth and technological advancements, it is estimated
that in 2057 the number of construction trades workers could actually shrink to 105,000 in Illinois,
76,000 in Indiana, 44,000 in Iowa, 53,000 in Minnesota, and 55,000 in Wisconsin (Figure 6). In
Illinois, this would displace 55,000 workers from existing jobs and would replace another 41,000
potential workers from tasks that are automated and never offered to humans, for a total gap of
96,000 construction jobs. Similarly, in Minnesota, technological advancements could displace 38,000
workers from current jobs and replace another 17,000 potential workers for a total gap of 55,000
construction jobs. By 2057, construction labor income could be $6.2 billion lower in Illinois, $3.2
billion lower in Indiana, $1.8 billion lower in Iowa, $3.0 billion lower in Minnesota, and $2.7 billion
lower in Wisconsin (in current dollars) due to automation (Figure 6).
Figure 6: Potential Impacts of Automation on Construction Workers, by State, 2057 Possible Impacts By State
Jobs Gap due to Automation (Existing
and Expected)*
Number of Jobs
Remaining*
Total Displacement
of Existing Jobs*
Labor Income Lost or Forgone
(Current Dollars) Illinois 96,000 105,000 55,000 -$6.15 billion
Indiana 72,000 76,000 24,000 -$3.35 billion
Iowa 41,000 44,000 17,000 -$1.77 billion
Minnesota 55,000 53,000 38,000 -$3.04 billion
Wisconsin 55,000 57,000 31,000 -$2.73 billion
Source(s): Authors’ estimates using BLS, 2017 – “May 2016 State Occupational Employment and Wage Estimates;” Johnson, 2017 – McKinsey
& Company estimates; IDES, 2017 – Illinois projected decadal growth for all jobs (+5.9%); HoosierData, 2017 - Indiana projected decadal
growth for all jobs (+10.1%); IWD, 2017 – Iowa projected decadal growth for all jobs (+8.6%); MN DEED – Minnesota projected decadal growth
for all jobs (+4.3%); WORKnet – Wisconsin projected decadal growth for all jobs (+6.0%).
*All employment estimates are rounded to the nearest thousand.
Figure 7: New Occupations of Workers Employed as Construction Workers Last Year, 2010-2017 New Job or Career
(Occupational Group) Number of Workers Changing
Occupations Between 2010 and 2017 Share of Former Construction
Workers in Labor Force Former Construction Workers 2,613,000 100.0%
Transportation & Material Moving 529,000 20.2%
Production 323,000 12.4%
Building & Grounds Crew 261,000 10.0%
Installation, Maintenance, & Repair 253,000 9.7%
Food Preparation & Service 196,000 7.5%
Management 179,000 6.8%
Sales & Related 177,000 6.8%
Office Administrative Support 147,000 5.6%
Extraction 87,000 3.3%
Architecture & Engineering 56,000 2.2%
Farming, Fishing, & Forestry 56,000 2.1%
Business Operations 48,000 1.8%
Protective Service 45,000 1.7%
Personal Care 40,000 1.5%
Education & Training 35,000 1.4%
All Other Occupations 179,000 6.8%
Source(s): Authors’ estimates using Flood et al., 2017 – Annual Social and Economic Supplement, Current Population Survey, 2010-2017.

The Potential Economic Consequences of a Highly Automated Construction Industry
11
Many former blue-collar construction workers whose jobs become displaced by automation would
find employment in other occupations. Figure 7 uses data from the March Current Population Survey
between 2010 and 2017 to show the new occupations of workers who report that they were
employed in construction occupations the year prior to responding to the survey by the Census
Bureau. Figure 7 includes workers between the ages of 21 and 55 who remained in the labor force
after leaving their job in the construction trades.3
Between 2010 and 2017, approximately 2.6 million working-age individuals were employed as
construction workers one year and then remained in the labor force but had another occupation the
next year, or an average of nearly 327,000 workers becoming separated from their former
construction job per year (Figure 7). Three out of every five former construction workers (59.8
percent) find new employment opportunities in just five occupations: transportation and material
moving positions such as truck drivers (20.2 percent), production occupations such as machinists
(12.4 percent), building and grounds crew jobs such as janitors (10.0 percent), installation,
maintenance, and repair careers such as auto repair technicians (9.7 percent), and food preparation
and service jobs such as fast-food workers (7.5 percent).
The move from a blue-collar construction career to a new job results in a drop in annual worker
income (Figure 8). While those who move into management positions or architecture and
engineering careers may experience increases in earnings, the vast majority of displaced blue-collar construction workers suffer a pay cut. Between 2010 and 2017, the average annual wage and salary
income of displaced construction workers was about $30,800, 32.1 percent lower than the average
annual income of current blue-collar construction workers. The median former construction worker
only earns about $26,300 in the year after separating from construction, 24.8 percent below the
comparable median in the trades.4
Figure 8: Difference in Annual Wages of Former Construction Workers, 2015-2017 Annual Income from Wages and Salaries
Blue-Collar Construction Workers
Former Construction Workers in Labor Force
Difference in Annual Wages
Average $45,420 $30,830 -32.1%
Median $35,000 $26,330 -24.8%
Source(s): Authors’ estimates using Flood et al., 2017 – Annual Social and Economic Supplement, Current Population Survey, 2010-2017.
A drop in human labor means a drop in construction labor income, with displaced workers forced to
find employment in other occupations, which pay an average of 32.1 percent less than construction.
This results in a drop in overall consumer spending in the economy (Figure 9). Figure 9 uses the
estimated labor income changes from Figure 6, the average difference in annual wages in Figure 8,
and average consumer spending rates from the Consumer Expenditure Survey (CEX) by the Bureau of
Labor Statistics (BLS) at the U.S. Department of Labor. In 2015-2016, “average annual expenditures”
accounted for 76.8 percent of “income before taxes” in the United States and 79.1 percent of “income
before taxes” in the Midwest (BLS, 2017). Accordingly, the projected labor income change for the
United States is multiplied by a 76.8 percent spending rate and the projected labor income changes
3 Of the former construction workers ages 21 to 55 who dropped out of the labor force, 9.9 percent were enrolled in a college or university within the next year– demonstrating that some former construction workers would return to school to acquire new skills if their jobs were displaced by automation. 4 The average wage and salary income for construction occupations in Figure 8 is different from the average annual wages for construction trades workers in Figure 3 because Figure 8 uses a different dataset, is limited to workers between the ages of 21 and 55, and includes both full-time and part-time workers.

The Potential Economic Consequences of a Highly Automated Construction Industry
12
for each of the five Midwest states are multiplied by 79.1 percent to forecast impacts on consumer
demand. Replacing human construction workers through automation could reduce consumer
demand, on net, by as much as $0.5 billion in Iowa, $1.6 billion in Illinois, and $31.5 billion nationally
(Figure 9).
Finally, Figure 10 shows results from economic impact analyses assessing the potential cost of
automating the construction trade. This study utilizes IMPLAN, an industry-standard economic
impact analysis software, which uses U.S. Census Bureau data to capture all transactions in the
economy while also factoring in taxes (IMPLAN, 2017). IMPLAN accounts for the interrelationship
between industries and households in economic markets, following a dollar as it cycles through the
local economy. Multipliers are used to assess how much a dollar removed from circulation will impact
the local economy.
Figure 9: Potential Impacts of Construction Automation on Consumer Demand, by State, 2057
Possible Impacts By State
Projected Labor Income Change (Current Dollars)
Impact on Consumer Demand (CEX)
United States -$40.98 billion -$31.46 billion
Illinois -$1.98 billion -$1.56 billion
Indiana -$1.08 billion -$0.85 billion
Iowa -$0.57 billion -$0.45 billion
Minnesota -$0.98 billion -$0.77 billion
Wisconsin -$0.88 billion -$0.69 billion
Source(s): Authors’ estimates using information from Figure 6 and BLS, 2017 – Consumer Expenditure Survey, 2016.
As construction becomes increasingly automated over the next generation, the effects of reduced
consumer demand could be dramatic. In addition to the 2.7 million jobs gap in construction (which
includes 1.5 million displaced workers finding employment in other lower-paying occupations),
another 498,000 jobs in the U.S. economy would be lost as construction workers and their incomes
are replaced by automation. The net drop in consumer demand among middle-class construction
workers would cause another $45.4 billion loss in gross domestic product (GDP) across the United
States (in current dollars). Nearly half a million non-construction workers could lose their jobs and
also be forced to find work in other industries.
Similar to the effect of automation on the manufacturing industry across the Rust Belt, an increasingly
capital-intensive construction industry over the next 40 years would have consequences for Midwest
states. If about half of all construction workers were replaced by automated technologies by 2057,
the drop in consumer demand would result in 18,000 non-construction jobs lost and $2.1 billion lost
in economic output (in current dollars) in Illinois. Indiana would lose 13,000 jobs and $1.2 billion in
economic activity. Iowa would lose 7,000 jobs and $0.6 billion in economic activity. Minnesota would
lose 9,000 jobs and $1.0 billion in economic activity. Lastly, Wisconsin would lose 11,000 jobs and
$1.0 billion in economic activity (Figure 10).
In this theoretical future with high automation in construction, the industry-wide effects would be
on the scale of the impact of global free trade and machinery in the manufacturing industry.
According to the Current Employment Statistics from the Bureau of Labor Statistics (BLS) at the U.S.
Department of Labor, total nonfarm employment in the United States has increased by 63.9 million
jobs (77.5 percent) since June 1977 due to population and economic growth. However, over the same

The Potential Economic Consequences of a Highly Automated Construction Industry
13
40-year timeframe, manufacturing employment decreased from 18.2 million employees to 12.4
million workers, a loss of 5.8 million manufacturing jobs (31.9 percent) (BLS, 2017). Economists
estimate that U.S. trade with China has accounted for between 1.5 million (Autor et al., 2012) and 2.4
million (Kimball & Scott, 2014) American manufacturing jobs lost. Similarly, a recent study estimated
that the United States has lost between 360,000 and 670,000 jobs so far due to robots, mainly in
manufacturing. However, future effects could be more sizable “if the spread of robots proceeds as
expected by experts over the next two decades,” with the presence of robots tripling or quadrupling
(Acemoglu & Restrepo, 2017). These numbers mirror the 2057 scenario with a highly automated
construction industry in Figure 4, where the United States could see 1.5 million current construction
jobs displaced and a human worker gap of nearly 2.7 million forgone construction jobs replaced by
robots.
Figure 10: Potential Economic Impact Analysis of Construction Automation, by State, 2057 Possible Impacts By State
Net Job Change from Consumer Demand Impacts (IMPLAN)
Net Value Added (GDP) Change from Consumer Demand
Impacts (Current Dollars)
Consumer Demand
Multiplier United States -498,000 -$45.39 billion 1.44
Illinois -18,000 -$2.11 billion 1.35
Indiana -13,000 -$1.19 billion 1.40
Iowa -7,000 -$0.64 billion 1.42
Minnesota -9,000 -$1.04 billion 1.35
Wisconsin -11,000 -$0.97 billion 1.40
Source(s): Authors’ estimates using information from Figure 7 and IMPLAN, 2017.
It is worth noting that while a highly automated construction industry would impose significant costs
on displaced construction workers and the middle class, it would also provide benefits. Researchers
at the Economic Policy Institute found that even if robots displace some jobs, other automation
creates jobs (Mishel & Bivens, 2017). Automation has been occurring in the U.S. economy for decades
and has created many jobs in new sectors, offsetting employment losses in particular industries as a
result of technological change. The authors explain:
“Technological change and automation absolutely can, and have, displaced particular workers
in particular economic sectors. But technology and automation also create dynamics (for
example, falling relative prices of goods and services produced with fewer workers) that help
create jobs in other sectors. And even when automation’s job-generating and job-displacing
forces don’t balance out, government policy can largely ensure that automation does not lead
to rising overall unemployment.”
In construction, automation could lead to lower building and maintenance costs, higher per-worker
productivity, reduced rates of human injuries and fatalities, and increased business profits. These
social benefits could spur innovations in both construction and other industries that could create
enough new jobs to offset the displacement of 1.5 million construction workers (Figure 4) and the
resultant consumer-demand loss of about 0.5 million non-construction jobs (Figure 10). However, as
Mishel and Bivens note, public policy will play an important role as technological advancements have
a larger impact on the construction industry.

The Potential Economic Consequences of a Highly Automated Construction Industry
14
Three Public Policy Recommendations
A construction industry that is increasingly reliant on automation will produce both economic
hardship and economic prosperity. Automation has negative impacts from the direct displacement
of workers (Acemoglu & Restrepo, 2017) and from lowering labor’s share of income (Benzell et al.,
2015). Workers replaced by automated technologies suffer unemployment spells– which reduce
current and future earnings– and may accumulate significant debt or even lose their homes. In
addition to financial stresses, a lack of work also tends to cause mental and emotional stresses. In
2013, a Gallup-Healthways Well-Being Index survey found that 16.6 percent of unemployed
Americans are depressed compared to 5.6 percent of Americans who work full time. People who are
employed tend to experience less hopelessness and tend to have a sense of self-worth in feeling like
they are contributing to society. Thus, a highly automated construction industry in the future could
result in higher rates of depression and financial difficulties among blue-collar workers (Kay, 2013).
On the other hand, automation technology has positive productivity effects (Acemoglu & Restrepo,
2017). More IT and computer jobs will be created, for instance, as construction and other sectors
become increasingly reliant on robotics and automation. Construction trades that use heavy
machinery, such as operating engineers, may transform into more technical positions, with a worker operating robots remotely as they build infrastructure safer and faster. These positons will require
higher-skilled workers who will need to be educated and trained in IT, digital technologies, and
coding to maintain and control machines performing tasks previously done by labor.
RECOMMENDATION #1: UTILIZE APPRENTICESHIP PROGRAMS IN THE BUILDING TRADES TO TRAIN NEW
WORKERS AND RE-SKILL CURRENT EMPLOYEES AS SPECIFIC TRADES BECOME MORE AUTOMATED.
In a future with a highly automated construction industry, the best solution will be the one at which
America’s building trades already excels: registered apprenticeship training programs. Contractors,
construction workers, trade unions, and nonprofit organizations should be encouraged to create new
programs or adapt active programs to train workers using new technologies. If certain tasks become
more efficient after they are automated using drones, construction workers should be trained in how
to operate, maintain, and override the drones. Furthermore, cities should expand pre-apprenticeship
programs in public high schools and states should provide tax credits to businesses that offer
apprenticeship programs. For instance, after South Carolina enacted a $1,000 tax credit per
apprentice per year to employers, employer-sponsored apprenticeship programs increased by 570
percent (Olinsky & Ayers, 2013).
Legislators and other elected officials should be discouraged from passing public policies that
weaken registered apprenticeship programs. Trade unions have historically been at the forefront of
worker apprenticeship programs. Across the United States, 79 percent of all apprentice completers
in construction come from joint programs that are funded by contractors and unions (Bilginsoy,
2017). Joint labor-management programs have an even larger role in training construction workers
across the Midwest. The share of active construction apprentices in joint labor-management
programs is 98 percent in Illinois, 94 percent in Indiana, 95 percent in Wisconsin, and 82 percent in
Ohio (Manzo & Bruno, 2016; Philips, 2015a; Philips 2015b; Duncan & Manzo, 2016).
Policies that expand collective bargaining rights or improve industry standards help boost
apprenticeship training, raise worker wages, and ensure good-quality jobs for displaced workers.
States should repeal “right-to-work” legislation, which reduces union membership and decreases

The Potential Economic Consequences of a Highly Automated Construction Industry
15
participation in registered apprenticeship programs. Prevailing wage laws– which are market-based
minimum wages for construction workers employed on projects funded using taxpayer dollars– are
associated with increased apprenticeship training. Apprenticeship enrollments are 6 to 8 percent
higher in states with prevailing wage laws (Bilginsoy, 2005). In states that have repealed their
prevailing wage laws, apprenticeship training has decreased by between 38 and 42 percent (Philips,
2014; Philips et al., 1995). States that repealed or do not have these laws should enact new prevailing
wage legislation to help encourage apprenticeship training.
RECOMMENDATION #2: COLLABORATE WITH EDUCATIONAL INSTITUTIONS TO FOSTER A TRAINED WORKFORCE
PREPARED FOR THE JOBS OF THE FUTURE.
Investments in complementary human capital will also be required to keep up with technological
advancements (Brynjolsson & McAfee, 2012). As long as machines cannot perform 100 percent of the
tasks that humans can complete and are imperfect substitutes, workers will experience a rise in
demand for complementary roles, which can lead to higher wages and higher productivity (Sachs et
al., 2015). Thus, workers– especially those who are displaced by automation– must be provided with
the education and complementary skills to design, produce, operate, and work alongside robots,
drones, and other artificial intelligence technologies (Petroff, 2017).
States and local communities should invest in vocational training and worker re-training to ensure
that displaced construction workers become employed in new sectors and benefit from the potential
gains of an automated construction industry. These investments would require funding and grants
to make postsecondary education more affordable, but would make career transitions easier for
displaced construction workers and improve sectoral mobility in the labor market. Additionally,
states also need to boost investments in science, technology, engineering, and math (STEM)
programs at public elementary and secondary schools (Moavenzadeh et al., 2013).
RECOMMENDATION #3: AS CONSTRUCTION BECOMES MORE AUTOMATED, LAWMAKERS SHOULD CONSIDER
TAXING CAPITAL OWNED BY CONTRACTORS AND INVESTING THE PROCEEDS TO PROGRAMS THAT BENEFIT
YOUNG AND DISPLACED WORKERS.
Redistribution is another possible policy solution to address job losses as the construction industry
becomes more automated. By taxing those who benefit from technological breakthroughs and
reinvesting the proceeds in targeted ways to those who are harmed, lawmakers can produce a win-
win situation. For example, the capital owned by contractors could be taxed and the revenue
generated could be used to invest in vocational education for young workers and re-training
programs for displaced workers. This would “ensure that a pure productivity improvement raises
well-being of all generations” (Sachs et al., 2015).
Alternatively, the proceeds from taxing capital could also be used to provide a fund to pay workers a
basic stipend as their wages or their employment opportunities decline over time (Benzell et al.,
2015). This fund would help compensate for the lack of jobs, helping individuals maintain health
coverage, save for retirement, and live with dignity. This temporary fund would also provide a
stipend to all construction workers and those displaced by new technologies, adding extra financial
support above and beyond unemployment insurance payments. If done right, the fund would help
cushion the blow as automation replaces human jobs (Flowers, 2016).
The Potential Economic Consequences of a Highly Automated Construction Industry
16
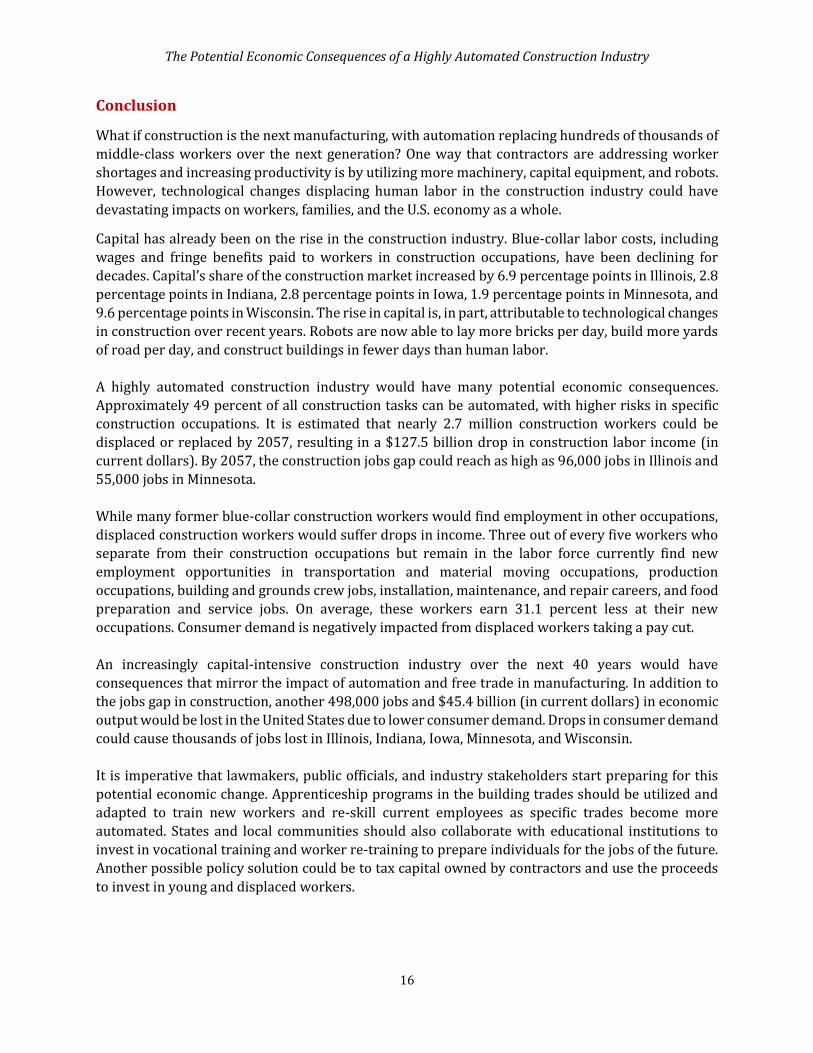
Conclusion
What if construction is the next manufacturing, with automation replacing hundreds of thousands of
middle-class workers over the next generation? One way that contractors are addressing worker
shortages and increasing productivity is by utilizing more machinery, capital equipment, and robots.
However, technological changes displacing human labor in the construction industry could have
devastating impacts on workers, families, and the U.S. economy as a whole.
Capital has already been on the rise in the construction industry. Blue-collar labor costs, including
wages and fringe benefits paid to workers in construction occupations, have been declining for
decades. Capital’s share of the construction market increased by 6.9 percentage points in Illinois, 2.8
percentage points in Indiana, 2.8 percentage points in Iowa, 1.9 percentage points in Minnesota, and
9.6 percentage points in Wisconsin. The rise in capital is, in part, attributable to technological changes
in construction over recent years. Robots are now able to lay more bricks per day, build more yards
of road per day, and construct buildings in fewer days than human labor.
A highly automated construction industry would have many potential economic consequences.
Approximately 49 percent of all construction tasks can be automated, with higher risks in specific construction occupations. It is estimated that nearly 2.7 million construction workers could be
displaced or replaced by 2057, resulting in a $127.5 billion drop in construction labor income (in
current dollars). By 2057, the construction jobs gap could reach as high as 96,000 jobs in Illinois and
55,000 jobs in Minnesota.
While many former blue-collar construction workers would find employment in other occupations,
displaced construction workers would suffer drops in income. Three out of every five workers who
separate from their construction occupations but remain in the labor force currently find new
employment opportunities in transportation and material moving occupations, production
occupations, building and grounds crew jobs, installation, maintenance, and repair careers, and food
preparation and service jobs. On average, these workers earn 31.1 percent less at their new
occupations. Consumer demand is negatively impacted from displaced workers taking a pay cut.
An increasingly capital-intensive construction industry over the next 40 years would have
consequences that mirror the impact of automation and free trade in manufacturing. In addition to
the jobs gap in construction, another 498,000 jobs and $45.4 billion (in current dollars) in economic
output would be lost in the United States due to lower consumer demand. Drops in consumer demand
could cause thousands of jobs lost in Illinois, Indiana, Iowa, Minnesota, and Wisconsin.
It is imperative that lawmakers, public officials, and industry stakeholders start preparing for this
potential economic change. Apprenticeship programs in the building trades should be utilized and
adapted to train new workers and re-skill current employees as specific trades become more
automated. States and local communities should also collaborate with educational institutions to
invest in vocational training and worker re-training to prepare individuals for the jobs of the future.
Another possible policy solution could be to tax capital owned by contractors and use the proceeds
to invest in young and displaced workers.

The Potential Economic Consequences of a Highly Automated Construction Industry
17
The world is changing fast. An increasingly capital-intensive construction industry could cause both
economic prosperity and economic hardship. However, proactive steps can be taken to ensure that
the benefits of a highly automated construction industry are shared broadly across the economy.
Sources
Acemoglu, Daron and Pascual Restrepo. (2017). Robots and Jobs: Evidence from US Labor Markets.
National Bureau of Economic Research.
AGC of America. (2017). “Construction Data.”
American Society of Civil Engineers (ASCE). (2017). “2017 Infrastructure Report Card: A
Comprehensive Assessment of America’s Infrastructure.”
Autor, David; David Dorn; and Gordon Hanson. (2012). The China Syndrome: Local Labor Market
Effects of Import Competition in the United States. National Bureau of Economic Research.
Benzell, Seth; Laurence Kotlikoff; Guillermo LaGarda; and Jeffrey D. Sachs. (2015). Robots Are Us:
Some Economics of Human Replacement. National Bureau of Economic Research.
Bilginsoy, Cihan. (2017). Presentation at the 19th Annual National Alliance for Fair Contracting
(NAFC) Conference.
Bilginsoy, Cihan. (2005). “Wage Regulation and Training: The Impact of State Prevailing Wage Laws
on Apprenticeship.” The Economics of Prevailing Wage Laws. Editors: Hamid Azari-Rad, Peter
Philips, and Mark Prus. 149-168
Bruno, Robert and Frank Manzo IV. (2016). The Impact of Apprenticeship Programs in Illinois: An
Analysis of Economic and Social Effects. University of Illinois at Urbana-Champaign and the
Illinois Economic Policy Institute.
Brynjolfsson, Erik and Andrew McAfee. (2012). Race Against the Machine: How the Digital Revolution
Is Accelerating Innovation, Driving Productivity, and Irreversibly Transforming Employment
and The Economy. The MIT Center for Digital Business.
Bureau of Economic Analysis (BEA). (2017). “Regional Data.” U.S. Department of Commerce.
Bureau of Labor Statistics (BLS). (2017). “May 2016 State Occupational Employment and Wage
Estimates.” Occupational Employment Statistics.
Bureau of Labor Statistics (BLS). (2017). “Databases, Tables & Calculators by Subject.”
Bureau of Labor Statistics (BLS). (2016). “Region of Residence: Annual Expenditure Means, Shares,
Standard Errors, and Coefficients of Variation.” Consumer Expenditure Survey.
Bureau of Labor Statistics (BLS). (2015). “Employment Projections — 2014-24.”
Bureau of Labor Statistics (BLS). (2015). “Occupational Employment Projections to 2024.” Monthly
Labor Review.

The Potential Economic Consequences of a Highly Automated Construction Industry
18
Cocco, Federica. (2016). “Most US Manufacturing Jobs Lost to Technology, Not Trade.” Financial
Times.
Duncan, Kevin; Lameck Onsarigo; Alan Atalah; and Frank Manzo IV. (2017). The Economic, Fiscal, and
Social Effects of Ohio’s Prevailing Wage Law. Colorado State University-Pueblo, Kent State
University, Bowling Green State University, Illinois Economic Policy Institute.
Everly, Rachael. (2017). “3 Ways Automation Will Change the Construction Industry.” Inman.
Flood, Sarah; Miriam King; Steven Ruggles; and J. Robert Warren. (2017). Integrated Public Use
Microdata Series, Current Population Survey: Version 5.0. [dataset]. Minneapolis: University
of Minnesota. https://doi.org/10.18128/D030.V5.0.
Flowers, Andrew. (2016). “What Would Happen If We Just Gave People Money?” FiveThirtyEight.
Frey, Carl Benedik and Michael A. Osborne. (2013). The Future of Employment: How Susceptible are
Jobs to Computerisation? University of Oxford.
Gannett, Andrea Kay. (2013). “At Work: Job, Self-Esteem Tied Tightly Together.” USA Today.
Glaser, April and Rani Molla. (2017). “The Construction Industry is Short on Human Workers and
Ripe for a Robotic Takeover.” Recode.
Hicks, Michael and Srikant Devaraj. (2017). The Myth and Reality of Manufacturing in America. Ball
State University.
Hoosiers by the Numbers. (2017). “Occupational Projections (Long Term).” Indiana Department of
Workforce Development.
Illinois Department of Employment Security (IDES). (2017). “Employment Projections.”
IMPLAN Group LLC. (2017). IMPLAN System (data and software).
Iowa Workforce Development. (2017). “Occupational Projections.”
Johnson, David. (2017). “Find Out If a Robot Will Take Your Job – McKinsey & Company Estimates.”
Time.
Kimball, Will and Robert Scott. (2014). China Trade, Outsourcing and Jobs. Economic Policy
Institute.
Leopold, Till Alexander; Vesselina Ratcheva; and Saadia Zahidi. (2016). The Future of Jobs:
Employment, Skills and Workforce Strategy for the Fourth Industrial Revolution. World
Economic Forum.
ManpowerGroup. (2016). “The Skills Revolution: Digitization and Why Skills and Talent Matter.”
Manyika, James; Michael Chui; Mehdi Miremadi; Jacques Bughin; Katy George; Paul Willmott; and
Martin Dewhurst. (2017a). Harnessing Automation for a Future that Works. McKinsey Global
Institute.
Manyika, James; Susan Lund; Micahel Chui; Jacques Bughin; Jonathan Woetzel; Parul Batra; Ryan Ko;
and Saurabh Sanghvi. (2017b). Jobs Lost, Jobs Gained: Workforce Transitions in a Time of
Automation. McKinsey Global Institute.

The Potential Economic Consequences of a Highly Automated Construction Industry
19
Manzo IV, Frank; Alex Lantsberg; and Kevin Duncan. (2016). The Economic, Fiscal, and Social Impacts
of State Prevailing Wage Laws: Choosing Between the High Road and the Low Road in the
Construction Industry. Illinois Economic Policy Institute, Smart Cities Prevail, and Colorado
State University-Pueblo.
McRae, Mike. (2017). “Unsettling New Statistics Reveal Just How Quickly Robots Can Replace Human
Workers.” Science Alert.
Minnesota Employment and Economic Development. (2017). “Employment Outlook Projections.”
Mishel, Lawrence and John Bivens. (2017). The Zombie Robot Argument Lurches On. Economic Policy
Institute.
Moavenzadeh, John; Mazine Bernard; Craig A. Giffi; and Dorothy Powers. (2013). Manufacturing for
Growth Strategies for Driving Growth and Employment. World Economic Form.
Murphy, Margi. (2017). “This Bricklaying Robot is Going to Destroy Construction Jobs.” New York
Post.
Olinksy, Ben and Sarah Ayres. (2013). Training for Success: A Policy to Expand Apprenticeships in the
United States. Center for American Progress.
Orlove, Raphael. (2012). “This Machine Prints Brick Roads.” Jalopnik.
Pash, Chris. (2016). “VIDEO: A One-Armed Australian Robot Can Build a House Four Times Quicker
Than a Brickie.” Business Insider Australia.
Peetros, Nicholas T. Sr. (2016). “How High-Tech Advances in Construction are Changing Our
Industry.” LinkedIn.
Peiffer, Emily. (2017). “10 Construction Industry Trends to Watch in 2017.” Construction Dive.
Petroff, Alanna. (2017). “U.S. Workers Face Higher Risk of Being Replaced by Robots. Here's Why.”
CNN Tech.
Philips, Peter. (2015a). Indiana’s Common Construction Wage Law: An Economic Impact Analysis.
University of Utah.
Philips, Peter. (2015b). Wisconsin’s Prevailing-Wage Law: An Economic Impact Analysis. University of
Utah.
Philips, Peter. (2014). Kentucky’s Prevailing Wage Law: An Economic Impact Analysis. University of
Utah.
Philips, Peter; Garth Mangum; Norm Waitzman; and Anne Yeagle. (1995). Losing Ground: Lessons
from the Repeal of Nine "Little Davis-Bacon" Acts. University of Utah.
Piketty, Thomas. (2014). Capital in the Twenty-First Century. The Belknap Press of Harvard University
Press.
PricewaterhouseCoopers (PwC). (2017). “Will Robots Steal Our Jobs? The Potential Impact of
Automation on the UK and Other Major Economies.” UK Economic Outlook.

The Potential Economic Consequences of a Highly Automated Construction Industry
20
Sachs, Jeffrey; Seth Benzell; and Guillermo LaGarda. (2015). Robots: Curse or Blessing? A Basic
Framework. National Bureau of Economic Research.
The Guardian. (2015). “Chinese Build 57-Storey Skyscraper in 19 Days.”
Wisconsin’s Worknet. (2017). “Occupation Projections.”
U.S. Census Bureau. (2012). “Construction: Geographic Area Series: Detailed Statistics for the State.”
American FactFinder.
U.S. Department of the Treasury Office of Economic Policy. (2014). Expanding our Nation’s
Infrastructure through Innovative Financing.
Cover Photo Credits
Bailly, Marc. (2017). “Robotics in Construction.” Boy Meets Robots.
Dillow, Clay. (2016). “The Construction Industry Is in Love with Drones.” Picture by 3D Robotics.
Fortune.
Heaton, Andrew. (2015). “Are Robots the Future of Construction Sites?” Sourceable.
Jacobson, Don. (2013). “Robots Replace Humans When Structures Must be Demolished.” Picture by
Elizabeth Flores. StarTribune.
The Potential Economic Consequences of a Highly Automated Construction Industry
21
Appendix
Figure A: The Automation Potential of 5 Construction Trades Based on Tasks Robots Can Do Construction Trade
(Percent of Job that Can be Automated) Tasks a Robot CAN Do Tasks a Robot CAN’T Do
Construction Laborers
(35%)
• Break up rock, asphalt, or concrete • Operate heavy-duty construction or installation equipment • Operate pumps or compressors • Mark reference points on construction materials • Apply sealants or other protective coatings • Apply paint to surfaces • Smooth surfaces with abrasive materials or tools • Prepare hazardous waste for processing or disposal • Prepare explosives for detonation • Spread concrete or other aggregate mixtures • Pour materials into or on designated areas • Mix substances or compounds needed for work activities • Test air quality at work sites • Review blueprints or specifications to determine work requirements
• Signal equipment operators to indicate proper equipment positioning • Maintain construction tools or equipment • Install plumbing or piping • Position structural components • Position construction forms or molds • Dismantle equipment or temporary structures • Direct vehicle traffic • Install green structural components, equipment or systems • Assemble temporary equipment or structures • Install masonry materials • Install insulation in equipment or structures • Move construction or extraction materials to locations where they are needed • Finish concrete surfaces • Compact materials to create level bases • Assist skilled construction or extraction personnel • Dig holes or trenches • Load or unload materials used in construction or extraction • Remove worn, damaged or outdated materials from work areas • Protect structures or surfaces near work areas to avoid damage • Clean surfaces in preparation for work activities • Clean equipment or facilities • Clean work sites • Measure work site dimensions
Carpenters (50%)
• Order construction or extraction materials or equipment • Record operational or environmental data • Mark reference points on construction materials • Apply material to fill gaps in surfaces • Build construction forms or molds • Weld metal components • Prepare hazardous waste for processing or disposal • Cut wood components for installation • Mix substances or compounds needed for work activities • Select construction materials • Estimate construction project costs • Measure materials or objects for installation or assembly • Review blueprints or specifications to determine work requirements
• Coordinate construction project activities • Direct construction or extraction personnel • Prepare operational reports • Apply decorative or textured finishes or coverings • Drill holes in construction materials • Fabricate parts or components • Position construction forms or molds • Position safety or support equipment • Assemble products or production equipment • Install wooden structural components • Install doors or windows • Install building fixtures • Install trim or paneling • Install safety or support equipment • Assemble temporary equipment or structures • Install carpet or flooring • Dig holes or trenches • Remove worn, damaged or outdated materials from work areas • Clean work sites • Verify alignment of structures or equipment • Inspect work sites to determine condition or necessary repairs
Electricians (42%)
• Order construction or extraction materials or equipment • Train construction or extraction personnel • Thread wire or cable through ducts or conduits • Update job related knowledge or skills • Estimate construction project costs
• Direct construction or extraction personnel • Communicate with other construction or extraction personnel to discuss project details • Prepare operational reports • Repair electrical equipment • Fabricate parts or components • Install electrical components, equipment, or systems • Assist skilled construction or extraction personnel • Dig holes or trenches

The Potential Economic Consequences of a Highly Automated Construction Industry
22
• Test electrical equipment or systems to ensure proper functioning • Inspect electrical or electronic systems for defects
• Plan layout of construction, installation, or repairs • Create construction or installation diagrams
Plumbers, Pipefitters, and
Steamfitters (50%)
• Record operational or environmental data • Operate pumps or compressors • Mark reference points on construction materials • Weld metal components • Cut metal components for installation • Cut openings in existing structures • Select construction materials • Estimate construction project labor requirements • Estimate construction project costs • Measure materials or objects for installation or assembly • Inspect plumbing systems or fixtures • Review blueprints or specifications to determine work requirements
• Direct construction or extraction personnel • Communicate with clients about products, procedures, and policies • Maintain plumbing structures or fixtures • Install plumbing or piping • Install green plumbing or water handling systems • Drill holes in construction materials • Fabricate parts or components • Install solar energy systems • Install gauges or controls • Remove worn, damaged or outdated materials from work areas • Clean equipment or facilities • Plan layout of construction, installation, or repairs • Create construction or installation diagrams • Estimate materials requirements for projects • Inspect work sites to identify potential environmental or safety hazards • Inspect work sites to determine condition or necessary repairs • Test green technology installations to verify performance
Operating Engineers
(88%)
• Signal equipment operators to indicate proper equipment positioning • Record operational or environmental data • Maintain construction tools or equipment • Drive trucks or truck-mounted equipment • Operate equipment or vehicles to clear construction sites or move materials • Operate road-surfacing equipment • Operate heavy-duty construction or installation equipment • Operate pumps or compressors • Position construction or extraction equipment • Compact materials to create level bases • Load or unload materials used in construction or extraction • Remove debris or vegetation from work sites • Update job related knowledge or skills • Select construction equipment • Estimate construction project costs • Test air quality at work sites • Monitor construction operations • Review blueprints or specifications to determine work requirements
• Communicate with clients about products, procedures, and policies • Install equipment attachments or components • Move construction or extraction materials to locations where they are needed • Assist skilled construction or extraction personnel • Locate equipment or materials in need of repair or replacement
Source(s): Johnson, 2017 – McKinsey & Company estimates.