the potential of eliminating government subsidies in the
TRANSCRIPT

The Potential of Eliminating
Government Subsidies in the Wind
Power Business Case
- A business assessment from a technological
perspective at E.ON Vind

i

ii
Preface This project marks the end of our master’s studies in Industrial Engineering
and Management, at the Faculty of Engineering, Lund University. Spending
the spring at E.ON Vind has truly been an inspiring time and has given us
the opportunity to learn more about the wind power industry.
We would like to take this opportunity to thank everyone at E.ON Vind for
all the support and the willingness to take time to contribute to this project.
Also, a special thanks to our supervisor Henrik Malmberg for giving us the
chance to perform this study and with his professionalism and passion
inspired us to work our hardest.
We would also like to thank our never-ending source of industrial wisdom –
Bertil I. Nilsson – for his guidance and support during this project. His
valuable insights as well as the feedback given by our opponents – Hannes
Teder and Gustav Wiklund – have helped us in producing this report.
Lund 2012-06-01
Gustaf Heverius Mohammed Younis

iii
iv
Abstract
Title The Road to Profitability through Technology
Development.
- A wind power business assessment at E.ON
Vind.
Authors Gustaf Heverius – Master of Science in
Industrial Engineering and Management.
Mohammed Younis – Master of Science in
Industrial Engineering and Management.
Supervisors Henrik Malmberg – Team leader, Project
Development, E.ON Vind Sverige AB.
Bertil I. Nilsson – Adjunct Professor, Department
of Industrial Management and Logistics, Lund
Institute of Technology, Lund University.
Issue of study For the past ten years there has been a
remarkable growth in the wind power industry.
During 2003 – 2010 the production capacity
increased by 456 % in Sweden, corresponding
to total capacity of 2019 MW. An additional 754
MW was installed in 2011, and there is a
planned capacity installation of 950 MW for
2012. This will, according to a prognosis from
Svensk Vindenergi, generate a power production
of 7.7 TWh in 2012 and 11 TWh in 2013.
Furthermore, if the expansion continues at this
rate, wind power will correspond to about 10 %
of the total power production in Sweden by
2015.
Despite the rapid growth wind power projects
are still dependent on government subsidies, i.e.
green certificates. However, as the business
continues to grow so do the technological
advancements, thus providing new and more
efficient wind turbine designs. Both incremental

v
as well as novel solutions have been developed
over the years. In order to find new dominant
designs they need to be evaluated both from a
technical and a business point of view.
Purpose The purpose of this study is to investigate the
possibility for technology development to further
strengthen the Swedish wind power business
case, and ultimately examine the potential for
eliminating the need for government subsidies.
Objectives The objectives of this thesis are the following:
Scan for trends in technology development
and choose areas according to the scope
and delimitations of the study.
Evaluate the chosen technical areas – both
financial and non-financial aspects.
Depending on the outcome in the previous
evaluation discuss the implications for the
case company.
Methodology A case study with an analytical approach has
been performed for the development of the
evaluation method, which consists of both
qualitative and financial measurements. The
qualitative aspect is covered by a method for
technology concept selection, which assesses
technologies based on several criteria. These
criteria have been developed through literature
studies and interviews with concerned
stakeholders in the wind power industry. The
financial aspect is covered by a capital
budgeting model, intended to assess the cost of
the wind power case including all costs over its
lifetime, capital expenditure, operations and
maintenance, and cost of capital.
Conclusion A potential for single technology advancements
to sustain the business case’s independence
from green certificates has been identified. The

vi
technological development is mainly focused on
increasing turbine size, i.e. generator output and
rotor diameter. However, other incremental
implementations have shown potential of
business case improvements as well.
Key words Green certificates, technology development, onshore wind power, wind turbine generator (WTGs), business case evaluation

vii

viii
Table of contents
1. Introduction .......................................................................................................... 1
1.1 Background ............................................................................................... 1
1.2 Issue of study ............................................................................................ 2
1.3 Purpose ..................................................................................................... 4
1.4 Objectives.................................................................................................. 4
1.5 Delimitations ............................................................................................. 5
1.6 Target group .............................................................................................. 5
1.7 Report outline ........................................................................................... 5
2. Methodology ....................................................................................................... 9
2.1 General characteristics of the study ............................................................... 9
2.2 Methodological approach ............................................................................. 10
2.3 Research strategies ....................................................................................... 12
2.4 Data collection .............................................................................................. 13
2.5 Qualitative and quantitative data ................................................................. 17
2.6 Credibility ...................................................................................................... 18
2.7 Source criticism ............................................................................................. 18
3. Theoretical framework ..................................................................................... 21
3.1 Wind power theory ....................................................................................... 21
3.2 Capital budgeting .......................................................................................... 23
3.2 Technology concept selection....................................................................... 33
3.3 Strategic decision making ............................................................................. 35
3.4 Linking theory with the study ....................................................................... 36
4. Case company - E.ON Vind .................................................................................. 39
4.1 E.ON Vind ...................................................................................................... 39
5. Wind turbine design ......................................................................................... 43
5.1 General design layouts .................................................................................. 43
5.2 Foundation .................................................................................................... 44

ix
5.3 Tower ............................................................................................................ 44
5.4 Rotor ............................................................................................................. 46
5.5 Control system .............................................................................................. 48
5.6 Nacelle and yaw control................................................................................ 48
5.7 Drive train ..................................................................................................... 49
5.8 Gearbox ......................................................................................................... 49
5.9 Generator ...................................................................................................... 50
5.10 Transformer ................................................................................................ 51
5.11 Vestas V90 – reference site turbine ............................................................ 52
6. Technology development ............................................................................... 53
6.1 Rock anchoring foundations ......................................................................... 53
6.2 Jointed blades ............................................................................................... 56
6.3 Tower ............................................................................................................ 57
6.4 Erection methods .......................................................................................... 61
6.5 Individual blade pitch control with laser ...................................................... 62
6.6 De-icing system ............................................................................................. 62
6.7 Synchronous generators ............................................................................... 64
6.8 Voltage converters ........................................................................................ 65
7. Business case evaluation model ......................................................................... 67
7.1 Building the model ........................................................................................ 67
7.2 Financial model ............................................................................................. 69
7.3 Decision matrix ............................................................................................. 71
7.4 Combining the financial and qualitative aspects .......................................... 73
7.5 Validating the model ..................................................................................... 74
8. Applying the model ............................................................................................. 75
8.1 Choice of reference site ................................................................................ 75
8.2 Assumptions regarding financial input ......................................................... 75
8.3 Overview decision alternatives ..................................................................... 76

x
8.4 First round results - Performance ................................................................. 77
8.4 First round results - OPEX ............................................................................. 88
8.5 First round results - CAPEX............................................................................ 94
9. Additional evaluation rounds ........................................................................ 101
9.1 Second round results - Performance .......................................................... 101
9.2 Second round results – OPEX ...................................................................... 103
9.3 Second round results - CAPEX ..................................................................... 103
9.4 Third round results ...................................................................................... 104
9.5 Sensitivity analysis ...................................................................................... 106
10. Discussion..................................................................................................... 111
10.1 First evaluation round ............................................................................... 111
10.2 Second evaluation round .......................................................................... 115
10.3 Third evaluation round ............................................................................. 116
10.4 Sensitivity analysis .................................................................................... 117
11. Conclusions and final remarks .................................................................. 119
11.1 Conclusions and suggested actions .......................................................... 119
11.2 Final remarks ............................................................................................. 122
12. References ...................................................................................................... 125
Printed sources ................................................................................................. 125
Articles .............................................................................................................. 127
Internet sources ................................................................................................ 128
Interviews.......................................................................................................... 129
Appendix 1. Nordpool electricity prices 2006 - 2012 ......................................... i
Appendix 2. LCOE formula .................................................................................. iii
Appendix 3. Overview of financial input ............................................................. iv
Appendix 4. Results from qualitative assessment .......................................... xix

xi

1
1. Introduction This chapter is intended to provide the reader with the background of this
thesis. The current situation in the wind power industry is initially presented
in order to give the reader an understanding of the purpose and objectives
of the thesis. Furthermore, delimitations and target group are presented.
1.1 Background
E.ON is one of the largest investor-owned power and gas companies in the
world, and operates globally in a wide range of businesses within the
energy sector. In recent years increased efforts have been focused towards
the expansion of renewable energy production, where wind power plays a
key role.
By the end of 2007 the power production from wind turbines in Sweden
amounted to 1.43 TWh, corresponding to approximately 1 % of the total
power production.1 The same year, EU adopted the 20/20/20 target, which
states that the union’s greenhouse gas emissions are to be reduced by 20
% by the year 2020, relative to 1990 emission levels. The EU target
furthermore states that 20 % of the energy consumption should come from
renewable energy sources.2
Consequently, this demand for renewable energy has led to the
introduction of financial incentives for the development of wind power
production. The Swedish green certificate system is a market-based
support system, intended to stimulate the expansion of power production
from renewable sources. Producers of renewable electricity are allocated
one certificate unit for every MWh they produce, which are then sold to
suppliers who are obligated to purchase a certain quota of certificates.3 The
1 Energimyndigheten (2011c)
2 Energimyndigheten (2011a)
3 Swedish Energy Agency (2011)
2
Swedish national aim is that by 2020 the production of electricity from such
sources shall amount to 25 TWh annually.4 In addition, the Swedish
government has set up a planning framework for wind power development
equivalent to an annual production capacity of 30 TWh, of which 20 TWh
onshore and 10 TWh offshore.5
For the past ten years there has been a remarkable growth in the wind
power industry. During 2003 – 2010 the production capacity increased by
456 % in Sweden, corresponding to total capacity of 2019 MW.6 An
additional 754 MW was installed in 2011, and there is a planned capacity
installation of 950 MW for 2012.7 This will, according to a prognosis from
Svensk Vindenergi, generate a power production of 7.7 TWh in 2012 and
11 TWh in 2013. Furthermore, if the expansion continues at this rate, wind
power will correspond to about 10 % of the total power production in
Sweden by 2015.
Despite the rapid growth wind power projects are still dependent on
government subsidies, i.e. green certificates. However, as the business
continues to grow so do the technological advancements, thus providing
new and more efficient wind turbine designs. Both incremental as well as
novel solutions have been developed over the years. In order to find new
dominant designs they need to be evaluated both from a technical and a
business point of view.
1.2 Issue of study
Technology development
The first mass-produced wind turbines had an average output of about 22
kW, which at the beginning of the 1990s had increased to approximately
4 Energimyndigheten (2011a)
5 Näringsdepartementet (2010)
6 Energimyndigheten (2011a)
7 Vindkraftsnytt (2012)
3
200 kW.8 Today there are turbines with an output of several megawatts,
ranging from 2-5 MW, and even larger including turbines at the prototype
stage. However, the average capacity for installed wind turbines in Sweden
was 1.9 MW in 2010, which is an increase from 0.6 MW in 2003.9
Alongside with the increase in turbine output, there has been a gradual
development towards larger turbines, e.g. higher towers and longer rotor
blades. Furthermore, incremental design changes have continuously been
developed in order to achieve more efficient turbines, and subsequently
improved profitability.
Currently, the typical WTG (wind turbine generator) for large-scale
commercial use is a horizontal three-blade turbine around 2 MW, with a
welded steel tower. The conceptual design of these turbines are similar,
however, technical features differ depending on the manufacturer.
Maturing market
In 2004 the Swedish Energy Agency specified a number of sites considered
particularly suitable as wind power locations. Furthermore, in 2008
additional sites were included, adding up to a total of 2.2 % of Sweden’s
surface.10 As the expansion continues, the competition for the most
favorable sites hardens.
This growth has also led to a shift in the power balance between different
stakeholders. From being a technology mostly applicable on a small scale
by individual energy consumers, today’s turbines are used in large-scale
commercial projects.11 This naturally provides commercial developers with
more leverage over turbine manufacturers. Furthermore, on the
manufacturer side, the playing field have become somewhat leveled as 8 Energimyndigheten (2011c)
9 Ibid.
10 Energimyndigheten (2011b)
11 Malmberg (2012)

4
new entrants are emerging, seeking market positions in the growing wind
power industry, while existing suppliers seek to consolidate their positions.
The larger, more established, manufacturers such as Vestas, Enercon, and
Gamesa have faced a decline in activity over the years, while others such
as GE Wind, Siemens, and Repower have increased their market shares.12
In the current situation, with an increasing number of suppliers, the
developers are given a wider range of choices, thus enabling them to
influence the development of technology in the desired direction. This is an
important premise given the described situation, i.e. the dependency of
green certificates and the limited number of appropriate sites. As the focus
on these aspect surfaces it becomes clear that new turbine designs will be
required to continue the expansion at the current pace.
1.3 Purpose
The purpose of this study is to investigate the possibility for technology
development to further strengthen the Swedish wind power business case,
and ultimately examine the potential for eliminating the need for
government subsidies.
1.4 Objectives
The above described purpose will be achieved through the following
objectives:
Scan for trends in technology development and choose areas
according to the scope and delimitations of the study.
Evaluate the chosen technical areas – both financial and non-
financial aspects.
Depending on the outcome in the previous evaluation discuss the
implications for the case company.
12
Engström et al. (2010)

5
1.5 Delimitations
Delimitations are established with regards to the project timeframe. This
thesis will focus on commercial onshore projects within the wind power
industry in Sweden.
1.6 Target group
The target group for this thesis is the wind power industry as a whole, but
more specifically stakeholders within wind power project development.
1.7 Report outline Chapter 1: Introduction – This chapter is intended to provide the reader with
the background of this thesis. The current situation in the wind power
industry is initially presented in order to give the reader an understanding of
the purpose and objectives of the thesis. Furthermore, delimitations and
target group are presented.
Chapter 2: Methodology – In this chapter an overview of the methodological
choices that have been made are presented and discussed. Initially, in
order to understand the choices made the general characteristic of the
thesis is discussed. Subsequently, the chosen methodological approach,
which is central to this study, is presented along with the research strategy
and data collection methods.
Chapter 3: Theoretical framework – This chapter presents the theoretical
framework used for this thesis. The presented framework has been chosen
as a result of the methodical approach and the evaluation model. At first,
the theoretical background regarding general wind energy is highlighted.
Then, the theory that will constitute the business evaluation method is
presented. At first, the necessary financial aspects concerning investment
appraisal will be accounted for. The second aspect is the qualitative
measure which implies a more strategic approach. For this measure a

6
concept selection method will be presented along with the SWOT analysis.
All tables and figures in this chapter have been produced by the authors.
Chapter 4: Case company – E.ON Vind – This chapter is intended to
provide a short insight to the case company and the activities involved in
the process of developing, constructing and operating onshore wind farm
projects.
Chapter 5: Wind turbine design – This chapter presents the current
characteristics in wind turbine technology. More specifically, the
fundamental parts of the wind turbine, including foundation, tower and
machine house, will be described in different possible layouts. It is
necessary to understand the historic trends and limitations affecting
technology development leading up to now. This will help understand
chosen focus areas in chapter 6.
Chapter 6: Technology development – In this chapter the chosen areas of
technology are presented, which are a result of the initial screening
process. They constitute the different aspects of the WTG that will be
further analyzed in the evaluation model. In this chapter only their
technological features are described. A more detailed reasoning for
including them in the study is later discussed in chapter 7.
Chapter 7: Business case evaluation method – This chapter will further
describe the evaluation method, consisting of the financial model and the
measuring of qualitative aspects. First, the model as a whole is discussed,
followed by a review of each component regarding the underlying
assumptions. Finally, the testing and validation of the model will be
discussed.
Chapter 8: Applying the model – In this chapter the initial results from the
business case evaluation is presented. A more extensive discussion
regarding financial input parameters will follow. In addition, a sensitivity

7
analyses in the qualitative dimension will be done by considering the
criteria for each decision. Moreover, the second evaluation round will be
presented. For detailed information regarding input parameters and
assumptions made, see Appendix 3. Also, in appendix 4 the full results of
the qualitative evaluation can be found.
Chapter 9: Additional evaluation rounds – This chapter will present the
evaluation rounds following the previous results, as well as a sensitivity
analysis regarding the final results. Further evaluation rounds were
performed after having analyzed the initial outcome. Some of the areas
were chosen to be examined further with the aim of applying a more
systemic approach and thus performing more detailed estimations
regarding some of the cost structures. Finally, a sensitivity analysis is
performed regarding uncertain parameters in the financial model.
Chapter 10: Discussion – This chapter is intended to present further
discussions regarding the outcome of the business model evaluation, as
well as the sensitivity analysis concerning the results.
Chapter 11: Conclusions and final remarks – In this final chapter,
conclusions relating to the purpose and objectives are presented.
Furthermore, the general credibility of the evaluation model and results are
discussed. Finally, remarks regarding improvements and areas for further
study are suggested.

8

9
2. Methodology
The aim of this chapter is to provide an overview of the methodological
choices that have been made. Initially, in order to understand these choices
the general characteristic and aim of the thesis is discussed. Subsequently,
the chosen methodological approach, which is central to this study, is
presented along with the research strategy and data collection methods.
2.1 General characteristics of the study
In accordance with the first objective an initial screening process was
conducted. Both existing and new technological areas that were considered
to potentially have an impact on the business case were examined. The
second objective consists of two different aspects that make up for the
evaluation of each technology area. The first aspect of measure is strictly
financial, with the aim of analyzing the financial impact of chosen
technological areas. The second dimension aims to cover all those aspects
that are not quantifiable as input in a financial model. The purpose of this
was to establish a more comprehensive view of the business case.
Moreover, the impact of each technology was subject to a comparative
analysis with a specific business case, which was chosen to represent a
reference point. The intersection of the two dimensions represented the
chosen reference site.
A financial model was established in order to perform the calculations
required by the case company for their investment decisions. The model
was intended for providing a quick but accurate assessment of specific
parameters to be compared with other business case evaluations. Since
each case was subject to the same simplifications and assumptions it is
possible to establish their relative financial status.
The qualitative dimension was examined together with key stakeholders in
the industry. More specifically, surveys were distributed, section 2.3, with

10
the aim to measure the qualitative aspects of chosen areas relative to the
corresponding solution at the reference site. Preceding interviews were
held with employees at the case company as a part of the initial screening
process. Furthermore, the outcome of these interviews, together with a
SWOT analysis, was used for generating the qualitative measures used in
the surveys.
2.2 Methodological approach
When conducting business research there are three different
methodological approaches to be considered13; the analytical, systems, and
actors approach, according to Arbnor & Bjerke (1997).
Analytical approach
The analytical approach assumes that reality has a summative character,
i.e. the whole is the sum of its parts.14 Accordingly, once the researcher
learns about the different parts of the whole, they can be added together to
obtain the whole picture. The knowledge generated from this approach is
characterized as being independent of the observer, which means that
knowledge advances by means of formal logic represented by specific
judgments independent of subjective experiences.15 Therefore, the result of
the analytical approach provides pure cause-effect relations, logical
models, and representative cases.16
Systems approach
The systems approach, which partly originated as a reaction to the
analytical, is based on the assumption that reality is arranged in such a way
that the whole differs from the sum of its parts. This means that the
relationship between the parts is just as essential as the parts themselves,
13
Arbnor & Bjerke (1997) 14
Ibid. 15
Ibid. 16
Ibid.

11
due to synergy effects. The knowledge developed through this approach
depends on systems, i.e. the parts are explained or understood through the
characteristics of the whole, of which they are part.17
Actors approach
The actors approach states that the whole is understood by the
characteristics of its parts, assuming that reality is a social construction
intentionally created by processes at different levels of meaning structures.
Knowledge is therefore based on actors, or individuals, where the whole is
understood through the individuals finite provinces of meaning. Along with
metatheories and other contributions the researcher is trying to understand
relations among interpretations made by actors. These relations are various
interpretations and factors mutually, and in constant transformation,
influencing each other in a continuous developmental process.18
Choice of approach
The analytical approach was chosen for this thesis, since it enables the
study of each variable in closer detail. The system was comprised of a
single WTG, which ultimately was seen as part of the greater system, i.e.
the general business case at the case company. While isolating all
elements and then modifying them one at a time, the aim was to conclude
rules that allows for the prediction of properties for a general system.
However, the value of the analytical approach depends on the level of
complexity in the studied system, where in a highly complex system it might
be preferable to have a systemic approach. When aiming at deriving the
optimal business case, the level of complexity rises due to the many more
aspects needed to be taken into consideration, compared to when isolating
elements of a single WTG. Therefore, there is a need to investigate
potential synergy effects that are the result of single variable alterations.
17
Arbnor & Bjerke (1997) 18
Ibid.

12
This aspect will be discussed at a later stage in the report. Finally, the
actors approach is not considered appropriate for this study.
2.3 Research strategies
Depending on the character and aim of the research, there are several
strategies to be considered. The four most relevant, regarding master
thesis projects within applied science, are survey, case study, experiment
and action research.19
The approach for a survey is characterized by the study of a phenomenon
within a broad research area at a specific time, dependant on the use of
empirical data.20 Conclusions, regarding the target population, can be made
by applying the survey on a chosen sample of the population, assuming the
sample correctly represents the target population.21
The purpose of case studies is to describe an object or phenomenon in
order to gain a deeper understanding of the area of study. This can be
done by combining different types of data, as well as several research
methods, which is encouraged when conducting a case study.22 An
important issue regarding case studies is the general application of the
results, where one can argue that it is not possible to draw any general
conclusions regarding a target population from the results of one specific
case. However, it can also be argued that even if the case is unique in
some regards it is possible to place it in a wider context and therefore be
able to draw conclusions regarding similar cases that share important
characteristics.23
19
Höst et al (2006) 20
Denscombe (2009) 21
Lekvall & Wahlbin (2001) 22
Denscombe (2009) 23
Ibid.

13
An experiment is usually conducted with the aim of establishing the cause
for the changes in the case issue at hand. The purpose is to determine the
dependant variables from the independent variables, why it is important to
arrange the experiment in such a way so that the results confirm this
relationship.24
The fourth and final research strategy is action research, which is
characterized by the desire to not only gain a better understanding of a
phenomenon, but also manage a change within the studied issue. The
process is iterative, where the initial results provide a suggested solution,
which is then implemented and evaluated. The evaluation will subsequently
be the basis for further studies, as this process is repeated until a desired
solution is obtained.25
Choice of research strategy
The case study was considered to fit the overall purpose of the thesis. It is
also compatible with the choice of the analytical approach. The studied
reference site and the business case it represents were chosen as the case
study. Also, the written survey strategy was included in this study as a part
of the qualitative evaluation.
2.4 Data collection
It is important to distinguish between two types of data. Secondary data is
information that has already been gathered and presented elsewhere.
Primary data on the other hand is collected by the researcher from the
original source, e.g. through interviews and observations. Research based
solely on primary data rarely exists, however, it is possible to conduct
research entirely based on secondary data, why it is important to scan for
24
Denscombe (2009) 25
Ibid.

14
existing data before gathering primary. Primary data is mainly gathered
through different types of questioning and observation methods.26
Both primary and secondary data can be categorized in more or less
detailed ways. According to Yin (2003) there are several sources of data
when conducting case studies. There is no data source more
advantageous than any other, which is why they should be used to
complement each other.27 Furthermore, the use of multiple sources is an
important method for enhancing the thoroughness of the research.28
Interviews
Lekvall & Wahlbin (2001) presents four typical ways of communicating with
respondents when conducting interviews, i.e. written survey, telephone
interview, personal interview, and interview via Internet. In the written
survey, questions are asked and answered on a questionnaire that is
distributed and returned by the inquirer and respondent without any
mediation from an interviewer. A telephone interview is performed by an
interviewer, where questions are asked and answered orally during a
telephone conversation. The personal interview is similar to the latter,
besides the fact that the interviewer and respondent have a personal
encounter. Lastly, the interview via Internet is a relatively new way of
conducting interviews. As with the written survey, there is no interviewer
acting as a link between the inquirer and the respondent. Depending on the
situation, each way of communication has its advantages and
disadvantages. The personal interview is dynamic in terms of the possibility
to ask any type of question and the opportunity to conduct an extensive
interview, nevertheless, it is rather expensive and time consuming. The
written survey and Internet interview are less expensive, thus appropriate
for large samples. The telephone interview is somewhat a hybrid between
26
Lekvall & Wahlbin (2001) 27
Yin (2003) 28
Robson (2011)

15
the personal interview and written survey, since it utilizes some of the
advantages of the personal interview, yet less expensive and not as time
consuming.29
Direct observations
If a specific location of interest exists, within the scope of the case study, it
can be subjected to a direct observation, which can be either formal or
casual. For the formal observation certain protocols can be developed as
part of the case study protocol, and the field-worker may be asked to
measure the incidence of certain types of behavior during specific periods
of time. Furthermore, by using multiple observers the reliability will be
increased.30
Participant-observation
When conducting a participant-observation the observer may take on a
variety of roles within a case study situation and even participate in the
studied event. The main advantage is that participant-observations can
provide the opportunity to observe a certain setting that would be
inaccessible to scientific investigation. On the other hand, there are issues
concerning potential biases when actively participating in a specific group
or event.31
Choice of data collection method
The main source of primary data was through personal interviews.
However, both telephone interviews as well as interviews via the Internet
were performed, since personal interviews are time consuming and also
more difficult to arrange due to different schedules. Furthermore, written
surveys were distributed for gathering qualitative data. For each technology
area two respondents were chosen to perform the survey.
29
Lekvall & Wahlbin (2001) 30
Yin (2003) 31
Ibid.

16
Regarding the collection of financial data it consists of two aspects.
Namely, the cost structure for the investigated areas, which were gathered
as both primary data through interviews, as well as secondary data using
previously performed studies. Second, production simulations were
performed using the wind assessment software WindPRO, in order to
acquire production estimations for the investigated areas.
In some cases the respondents were reluctant to reveal financial data and
also situations where the requested input was nonexistent due to lack of
industry experience. In these cases, interviews were held in order to ask
the respondent to make qualified assumptions, based on their position
within the field of study.
The respondents were first approached by email, explaining the aim and
prerequisites of the interview, and then asked to schedule a personal
meeting if possible. The interviews were recorded in order to ensure full
acquisition of information. Furthermore, written surveys were distributed
among respondents internally at the case company. The intention of this
was to quantify those aspects of technological enhancements that could not
be taken into consideration in the financial model.
Furthermore, the data collection was characterized by several unstructured
conversations and complementing questions due to the closeness to many
of the sources. Complementing questions in the form of personal,
telephone and email conversations were conducted in order to gain
answers to additional questions, as well as verifying previously given
answers.
Direct observations were performed early in the work process, in the form
of field visits to specific sites. The purpose of this was to gain a deeper
knowledge regarding the specific case study. In addition, participant-
17
observations were performed, since the authors spent most of the project
duration at the case company’s office.
2.5 Qualitative and quantitative data
The distinction between the qualitative and quantitative research method is
connected to the character of the collected data, i.e. whether or not the
data is expressed in mere numbers, or in words and images. Furthermore,
the research method partly coincides with the choice of research strategy,
where case studies usually are more suitable with non-calculating methods,
surveys and experiments generally with mathematic-statistical methods.
However, it is possible to conduct mathematical calculations on qualitative
data as well as performing a qualitative analysis on numerical data.
According to Lekvall & Wahlbin (2001) the research strategy is more
important, in regards to the outcome of the research, than the way which
data is expressed. 32
Choice of method
Both qualitative and quantitative data was collected during the project.
Initially, when researching the trends within technology development, a
qualitative approach was used; e.g. interviews and literature studies. The
qualitative evaluation of the different aspects of technological development
was quantified with the distribution of surveys. Second, the data used for
the financial input was gathered as both primary and secondary data
regarding the cost structures, as well as production simulations as a base
for the revenue input. In the case of these retrieval methods failing to
deliver the required input the financial data was based on qualitative
assumptions.
32
Yin (2003)

18
2.6 Credibility
There are three important aspects of valuation that should be taken into
account when conducting a scientific study. Namely, validity, reliability, and
representativity.33 Validity has to do with whether or not the data collection
method measures what it is intended to measure.34 Reliability determines
the consistency of the measurements, i.e. whether or not the results will be
the same at repetition, and are not influenced by random errors.35
Representativity is to which extent the results are applicable in other
cases.36
Achieving credibility
In order to achieve a high reliability multiple sources were used.
Furthermore, all questions were formulated with the aim of being explicit
and clear from bias. Also, whenever conflicting sources were found they
were both confronted when possible. The use of multiple sources will,
together with the efforts to increase reliability, ensure a high validity as well.
The financial model was validated through the testing of known cases.
Furthermore, a draft of the survey was initially performed on key employees
before finalized. In addition, the reference site was chosen to represent the
typical business case at the moment, and consequently an effort to
strengthen the generalizability of the results. Finally, as the outcome of this
study was presented the authors received valuable feedback from both the
case company and academia that was used to further strengthen this
thesis.
2.7 Source criticism
With the purpose of looking into the future development of the onshore
wind business, there will be a certain degree of uncertainty affecting the
33
Rosengren & Arvidsson (2002) 34
Lekvall & Wahlbin (2001) 35
Ibid. 36
Rosengren & Arvidsson (2002)

19
data. Some of the data regarding the financial input can only be based on
assumptions, due to the lack of commercial projects from which data can
be acquired, or the fact that existing projects are reluctant to reveal the
actual outcome. Also, the qualitative evaluation of the chosen technology
areas is likely to be subject to uncertainty, which is presumably due to
operational inexperience among the respondents at the case company. In
order to reduce the level of uncertainty that arises as a result of subjectivity
it is important to ensure that the respondents receive explicit boundaries for
each specific technology field so that they are able to make as qualified
assumptions as possible. Furthermore, it is important to choose
respondents that have particular experience in reference to each field.

20

21
3. Theoretical framework
This chapter presents the theoretical framework used for this thesis. The
presented framework has been chosen as a result of the methodical
approach and the evaluation model. At first, the theoretical background
regarding general wind energy is highlighted. Then, the theory that will
constitute the business evaluation method is presented. At first, the
necessary financial aspects concerning investment appraisal will be
accounted for. The second aspect is the qualitative measure which implies
a more strategic approach. For this measure a concept selection method
will be presented along with the SWOT analysis.
3.1 Wind power theory
Wind energy
Wind energy is the kinetic energy of air in motion. The wind’s kinetic energy
can be determined with the following formula, where Pkin [W] is the kinetic
energy; p [kg/m3] the air density; A [m2] the area of the cross section, and v
[m/s] the wind speed passing the cross section:37
The implications of this formula are that power increases eightfold when the
wind speed doubles, which emphasizes the importance of choosing
appropriate sites in regards to wind conditions. The amount of energy a
turbine can produce is determined by the wind’s kinetic energy multiplied by
the time it is producing, typically expressed in kilowatt-hours, kWh.
However, it is not enough to know the mean wind speed at a location in
order to assess the potential production, since the frequency may differ for
two sites with the same average wind speed.38 The wind conditions for
37
Wizelius (2007) 38
Ibid.

22
each site are therefore carefully assessed by conducting wind
measurements in order to determine the wind speed distribution.
The energy in the wind is converted to electricity by the turbine’s rotor and
generator. However, it is not possible to utilize 100 % of the wind’s energy.
If the turbine was to consume all of the incoming wind energy then the wind
speed would be zero after the turbine, thus inhibiting more wind to pass
through.39 In order to keep the flow of wind through the turbine it is
necessary that not all of its energy is consumed. A WTG is most efficient
when the wind speed is reduced by 1/3 at the rotor and by an additional 1/3
after the rotor. The proportion of the wind’s kinetic energy that can be
utilized by a WTG is determined by Betz’s law and corresponds to the
power coefficient Cpmax = 0,593. The maximum power a turbine can
generate is consequently:40
This is the theoretical upper limit that can be obtained by a turbine. In
practice, Cp will be lower due to aerodynamic and mechanical friction
losses.41
Turbulence
When moving air encounters obstacles it will move around it, creating air
vortexes along the primary wind direction. These air waves are measured
as short variations in wind speed and direction, i.e. turbulence. With
increased height the turbulence is generally lower since the winds are
farther away from obstacles in the terrain.42 The avoidance of turbulence is
an important aspect of wind power production, since the sudden changes in
wind speed and direction have a strenuous effect on turbine components.
39
Wizelius (2007) 40
Ibid. 41
Ibid. 42
Ibid.

23
Therefore, it is necessary to aim at avoiding turbulence, but also designing
the WTG to be able to handle the inevitable turbulences.
3.2 Capital budgeting
In order to determine a wind energy system’s commercial feasibility it is first
necessary to be able to assess its relative economic benefits. This method
should be easy to understand, free from detailed economic variables and
easy to execute.43
When it comes to making investment decisions in general it is necessary to
analyze profitability, and primarily making sure the investment fulfills certain
requirements. Profitability alone is, however, not a sufficient enough
measure when determining the appropriateness of an investment.44
The size of the investment for wind power projects will naturally depend on
the size of the wind farm, but still the typical wind power project is
characterized by large investments and a long project life time. For this
reason, it is important to have a good understanding of the cost driving
activities and cash flows, during the entire lifetime, in order to be able to
conduct a reasonable profitability analysis. However, there are other
important aspects of investment decision making which need to be taken
into consideration, for example strategic fit as well as other qualitative
assessments. Yet, simple capital budgeting methods are used as a
financial measure to determine the strength of specific investment
proposals.45
Investment criteria46
One of the most fundamental financial principles is that money has a time
value. This means that receiving dollar today is considered to be worth
43
Manwell et al. (2002) 44
Yard (2001) 45
Ibid. 46
Ibid.

24
more than receiving a dollar tomorrow. This is the case since it is possible
to invest the amount of money received in the today to generate a future
profit. So when evaluating an investment proposal it is not accurate to
compare cash flows that occur at different times without discounting them
to a mutual date.47 When doing so it is possible to see the amount of
money needed today so that the future payments can be made.
In order to calculate the present value of an investment proposal the
opportunity cost of capital is used as discount rate. The cost of capital is the
expected rate of return that is being given up by investing in the project.
Therefore, a project’s expected future payoff should be discounted using a
known rate of return offered by equivalent-risk investments in the capital
market. The present value then corresponds to the market value of the
project.48 The present value is then compared to the required investment,
which represent the net present value (NPV). Consequently, the NPV is the
amount of money that the project will add to shareholder wealth. This
results in the decision rule of accepting all projects that have a positive net
present value. This rule can be applied to projects of any length.
The internal rate of return (IRR) of a project corresponds to the discount
rate for which the NPV is zero. Hence, comparing the IRR to the
opportunity cost of capital will answer the question whether or not to accept
the project. If the IRR is higher than the opportunity cost of capital the NPV
will be positive and consequently negative when the IRR is lower. This
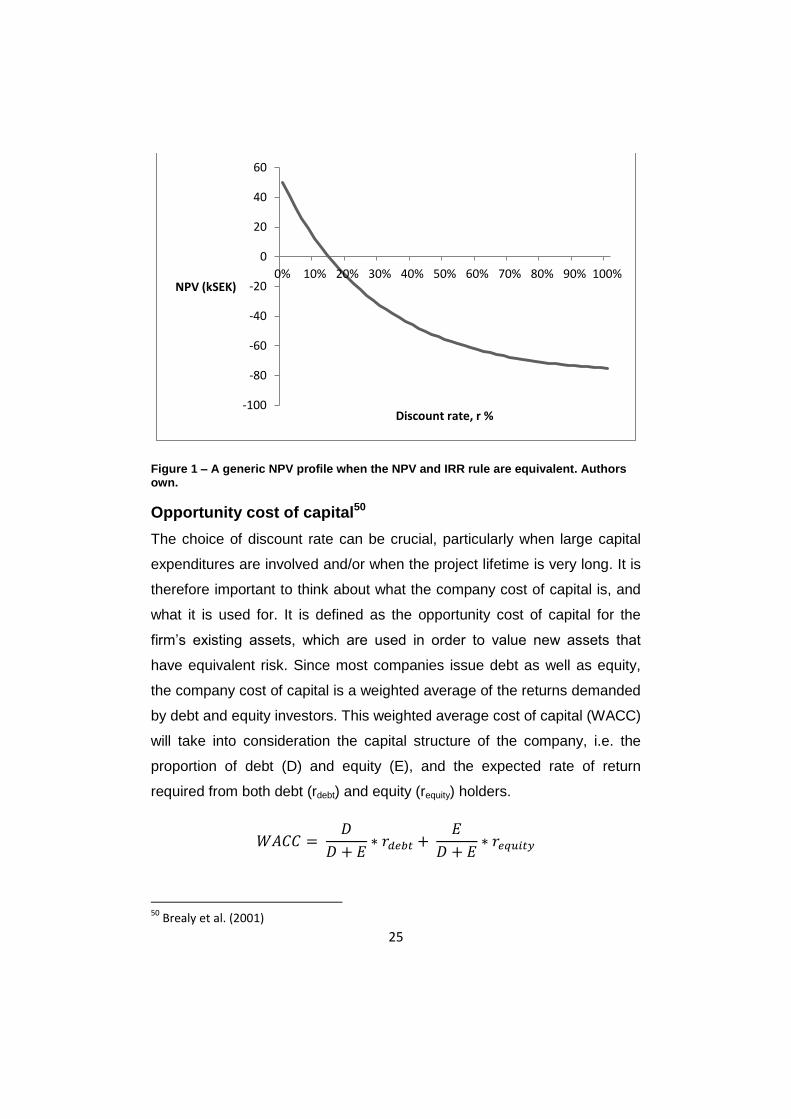
means that the NPV rule and the rate of return rule are equivalent.49
However, this is only true as long as the NPV declines smoothly as the
discount rate increases. Such a NPV profile is shown in the figure below.
47
Yard (2001) 48
Brealy et al. (2001) 49
Ibid.
25
Figure 1 – A generic NPV profile when the NPV and IRR rule are equivalent. Authors own.
Opportunity cost of capital50
The choice of discount rate can be crucial, particularly when large capital
expenditures are involved and/or when the project lifetime is very long. It is
therefore important to think about what the company cost of capital is, and
what it is used for. It is defined as the opportunity cost of capital for the
firm’s existing assets, which are used in order to value new assets that
have equivalent risk. Since most companies issue debt as well as equity,
the company cost of capital is a weighted average of the returns demanded
by debt and equity investors. This weighted average cost of capital (WACC)
will take into consideration the capital structure of the company, i.e. the
proportion of debt (D) and equity (E), and the expected rate of return
required from both debt (rdebt) and equity (requity) holders.
50
Brealy et al. (2001)
-100
-80
-60
-40
-20
0
20
40
60
0% 10% 20% 30% 40% 50% 60% 70% 80% 90% 100% NPV (kSEK)
Discount rate, r %
26
Companies can raise money from many different sources, e.g. convertible
debt, warrants, options, preferred stock, etc. These different sources of
finance are expected to generate different returns, thus making WACC
calculations increasingly difficult as the firm’s capital structure becomes
more complex. The formula above is, however, easily extended,
consequently adding additional weighted securities with its expected rate of
return. However, for the WACC to be an appropriate discount rate, each
project must be in accordance with the firm’s existing business.
Furthermore, the cost of capital must be based on what investors are
actually willing to pay for the firm’s outstanding securities, i.e. the securities’
market values. Consequently, the company cost of capital depends on how
its investors value the firm’s securities, which in turn depends on future
profits and cash flows.
Finally, when calculating cash flows for a specific project it is considered to
be all equity-financed, regardless of the structure of the financing.
Pitfalls with the IRR
As previously mentioned, the IRR rule will only provide the same answer as
the NPV rule as long as the NPV is declining as the discount rate
increases. Common pitfalls that may occur when it does not will be
illustrated with a few examples:51
First, looking at the projects in Table 1, both of them have the same IRR,
indicating that they are equally attractive investments. However, when
considering their net present value it becomes clear that project B is a poor
choice of investment. In project A, money is being lent out at a 50 % return
rate, whereas in project B, money is being borrowed at a 50 % return rate.
Consequently, the IRR rule, as earlier stated, does not apply in this case.
51
Brealy et al. (2001)

27
Project C0 C1 IRR NPV at 10 %
A -1,000 1,500 50 % 364
B 1,000 -1,500 50 % -364
Table 1 – Cash flows, IRR, and NPV for two arbitrary projects. All figures are in kSEK.
Authors’ own.
The NPV profile for project B, shown in Figure 2 below, shows that the net
present value increases as the discount rate increases, implying that the
IRR rule is reversed in these cases. This project must have an IRR less
than the opportunity cost of capital in order for it to be considered as an
attractive investment.
Figure 2 – NPV profile for project B from Table 1. Authors’ own.
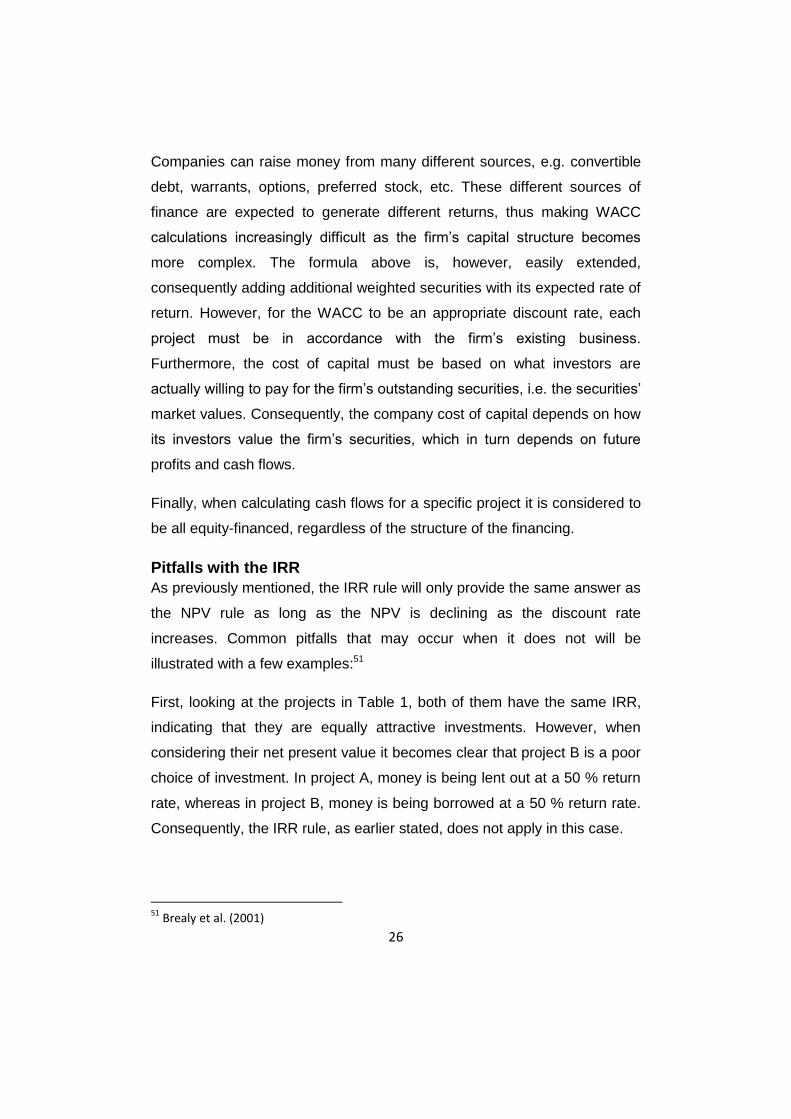
Project C in Table 2 below has two different internal rates of return. The
reason for this is the double sign change in front of the last cash flow.
-600
-400
-200
0
200
400
0% 10% 20% 30% 40% 50% 60% 70% 80% 90% 100% NPV (kSEK)
Discount rate, r %
28
There can be as many internal return rates as there are sign changes.52
This implies that the general IRR rule does not work here either.
Project C0 C1 C2 C3 C4 C5 IRR NPV at 10 %
C 22 15 15 15 15 -40 6 % & 28 % 0,7
Table 2 - Cash flows, IRR, and NPV for an arbitrary project. All figures are in kSEK.
Authors’ own.
The NPV profile for project C, Figure 2, shows that the investment has a
positive outcome when the opportunity cost of capital is in the interval 6 –
28 %, which is confirmed by the positive NPV in the same range.
Figure 3 – NPV profile for project C from table 2. Authors’ own.
Finally, caution should be taken whenever considering mutually exclusive
projects. In practice firms do not have unlimited resources to spend on
projects, but instead they must choose among several possibilities.
Considering project D and E in Table 3, both can be said to be good
52
Brealy et al. (2001)
-10
-8
-6
-4
-2
0
2
0% 10% 20% 30% 40% 50% 60% 70% 80% 90% 100%
NPV (kSEK)
Discount rate, r %

29
investments since the NPV is positive. However, the project with the
highest NPV is not necessarily the one with the highest internal rate of
return. The IRR rule does in this case favor the quick payback of project D,
which has a higher percentage return but lower NPV.
Project C0 C1 IRR NPV at 10 % NPV at 60 %
D -10,000 20,000 100 % 8,182 2,500
E -20,000 35,000 75 % 11,818 1,875
Table 3 – Cash flows, IRR, and NPV for two arbitrary projects. All figures are in kSEK. Authors’ own.
In figure 4, the NPV profiles for both projects are plotted. Clearly, the choice
between the two projects depends on the firm’s opportunity cost of capital.
The projects’ NPV profiles intersect at a discount rate of 50 %, which
implies that if this is the firm’s opportunity cost of capital both projects are
equal according to the NPV rule. However, when the opportunity cost of
capital is lower than 50 % project E is the better investment, and project D
is consequently better when the cost of capital is higher than 50 %.

30
Figure 4 – NPV profile for projects’ D and E from table 3. Authors’ own.
To conclude, the IRR rule is not always a sufficient measure by itself. The
principle behind making good investments is choosing activities that
increase the value of the firm. Projects that earn a good rate of return for a
long time usually have a higher NPV compared to those who offer a high
percentage rate of return for a shorter period of time.53
Forecasting cash flow54
Perhaps the biggest challenge in capital budgeting is forecasting the cash
flows. Often there is only raw data available, which need to be processed
before it can be used. Also, most financial forecasts are based on
accounting principles that do not necessarily recognize cash flows when
they happen. When identifying cash flows it is important to recognize
investment expenditure as they occur, since it is the generated cash that
determines if a project is financially attractive. The accounting profit differs
from cash flow, in the sense that the profit can occur before it has
generated any cash.
53
Brealy et al. (2001) 54
Ibid.
-4000
-2000
0
2000
4000
6000
8000
10000
12000
14000
16000
0% 10% 20% 30% 40% 50% 60% 70% 80% 90% 100%
NPV (kSEK)
Discount rate, r %
NPV project D NPV project E
31
A project’s cash flow should be based on the incremental cash flow, i.e. the
additional cash flow it produces compared to the option of not proceeding
with the investment. In doing so, all indirect effects of accepting a project
should be included as well. There is an opportunity cost related to the
resources involved in a project, that is equal to the cash generated by
selling the resource, and therefore it is a relevant cash flow when
evaluating the project. Furthermore, sunk costs should not be included,
since they remain the same whether or not the project is accepted, thus
having no impact on the net present value.
Furthermore, investments in working capital need to be accounted for. The
net working capital is the difference between a company’s short-term
assets and liabilities. Most projects require additional investments in
working capital, since cash outflow occurs when inventories are built up or
customers are slow to pay. Depending on the characteristics of the
business and the payment requirements toward customers and suppliers
the required investment in working capital will vary. However, the
investment in working capital will be recovered at the end of the project life
time.
The third component of project cash flow comes from operations, which can
be calculated in several ways. One method is to subtract all cash expenses
and taxes paid from the revenues. Alternatively, looking at the accounting
profit and adding back any deductions made for noncash expenses, e.g.
depreciation. A third way is to calculate net profit assuming no depreciation
((revenues – cash expense) * (1- tax rate)) and then adding back the tax
shield created by depreciation (+ (depreciation * tax rate)). Although the
depreciation deduction is a noncash expense it does affect net profit and
taxes paid, which is a cash item. All three methods will give the same
answer.

32
To conclude, a project’s cash flow can be considered as the sum of three
components; investments in fixed assets, investments in working capital,
and cash flow generated from operations.
Real vs. nominal cash flows
The distinction between nominal and real cash flows and interest rates is
another important aspect of capital budgeting. Interest rates are usually
expressed in nominal terms but the real interest rate on a bank deposit
depends on inflation as well. Therefore, if the discount rate is nominal it is
required that the cash flows are estimated in nominal terms as well, thus
having to take into account trends in selling price, labor, material costs,
etc.55 Applying a single assumed inflation rate to the cash flow is not
sufficient enough, since some costs and prices may increase faster than
inflation while others increase slower.56 It is also possible to discount the
real cash flows instead of the nominal, although it is not commonly done.
However, real cash flows discounted at a real discount rate will give the
same present value as nominal cash flows discounted at a nominal
discount rate.57
Inflation is defined as the overall increase in prices.58 This increase, in the
general level of prices, means that the purchasing power of money has
weakened. A way of keeping track of the general level of prices is the use
of different price indexes. The consumer price index (CPI) is the most
common used measure for tracking the price development, and thus
inflation59. CPI is intended to show, on average, how consumer prices are
developing for the private domestic consumption. Accordingly, the
percentage increase in the CPI from one year to another corresponds to
55
Yard (2001) 56
Brealy et al. (2001) 57
Ibid. 58
SCB (2012) 59
Ibid.

33
the inflation rate. Sveriges Riksbank, the Swedish central bank, is
responsible for the monetary policy in Sweden, thus responsible for
maintaining the national inflation target, which has been set to 2 %.60
3.2 Technology concept selection61 The decision-matrix method developed by Stuart Pugh is a way of
quantifying multi-dimensional options, in order to be able to rank them and
thereby support the decision making process. It is frequently used in
engineering field, often to solve construction and design issues, though
applicable in any situation involving a set of choices.
When facing a decision or problem, the first action will be to determine a
set of alternative solutions. Second, people with knowledge regarding
aspects that will influence the choice are asked to list certain criteria and
weight them according to the impact that each criterion has on the decision.
Thereafter, each possible solution will be graded based on how well they
meet each criterion. In order to be able to value the possible solutions, a
reference point is used, which could be an existing product or approach
that is the current solution to the problem. Nonetheless, the reference point
is used as a benchmark when evaluating the different concept solutions.
Therefore, it is given the value 0, thus enabling each concept to be graded
as either better (> 0) or worse (< 0) than the reference, or equivalent (=0) to
it. Any scale seen fit can be used, however a scale ranging from -2 to +2 is
frequent implemented, where each step corresponds to the following
valuation: much worse than, worse than, equal to, better than, and much
better than the reference for the specific criterion.
When the grading has been finalized, the results can be computed in
several ways. It is possible to simply summarize the grades for each
alternative, which will provide the total score. Also, the number of plus
60
Sveriges Riksbank (2010) 61
Virginia tech (2010)
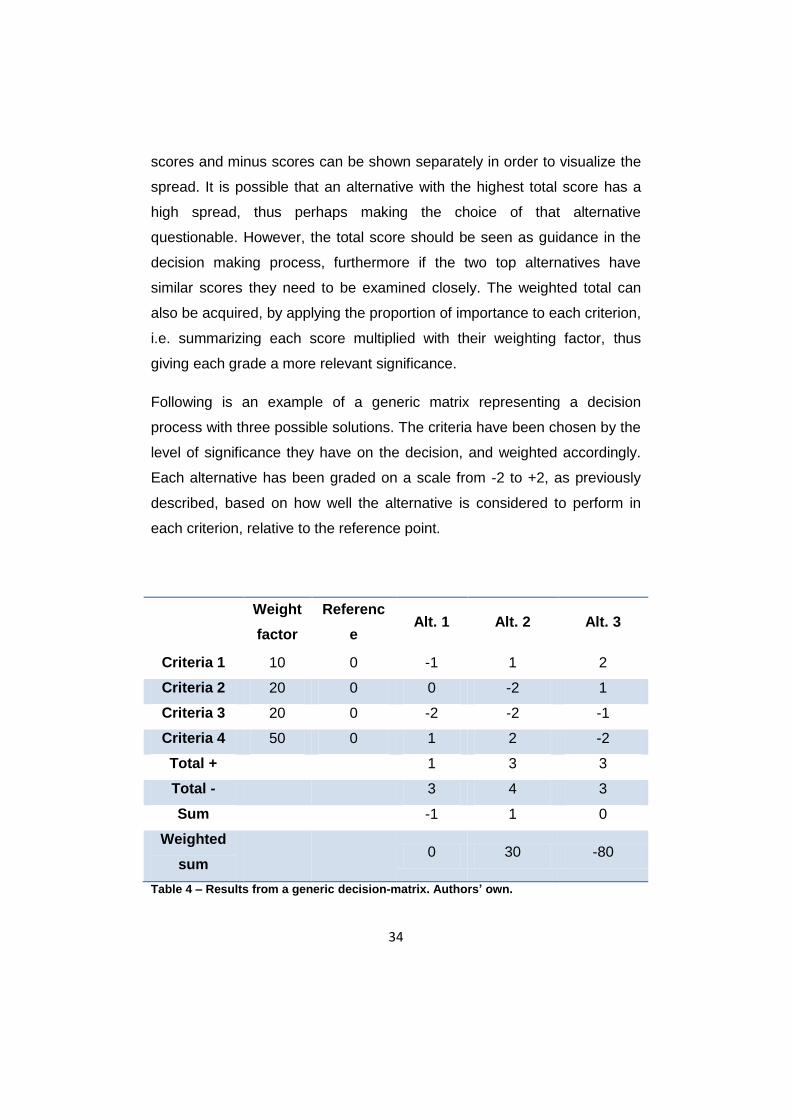
34
scores and minus scores can be shown separately in order to visualize the
spread. It is possible that an alternative with the highest total score has a
high spread, thus perhaps making the choice of that alternative
questionable. However, the total score should be seen as guidance in the
decision making process, furthermore if the two top alternatives have
similar scores they need to be examined closely. The weighted total can
also be acquired, by applying the proportion of importance to each criterion,
i.e. summarizing each score multiplied with their weighting factor, thus
giving each grade a more relevant significance.
Following is an example of a generic matrix representing a decision
process with three possible solutions. The criteria have been chosen by the
level of significance they have on the decision, and weighted accordingly.
Each alternative has been graded on a scale from -2 to +2, as previously
described, based on how well the alternative is considered to perform in
each criterion, relative to the reference point.
Weight
factor
Referenc
e Alt. 1 Alt. 2 Alt. 3
Criteria 1 10 0 -1 1 2
Criteria 2 20 0 0 -2 1
Criteria 3 20 0 -2 -2 -1
Criteria 4 50 0 1 2 -2
Total +
1 3 3
Total -
3 4 3
Sum
-1 1 0
Weighted
sum 0 30 -80
Table 4 – Results from a generic decision-matrix. Authors’ own.

35
Alternative 1 has a weighted sum of 0, indicating that it performs just as
well as the reference case. However, not considering the weighting of the
criteria will indicate that this alternative is worse than the reference.
Nonetheless, since criterion 4 has a substantial impact on the decision it
will strongly favor any alternative with a positive grade in that dimension.
Provided that the weightings display an accurate view of the problem
situation, the weighted sum will present a more dynamic decision basis.
This method is an effective approach of handling decision-processes with a
set of multi-dimensional options. Furthermore, it is beneficial since it is
possible to easily conduct sensitivity analyses, i.e. see the required change
for a specific alternative before it becomes a high rank option.
3.3 Strategic decision making62
The SWOT analysis is a widely used planning tool for strategic decision
making. It is applicable when evaluating projects or business ventures and
their effects on strategy development. The aim of the analysis is to identify
key internal and external factors that are significant in the process of
achieving specific objectives. The internal factors include all the strengths
and weaknesses of the project, which consequently can be managed within
in the firm. The external factors take into account the opportunities and
threats that lie in the surrounding environment. These are however much
more comprehensive, including aspects of macroeconomics, technological
developments, legislation and policy change etc.
The analysis is typically visualized with a matrix, and Karppi et al. (2001)
suggests the following actions to be implemented after the SWOT analysis
has been established: “Build on strengths, eliminate weaknesses, exploit
opportunities, and mitigate threats.” This is to ensure the successful
execution of long-term projects.
62
Johnson et al (2008)

36
The method itself is however not particularly preferable for in-depth
analyses since it lacks some matters that should require attention.
However, if these shortcomings are adjusted for it could act as balance
favoring the long-term perspective. Some of the intended concerns are
displayed below. 63:
The length of the lists.
No requirement to prioritize or weight the factors identified.
Unclear and ambiguous words or phrases.
No obligation to verify statements or opinions with data or analyses.
No resolution to contradictions in itself.
Single level of analysis is all that is required.
No logical link with implementation phase.
3.4 Linking theory with the study
An understanding of wind power theory and the physicality of wind energy
is required for both identifying potential focus areas and furthermore
necessary for the performed production simulations and estimations of
power curves for increased rotor diameter (see Appendix 4 – Increased
rotor diameter).
Theories regarding capital budgeting were used in order to ensure that the
financial model functions according to the necessary economic principles
and still applicable as a comprehensive and accurate, yet user-friendly tool.
In order to maintain this aim it was necessary to make certain assumptions
and simplifications, however the theoretical background was intended to
ensure that the model fulfills the fundamentals of financing. These
assumptions are further described in section 7.2.
63
Johnson et al. (2008)

37
The SWOT-analyzes was incorporated in the early stages of the project,
serving as the premise for the initial meetings within the case company.
The purpose of these interviews was to function as part of the technology
screening process but also for mapping out the qualitative measures.
To summarize, the main aspects of the presented theoretical framework will
constitute the basis for the evaluation method. The framework used for the
financial model will constitute one dimension in the evaluation. The second
dimension will be comprised of the qualitative aspects of the business case,
which will be quantified using the Pugh concept selection approach.

38

39
4. Case company - E.ON Vind
This chapter is intended to provide a short insight to the case company and
the activities involved in the entire process of developing onshore wind farm
projects.
4.1 E.ON Vind
E.ON Vind is headquartered in Malmö, Sweden and operates in Denmark,
Norway and Finland as well. Its activities to achieve their aim of customer
satisfaction are described by four main processes. Namely, Identify and
secure business opportunities, Develop project, Construct site, and
Operate and maintain site.
Identify and secure business opportunities64
A project is initiated by the search for a business opportunity, i.e. finding an
appropriate site and searching for potential business partners. The potential
project is evaluated further by conducting an investment calculation.
However, at this stage, there are no detailed wind assessments or
decisions regarding turbine specifications, thus making the initial project
evaluation a rough estimation. The emphasis in this process is to secure
the project by negotiating with land owners, as well as focusing on the
strategic fit of the project. As the project is secured it can be planned more
specifically and consequently handed in for a Gate 1 decision. Finally,
when the project is approved at G1 it will then proceed to the project
development phase.
Develop project65
Once the project has received its G1 clearance, the process of conducting
more detailed site studies and investment calculations can take place.
Several technical evaluations are performed, namely wind assessments,
64
E.ON intranet (2012) 65
Ibid.
40
site layout and production estimations, road planning and geotechnical
assessments, as well as the technical aspects of grid connection. If the
results from these evaluations are satisfactory, negotiations with
subcontractors are initiated. This enables more detailed investment
calculations, which will be an important input for the G2 decision. Parallel to
the technical evaluations, the process of applying for authorization of
environmental and building permits is initiated. In order to receive the
proper authorization an environmental impact assessment needs to be
conducted, which will cover any environmental aspects that may be in
danger due to the planned project. Once all the technical evaluations are
satisfactory, permits have been approved, and an extensive investment
calculation has been made the project will be subject to a G2 decision,
which will determine if the project is attractive enough to continue on to the
construction phase.
Construct site66
After the G2 approval the project is handed over to a construction project
manager. Initially, the contracts with suppliers and subcontractors,
regarding turbines, grid connection, roads and foundations etc., are
finalized. Next, the construction phase is prepared and coordinated. Each
turbine is inspected thoroughly before commissioning. Once the wind farm
is commissioned and all documentation is in place the project is finally
handed over to O&M.
Operate and maintain site67
The Operation & Maintenance department is responsible for planning the
operation of the wind farms, where the overall purpose is to ensure a high
availability and thus an optimal production. Planning maintenance and
service activities are important in order to guarantee a high availability.
66
E.ON intranet (2012) 67
Ibid.

41
Furthermore, data is gathered from the SCADA system and evaluated in
order to implement actions to ensure an efficient production. Finally, after
25 years when the turbines have reached their expected lifetime they are
disassembled with the intention of restoring the site to its original state.

42

43
5. Wind turbine design This chapter is intended to present the current characteristics in wind
turbine technology. More specifically, the fundamental parts of the wind
turbine, including foundation, tower and machine house, will be described
in different possible layouts. It is necessary to understand the historic
trends and limitations affecting technology development leading up to now.
This will help understand chosen focus areas in chapter 6.
5.1 General design layouts There are several fundamental wind turbine designs. A basic distinction is
between horizontal axis (HAWT) and vertical axis (VAWT) wind turbines. A
vertical turbine will operate regardless of the wind direction, while HAWT
rotors must be oriented either upwind or downwind of the tower.68
Therefore, a mechanism that maintains the correct orientation, as the wind
direction changes, is required for HAWT. In addition, there are turbine
designs where the number of blades varies from one to three. However, the
most common type of turbine is an upwind three-blade HAWT.69
A typical WTG consists of a foundation, tower, rotor (rotor blades and rotor
hub), control system, and the nacelle, which contains the generator, yaw
control, drive train and other mechanical components. The transformer is
also a part of the WTG, and is placed in the nacelle or at the bottom of the
tower, either inside the tower or outside. Most manufacturers offer a variety
of versions of their turbines, mainly concerning tower height and rotor
diameter, but also other configurations. This provides the possibility to
some extent tailor the turbines to specific sites.70
68
Manwell et al. (2002) 69
Wizelius (2007) 70
Ibid.

44
5.2 Foundation71 The foundation of the WTG fills two purposes: it holds up the weight of the
tower and nacelle, but also acting as a counterweight thus preventing the
tower from tipping over. The conventional foundation structure is the gravity
foundation, though each foundation is adapted to the WTG size, weight and
height as well as the quality of the soil. Ordinarily, the foundation is
constructed by first digging a 2-3 m deep square with a 7-12 m side and
then filling it with concrete steel. An anchor cage is placed in the middle of
the foundation, reaching the ground level, which acts as a socket for the
bottom tower. Finally, the concrete is cast, and when it is hardened the
tower can be assembled.
5.3 Tower Theoretically, the tower should be as high as possible since winds are
generally stronger with increased height and also since the winds are
expected to be less turbulent. Consequently, the tower height is determined
by the trade-off between energy output and cost72, which in turn depends
on the tower structure. Today, the most commercially proven tower design
is conical steel towers. These towers are, depending on the height,
assembled in sections on site. Larger WTGs with a height above 40 m are
divided into sections for transportation purposes.73 Each section is made
from welded steel segments and has welded flanges at the top and bottom.
These sections are bolted together and then bolted to the foundation and at
the top to the nacelle.74
71
Wizelius (2007) 72
Manwell et al. (2002) 73
Wizelius (2007) 74
Engström et al. (2010)

45
Figure 575
- Welded tubular steel tower.
The overall increase in turbine size challenges logistics services, since
there are national regulations restricting the height and length of
transported goods, seen in the table below. This implies a design limit on
conventional steel towers, imposed by the height restriction of 4.5 m. A
conical steel tower has a larger base diameter compared to the top
diameter, since this design requires less material and is the most cost-
effective. Consequently, the base diameter as well as the top diameter
increases with the tower height. Then, in order to be able to transport the
bottom section its diameter cannot exceed 4.5 m. A tower with a base
diameter of 4.5 m enables a tower height of approximately 100 m.
However, it is possible to construct higher towers and at the same time
maintain a base diameter of 4.5 m, but only if the walls are reinforced.
75
Engström et al. (2010)

46
Consequently, the potential tower height with this design becomes a trade-
off between the increased material cost and the improved production.
Length Width Height Weight
50 – 55 m 5.0 – 5.5 m 4.5 m 150 t
Table 576
– Swedish road transportation limits. The upper limit is granted by a special permit.
5.4 Rotor There are several aspects of a wind turbine that determine the actual
energy production. Namely, tower height, the effectiveness of crucial
components, and the rotor swept area. The wind’s output is directly
proportional to the swept area of the rotor77, meaning that a turbine will be
able to produce more with a larger rotor. Consequently, the rotors have
also increased over the years, however not as rapidly as the increase in
turbine output. This has to do with the fact that a larger rotor is dependent
on the development of higher towers. Normally, the desired relationship
between tower height and rotor diameter is 1:1.78
The rotor component includes the rotor blades and the rotor hub, to which
the blades are attached. Most commercial WTGs have a three-blade rotor,
which provides a sufficient enough increase in aerodynamic efficiency to
cover the increased cost of having more blades.79 The blades must be
designed so that they are able to withstand the loads they are being
exposed to, as well as being aerodynamically efficient. Due to the constant
load shifts the blade material need to handle fatigue well, which is why
most blades are manufactured in some type of composite material with
76
Engström (2010) 77
Wizelius (2007) 78
Ibid. 79
Manwell et al. (2002)

47
fiberglass or epoxy.80 Moreover, wood is a material that also handles
fatigue well, but a blade material that is not commercially widespread, since
it is technologically unproven.
Each turbine has a rated output, i.e. the maximum output the turbine can
utilize, which is reached at a specific wind speed. When the wind speed
exceeds this limit the additional power needs to be adjusted for, otherwise
the generator will generate too much heat and eventually destroyed. One
way of dealing with this is to allow for pitching of the blades, i.e. adjusting
the blades’ angle of attack, according to the wind speed and thus
controlling the rotational speed.81
WTGs that are erected in cold climates need to be able to handle the
issues with ice formation. The profile of the blades changes as a result of
ice building up, and consequently the rotor’s aerodynamic features.82 In
addition, there is a risk of increased loads on the rotor if the ice formation
varies along the blades and hub.83 If there is no system for handling the
issues with ice the turbine will automatically shut down when loads reach a
certain level.84
As with the conical steel towers, there is a design limit on the rotor blades
imposed by the transportation restrictions. Once again considering table 5,
the length restriction puts a limit on blade length resulting in a maximum
rotor diameter of approximately 112 m. Vestas’s V112 turbine is one of their
more recent models and has a diameter of 112 m. Furthermore, if the site is
80
Wizelius (2007) 81
Ibid. 82
Manwell et al. (2002) 83
Wizelius (2007) 84
Lindkvist (2012a)

48
located in mountainous terrain, the length restriction might be even lower,
possibly 35 m.85
5.5 Control system All commercial WTGs have advanced computerized control systems, which
monitor every aspect of the turbine. The control system can be divided into
three functions86: dynamic control, supervisory control, and operation
follow-up, where the general aim is to maximize energy production, ensure
safe turbine operation, reduce loads and increase fatigue life. The purpose
of the dynamic control is to gather information from wind measurements,
which is done with anemometers on top of the nacelle, and then signals the
turbine to perform actions accordingly, e.g. yaw control and blade pitch
control. The surveillance control ensures the safe operation of the turbine
by monitoring temperature and vibrations in the mechanical components,
and if necessary shutting the turbine down. The follow-up control gathers
data regarding production and operation failure etc. This information is
processed and displayed to both owners and manufacturers.87
5.6 Nacelle and yaw control The nacelle is the unit at the top of tower, which houses all the generating
components in the turbine. General components include a main shaft with
bearings, generator and a yaw control system.88 The yaw orientation
system is necessary to keep the rotor correctly aligned to the wind. An
active yaw drive, mostly used with an upwind HAWT, contains one or more
motors, which operate according to the wind measurements from the
anemometer, mounted on top of the nacelle.89 A downwind rotor, on the
other hand, allows the turbine to implement a free yaw, i.e. the rotor will
85
Engström (2010) 86
Manwell et al. (2002) 87
Wizelius (2007) 88
Ibid. 89
Manwell et al. (2002)
49
align itself automatically to the wind like a weather vane.90 The remaining
components vary, depending on design concept and manufacturer. E.g.
some turbines incorporate hydraulics for blade pitch, while others use
electrical devices.91
5.7 Drive train92 The drive train is made up of the rotating parts of the WTG. These usually
include a low-speed shaft on the rotor side, a gearbox, and a high speed
shaft on the generator side. Other components typically include support
bearings, one or more couplings, a brake, and the rotating parts of the
generator. The drive train is a critical aspect of the turbine in regards to
wind loads, since these components will be subject to the continuous strain
from these loads.
5.8 Gearbox Manufacturers can offer turbines with either a gearbox or without. The
purpose of the gearbox is to increase the main shaft’s rotation speed to the
speed required by the generator93, which is in the range of 1000 – 2000
rpm.94 Since the rotor speed for a larger turbine is in the range of 20 – 30
rpm this increase needs to be done in several steps. Moreover, the gearbox
consists of many components and requires efficient lubrication and cooling,
and therefore is a crucial aspect in terms of operation and maintenance.
Therefore, reduced activity for O&M is an advantage that turbines without a
gearbox provide. Furthermore, this design reduces the required amount of
components substantially, thus reducing maintenance cost. However, they
have approximately the same efficiency rate.95
90
Manwell et al. (2002) 91
Wizelius (2007) 92
Manwell et al. (2002) 93
Ibid. 94
Wizelius (2007) 95
Ibid.

50
5.9 Generator Most turbines have an asynchronous generator, where power is supplied
through electromagnetic induction. An asynchronous generator needs to
overcome a certain rotation speed for it to start producing power. In order to
deal with this some manufacturers offer turbines with two separate
generators, or a double fed induction generator (DFIG).96 With this design it
is possible to have the turbine operational at lower wind speeds as well.
A synchronous generator has the advantage of being able to operate at the
same rotation speed as the rotor, which implies that a gearbox is not
needed. This turbine design is however not the dominant one among
manufacturers. The downside of a direct driven generator is that it
increases in size significantly. Also, a generator that operates at a variable
rotation speed will produce electricity with varying frequency, thus requiring
advanced power electronics to handle the grid input.97
The size of the generator is specified by its rated output, but the power
output is dependent on the wind speed. Each turbine will produce at its
rated output when the wind speed is sufficiently high, otherwise at a lower
output according to the specific wind speed.98 This is illustrated in the
power curve for each turbine type. Below is the power curve for a Vestas
V90 2 MW, displaying the production capacity for different wind speeds.
96
Wizelius (2007) 97
Manwell et al. (2002) 98
Wizelius (2007)

51
Figure 6 – Power curve for Vestas V90 2MW.99
5.10 Transformer Today’s WTGs usually have a voltage of 690 V, which means that they can
be connected directly to industrial plants without a transformer. However,
most WTGs are connected directly to the power grid through a transformer,
which increases the voltage to high-voltage, i.e. 10 – 20 kV.100 The
transformer is either placed just outside the tower, or inside the tower at
ground level. Some manufacturers place the transformer in the nacelle,
acting as a counterweight to the rotor.101
99
Vestas (2011) 100
Wizelius (2007). 101
Lindkvist (2012c)
0
200
400
600
800
1000
1200
1400
1600
1800
2000
0 5 10 15 20 25
Ou
tpu
t (k
W)
Wind speed (m/s)

52
5.11 Vestas V90 – reference site turbine102
The Vestas V90 wind turbine is a pitch regulated upwind HAWT with active
yaw and a three-blade rotor. It has a double fed induction generator with a
rated output of 2 MW and a 3-stage gearbox. The rotor diameter is 90 m
and the hub height 105 m. The tower is made of four tubular steel sections
which is anchored to the ground using a gravity foundation.
102
Vestas (2011)

53
6. Technology development In this chapter the chosen areas of technology are presented, which are a
result of the initial screening process. They constitute the different aspects
of the WTG that will be further analyzed in the evaluation model. In this
chapter only their technological features are described. A more detailed
reasoning for including them in the study is later discussed in chapter 7.
6.1 Rock anchoring foundations In general, when constructing a foundation, its type and size will be
governed partly by the geotechnical conditions of the site. Depending on
the quality and volume of soil at the site the gravity foundation may require
additional efforts to increase the load bearing capacity. If the conditions are
sufficient enough, the loads from the WTG are transferred to the ground by
a spread footing103, seen in the figure below.
Figure 7104
– Illustrating how the spread footing resists wind loads.
If not, piles might be needed to transfer the loads to a more rigid ground,
e.g. the bedrock, thus creating a deep foundation system. The ability to
103
Hassanzadeh (2012) 104
Byle (2010)

54
resist tilting of the WTG is a result of the tension and compression
resistances of the piles105, which can be seen in Figure 8 a) and c).
Figure 8106
– Different deep foundation systems - a) spread footing supported by two piles, b) spread footing anchored to the bedrock, c) spread footing supported by a
single pile.
In 8 b) there is no soil with sufficient bearing capacity, so the spread footing
is anchored directly to the bedrock. This technique requires solid and
homogenous bedrock, e.g. granite.107
There is an additional option involving rock anchoring which eliminates the
spread footing, thus reducing the cost of concrete as well as the anchor
cage. The technique, illustrated in figure 9, basically anchors the bottom
tower directly to the bedrock using threaded bars that are attached deep
into the bedrock. First, holes are drilled into the bedrock, which are injected
with a type of expanding material. The threaded bars are then inserted and
105
Byle (2010) 106
Ibid. 107
Mobjer (2012)

55
fixated at the ends, while the upper part of the bars are pulled and locked
into place at the desired tension load.108 According to Olof Mobjer, CEO of
Mobjer Entreprenad AB, there are no additional O&M costs for this rock
anchoring foundation, except occasional visual inspections. The foundation
is designed to last the entire lifetime of the WTG. Should one of the bars
disengage from its socket there is no way of reattaching it to the bedrock.
However, according to Mobjer the foundation is dimensioned to have plenty
more bars than required, thus allowing for several of them to disengage
without risking serious harm to the WTG or surrounding area.
Figure 9 – The rock anchoring solution offered by Mobjer Entreprenad AB. The fox is in scale 1:1.
The main advantage of this rock anchoring technique is the low
environmental impact, compared to gravity foundations, which usually
requires a large amount of concrete.109 When it is time for decommissioning
the gravity foundation will implicate heavier interference with the
surrounding area, due to the amounts of concrete that is either removed or
108
Mobjer (2012) 109
Ibid.

56
left behind. This is most likely an influencing aspect in regards to acquiring
permits.110
In a cost-perspective the better of these two foundations types will be
determined by the distance to a concrete station. When constructing a
gravity foundation the soil that is dug up is used to create the necessary
crane areas, however with the rock anchoring foundation the crane areas
will have to be built by transporting additional material to the site.111
Consequently, the advantages of rock anchoring, i.e. eliminated costs for
concrete and anchor cages, will have to be weighed against the additional
cost of creating the crane areas. However, the choice of foundation will first
and foremost be decided by the geotechnical conditions on site, as well as
turbine output and tower type.112
It is natural to presume that rock anchoring foundations will extend the
amount of possible sites considerably. Mobjer estimates that the possible
granite sites correspond to about 5-10 % of Sweden’s surface, and
probably more in Norway.
6.2 Jointed blades113 In order to be able erect turbines with a larger diameter, one commercially
feasible solution is to divide the blades and assemble them on site.
However, there are a limited number of suppliers that can offer this
solution. Gamesa’s 4.5 MW G 10X jointed blades are made entirely of
composite material and has a 128 m diameter. The problem, however, is
the fact that composite joints are difficult to make, thus increasing weight
and cost. Enercon has a different solution with its E-126 turbine, as the
outer portion of the blade is made from composite materials while the inner
section is made from a load-bearing steel beam with an outer cladding of
110
Mobjer (2012) 111
Ibid. 112
Hassanzadeh (2012) 113
Engström (2010)

57
aluminum. Even though this solution increases the overall weight, it could
nevertheless be cost-effective, since it is five to ten times cheaper to
construct the load-bearing structure in steel rather than composite material.
Furthermore, a steel-composite joint is more favorable than a composite-
composite joint.
6.3 Tower As the expansion of wind power has developed rapidly over years, the
competition for the most appropriate sites hardens. Building wind turbines
in flat terrain is favorable, in the sense that turbulence is generally lower,
however, as these sites become occupied, the adaptation to less favorable
terrain becomes necessary. Building wind turbines in forest sites, which
have become common in both Sweden and Germany114, requires that
consideration is taken to turbulence and increased tower height. Since
turbulence is usually stronger in the immediate vicinity above trees, there is
a demand for higher towers in forest sites.
Even though conical steel towers dominate the market there are tower
structures that are more or less technically and commercially feasible.
These alternatives become increasingly interesting as the demand for
higher towers rises. The conventional steel tower has its limitations when
aiming at reaching higher heights, and therefore it might not be the most
economically attractive design. It is possible to construct WTG towers in
concrete and lattice, and even hybrid towers incorporating both steel and
concrete. Also, wooden towers are being investigated as an alternative
tower material.115
Friction joint
An alternative tower construction, hence avoiding the problem of transport
limitations, is to assemble the tower using bolted joints instead of welding
114
Engström (2010) 115
Ibid.

58
the sections together. This will add the cost of bolts, however, the need for
flanges is removed. Welds, which impose fatigue limitations, are also
avoided, thus enabling the use of better steel qualities.116
Figure 10117
- Tower with bolted friction joints both in longitudinal and lateral directions.
Concrete
Towers made entirely of concrete are technically feasible as well, however
not as commercially proven as the tubular steel tower. In general, towers
have been built using pre-stressed concrete for many years. Initially, they
were usually constructed by slip form casting, but in recent years more
often constructed from prefabricated elements, thus making it easier to
control manufacturing conditions. Regarding technical aspects, both
alternatives perform in the same way, since it is the pre-stressing that
provides the tensile strength.118 The main advantages of concrete towers
116
Engström (2010) 117
Hassanzadeh (2012) 118
Ibid.

59
are their stiffness, robustness, and maintenance properties. A well
designed concrete tower does not need any maintenance during its lifetime.
Figure 11119
– Slip-formed cast concrete tower in production.
Hybrid
A hybrid tower, consisting of a concrete bottom part and upper tubular steel
part has been shown to meet the requirements of strength, stiffness and
natural frequency for turbine towers. About 2/3 of a hybrid tower, with a hub
height if 120 – 140, m can be made out of concrete, and the remaining 1/3
of tubular steel. The structural concepts and production for the concrete
part of the hybrid tower are quite similar to those of the concrete tower.120
119
Hassanzadeh (2012) 120
Ibid.

60
Figure 12121
- Hybrid tower with a concrete bottom part and upper tubular steel part.
Lattice
The lattice tower is often used in Germany for towers up to 150 m. They are
made of struts that are assembled in a specific order to attain a given
structural strength and stiffness while using as little material as possible.
The main advantage of the lattice tower is the low material consumption.
Furthermore, the lattice structure enables the construction of quite large
towers and since the towers are assembled on site there are no
transportation issues. However, maintenance is the main disadvantage of
lattice towers. There can be as many as 10,000 joint bolts in a lattice tower,
and each bolt must be inspected three times during its lifetime.
Furthermore, the risk of ice formation is an issue, since it could prevent
access to the nacelle.
121
Hassanzadeh (2012)
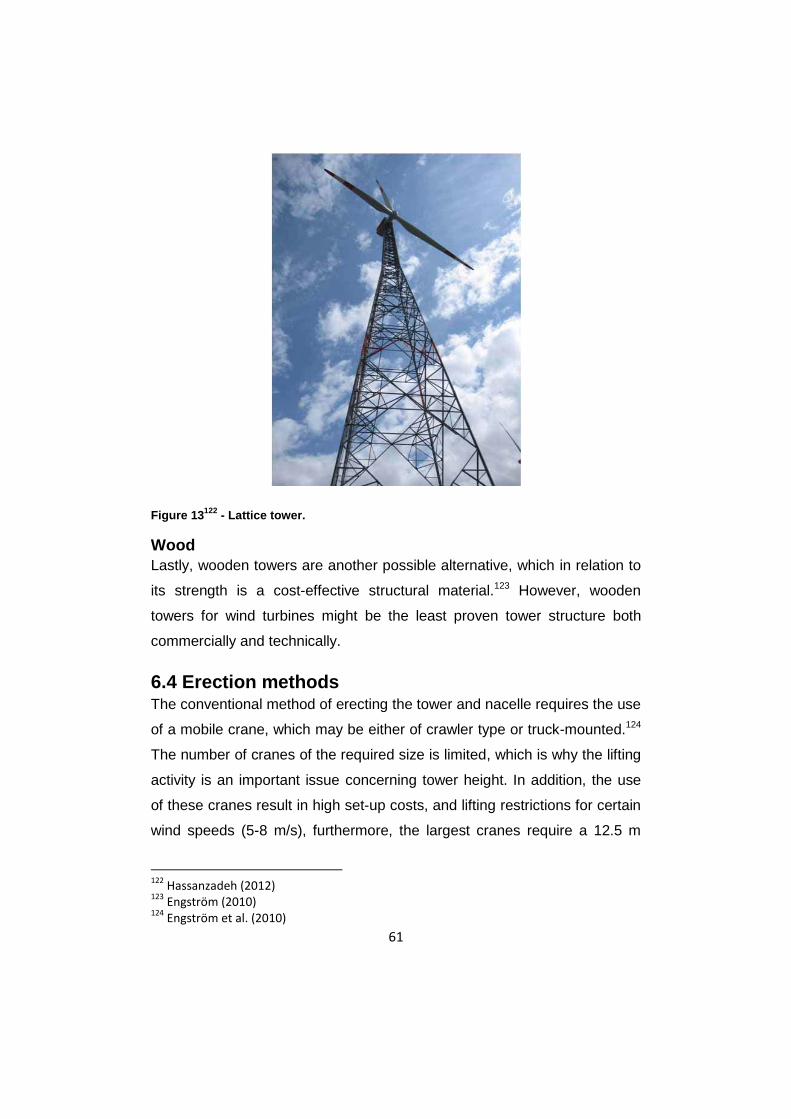
61
Figure 13122
- Lattice tower.
Wood
Lastly, wooden towers are another possible alternative, which in relation to
its strength is a cost-effective structural material.123 However, wooden
towers for wind turbines might be the least proven tower structure both
commercially and technically.
6.4 Erection methods The conventional method of erecting the tower and nacelle requires the use
of a mobile crane, which may be either of crawler type or truck-mounted.124
The number of cranes of the required size is limited, which is why the lifting
activity is an important issue concerning tower height. In addition, the use
of these cranes result in high set-up costs, and lifting restrictions for certain
wind speeds (5-8 m/s), furthermore, the largest cranes require a 12.5 m
122
Hassanzadeh (2012) 123
Engström (2010) 124
Engström et al. (2010)

62
wide road or track width between sites.125 Lifting towers, used in Sweden
for Maglarp and Näsudden II as well as in Norway by Scanwind, might be
necessary when performing lifts over 150 m. However, this method has its
drawbacks as well, e.g. it requires a large number of personnel, and the
erection time is longer than for a mobile crane. Consequently, the costs are
significantly higher for the use of lifting towers.126
6.5 Individual blade pitch control with laser Conventional blade pitch control, which controls the pitch of all blades
collectively, has been used for quite some time. The application of
individual pitch control is now being used by the larger turbine
manufacturers.127 Theoretically, there are indications of the possibility to
reduce fatigue loads by 30 %, using individual pitch control. Experiments
within the EU-supported Upwind project have shown that this desired
reduction is possible to achieve.128 However, in most cases the rotor blades
are pitched according to the wind data collected from the anemometers’
which are placed at the back of the nacelle, thus measuring the wind that
has already passed the blades.129 Using a LIDAR (Light Detection And
Ranging) based wind measurement system for blade pitch control suggests
that further optimization can be made.130
6.6 De-icing system In areas with colder climate the risk of icing on the turbines becomes an
important aspect for operation and maintenance. This problem is further
emphasized by increasing tower heights, resulting in turbines that can be
125
Engström (2010) 126
Ibid. 127
Ibid. 128
Bossanyi (2010) 129
Lindkvist (2012c) 130
Mikkelsen (2012)

63
situated in low clouds for much of the year, and consequently subject to
icing when temperatures fall.131
There are two main aspects of the icing problem, namely, increased
maintenance and consequently production loss, as well as the risk of
damage to person, both due to ice formation on the turbine and blades.132 If
the turbine is at a standstill and ice has time to build up on the rotor blades
there is a potential risk of damage to person when the turbine is once again
set into operation. The maximum ice throw can be calculated using the
following formula, where H = tower height and D = rotor diameter: 133
Ice throw = (H + D) * 1.5
Today, most turbine manufacturers offer some kind of ice-detection system,
which signals when ice is formed, and the turbine is consequently stopped
until it is removed. For the O&M department this is not the best solution
since production is lost. Furthermore, the ice-detection systems available
today are not considered to be sufficiently reliable134, thus incurring
“unnecessary” production losses when the system mistakenly signals for
icing on the turbine. However, without a functioning de-icing system these
production losses will have to be accepted, due to safety restrictions.
There are two fundamentally different de-icing systems available or under
development.135 One design involves distributing heated air inside the
hollow blades which shuts down the turbine temporarily until the ice is
removed. The other design incorporate heating coils placed on the blades’
exterior. Only one supplier has a commercial de-icing system, which is the
131
Mikkelsen (2012) 132
Lindholm (2012) 133
Lindkvist (2012a) 134
Høy-Thomsen (2012) 135
Lindkvist (2012a)

64
heated air solution, though several other suppliers are about to finalize their
products, where both designs are represented.136
6.7 Synchronous generators137
High speed
Using DFIG requires a converter, which supplies power to the rotor, with
only a capacity of about 30 % of the full generator output. However, with a
synchronous generator the converter must be able to handle the full output
of the turbine. This could be outweighed by the fact that the cost of
converters has decreased, thus making synchronous generators an
attractive alternative. The most important advantage of synchronous
generators is the possibility for turbines to contribute to system stability.
Also, they have a high efficiency, especially at part load, which is
significantly important in wind power applications. Most of the larger
manufacturers, such as GE, Gamesa, Siemens, and Vestas, have been
applying this technology in some turbine models.
The permanent-magnets used for these generators consist of the rare earth
metal neodymium, which contrary to its name is widely distributed in the
earth’s crust. Neodymium magnets are the most powerful magnets known
and consequently used in a wide range of applications. However, the main
issues with neodymium are that China controls nearly the entire world
production, and that the mining process is extremely toxic.138 Mining
corporations, in the US foremost, have responded to this situation by
expressing the need for reopening old mines, but at the same time solving
the environmental issues associated with the mining process.139 It remains
to be seen how this situation will affect the price on neodymium in the
future.
136
Lindkvist (2012c) 137
Engström (2010) 138
The Atlantic (2009) 139
Daily mail (2011)

65
Direct drive
A gearless turbine solution provides the advantage of reduced O&M costs,
mainly due to the reduced amount of components and the elimination of
gearbox replacements. The gearbox and its mechanical components are
constantly subject to strain from wind loads and will eventually require a
total of two or more replacement in order to sustain the expected turbine
lifetime.140 The elimination of these activities is highly desired from an O&M
perspective, particularly in locations with a high amount of turbulence.141
However, there are some uncertainties regarding the technology142, partly
due to limited industry experience and supplier alternatives. Furthermore, a
direct driven generator is larger and heavier, and consequently more
expensive.143
As previously mentioned, Enercon has basically been the sole supplier of
direct-drive generators. However, nowadays five out of the ten of the
largest manufacturers are either manufacturing or developing direct-drive
turbines. Scanwind, which has been taken over by GE, is developing a
commercial direct-drive plant for offshore installation. Chinese Goldwind is
producing turbines developed by its wholly-owned German subsidiary,
Vensys. Siemens has produced a 3 MW turbine with an outer-rotor
generator, demonstrated in the Swedish NewGen-generator. Vestas is said
to be developing a direct-drive design as well.144
6.8 Voltage converters Traditionally, 690 V converters are most common in wind turbines, despite
the fact that higher voltage converters are well established in industrial
applications. For a turbine with an output in the megawatt range, it would
140
Flaig (2012) 141
Lindholm (2012) 142
Høy-Thomsen (2012) 143
Lindkvist (2012) 144
Engström (2010)

66
be natural to design the generators for a higher voltage145. A medium
voltage converter enables the elimination of the transformer, thus reducing
the weight of the nacelle (if the transformer is placed in the nacelle) as well
as potentially reducing cable costs. A 3.3 kV converter would result in a
more compact and lighter converter146, however, capital equipment cost
would increase by roughly 25 %, according to Desai & Troedson (2010).
Furthermore, the equipment for the medium voltage converter is more
sensitive to moisture, and requires de-ionized cooling water. However,
there are expectations of a higher reliability and improved efficiency using a
medium voltage converter, although experiences from industrial use do not
necessarily prove the latter to be true. Both low voltage and medium
voltage converters are in the efficiency range of 97.5 to 98 %.147 Finally,
incorporating a higher voltage converter in the turbine will require higher
safety restrictions and trained personnel accordingly.148 The number of
available electricians with the required training is limited.149
145
Engström (2010) 146
Ibid. 147
Desai & Troedson (2010) 148
Rasmussen (2012) 149
Dahlgren (2012)

67
7. Business case evaluation model This chapter will further describe the evaluation method, consisting of the
financial model and the measuring of qualitative aspects. First, the model
as a whole is discussed, followed by a review of each component regarding
the underlying assumptions. Finally, the testing and validation of the model
will be discussed.
7.1 Building the model
The business case evaluation model is centered on three key aspects that
represent the drivers for improving the business case.150 Namely, wind
turbine performance, operational expenditure, and capital expenditure.
These are the main factors that will have a large impact on whether or not
the business case will be regarded as attractive. More specifically, the aim
is to increase performance, while reducing operational and capital
expenditure.
Each of the chosen technological areas will be subject to both a financial
analysis and a qualitative analysis, the latter intended to cover all those
aspects that cannot be quantified and as input to the financial model.
Covering both aspects is intended to ensure a more comprehensive view
compared to merely conducting a financial analysis, which will not take into
consideration the overall feasibility.
The chosen technology areas presented in chapter 6 are categorized
accordingly and displayed in the table below.
150
Malmberg (2012)

68
1) Performance 2) OPEX 3) CAPEX
1.1 Higher towers 2.1 Direct drive
generator
3.1 Tower
structures
1.2 Increased rotor diameter 2.2 De-icing system 3.2 Foundations
1.3 Increased generator
output 2.3 LIDAR blade pitch 3.3 Jointed blades
1.4 Medium voltage converter
1.5 Permanent-magnet
generator
Table 6 – Chosen technology areas. Authors’ own.
Each focus area has been placed in either three categories depending on
its impact in the specific category. However, this categorization is merely a
visualization of what the internal drivers for each area are. For example,
when investigating higher towers the impact it has on performance will be
analyzed as well as the effect on capital and operational expenditure.
Regarding the Performance category, the inclusion of higher towers is in
accordance with the need to develop wind farms in hilly terrain, which is
driven by wind conditions. Furthermore, the rotor diameter is strongly
correlated to the energy output, thus increasing blade length should provide
a significant increase in production as well. Increasing the generator is also
a clear inclusion to the category. As for including higher voltage converters
and permanent-magnet generators, they are not expected to increase
performance to the same extent as the other, but are still intended to
rationalize the production.
For the OPEX category, a direct driven generator has the advantage of
eliminating the need for a gearbox, which will have a substantial impact on
maintenance costs. The de-icing system is a highly demanded component
in areas with cold climate, where the main reason is concerning safety.

69
Nonetheless, icing issues have an impact on both production and
maintenance. Furthermore, blade pitch control using a LIDAR system is
also expected to affect both production and maintenance. They are both
clear inclusions to the OPEX category since both systems are active
processes that will be managed by the O&M department throughout the
WTG lifetime. Finally, it should be stated that the estimations for O&M costs
are only take into consideration the scheduled maintenance activities.
The CAPEX category does not consist of as many certain inclusions as the
previous two, mainly since most new technological advancements will
require an increased investment cost, where the trade-off between CAPEX
and production increase will determine its feasibility. The demand for
alternative tower structures is partly driven by the desire to reduce
investment costs, and partly by the desire to build higher towers than the
conventional method allows. Finding an alternative foundation structures is
mainly driven by design requirements and geological constraints, however
it has a direct impact on CAPEX. As for the development towards jointed
blades it is powered by limitations in transportation and since the upper limit
for this constraint has already been reached, jointed blades are a
prerequisite for longer blades. Since they will have a clear impact on
CAPEX they are included there.
As a final point, when selection each technology area for inclusion in the
above mentioned categories it is important to recognize that they will
impact all categories. The attractiveness of each technology area will
consequently be determined by the trade-off between the outcomes in its
respective category together with the other categories.
7.2 Financial model
The financial model is intended to be used as a quick and accurate
assessment of potential investment decisions. The current model employed
at the case company is a highly detailed tool, however not as efficient for

70
numerous calculations. By reducing the elaborate cost break down
structures and leaving out the extensive information required by an
executive management, the aim is to create a model that accurately
evaluates two projects, assuming they share several of the underlying
assumptions.
The capital investment is considered a single cash outflow, which is
required to initiate the project, occurring in the first year. In actuality, the
capital expenditure can begin years prior to the construction and O&M
phase, where technology has its greatest impact. However, the expenditure
of activities required for a G2 proposal to be submitted is disregarded, since
it would be considered a sunk cost.
Required investments in working capital need to be calculated for each
specific project. The level of working capital required is affected by the
payment contracts with both suppliers and customers. If the customer is
granted a longer time period before payment than what is given by the
supplier, the change in working capital will be negative. Working capital is
calculated as the difference between current assets and short-term
liabilities, which in turn are expressed as specific proportions of the revenue
stream. Since the Knäred project has been chosen as the reference case,
the same proportions for assets and liabilities will be used.
When it comes to the opportunity cost of capital the financial model
assumes all projects to be entirely equity financed. This removes the
financial income and expenses in the income statement, which however
has no effect on the cash flows. In reality, the capital structure of corporate
firms is rather complex and need to be properly assessed in order to
provide an accurate WACC. For the case company, the weighted average
cost of capital is determined by headquarters and acquired for each specific
project. Consequently, the nominal post-tax WACC used for evaluating the
Knäred project is used throughout this evaluation.

71
Consideration has been taken to the overall increase in prices, i.e. inflation.
However, analyzing all variables that might have an impact on the price
fluctuations neither fits the scope of this thesis, nor the timeframe.
Furthermore, forecasting electricity prices 25 years forward is a
comprehensive task and will nonetheless be characterized by uncertainty.
Therefore, the model is subjected to a single assumed inflation rate, which
corresponds to the national inflation target in Sweden, i.e. 2%.
The cost for decommissioning is regarded as a single cash outflow
occurring in the final year. Alternatively, the decommissioning cost can be
distributed evenly over the lifetime as a non-cash flow cost, evened out by
a non-cash flow revenue the final year. This book-keeping maneuver will
not affect the cash flows directly. However, it will lower EBIT (earnings
before interest and tax) in the statement of income and consequently taxes
paid. This implies a lowered cash outflow for year 1-24. Consequently, by
treating the decommissioning cost in accordance with the theoretical
framework, it will provide an undervaluing of projects.
The assumptions that constitute the basis for the financial model have been
made with consideration to its primary purpose, which is to enable a quick
and accurate project valuation. This involves some simplifications, as
previously explained, which are intended to reduce the complexity of the
existing model. However, consideration has been taken so that the
assumptions and simplifications do not overvalue projects, or go against
conventional investment decision praxis. The project’s outcome is intended
to provide a view of the project’s attractiveness and enable a comparison
between projects in order to be able to look at the effects of desired tweaks.
7.3 Decision matrix
The Pugh concept selection constitutes the second dimension in the
business case evaluation method. Each of the chosen technology areas
correspond to a decision to be viewed relative to the reference site’s

72
current configuration. Furthermore, the technological areas must present at
least one specific alternative.
Each focus area represents a decision and is valued by grading each
alternative according to the concept selection matrix. The criteria, by which
each alternative is measured, are intended to cover a wide range of
qualitative aspects that influence the potential decision of investigating new
technology. This implies that some of the criteria will be more or less
relevant to the different decisions. A criterion that has received a 0 in
weighting is considered to be irrelevant to the decision in question.
Furthermore, the possibility to contribute with additional criterion is offered.
For all thirteen technology areas, i.e. decisions, ‘construction time’ was the
only criterion added. This would suggest that the initial criteria, compiled
from interviews, cover the better part of the relevant qualitative aspects. A
complete overview of the criteria can be found in Appendix 4.
As previously mentioned, all decisions have one or more alternatives to be
considered. In fact, for some cases there is only one alternative, which has
to do with the decision being expressed as more or less binary. For
example, the technology regarding permanent-magnet generators implies
that the decision is about whether or not to buy this type of generator. On
the other hand, when considering higher towers, the specific height is a
variable that needs to be known when faced with the decision. This
provides the possibility to create a more dynamic decision-matrix, which is
the case for higher towers, increased rotor diameter, increased generator
output, de-icing system, and tower structures. The decision regarding
higher towers and larger rotor diameter incorporate three alternatives,
namely 125 m, 150 m, 175 m, and 100 m, 126 m, and 164 m. For an
increased generator output there are only two alternatives, 3 and 5 MW,
mainly since a rated output of more than 5 MW is considered to result in
severe practical implications for the onshore area. For the de-icing system

73
there are two alternatives as well. Lastly, concerning tower structures, there
are five different possibilities.
7.4 Combining the financial and qualitative aspects The combination of the financial model with the qualitative analysis will
constitute the business evaluation model. The intersection of the axes
marks the reference point to which all projects are related. The horizontal
axis displays both the relative and actual IRR, to the right if better than the
reference case, and to the left if worse. The vertical axis displays the
qualitative measure which has a maximum value of 200 and minimum -200,
corresponding to the ratings much better and much worse than the existing
configuration at the reference site. Each point will represent all the
alternatives for each decision. Furthermore, it is also possible to compute
desired scenarios and display them in relation to the case site.
Regarding the financial aspect the IRR will be used to display the financial
status of investigated alternatives relative to the base case. However, in
those cases where the IRR and the NPV rule show conflicting results the
NPV will be used as the decisive factor. The reason for displaying the IRR
is that it the most widely known measure and consequently the one people
easiest can relate to.
The evaluation model is intended to be an iterative tool. Once the initial
evaluation round has been finalized further refining can be made. The
analytical approach, described in section 2.2, enables a broader study of
different technological developments, since it focuses on single variable
changes. The impact on the system is considered to consist only of the
direct effects derived from this change. Each component of the WTG is
considered to be part of the wind turbine system, and each turbine is in turn
part of a greater system, i.e. the business case which is the issue of study.
Consequently, after the first evaluation round there are possibilities to make
further estimations and involve additional input data that should be

74
accounted for in a systems perspective. This is mainly concerning the
financial input but not exclusively. After each round the qualitative aspects
could be reexamined as well and subject to additional surveys, which would
further improve the reliability of the results. The focus areas that resulted in
a positive outcome from the previous round will be subject to further
examination.
7.5 Validating the model The validation of the model was carried out according to the initial aim for
ensuring a high credibility, which is described in section 2.6.

75
8. Applying the model In this chapter the initial results from the business case evaluation is
presented. A more extensive discussion regarding financial input
parameters will follow. In addition, a sensitivity analyses in the qualitative
dimension will be done by considering the criteria for each decision.
Moreover, the second evaluation round will be presented. For detailed
information regarding input parameters and assumptions made, see
Appendix 3. Also, in Appendix 4 the full results of the qualitative evaluation
can be found.
8.1 Choice of reference site The Knäred project was initiated in 2010. Construction of the wind farm
began in 2012 and will be completely commissioned by the end of 2012.
The site is located in southwest of Sweden, Laholm county, and represents
a typical onshore project today.151 The wind farm consists of ten 2 MW
turbines with a hub height of 105 m and rotor diameter of 90 m.
Furthermore, the turbines are situated in a forest area, which is considered
to be an appropriate location according to the field of study.
The Knäred case serves as the foundation from which all alternative
decisions will be formed. Choosing Knäred as the reference site will
naturally influence the outcome of the study. All underlying factors, such as
forecasts and wind assessments etc., will consequently be passed on to
the resulting cases.
8.2 Assumptions regarding financial input In addition to the assumptions regarding the financial model, described in
section 7.2, there are further assumptions made regarding the input
parameters in the model. These cover assumptions regarding Euro
exchange rates, cost of certificates and the price for electricity in the
151
Axelsson (2012a)

76
different electricity price zones in Sweden. For the exchange rate, all costs
that have been displayed in Euros have been subject to the same
exchange rate of 9.26 SEK/Euro, which represents the rate used at the
time for the initiation of the Knäred project. Regarding the price of green
certificates and electricity they have been subject to a single assumption
over the WTG lifetime, which can be seen in Table 7. The certificate price
corresponds to the average price during the past five years.152 The chosen
electricity price assumption will later be scrutinized as a sensitivity analysis
will be performed. Furthermore, the price for electricity has also been
subject to a slight increase due to the location of Knäred in price zone SE4.
This is further discussed in section 9.5.
Financial input
Euro exchange rate 9.26 SEK/Euro
Certificate cost 0.25 SEK/kWh
Electricity price 0.50 SEK/kWh
Electricity price (including supplement charge for SE4) 0.58 SEK/kWh
WTG Lifetime 25 years
Table 7 - Assumptions made concerning financial input. Authors’ own.
8.3 Overview decision alternatives Below is a complete overview of the chosen areas within the current
technology development for onshore wind projects. There are a total of 11
focus areas, corresponding to 21 decision alternatives, which can be seen
in Table 8 below. Most of the alternatives have been chosen instinctively
according to the current developments in each area. For increased tower
height, rotor diameter and generator output the alternatives represent
current commercially feasible solutions as well as extreme values.
152
Swedish Energy Agency (2011)

77
1) Performance 2) OPEX 3) CAPEX
1.1 Higher towers 2.1 Direct drive
generator
3.1 Tower
structures
i) 125 m i) Direct drive
generator
i) Friction
joint
ii) 150 m 2.2 De-icing system ii) Concrete
iii) 175 m i) Heating coil iii) Hybrid
1.2 Increased rotor
diameter
ii) Heated air iv) Lattice
i) 100 m 2.3 LIDAR blade pitch v) Wood
ii) 126 m i) LIDAR blade
pitch
3.2 Foundations
iii) 164 m i) Rock
anchoring
1.3 Increased generator
output
3.3 Jointed
blades
i) 3 MW i) Jointed
blades
ii) 5 MW
1.4 Medium voltage
converter
i) 3.3 kV converter
1.5 Permanent-magnet
generator
i) Permanent-magnet
generator
Table 8 – Chosen focus areas including all decision alternatives. Authors’ own.
8.4 First round results - Performance Here, the results from the evaluation of Performance areas are presented.
For increased tower height, rotor diameter, and generator output all
alternatives displayed a financial improvement of the base case, though all

78
performed worse than the base case regarding qualitative aspects.
Incorporating medium voltage converters and permanent-magnet
generators in the turbines, only reduced the attractiveness of the business
case.
Higher towers
There is an improvement of the business case following the increase in
tower height. Both the IRR and NPV rule suggest that a 175 m tower is the
most attractive alternative. However, it should be pointed out that the 175 m
alternative is a hybrid structure with concrete and welded steel segments.
The reason for this inconsistency is simply because a 175 m tower with the
design employed at the reference site is not considered feasible.153 Other
possible tower structures at this height are steel towers with friction joints
and the wooden structure. However, the hybrid structure was chosen since
it is financially more attractive.
The grading of the qualitative aspects displays the reversed situation. As
the tower height increases, so does the liability regarding non-financial
aspects. For the 175 m alternative the grading -88 corresponds to the
increase in height, while the -27 grading represent the change in tower
structure to a hybrid tower.
IRR Qualitative grade, higher
towers
Qualitative grade, tower
structure
NPV
Base case 9.8% 0 92,497
Welded Steel, 125m 10.2% -24 114,023
Welded Steel, 150m 10.4% -69 135,698
Hybrid, 175m 10.7% -88 -27 156,796
Table 9 – Results for increased tower height. Authors’ own.
153
Engström et al. (2012)

79
For different heights the production was simulated using the wind
assessment data from the reference site. Furthermore, the input data for
these alternatives are based on the assumption that the base diameter is
kept within the transportation restrictions. However, for the 175 m
alternative the base diameter is allowed a size of 11.75 m, which is not an
issue since it is a hybrid tower with a concrete bottom part, either
slipformed or assembled on site using pre-fabricated concrete elements.
The results, with a financial improvement following the increase in tower
height, were expected. In addition, the qualitative aspects, reflecting the
greater uncertainty with higher towers, were not surprising either. For the
financial outcome there is room for a more comprehensive analysis. The
initial input data for capital investments do not include costs for
transportation, lift and foundation. The assumption behind this approach is
that once the technology is implemented at a regular basis these costs will
be at a level corresponding to the base case. The additional costs of
transportation, lift and foundation for increased heights are mainly the result
of heavier tower parts, thus requiring larger cranes etc. and perhaps
reinforced foundations.
The qualitative aspects that were considered to be most important for the
development of higher turbine towers mainly concerned public acceptance
and the uncertainties of unproven technology. Public acceptance is an
important factor when developing wind power projects and may be
hindering when applying for necessary permits. Moreover, when reaching
heights above 125 m there is limited amount of experience and knowledge
in the industry, which is further articulated in the negative grading for
manufacturer alternatives. Finally, concerns regarding maintenance and
accessibility are raised with increasing tower heights.

80
Figure 14 – Results for increased tower height. Authors’ own.
Increased rotor diameter
For the increased rotor diameter the business case shows a significant
improvement following the increase of blade length. Both IRR and NPV
suggest all three alternatives perform better than a 90 m diameter, which is
employed at the reference site. However, regarding the qualitative aspects,
all three alternatives perform worse than for the diameter at the reference
site.
9% 10% 11%
IRR
Qualitative grade
Base case
Welded Steel, 125m
Welded Steel, 150m
Hybrid, 175m
Better
Much better than
Worse than
Much worse than

81
IRR Qualitative grade, increased rotor
diameter
NPV
Base case 9.8% 0 92,497
100 m 13.9% -33 213,192
126 m 15.4% -96 302,195
164 m 16.7% -163 408,120
Table 10 – Results for increased rotor diameter. Authors’ own.
The financial evaluation is based on estimations of increased capital
investment, OPEX and performance increase due to longer blades. Power
curves for a 2 MW turbine with the desired rotor diameter were needed to
perform the production simulations. Since these power curves could not be
found they had to be estimated by using several turbines with the desired
output and existing diameters. The improved financial outcome is
unsurprising, mainly due to the strong correlation between energy output
and rotor swept area. However, the cost inputs only take into consideration
the increase in CAPEX due to material increase, and assumptions for
increased maintenance. One major aspect for the two longer alternatives
are the transportation restriction, which will probably further reduce their
attractiveness if taken into consideration. Perhaps the only feasible solution
is to divide the blades for those exceeding the restricted length of 55 m.
The above mentioned difficulties with longer blades are emphasized in the
qualitative assessment. The main concerns involved different aspects of
logistics. First, the site delivery is an issue when transporting long blades
by road. Second, construction logistics, which involve lifting and
construction of roads at the site, is a limiting factor as well. Furthermore,
the loads on both nacelle/blades and the tower/foundation may potentially
have a negative impact and need to be investigated further. Finally, the
issue of acquiring necessary permits is once again raised, which is a highly
relevant concern as turbines grow larger.

82
Figure 15 – Results for increased rotor diameter. Authors’ own.
Increased generator output
For the two alternatives for higher generator output the results are similar to
the previous. Both the IRR and NPV rule supports a 3 MW generator over
the 2 MW employed at the reference site, and ultimately the 5 MW option
above both. However, it must be stated that for both cases the
improvements in IRR and NPV are also a result of increased rotor
diameter. The outcome of the 3 MW case is based on a rotor diameter of
112 m, and the 5 MW case on a diameter of 126 m. This will naturally, as
seen in the previous table, act as an additional factor impacting the
business case. The reason for this approach was due to difficulties of
9% 11% 13% 15% 17%
IRR
Qualitative grade
Base case
100 m
126 m
164 m
Better than
Much better than
Worse than
Much worse than

83
acquiring power curves for generators of the desired size with a rotor
diameter of 90 m.
Also similar to the previous results, both alternatives perform worse than
the base case regarding qualitative aspects and increasingly so with higher
generator output.
IRR Qualitative grade, increased generator output
Qualitative grade,
larger rotor diameter
NPV
Base case 9.8% 0 92,497
3 MW 16.9% -14 -33 344,357
5 MW 20.7% -68 -96 528,386
Table 11 – Results for increased generator output. Authors’ own.
The generator alternatives show a significant financial improvement and as
previously stated the results are enhanced due to the use of power curves
that also are based on turbines with larger rotor diameters. Furthermore,
the capital and operational expenditure only take into consideration the cost
of the actual generator and the operation and maintenance of it, as well the
same for the longer blades. However, incorporating a generator with higher
output will affect the entire design of the turbine, including other mechanical
components and power electronics. These aspects will most likely reduce
the financial improvements.
Furthermore, the criteria impacting the qualitative assessment are
widespread. Concerns regarding logistics are raised due to the followed
increase in size for the generator as well as other components. This
concern is also expressed in the measure for nacelle weight, which is
expected to increase as well, thus possibly affecting tower and foundation
dimensioning. Moreover, HSSE issues are raised due to increased safety
risks when working with larger components. Lastly, none of the output
alternative is considered to be proven enough to be without uncertainties.

84
Figure 16 – Results for increased generator output. Authors’ own.
Medium voltage converter
Incorporating a medium voltage converter in the turbines has a negative
effect on the business case. Both financial and qualitative aspects are
reduced and consequently this is the first decision alternative that performs
worse than the base case in both dimensions.
9% 13% 17% 21% IRR
Qualitative grade
Base case
3 MW
5 MW
Better than
Much better than
Worse than
Much worse than

85
IRR Qualitative grade, medium voltage
converter
NPV
Base case 9.8% 0 92,497
3.3 kV 9.6% -80 88,184
Table 12 – Results for the 3.3 kV converter. Authors’ own.
The estimations made for a 3.3 kV converter include the additional cost for
the converter, increased maintenance costs due to need for highly trained
personnel, as well as the specified efficiency rate. Theoretically, there are
expectations that a higher voltage converter would reduce some of the
losses that occur when transforming the current. However, this has not
been possible to estimate which is why the medium converter does not
amount to any effects on performance. Consequently, the negative financial
outcome of this decision corresponds to the increase in both CAPEX and
OPEX.
The main qualitative aspect of implementing a higher voltage converter has
to do with the increased safety risk. When a component reaches a voltage
output of 1000 V it is required to have service personnel with additional
electric training is required. Further criteria that resulted in the negative
evaluation concern mainly proven technology and manufacturer
alternatives. The use of higher voltage converters is almost non-existent in
the lower megawatt range.

86
Figure 17 - Results for the 3.3 kV converter. Authors’ own.
Permanent-magnet generator
Regarding the permanent-magnet generator it performs quite similar to the
voltage converter, however not as bad in the qualitative aspects.
Nevertheless, this alternative performs worse than the business case in all
three measures.
IRR Qualitative grade, permanent-
magnet generator
NPV
Base case 9.8% 0 92,497
Permanent-magnet generator 9.6% -1 89,239
Table 13 – Results for the permanent-magnet generator. Authors’ own.
9% 10%
IRR
Qualitative grade
Base case
3.3 kV
Better than
Much better than
Worse than
Much worse than

87
The estimations made for a permanent-magnet generator include the
additional cost for the generator, increased maintenance costs since the
synchronous generator is larger, as well as the corresponding power curve
for a 2 MW turbine with a permanent-magnet generator. The results are
somewhat surprising, since it is expected that a synchronous generator can
produce more since it operates at a variable rotation speed. However, the
production simulation for the chosen permanent-magnet generator resulted
in a similar production as the base case turbine.
The qualitative evaluation of the permanent-magnet alternative is only
somewhat negative in relation to the base case. One major aspect
supporting the choice is the strong compliance to grid demands expected
by a synchronous generator. Furthermore, concerns regarding HSSE
issues and maintenance accessibility are once again raised. This is mainly
due to the fact that a permanent-magnet generator will increase in size and
incorporate strong magnets, thus increasing the liabilities concerning safety
and maintenance.

88
Figure 18 – Results for the permanent-magnet generator. Authors’ own.
8.4 First round results - OPEX Here, the results of the evaluation for the OPEX category are presented.
The results for these three focus areas all share a similar pattern in the
outcome of the financial dimension, and in the positive qualitative grading
for all alternatives. Furthermore, all the better alternatives displayed a lower
IRR than the base case while having a higher NPV. A higher net present
value states that the project has earns the highest value over the entire
lifetime. This will be further discussed following the presentation of the
results.
9% 10%
IRR
Qualitative grade
Base case
Permanent-magnet generator
Better than
Much better than
Worse than
Much worse than

89
De-icing system
Looking at the two de-icing alternatives they perform quite similar to each
other. The heated air option is slightly better financially than the heating
coil. Nevertheless, none of the two perform better than the base case
according to the IRR. However, the heated air system has the better NPV
suggesting that this alternative performs better. As previously mentioned
this will be addressed further later on.
Considering the qualitative grading both alternatives perform better than
base case. The heated air alternative is yet again the stronger choice,
consequently having an overall positive impact on the business case.
IRR Qualitative grade, de-icing system
NPV
Base case 9.8% 0 92,497
Heating coil 9.6% 108 90,624
Heated air 9.7% 132 92,799
Table 14 – Results for the de-icing systems. Authors’ own.
When evaluating the de-icing systems the assumption is made that they will
eliminate the entire production loss due to icing. For the heated air
alternative this production loss is not entirely eliminated since the turbine is
stopped temporarily while the ice is being removed. The data for the
production loss are from production simulations during winter months at a
site with similar conditions as the Knäred site. The CAPEX is included, as
well as cost estimations for operation and maintenance. In addition, both
designs require a certain energy consumption for removing the ice, which is
however not included in evaluation due to difficulties of acquiring this
information for both designs.
The major qualitative aspect that is highlighted for both alternatives is the
improved safety aspects concerning work environment and third party risk,
as a consequence of implementing systems that can efficiently detect and

90
remove icing on turbines. Maintenance accessibility is also considered a
positive consequence, as well as the increased amount of potential project
sites. On the other hand, some concern was raised on aspects regarding
the time to commercial development.
Figure 19 - Results for the de-icing systems. Authors’ own.
LIDAR based blade pitch control
The resulting evaluation for the LIDAR based blade pitch system shows the
similar situation as for the heated air de-icing system. The NPV is higher
than for the base case but the IRR suggests the reversed ranking.
Furthermore, there is a minor improvement in the qualitative dimension as
a further consequence.
9% 10% IRR
Qualitative grade
Base case
Heating coil
Heated air
Better than
Much better than
Worse than
Much worse than

91
IRR Qualitative grade, LIDAR blade pitch
NPV
Base case 9.8% 0 92,497
LIDAR blade pitch 9.7% 33 93,236
Table 15 - Results for LIDAR pitched control system. Authors’ own.
For the pitch control solution the CAPEX for the system is included, as well
as estimations regarding operation and maintenance, as well as the
estimated load reduction. Furthermore, the percentage of estimated load
reduction as a result of LIDAR based blade pitch is assumed to correspond
proportionally to a reduction in OPEX. However, no consideration is taken
to the necessary configuration of the blades since the exact layout of the
pitch control is not specified. Therefore, the assumption is that the LIDAR
system can be implemented with the current individual blade pitch control.
The positive outcome in the qualitative grading is mainly due to the
expected reduction of loads on the rotor and thus mechanical components.
Subsequently, the number of site possibilities increases as well the
possibility to construct WTGs at closer distance to each other. Aspects that
remain uncertain involve the stability of the system and key component
availability.

92
Figure 20 - Results for LIDAR pitched control system. Authors’ own.
Direct drive generator
The results for the direct drive system are treated similarly by the IRR and
NPV rule, i.e. the IRR suggest the base case is the better while NPV and
the qualitative assessment indicate otherwise.
IRR Qualitative grade, direct drive generator
NPV
Base case 9.8% 0 92,497
Direct drive generator 9.7% 28 99,696
Table 16 – Results for direct drive generator. Authors’ own.
9% 10%
IRR
Qualitative grade
Base case
LIDAR blade pitch
Better than
Much better than
Worse than
Much worse than

93
When evaluating the option of using a direct drive generator the
assumptions were made with emphasize on the structural design of such a
turbine, since it proved difficult to acquire this information otherwise.
Starting with the base case turbine, the generator is replaced with a 2.3
MW synchronous generator, and the gearbox is entirely removed. The
CAPEX for this arrangement will increase with the additional cost of the
generator, while it is reduced with the removal of the gearbox. The OPEX
will be favored due to the elimination of gearbox changes, while
performance is estimated to be similar to the base case.
For the results of the qualitative evaluation the same reasoning as for the
permanent-magnets is applied. Furthermore, the aspects of proven
technology where raised as the biggest concern, as well as the limited
number of manufacturer alternatives.

94
Figure 21- Results for a direct drive generator. Authors’ own.
8.5 First round results - CAPEX The results regarding the CAPEX alternatives are presented below.
Regarding tower structures they all perform quite similar but there are only
two alternatives that perform better than the base case, i.e. wood and
lattice. However, they all receive a negative grading in the qualitative
dimension, which could be expected due to their limited track record.
Furthermore, the structures with the most limited track record are perhaps
lattice and wood, which might imply a greater uncertainty in the financial
input.
9% 10%
IRR
Qualitative grade
Base case
Direct drive generator
Better than
Much better than
Worse than
Much worse than
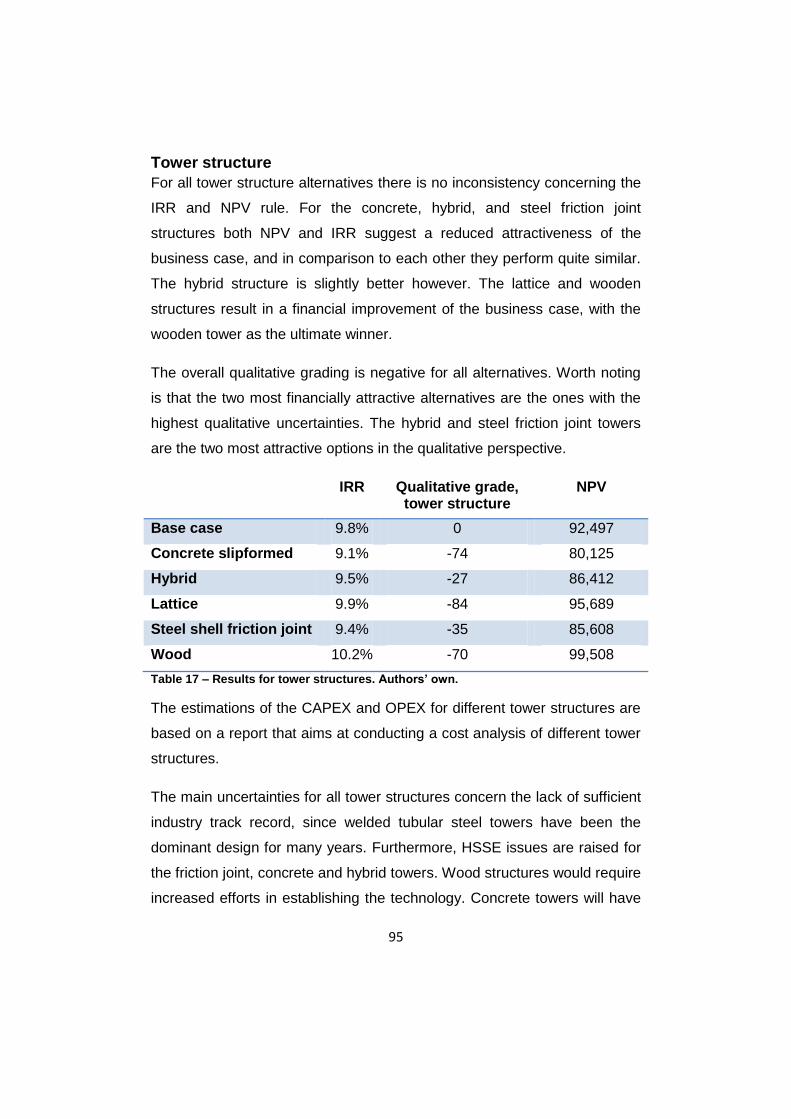
95
Tower structure
For all tower structure alternatives there is no inconsistency concerning the
IRR and NPV rule. For the concrete, hybrid, and steel friction joint
structures both NPV and IRR suggest a reduced attractiveness of the
business case, and in comparison to each other they perform quite similar.
The hybrid structure is slightly better however. The lattice and wooden
structures result in a financial improvement of the business case, with the
wooden tower as the ultimate winner.
The overall qualitative grading is negative for all alternatives. Worth noting
is that the two most financially attractive alternatives are the ones with the
highest qualitative uncertainties. The hybrid and steel friction joint towers
are the two most attractive options in the qualitative perspective.
IRR Qualitative grade, tower structure
NPV
Base case 9.8% 0 92,497
Concrete slipformed 9.1% -74 80,125
Hybrid 9.5% -27 86,412
Lattice 9.9% -84 95,689
Steel shell friction joint 9.4% -35 85,608
Wood 10.2% -70 99,508
Table 17 – Results for tower structures. Authors’ own.
The estimations of the CAPEX and OPEX for different tower structures are
based on a report that aims at conducting a cost analysis of different tower
structures.
The main uncertainties for all tower structures concern the lack of sufficient
industry track record, since welded tubular steel towers have been the
dominant design for many years. Furthermore, HSSE issues are raised for
the friction joint, concrete and hybrid towers. Wood structures would require
increased efforts in establishing the technology. Concrete towers will have

96
a negative impact on logistics because of heavy transportation to the site.
Lattice towers involve further concerns regarding public acceptance since
the visual feature of the tower might be considered to have a negative
impact. To conclude, there are more or less uncertain aspects influencing
all alternatives due to the lack of experience.
Figure 22 – Results for tower structures. Authors’ own.
Rock anchoring foundation
The rock anchoring foundation has a positive outcome in both aspects of
the business case. However, the assumptions behind the data are
uncertain and furthermore the result from this case will be difficult to
generalize to a wider extent. The financial improvement is based on the
assumption that the relative economic improvement for the rock anchoring
solution compared to the gravity foundation corresponds to the cost
9% 10%
IRR
Qualitative grade
Base case
Concrete slipformed
Hybrid
Lattice
Steel shell friction joint
Wood
Better than
Much better than
Worse than
Much worse than

97
reduction when no long requiring the anchor cage. The data for this input is
a reasonable assumption based on multiple sources. However, the
circumstances that affect the choice of foundation are not entirely
geotechnical. When taking into consideration the distance to a concrete
station it may eliminate the cost reduction, since the additional material for
crane areas will be required. Nevertheless, in these calculations it is
assumed that the concrete station is sufficiently far away and that the issue
with the crane areas is solved.
The qualitative assessment showed a positive impact regarding
construction time, permit process and construction logistics. Concern was
mainly raised on maintenance issues and uncertainties about the effect on
WTG lifetime.
IRR Qualitative grade, foundation
NPV
Base case 9.8% 0 92,497
Rock anchoring 10.0% 10 96,410
Table 18 - Results for rock anchoring foundation. Authors’ own.

98
Figure 23 - Results for rock anchoring foundation. Authors’ own.
Jointed blades
For the final decision alternative jointed blades have only been subject to
the qualitative assessment. The reason for this is partly due to difficulties in
acquiring financial data. Most onshore projects that are being developed
today do not incorporate turbines with blades that exceed the length
restriction imposed by transportation. Therefore, there are a limited number
of suppliers that can offer this solution. However, jointed blades are
included since they are basically a necessity when it comes to building
turbines with larger rotor diameters. There is probably several other
solutions for getting by the transport restriction but they are assumed to be
more costly.
9% 10%
IRR
Qualitative grade
Base case
Rock anchoring
Better than
Much better than
Worse than
Much worse than

99
The qualitative grading is overwhelmingly negative. The main uncertainties
can yet again be derived from the lack of industry experience. Additionally,
there are concerns regarding loads and fatigue on the rotor, as well as the
logistics around the assembly on site. The total weighted sum for the
assessment of jointed blades corresponds to -123.

100

101
9. Additional evaluation rounds
This chapter will present the evaluation rounds following the previous
results, as well as a sensitivity analysis regarding the final results. Further
evaluation rounds were performed after having analyzed the initial
outcome. Some of the areas were chosen to be examined further with the
aim of applying a more systemic approach and thus performing more
detailed estimations regarding some of the cost structures. Finally, a
sensitivity analysis is performed regarding uncertain parameters in the
financial model.
9.1 Second round results - Performance
Higher towers
The further approximations include estimations in additional capital
expenditure for transportation, lift and foundation costs for the different
tower height alternatives. When taking this into account the two highest
tower alternatives have reduced their attractiveness, mainly due to
substantial costs for lifting at 150 and 175 m. The changes are presented
below in table 17.
IRR Qualitative grade, higher
towers
Qualitative grade, tower
structure
NPV
Base case 9.8% 0 92,497
Welded Steel, 125m 10.0% -24 109,673
Welded Steel, 150m 9.5% -69 114,085
Hybrid, 175m 8.3% -88 -27 89,954
Table 19 – Results for higher towers in the second evaluation round. Authors’ own.
Increased rotor diameter
In the further examination of the cost structure for longer blades the
assumption is that, for blades exceeding the transportation limit of 55 m,
they are divided into two parts. This will lead to an increase in
transportation costs, resulting in the outcome below, table 20.

102
IRR Qualitative grade, larger rotor diameter
NPV
Base case 9.8% 0 92,497
100 m 13.9% -33 213,192
126 m 15.3% -96 296,670
164 m 16.4% -163 397,501
Table 20 - Results for increased rotor diameter in the second evaluation round. Authors’ own.
Increased generator output
When analyzing the impact on the turbine assumptions are made for
additional costs for components that inevitably need to be adjusted for. The
results are somewhat lowered, however both are still considered to be
attractive. Interestingly, the 3 MW is favored by the IRR rule due do its
higher percentage of return, but the choice of a 5 MW generator will still
provide the highest value project. The results can be seen in table 21
below.
Medium voltage converter
No further approximations are made. However, there are additional costs
due to the salary increase for qualified personnel corresponding to
approximately 400 SEK/h.154
Permanent-magnet generator
No further approximations are made.
IRR Qualitative grade, increased generator
output
Qualitative grade, larger
rotor diameter
NPV
Base case 9.8% 0 92,497
3 MW 14.6% -14 -33 306,159
5 MW 13.0% -68 -96 364,683
Table 21 - Results for increased generator output for the second evaluation round. Authors’ own.
154
Sjöbeck (2012)

103
9.2 Second round results – OPEX
De-icing system
No further approximations are made. However, there is a need to look
closer into the energy consumption of the de different systems.
LIDAR based pitch control
No further approximations are made. However, there is an interesting
aspect in the implementation of yaw control using LIDAR which could be
complemented with the blade pitch control, and thus increasing
performance further.
Direct drive generator
No further approximations are made. One aspect for potential concern is
the weight of the nacelle due to a direct drive solution. However, the overall
weight is expected to decrease as a result of the direct drive design. If not,
this could affect the structural design of towers and foundations, as well as
increased transportation and lifting costs.
9.3 Second round results - CAPEX
Tower structure
The further approximations include similar estimations in capital
expenditure as made for higher towers, i.e. additional costs for
transportation, lift and foundation due to the different tower structures. For
some structures this implies reduced costs for these activities and therefore
improves their financial attractiveness. These can be seen in table 22.

104
IRR Qualitative grade, tower structure
NPV
Base case 9.8% 0 92,497
Concrete slipformed 9.3% -74 82,643
Hybrid 9.4% -27 85,389
Lattice 9.8% -84 93,728
Steel shell friction joint 9.4% -35 85,401
Wood 9.8% -70 92,197
Table 22 - Results for towers structures in the second evaluation round. Authors’ own.
Rock anchoring foundation
No further approximations are made. A scenario analysis could be done in
order to estimate the break-even distance for the concrete station, thus
implying when each alternative is most advantageous.
Jointed blades
No financial evaluation was made for jointed blades.
9.4 Third round results The third and final evaluation round is performed in order to identify cases
that are profitable without the additional revenues from certificates. The
following table presents the IRR and NPV, with the same qualitative
grading as previous, for the cases from the second evaluation round, with
the exception that the subsidies are removed. As can be seen, the Knäred
project has a negative NPV and consequently a non-attractive project
financially. The best case is unsurprisingly provided with a 164 m rotor
diameter, which is also the one with the lowest qualitative grading.
Furthermore, both generator options are included as well as the remaining
two increases in rotor diameter.

105
IRR NPV
Base case 5.6% -12,737
100 m 8.9% 79,591
126 m 10.1% 133,033
3 MW 9.8% 134,963
5 MW 8.8% 145,019
164 m 11.1% 198,099
Table 23 – Financial results without green certificates. Authors’ own.
In Table 24 below, the alternatives are shown that financially improve the
base case when the certificates are removed. However, none of them
manage to make it independent from subsidies.
IRR NPV
Base case 5.6% -12,737
LIDAR blade pitch 5.6% -11,986
Lattice 5.6% -11,503
Rock anchoring foundation 5.8% -8,816
Welded Steel, 125m 5.9% -5,737
Direct drive generator 5.9% -5,216
Table 24 – Financial results without green certificates. Authors’ own.
In Table 25 below, the remaining focus areas with the certificates removed
are present. All of them contribute to reducing the financial attractiveness of
the base case to some extent. Noteworthy, is that the tower height increase
to 150 m displays a relatively positive IRR while the NPV is lower than for
the base case.

106
IRR NPV
Hybrid, 175m 5.0% -46,243
Concrete slipformed 5.2% -22,608
Hybrid 5.3% -19,858
Steel shell friction joint 5.3% -19,845
Medium voltage converter 5.4% -17,118
Permanent-magnet generator 5.5% -16,001
De-icing coil 5.5% -15,367
De-icing air 5.6% -13,188
Wood 5.6% -13,037
Welded Steel, 150m 5.7% -12,839
Base case 5.6% -12,737
Table 25 – Financial results without green certificates. Authors’ own.
9.5 Sensitivity analysis In order to identify the margin for uncertainty a sensitivity analysis has been
performed. This analysis focuses mainly on the price of electricity since it is
perhaps the most volatile parameter in the financial model and thus difficult
to forecast, while at the same time it has a large impact on the outcome.
Furthermore, the analysis focuses on the total cost of the WTG, in order to
see how sensitive the results are to changes in factors that are considered
to be included in the price of the turbines, e.g. material and labor costs etc.
The mentioned results that have been subject to this sensitivity analysis are
from the outcome of the third evaluation round, i.e. the technology areas
that show potential of eliminating the certificates from the business case. In
the Figure 24 below the initial analysis regarding the electricity price is
presented. These alternatives manage to be profitable without the
certificates, and the results from the sensitivity analysis show that they are
able to maintain this profitability in the case of a price reduction of about 20
– 30 % relative to the flat electricity price assumed in the financial
evaluation.

107
Figure 24 – Result of sensitivity analysis for the NPV as the electricity price is reduced. Authors’ own.
Furthermore, the table below shows the actual break-even price for the
analyzed areas along with a comparison to the mean spot price per kWh in
price zone SE4, which corresponds to 0.44 SEK/kWh.155 The 5 MW and
the 100 m rotor diameter turbine require a minimum electricity price that is
slightly higher than the average spot price in price zone SE4, thus implying
they would not receive enough revenues to maintain profitability without
certificates. For the remaining areas they manage to receive a sufficient
revenue stream to maintain profitability without certificates, however not
significantly.
155
The mean price is based on the Nordpool spot price during 2006-2010 before the price zones were implemented together with the mean price for price zone SE4 from the time of its introduction. The basis for this estimation is found in Appendix 1.
0
50 000
100 000
150 000
200 000
250 000
0% 10% 20% 30% 40%
NP
V (
kSEK
)
Electricity price decrease
3MW
5MW
100 m
126 m
164 m

108
Min. price limit
(SEK/kWh)
Relative to mean spot price
(SEK/kWh)
3 MW 0.44 0
5 MW 0.46 - 0.02
100
m 0.48 - 0.03
126
m 0.43 0.01
164
m 0.39 0.05
Table 26 – The minimum required electricity price for the areas that displayed profitability without certificates, compared to the average spot price on electricity in SE4. Authors’ own.
In Figure 25 below, an analysis has been conducted regarding a cost
increase for the entire turbine, which could be a result of increased material
costs for example. All alternatives manage to withstand a substantial cost
increase for the turbine and still sustain a profitable business case without
green certificates.

109
Figure 25 - Result of sensitivity analysis for the NPV as the overall turbine cost increases. Authors’ own.
In addition, a LCOE156 (Levelized Cost of Energy) analysis has been
performed on the third round evaluation results, which can be seen in the
table below. The LCOE determines the price that a specific source of
energy requires in order to break even. It is an economic assessment of
energy systems, taking into account all costs over its lifetime. However,
compared to financial model employed in this study the LCOE does not
take into consideration effects of possible accounting procedures, e.g.
depreciation, corporate tax etc. Nevertheless, comparing the results from
the LCOE analysis to the break-even prices based on NPV shows that they
are nearly identical. This is perhaps not too surprising since the input
parameters are the same. However, comparing these to other LCOE
156
A more detailed description can be found in Appendix 2.
0
50 000
100 000
150 000
200 000
250 000
0% 10% 20% 30% 40% 50% 60% 70% 80% 90%
NP
V (
kSEK
)
Increased WTG cost
3MW
5MW
100 m
126 m
164 m

110
studies and energy sources further enables the possibility to investigate the
competitiveness of the different alternatives.
LCOE (SEK/kWh) Price break-even for NPV (SEK/kWh)
3 MW 0.46 0.44
5 MW 0.48 0.46
100 m 0.50 0.48
126 m 0.45 0.43
164 m 0.41 0.39
Table 27 – LCOE and break-even price based on NPV (Table 26). Authors’ own.

111
10. Discussion This chapter is intended to present further discussions regarding the
outcome of the business model evaluation, as well as the sensitivity
analysis concerning the results.
10.1 First evaluation round In the first evaluation round for higher towers the best performing
alternative was the 175 m hybrid tower. For the remaining heights and with
the welded tubular steel structure the second best was the 150 m followed
by 125 m heights. However, for the 150 and 175 m options there are
substantial qualitative factors that are limiting. Furthermore, these factors
will result in a lowering of the financial attractiveness when taken into
consideration, which is done in the second evaluation round. Assuming a
further developed industry that has adapted to the uncertainties expressed
in the qualitative assessment the results are more likely to represent the
actual outcome.
The results for increased rotor diameter show a significantly improved
business case following the increase in blade length. This is as previously
stated due to the strong correlation between energy output and the swept
area. In addition, the estimations for material and maintenance costs are
considered linear. However, the major concerns are with the transportation
regulations, as well as public acceptance and the acquiring of permit.
Implementing jointed blades is a technically feasible solution to the problem
with logistics. Further implications regarding the financial aspect should
therefore be investigated.
The results for increased generator output also show a significant
improvement of NPV and IRR. However, these results are misleading since
the production simulations are based on power curves from turbines that
have larger blades as well. What can be concluded from this inconsistency
is that the combination of a larger generator and rotor diameter is

112
interesting to investigate further. However, the cost analysis for a turbine
that implements a larger generator should involve an analysis of the effect
on other components. The attempt to estimate these additional costs is
done in the second evaluation round.
From the results concerning the higher voltage converter the conclusion
can be drawn that a medium voltage converter does not improve the
business case with the current circumstances. At least as long as the
potential elimination of production losses cannot be estimated. However,
for very large turbines these production losses may be substantial enough
for further investigation, as well as for the offshore market. Furthermore,
there are some practical implications that are reasonably considered as
decisive in favor for the current low voltage converter, i.e. the safety
requirements for components above 1000 V.
The results for the permanent-magnet generator suggest that it does not
offer a sufficient enough improvement to be included. Also, the situation
regarding the supply of neodymium magnets is another limiting issue.
However, in a qualitative aspect the p-m generator performs pretty much
similar to the base case. The major expectations are that it will contribute to
stabilizing the grid, but at the same time there are concerns regarding its
track record. Furthermore, the production estimations are the same as for
the regular generator, which will disfavor this option as long as there is no
additional production increase. Finally, given the situation the results do not
suggest that implementing a permanent-magnet generator will improve the
business case as a whole.
As for the financial results for the OPEX alternatives there were several
cases showing a lower IRR but higher NPV than the base case. This is an
interesting finding, since the general investment decision rule states that for
mutually exclusive projects the project with the highest NPV should be
chosen. It is furthermore interesting to see that this is the case for the

113
outcome in the OPEX category. This suggests that these alternatives are
disfavored due to the fact that cash flow occurring later are considered to
be less valuable. Consequently, the rate of return will reward projects that
pay back faster. However, looking at the entire lifetime of the project the
best decision is the one with the highest NPV.
The evaluation of the de-icing systems shows that there is a significant
demand for a functioning de-icing system, and that it even has the potential
of improving the business case. For developers the main incentive for
implementing a de-icing system is safety concerns, even at a point where it
costs more than it increases the value of the project. However, if there is a
financial incentive involved as well it might speed up the technology
development. Furthermore, the simulated production losses are from a site
located in southern Sweden with relatively low ice formation. This suggests
that a functioning de-icing system would enable the development of wind
farms in even colder climates. The results indicate that the heated air
solution is the one to prefer since it performs better in all measures.
However, for further analysis the energy consumption is a determining
factor as well and should be included.
The LIDAR based blade pitch control shows the same results as the heated
air de-icing system, namely a higher NPV and qualitative grading than the
base while displaying a lower IRR. The main conclusion is that it might be
profitable to implement a LIDAR system in the turbine. However, the main
uncertainty concern the configuration of the blades, so the results are
assuming the system is incorporated with the current pitch control.
Furthermore, there are studies suggesting that using the LIDAR system for
the yaw control as well could boost performance by some percentage.
Also, for the direct drive solution the NPV and qualitative grading support
the implementation of this design. The overall advantage of the direct drive
system is the elimination of the gearbox replacements as well as the overall

114
reduction of maintenance. The cost for not having to deal with gearbox
changes have a great impact on the business case, which can be seen by
looking at the NPV, but it does not yield a higher rate of return since the
changes occur after several years. Furthermore, the main concern with
implementing a direct drive solution involves proven technology and limited
number of suppliers that can offer the solution. The design has been used
by Enercon for many years which further suggest that once the initial
obstacles are overcome it is potentially an attractive solution. This is further
supported by the increasing number of turbine supplier emerging with a
direct drive solution.
The initial results for tower structures suggest that wooden towers are the
financially most attractive choice, followed by the lattice structure. Affecting
these results are the limitations in data especially for these two alternatives.
Furthermore, adding the qualitative assessment to the discussion, which
proved to be the two lowest score, it seems that both wooden and lattice
towers display too many uncertainties to viewed as competitive
alternatives. Wooden towers mainly have concerns with the limited
experience for wind turbine applications. Lattice towers are on the other
hand perhaps more applicable on a commercial scale, but the public
acceptance will still have a strong impact on the decision. Concrete and
friction joint towers are proven to be less financially attractive than for the
welded steel structure in the base case. Concrete towers will require more
labor and for the friction joints they will induce higher maintenance costs.
The final structure, consisting of both a concrete bottom part and a welded
tubular steel part, does not perform better either. This has most likely to do
with the fact that the tubular steel tower has been rationalized for many
years, thus serving as the most cost-efficient tower design. However, at
heights beyond a hundred meters there should be an opportunity for
alternative structures to emerge as a commercial alternative. This is
suggested by the results in the second evaluation round for increased

115
tower height. Since a 175 m tubular steel tower was not considered feasible
a hybrid structure was chosen to be able to keep the 175 m alternative. As
the results suggest, the opportunity may lie in the increase in production for
higher towers, thus allowing alternative structures some margin to establish
the technology.
The financial outcome for the rock anchoring foundation is perhaps too
uncertain to be able to draw any general conclusions. However, the
qualitative aspects have highlighted a foundation design that is the
preferable solution. Also, under the right circumstances it may also
contribute to improving the business case. This trade-off can easily be
calculated for each project. Furthermore, the rock anchoring solution has a
lower environmental impact and reduces the amount of heavy
transportation to the site. It will also contribute to an increase in number of
site possibilities. To conclude, this foundation is considered to be a highly
interesting design given the right circumstances.
10.2 Second evaluation round In the second evaluation round the tower height alternatives were subject to
a more comprehensive cost analysis. When including the estimations of the
additional costs for transportation, lifting, and foundation the highest tower
alternatives became less attractive. This resulted in the 150 m height as the
financially most interesting with the 125 m alternative followed after. On the
other hand, a 150 m welded tubular steel tower is at the upper limit of what
is considered economically feasible while keeping the base diameter fixed,
which leads to believe there is perhaps a greater uncertainty in this positive
outcome. This together with the qualitative grading in mind suggests that a
125 m is the better option, at least with the current design.
The further evaluation for increased rotor diameter have been subject to
additional cost estimations for dividing the blades, which resulted in
reduced NPV for the two alternatives exceeding the transportation limit.

116
However, the costs for the joints to be made and assembled on site were
not possible to acquire, but should however be examined further.
The second round results for the two generator alternatives reduced the
attractiveness in the same manner as for the rotor diameter. Consequently,
there is no change in the ranking of the 2, 3 or 5 MW generator. However,
when considering the qualitative aspects the 5 MW turbine seems to be the
least feasible alternative. The main issue is the substantial increase in size,
not only for the generator itself but most WTG parts, and the issues that
follows with it, i.e. maintenance and safety issues, public acceptance and
permit issues, as well as increased difficulties for logistics services.
The second evaluation round for tower structures where subject to the
same additional parameters as for the increased tower heights. To no
surprise all alternatives are lowered in the financial dimension, thus
resulting in the lattice tower as the ultimate winner. Since the results display
pretty much the same situation as after the initial evaluation the same
reasoning is applied here.
10.3 Third evaluation round The third and final evaluation round is performed in accordance with the
overall purpose of this study. In order to draw conclusions on whether or
not the general business case can sustain its profitability without subsidies,
all decisions are evaluated disregarding the additional revenue streams
from certificates. The result from this evaluation displays a rather consistent
choice of technology areas. This has mostly to do with the fact that they
have a strong impact in the performance input. Increasing generator output
as well as rotor diameter should be suggested as actions to further enable
sustainable projects, which is accordance with the historic development.
However, the limitations for onshore projects are imposing constraints on
further development, which is currently starting to be recognized. Perhaps
this is most visible for the development of towers, where limitations due to

117
size increase are already affecting the business case. There are 125 m
welded steel towers under construction but with reinforced walls in order to
meet load requirements. This explains the reduced improvements for
higher towers despite the substantial performance increase. Regarding the
qualitative aspects the same reasoning is applied here. When weighing all
this in the choice most likely to succeed is the 3 MW turbine, which also
has a rotor diameter of 112 m. Given the current circumstances in
transportation restrictions this is more or less the upper limit regarding the
continued technology development for onshore turbines.
10.4 Sensitivity analysis The sensitivity analysis regarding the price for electricity reveals a rather
low margin of profitability. The previously five top performing alternatives
are reduced to three, since the 5 MW and 100 m rotor diameter turbine
requires a minimum price for electricity that is higher than the mean price in
price zone SE4. Furthermore, the additional revenue stream as a result of a
higher price in this area is necessary for the remaining alternatives to
sustain their profitability independent of certificates. Also, since the
Swedish electricity price zones only have been in effect for less than a year
it is difficult to draw any general conclusions regarding the price
development. However, the LCOE analysis and the break-even prices
based on NPV (Table 25, 26) show that the required price for sustaining
profitability are reasonably competitive. Comparing the outcome from the
sensitivity analysis to the cost of energy from studies on wind power
projects similar to Knäred, which corresponds to 0.57 SEK/kWh, shows that
the LCOE for the third round alternatives is in the range of 0.07 – 0.16
SEK/kWh less, without subsidies and using an almost identical WACC.157
Regarding the margin for increasing the overall capital expenditure the
analysis shows that the five top performing alternatives can maintain
157
Nyström et al. (2011)

118
profitability despite a substantial increase in WTG cost. This margin is
considered highly important since it is likely to be exploited by the
manufacturers since they will require coverage for R&D activities etc.
Furthermore, some of the calculations are based on material costs at a
given time for a given Euro exchange rate, which with fluctuations in both
material and labor cost together with currency variations will impact the
financial status of the projects.

119
11. Conclusions and final remarks
In this final chapter, conclusions relating to the purpose and objectives are
presented. Furthermore, the general credibility of the evaluation model and
results are discussed. Finally, remarks regarding improvements and areas
for further study are suggested.
11.1 Conclusions and suggested actions The purpose of this study was to investigate the possibility for technology
development to strengthen the Swedish wind power business case, and
ultimately examine the potential for eliminating the need for government
subsidies. The following objectives were established:
Scan for trends in technology development and choose areas
according to the scope and delimitations of the study.
Evaluate the chosen technical areas – both financial and non-
financial aspects.
Depending on the outcome in the previous evaluation discuss the
implications for the case company.
The initial technology focus areas and the conclusions concerning each
decision are presented below:
Performance
This category represents the greatest opportunity for improvements. More
specifically, this is the case for the alternatives with increased rotor
diameter and generator output.
For towers with the current welded steel structure the 125 m
alternative is the most feasible and financially attractive alternative.
The general conclusion for increased rotor diameter is that this
development is expected to have a substantial impact on the
business case. In fact, this provides the best opportunity for

120
sustaining profitability without green certificates. However, jointed
blades are considered necessary for the continued development of
longer blades.
Considering all aspects the 3 MW generator provides the best
potential for improving the business case.
The medium voltage converter does not suggest that is of interest
for onshore turbines in the current megawatt range.
The conclusion for the permanence-magnet generator is similar to
the previous, i.e. not interesting as long as no performance increase
can be shown.
OPEX
The general conclusion drawn from the OPEX category is that efforts
favoring O&M activities contribute to a qualitative improvement and a NPV
in the same range as for the base case, while the rate of return seen to the
whole period is not affected to the same extent. However, none of the
investigated areas have the potential to alone be able to eliminate the need
for certificates.
The heated air solution is the preferred alternative concerning the
de-icing systems.
The LIDAR based pitch control system proves to interesting in both
aspects. However, further studies concerning the technical potential
are required.
For the direct drive design, it is suggested that efforts are directed at
introducing this technology in at least one project.
CAPEX
The general conclusion from the CAPEX category is that none of the
chosen areas provided any further improvements on the business case.

121
The conclusion for tower structures is that alternative structures are
not interesting at the current height of about 100 m. However, for
higher towers the hybrid structure is considered the most viable.
It is recommended that the rock anchoring foundation should be
implemented and evaluated when given the opportunity.
The jointed blades solution has not been subject to any financial
evaluation, which is why no further conclusions can be drawn.
Suggested efforts for E.ON Vind
The results from the third evaluation round strongly indicate that increasing
the rotor diameter and generator output is the best approach for further
improving the financial outcome. However, the concerns raised in the
qualitative dimension is regarded as limiting factors, thus requiring further
efforts in the previously specified areas in order to implement the
suggested actions. The uncertainties in the financial input may be
influenced by a wide range of aspects that is not possible to fully account
for. On the other hand, issues concerning limitations due to low or non-
existent demand are considered to be eliminated with further technology
development. With this in mind, the suggested actions for implementing the
concluded choices are focused on reducing the qualitative aspects that
may have a negative impact on the business case as a whole.
Consequently, these actions should be considered at an early stage in
project process, preferably in the project development phase.
Challenges for E.ON Vind
The main challenges for E.ON Vind are concerning those aspects that have
emerged for almost all alternatives which imply a substantial turbine size
increase.
Concerns regarding logistics and the regulations for transportation
will results in substantial challenges, due to the constraints imposed
on blade length and tower height.

122
The process of acquiring the required permits is a crucial aspect for
project development. When developing project with larger WTGs
the permit process will be of further importance.
Public acceptance is also considered to be a critical factor that
ultimately may decide the feasibility of the entire project.
11.2 Final remarks
Potential improvements and suggestions for further research
The general approach of this study has been to investigate a wide
spectrum of technology areas, since the authors’ personal aim has been to
identity as many technological developments as possible, thus aiming at
delivering a more holistic view of potential business case outcomes.
Paradoxically, this resulted in the choice of the analytical approach, since it
allows for the execution of single variable analyses. This enables the study
of many single parameters at a time with no regard to the possible impact
on other technology areas. However, this would suggest a natural next step
for further studies, i.e. choosing one of the proposed areas and perform a
full systemic study. Furthermore, combining several focus areas and
studying the possible effects of synergies for different scenarios may also
be suggested for further research. As for the evaluation model there is a
need for, and the opportunity of, conducting the qualitative assessments to
a larger extent. The broad approach in this study results in limiting amounts
of surveys that could be distributed, due to the given timeframe. When
conducting a further systems approach the distribution of surveys can be
increased, thus providing a higher reliability.
General applicability of the results and model
Regarding the applicability of the results they are highly dependent on the
assumptions that have been made. The initial aim was to perform a broader
study applicable in all of Sweden. However, the outcome from the
sensitivity analysis regarding the price of electricity shows that the results

123
are dependent on the price level in SE4, where the Knäred project is
located. The electricity price is probably the most important input affecting
the results, but at the same time very difficult to forecast. However, the
price level that has been used for this study’s calculations are considered
reasonable, and the sensitivity analysis shows that the alternatives
potentially independent from subsidies can sustain its own profitability at a
price that is in the range of historic electricity prices.
Concerning the business evaluation model it is comprised of a financial
model that calculates the present value of the entire cost of constructing
and operating an energy generating plant over a specified life cycle, and a
quantifiable technology concept selection model which takes into
consideration the non-financial aspects. The strength of this evaluation
method is that it covers a wide perspective when aiming at investigating
technological advancements. It is considered to be applicable in basically
all industries when facing decisions regarding new technology.
One aspect to consider for future improvements regarding the business
evaluation model is to employ a more sophisticated financial model.
However, this is not considered to have any dramatic effect on the
outcome, since the financial model used in this study covers all basic
financial principles as well as taking into consideration pretty much all costs
for building, operating and dismantling the turbines. Furthermore, the most
relevant improvements to consider are those regarding the input
parameters, since it is primarily these and not the financial model that will
affect the results. For example, a long time prognosis for the electricity
price 25 years ahead would increase the credibility of the results.

124

125
12. References
Printed sources
Arbnor, I. & Bjerke, B. (1997). Methodology for creating business
knowledge. 2. ed. Thousand Oaks, Calif.: Sage
Brealey, R., Myers, S., & Marcus, A. (2001). Fundamentals of corporate
finance. 3. ed. Boston, Mass.: McGraw-Hill/Irwin.
Denscombe, M. (2009). Forskningshandboken: för småskaliga
forskningsprojekt inom samhällsvetenskaperna. 2. uppl. Lund:
Studentlitteratur.
Engström, S. (2010). Trends and development in wind power technology.
Stockholm: Elforsk.
Engström, S., Lyrner, T., Hassanzadeh, M., Stalin, T. & Johansson, J.
(2010). Tall towers for large wind turbines. Stockholm: Elforsk.
Hodgkinson, G., Whittington, R., Johnson, G., & Schwarz, M. (2006) The
Role of strategy workshops in strategy development processes: formality,
communication, coordination and inclusion, Long Range Planning, vol. 30
Hassanzadeh, M. (2012). Cracks in onshore wind power foundations –
causes and consequences. Stockholm:Elforsk.
Höst, M., Regnell, B., & Runeson, P. (2006). Att genomföra
examensarbete. Lund: Studentlitteratur.
Johnson, G., Scholes, K., & Whittington, R. (2008). Exploring corporate
strategy / Gerry Johnson, Kevan Scholes, Richard Whittington. 8. ed.
Harlow: Financial Times Prentice Hall.

126
Karppi, I., Kokkonen, M., & Smith, K. (2001). SWOT- analysis as a basis
for regional strategies. Stockholm: The Nordic Centre for Spatial
Development.
Lekvall, P., Wahlbin, C., & Frankelius, P. (2001). Information för
marknadsföringsbeslut. 4., [omarb.] uppl. [sic] Göteborg: IHM Publ.
Manwell, J., McGowan, J. & Rogers, A. (2002). Wind energy explained:
theory, design and application. Chichester: Wiley.
Nyström, O., Nilsson, P-A., Ekström, C., Wiberg, A-M., Ridell, B., Vinberg,
D. (2011) El från nya och framtida anläggningar. Stockholm: Elforsk.
Robson, C. (2011). Real world research: a resource for users of social
research methods in applied settings. 3rd ed. Chichester: Wiley.
Rosengren, K. & Arvidson, P. (2002). Sociologisk metodik. 5., [omarb. och
utök.] uppl. Malmö: Liber.
The electricity certificate system, 2011. (2011). Eskilstuna: Swedish Energy
Agency.
Yard, S. (2001). Kalkyler för investeringar och verksamheter. 2., [rev.] uppl.
Lund: Studentlitteratur.
Yin, R. (2003). Case study research: design and methods. 3 ed. Thousand
Oaks: Sage Publications.
Vestas (2011). General specification V-90 – 1.8/2.0 MW 50 Hz VCS.
Wizelius, T. (2007). Vindkraft i teori och praktik. 2. uppl. Lund:
Studentlitteratur.

127
Articles
The Independent (2010). Concern as China clamps down on rare earth
exports. Milmo C., Chief Reporter.
Available at:
http://www.independent.co.uk/news/world/asia/concern-as-china-clamps-
down-on-rare-earth-exports-1855387.html (2012-03.20)
Svensk vindenergi (2012). 2012 blir ett rekordår för Sveriges vindkraft,
Vindnytt.
Available at:
http://www.vindkraftsnytt.se/2012/02/2012-blir-ett-rekord-r-f-r-sveriges-
vindkraft (2012-02-20)
The daily mail (2011). In China, the true cost of Britain's clean, green wind
power experiment:
Pollution on a disastrous scale by Parry S. & Douglas E.
Available at:
http://www.dailymail.co.uk/home/moslive/article-1350811/In-China-true-
cost-Britains-clean-green-wind-power-experiment-Pollution-disastrous-
scale.html#ixzz1wp6iUIPK (2012-03-20)
The Atlantic (2009). Clean Energy’s Dirty Little Secret by Margonelli L.
Available at:
http://www.theatlantic.com/magazine/archive/2009/05/clean-energy-apos-s-
dirty-little-secret/7377/# (2012-03-20)
Virginia Tech (2010). Pugh method or decision-matrix method.
Available at:
http://www.enge.vt.edu/terpenny/Smart/Virtual_econ/Module2/pugh_metho
d.htm (2012-02-16)

128
Internet sources Byle, M. (2010). In Support of Wind Energy: The foundations that underlie
Wind Projects.
Available at:
http://www.altenergymag.com/emagazine/2010/04/in-support-of-wind-
energy-the-foundations-that-underlie-wind-projects/1478 (2012-02-16)
Desai, P. & Troedson, A. , The Switch, USA. Comparison of low-voltage
and medium-voltage wind turbine drive trains. EWEC2010, 20-23 April
2010, Warsaw, Poland (2012-02-16)
Bossanyi, E., Hassan, G. & Partners. Progress with field testing of
individual pitch control. EWEC2010, 20-23 April 2010, Warsaw, Poland
(2012-02-16)
Energimyndigheten (2011a). Energiläget 2011.
Available at:
http://www.energimyndigheten.se/Global/Statistik/Energil%C3%A4get/Ener
gil%C3%A4get%202011.pdf (2012-02-16)
Energimyndigheten (2011b). Riksintressen för vindbruk.
Available at:
http://energimyndigheten.se/sv/Om-oss/Var-verksamhet/Framjande-av-
vindkraft1/Riksintresse-vindbruk-/ (2012-02-16)
Energimyndigheten (2011c). Vindkraftsstatistik 2010.
Available at:
http://webbshop.cm.se/System/TemplateView.aspx?p=Energimyndigheten
&view=default&cat=/Rapporter&id=209a94dbb239430a9988bbfff73b7b48.
(2012-02-16)

129
E.ON Intranet (2012). E.ON Vind Process Chart. (2012-03-20)
Nordpool (2012). Elspot prices.
Available at:
http://www.nordpoolspot.com/Market-data1/Elspot/Area-
Prices/ALL1/Hourly/ (2012-06-01)
Näringsdepartementet (2010). Sveriges nationella handlingsplan för
främjande av förnybar energi.
Available at:
http://www.regeringen.se/download/968a6b5e.pdf?major=1&minor=149023
&cn=attachmentPublDuplicator_0_attachment. (2012-02-16)
Sveriges riksbank (2010). Penningpolitiken i Sverige.
Available at:
http://www.riksbank.se/Upload/Dokument_riksbank/Kat_publicerat/Rapport
er/2010/Penningpolitiken_2010.pdf. (2012-02-12)
SCB (2012). Konsumentprisindex (KPI).
Available at:
http://www.scb.se/PR0101. (2012-02-12)
Wikipedia (2012). Cost of electricity by source.
Available at:
http://en.wikipedia.org/wiki/Levelized_cost_of_energy (2012-06-01)
Interviews
Axelsson, M. (2012a). Head of Construction, E.ON Vind. Conversation,
2012-01-31.

130
Axelsson, M. (2012b). Head of Construction, E.ON Vind. Personal
interview, 2012-03-26.
Dahlgren, M. (2012). R&D Manager, ABB AB. Telephone interview, 2012-
03-29.
Egard, M. (2012). Project Manager Construction, E.ON Vind. E-mail
conversation, 2012-04-11.
Flaig, R. (2012a). Head of O&M, E.ON Vind. Conversation 2012-02-03.
Flaig, R. (2012b). Head of O&M, E.ON Vind. Personal interview, 2012-03-
26.
Høy-Thomsen, K. (2012). Head of Technical Team, E.ON Vind.
Conversation 2012-02-10.
Jarnhäll, J. (2012a). Portfolio Development, E.ON Sverige. Conversation,
2012-04-05.
Jarnhäll, J. (2012b). Portfolio Development, E.ON Sverige. Personal
interview, 2012-04-11.
Lindelöw, P. (2012). Performance Analyst Technical Team, E.ON Vind.
Conversation, 2012-04-03.
Lindholm, M. (2012). Manager New Technology, E.ON Vind. Conversation
2012-02-16.
Lindkvist, T. (2012a). Asset Manager O&M, E.ON Vind. Conversation 2012-
02-03.
Lindkvist, T. (2012b). Asset Manager O&M, E.ON Vind. Conversation 2012-
03-05.

131
Lindkvist, T. (2012c). Asset Manager O&M, E.ON Vind. Conversation 2012-
03-08.
Malmberg, H. (2012). Team Leader Project Development, E.ON Vind.
Conversation, 2012-02-01.
Messing, M. (2012). Procurement Manager, E.ON Vind. E-mail
conversation, 2012-04-24.
Mikkelsen, T. (2012). Professor DTU Vindenergi. E-mail conversation,
2012-03-22
Mobjer, O. (2012). CEO, Mobjer Entreprenad AB. Personal interview, 2012-
04-03.
Rasmussen, M. (2012). Technical Specialist, Vestas Wind Systems A/S.
Telephone interview, 2012-03-12
Ronsten, G. (2012). CEO, WindREN AB. Email interview, 2012-03-20.
Sottini, F. (2012). Wind Assessment Specialist, 2012-05-07
Sjöbeck, L. (2012). Grid Consultant at E.ON Vind. Personal interview,
2012-04-02.

132

i
Appendix 1. Nordpool electricity prices 2006 -
2012158
Elspot prices in [EUR/MWh]
SYS SE SE1 SE2 SE3 SE4
12 - Jun - - - - -
12 - May 28.50 29.31 29.31 30.00 31.99
12 - Apr 31.71 31.51 31.51 31.52 33.80
12 - Mar 29.20 28.30 29.02 29.02 29.72
12 - Feb 49.06 48.40 48.40 50.80 52.75
12 - Jan 37.18 37.14 37.14 38.20 38.26
11 - Dec 33.74 33.21 33.21 33.22 34.45
11 - Nov 41.18 41.60 41.60 43.52 49.88
11 - Oct 27.96 30.49
11 - Sep 28.94 32.10
11 - Aug 40.14 42.13
11 - Jul 38.78 39.78
11 - Jun 48.40 48.55
11 - May 54.49 54.47
11 - Apr 53.84 53.60
11 - Mar 64.22 63.29
11 - Feb 64.46 64.53
11 - Jan 69.62 69.72
10 - Dec 81.65 91.86
10 - Nov 54.78 56.26
10 - Oct 49.66 51.32
10 - Sep 49.37 51.20
10 - Aug 42.89 43.21
10 - Jul 45.43 45.81
158
Nordpool (2012)

ii
Elspot prices in [EUR/MWh]
SYS SE
2012 -
2011 47.05 -
2010 53.06 56.82
2009 35.02 37.01
2008 44.73 51.12
2007 27.93 30.25
2006 48.59 48.12
2005 29.33 29.76
2004 28.92 28.08
2003 36.69 36.49
2002 26.91 27.62
2001 23.15 22.86
2000 12.75 14.24
1999 13,46
1998 -
1997 -

iii
Appendix 2. LCOE formula159
= Investment expenditures in year t
O&M expenditures in year t
Fuel expenditures in year t
Electricity generation in year t
Discount rate
Life of the system
159
Wikipedia (2012)

iv
Appendix 3. Overview of financial input All numbers have been rounded and are shown to provide rough estimations of the financial input.
Higher towers
Relative CAPEX cost
(kSEK) Source160
Relative OPEX and
replacement cost (kSEK/y)
Source Produ-ction
(GWh) Source
Welded steel 125 m
First round: 3000
Second round: 500
First round: Market price 2.3€/kg including material and work. Tower weight is 335 metric tons.161 Second round: Transportation, lifting and foundation at 125 m.
None. Assuming only additional O&M in the form of visual inspections with no substantial cost increase.
6.08 Production simulation based on power curve from V90 2MW and wind data from the reference site at a height of 125 m. The simulations were performed with the software WAsP 10 and WindPro 2.7. Noise mode 0, Air density kg/m3 1.225. Production losses due to icing are included and correspond to 0.9 % of production.162
160
Engström et al. (2010) 161
Egard (2012) 162
Sottini (2012)

v
Welded steel 150 m
First round: 6000
Second round: 2500
First round: Market price 2.3€/kg including material and work. Tower weight is estimated to 490 metric tons, based on linearization of 105 and 125 meter. Second round: Transportation, lifting and foundation at 150 m.
None. Assuming only additional O&M in the form of visual inspections with no substantial cost increase.
6.69
Production simulation based on power curve from V90 2MW and wind data from the reference site at a height of 150 m. The simulations were performed with the software WAsP 10 and WindPro 2.7. Noise mode 0, Air density kg/m3 1.225. Production losses due to icing are included and correspond to 1.1 % of production.163
163
Sottini (2012)

vi
Hybrid – concrete and welded steel 175 m
First round: 8500
Second round: 8000
First round: Tower cost is estimated to 1394 k€, based on interpolation of tower weights and top tower weights for 3 and 5 MW at 175m. Second round: Transportation, lifting and foundation at 175 m.
None. Assuming only additional O&M in the form of visual inspections with no substantial cost increase.
7.18 Production simulation based on power curve from V90 2MW and wind data from the reference site at a height of 175 m. The simulations were performed with the software WAsP 10 and WindPro 2.7. Noise mode 0, Air density kg/m3 1.225. Production losses due to icing are included and correspond to 1.3 % of production.164
164
Ibid.

vii
Higher output
Relative CAPEX (kSEK)
Source
Relative
OPEX (kSEK/
y)
Source
Relative replacement cost
(kSEK)
Source165
Produ-ction
(GWh) Source
3 MW
First round: 3500
Second round: 8000
First round:166 Generator cost is 142 k€. Rotor blades cost 1074 k€. Second round:167 Based on generic formula for entire WTG as with output and hub height as parameters: 3 [MW] * 1000 k€ + 90 k€ * [every 10 m over 100 m hub height]
5 The relative OPEX cost is 3 k€ for the generator and 0 for the blades.168
500 Relative cost for replacement of blades is 32 k€ in year 18.
9.04 Production simulation based on power curve for V112 3MW and wind data from the reference site at a height of 105 m. The simulations were performed with the software WAsP 10 and WindPro 2.7. Noise mode 0, Air density kg/m3 1.225. Production losses due to icing are included and correspond to 0.7 % of production.169
165
Flaig (2012b) 166
Ibid. 167
Malmberg (2012) 168
Flaig (2012b) 169
Sottini (2012)

viii
5 MW First round: 6,000
Second round: 27,000
First round:170 Generator cost is 232 k€. Rotor blades, 1251 k€. Second round:171 Based on generic formula for entire WTG as with output and hub height as parameters: 5 [MW] * 1000 k€ + 90 k€ * [every 10 m over 100 m hub height]
10 The relative OPEX cost is based on 2 % generator failure rate and 3 % extra failure rate of the total CAPEX. Relative OPEX costs for 126 m rotor diameter are added.172
500 Relative cost for replacement of blades is 50 k€ in year 18.
11.60 Production simulation based on power curve from RePower 5 MW 126 m diameter and wind data from the reference site at a height of 105 m. The simulations were performed with the software WAsP 10 and WindPro 2.7. Noise mode 0, Air density kg/m3 1.225. Production losses due to icing are included and correspond to 0.7 % of production.173
170
Flaig (2012b) 171
Malmberg (2012) 172
Flaig (2012b) 173
Sottini (2012)

ix
Longer rotor
diameter
Relative CAPEX
cost (kSEK)
Source174 Relative OPEX
(kSEK/y)
Source175
Relative replaceme
nt cost (kSEK)
Source176
Production (GWh
)
Source
100 m
0 Same cost as for the base case - 750 k€.
None. No additional O&M are considered.
None.
Cost for replacement is already included in base case - 75 k€.
7.05 Production simulation based on power curve from V100 2MW and wind data from the reference site at a height of 105 m. The simulations were performed with the software WAsP 10 and WindPro 2.7. Assumed that, Noise mode 0, Air density kg/m3 1.225. Production losses due to icing are included and correspond to 0.7 % of production.177
174
Flaig (2012b) 175
Ibid. 176
Ibid. 177
Sottini (2012)

x
126 m
First round: 5,000
Second round:
50
First round: Based on the assumption that CAPEX is linear to the cost of rotor blades for a V90 and V112. Second round: Based on the assumption of additional transportation due to dividing of the blades. This cost is added linearly to the existing transportation cost.
5
Additional OPEX are assumed to increase linearly.
500 Relative cost for replacement of blades is 50 k€ in year 18.
8.64 Production simulation based on estimated power curve. The power curve is based on interpolation of a V80, V90, V100 2MW turbine and then extrapolated to 126 m diameter combined with wind data from the reference site at a height of 105 m. The simulations were performed with the software WAsP 10 and WindPro 2.7. Assumed that, Noise mode 0, Air density kg/m3 1.225. Production losses due to icing are included and correspond to 0.7 % of production.178
178
Sottini (2012)

xi
164m
First round: 10,000
Second round:
100
First round: Based on the assumption that CAPEX is linear to the cost of rotor blades for a V90 and V112. Second round: Based on the assumption of additional transportation due to dividing of the blades. This cost is added linearly to the existing transportation cost.
10 Additional OPEX are assumed to increase linearly.
1000 Cost for replacement is 184 k€ in year 18.
10,53 Production simulation based on estimated power curve. The power curve is based on interpolation of a V80, V90, V100 2MW turbine and then extrapolated to 164 m diameter combined with wind data from the reference site at a height of 105 m. The simulations were performed with the software WAsP 10 and WindPro 2.7. Production losses due to icing are included and correspond to 0.7 % of production.179
179
Ibid.

xii
Permanent-magnet
generator
Relative CAPEX cost (kSEK)
Source
Relative OPEX and
replacement (kSEK/y)
Source Production
(GWh) Source
Permanent-magnet generator
400 Cost of P-M generator is 142 k€.180
5
Relative OPEX cost is 4.3 k€/lifetime and replacement cost is 0 k€.181
5.54
Production simulation based on power curve from V.90 2MW - Gridstreamer and wind data from the reference site at a height of 105 m. The simulations were performed with the software WAsP 10 and WindPro 2.7. Noise mode 0, Air density kg/m3 1.225. Production losses due to icing are included and correspond to 0.7 % of production.182
180
Flaig (2012b) 181
Ibid. 182
Sottini (2012)

xiii
Voltage converters
Relative CAPEX
cost (kSEK)
Source Relative OPEX
(kSEK/y) Source
Relative replacement cost (kSEK)
Source Production
(GWh) Source
3.3 kV converter
400 Cost is 25 % more than for the 690 V which is 150 k€.183
None. No additional costs are assumed. Salary increase for qualified personnel is discussed in the qualitative evaluation.
400 Cost for replacement is 187 k€ in year 18.184
5.54 Production simulation based on power curve from V90 2MW and wind data from the reference site at a height of 105 m. The simulations were performed with the software WAsP 10 and WindPro 2.7. Noise mode 0, Air density kg/m3 1.225. Production losses due to icing are included and correspond to 0.7 % of production.185
183
Engström (2010) 184
Ibid. 185
Sottini (2012)

xiv
Direct drive
generator
Relative CAPEX
cost (kSEK)
Source Relative OPEX
(kSEK/y) Source
Relative replacemen
t cost (kSEK)
Source Production
(GWh) Source
Direct drive
5,500 Cost of 2.3 DD generator from Siemens is 699 k€, which replaces the cost for both the previous generator and the gearbox entirely.186
10
3 % extra failure rate of CAPEX cost.
-6,500 Reduced cost of 2 * 350 k€ due to the elimination of gearbox replacements.187
5.54 Production simulation based on power curve from V90 2MW - Gridstreamer and wind data from the reference site at a height of 105 m. The simulations were performed with the software WAsP 10 and WindPro 2.7. Noise mode 0, Air density kg/m3 1.225. Production losses due to icing are included and correspond to 0.7 % of production.188
186
Messing (2012) 187
Ibid. 188
Sottini (2012)

xv
De-icing system
Relative CAPEX
cost (kSEK)
Source
Relative OPEX and
replacement costs
(kSEK/y)
Source Production
(GWh) Source
Heating coil
1,000 Cost of heating coil system is 70 k€.189
None. Assumption is that no additional O&M is required.
5.58 Production simulation based on power curve from V90 2MW and wind data from the reference site at a height of 105 m. The simulations were performed with the software WAsP 10 and WindPro 2.7. Noise mode 0, Air density kg/m3 1.225. Production losses due to icing are assumed to be 0.190
Heated air
500 Cost of heating coil system is 40 k€.191
None. Assumption is that no additional O&M is required.
5.58 Production simulation based on power curve from V90 2MW and wind data from the reference site at a height of 105 m. The simulations were performed with the software WAsP 10 and WindPro 2.7. Noise mode 0, Air density kg/m3 1.225. Production losses due to icing are assumed to be 0.192
189
Messing (2012) 190
Sottini (2012) 191
Ronsten (2012) 192
Sottini (2012)

xvi
Blade pitch
control
CAPEX cost
(kSEK) Source
Relative OPEX
(kSEK/y) Source
Production (GWh)
Source
LIDAR blade pitch
500 Cost of LIDAR blade pitch system is 50 k€.193
-50 The cost is 5 % of the CAPEX cost and 2 hours of man work á 0.1 k€.194 The system can generate a 2 % load reduction which is considered to correspond to a 2 % reduction of planned maintenance.195
5.54 Production simulation based on power curve from V90 2MW and wind data from the reference site at a height of 105 m. The simulations were performed with the software WAsP 10 and WindPro 2.7. Noise mode 0, Air density kg/m3 1.225. Production losses due to icing are included and correspond to 0.7 % of production.196
193
Lindelöw (2012) 194
Ibid. 195
Ibid. 196
Sottini (2012)

xvii
Tower structure
105 m
Relative CAPEX
cost (kSEK)
Source197
Relative OPEX and replaceme
nt cost (kSEK/y)
Source Product
ion (GWh)
Source
Hybrid – concrete and welded steel
First round: 1,000
Second round:
100
First round: Tower cost is estimated to 555 k€, based on interpolation of tower weights and top tower weights for a 3 and 5 MW turbine at 105 m hub height. Second round: Transportation, lifting and foundation for a concrete steel hybrid tower at 105 m.
None. Assuming only additional O&M in the form of visual inspections with no substantial cost increase.
5.54 Production simulation based on power curve from V90 2MW and wind data from the reference site at a height of 105 m. The simulations were performed with the software WAsP 10 and WindPro 2.7. Noise mode 0, Air density kg/m3 1.225. Production losses due to icing are included and correspond to 0.7 % of production.198
197
Engström et al. (2010) 198
Sottini (2012)

xviii
Steel shell friction joint
First round: 1,000
Second round:
20
First round: Tower cost is estimated to 567 k€, based on interpolation of tower weights and top tower weights for a 3 and 5 MW turbine at 105 m hub height. Second round: Transportation, lifting and foundation for a steel friction joint tower at 105 m.
None. Assuming only additional O&M in the form of visual inspections with no substantial cost increase.
5.54 Production simulation based on power curve from V90 2MW and wind data from the reference site at a height of 105 m. The simulations were performed with the software WAsP 10 and WindPro 2.7. Noise mode 0, Air density kg/m3 1.225. Production losses due to icing are included and correspond to 0.7 % of production.199
199
Ibid. (2012)

xix
Concrete slip-formed
First round: 1,500
Second round:
-500
First round: Tower cost is estimated to 642 k€, based on interpolation of tower weights and top tower weights for a 3 and 5 MW turbine at 105 m hub height. Second round: Transportation, lifting and foundation for a slip-formed concrete tower at 105 m.
None. Assuming only additional O&M in the form of visual inspections with no substantial cost increase.
5.54 Production simulation based on power curve from V90 2MW and wind data from the reference site at a height of 105 m. The simulations were performed with the software WAsP 10 and WindPro 2.7. Noise mode 0, Air density kg/m3 1.225. Production losses due to icing are included and correspond to 0.7 % of production.200
200
Ibid.

xx
Lattice
First round:
-500 Second round:
250
First round: Tower cost is estimated to 427 k€, based on interpolation of tower weights and top tower weights for a 3 and 5 MW turbine at 105 m hub height. Second round: Transportation, lifting and foundation for a steel lattice tower at 105 m.
None. Assuming only additional O&M in the form of visual inspections with no substantial cost increase.
5.54 Production simulation based on power curve from V90 2MW and wind data from the reference site at a height of 105 m. The simulations were performed with the software WAsP 10 and WindPro 2.7. Noise mode 0, Air density kg/m3 1.225. Production losses due to icing are included and correspond to 0.7 % of production.201
201
Sottini (2012)

xxi
Wood
First round: -1,000
Second round: 1,000
First round: Tower cost is estimated to 375 k€, based on interpolation of tower weights and top tower weights for a 3 and 5 MW turbine at 105 m hub height. Second round: Transportation, lifting and foundation for a wooden tower at 105 m.
None. Assuming only additional O&M in the form of visual inspections with no substantial cost increase.
5.54 Production simulation based on power curve from V90 2MW and wind data from the reference site at a height of 105 m. The simulations were performed with the software WAsP 10 and WindPro 2.7. Noise mode 0, Air density kg/m3 1.225. Production losses due to icing are included and correspond to 0.7 % of production.202
202
Ibid.

xxii
Foundation
Relative CAPEX
cost (kSEK)
Source Relative OPEX
(kSEK/y) Source
Production (GWh)
Source
Rock anchoring
-500 Cost reduction as a result of elimination the anchor cage required for the gravity foundation.203
None. Assuming only additional O&M in the form of visual inspections with no substantial cost increase.204
5.54 Production simulation based on power curve from V90 2MW and wind data from the reference site at a height of 105 m. The simulations were performed with the software WAsP 10 and WindPro 2.7. Noise mode 0, Air density kg/m3 1.225. Production losses due to icing are included and correspond to 0.7 % of production.205
203
Mobjer (2012) 204
Ibid. 205
Sottini (2012)

xix
Appendix 4. Results from qualitative
assessment The presented outcome comes from the merger of all surveys for each
focus area.
Tower height Measure 125m 150m 175m
# of site possibilities (wind) 8 15 15
Construction logistics (cranes, roads etc.) 0 -6 -11
Decreased distance between WTGs 4 4 4
Decreased ice formation -3 -6 -6
General HSSE issues -3 -3 -3
Increased park size (# of WTGs) 2 7 7
Key component availability (i.e. supply chain) -4 -10 -13
Maintenance accessibility -7 -10 -10
Manufacturer alternatives -5 -12 -15
Noise reduction 0 0 0
Operation availability -3 -5 -5
Other logistics (i.e. site delivery) 0 -5 -5
Permit process (MKB etc.) -6 -8 -11
Proven technology -5 -14 -19
Public acceptance -7 -13 -13
Reduced grid demands 0 0 0
Reduced loads/fatigue (nacelle/blades) 7 7 7
Reduced loads/fatigue (tower/foundation) -2 -7 -7
Reduced nacelle weight 0 0 0
WTG lifetime -2 -2 -2
Total -24 -69 -88

xx
Increased rotor diameter
Measure 100-110m 116-124m 140-
164m
# of site possibilities (wind) 3 7 7
Construction logistics (cranes, roads etc.) 0 -16 -32
Decreased distance between WTGs -3 -7 -7
Decreased ice formation -3 -7 -7
General HSSE issues 0 0 0
Increased park size (# of WTGs) -3 -9 -12
Key component availability (i.e. supply chain) 0 -3 -7
Maintenance accessibility 0 0 0
Manufacturer alternatives 0 -3 -9
Noise reduction 0 0 0
Operation availability 0 0 0
Other logistics (i.e. site delivery) -13 -16 -32
Permit process (MKB etc.) -3 -7 -7
Proven technology 0 -3 -22
Public acceptance -3 -7 -7
Reduced grid demands 0 0 0
Reduced loads/fatigue (nacelle/blades) -3 -9 -12
Reduced loads/fatigue (tower/foundation) -3 -9 -12
Reduced nacelle weight 0 -3 -3
WTG lifetime 0 -3 -3
Total -33 -96 -163

xxi
Generator output
Measure 3 MW 5 MW
# of site possibilities (wind) 0 -3
Construction logistics (cranes, roads etc.) 0 -13
Decreased distance between WTGs -3 -3
Decreased ice formation -3 -3
General HSSE issues -3 -3
Increased park size (# of WTGs) 0 0
Key component availability (i.e. supply chain) 0 -3
Maintenance accessibility 5 13
Manufacturer alternatives 0 -8
Noise reduction 0 0
Operation availability 0 3
Other logistics (i.e. site delivery) -10 -23
Permit process (MKB etc.) 0 -3
Proven technology 0 -8
Public acceptance 0 -1
Reduced grid demands 5 8
Reduced loads/fatigue (nacelle/blades) -1 -3
Reduced loads/fatigue (tower/foundation) -1 -3
Reduced nacelle weight -3 -8
WTG lifetime 0 -10
Total -14 -68

xxii
Permanent magnet generator Measure P-M
# of site possibilities (wind) 0
Construction logistics (cranes, roads etc.) 0
Decreased distance between WTGs 0
Decreased ice formation 0
General HSSE issues -20
Increased park size (# of WTGs) 0
Key component availability (i.e. supply chain) 4
Maintenance accessibility -15
Manufacturer alternatives -4
Noise reduction 0
Operation availability 0
Other logistics (i.e. site delivery) 0
Permit process (MKB etc.) 0
Proven technology 5
Public acceptance 0
Reduced grid demands 25
Reduced loads/fatigue (nacelle/blades) 0
Reduced loads/fatigue (tower/foundation) 0
Reduced nacelle weight 0
WTG lifetime 4
Total -1

xxiii
Medium voltage converter Measure 3.3 kV
# of site possibilities (wind) 0
Construction logistics (cranes, roads etc.) 0
Decreased distance between WTGs 0
Decreased ice formation 0
General HSSE issues -45
Increased park size (# of WTGs) 0
Key component availability (i.e. supply chain) -10
Maintenance accessibility -5
Manufacturer alternatives -10
Noise reduction 0
Operation availability -5
Other logistics (i.e. site delivery) 0
Permit process (MKB etc.) 0
Proven technology -20
Public acceptance 0
Reduced grid demands 0
Reduced loads/fatigue (nacelle/blades) 0
Reduced loads/fatigue (tower/foundation) 0
Reduced nacelle weight 15
WTG lifetime 0
Total -80

xxiv
Jointed blades
Measure Jointed blades
# of site possibilities (wind) 5
Construction logistics (cranes, roads etc.) 5
Decreased distance between WTGs -3
Decreased ice formation 0
General HSSE issues 0
Increased park size (# of WTGs) -8
Key component availability (i.e. supply chain) 0
Maintenance accessibility 0
Manufacturer alternatives -15
Noise reduction -5
Operation availability 0
Other logistics (i.e. site delivery) 5
Permit process (MKB etc.) 0
Proven technology -75
Public acceptance -3
Reduced grid demands 0
Reduced loads/fatigue (nacelle/blades) -18
Reduced loads/fatigue (tower/foundation) -5
Reduced nacelle weight 0
WTG lifetime -8
Total -123

xxv
De-icing systems Measure Air Coil
# of site possibilities (wind) 15 13
Construction logistics (cranes, roads etc.) 0 0
Decreased distance between WTGs 0 0
Decreased ice formation 30 30
General HSSE issues 53 40
Increased park size (# of WTGs) 1 1
Key component availability (i.e. supply chain) -6 -6
Maintenance accessibility -3 -5
Manufacturer alternatives -4 -2
Noise reduction 7 7
Operation availability 3 3
Other logistics (i.e. site delivery) 0 0
Permit process (MKB etc.) 18 18
Proven technology 14 7
Public acceptance 6 6
Reduced grid demands 0 0
Reduced loads/fatigue (nacelle/blades) 0 0
Reduced loads/fatigue (tower/foundation) 0 0
Reduced nacelle weight -1 0
WTG lifetime 0 -1
Sparepart availability 0 0
Total 132 108

xxvi
Direct drive generator Measure Direct drive
# of site possibilities (wind) 0
Construction logistics (cranes, roads etc.) 0
Decreased distance between WTGs 0
Decreased ice formation 0
General HSSE issues 3
Increased park size (# of WTGs) 0
Key component availability (i.e. supply chain) 0
Maintenance accessibility 23
Manufacturer alternatives -13
Noise reduction 3
Operation availability 15
Other logistics (i.e. site delivery) 0
Permit process (MKB etc.) 3
Proven technology -15
Public acceptance 0
Reduced grid demands -3
Reduced loads/fatigue (nacelle/blades) 0
Reduced loads/fatigue (tower/foundation) 0
Reduced nacelle weight 5
WTG lifetime 8
Total 28

xxvii
Pitching w. LIDAR Measure Pitching w. LIDAR
# of site possibilities (wind) 8
Construction logistics (cranes, roads etc.) -1
Decreased distance between WTGs 5
Decreased ice formation 0
General HSSE issues -1
Increased park size (# of WTGs) 5
Key component availability (i.e. supply chain) -3
Maintenance accessibility -3
Manufacturer alternatives -2
Noise reduction 1
Operation availability -4
Other logistics (i.e. site delivery) -1
Permit process (MKB etc.) 0
Proven technology -40
Public acceptance 0
Reduced grid demands -1
Reduced loads/fatigue (nacelle/blades) 12
Reduced loads/fatigue (tower/foundation) 4
Reduced nacelle weight 2
WTG lifetime 53
Total 33
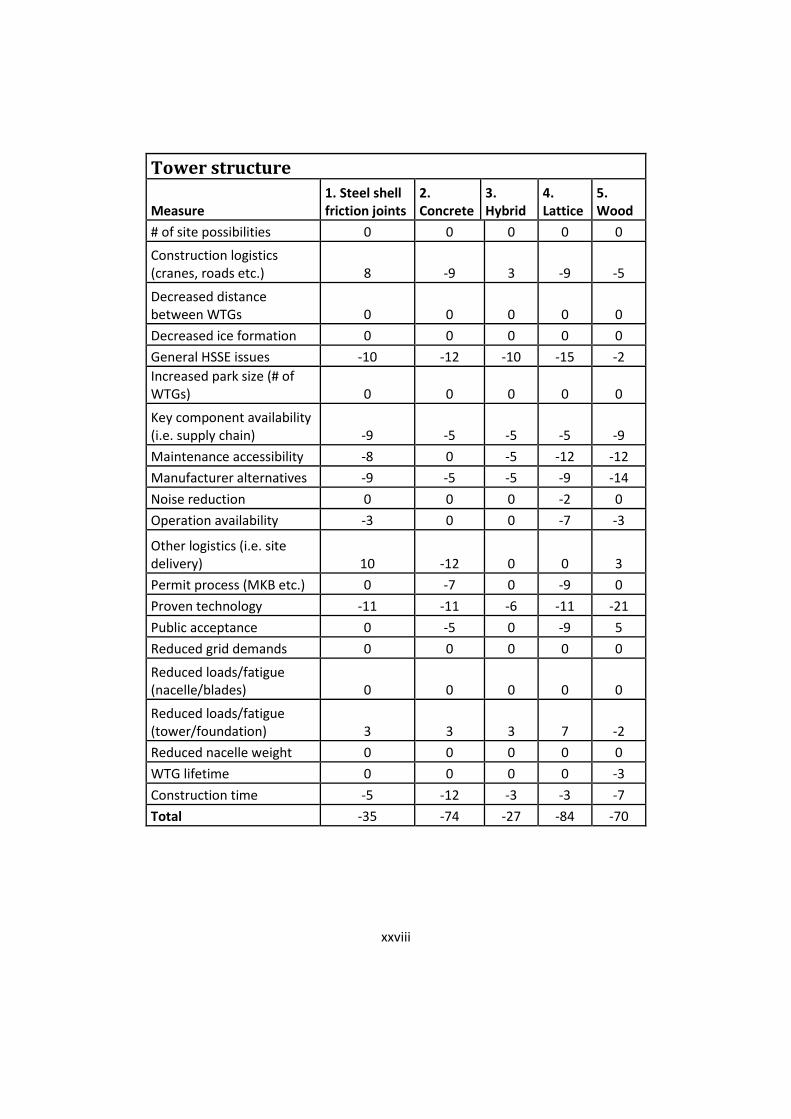
xxviii
Tower structure
Measure 1. Steel shell friction joints
2. Concrete
3. Hybrid
4. Lattice
5. Wood
# of site possibilities 0 0 0 0 0
Construction logistics (cranes, roads etc.) 8 -9 3 -9 -5
Decreased distance between WTGs 0 0 0 0 0
Decreased ice formation 0 0 0 0 0
General HSSE issues -10 -12 -10 -15 -2
Increased park size (# of WTGs) 0 0 0 0 0
Key component availability (i.e. supply chain) -9 -5 -5 -5 -9
Maintenance accessibility -8 0 -5 -12 -12
Manufacturer alternatives -9 -5 -5 -9 -14
Noise reduction 0 0 0 -2 0
Operation availability -3 0 0 -7 -3
Other logistics (i.e. site delivery) 10 -12 0 0 3
Permit process (MKB etc.) 0 -7 0 -9 0
Proven technology -11 -11 -6 -11 -21
Public acceptance 0 -5 0 -9 5
Reduced grid demands 0 0 0 0 0
Reduced loads/fatigue (nacelle/blades) 0 0 0 0 0
Reduced loads/fatigue (tower/foundation) 3 3 3 7 -2
Reduced nacelle weight 0 0 0 0 0
WTG lifetime 0 0 0 0 -3
Construction time -5 -12 -3 -3 -7
Total -35 -74 -27 -84 -70

xxix
Foundation Measure Rock anchoring
# of site possibilities (wind) -5
Construction logistics (cranes, roads etc.) 13
Decreased distance between WTGs 0
Decreased ice formation 0
General HSSE issues 0
Increased park size (# of WTGs) 0
Key component availability (i.e. supply chain) -3
Maintenance accessibility -13
Manufacturer alternatives -10
Noise reduction 0
Operation availability 0
Other logistics (i.e. site delivery) 15
Permit process (MKB etc.) 15
Proven technology -8
Public acceptance 5
Reduced grid demands 0
Reduced loads/fatigue (nacelle/blades) 0
Reduced loads/fatigue (tower/foundation) -3
Reduced nacelle weight 0
WTG lifetime -5
Construction time 8
Total 10