the power of data analysis to inform improvement a presentation to msba leadership conference bill...
Post on 20-Dec-2015
214 views
TRANSCRIPT

THE POWER OF DATA ANALYSIS TO INFORM IMPROVEMENT
A Presentation toMSBA Leadership Conference
Bill Elder, Keith Jamtgaard and Howard Jones Office of Social and Economic Data Analysis
University of MissouriJune 6, 2008
SESSION GOALS• Explore the power of data to inform
school improvement
• Explore types of data of importance to school board members
• Exchange experiences and ideas
• Think, apply and dream
SESSION AGENDA• Introduction• Data 101• Discuss the Board’s Role• Demographic Data• Resource Data• Process Data• Performance Data• Reflection and Feedback
WHO ARE WE? WHO ARE YOU?
THE OFFICE OF SOCIAL AND ECONOMIC DATA ANALYSIS
(OSEDA)
THE UNIVERSITY OF MISSOURI

OSEDA Values: As part of the University of Missouri, we honor the public trust placed in our institution and accept our responsibility to be effective stewards of that trust. We acknowledge our duty to acquire, create, transmit and preserve knowledge and to promote understanding. We embrace the University of Missouri values of Respect, Responsibility, Discovery and Excellence.

In particular, at OSEDA we foster:Accessibility: Public data and information should
be readily accessible.
Collaboration: Collaboration and engagement is essential for the construction of meaningful policy information.
Trust: Trustworthy relationships and information contribute to sound policy development and decision-making.
Excellence: Our users deserve excellence. Excellence is achieved through the diligent individual and collaborative efforts of a skilled and experienced team of faculty and staff.

OSEDA Vision:Policy development and decision-making is more
effective because of the collaborative application of social and economic information.
OSEDA Mission: We sustain high quality data and data analysis
capabilities in order to collaborate with partners in the analysis of social and economic data in ways that contribute to the development of improvements in the health, education and well-being of people and communities in Missouri and the world.
WHY ARE WE SO INTERESTED IN DATA?For just a minute, think about some important decision you and your fellow board members made this year when additional data analysis would have made you more confident in your decision.
DATA 101: From Data to Information

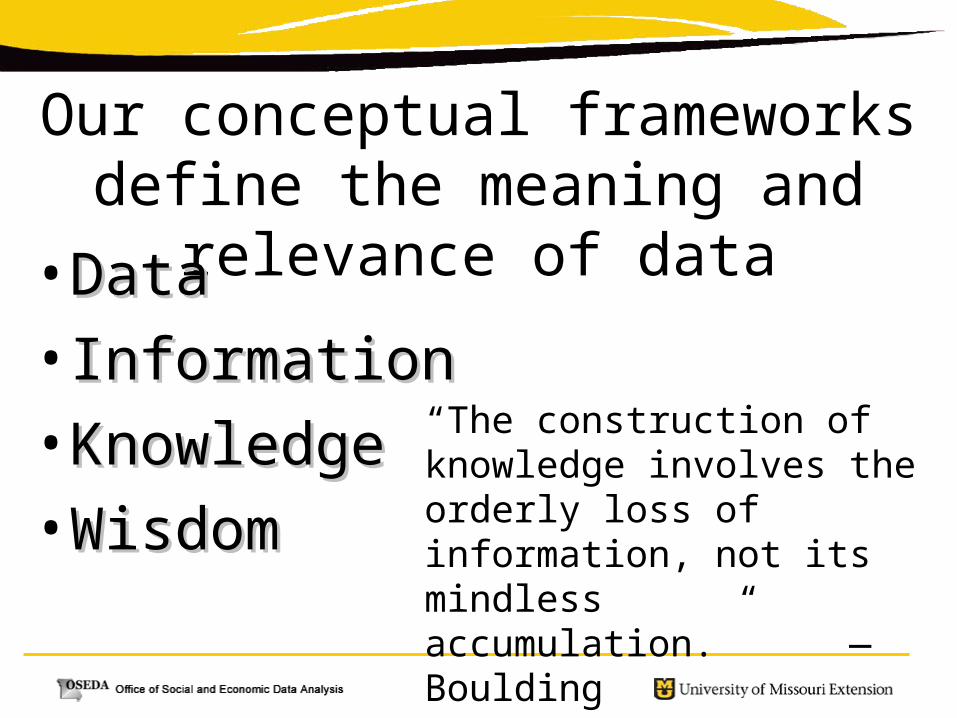
Our conceptual frameworks define the meaning and relevance of data
• Data Data
• Information Information
• Knowledge Knowledge
• WisdomWisdom
Our conceptual frameworks define the meaning and relevance of data
• Data Data
• Information Information
• Knowledge Knowledge
• WisdomWisdom
“The construction of knowledge involves the orderly loss of information, not its mindless accumulation.” — Boulding
Indicators are conceptually connected data.
They’re answers to questions arising from the logic of the model.
They may be quantitative or qualitative.
Utilization Focused Evaluation
Evaluative answers are “useful” when they reduce the risks of making the wrong decision.
To know you have asked the “right” questions and produced “useful” answers….you must
understand who the decision makers are
and what kinds of decisions they need to make. — Michael Patton
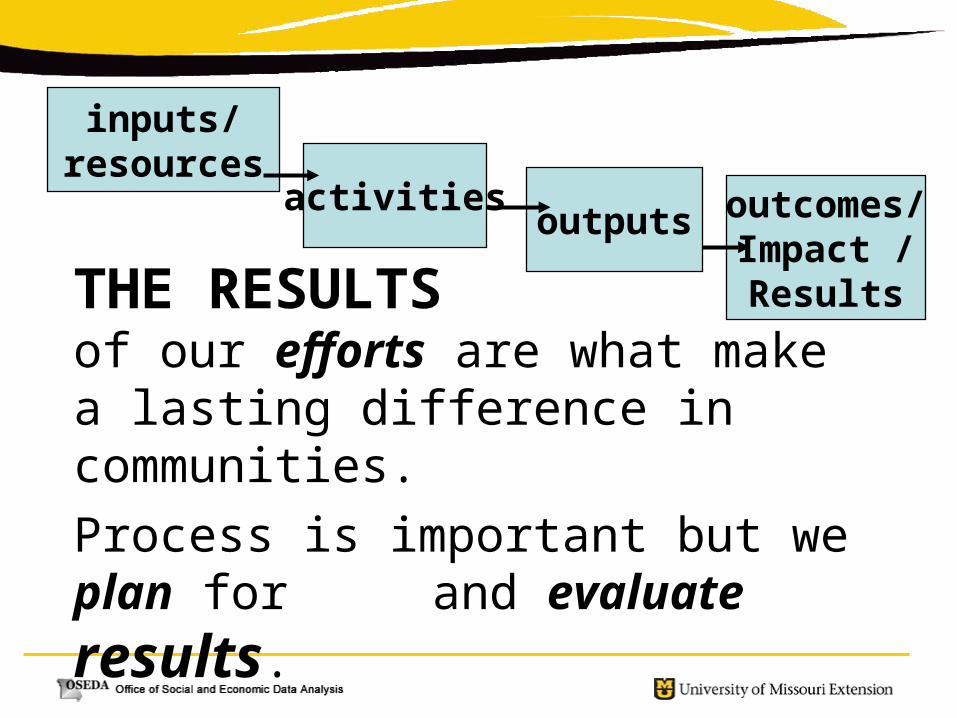
inputs/resources
activities
THE RESULTS of our efforts are what make a lasting difference in communities.
Process is important but we plan for
and evaluate results.
outputs outcomes/Impact /Results
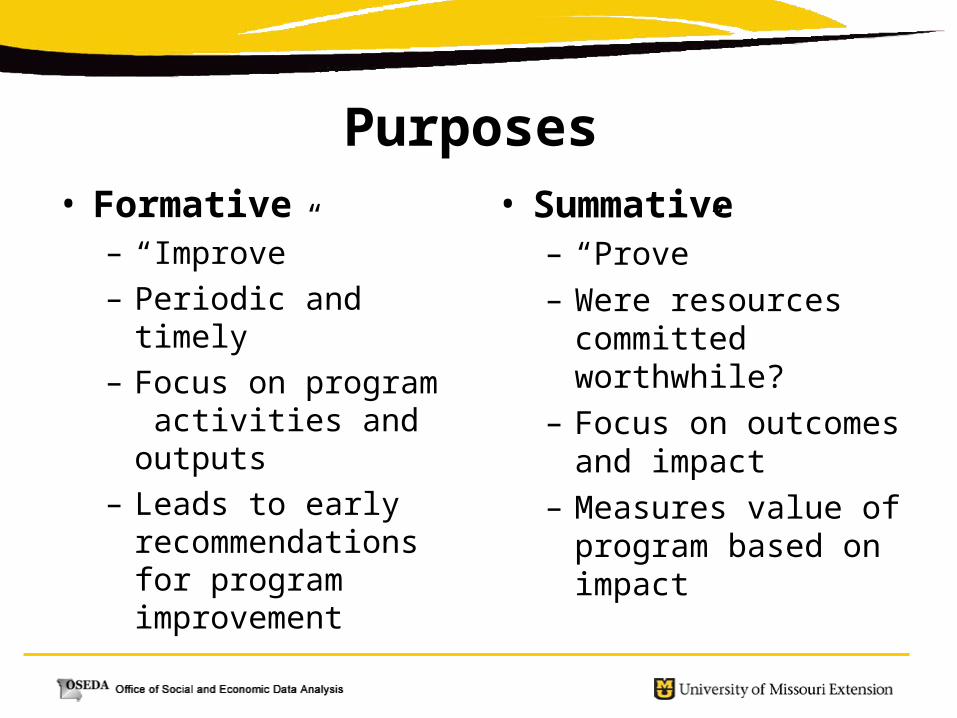
Purposes• Formative
– “Improve”– Periodic and timely– Focus on program
activities and outputs– Leads to early
recommendations for program improvement
• Summative– “Prove”– Were resources
committed worthwhile?– Focus on outcomes
and impact– Measures value of
program based on impact

Choosing and Getting to Port(Where we’re going)
Plotting a Course (Making a plan)
Estimating Position(Where we might be)
Taking a “FIX”(where we really are) “Set and Drift”
Adjusting Course
“Summative” Result
“Formative” Information

Missouri School Improvement Program (MSIP): Theory of Action
• Resources deployed• To engage educational processes to• Bring about student outcomes/ performance • Within a demographic context The MSIP Standards and Indicators describe
a good school, and to some extent categorize important data sources

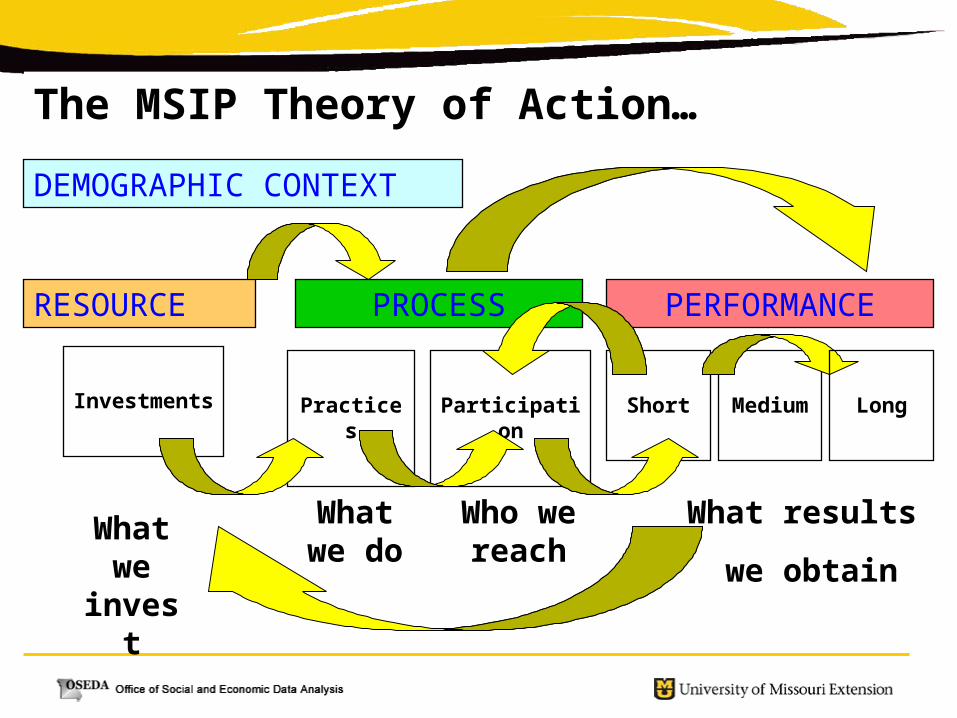
RESOURCE PROCESS PERFORMANCE
Investments Practices Participation Short Medium
What we
invest
What we do
Who we reach
What results
we obtain
The MSIP Theory of Action…
Long
DEMOGRAPHIC CONTEXT

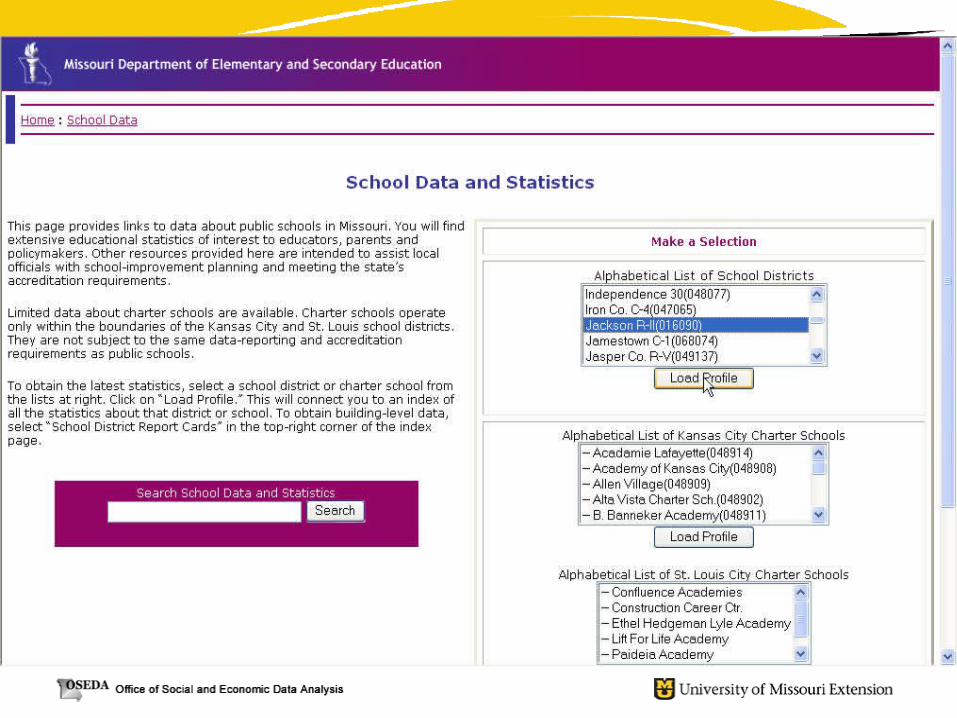
Focusing On School/Education Data:
THE BOARD’S ROLE

NSBA’s “Key Work of School Boards”
Framework of eight essential key action areas that focus and guide school boards in their efforts to improve student achievement.
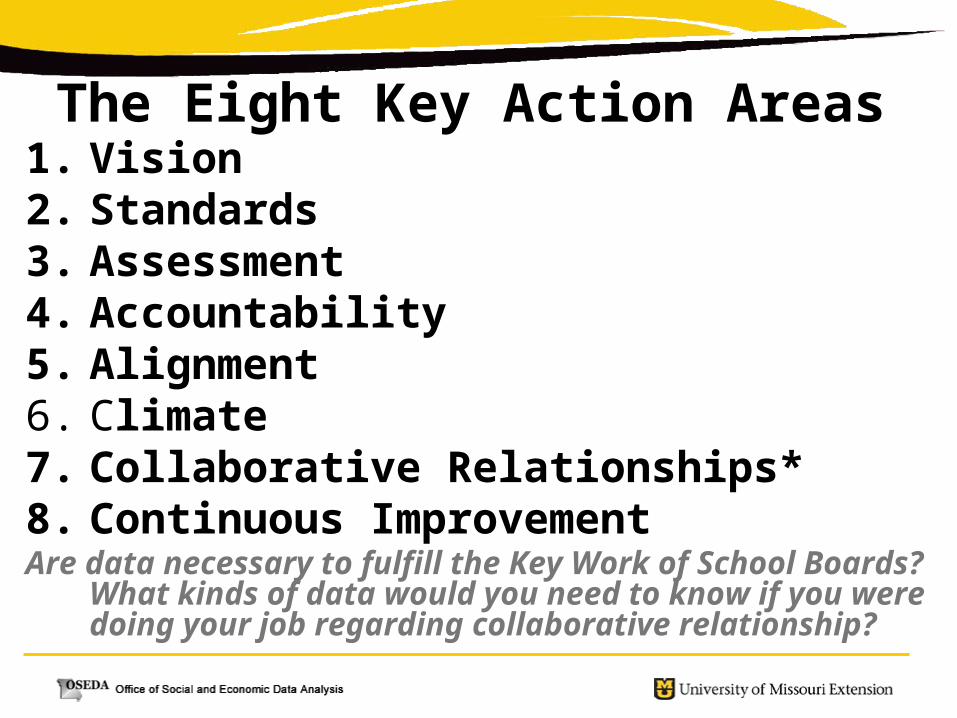
The Eight Key Action Areas1. Vision2. Standards3. Assessment4. Accountability5. Alignment 6. Climate 7. Collaborative Relationships*8. Continuous ImprovementAre data necessary to fulfill the Key Work of School
Boards? What kinds of data would you need to know if you were doing your job regarding collaborative relationship?

Guiding Documents:
THE BOARD’S LEGAL RESPONSIBILITY
• District Policy• Budget• CSIP• Professional Development Plan• District Curriculum

CATEGORIES OF SCHOOL DATA
• Performance Data
• Resource Data
• Process Data
• Demographic Data


Student Level
Teacher Level
School Level
F1 Guaranteed and Viable CurriculumF2 Challenging Goals and Effective FeedbackF3 Parental and Community InvolvementF4 Safe and Orderly EnvironmentF5 Collegiality and Professionalism
F6 Instructional StrategiesF7 Classroom ManagementF8 Curriculum Design
F9 Home EnvironmentF10 Learned Intelligence or Background F11 KnowledgeF12 Motivation
Research on Factors That Influence Student Achievement

EXAMPLES:
PERFORMANCE DATA• Annual Performance Report (APR)
• APR and AYP disaggregated by gender, race, free and reduced lunch, etc.
• District Report Card
• Nationally Standardized Test Scores
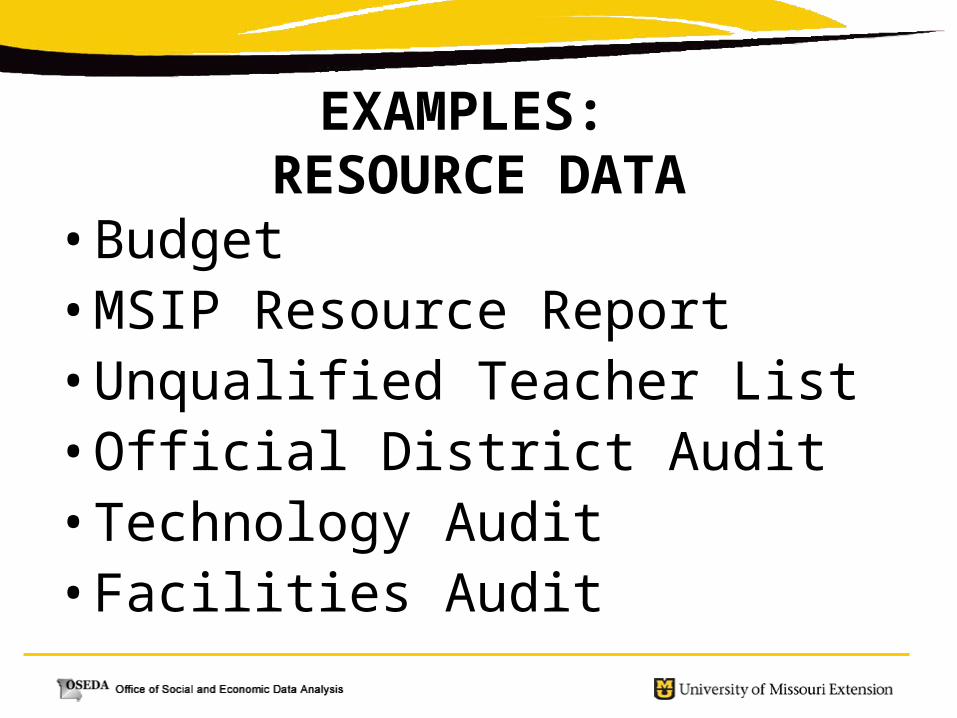
EXAMPLES: RESOURCE DATA
• Budget• MSIP Resource Report• Unqualified Teacher List• Official District Audit• Technology Audit• Facilities Audit
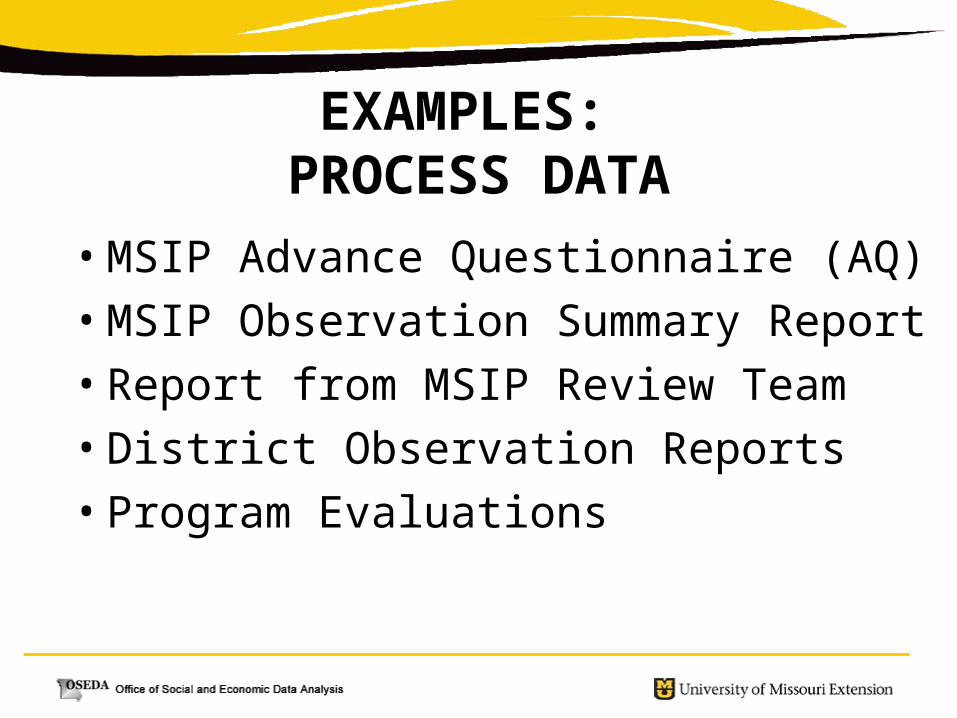
EXAMPLES: PROCESS DATA
• MSIP Advance Questionnaire (AQ)
• MSIP Observation Summary Report
• Report from MSIP Review Team
• District Observation Reports
• Program Evaluations

EXAMPLES: DEMOGRAPHIC DATA
• Enrollment trends
• Free and reduced lunch count
• Kids Count
• Census data

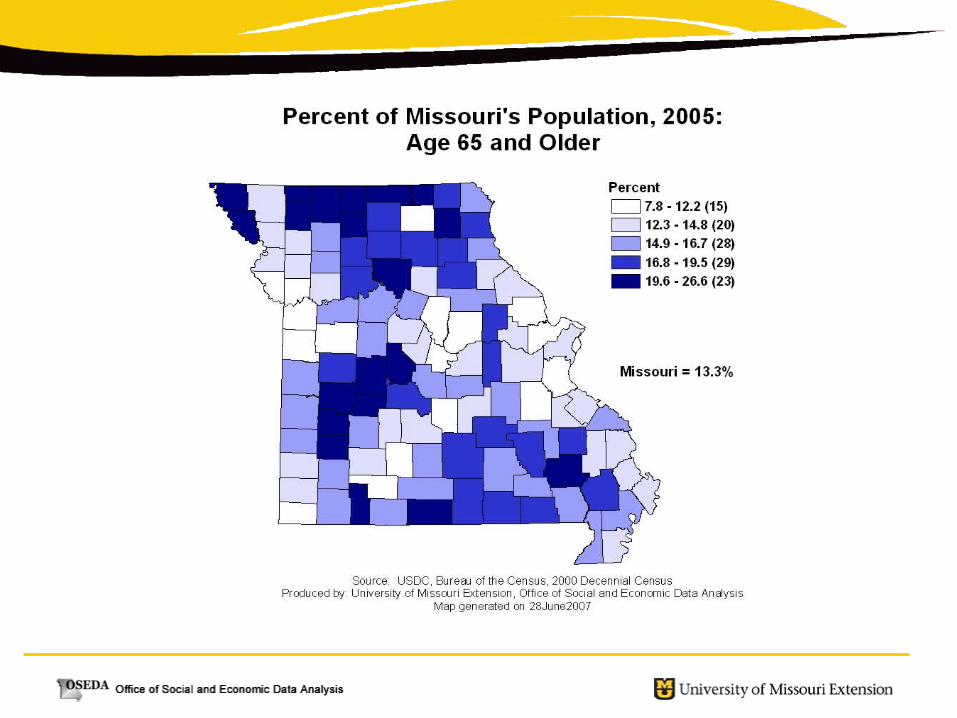
DEMOGRAPHIC DATA

Percent Population Change
Total Population
World: 6.7 Billion
U.S.: 302 Million
Mo.: 5,878,415
@

* ** *
*
Percent Population Change
Total Population
World: 6.7 Billion
U.S.: 302 Million
Mo.: 5,878,415U.S. : 20.2 MillionFive States: 10.6 Million

* ** *
*
Percent Population Change
Total Population
World: 6.7 Billion
U.S.: 302 Million
Mo.: 5,878,415
Boone: 152,435
U.S. : 20.2 MillionFive States: 10.6 Million
Missouri 5.0% US 7.2%

Regions within regions


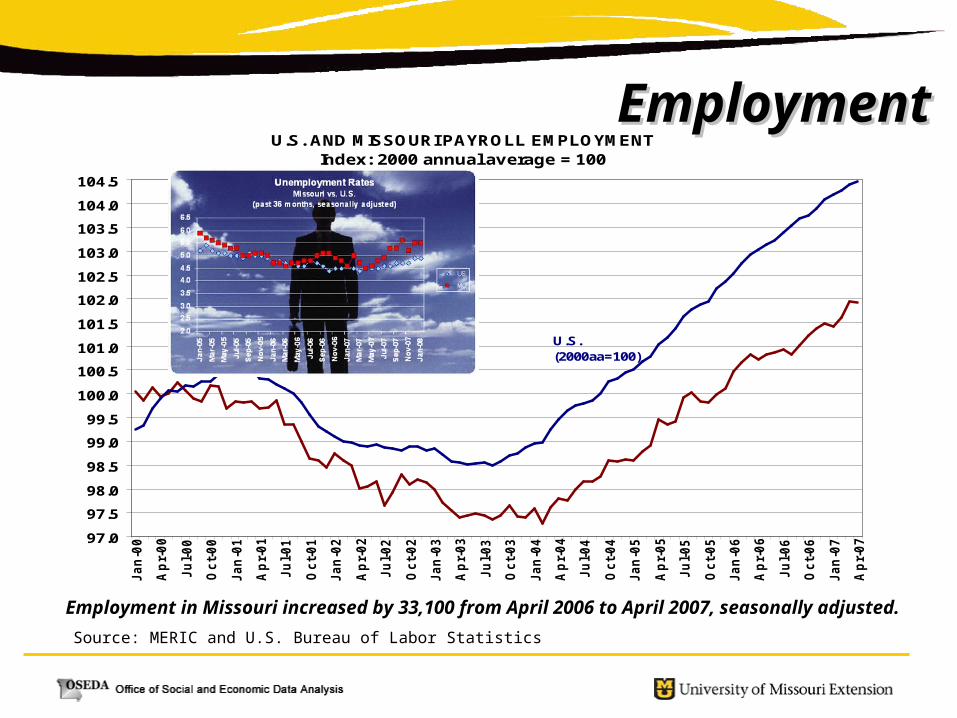
U.S. AND MISSOURI PAYROLL EMPLOYMENTIndex: 2000 annual average = 100
97.0
97.5
98.0
98.5
99.0
99.5
100.0
100.5
101.0
101.5
102.0
102.5
103.0
103.5
104.0
104.5
Ja
n-0
0
Ap
r-0
0
Ju
l-0
0
Oc
t-0
0
Ja
n-0
1
Ap
r-0
1
Ju
l-0
1
Oc
t-0
1
Ja
n-0
2
Ap
r-0
2
Ju
l-0
2
Oc
t-0
2
Ja
n-0
3
Ap
r-0
3
Ju
l-0
3
Oc
t-0
3
Ja
n-0
4
Ap
r-0
4
Ju
l-0
4
Oc
t-0
4
Ja
n-0
5
Ap
r-0
5
Ju
l-0
5
Oc
t-0
5
Ja
n-0
6
Ap
r-0
6
Ju
l-0
6
Oc
t-0
6
Ja
n-0
7
Ap
r-0
7
U.S. (2000aa=100)
MISSOURI(2000aa=100)
Employment in Missouri increased by 33,100 from April 2006 to April 2007, seasonally adjusted.
Source: MERIC and U.S. Bureau of Labor Statistics
EmploymentEmployment

Regional Economic Share
St. Louis County 21%Jackson
County 11%
Central 6.5%
2007 Missouri Economic Report
Source: MERIC
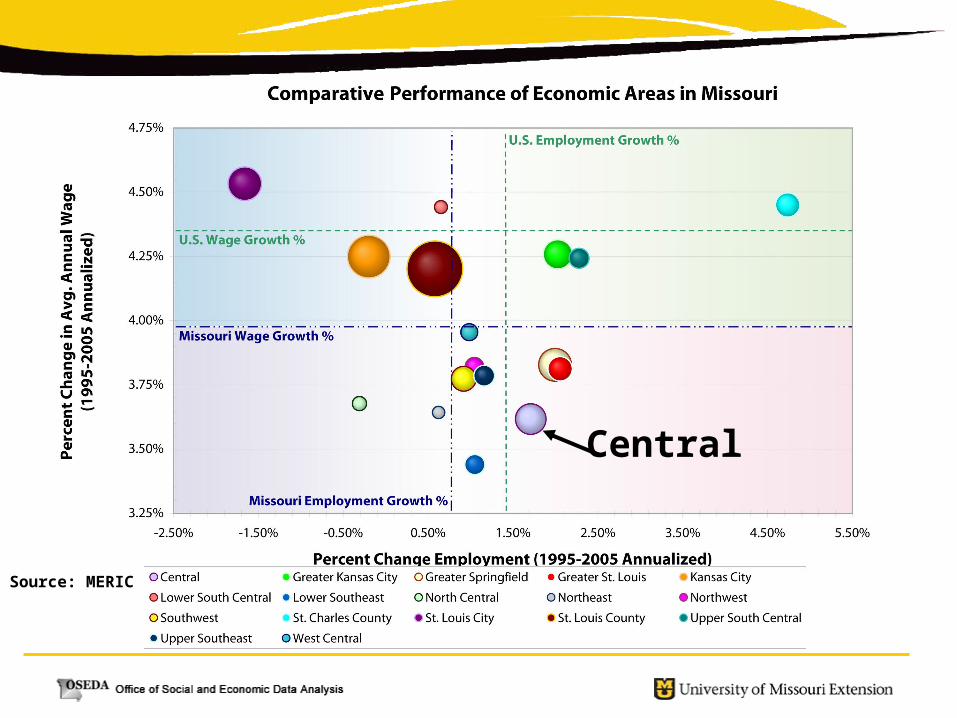
Central

Economic Share in Missouri by County, 2006
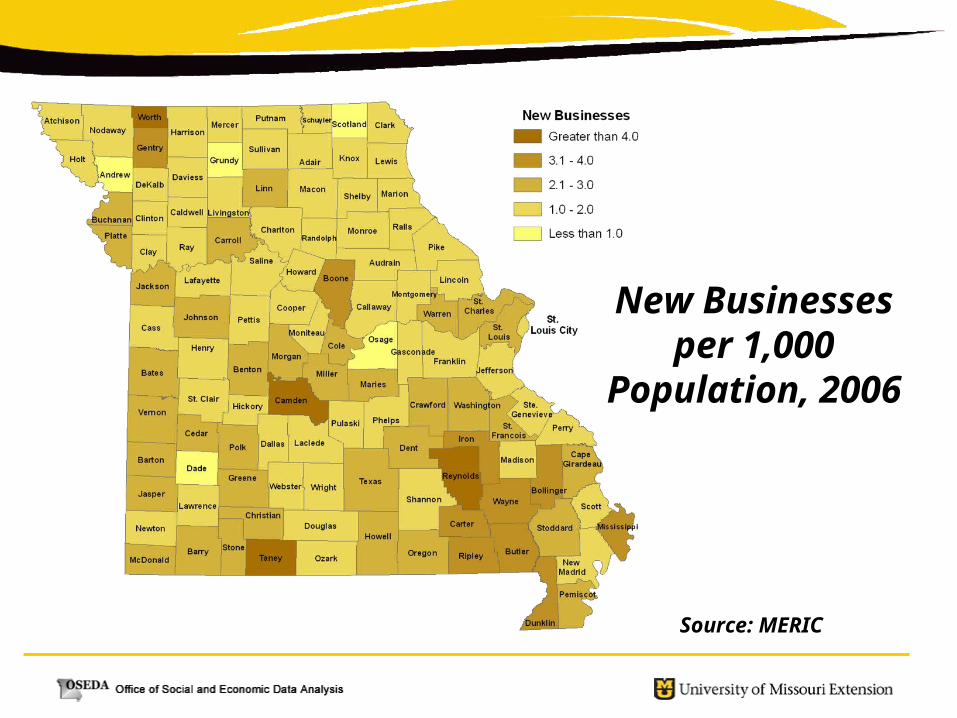
Source: MERIC
Source: MERIC
New Businesses per
1,000 Population,
2006

How f l a tf l a t the world is depends on where you’re standing…
• The World is Flat – “new oil wells” — Thomas Friedman
• Making Globalization Work — Joseph Stiglitz
• Networking Diverse Assets, especially human capital… “collaboration” is hard
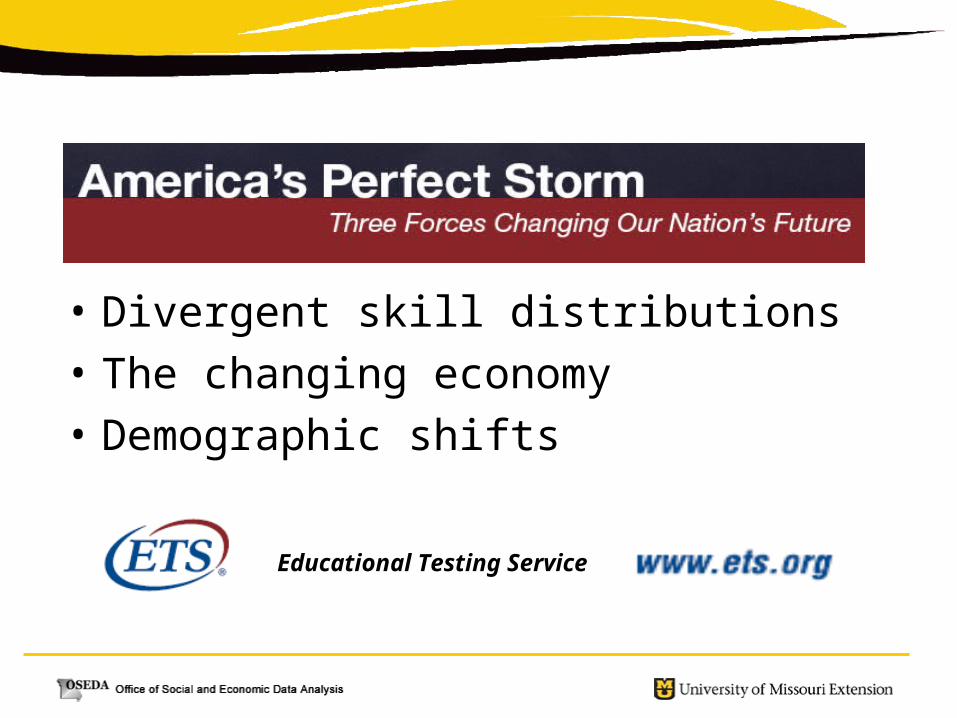
• Divergent skill distributions
• The changing economy
• Demographic shifts
Educational Testing Service

Missouri’s rating declined from 28th in 2002 to 35th in 2007
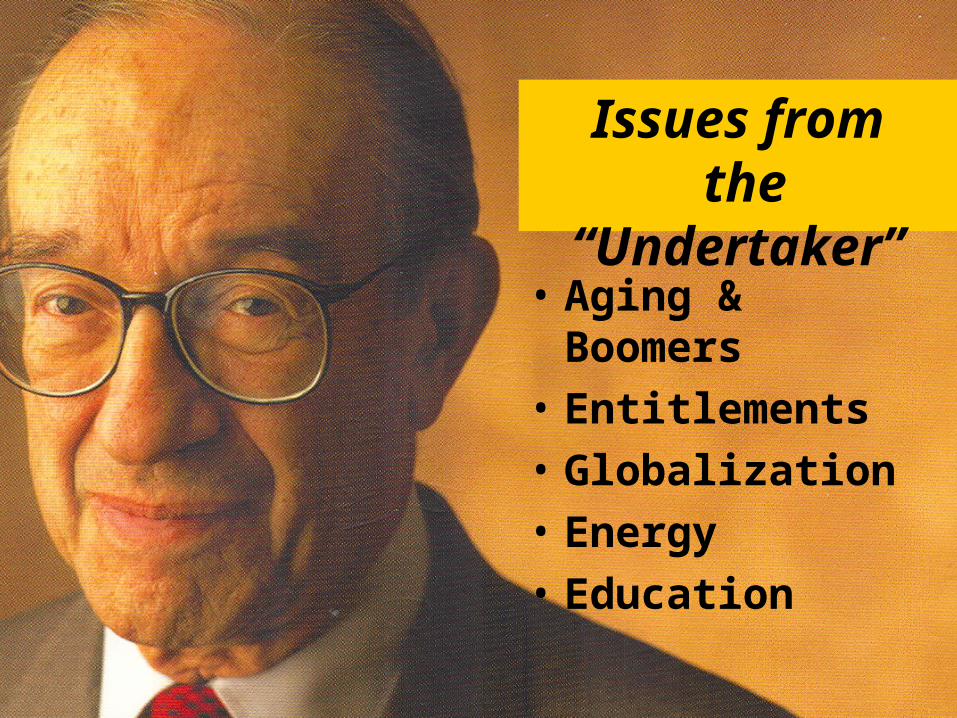
Issues from the “Undertaker”
• Aging & Boomers
• Entitlements
• Globalization
• Energy
• Education

Change in the Hispanic Population 2000 - 2006
• Percent Change: U.S. 6.4% -- Hispanic 25.5%• Hispanics (44.3 million)• Blacks (38.3 million)• Missouri Hispanic Population 2006
– 164,194 – 38.4% gain since 2000
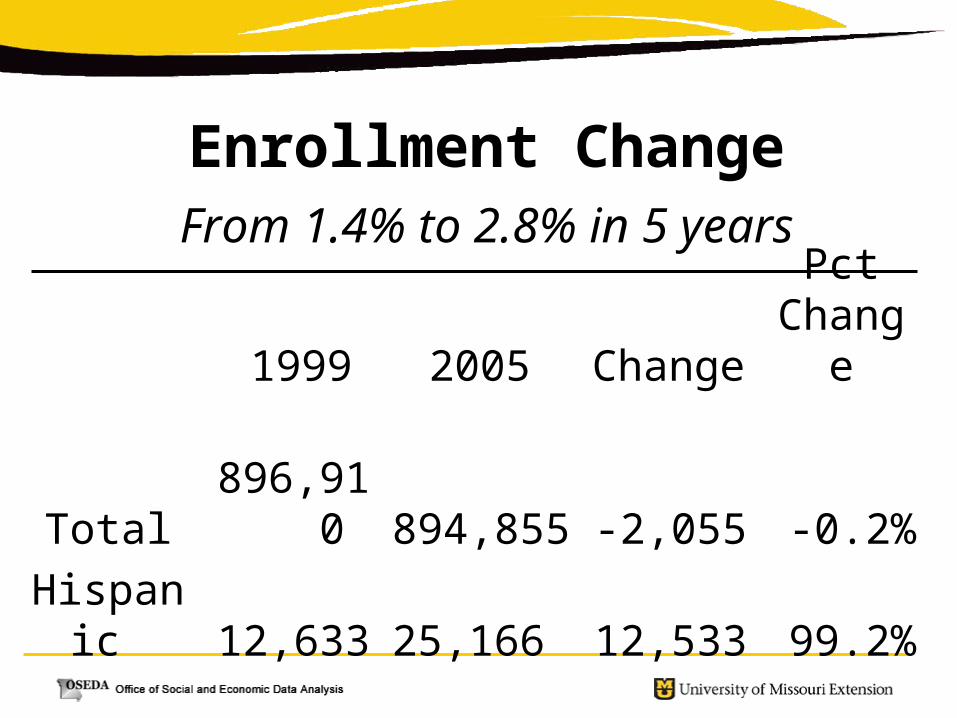
1999 2005 ChangePct
Change
Total
896,910
894,855 -2,055 -0.2%
Hispanic
12,633
25,166
12,533 99.2%
Enrollment ChangeFrom 1.4% to 2.8% in 5 years

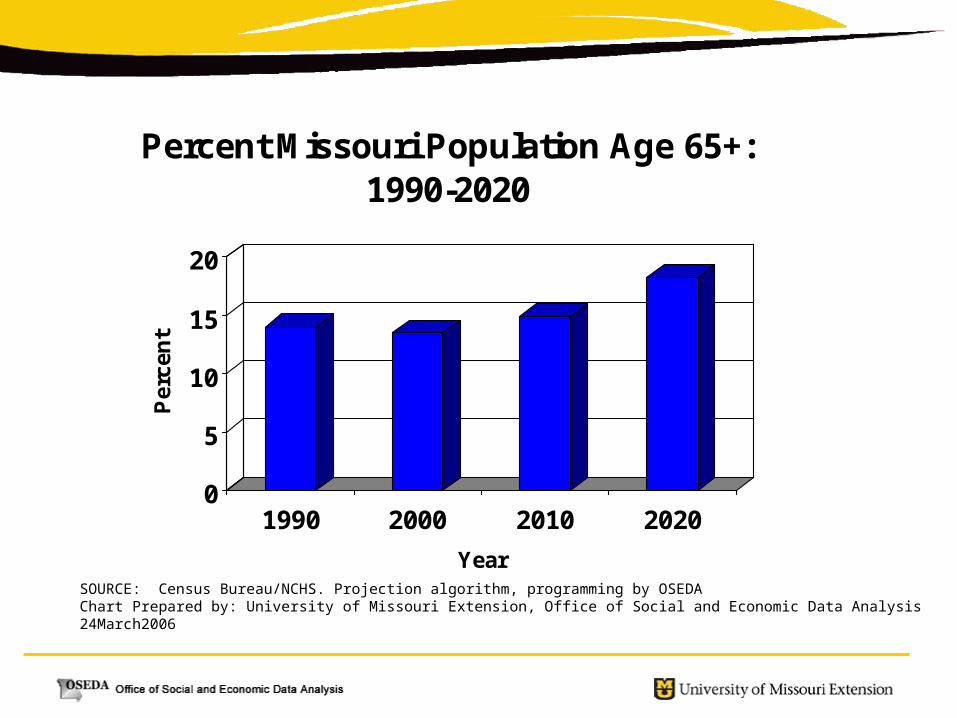
0
5
10
15
20
Per
cen
t
1990 2000 2010 2020
Year
Percent Missouri Population Age 65+: 1990-2020
SOURCE: Census Bureau/NCHS. Projection algorithm, programming by OSEDA Chart Prepared by: University of Missouri Extension, Office of Social and Economic Data Analysis24March2006


Composite Kids Count Ratings, 2007
Quality of Life Indicators for Kids
REFLECTION
What are three demographic trends that you believe will impact your district?
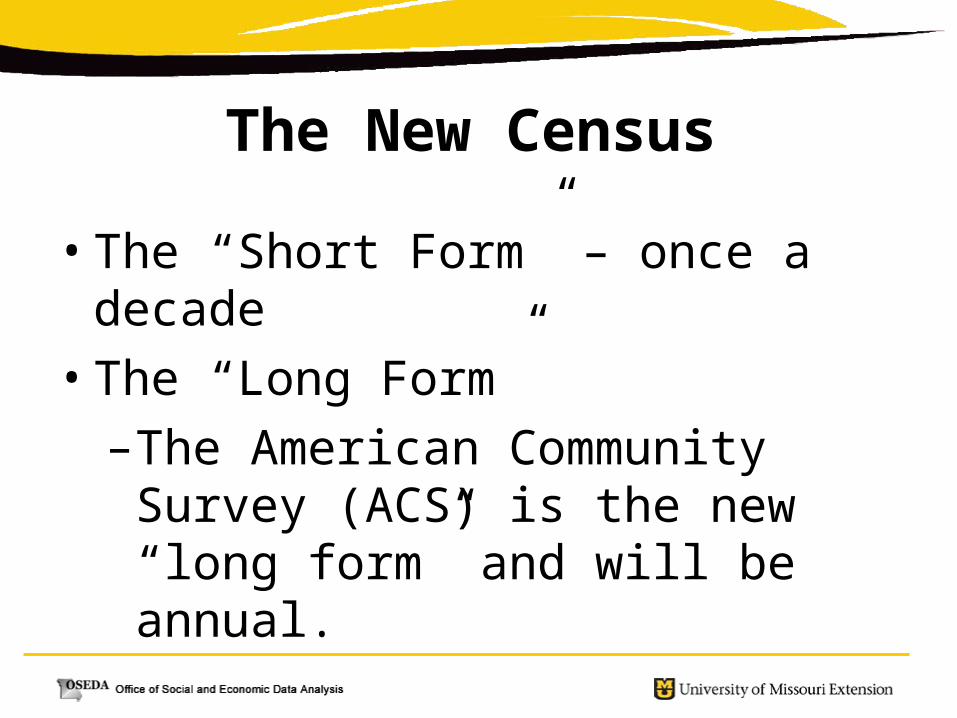
The New Census
• The “Short Form” – once a decade
• The “Long Form”
–The American Community Survey (ACS) is the new “long form” and will be annual.

ACS Plans• ACS data are available now for areas with
populations of 65,000 or more.
• In 2008, the Census Bureau will release the three-year estimates for areas with populations of 20,000 or more.
• In 2010, 5-year estimates will be released including the smallest of geographic areas —down to the tract and block group levels.
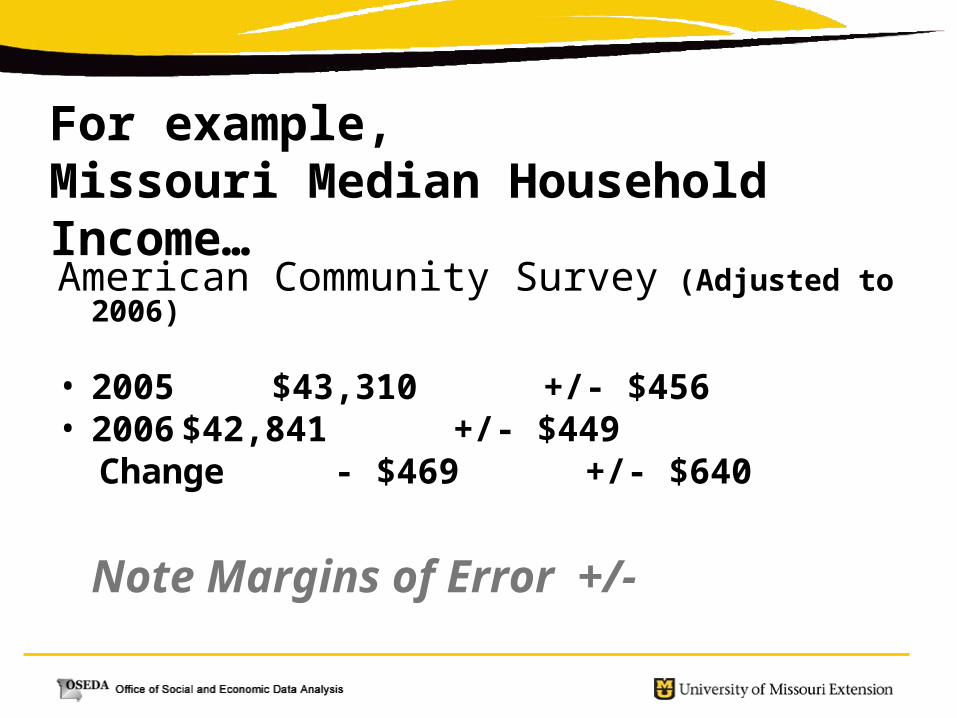
For example,Missouri Median Household Income…
American Community Survey (Adjusted to 2006)
• 2005 $43,310 +/- $456 • 2006 $42,841 +/- $449 Change - $469 +/- $640
Note Margins of Error +/-

Missouri Median Household Income
American Community Survey (Adjusted to 2006) • 2005 $43,310 +/- $456 • 2006 $42,841 +/- $449 • Change - $469 +/- $640
Current Population Survey (not adj.) • 2005 $44,686 +/- $1,465• 2006 $44,487 +/- $1,647
(None of the differences are statistically significant.)
Note differences in the 90 percent margins of error between the ACS and CPS

Key Elements
• Geography Nation, states, cities, counties and school districts.
• Now 65,000+ Eventually, areas as small as census tracts using multi-year averages.
• Sample Size About 3 million addresses per year. Data are collected from about one-twelfth of the sample each month.
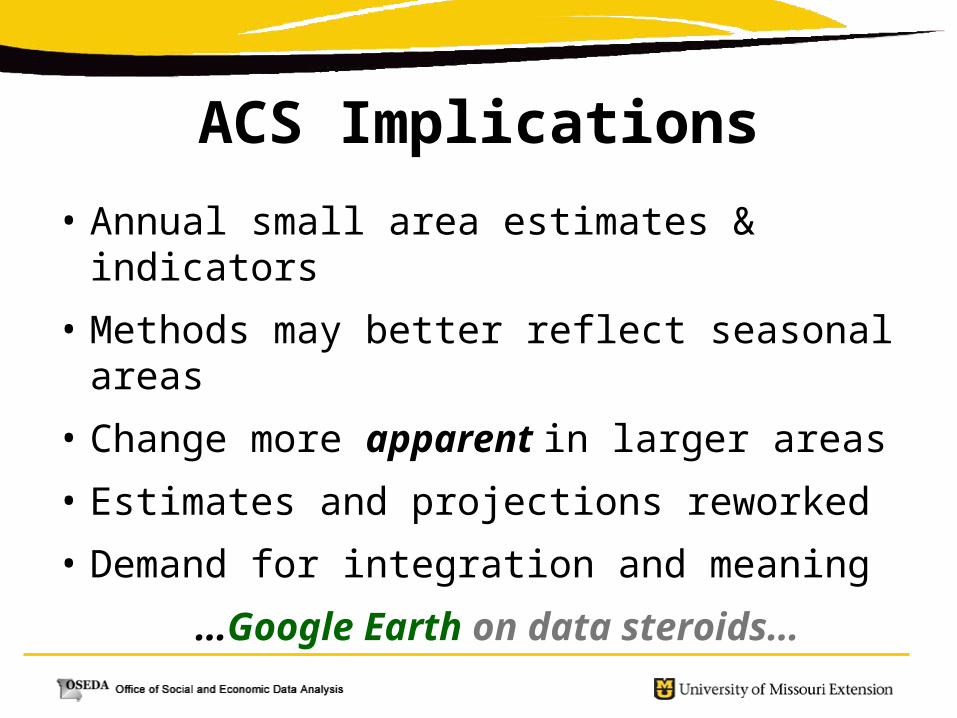
ACS Implications
• Annual small area estimates & indicators
• Methods may better reflect seasonal areas
• Change more apparent in larger areas
• Estimates and projections reworked
• Demand for integration and meaning
…Google Earth on data steroids…
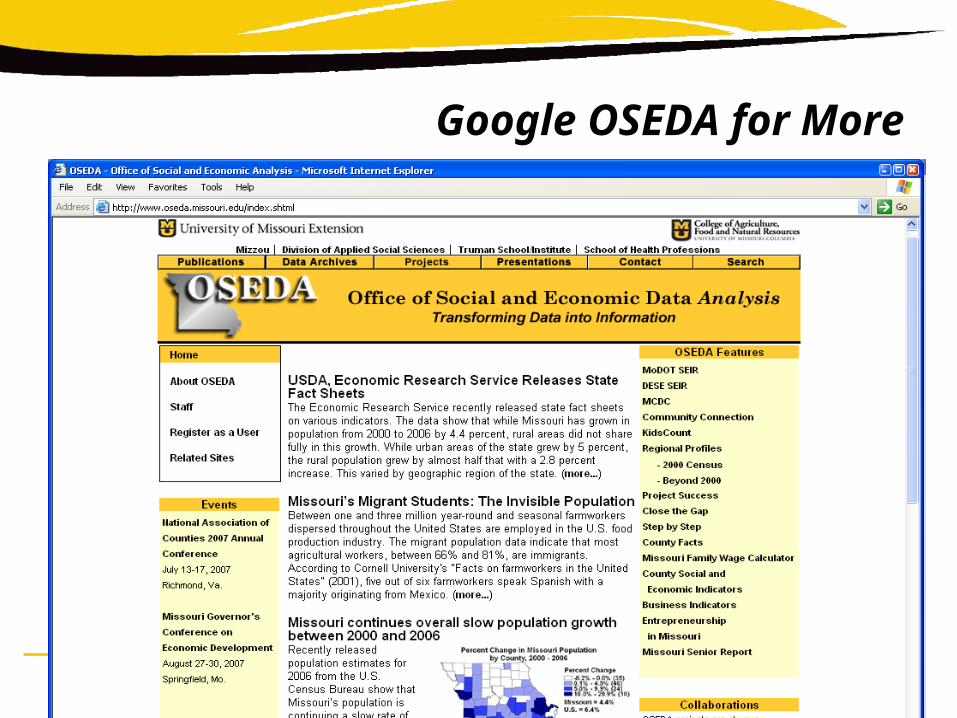
Google OSEDA for More
RESOURCE DATA

Resources Are Needed To Get Done What Needs To Get Done
• It all starts with the budget!
• Is the district budget an important part of your work?
• Is the budget the educational plan, and are priorities expressed in dollars and cents?

Is Our Only Valuable Resource The Money?
• What are the intangible assets or resources that you value in your district?
• Do you gather information regarding how you identify and make use of these intangible resources (social capital)?
MSIP Resource Standards
• Program of Studies
• Class Size/Assigned Enrollments
• Professional Support Staff
• Administrative Staff
• Certification
• Planning Time

PROCESS DATA
THE MSIP ADVANCE QUESTIONNAIRE (AQ):
A storehouse of often underutilized but important
perceptual data

The Advance Questionnaire (AQ)• Perceptual data obtained through a
questionnaire(s) • Provides a voice for all key stakeholder
groups• Includes questions based on critical
research-based elements• Allows development of additive scales
consistent with Effective Schools Research

The Advance Questionnaire (AQ)
• Longitudinal data available from 1990 to present in the form of legacy scales & items.
• Unlike many perceptual data collection tools & processes, the AQ offers checks on reliability and validity.
• Scales directly relate to MSIP standards & indicators.

N Received
Population Estimate
Response Rate
Students 106,034 127,758 83%Parents 76,297 152,468 50%Faculty 11,740 14,646 80%
Response Rates for the State Sample 2006- 07

Selected Additive Scales/Definitions
• Leadership: This scale identifies the degree to which leadership is perceived as effective in improving student learning.
• School Climate: This scale identifies the degree to which all students feel respected and valued.
• Efficacy and Expectations: This scale identifies the degree to which teachers and students believe that they are capable of impacting student achievement.

Additive Scales and Definitions (cont.)
• Differentiated Instruction: This scale identifies the degree to which teachers vary and revise instruction to meet the needs of students.
• Safe and Orderly Environment: This scale identifies the degree to which the school environment is safe and orderly.
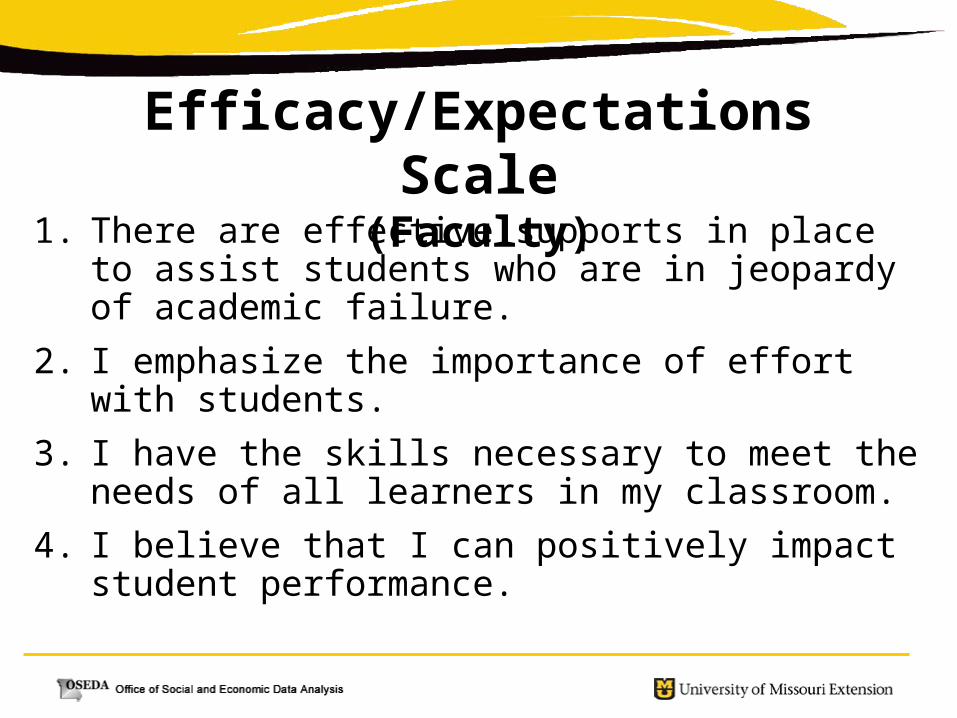
Efficacy/Expectations Scale(Faculty)
1. There are effective supports in place to assist students who are in jeopardy of academic failure.
2. I emphasize the importance of effort with students.
3. I have the skills necessary to meet the needs of all learners in my classroom.
4. I believe that I can positively impact student performance.

Efficacy/Expectations Scale(Faculty)
5. Students are held accountable for doing quality work.
6. All staff in our school hold high expectations for student learning.
7. There are avenues for recognizing and rewarding the accomplishments of all students.

Variance In MAP Communication Arts
Achievement is Explained by…

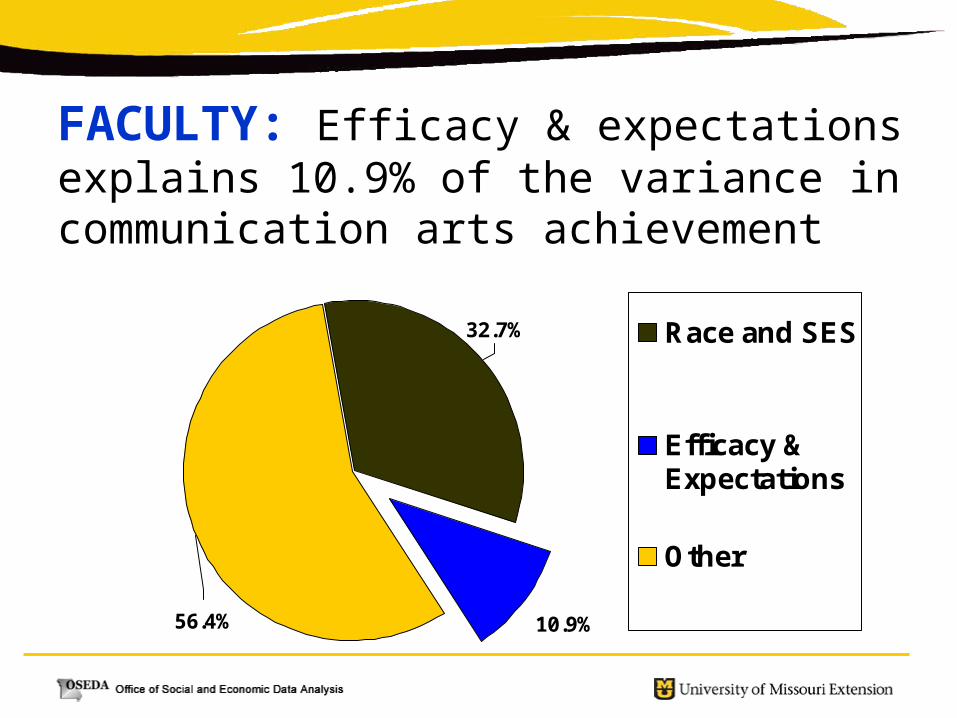
FACULTY: Efficacy & expectations explains 10.9% of the variance in communication arts achievement
10.9%56.4%
32.7% Race and SES
Efficacy &Expectations
Other

Example from Happy Valley R-IX School District
The efficacy and expectations scale from the faculty Advance Questionnaire identifies the degree to which teachers believe that they are capable of impacting student achievement.
The Faculty scale for Efficacy & Expectations consists of seven questions:

Happy Valley District Faculty percentile mean std dev n
All staff in our school hold high expectations for student learning.
53 4.18 0.79 173
I believe that I can positively impact student performance.
35 4.56 0.52 173
I emphasize the importance of effort with students.
60 4.75 0.55 173
I have the skills necessary to meet the needs of all learners in my classroom.
29 4.19 0.77 173
Students are held accountable for doing quality work.
72 4.22 0.71 173
There are avenues for recognizing and rewarding the accomplishments of all students.
61 4.36 0.58 173
There are effective supports in place to assist students who are in jeopardy of academic failure.
30 4.01 0.94 173

School Building Results for Efficacy and Expectations Faculty Scale
district school_namepercent
ile mean std_dev n
HAPPY VALLEY DISTRICT 53 4.32 0.45 173HAPPY VALLEY HAPPY VALLEY
HIGH43 4.19 0.51 48
HAPPY VALLEY HAPPY VALLEY MIDDLE
80 4.44 0.43 35
HAPPY VALLEY HILL TOP ELEM. 10 4.14 0.39 13HAPPY VALLEY JOHNSON ELEM. 62 4.46 0.42 13
HAPPY VALLEY PARK ELEM. 39 4.35 0.41 21HAPPY VALLEY DEERFIELD ELEM. 45 4.38 0.39 38
FACULTY: Efficacy & expectations explains 10.9% of the variance in communication arts achievement
10.9%56.4%
32.7% Race and SES
Efficacy &Expectations
Other

State Distribution — Faculty

Student Perceptions: Happy Valley R-IX School District
The efficacy and expectations scale from the student (grade 3 and older) Advance Questionnaire identifies the degree to which students believe that they are capable of impacting student achievement.
The Student scale for Efficacy & Expectations consists of six questions:

Efficacy/Expectations Scale(Students)
1. If I do well in school, it will help me when I grow up.
2. Being successful in school today will help me in my future.
3. I can do well in school.4. I learn a lot in this school.

Efficacy/Expectations Scale(Students)
5. My teachers think I can learn.6. My family believes that I can do well
in school.7. My teachers expect very good work
from me.

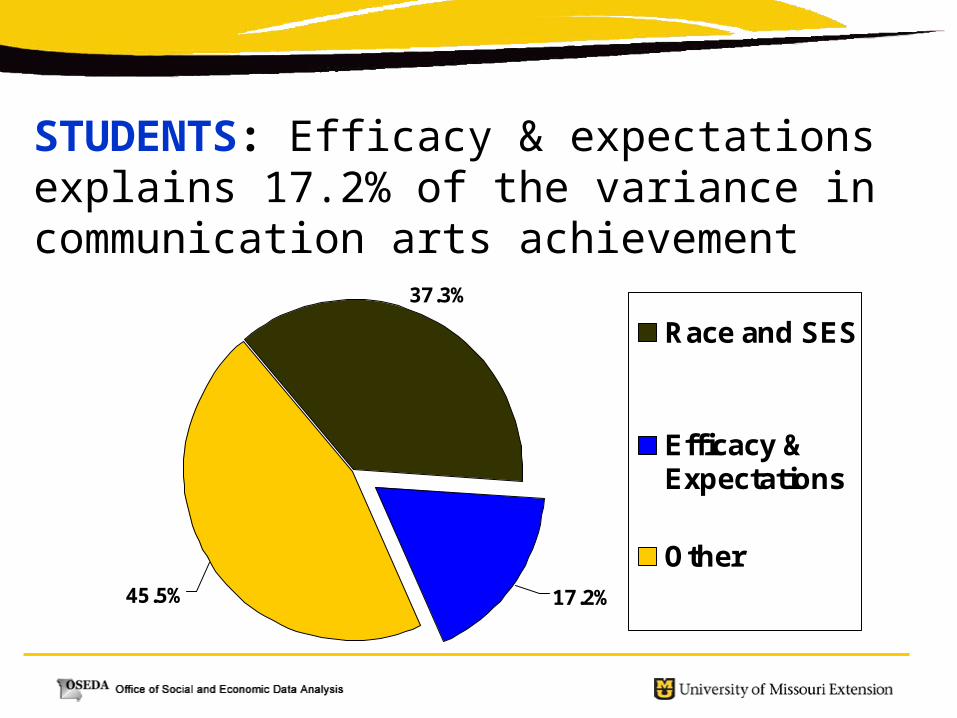
STUDENTS: Efficacy & expectations explains 17.2% of the variance in communication arts achievement
17.2%45.5%
37.3%
Race and SES
Efficacy &Expectations
Other
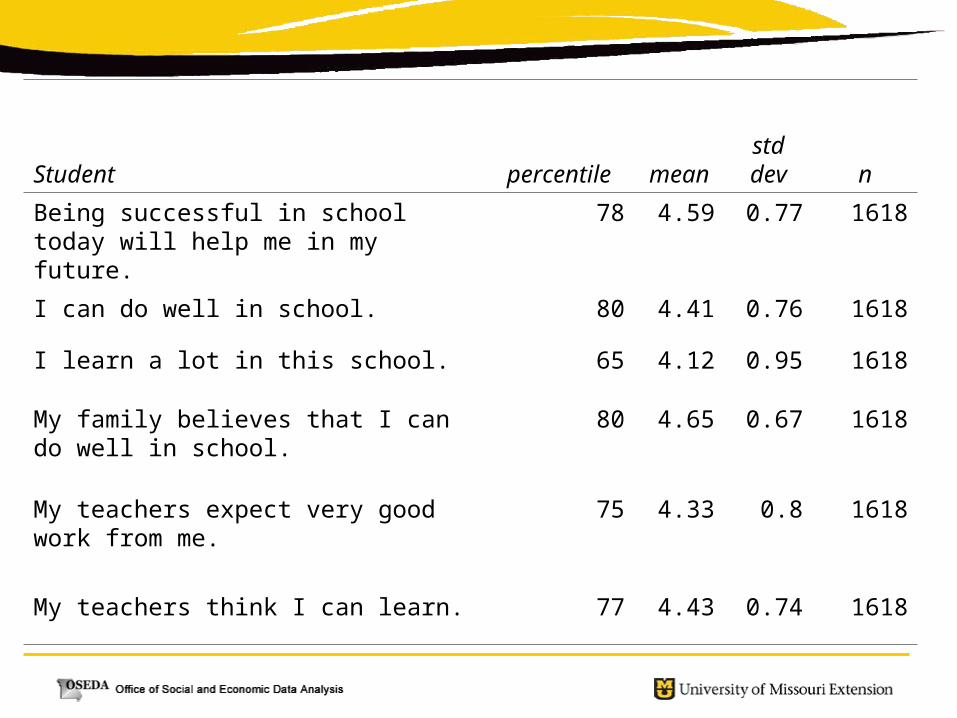
Student percentile meanstd dev n
Being successful in school today will help me in my future.
78 4.59 0.77 1618
I can do well in school. 80 4.41 0.76 1618
I learn a lot in this school. 65 4.12 0.95 1618
My family believes that I can do well in school.
80 4.65 0.67 1618
My teachers expect very good work from me.
75 4.33 0.8 1618
My teachers think I can learn. 77 4.43 0.74 1618
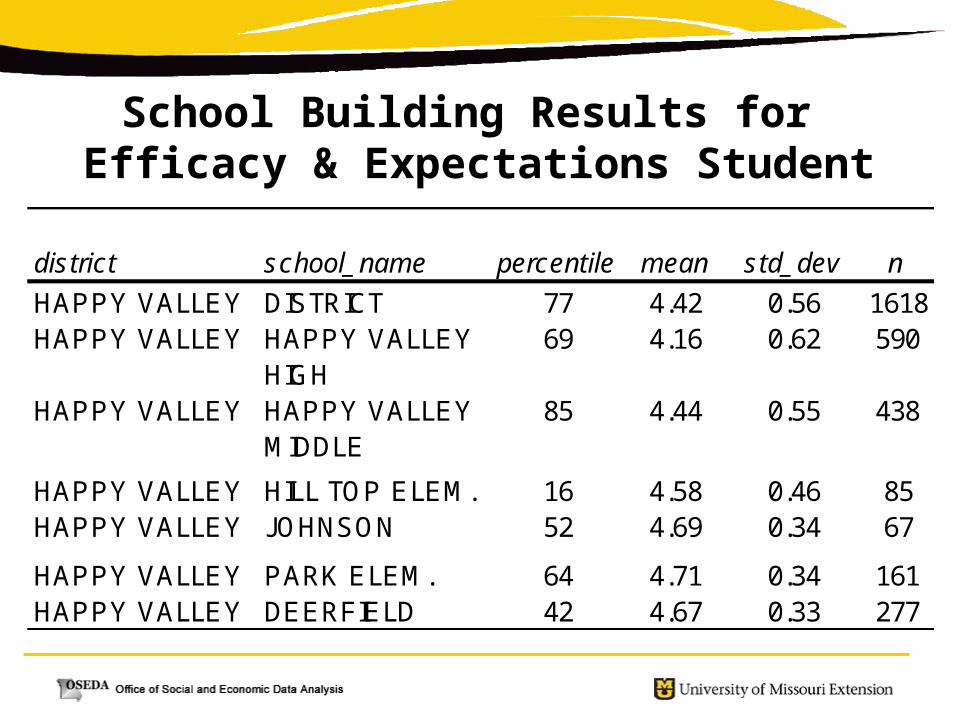
School Building Results for
Efficacy & Expectations Student Scale
district school_name percentile mean std_dev n
HAPPY VALLEY DISTRICT 77 4.42 0.56 1618HAPPY VALLEY HAPPY VALLEY
HIGH69 4.16 0.62 590
HAPPY VALLEY HAPPY VALLEY MIDDLE
85 4.44 0.55 438
HAPPY VALLEY HILL TOP ELEM. 16 4.58 0.46 85HAPPY VALLEY JOHNSON
ELEM.52 4.69 0.34 67
HAPPY VALLEY PARK ELEM. 64 4.71 0.34 161HAPPY VALLEY DEERFIELD
ELEM.42 4.67 0.33 277
STUDENTS: Efficacy & expectations explains 17.2% of the variance in communication arts achievement
17.2%45.5%
37.3%
Race and SES
Efficacy &Expectations
Other
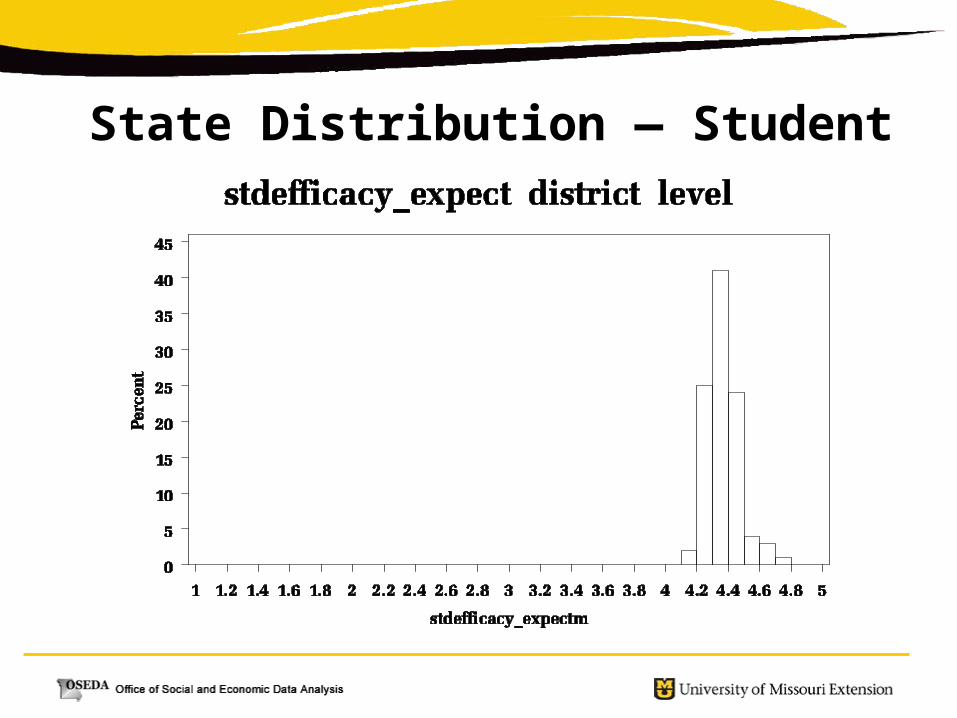
State Distribution — Student
Lets examine the results from a single school building: Hill Top Elem.
First for Faculty, then Students.

Hill Top Faculty percentile meanstd dev
n
All staff in our school hold high expectations for student learning.
43 4.31 0.63 13
I believe that I can positively impact student performance.
25 4.54 0.52 13
I emphasize the importance of effort with students.
47 4.77 0.44 13
I have the skills necessary to meet the needs of all learners in my classroom.
5 3.92 0.76 13
Students are held accountable for doing quality work.
13 4 0.41 13
There are avenues for recognizing and rewarding the accomplishments of all students.
6 3.85 0.69 13
There are effective supports in place to assist students who are in jeopardy of academic failure.
8 3.62 0.96 13
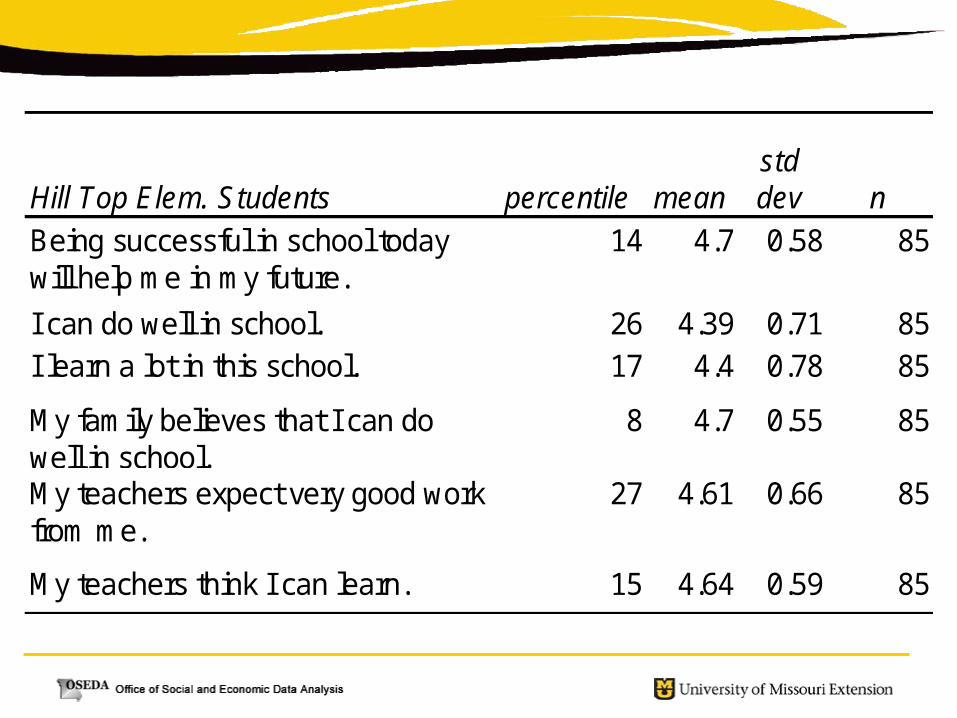
Hill Top Elem. Students percentile meanstd dev n
Being successful in school today will help me in my future.
14 4.7 0.58 85
I can do well in school. 26 4.39 0.71 85I learn a lot in this school. 17 4.4 0.78 85
My family believes that I can do well in school.
8 4.7 0.55 85
My teachers expect very good work from me.
27 4.61 0.66 85
My teachers think I can learn. 15 4.64 0.59 85
Student Perceptions: Happy Valley R-IX School District
6.3.1.6 The instructional strategies scale from the student (grade 6 and older) Advance Questionnaires identifies the degree to which teachers use instructional strategies that research indicates are likely to result in improved student learning.
The Student scale for Instructional Strategies consists of seven questions.
What can we observe from this scale?

Hill Top Studentspercent
ile meanstd_dev n
I am asked to identify similarities and differences.
29 3.04 1.02 27
I am asked to revise or correct errors in my work.
3 2.58 1.14 27
I am asked to summarize new material.
7 2.52 1.05 27
I am asked to use pictures, graphs, maps, or charts to present my information.
3 2.31 0.84 27
I am given opportunities to present what I have learned to other students.
21 2.74 0.94 27
I am required to take notes. 4 2.44 0.89 27
My teachers place students in small groups.
43 3.11 0.97 27

THE MSIP 4TH CYCLE CLASSROOM OBSERVATION
TOOL:
A New Way To Examine Prevailing Instructional Practice

MSIP CLASSROOM OBSERVATION “LOOK FORS”
(As with the AQ, based on latest effective schools research by Robert Marzano, MCREL, and others)

“LOOK FORS”
• Differentiated instruction
• Instructional delivery methods
• Instructional strategies
• Level of engagement
• Depth of knowledge (higher order thinking)
“LOOK FORS”
• Classroom learning environment
• Instructional climate
• Student work displayed
• Technology use

Implications Of Classroom Observation Data
• What is prevailing instructional practice now?
• What does the research say about instructional strategies and the effect on student performance?
• Is our professional development bringing about changes in instruction?
PERCEPTUAL DATA COLLECTION TECHNIQUES
• Survey/Questionnaires (web-based or traditional paper forms)
• Focus groups• Interviews• Town hall meetings• Clicker activity• Colored dots to prioritize and categorize

PERFORMANCE DATA

MSIP Performance Standards/APR
• MAP• ACT• Advanced courses• Career education courses• College placement• Career education placement• Attendance• Graduation rate

Sources: Performance Data
• Annual Performance Report (APR)
• Disaggregated with Multiple Years
• MAP Index by Subject Area
• Attendance
• Graduation Rate
• College and Career Preparation Indicators
Annual Performance Report (APR)
• Explore the district APR in the handouts
• There is valuable information in the front section, but don’t neglect the “rest of the story.”


CONCLUDING THOUGHTSYOURS AND OURS
• What about leadership?
• How can we make data-based decision making for boards of education more accessible and meaningful?

Leadership: Marzano indicates that leaders create a
purposeful community—
“One with the collective efficacy and capacity to develop and use assets to accomplish goals that matter to all community members through agreed-upon processes.”
Not just for school, but the entire community enterprise

FACULTY: Instructional leadership explains 5.8% of the variance in communication arts achievement
5.8%61.5%
32.7% Race and SES
InstructionalLeadership
Other
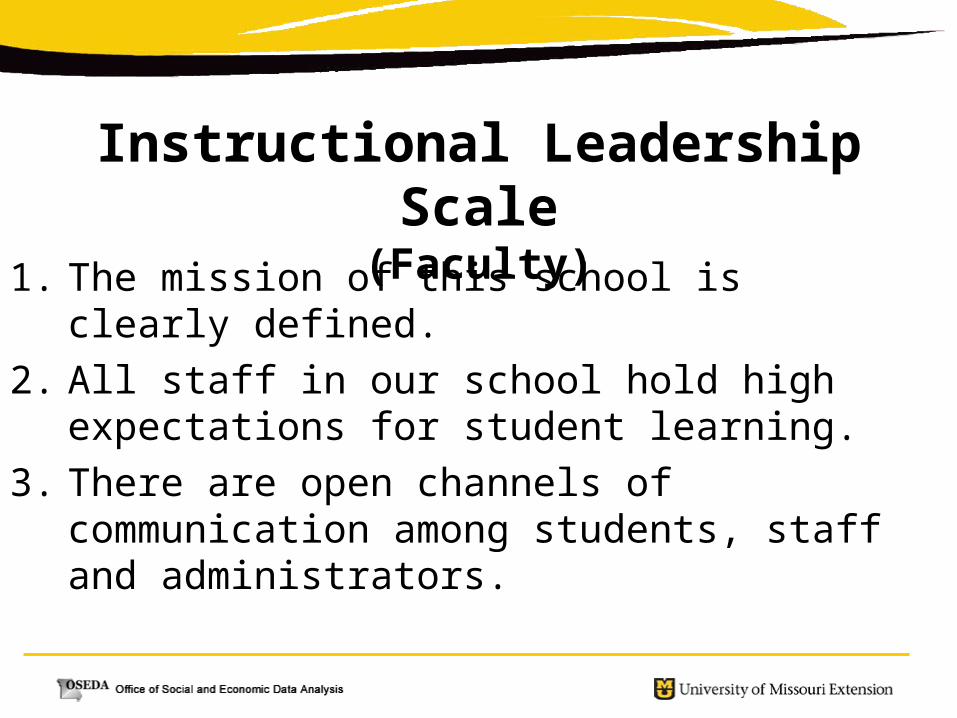
Instructional Leadership Scale(Faculty)
1. The mission of this school is clearly defined.
2. All staff in our school hold high expectations for student learning.
3. There are open channels of communication among students, staff and administrators.

Data Axioms• Our job is not the mindless accumulation
of data, rather the prudent reduction of unnecessary data
• Averages don’t tell you much about individuals
• Two data points do not a trend make
• Always remember it isn’t the numbers that are important, it is the people
THE POWER OF DATA ANALYSIS TO INFORM IMPROVEMENT
A Presentation toMSBA Leadership Conference
Bill Elder, Keith Jamtgaard and Howard Jones Office of Social and Economic Data Analysis
University of MissouriJune 6, 2008