the power of mapping financial services data power of mapping... · the power of mapping financial...
TRANSCRIPT
The Power of Mapping Financial Services Data, July 2013 | 1
The Power of Mapping Financial Services Data
By: Karina Broens Nielsen
Program Officer, Measurement, Learning and Evaluation, Financial Services for the Poor,
Bill & Melinda Gates Foundation
Todd Slind
Founder/Principal, Spatial Development
Background: Financial Services for the Poor’s Strategy
Increasing access to better financial tools can help accelerate the rate at which people move out of poverty and help
them maintain economic gains. Nevertheless, 77% of those living on less than $2/day do not have a bank account.
At the regional level, 86% of all adults in sub-Saharan Africa and 77% in South Asia are disconnected from the
banking system.1 The poor are not so much in a static state of chronic poverty: millions transition out of poverty by
capturing opportunities to invest or by finding new jobs, but large numbers fall back into poverty every few years
due to various economic shocks. Evidence shows that poor people intensively need finance during the pivotal
moments associated with transitions in and out of poverty, as well as in their day to day life to make ends meet.
Research supports the notion that improved financial tools will give poor people greater ability to capture
opportunities and move out of poverty at faster rates, while slowing the rate at which they are knocked back into
poverty due to adverse shocks. Impacts will occur at three levels: i) reducing transaction costs; ii) managing health,
lifecycle and agricultural shocks; and iii) economy-wide efficiencies.
Despite significant individual and social benefits of greater use of formal financial services by poor people, several
barriers exclude most poor families:
High run-rate costs (cash handling; documentation; IT) of serving poor customers relative to the revenues
generated by their small transactions and balances.
High costs of building a distribution system to acquire and serve poor customers.
Asymmetries of information about poor people’s financial lives, which make it difficult to develop
products tailored to meet their needs and create large risks to providers.
Misguided regulations that impose costs disproportional to their intended benefits.
Addressing these barriers will require a fundamental shift in the cost structure of financial service delivery,
availability of products that are valuable to poor people, and appropriate regulations. Shifting the bulk of the poor’s
financial transactions into digital form is the catalytic change that will strip enough costs out of the system to
stimulate aggressive commercial efforts to reach the poor. In addition, as people migrate more of their financial lives
into digital form, many of the asymmetries of information that make product design and risk mitigation difficult and
expensive are addressed. Finally, digital mechanisms can better connect the poor to a broader set of services in
ways that also enable more efficient social payments, tax collection, and reduced corruption.
1 Global Findex (2011).
An Interactive Geospatial Tool for Financial Inclusion Analysis
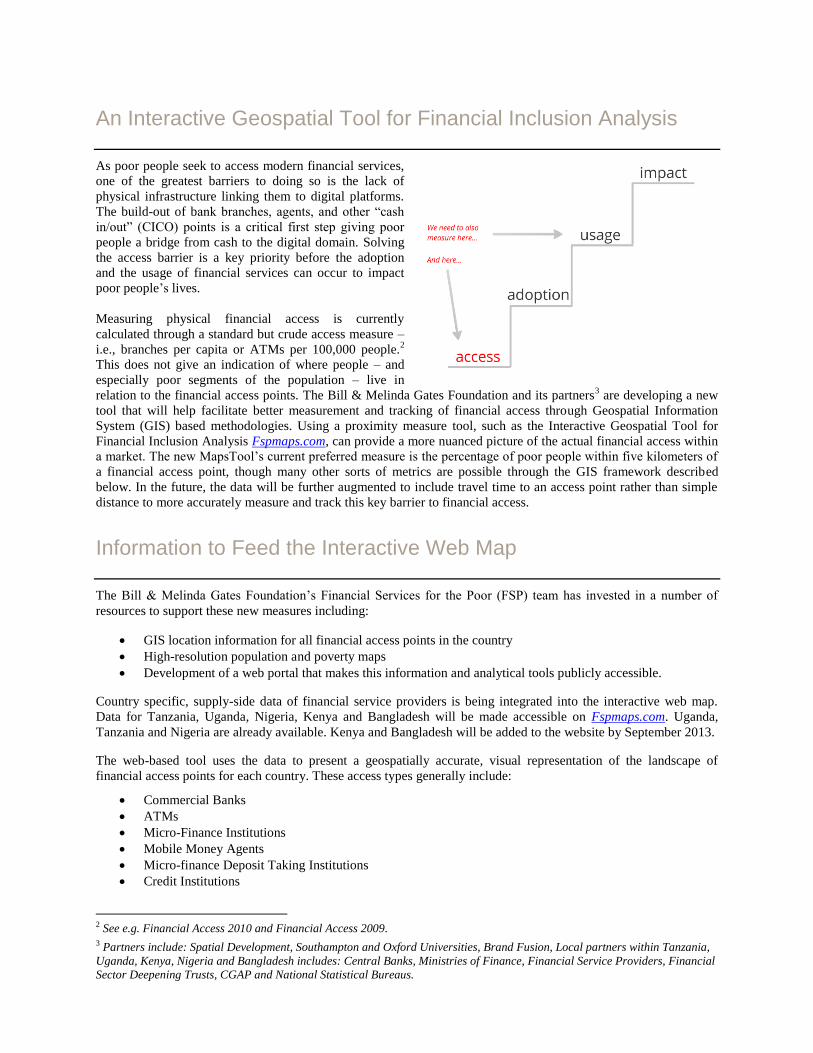
As poor people seek to access modern financial services,
one of the greatest barriers to doing so is the lack of
physical infrastructure linking them to digital platforms.
The build-out of bank branches, agents, and other “cash
in/out” (CICO) points is a critical first step giving poor
people a bridge from cash to the digital domain. Solving
the access barrier is a key priority before the adoption
and the usage of financial services can occur to impact
poor people’s lives.
Measuring physical financial access is currently
calculated through a standard but crude access measure –
i.e., branches per capita or ATMs per 100,000 people.2
This does not give an indication of where people – and
especially poor segments of the population – live in
relation to the financial access points. The Bill & Melinda Gates Foundation and its partners3 are developing a new
tool that will help facilitate better measurement and tracking of financial access through Geospatial Information
System (GIS) based methodologies. Using a proximity measure tool, such as the Interactive Geospatial Tool for
Financial Inclusion Analysis Fspmaps.com, can provide a more nuanced picture of the actual financial access within
a market. The new MapsTool’s current preferred measure is the percentage of poor people within five kilometers of
a financial access point, though many other sorts of metrics are possible through the GIS framework described
below. In the future, the data will be further augmented to include travel time to an access point rather than simple
distance to more accurately measure and track this key barrier to financial access.
Information to Feed the Interactive Web Map
The Bill & Melinda Gates Foundation’s Financial Services for the Poor (FSP) team has invested in a number of
resources to support these new measures including:
GIS location information for all financial access points in the country
High-resolution population and poverty maps
Development of a web portal that makes this information and analytical tools publicly accessible.
Country specific, supply-side data of financial service providers is being integrated into the interactive web map.
Data for Tanzania, Uganda, Nigeria, Kenya and Bangladesh will be made accessible on Fspmaps.com. Uganda,
Tanzania and Nigeria are already available. Kenya and Bangladesh will be added to the website by September 2013.
The web-based tool uses the data to present a geospatially accurate, visual representation of the landscape of
financial access points for each country. These access types generally include:
Commercial Banks
ATMs
Micro-Finance Institutions
Mobile Money Agents
Micro-finance Deposit Taking Institutions
Credit Institutions
2 See e.g. Financial Access 2010 and Financial Access 2009. 3 Partners include: Spatial Development, Southampton and Oxford Universities, Brand Fusion, Local partners within Tanzania,
Uganda, Kenya, Nigeria and Bangladesh includes: Central Banks, Ministries of Finance, Financial Service Providers, Financial
Sector Deepening Trusts, CGAP and National Statistical Bureaus.
Savings and Credit Cooperatives Organizations (SACCOs)
Post Offices
Other outlets specific to individual countries.
The information captured includes observable characteristics for financial access point locations such as background
information, service providing organizations, and photographs. The high-resolution population data for all of the
countries mentioned above are now available at Afripop.org and Asiapop.org. The poverty data for those countries,
developed to the same, one-kilometer resolution, will be publicly available later this year. Fspmaps.com currently
includes poverty data for Uganda and Nigeria.
Purpose of the Interactive Web Map
The interactive web map is designed to inform decisions for expanding financial services access in sub-Saharan
Africa and South Asia. The data and tools will help users target investments that expand financial services access for
maximum impact, and will help them optimally place retail access points. A blog post published last year identified
possible applications for a range of decision-makers, as shown in Table 1.
Table 1. How the Web Map Can Inform Decision-making
User Type Use Cases
Service Providers To optimize the Cash-In and Cash-Out agent network expansion, improve
liquidity management, identify new potential customers and market
products, assess proximity and scale of competitors/partners.
Government Agencies To design effective social transfer programs and incentives for the private
sector to extend their offer to underserved and unserved areas e.g.
government cash-transfer programs - payments to government employees,
pension and safety-net payments.
Policy-makers and Regulators Design efficient policies for financial inclusion and monitor their
implementation.
Provides financial market data and information to guide the market players
in designing products, identifying opportunities and responding to
constraints/challenges.
Donors and Development Partners To evaluate impact/outreach of financial inclusion initiatives. Create a geo-
referenced information base – enable sector coordination and leverage e.g.
agricultural/health synergies with financial services.
Additional use cases will be identified and vetted by communities of practice within each focus country.
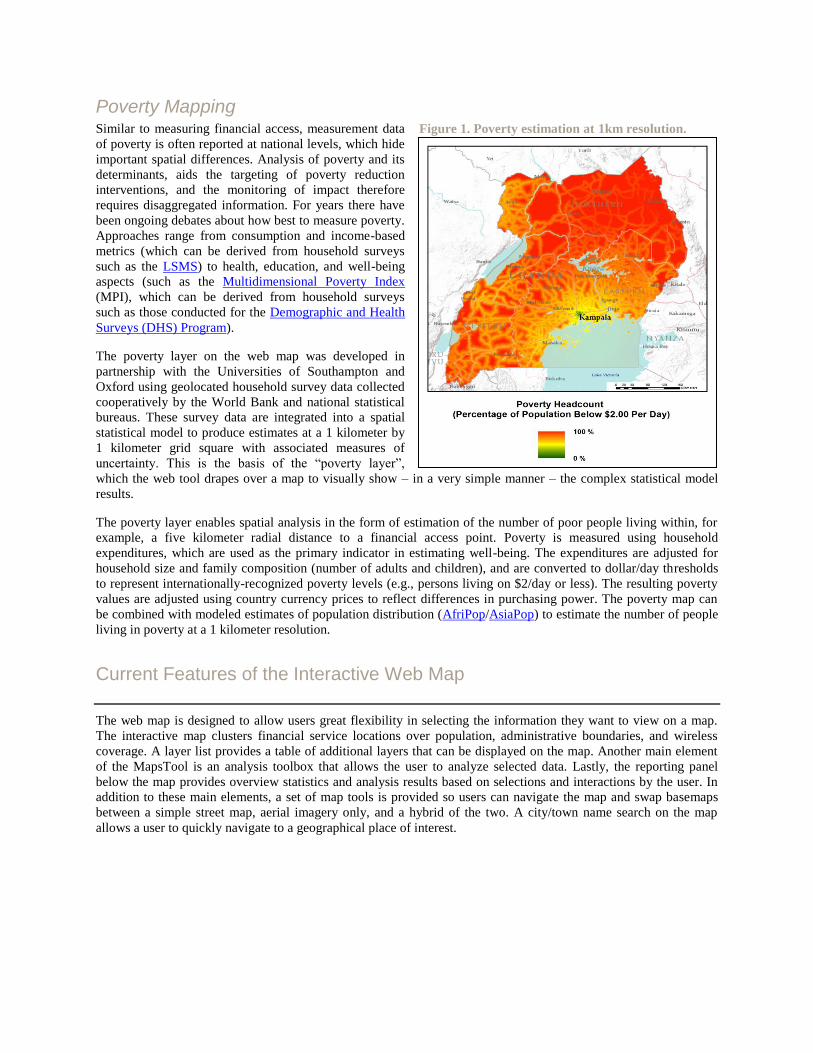
Poverty Mapping Similar to measuring financial access, measurement data
of poverty is often reported at national levels, which hide
important spatial differences. Analysis of poverty and its
determinants, aids the targeting of poverty reduction
interventions, and the monitoring of impact therefore
requires disaggregated information. For years there have
been ongoing debates about how best to measure poverty.
Approaches range from consumption and income-based
metrics (which can be derived from household surveys
such as the LSMS) to health, education, and well-being
aspects (such as the Multidimensional Poverty Index
(MPI), which can be derived from household surveys
such as those conducted for the Demographic and Health
Surveys (DHS) Program).
The poverty layer on the web map was developed in
partnership with the Universities of Southampton and
Oxford using geolocated household survey data collected
cooperatively by the World Bank and national statistical
bureaus. These survey data are integrated into a spatial
statistical model to produce estimates at a 1 kilometer by
1 kilometer grid square with associated measures of
uncertainty. This is the basis of the “poverty layer”,
which the web tool drapes over a map to visually show – in a very simple manner – the complex statistical model
results.
The poverty layer enables spatial analysis in the form of estimation of the number of poor people living within, for
example, a five kilometer radial distance to a financial access point. Poverty is measured using household
expenditures, which are used as the primary indicator in estimating well-being. The expenditures are adjusted for
household size and family composition (number of adults and children), and are converted to dollar/day thresholds
to represent internationally-recognized poverty levels (e.g., persons living on $2/day or less). The resulting poverty
values are adjusted using country currency prices to reflect differences in purchasing power. The poverty map can
be combined with modeled estimates of population distribution (AfriPop/AsiaPop) to estimate the number of people
living in poverty at a 1 kilometer resolution.
Current Features of the Interactive Web Map
The web map is designed to allow users great flexibility in selecting the information they want to view on a map.
The interactive map clusters financial service locations over population, administrative boundaries, and wireless
coverage. A layer list provides a table of additional layers that can be displayed on the map. Another main element
of the MapsTool is an analysis toolbox that allows the user to analyze selected data. Lastly, the reporting panel
below the map provides overview statistics and analysis results based on selections and interactions by the user. In
addition to these main elements, a set of map tools is provided so users can navigate the map and swap basemaps
between a simple street map, aerial imagery only, and a hybrid of the two. A city/town name search on the map
allows a user to quickly navigate to a geographical place of interest.
Figure 1. Poverty estimation at 1km resolution.
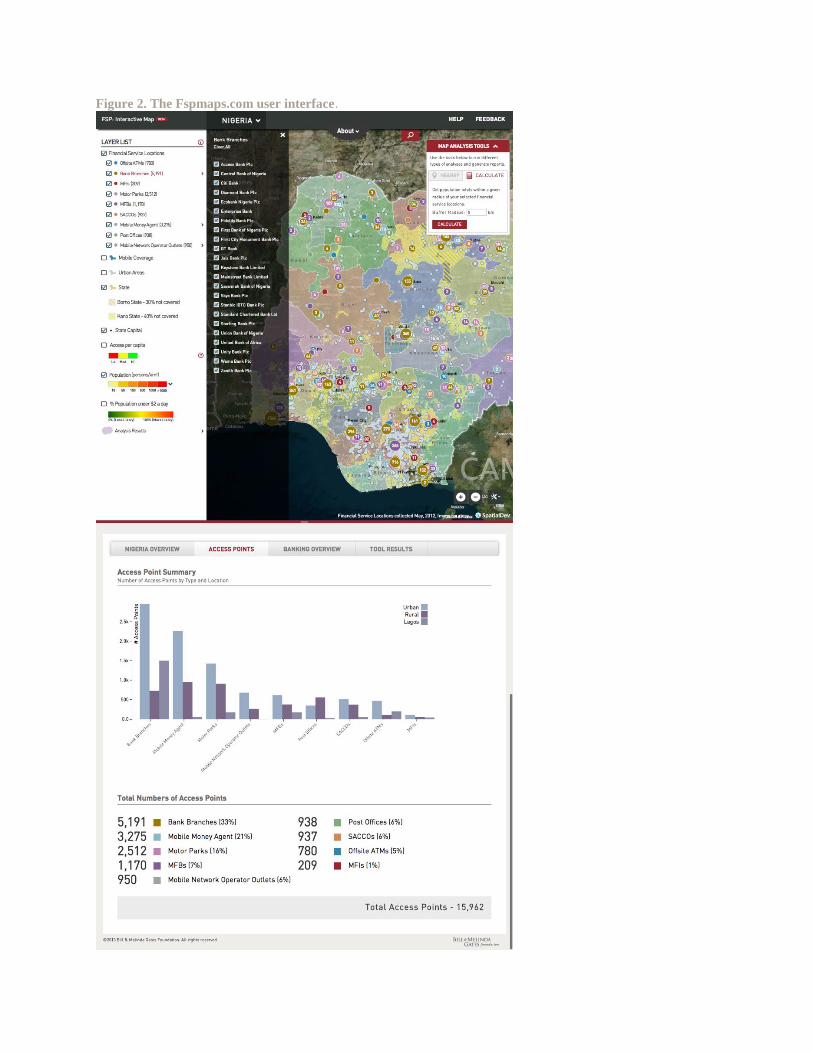
Figure 2. The Fspmaps.com user interface.
Analysis Toolbox
Currently, the analysis toolbox contains two tools: a location proximity query and a basic inclusion access
calculator.
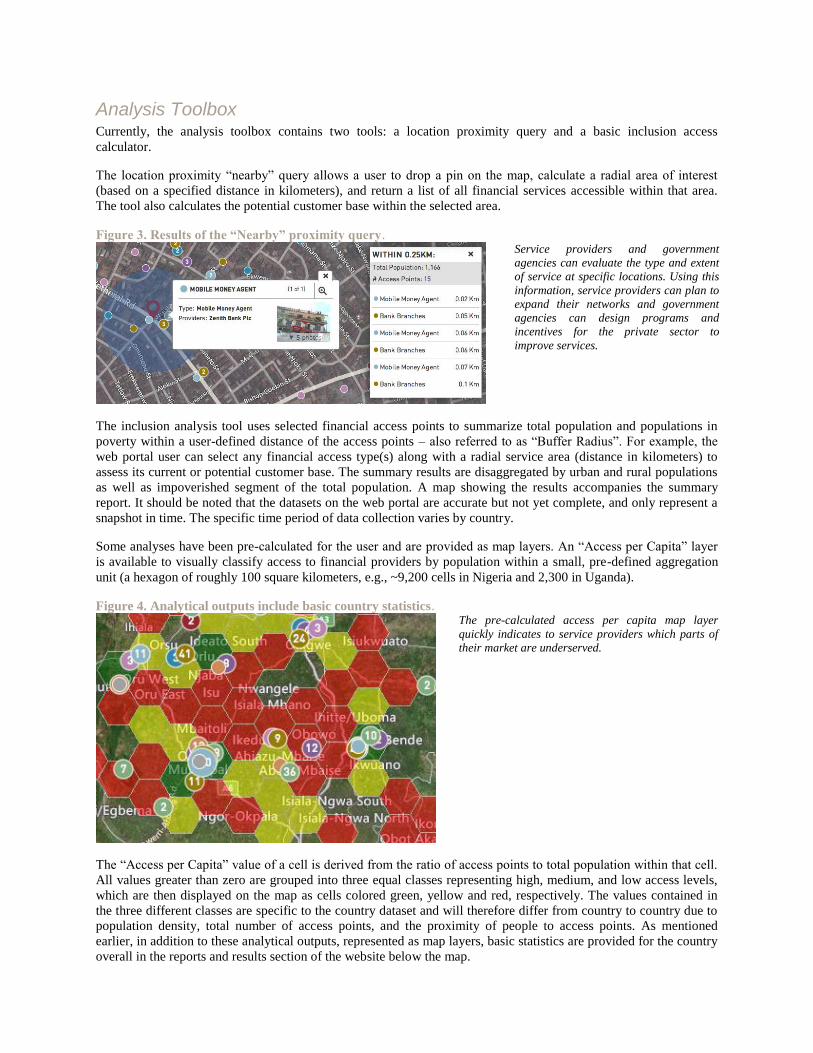
The location proximity “nearby” query allows a user to drop a pin on the map, calculate a radial area of interest
(based on a specified distance in kilometers), and return a list of all financial services accessible within that area.
The tool also calculates the potential customer base within the selected area.
Figure 3. Results of the “Nearby” proximity query.
Service providers and government
agencies can evaluate the type and extent
of service at specific locations. Using this
information, service providers can plan to
expand their networks and government
agencies can design programs and
incentives for the private sector to
improve services.
The inclusion analysis tool uses selected financial access points to summarize total population and populations in
poverty within a user-defined distance of the access points – also referred to as “Buffer Radius”. For example, the
web portal user can select any financial access type(s) along with a radial service area (distance in kilometers) to
assess its current or potential customer base. The summary results are disaggregated by urban and rural populations
as well as impoverished segment of the total population. A map showing the results accompanies the summary
report. It should be noted that the datasets on the web portal are accurate but not yet complete, and only represent a
snapshot in time. The specific time period of data collection varies by country.
Some analyses have been pre-calculated for the user and are provided as map layers. An “Access per Capita” layer
is available to visually classify access to financial providers by population within a small, pre-defined aggregation
unit (a hexagon of roughly 100 square kilometers, e.g., ~9,200 cells in Nigeria and 2,300 in Uganda).
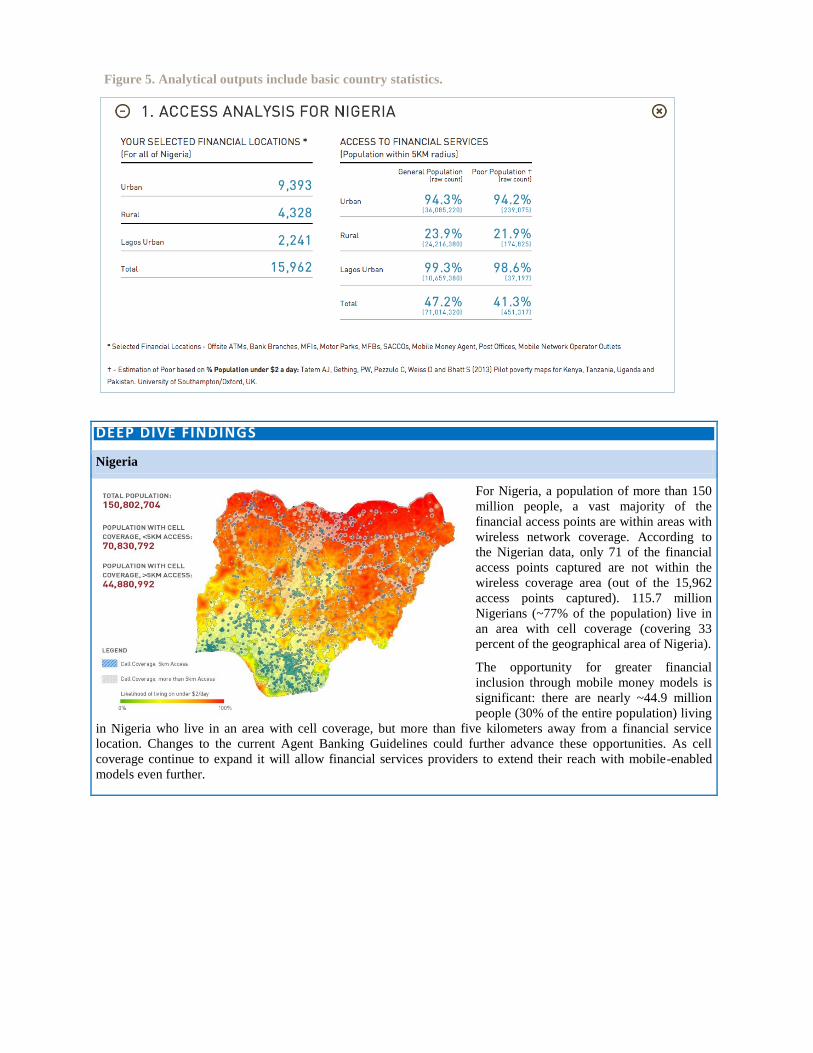
Figure 4. Analytical outputs include basic country statistics.
The pre-calculated access per capita map layer
quickly indicates to service providers which parts of
their market are underserved.
The “Access per Capita” value of a cell is derived from the ratio of access points to total population within that cell.
All values greater than zero are grouped into three equal classes representing high, medium, and low access levels,
which are then displayed on the map as cells colored green, yellow and red, respectively. The values contained in
the three different classes are specific to the country dataset and will therefore differ from country to country due to
population density, total number of access points, and the proximity of people to access points. As mentioned
earlier, in addition to these analytical outputs, represented as map layers, basic statistics are provided for the country
overall in the reports and results section of the website below the map.
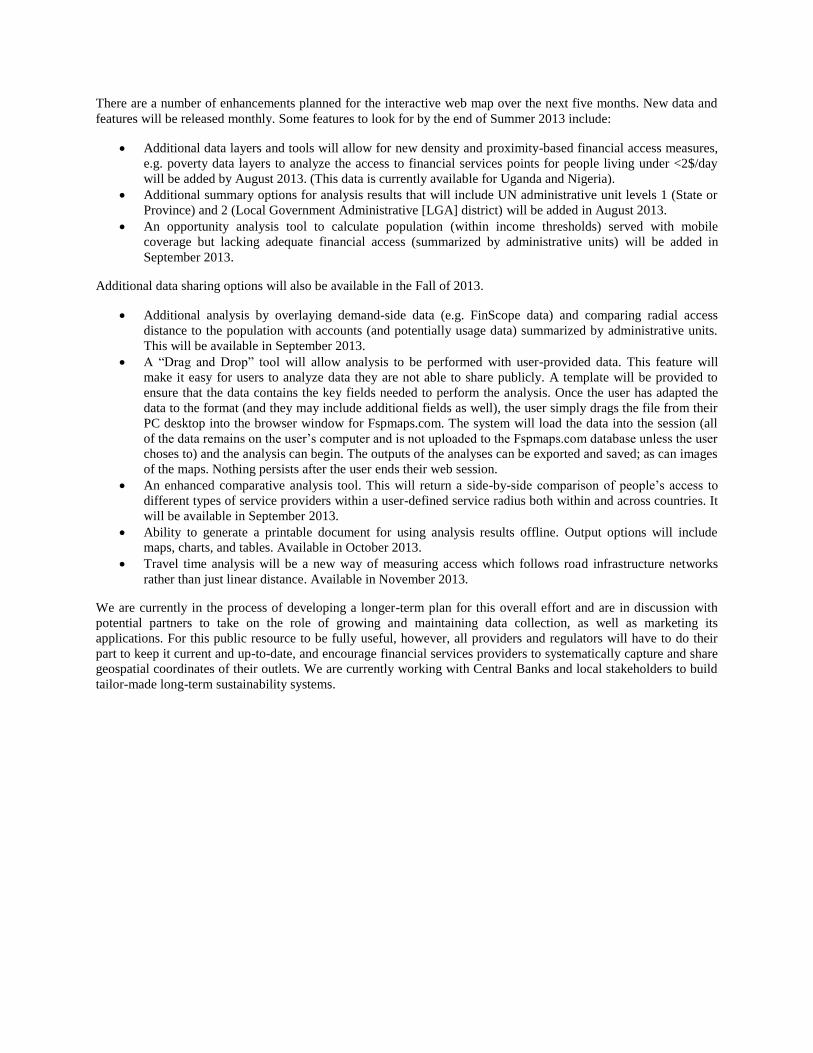
DEEP DIVE FINDINGS
Nigeria
For Nigeria, a population of more than 150
million people, a vast majority of the
financial access points are within areas with
wireless network coverage. According to
the Nigerian data, only 71 of the financial
access points captured are not within the
wireless coverage area (out of the 15,962
access points captured). 115.7 million
Nigerians (~77% of the population) live in
an area with cell coverage (covering 33
percent of the geographical area of Nigeria).
The opportunity for greater financial
inclusion through mobile money models is
significant: there are nearly ~44.9 million
people (30% of the entire population) living
in Nigeria who live in an area with cell coverage, but more than five kilometers away from a financial service
location. Changes to the current Agent Banking Guidelines could further advance these opportunities. As cell
coverage continue to expand it will allow financial services providers to extend their reach with mobile-enabled
models even further.
Figure 5. Analytical outputs include basic country statistics.

Future Analytical Features and Tools
The new proximity-based measures of financial inclusion enabled by FSP maps provide information much more
useful than any previous metrics for making investments aimed at increasing financial access. Going forward, as
more demographic data layers become available on the interactive web site (e.g. population age distribution or travel
time), service providers will have detailed information to help optimize access, liquidity management, credit
availability and product marketing.
DEEP DIVE FINDINGS
Uganda
In Uganda, 96% of the country’s
33 million people live in areas with
cell coverage. 18 million people
(~54 percent) of the entire
population have cell coverage but
live more than five kilometers
away from a financial access point.
An interesting finding is that 52%
of the mobile money agents are
located within 10 kilometers away
from their super-agents*. 20% are
within the range of 10-30
kilometers. And 27% are more than
30 kilometers from a super-agent.
As agents have to collect liquidity
from their super agents (usually bank branches) on a daily basis, truly penetrating into rural areas and improving on
financial access remains a challenge. Although it can be argued that mobile money agents are reaching more rural
areas, the majority of agents are located in close proximity to their super-agents. Going forward, and with
additional transaction level information, analysis could be made to compare the efficiency of individual agents in
relation to their super-agents.
* A super-agent is a business, sometimes a bank, which purchases electronic money from a Mobile Network Operator
wholesale and then resells it to agents, who in turn sell it to users. A person or business that purchases e-money from an MNO
wholesale and then resells it to agents, who in turn sell it to users. (Unlike a super-agent, master-agents are responsible for
managing the cash and electronic-value liquidity requirements of a particular group of agents). GSMA definition.
Figure 6. The evolution of the financial access geospatial application.
Prior efforts: Country-level statistics
Current: Fspmaps.com Future: Travel time analysis
There are a number of enhancements planned for the interactive web map over the next five months. New data and
features will be released monthly. Some features to look for by the end of Summer 2013 include:
Additional data layers and tools will allow for new density and proximity-based financial access measures,
e.g. poverty data layers to analyze the access to financial services points for people living under <2$/day
will be added by August 2013. (This data is currently available for Uganda and Nigeria).
Additional summary options for analysis results that will include UN administrative unit levels 1 (State or
Province) and 2 (Local Government Administrative [LGA] district) will be added in August 2013.
An opportunity analysis tool to calculate population (within income thresholds) served with mobile
coverage but lacking adequate financial access (summarized by administrative units) will be added in
September 2013.
Additional data sharing options will also be available in the Fall of 2013.
Additional analysis by overlaying demand-side data (e.g. FinScope data) and comparing radial access
distance to the population with accounts (and potentially usage data) summarized by administrative units.
This will be available in September 2013.
A “Drag and Drop” tool will allow analysis to be performed with user-provided data. This feature will
make it easy for users to analyze data they are not able to share publicly. A template will be provided to
ensure that the data contains the key fields needed to perform the analysis. Once the user has adapted the
data to the format (and they may include additional fields as well), the user simply drags the file from their
PC desktop into the browser window for Fspmaps.com. The system will load the data into the session (all
of the data remains on the user’s computer and is not uploaded to the Fspmaps.com database unless the user
choses to) and the analysis can begin. The outputs of the analyses can be exported and saved; as can images
of the maps. Nothing persists after the user ends their web session.
An enhanced comparative analysis tool. This will return a side-by-side comparison of people’s access to
different types of service providers within a user-defined service radius both within and across countries. It
will be available in September 2013.
Ability to generate a printable document for using analysis results offline. Output options will include
maps, charts, and tables. Available in October 2013.
Travel time analysis will be a new way of measuring access which follows road infrastructure networks
rather than just linear distance. Available in November 2013.
We are currently in the process of developing a longer-term plan for this overall effort and are in discussion with
potential partners to take on the role of growing and maintaining data collection, as well as marketing its
applications. For this public resource to be fully useful, however, all providers and regulators will have to do their
part to keep it current and up-to-date, and encourage financial services providers to systematically capture and share
geospatial coordinates of their outlets. We are currently working with Central Banks and local stakeholders to build
tailor-made long-term sustainability systems.

INDUSTRY LAUNCH IN NIGERIA The Event
The Nigerian data portrayed on Fspmaps.com was
launched at an industry stakeholder event in Lagos
on July 8, 2013. The event was co-hosted by the
Central Bank of Nigeria (CBN) and the Bill &
Melinda Gates Foundation. Governor Sanusi Lamido
Sanusi provided the keynote speech and expressed
great enthusiasm with regards to the web portal. He
underscored how the data and analysis tools will
support the government in tracking progress against
the National Financial Inclusion Strategy and make
evidence-based decisions.
In all, 80 individuals representing 40 different
institutions participated in the launch event. These
institutions covered the sector broadly and included
the CBN, Commercial Banks, Micro Finance Banks,
Mobile Money Operations, Mobile Network
Operators, Development Agencies and Enhancing
Financial Innovation and Access (EFInA), which
supports financial sector deepening in Nigeria.
Use Cases Discussed
Support to the CBN in validating their existing data and
measuring the progress of the spatial expansion of
financial access over time. With proximity-based
information, financial access variations between
population density and administrative levels will become
clear.
Baseline and trend analysis to mark progress towards
channel and product targets under the National Financial
Inclusion Strategy and against the Maya declaration
commitments. The commitments are to reduce the
percentage of adult Nigerians that are excluded from
financial services from the current 46.3% to 20% by
2020 (demand-side data - EFInA Access to Financial
Services in Nigeria 2012 Survey). Furthermore, the data
can be used to measure progress relative to other
countries.
Inform digital payment streams of civil service staff to
ensure on-time payment and incentivize performance,
thereby measuring effectiveness of other government
agencies’ efforts.
Help providers make business decisions for expanding
their distribution channels, particularly in rural areas.
Invitation to Participate
The FSP interactive web map offers a platform to visualize and analyze accessibility for those working to expand
financial inclusion. Fspmaps.com is now open as a public beta and all are encouraged to visit the site, explore the
data, do some analysis, and leave feedback on issues and ideas. Beyond simply using the site and its current content,
those interested can add their financial service access point data to the database to help others who are working in
financial services. Service providers who upload their data will immediately have service area maps, a branch finder
service for their customers, and be able to pursue any number of applications for customer targeting and market
analysis. There is also a how-to manual available on the web site for institutions who want to build in-house
analytical geo-spatial capabilities. The picture of mobile financial services access changes at a rapid speed. For
optimized use of the tool, it is important that regulators and financial service providers systematically and frequently
capture latitude and longitude coordinates of access points to ensure meaningful analysis.
The long-term vision of Fspmaps.com goes well beyond serving as a MapsTool to the financial inclusion field. It
holds great potential to be expanded and linked to improve management information systems of ministerial entities
and local governance. Furthermore, the MapsTool can become useful for donors and commercial players including
those involved in agriculture, health and financial services, mobile telephone services as well as fast moving
consumer good companies. Access barriers are faced by poor people in many ways - in health clinics, disease
distribution, vaccine delivery, electricity, warehouses, market squares, agro-dealers and more. Overlaying geo-
spatial data-sets to improve information in an easy, transparent, and digestible way across many sectors holds great
potential of truly assessing underserved areas. By using the MapsTool, these players can better invest (government,
commercial and donor funds) in effectively reaching their desired populations and markets.
While only recently released as a beta version, the interactive web map is already expanding its reach through new
partners and is used in ways not previously envisaged. A number of Central Banks are interested in sharing their
geo-spatially referenced data through the web portal to increase transparency and enable the industry to access the
types of analytical tools and datasets that can help them effectively partner in expanding access to services. Beyond
the financial sector, access point data for western Uganda from Fspmaps.com was used by the Red Cross to identify

pathways for distributing money digitally to flood victims. These examples provide great testimony to the value of
financial access mapping. And we are just getting started!
How to Provide Feedback
You can provide your input to the priority and sequence of these features, and submit ideas for new data and features
through the feedback form on http://Fspmaps.com.
Acknowledgements
Many have contributed to conceive and develop the outputs for this project. Several members of the FSP team have
made important contributions to this work. Karthik Balasubramanian originated the idea through his vision to
change the way industry measures financial access to proximity-based measurement. Mireya Almazan conducted
analytical work on implementing the Bill & Melinda Gates Foundation’s geospatial investments. Brand Fusion
collected access point data in Tanzania, Uganda, Nigeria, Kenya, and Bangladesh. Southampton (Andy Tatem) and
Oxford University (Peter Gething) have developed the gridded poverty surfaces. Spatial Development brought it all
together into a database, conducted much of the baseline statistical analyses, and developed the web portal.
Guided by the belief that every life has equal value, the Bill & Melinda Gates Foundation works to help all people lead healthy, productive lives. In developing
countries, it focuses on improving people’s health and giving them the chance to lift themselves out of hunger and extreme poverty. In the United States, it seeks
to ensure that all people—especially those with the fewest resources—have access to the opportunities they need to succeed in school and life. Based in Seattle,
Washington, the foundation is led by CEO Jeff Raikes and Co-chair William H. Gates Sr., under the direction of Bill and Melinda Gates and Warren Buffett.
For additional information on the Bill & Melinda Gates Foundation, please visit our website: www.gatesfoundation.org.
© 2013 Bill & Melinda Gates Foundation. All Rights Reserved. Bill & Melinda Gates Foundation is a registered trademark in the United States and other countries.