the preparation and identification of a monoclonal ... · isotyping and chromosome analysis of...
TRANSCRIPT
toxins
Article
The Preparation and Identification of a MonoclonalAntibody against Citrinin and the Development ofDetection via Indirect Competitive ELISA
Shimuye Kalayu Yirga, Sumei Ling, Yanling Yang, Jun Yuan and Shihua Wang *
Fujian Key Laboratory of Pathogenic Fungi and Mycotoxins, Key Laboratory of Biopesticide and ChemicalBiology of The Education Minister, School of Life Science, Fujian Agriculture And Forestry University,Fuzhou 35002, China; [email protected] (S.K.Y.); [email protected] (S.L.); [email protected] (Y.Y.);[email protected] (J.Y.)* Correspondence: [email protected]; Tel./Fax: +85-591-8798-4471
Academic Editor: Laura AnfossiReceived: 8 December 2016; Accepted: 13 March 2017; Published: 17 March 2017
Abstract: Citrinin (CTN) is a hepato-nephrotoxic mycotoxin produced by fungi genera of Aspergillus,Monauscus, and Penicillium. CTN contaminates grains, fruits, juices and vegetables, and causes varioustoxic effects to humans and animals. It has small molecular weight, which is non-immunogenicto animals. Thus, CTN was conjugated to bovine serum albumin (BSA) and ovalbumin (OVA),respectively, by amide bonds using 1-ethyl-3-(3-dimethylaminopropyl) carbodiimide hydrochloride(EDC) and N-hydroxysuccinimide (NHS). Mice were immunized with CTN-BSA conjugates,and spleen cells of the immunized mice were fused with Sp2/0 myeloma cells to obtain 21H27hybriodoma cell. Ascitic fluid of hybridoma cell was produced in mice abdomen, and purifiedusing caprylic/ammonium sulfate precipitation method. The 21H27 anti-CTN mcAb was the IgG2aantibody subclass, and cross-reactivity results indicated that anti-CTN mcAb is specific to CTNwith high affinity (2.0 × 10⁸ L/mol). Indirect competitive ELISA (ic-ELISA) results showed that thelinear range of detection was 0.01–5.96 ng/mL and the IC50 was 0.28 ng/mL with a lower detectionlimit (LOD) of 0.01 ng/mL. The average recovery was 93.8% ± 1.6% with a coefficient variation of1.0%–4.3%. Hence, anti-CTN mcAb secreted by 21H27 hybridoma cell was successfully producedand can be used to detect CTN contaminated feed and foodstuffs.
Keywords: citrinin; conjugation; cell fusion; monoclonal antibody; ic-ELISA
1. Introduction
Mycotoxins are poisonous chemical compounds produced by fungi which contaminate humanfood and animal feeds [1]. Citrinin (CTN) (Figure 1) has a molecular formula of C13H14O5 and isone of the oldest mycotoxins originally isolated from the secondary metabolites of Penicillium citrinumin 1931 [2]. However, later studies revealed that citrinin can be produced by a variety of fungi,such as Monascus [3] and Penicillium chrysogenum [4]. A recent study indicated that high amountof citrinin have been found in Aspergillus niger fungal species [5]. CTN is a hepato-nephrotoxicmycotoxin commonly occurring in stored grains, beans [6], fruits, juices and vegetables [7]. Researchundertaken using a spectroscopy method revealed that Penicillium expansum isolated from meat andapples can produce both patulin and citrinin [8]. CTN contamination from major cropping areasin Tunisia had 50% positive wheat samples with an average of 28 µg/kg [9]. CTN contaminantswere also reported in tomato juice [10]. The two toxigenic strains of P. citrinum and P. expansumwere able to produce citrinin in cheese at 20 ◦C, and up to 600 mg of citrinin per kg of cheesewas obtained after 10 d of incubation [11]. Many studies have shown that the Monascus species
Toxins 2017, 9, 110; doi:10.3390/toxins9030110 www.mdpi.com/journal/toxins
Toxins 2017, 9, 110 2 of 12
produce commercially viable metabolites, including food colorants, cholesterol-lowering agents, andantibiotics [12], and the natural occurrence of citrinin in traditional Chinese food such as red yeast ricehas also been investigated [13–15].
Toxins 2017, 9, 110 2 of 12
natural occurrence of citrinin in traditional Chinese food such as red yeast rice has also been
investigated [13–15].
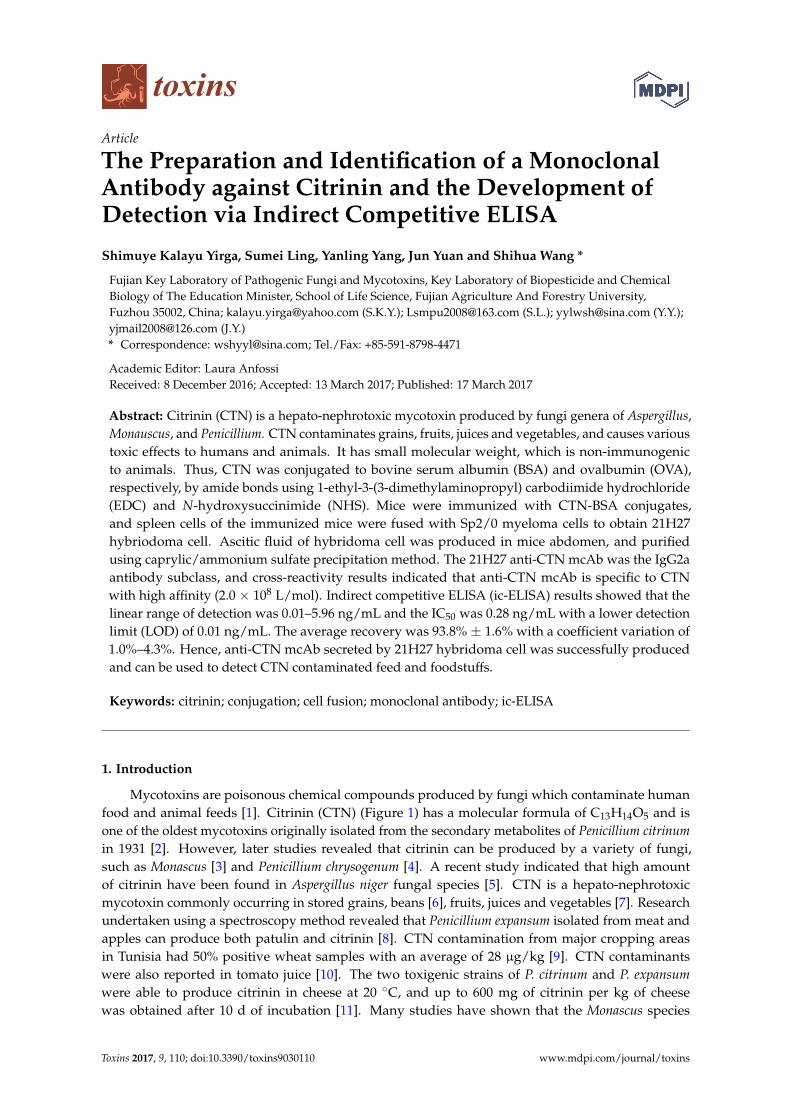
Figure 1.The structure of citrinin (CTN) [16].
The harmful targets of CTN include the kidney [17], spleen, liver and bone marrow [18], and the
cytotoxic effects of citrinin on humans has already been studied. The incubation of embryonic kidney
cells (HEK293) with pure CTN at a concentration of 60 μM for 72 h caused 50% of cell death when
compared to the control cells [19]. Furthermore, a genotoxicity study of CTN showed a significant
concentration‐dependent increase in micronucleus (MN) frequency in human lymphocytes [20]. CTN
has also been proven to have adverse effects on the reproductive system of adult male mice [21], as
well as identified as a teratogenic mycotoxin in female Wistar rats [22]. According to an International
Agency for Research on Cancer (IARC) report, the carcinogenicity of CTN has no clear scientific
evidence, thus, CTN is classified as a Group 3 carcinogen and its toxicity mechanism remains
unknown [23]. This implies that prevention and control of CTN contaminants are very important for
safety and security reasons.
The most commonly used analytical methods for CTN detection are thin layer chromatography
(TLC) [24], high‐performance liquid chromatography (HPLC) [25], liquid chromatography tandem
mass spectrometry (LC‐MS/MS) [26], ultra‐high‐performance liquid chromatography and
fluorescence detection (UHPLC‐FL) [27], gas‐chromatography‐selected ion monitoring (SIM) mass
spectrometry (GC‐MS) [28], and an enzyme immunoassay [29]. The advantages of instrument‐based
methods are their sensitivity and use in simultaneous analysis of multiple mycotoxins; however,
there are many disadvantages including the necessity of using complex equipment, incompatibility
with real samples, the cost, and amount of time required [30]. The detection of mycotoxins based on
monoclonal antibodies is rapid, specific, and sensitive, uses simple equipment, has a low cost, and is
compatible with real samples. Furthermore, detection based on monoclonal antibodies through
enzyme‐linked immunosorbent assay has a low inhibitory concentration at a short period. Indirect
competitive ELISA (ic‐ELISA) is widely applicable and is an effective assay for the detection of
mycotoxins using monoclonal antibodies. Therefore, this study was designed to produce monoclonal
antibodies against CTN and to detect the presence of CTN using an indirect competitive enzyme
linked immunosorbent (ic‐ELISA) assay.
2. Results
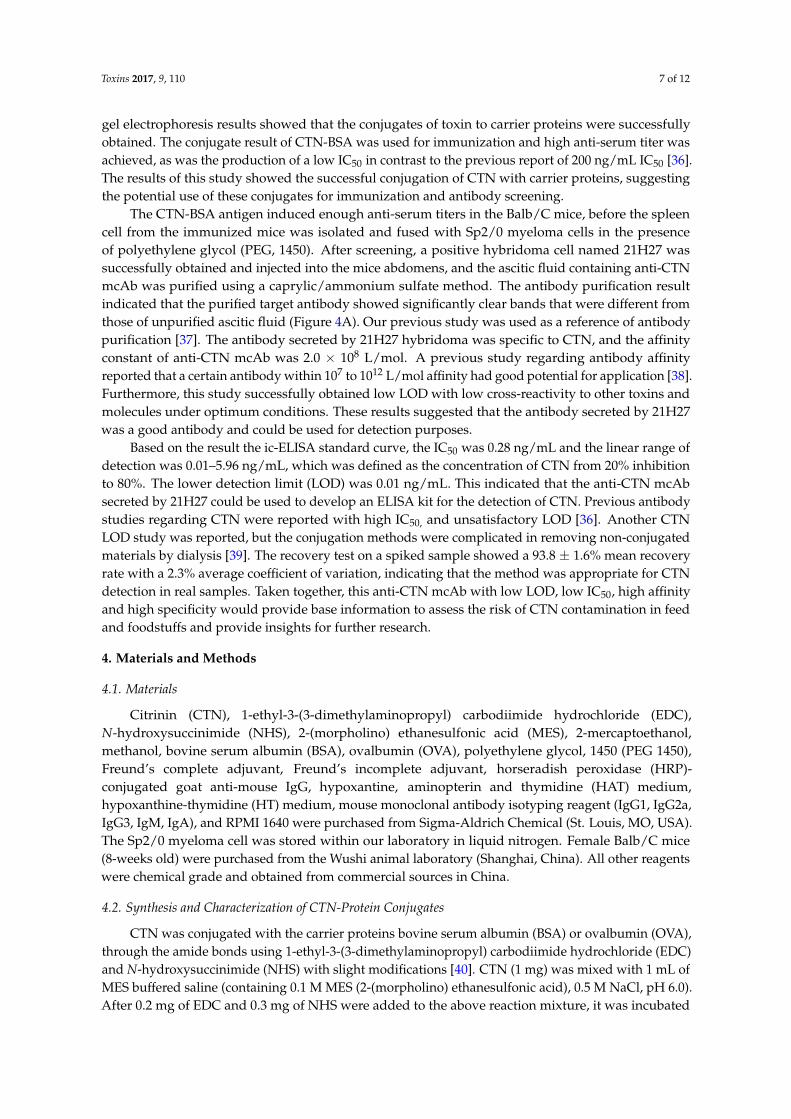
2.1. Synthesis and Identification of CTN‐Protein Conjugates
Citrinin is a small non‐immunogenic toxin with a molecular weight of 250.25, so it is necessary
to conjugate it with carrier proteins for an immuno‐response to generate antibodies. In this study,
CTN was conjugated to the carrier protein bovine serum albumin (BSA) and ovalbumin (OVA)
respectively, through the amide bonds using 1‐ethyl‐3‐(3‐dimethylaminopropyl) carbodiimide
hydrochloride (EDC) and N‐hydroxysuccinimide (NHS). Non‐denaturing agarose gel
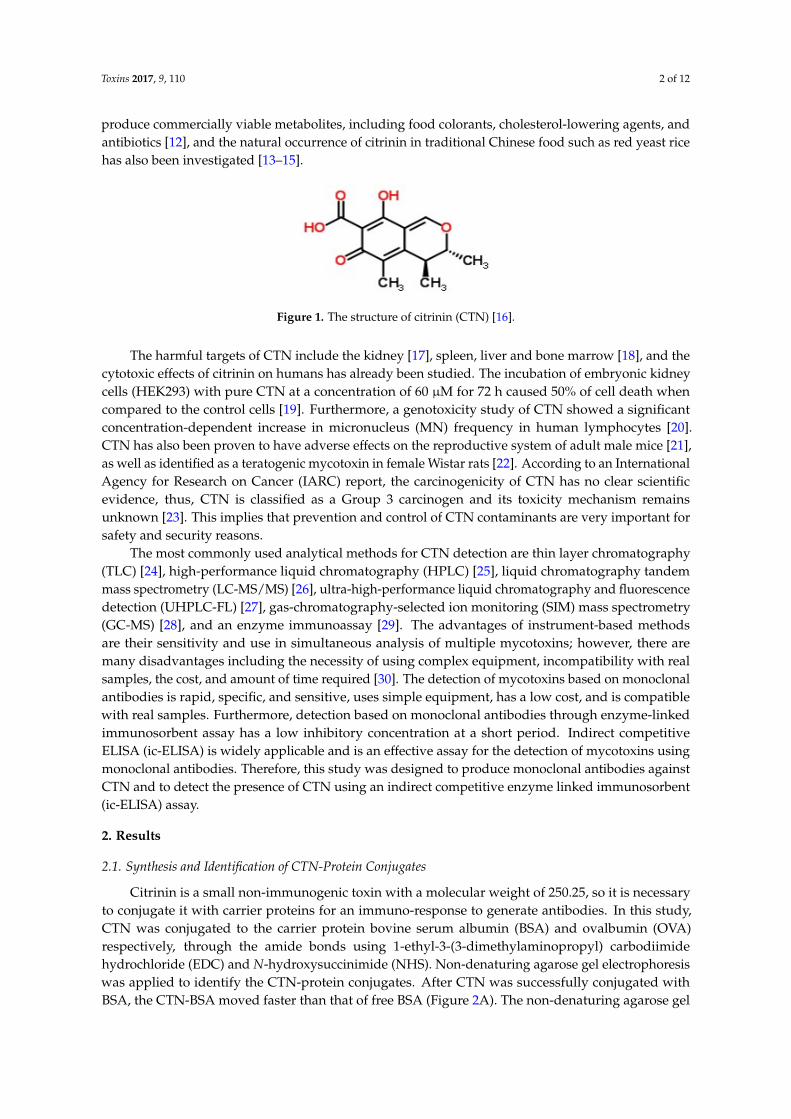
electrophoresis was applied to identify the CTN‐protein conjugates. After CTN was successfully
conjugated with BSA, the CTN‐BSA moved faster than that of free BSA (Figure 2A). The non‐
Figure 1. The structure of citrinin (CTN) [16].
The harmful targets of CTN include the kidney [17], spleen, liver and bone marrow [18], and thecytotoxic effects of citrinin on humans has already been studied. The incubation of embryonic kidneycells (HEK293) with pure CTN at a concentration of 60 µM for 72 h caused 50% of cell death whencompared to the control cells [19]. Furthermore, a genotoxicity study of CTN showed a significantconcentration-dependent increase in micronucleus (MN) frequency in human lymphocytes [20].CTN has also been proven to have adverse effects on the reproductive system of adult male mice [21],as well as identified as a teratogenic mycotoxin in female Wistar rats [22]. According to an InternationalAgency for Research on Cancer (IARC) report, the carcinogenicity of CTN has no clear scientificevidence, thus, CTN is classified as a Group 3 carcinogen and its toxicity mechanism remainsunknown [23]. This implies that prevention and control of CTN contaminants are very important forsafety and security reasons.
The most commonly used analytical methods for CTN detection are thin layer chromatography(TLC) [24], high-performance liquid chromatography (HPLC) [25], liquid chromatography tandemmass spectrometry (LC-MS/MS) [26], ultra-high-performance liquid chromatography and fluorescencedetection (UHPLC-FL) [27], gas-chromatography-selected ion monitoring (SIM) mass spectrometry(GC-MS) [28], and an enzyme immunoassay [29]. The advantages of instrument-based methodsare their sensitivity and use in simultaneous analysis of multiple mycotoxins; however, there aremany disadvantages including the necessity of using complex equipment, incompatibility with realsamples, the cost, and amount of time required [30]. The detection of mycotoxins based on monoclonalantibodies is rapid, specific, and sensitive, uses simple equipment, has a low cost, and is compatiblewith real samples. Furthermore, detection based on monoclonal antibodies through enzyme-linkedimmunosorbent assay has a low inhibitory concentration at a short period. Indirect competitiveELISA (ic-ELISA) is widely applicable and is an effective assay for the detection of mycotoxins usingmonoclonal antibodies. Therefore, this study was designed to produce monoclonal antibodies againstCTN and to detect the presence of CTN using an indirect competitive enzyme linked immunosorbent(ic-ELISA) assay.
2. Results
2.1. Synthesis and Identification of CTN-Protein Conjugates
Citrinin is a small non-immunogenic toxin with a molecular weight of 250.25, so it is necessaryto conjugate it with carrier proteins for an immuno-response to generate antibodies. In this study,CTN was conjugated to the carrier protein bovine serum albumin (BSA) and ovalbumin (OVA)respectively, through the amide bonds using 1-ethyl-3-(3-dimethylaminopropyl) carbodiimidehydrochloride (EDC) and N-hydroxysuccinimide (NHS). Non-denaturing agarose gel electrophoresiswas applied to identify the CTN-protein conjugates. After CTN was successfully conjugated withBSA, the CTN-BSA moved faster than that of free BSA (Figure 2A). The non-denaturing agarose gel
Toxins 2017, 9, 110 3 of 12
electrophoresis (Figure 2B) also showed that the migration velocity of the CTN-OVA conjugate wasfaster than that of free OVA.
Toxins 2017, 9, 110 3 of 12
denaturing agarose gel electrophoresis (Figure 2B) also showed that the migration velocity of the
CTN‐OVA conjugate was faster than that of free OVA.
Figure 2. Analysis of the CTN‐protein conjugates. (A) Non‐denaturing agarose gel electrophoresis.
Lane 1 and 2, CTN‐BSA conjugates. Lane 3, BSA. (B) Non‐denaturing agarose gel electrophoresis.
Lane 1, OVA. Lane 2, CTN‐OVA conjugates. BSA: bovine serum albumin; OVA: ovalbumin.
2.2. Anti‐Serum ELISA Assay of the Immunized Mice
A bicinchoninic acid (BCA) assay was carried out to determine the concentration of CTN‐protein
conjugates, and the results indicated that the concentrations of conjugated CTN‐BSA and CTN‐OVA
were 0.81 and 0.19 mg/mL respectively. Female Balb/C mice were immunized with CTN‐BSA
conjugates at intervals of 2 weeks. According to the indirect non‐competitive ELISA assay, the CTN‐
BSA immunized mice showed a high anti‐serum titer (1:32,000 v/v) when compared to the non‐
immunized control mice, indicating that the CTN‐BSA conjugates had successfully induced an
immuno‐response. Therefore, this study used conjugate CTN‐BSA for the immuno‐antigen, while
conjugate CTN‐OVA was used as the coating‐antigen.
2.3. Cell Fusion and Screening of Hybridoma Cells
The mouse which had a high anti‐serum titer was chosen for spleen cell isolation, and the cell
fusion was carried out at a ratio of 1:10 B cells from the spleen with Sp2/0 myeloma cells by adding
polyethylene glycol (PEG, 1450) drop by drop [31]. Based on our previous cell fusion experience,
three fully well grown cell culture dishes of Sp2/0 myeloma cells were fused with spleen cells from
one immunized mouse. The hybridoma cells were cultured with aminopterin and a thymidine (HAT)
supplementary medium in the presence of feeder cells with 5% CO2 at 37 °C and the HAT medium
was replaced with hypoxanthine‐thymidine (HT) medium 7 d later. Only fused cells grew in HAT
medium, and the hybridoma cells increased significantly in number. After growing the fused cells
for 10 d, the supernatant titer was determined by indirect non‐competitive ELISA using CTN‐OVA
conjugates as the coating‐antigen. Positive clones were transferred to 48‐well plates for growth and
were subsequently sub‐cloned several times until a single positive clone was obtained. Finally, six
positive hybridoma cells of interest were screened out and named as 7F2, 5C5, 6B5, 10D3, 21H27 and
12D16 respectively. Cell fusions were successfully performed with an average fusion rate of 99.56%
and an average positive rate of 4.5%. The hybridoma cell line 21H27, which stably secreted
monoclonal antibodies against CTN, was chosen for further research.
2.4. Isotyping and Chromosome Analysis of Anti‐CTN mcAb
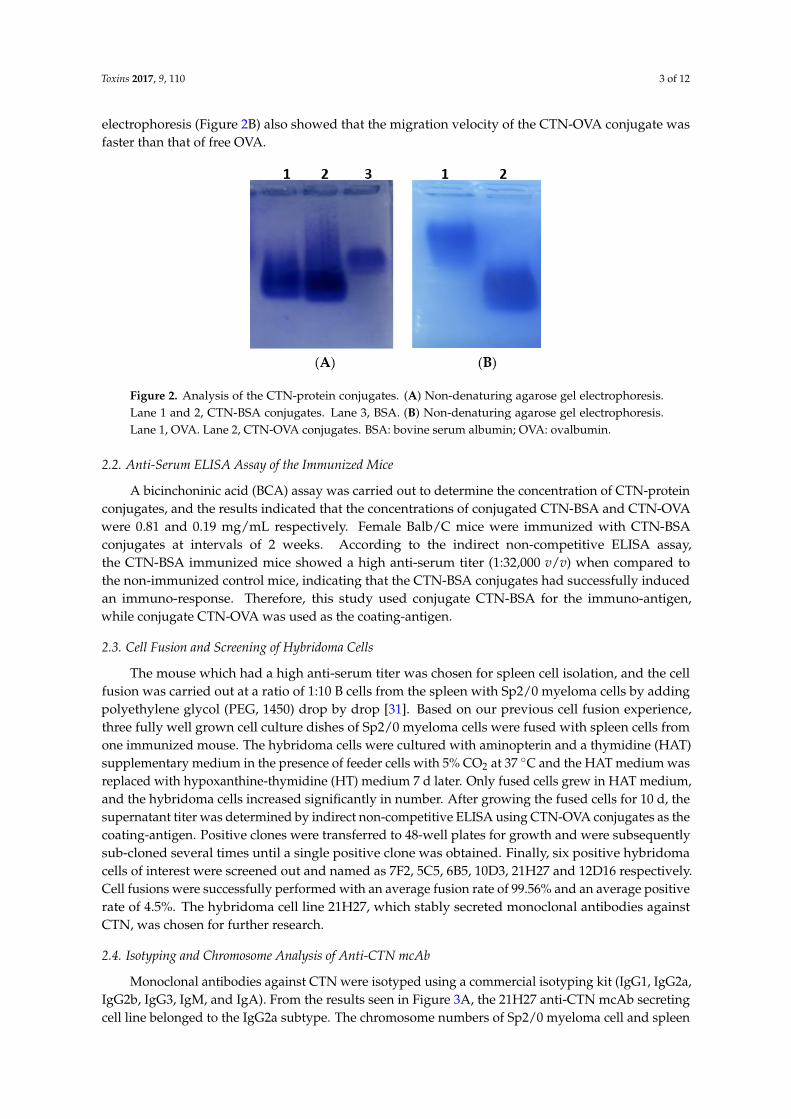
Monoclonal antibodies against CTN were isotyped using a commercial isotyping kit (IgG1,
IgG2a, IgG2b, IgG3, IgM, and IgA). From the results seen in Figure 3A, the 21H27 anti‐CTN mcAb
secreting cell line belonged to the IgG2a subtype. The chromosome numbers of Sp2/0 myeloma cell
Figure 2. Analysis of the CTN-protein conjugates. (A) Non-denaturing agarose gel electrophoresis.Lane 1 and 2, CTN-BSA conjugates. Lane 3, BSA. (B) Non-denaturing agarose gel electrophoresis.Lane 1, OVA. Lane 2, CTN-OVA conjugates. BSA: bovine serum albumin; OVA: ovalbumin.
2.2. Anti-Serum ELISA Assay of the Immunized Mice
A bicinchoninic acid (BCA) assay was carried out to determine the concentration of CTN-proteinconjugates, and the results indicated that the concentrations of conjugated CTN-BSA and CTN-OVAwere 0.81 and 0.19 mg/mL respectively. Female Balb/C mice were immunized with CTN-BSAconjugates at intervals of 2 weeks. According to the indirect non-competitive ELISA assay,the CTN-BSA immunized mice showed a high anti-serum titer (1:32,000 v/v) when compared tothe non-immunized control mice, indicating that the CTN-BSA conjugates had successfully inducedan immuno-response. Therefore, this study used conjugate CTN-BSA for the immuno-antigen,while conjugate CTN-OVA was used as the coating-antigen.
2.3. Cell Fusion and Screening of Hybridoma Cells
The mouse which had a high anti-serum titer was chosen for spleen cell isolation, and the cellfusion was carried out at a ratio of 1:10 B cells from the spleen with Sp2/0 myeloma cells by addingpolyethylene glycol (PEG, 1450) drop by drop [31]. Based on our previous cell fusion experience,three fully well grown cell culture dishes of Sp2/0 myeloma cells were fused with spleen cells fromone immunized mouse. The hybridoma cells were cultured with aminopterin and a thymidine (HAT)supplementary medium in the presence of feeder cells with 5% CO2 at 37 ◦C and the HAT medium wasreplaced with hypoxanthine-thymidine (HT) medium 7 d later. Only fused cells grew in HAT medium,and the hybridoma cells increased significantly in number. After growing the fused cells for 10 d, thesupernatant titer was determined by indirect non-competitive ELISA using CTN-OVA conjugates as thecoating-antigen. Positive clones were transferred to 48-well plates for growth and were subsequentlysub-cloned several times until a single positive clone was obtained. Finally, six positive hybridomacells of interest were screened out and named as 7F2, 5C5, 6B5, 10D3, 21H27 and 12D16 respectively.Cell fusions were successfully performed with an average fusion rate of 99.56% and an average positiverate of 4.5%. The hybridoma cell line 21H27, which stably secreted monoclonal antibodies againstCTN, was chosen for further research.
2.4. Isotyping and Chromosome Analysis of Anti-CTN mcAb
Monoclonal antibodies against CTN were isotyped using a commercial isotyping kit (IgG1, IgG2a,IgG2b, IgG3, IgM, and IgA). From the results seen in Figure 3A, the 21H27 anti-CTN mcAb secretingcell line belonged to the IgG2a subtype. The chromosome numbers of Sp2/0 myeloma cell and spleen
Toxins 2017, 9, 110 4 of 12
cell were 39 ± 1 and 66 ± 4 respectively [32], and the chromosome numbers of hybridoma cell 21H27were 102 ± 4 (Figure 3B) among the replicates of the experiments. The chromosome number resultrevealed that positive clone 21H27 was the hybridoma cell produced from the fusion of the spleen celland the Sp2/0 myeloma cell.
Toxins 2017, 9, 110 4 of 12
and spleen cell were 39 ± 1 and 66 ± 4 respectively [32], and the chromosome numbers of hybridoma
cell 21H27 were 102 ± 4 (Figure 3B) among the replicates of the experiments. The chromosome
number result revealed that positive clone 21H27 was the hybridoma cell produced from the fusion
of the spleen cell and the Sp2/0 myeloma cell.
(A) (B)
Figure 3. Isotyping and chromosome analysis of anti‐CTN mcAb. (A) Isotyping of 21H27 cell stably
secreting anti‐CTN mcAb by using an isotyping kit. (B) Chromosome analysis of 21H27 hybridoma
cell.
2.5. Purification of Anti‐CTN mcAb
The positive hybridoma 21H27 cell line, which stably secreted anti‐CTN mcAb was injected into
the pristane pre‐treated mice abdomens, and the ascites containing monoclonal antibodies against
CTN were produced in the mice abdomen after 8 d of injections. The ascites were withdrawn with a
syringe and the monoclonal antibody was purified using the caprylic/ammonium sulfate purification
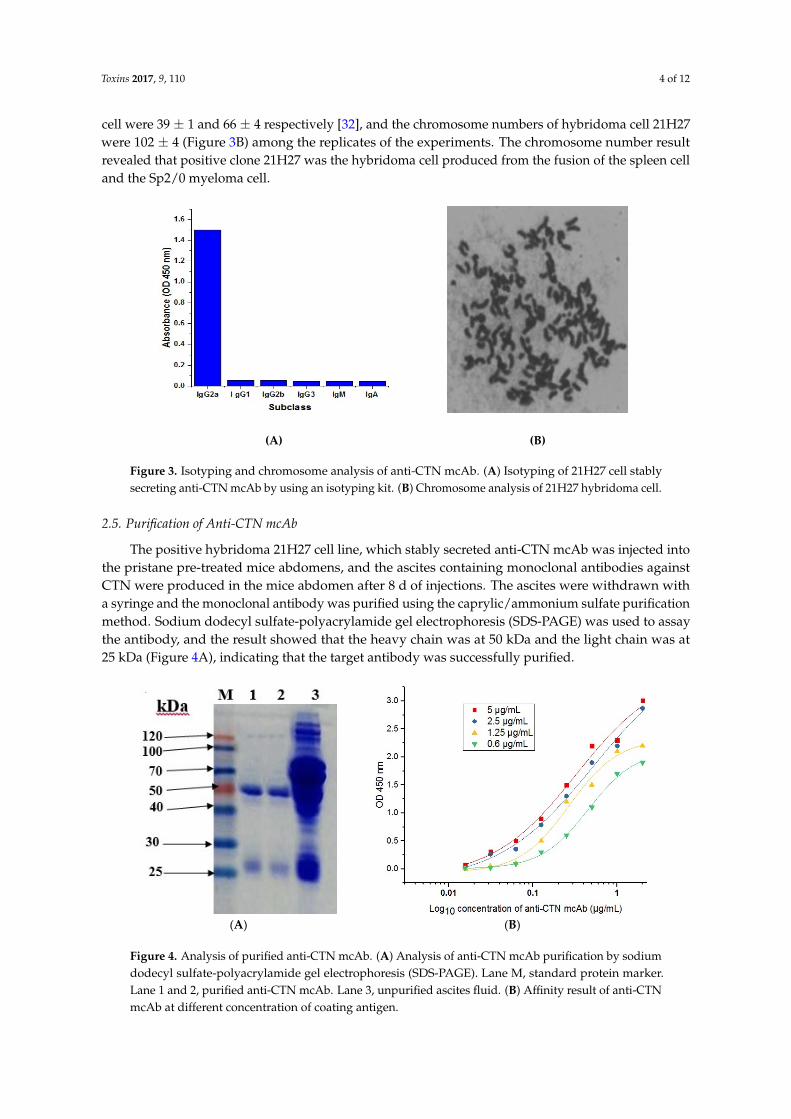
method. Sodium dodecyl sulfate‐polyacrylamide gel electrophoresis (SDS‐PAGE) was used to
assay the antibody, and the result showed that the heavy chain was at 50 kDa and the light chain was
at 25 kDa (Figure 4A), indicating that the target antibody was successfully purified.
(A) (B)
Figure 4. Analysis of purified anti‐CTN mcAb. (A) Analysis of anti‐CTN mcAb purification by
sodium dodecyl sulfate‐polyacrylamide gel electrophoresis (SDS‐PAGE). Lane M, standard protein
Figure 3. Isotyping and chromosome analysis of anti-CTN mcAb. (A) Isotyping of 21H27 cell stablysecreting anti-CTN mcAb by using an isotyping kit. (B) Chromosome analysis of 21H27 hybridoma cell.
2.5. Purification of Anti-CTN mcAb
The positive hybridoma 21H27 cell line, which stably secreted anti-CTN mcAb was injected intothe pristane pre-treated mice abdomens, and the ascites containing monoclonal antibodies againstCTN were produced in the mice abdomen after 8 d of injections. The ascites were withdrawn witha syringe and the monoclonal antibody was purified using the caprylic/ammonium sulfate purificationmethod. Sodium dodecyl sulfate-polyacrylamide gel electrophoresis (SDS-PAGE) was used to assaythe antibody, and the result showed that the heavy chain was at 50 kDa and the light chain was at25 kDa (Figure 4A), indicating that the target antibody was successfully purified.
Toxins 2017, 9, 110 4 of 12
and spleen cell were 39 ± 1 and 66 ± 4 respectively [32], and the chromosome numbers of hybridoma
cell 21H27 were 102 ± 4 (Figure 3B) among the replicates of the experiments. The chromosome
number result revealed that positive clone 21H27 was the hybridoma cell produced from the fusion
of the spleen cell and the Sp2/0 myeloma cell.
(A) (B)
Figure 3. Isotyping and chromosome analysis of anti‐CTN mcAb. (A) Isotyping of 21H27 cell stably
secreting anti‐CTN mcAb by using an isotyping kit. (B) Chromosome analysis of 21H27 hybridoma
cell.
2.5. Purification of Anti‐CTN mcAb
The positive hybridoma 21H27 cell line, which stably secreted anti‐CTN mcAb was injected into
the pristane pre‐treated mice abdomens, and the ascites containing monoclonal antibodies against
CTN were produced in the mice abdomen after 8 d of injections. The ascites were withdrawn with a
syringe and the monoclonal antibody was purified using the caprylic/ammonium sulfate purification
method. Sodium dodecyl sulfate‐polyacrylamide gel electrophoresis (SDS‐PAGE) was used to
assay the antibody, and the result showed that the heavy chain was at 50 kDa and the light chain was
at 25 kDa (Figure 4A), indicating that the target antibody was successfully purified.
(A) (B)
Figure 4. Analysis of purified anti‐CTN mcAb. (A) Analysis of anti‐CTN mcAb purification by
sodium dodecyl sulfate‐polyacrylamide gel electrophoresis (SDS‐PAGE). Lane M, standard protein Figure 4. Analysis of purified anti-CTN mcAb. (A) Analysis of anti-CTN mcAb purification by sodiumdodecyl sulfate-polyacrylamide gel electrophoresis (SDS-PAGE). Lane M, standard protein marker.Lane 1 and 2, purified anti-CTN mcAb. Lane 3, unpurified ascites fluid. (B) Affinity result of anti-CTNmcAb at different concentration of coating antigen.
Toxins 2017, 9, 110 5 of 12
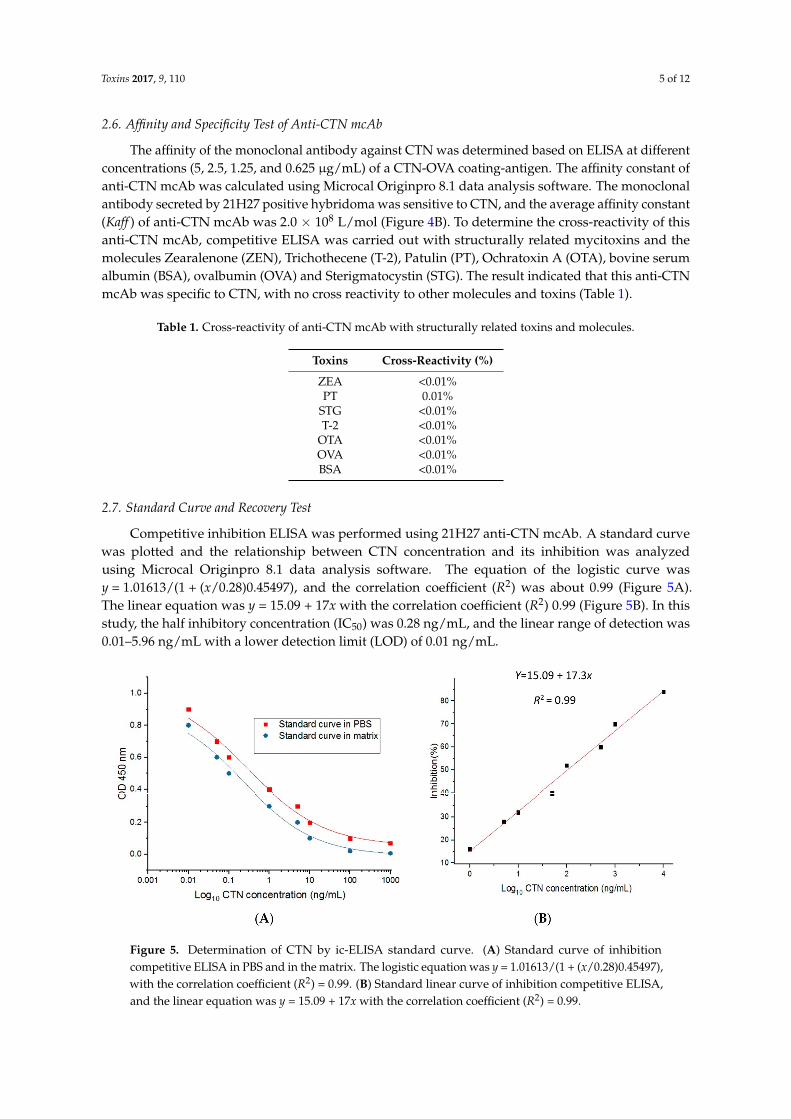
2.6. Affinity and Specificity Test of Anti-CTN mcAb
The affinity of the monoclonal antibody against CTN was determined based on ELISA at differentconcentrations (5, 2.5, 1.25, and 0.625 µg/mL) of a CTN-OVA coating-antigen. The affinity constant ofanti-CTN mcAb was calculated using Microcal Originpro 8.1 data analysis software. The monoclonalantibody secreted by 21H27 positive hybridoma was sensitive to CTN, and the average affinity constant(Kaff ) of anti-CTN mcAb was 2.0 × 10⁸ L/mol (Figure 4B). To determine the cross-reactivity of thisanti-CTN mcAb, competitive ELISA was carried out with structurally related mycitoxins and themolecules Zearalenone (ZEN), Trichothecene (T-2), Patulin (PT), Ochratoxin A (OTA), bovine serumalbumin (BSA), ovalbumin (OVA) and Sterigmatocystin (STG). The result indicated that this anti-CTNmcAb was specific to CTN, with no cross reactivity to other molecules and toxins (Table 1).
Table 1. Cross-reactivity of anti-CTN mcAb with structurally related toxins and molecules.
Toxins Cross-Reactivity (%)
ZEA <0.01%PT 0.01%
STG <0.01%T-2 <0.01%
OTA <0.01%OVA <0.01%BSA <0.01%
2.7. Standard Curve and Recovery Test
Competitive inhibition ELISA was performed using 21H27 anti-CTN mcAb. A standard curvewas plotted and the relationship between CTN concentration and its inhibition was analyzedusing Microcal Originpro 8.1 data analysis software. The equation of the logistic curve wasy = 1.01613/(1 + (x/0.28)0.45497), and the correlation coefficient (R2) was about 0.99 (Figure 5A).The linear equation was y = 15.09 + 17x with the correlation coefficient (R2) 0.99 (Figure 5B). In thisstudy, the half inhibitory concentration (IC50) was 0.28 ng/mL, and the linear range of detection was0.01–5.96 ng/mL with a lower detection limit (LOD) of 0.01 ng/mL.Toxins 2017, 9, 110 6 of 12
Figure 5. Determination of CTN by ic‐ELISA standard curve. (A) Standard curve of inhibition
competitive ELISA in PBS and in the matrix. The logistic equation was y = 1.01613/(1 + (x/0.28)0.45497),
with the correlation coefficient (R2) = 0.99. (B) Standard linear curve of inhibition competitive ELISA,
and the linear equation was y = 15.09 + 17x with the correlation coefficient (R2) = 0.99.
2.8. Samples Detection by ic‐ELISA using Anti‐CTN mcAb
To evaluate the precision and accuracy of the developed ic‐ELISA, a recovery test was carried
out. Non‐contaminated red yeast rice was purchased from the supermarket and spiked with CTN at
different concentrations (0.5, 5, 100, 1000 ng/mL) (Table 1). The results showed that the recovery range
was from 90.2 ± 0.7% to 96.7 ± 1.6% with an average recovery of 93.8 ± 1.6%, and its coefficient of
variation (CV) ranged from 1.0% to 4.3% with an average CV of 2.3% (Table 1). Real samples (cheese,
wheat bread, apple and tomato) were purchased randomly from the local market to carry out the
sample tests. The extracted samples were diluted appropriately to minimize matrix interference and
tested by ic‐ELISA. The results showed that no CTN toxin was detected in these real samples (Table
2).
Table 1. Recovery test of CTN spiked red yeast rice (n = 3).
Spiked Level
(ng/mL)
Measured Concentration
(ng/mL) Recovery (%) CV (%)
0.5 0.47 ± 0.01 94.5 ± 1.1 1.5
5 4.84 ± 0.06 96.7 ± 1.6 2.2
100 93.9 ± 3.0 93.9 ± 3.0 4.3
1000 902.0 ± 7.2 90.2 ± 0.7 1.0
Average 93.8 ± 1.6 2.3
Note: ± indicates value of the average deviation from the mean. Data were given as the mean value.
The coefficient of variation (CV) was defined as the ratio of the standard deviation to the mean in the
recovery test.
Table 2. Analysis of CTN toxin in the real sample.
Samples OD 450 nm Detection Results
Control PBS (B0) 1.07 ± 0.11 ND
Wheat bread 1.1 ± 0.07 ND
Cheese 1.03 ± 0.04 ND
Apple 1.00 ± 0.04 ND
Tomato 1.13 ± 0.09 ND
Figure 5. Determination of CTN by ic-ELISA standard curve. (A) Standard curve of inhibitioncompetitive ELISA in PBS and in the matrix. The logistic equation was y = 1.01613/(1 + (x/0.28)0.45497),with the correlation coefficient (R2) = 0.99. (B) Standard linear curve of inhibition competitive ELISA,and the linear equation was y = 15.09 + 17x with the correlation coefficient (R2) = 0.99.

Toxins 2017, 9, 110 6 of 12
In addition, the interference of the matrix was assessed using ic-ELISA at different concentrationsof CTN. CTN is commonly found in red yeast rice, wheat feed and food contaminants. Artificially CTNcontaminated red yeast rice and wheat were used for the evaluation of the matrix effect. Based on theresult, ic-ELISA standard curves were developed in PBS when compared with the matrix (Figure 5A).The matrix interference was reduced by 50-fold dilution, which means that it was appropriate for theic-ELISA assay.
2.8. Samples Detection by ic-ELISA using Anti-CTN mcAb
To evaluate the precision and accuracy of the developed ic-ELISA, a recovery test was carriedout. Non-contaminated red yeast rice was purchased from the supermarket and spiked with CTN atdifferent concentrations (0.5, 5, 100, 1000 ng/mL) (Table 2). The results showed that the recovery rangewas from 90.2 ± 0.7% to 96.7 ± 1.6% with an average recovery of 93.8 ± 1.6%, and its coefficient ofvariation (CV) ranged from 1.0% to 4.3% with an average CV of 2.3% (Table 2). Real samples (cheese,wheat bread, apple and tomato) were purchased randomly from the local market to carry out thesample tests. The extracted samples were diluted appropriately to minimize matrix interference andtested by ic-ELISA. The results showed that no CTN toxin was detected in these real samples (Table 3).
Table 2. Recovery test of CTN spiked red yeast rice (n = 3).
Spiked Level(ng/mL)
Measured Concentration(ng/mL) Recovery (%) CV (%)
0.5 0.47 ± 0.01 94.5 ± 1.1 1.55 4.84 ± 0.06 96.7 ± 1.6 2.2
100 93.9 ± 3.0 93.9 ± 3.0 4.31000 902.0 ± 7.2 90.2 ± 0.7 1.0
Average 93.8 ± 1.6 2.3
Note: ± indicates value of the average deviation from the mean. Data were given as the mean value. The coefficientof variation (CV) was defined as the ratio of the standard deviation to the mean in the recovery test.
Table 3. Analysis of CTN toxin in the real sample.
Samples OD 450 nm Detection Results
Control PBS (B0) 1.07 ± 0.11 NDWheat bread 1.1 ± 0.07 ND
Cheese 1.03 ± 0.04 NDApple 1.00 ± 0.04 ND
Tomato 1.13 ± 0.09 ND
Note: ND means no CTN was detected out in the above samples tests. ± indicates the value of the average deviationfrom the mean. Data were given as the mean value.
3. Discussion
Citrinin (CTN) is known as a nephrotoxic mycotoxin, and can also cause cytotoxicity,teratogenicity, hepatotoxicity, and skin irritations in terms of human and animal health [33,34]. CTN isa hapten with a very small molecular weight that cannot induce an immuno-response to producea monoclonal antibody in mice. Thus, it is necessary to couple CTN with carrier proteins to elicita specific monoclonal antibody. Structurally, CTN has four active functional groups which can beconjugated with a given carrier protein. Bovine serum albumin (BSA, MW 67,000) has 59 lysine (NH2)groups available for coupling [35], and OVA (MW 45,000) has 20 lysine (NH2) groups. In this studywe applied conjugation of CTN with BSA and OVA, respectively, through the amide bonds using1-ethyl-3-(3-dimethylaminopropyl) carbodiimide hydrochloride (EDC) and its coupling dehydratingagent N-hydroxysuccinimide (NHS). The coupling reaction was carried out in the MES buffer, and theEDC was quenched by 2-mercaptoethanol, making the conjugates stable. Non-denaturing agarose
Toxins 2017, 9, 110 7 of 12
gel electrophoresis results showed that the conjugates of toxin to carrier proteins were successfullyobtained. The conjugate result of CTN-BSA was used for immunization and high anti-serum titer wasachieved, as was the production of a low IC50 in contrast to the previous report of 200 ng/mL IC50 [36].The results of this study showed the successful conjugation of CTN with carrier proteins, suggestingthe potential use of these conjugates for immunization and antibody screening.
The CTN-BSA antigen induced enough anti-serum titers in the Balb/C mice, before the spleencell from the immunized mice was isolated and fused with Sp2/0 myeloma cells in the presenceof polyethylene glycol (PEG, 1450). After screening, a positive hybridoma cell named 21H27 wassuccessfully obtained and injected into the mice abdomens, and the ascitic fluid containing anti-CTNmcAb was purified using a caprylic/ammonium sulfate method. The antibody purification resultindicated that the purified target antibody showed significantly clear bands that were different fromthose of unpurified ascitic fluid (Figure 4A). Our previous study was used as a reference of antibodypurification [37]. The antibody secreted by 21H27 hybridoma was specific to CTN, and the affinityconstant of anti-CTN mcAb was 2.0 × 10⁸ L/mol. A previous study regarding antibody affinityreported that a certain antibody within 107 to 1012 L/mol affinity had good potential for application [38].Furthermore, this study successfully obtained low LOD with low cross-reactivity to other toxins andmolecules under optimum conditions. These results suggested that the antibody secreted by 21H27was a good antibody and could be used for detection purposes.
Based on the result the ic-ELISA standard curve, the IC50 was 0.28 ng/mL and the linear range ofdetection was 0.01–5.96 ng/mL, which was defined as the concentration of CTN from 20% inhibitionto 80%. The lower detection limit (LOD) was 0.01 ng/mL. This indicated that the anti-CTN mcAbsecreted by 21H27 could be used to develop an ELISA kit for the detection of CTN. Previous antibodystudies regarding CTN were reported with high IC50, and unsatisfactory LOD [36]. Another CTNLOD study was reported, but the conjugation methods were complicated in removing non-conjugatedmaterials by dialysis [39]. The recovery test on a spiked sample showed a 93.8 ± 1.6% mean recoveryrate with a 2.3% average coefficient of variation, indicating that the method was appropriate for CTNdetection in real samples. Taken together, this anti-CTN mcAb with low LOD, low IC50, high affinityand high specificity would provide base information to assess the risk of CTN contamination in feedand foodstuffs and provide insights for further research.
4. Materials and Methods
4.1. Materials
Citrinin (CTN), 1-ethyl-3-(3-dimethylaminopropyl) carbodiimide hydrochloride (EDC),N-hydroxysuccinimide (NHS), 2-(morpholino) ethanesulfonic acid (MES), 2-mercaptoethanol,methanol, bovine serum albumin (BSA), ovalbumin (OVA), polyethylene glycol, 1450 (PEG 1450),Freund’s complete adjuvant, Freund’s incomplete adjuvant, horseradish peroxidase (HRP)-conjugated goat anti-mouse IgG, hypoxantine, aminopterin and thymidine (HAT) medium,hypoxanthine-thymidine (HT) medium, mouse monoclonal antibody isotyping reagent (IgG1, IgG2a,IgG3, IgM, IgA), and RPMI 1640 were purchased from Sigma-Aldrich Chemical (St. Louis, MO, USA).The Sp2/0 myeloma cell was stored within our laboratory in liquid nitrogen. Female Balb/C mice(8-weeks old) were purchased from the Wushi animal laboratory (Shanghai, China). All other reagentswere chemical grade and obtained from commercial sources in China.
4.2. Synthesis and Characterization of CTN-Protein Conjugates
CTN was conjugated with the carrier proteins bovine serum albumin (BSA) or ovalbumin (OVA),through the amide bonds using 1-ethyl-3-(3-dimethylaminopropyl) carbodiimide hydrochloride (EDC)and N-hydroxysuccinimide (NHS) with slight modifications [40]. CTN (1 mg) was mixed with 1 mL ofMES buffered saline (containing 0.1 M MES (2-(morpholino) ethanesulfonic acid), 0.5 M NaCl, pH 6.0).After 0.2 mg of EDC and 0.3 mg of NHS were added to the above reaction mixture, it was incubated
Toxins 2017, 9, 110 8 of 12
for 15 min at room temperature. EDC was then quenched by 1.6 µL 2-mercaptoethanol in the MESbuffer. Subsequently, 0.5 mL protein solution (10 mg/mL BSA in 0.1 M phosphate buffered saline(PBS)) was added. The reaction mixture was well mixed and, reacted for 2 h at room temperature.Next, the conjugates were dialyzed with 0.01 M phosphate buffered saline (PBS) at 4 ◦C for 3 d, wherefreshly prepared PBS was replaced every 8 h. The CTN-BSA conjugate was obtained and lyophilizedat the evaporation rotary machine until dry for about 3 h. The final products were stored at −20 ◦Cfor further use. The coating-antigen CTN-OVA was prepared with the same method for CTN-BSA asmentioned above.
4.3. Analysis of CTN-Protein Conjugates
CTN-BSA and CTN-OVA conjugates were checked by non-denaturing agarose gelelectrophoresis [37] and 20 µL of the conjugates were mixed with 10 µL of protein loading buffer,before the mixture was loaded to 1% agarose gel and run at 200 V for 50 min. After electrophoresis,the gel was stained overnight with coomassie blue R-250 and then destained until the clear bands wereseen. CTN has maximal UV absorption at 250 nm and 333 nm (in methanol). CTN conjugation withBSA and OVA carrier proteins was also reported from previous studies [40,41]. A bicinchoninic acid(BCA) assay was used to determine the concentrations of CTN-protein conjugates [37,42].
4.4. Mice Immunization and Anti-Serum ELISA Assay
Healthy female Balb/C mice (8-weeks old) were prepared for immunization, and all mice werecared for according to the institutional guidelines of the Fujian Agriculture and Forestry University,China. CTN-BSA conjugates (100 µg/mL) dissolved in PBS were emulsified with an equal volume ofFreund’s complete adjuvant before female Balb/C mice at multiple sites were immunized throughsubcutaneous injection. After a two-week interval, the mice were boosted by 50 µg/mL of CTN-BSAconjugate emulsified with an equal volume of Freund’s incomplete adjuvant. After boosting the micefive times, serum from the mice tail was collected and the titer of anti-serum was tested by indirectELISA. The coating-antigen CTN-OVA was diluted to 5 µg/mL, then ELISA plates were coated with100 µL/well coating-antigen and incubated overnight at 4 ◦C then washed by PBST (PBS with 0.05%of Tween-20) and PBS for three times, respectively. After washing, 200 µL/well of PBSM (PBS with 5%non-fat milk) were added to block residual protein-binding sites for 2 h at 37 ◦C. After washing threetimes by PBST and PBS, respectively, 100 µL/well of anti-CTN anti-serum was added and incubatedfor 1.5 h at 37 ◦C. After washing further, three times, with PBST and PBS, respectively, 100 µL/well ofHRP conjugated goat anti-mouse IgG (1:8000) was added and incubated at 37 ◦C for 1.5 h. The plateswere then washed three times with PBST and PBS, respectively, and 100 µL/well TMB substrate(mixed equal volumes of TMB buffer A and buffer B) were added and incubated for 15 min at 37 ◦C.The reaction was stopped by the addition of 50 µL/well of H2SO4 (2 mol/L), and the absorbance wasthen measured with a 450 nm micro plate reader [37].
4.5. Cell Fusion and Screening of Anti-CTN mcAb
Production of hybridoma cell against CTN was based on a standard method [37,42,43] with slightmodifications. After anti-serum titer was tested, the high titer mouse was chosen and immunized withCTN-BSA without adjuvant through intraperitoneal 3 d before cell fusion. Sp2/0 myeloma cells grewwell at a complete medium, and the spleen cells from the immunized mouse were fused at 1 ratio ofSp2/0 with 10 B cells from the spleen cells. The fusion was done by adding polyethylene glycol (PEG,1450) drop by drop [31], and the hybridoma were cultured with a HAT supplementary medium in thepresence of feeder cells in 96-well plates with 5% CO2 at 37 ◦C. One week later, the HAT medium waschanged to a HT medium. After a further 10 d incubation, the presence of anti-CTN antibodies waschecked from the supernatant of the hybridoma cells using ELISA. The positive clones were transferredto 48-well plates and subsequently sub-cloned several times through limited dilution method.

Toxins 2017, 9, 110 9 of 12
4.6. Isotyping and Chromosome Analysis of the Anti-CTN mcAb
After hybridoma of interest were subcloned, the isotyping of the positive cells was conductedaccording to the guide with minor modifications [37]. For chromosome analysis, geimsa staining wasapplied [44] and the chromosome was observed under a microscope [37,42].
4.7. Production and Purification of Anti-CTN mcAb
Healthy mature female Balb/C mice were injected intraperitoneally with 500 µL of pristane (2, 6,10, 14-Tetramethylpentadecane) 7 d before receiving ip injection of the hybridoma cell line 21H27,and ascites fluid was developed after injection for 8 d. The ascites fluid was harvested from the miceand centrifuged at 9391× g for 10 min, and the antibody was purified using the caprylic/ammoniumsulfate precipitation method [45]. The purified mcAb was analyzed by SDS-PAGE [46], and a BCAprotein assay kit was used to determine the concentration of the ascites fluid and the purified mcAb [42].
4.8. Affinity Assay and Cross-Reactivity of Anti-CTN mcAb
An affinity assay for monoclonal antibodies against CTN was carried out according to previouspublications in our laboratory [37,42] with minor modifications. The coating antigen (CTN-OVA)was coated at different concentrations (5, 2.5, 1.25, 0.625 µg/mL) overnight at 4 ◦C, then washedwith PBST and PBS three times, respectively. PBSM (200 µL/well) was added to block residualprotein-binding sites, and incubated for 2 h at 37 ◦C. After washing, anti-CTN mcAb was seriallydiluted, and 100 µL/well of anti-CTN mcAb was added and incubated for 1.5 h at 37 ◦C. After washing,100 µL/well HRP conjugated goat anti-mouse IgG (1:8000) was added and incubated at 37 ◦C for1.5 h. After washing three times with PBST and PBS, respectively, 100 µL/well of TMB substratewas added for color development, and incubated at 37 ◦C for 15 min. The reaction was stoppedby adding 50 µL/well of H2SO4 (2 mol/L). The absorbance was measured at 450 nm by the microplate reader. Data were analyzed using Microcal OriginPro 8.1 data analysis software, and theaffinity constants of anti-CTN mcAb were calculated according to the standard method describedin Reference [47]. The specificity and cross-reactivity of anti-CTN mcAb were carried out accordingto references from our previous study [37]. Structurally related molecules and toxins zearalenone(ZEN), trichothecene (T-2 patulin (PT), ochratoxin A (OTA), bovine serum albumin (BSA), ovalbumin(OVA), and sterigmatocystin (STG) were used as competitor antigens of CTN, and cross-reactivity wascalculated as: cross-reactivity (%) = concentration of standard CTN inhibiting 50% of antibody bindingdivided by the concentration of competitor inhibiting 50% of antibody binding multiplied by 100%.
4.9. Standard Curve and Recovery Test
Artificially contaminated samples with CTN were tested using competitive indirect ELISA.The CTN-OVA coating antigen was prepared at an optimum concentration. The ELISA micro wellswere coated overnight at 4 ◦C. After washing with PBST and followed by PBS for three times, the wellswere blocked with 200 µL/well of 5% PBSM then incubated for 2 h at 37 ◦C. After washing, an equalvolume of anti-CTN mcAb was reacted with a free CTN toxin at different concentrations (0, 0.01,0.05, 0.1, 1, 5, 10, 100, 1000 ng/mL). The reaction products were incubated for 30 min at 37 ◦C.Subsequently, 100 µL/well of the product was transferred to ELISA micro wells with three replicatesof each concentration standard, and incubated for 1 h at 37 ◦C. After washing, HRP conjugated goatanti-mouse IgG (1:8000) was diluted in 5% PBSM and 100 µL/well was added. After incubatingand washing, 100 µL/well TMB substrate solution was added and incubated for 15 min at 37 ◦C.The reaction was stopped by adding 50 µL/well of H2SO4 and absorbance was measured at 450 nm.The linear range to detect CTN was defined as the concentration of CTN towards from 20% to 80%inhibition [48]. The inhibition concentration of CTN toxin in relation to anti-CTN mcAb was analyzedusing Microcal OriginPro 8.1 [37,42].

Toxins 2017, 9, 110 10 of 12
Red yeast rice (1 g) and wheat flour samples were spiked with the CTN toxin at differentconcentrations (0.5, 5, 100, 1000 ng/mL). Added to each sample was 10 mL of 70% ethanol (v/v) andmixed well by ultrasonic treatment for 30 min. The sample was then extracted at room temperature.After being centrifuged at 1055× g for 20 min, the supernatant was used for ic-ELISA assay. The matrixeffect in the standard curve was tested by comparing the sample in the matrix and in the PBS.The sample extract was diluted to reduce matrix interference. Recovery tests were performed anddetermined based on the standard curve. The coefficient variation and the recovery tests weredetermined from data triplicates [42].
4.10. Ethical Statement and Animal Care
All animal experiments were performed according to the Animal Ethics Committee of the FujianAgriculture and Forestry University in China (C1017/23.12.2014). All female Balb/C mice were kept ina well-designed mice room with three mice per cage. The temperature of the room was set at 24 ± 2 ◦Cwith an approximate relative humidity of 50%–60%. The mice were given clean water and fed withForti-Diet commercial pellet mouse food. Overall health monitoring of the mice were performedregularly and the mice room was cleaned on a regular basis.
Acknowledgments: This work was supported by the Key Scientific and Technology project of Fujian provinceof China (No. 2014Y4001, 2014YZ0105) and Industrial Technology Development project in the Special StrategicDevelopment of Novel Industries project of Fujian province (K6NER0001).
Author Contributions: Shimuye Kalayu Yirga and Shihua Wang conceived and designed the experiments;Shimuye Kalayu Yirga performed the experiments; Shimuye Kalayu Yirga, Sumei Ling, and Shihua Wanganalyzed the data; Shimuye Kalayu Yirga, Sumei Ling, Yanling Yang, Jun Yuan, and Shihua Wang wrote the paper;Shihua Wang provided financial and administrative support and gave final approval of the manuscript.
Conflicts of Interest: The authors declare no conflicts of interest.
References
1. Da Rocha, M.E.B.; Freire, F.D.C.O.; Erlan Feitosa Maia, F.; Izabel Florindo Guedes, M.; Rondina, D.Mycotoxins and their effects on human and animal health. Food Control 2014, 36, 159–165. [CrossRef]
2. Hetherington, A.C.; Raistrick, H. Studies in the biochemistry of micro-organisms. XIV. On the production andchemical constitution of a new yellow coloring matter, citrinin, produced from glucose by Penicillium citrinum,Thom. Philos. Trans. R. Soc. Ser. B 1931, 220, 269. [CrossRef]
3. Blanc, P.J.; Laussac, J.P.; Le Bars, J.; Le Bars, P.; Loret, M.O.; Pareilleux, A.; Prome, D.; Prome, J.C.;Santerre, A.L.; Goma, G. Characterization of monascidin a from Monascus as citrinin. Int. J. Food Microbiol.1995, 27, 201–213. [CrossRef]
4. Reiss, J. Mycotoxins in foodstuffs. X. Production of citrinin by Penicillium chrysogenum in bread.Food Cosmet. Toxicol. 1977, 15, 303–307. [CrossRef]
5. Nejati, P.; Chaychi Nosrati, A.; Bayat, M. An investigation on measurement means of citrinin toxin quantityby toxigenic Aspergillus species in biomass, using ELISA. Int. J. Adv. Biol. Biomed. Res. 2014, 2, 2466–2471.
6. Petkova-Bocharova, T.; Castegnaro, M.; Michelon, J.; Maru, V. Ochratoxin A and Other Mycotoxins in Cerealsfrom an Area of Balkan Endemic Nephropathy and Urinary Tract Tumours in Bulgaria; IARC Scientific Publications:Lyon, France, 1990; pp. 83–87.
7. Ostry, V.; Malir, F.; Ruprich, J. Producers and important dietary sources of ochratoxin A and citrinin. Toxins2013, 5, 1574–1586. [CrossRef] [PubMed]
8. Ciegler, A.; Vesonder, R.; Jackson, L.K. Produciton and biological activity of patulin and citrinin frompenicillium expansum. Appl. Environ. Microbiol. 1977, 33, 1004–1006. [PubMed]
9. Zaied, C.; Zouaoui, N.; Bacha, H.; Abid, S. Natural occurrence of citrinin in tunisian wheat grains. Food Control2012, 28, 106–109. [CrossRef]
10. Tölgyesi, Á.; Stroka, J.; Tamosiunas, V.; Zwickel, T. Simultaneous analysis of Alternaria toxins and citrinin intomato: An optimised method using liquid chromatography-tandem mass spectrometry. Food Addit. Contam.Part A 2015, 32, 1512–1522. [CrossRef] [PubMed]
Toxins 2017, 9, 110 11 of 12
11. Bailly, J.; Querin, A.; Le Bars-Bailly, S.; Benard, G.; Guerre, P. Citrinin production and stability in cheese.J. Food Prot. 2002, 65, 1317–1321. [CrossRef] [PubMed]
12. Wang, T.H.; Lin, T.F. Monascus rice products. In Advances in Food and Nutrition Research; Academic Press:University of Nebraska, Lincoln, NE, USA, 2007; Volume 53, pp. 123–159.
13. Li, Y.; Zhou, Y.-C.; Yang, M.-H.; Ou-Yang, Z. Natural occurrence of citrinin in widely consumed traditionalchinese food red yeast rice, medicinal plants and their related products. Food Chem. 2012, 132, 1040–1045.[CrossRef]
14. Li, F.; Xu, G.; Li, Y.; Chen, Y.; Ji, R. Natural occurrence of citrinin in Monascus products. Wei Sheng Yan Jiu =J. Hyg. Res. 2005, 34, 451–454.
15. Sabater-Vilar, M.; Maas, R.F.; Fink-Gremmels, J. Mutagenicity of commercial Monascus fermentation productsand the role of citrinin contamination. Mutat. Res./Genet. Toxicol. Environ. Mutagen. 1999, 444, 7–16.[CrossRef]
16. Flajs, D.; Peraica, M. Toxicological properties of citrinin. Arch. Ind. Hyg. Toxicol. 2009, 60, 457–464. [CrossRef][PubMed]
17. Frank, H.K. Citrinin. Zeitschrift für Ernährungswissenschaft 1992, 31, 164–177. [CrossRef] [PubMed]18. Gupta, M.; Sasmal, D.; Bandyopadhyay, S.; Bagchi, G.; Chatterjee, T.; Dey, S. Hematological changes produced
in mcie by ochratoxin A and citrinin. Toxicology 1983, 26, 55–62. [CrossRef]19. Liu, B.-H.; Wu, T.-S.; Su, M.-C.; Chung, C.P.; Yu, F.-Y. Evaluation of citrinin occurrence and cytotoxicity in
Monascus fermentation products. J. Agric. Food Chem. 2005, 53, 170–175. [CrossRef] [PubMed]20. Dönmez-Altuntas, H.; Dumlupinar, G.; Imamoglu, N.; Hamurcu, Z.; Liman, B.C. Effects of the mycotoxin
citrinin on micronucleus formation in a cytokinesis-block genotoxicity assay in cultured human lymphocytes.J. Appl. Toxicol. 2007, 27, 337–341. [CrossRef] [PubMed]
21. Qingqing, H.; Linbo, Y.; Yunqian, G.; Shuqiang, L. Toxic effects of citrinin on the male reproductive systemin mice. Exp. Toxicol. Pathol. 2012, 64, 465–469. [CrossRef] [PubMed]
22. Singh, N.; Sharma, A.; Patil, R.; Rahman, S.; Leishangthem, G.; Kumar, M. Effect of feeding graded doses ofcitrinin on clinical and teratology in female Wistar rats. Indian J. Exp. Biol. 2014, 52, 159–167. [PubMed]
23. Böhm, J.; De Saeger, S.; Edler, L.; Fink-Gremmels, J.; Mantle, P.; Peraica, M.; Stetina, R.; Vrabcheva, T. Scientificopinion on the risks for public and animal health related to the presence of citrinin in food and feed. Eur. FoodSaf. Auth. J. 2012, 10, 1–82.
24. Santos, I.M.; Abrunhosa, L.; Venâncio, A.; Lima, N. The effect of culture preservation techniques on patulinand citrinin production by Penicillium expansum link. Lett. Appl. Microbiol. 2002, 35, 272–275. [CrossRef][PubMed]
25. Vrabcheva, T.; Usleber, E.; Dietrich, R.; Märtlbauer, E. Co-occurrence of ochratoxin A and citrinin in cerealsfrom Bulgarian villages with a history of Balkan endemic nephropathy. J. Agric. Food Chem. 2000, 48,2483–2488. [CrossRef] [PubMed]
26. Ji, X.; Xu, J.; Wang, X.; Qi, P.; Wei, W.; Chen, X.; Li, R.; Zhou, Y. Citrinin determination in red fermented riceproducts by optimized extraction method coupled to liquid chromatography tandem mass spectrometry(LC-MS/MS). J. Food Sci. 2015, 80, T1438–T1444. [CrossRef] [PubMed]
27. Huertas-Pérez, J.F.; Arroyo-Manzanares, N.; García-Campaña, A.M.; Gámiz-Gracia, L. High-throughputdetermination of citrinin in rice by ultra-high-performance liquid chromatography and fluorescence detection(UHPLC-FL). Food Addit. Contam. Part A 2015, 32, 1352–1357. [CrossRef] [PubMed]
28. Shu, P.-Y.; Lin, C.-H. Simple and sensitive determination of citrinin in Monascus by GC-selected ionmonitoring mass spectrometry. Anal. Sci. 2002, 18, 283–287. [CrossRef] [PubMed]
29. Abramson, D.; Usleber, E.; Märtlbauer, E. An indirect enzyme immunoassay for the mycotoxin citrinin.Appl. Environ. Microbiol. 1995, 61, 2007–2009. [PubMed]
30. Xu, B.-J.; Jia, X.-Q.; Gu, L.-J.; Sung, C.-K. Review on the qualitative and quantitative analysis of the mycotoxincitrinin. Food Control 2006, 17, 271–285. [CrossRef]
31. Cho, Y.-J.; Lee, D.-H.; Kim, D.-O.; Min, W.-K.; Bong, K.-T.; Lee, G.-G.; Seo, J.-H. Production of a monoclonalantibody against ochratoxin A and its application to immunochromatographic assay. J. Agric. Chem. 2005,53, 8447–8451. [CrossRef] [PubMed]
32. Zhou, Y.; Li, Y.; Pan, F.; Liu, Z.; Wang, Z. Identification of tetrodotoxin antigens and a monoclonal antibody.Food Chem. 2009, 112, 582–586. [CrossRef]
Toxins 2017, 9, 110 12 of 12
33. Gayathri, L.; Dhivya, R.; Dhanasekaran, D.; Periasamy, V.S.; Alshatwi, A.A.; Akbarsha, M.A. Hepatotoxiceffect of ochratoxin A and citrinin, alone and in combination, and protective effect of vitamin E: In vitrostudy in Hep G2 cell. Food Chem. Toxicol. 2015, 83, 151–163. [CrossRef] [PubMed]
34. Roberts, W.T.; Mora, E.C. Toxicity of Penicillium citrinum AUA-532 contaminated corn and citrinin in broilerchicks. Poult. Sci. 1978, 57, 1221–1226. [CrossRef] [PubMed]
35. Lei, H.; He, Z.; Yuan, H.; Wu, J.; Wen, L.; Li, R.; Zhang, M.; Yuan, L.; Yuan, Z. Generation and characterizationof a monoclonal antibody to penicillic acid from Penicillium cyclopium. Afr. J. Biotechnol. 2010, 9, 3026–3031.
36. Liu, R.; Yu, Z.; He, Q.; Xu, Y. Preparation and identification of a monoclonal antibody against citrinin.Wei Sheng Yan Jiu = J. Hyg. Res. 2007, 36, 190–193.
37. Ling, S.; Pang, J.; Yu, J.; Wang, R.; Liu, L.; Ma, Y.; Zhang, Y.; Jin, N.; Wang, S. Preparation and identification ofmonoclonal antibody against fumonisin B 1 and development of detection by ic-ELISA. Toxicon 2014, 80,64–72. [CrossRef] [PubMed]
38. Maragos, C.; Busman, M.; Plattner, R. Development of monoclonal antibodies for the fusarin mycotoxins.Food Addit. Contam. 2008, 25, 105–114. [CrossRef] [PubMed]
39. Li, Y.; Wang, Y.; Guo, Y. Preparation of synthetic antigen and monoclonal antibody for indirect competitiveELISA of citrinin. Food Agric. Immunol. 2012, 23, 145–156. [CrossRef]
40. Cheng, H.; Chen, Y.; Yang, Y.; Chen, X.; Guo, X.; Du, A. Characterization of anti-citrinin specific scFvsselected from non-immunized mouse splenocytes by eukaryotic ribosome display. PLoS ONE 2015, 10,e0131482. [CrossRef] [PubMed]
41. Liu, X.S.; Yang, W.J.; He, J.X.; Zhao, J.Z.; Justo, G.C.; Zhang, X.Y. Preparation of artificial antigen and eggyolk-derived immunoglobulin (IgY) of citrinin for enzyme-linked immunosorbent assay. Biomed. Environ. Sci.2009, 22, 237–243.
42. Jin, N.; Ling, S.; Yang, C.; Wang, S. Preparation and identification of monoclonal antibody against citreoviridinand development of detection by ic-ELISA. Toxicon 2014, 90, 226–236. [CrossRef] [PubMed]
43. Köhler, G.; Milstein, C. Continuous cultures of fused cells secreting antibody of predefined specificity. Nature1975, 256, 495–497. [CrossRef] [PubMed]
44. Kozak, C.A.; Lawrence, J.B.; Ruddle, F.H. A sequential staining technique for the chromosomal analysisof interspecific mouse/hamster and mouse/human somatic cell hybrids. Exp. Cell Res. 1977, 105, 109–117.[CrossRef]
45. Bai, L.; Qian, J.-H.; Wang, J. Purification of mouse IgG from ascites fluid and serum by caprylic acid andammonium sulfate. J. Dali Med. Coll. 2000, 4, 001.
46. Chang, Y.-C.; Gottlieb, D.I. Characterization of the proteins purified with monoclonal antibodies to glutamicacid decarboxylase. J. Neurosci. 1988, 8, 2123–2130. [PubMed]
47. Beatty, J.D.; Beatty, B.G.; Vlahos, W.G. Measurement of monoclonal antibody affinity by non-competitiveenzyme immunoassay. J. Immunol. Methods 1987, 100, 173–179. [CrossRef]
48. Kido, K.; Edakuni, K.; Morinaga, O.; Tanaka, H.; Shoyama, Y. An enzyme-linked immunosorbent assay foraconitine-type alkaloids using an anti-aconitine monoclonal antibody. Anal. Chim. Acta 2008, 616, 109–114.[CrossRef] [PubMed]
© 2017 by the authors. Licensee MDPI, Basel, Switzerland. This article is an open accessarticle distributed under the terms and conditions of the Creative Commons Attribution(CC BY) license (http://creativecommons.org/licenses/by/4.0/).