the primary immune response to vaccinia virus vaccination
TRANSCRIPT
Vaccine 34 (2016) 5251–5261
Contents lists available at ScienceDirect
Vaccine
journal homepage: www.elsevier .com/locate /vacc ine
The primary immune response to Vaccinia virus vaccination includescells with a distinct cytotoxic effector CD4 T-cell phenotype
http://dx.doi.org/10.1016/j.vaccine.2016.09.0090264-410X/Crown Copyright � 2016 Published by Elsevier Ltd. All rights reserved.
⇑ Corresponding author at: Immunovirology and Pathogenesis Program, TheKirby Institute, UNSW, Australia, Wallace Wurth Building, Sydney, NSW 2052,Australia.
E-mail address: [email protected] (C. Mee Ling Munier).1 These authors contributed equally to this work.
Downloaded from ClinicalKey.com.au at University of Melbourne December 21, 2016.For personal use only. No other uses without permission. Copyright ©2016. Elsevier Inc. All rights reserved.
C. Mee Ling Munier a,⇑, David van Bockel a, Michelle Bailey a, Susanna Ip a, Yin Xu a, Sheilajen Alcantara b,Sue Min Liu d, Gareth Denyer e, Warren Kaplan d, PHIIDO Study group, Kazuo Suzuki a,c, Nathan Croft h,Anthony Purcell h, David Tscharke i, David A. Cooper a,c, Stephen J. Kent b,f,g, John J. Zaunders a,c,1,Anthony D. Kelleher a,c,1
a The Kirby Institute for infection and immunity in society, UNSW Australia, Sydney, NSW, AustraliabDepartment of Microbiology and Immunology, Peter Doherty Institute, University of Melbourne, Melbourne, VIC, Australiac St Vincent’s Hospital, Sydney, NSW, Australiad The Garvan Institute, Sydney, NSW, Australiae School of Molecular Bioscience, Faculty of Science, The University of Sydney, NSW, AustraliafMelbourne Sexual Health Centre and Department of Infectious Diseases, Alfred Health, Central Clinical School, Monash University Melbourne, VIC, AustraliagARC Centre of Excellence in Convergent Bio-Nano Science and Technology, University of Melbourne, Parkville, VIC, Australiah Infection and Immunity Program, Department of Biochemistry and Molecular Biology, Biomedicine Discovery Institute, Monash University, Clayton, VIC, Australiai John Curtin School of Medical Research, The Australian National University, Canberra, ACT, Australia
a r t i c l e i n f o
Article history:Received 23 February 2016Received in revised form 9 August 2016Accepted 6 September 2016Available online 14 September 2016
Keywords:VacciniaGranzyme KCD4CD8MicroarrayHIVCytotoxic T-cells
a b s t r a c t
Background: Smallpox was eradicated by a global program of inoculation with Vaccinia virus (VV). RobustVV-specific CD4 T-cell responses during primary infection are likely essential to controlling VV replica-tion. Although there is increasing interest in cytolytic CD4 T-cells across many viral infections, the impor-tance of these cells during acute VV infection is unclear.Methods: We undertook a detailed functional and genetic characterization of CD4 T-cells during acuteVV-infection of humans. VV-specific T-cells were identified by up-regulation of activation markersdirectly ex vivo and through cytokine and co-stimulatory molecule expression. At day-13-post primaryinoculation with VV, CD38highCD45RO+ CD4 T-cells were purified by cell sorting, RNA isolated and anal-ysed by microarray. Differential expression of up-regulated genes in activated CD4 T-cells was confirmedat the mRNA and protein levels. We compared analyses of VV-specific CD4 T-cells to studies on 12 sub-jects with primary HIV infection (PHI). VV-specific T-cells lines were established from PBMCs collectedpost vaccination and checked for cytotoxicity potential.Results: A median 11.9% CD4 T-cells were CD38highCD45RO+ at day-13 post-VV inoculation, comparedto 3.0% prior and 10.4% during PHI. Activated CD4 T-cells had an up-regulation of genes related tocytolytic function, including granzymes K and A, perforin, granulysin, TIA-1, and Rab27a. No differencewas seen between CD4 T-cell expression of perforin or TIA-1 to VV and PHI, however granzyme k wasmore dominant in the VV response. At 25:1 effector to target ratio, two VV-specific T-cell lines exhibited62% and 30% cytotoxicity respectively and CD107a degranulation.Conclusions: We show for the first time that CD4 CTL are prominent in the early response to VV.Understanding the role of CD4 CTL in the generation of an effective anti-viral memory may help developmore effective vaccines for diseases such as HIV.
Crown Copyright � 2016 Published by Elsevier Ltd. All rights reserved.
1. Introduction
CD4 T-cells play a crucial role in a functioning immune systemand are critical for durable anti-viral immunity. They assist B cellsto produce neutralizing antibodies and augment and maintainvirus-specific CD8 T-cell responses. CD4 T-cells with cytotoxiccharacteristics have been increasingly described ex vivo and have
5252 C. Mee Ling Munier et al. / Vaccine 34 (2016) 5251–5261
been linked to control a number of viral infections affectinghumans, including HIV-1 [1–4], CMV [5,6], EBV [7] and viralhepatitis [8]. Cytotoxic CD4 T-cells have also been detected inindividuals vaccinated against poliovirus [9] and in the RV144HIV vaccine study [10]. In macaques, simian immunodeficiencyvirus (SIV)-specific CD4 T-cells were shown to have direct effectorfunction with the ability to eliminate SIV-infected macrophagesex vivo [11].
The role of cytotoxic CD4 T-cells during a robust experimentalinfection of humans such as Vaccinia virus (VV) has not beenstudied. VV provides an attractive model to study humananti-viral T-cell responses as: (i) this live virus vaccination resultsin acute infection that is cleared leading to life-long immunity[12]; (ii) the effectiveness of immunity has been demonstratedby global eradication of smallpox; (iii) un-controlled antigenicre-exposure is unlikely, so measurement of memory most likelyreflects cells generated by vaccination; (iv) exact date and strainof inoculation with VV is known, unlike most primary HIV-1, EBVand CMV infections, hence it is possible to undertake scheduledprospective longitudinal studies to dissect early stages of theimmune response.
The peak of the primary VV-specific CD4 T-cell response occurs�2 weeks after inoculation, with a sharp increase in highlyactivated cells (CD4+CD38+++) that produce IFN-c, have highproliferative and apoptotic rates and approximately half expressCTLA-4 [13]. A similar pattern of early-activated effector CD4T-cells in primary HIV-1 infection (PHI) has been observed,however, CD127 expression and IL-2 is lower and CTLA-4 higherthan in VV-specific cells [2,14]. It is likely such differences in thesetwo primary immune responses reflect differences in effectivenessof subsequent memory responses in these two infections, but thedeterminants of these differences are not understood.
In the current study, we sought to further understand differ-ences in the primary immune response to VV and primary immuneresponse to HIV-1 by comparing immunophenotype of T-cells fromthese two groups. Analysis of microarray data generated fromsorted human CD4 T-cells at day-13 post-VV vaccination revealedthat activated CD4 T-cells have a prominent cytotoxic T lympho-cyte (CTL) profile with up-regulation of CTL associated genesincluding granzyme (Gzm) K and A.
2. Materials and methods
2.1. Subjects
Individuals receiving primary VV-immunisation (Dryvax vac-cine, Wyeth Laboratories, Marietta, PA, USA) for occupationalrequirements were recruited. Blood drawn prior to vaccination(baseline), at day-13 and 12-months post-vaccination (Supplemen-tary Fig. 1). Cryopreserved PBMCs from 12 individuals with acutePHI enrolled in the Primary HIV Infection Identification, Datacollection and Observation (PHIIDO) cohort were used.
VV studies were approved by Australian Red Cross Blood ServiceHuman Research Ethics Committee (HREC), St Vincent’s HospitalSydney HREC (HREC/10/SVH/130) and University of MelbourneHealth Sciences Human Ethics Sub-Committee (Ethics ID:1035129). PHIIDO cohort studies were approved by St Vincent’sHospital Sydney HREC (HREC/08/SVH/180). All participants gaveinformed written consent.
2.2. Reagents
The monoclonal antibodies used: CD3PerCP-Cy5.5,CD4AlexaFluor-700, CD4-PE-Cy7, CD4BV605, CD8APC-Cy7,CD8-FITC, CD25APC, CD38-PE, CD38PE-Cy7, CD45RA-APC,
Downloaded from ClinicalKey.com.au at UnFor personal use only. No other uses without permissio
CD69-PE, CD107a-APC, CD134 (OX40)-PE, Beta-7-APC, Bcl-2-PE,CCR5-PE, CXCR3-PE-CF594, IFN-c-APC, IFN-c-FITC, IL-2-PE,Ki-67-FITC, TNF-a-PE-Cy7 (Becton Dickinson (BD), San Jose, CA,USA); CD4-energy coupled dye (ECD), CD45RO-ECD (BeckmanCoul-ter, Hialeah, FL, USA); GzmK-FITC (Santa Cruz Biotechnology, SantaCruz, CA, USA); CCR6-BV421, CD127-BV421, GzmA-Pacific Blue,Perforin-PE (BioLegend, San Diego, CA, USA); GzmB-APC, LIVE/DEADTM Fixable Near-IR, Zenon� Pacific BlueTM Mouse IgG1 labellingkit (Molecular Probes, Eugene, OR, USA); CD62L-eFluor780, Eomes-APC, T-bet-PE (eBioscience); TIA-1-unconjugated (Immunotech),according to manufacturers’ directions.
2.3. Immunophenotyping and antigen-specific T-cell assays
Na-Hep anti-coagulated blood was used for immunophenotyp-ing, intracellular cytokine staining assay (ICS) and CD25/OX40assay as previously described [13,15,16]. For ICS and CD25/OX40assays, blood was stimulated with: (i) no antigen (negative con-trol); (ii) Staphylococcal enterotoxin B (SEB; positive control; finalconcentration 1 lg/mL; Sigma, St Louis, MO, USA); (iii) VV lysateand (iv) HeLa cell lysate both at final concentration of 1/250,prepared as described [13]. Gating for ICS in SupplementaryFig. 2a and CD25/OX40 assay in Supplementary Fig. 2b. Samplesanalysed on 4-Laser LSRII flow-cytometer (BD), data analysed usingFlowJo (v9.8.3; TreeStar, Ashland, OR, USA).
2.4. Cell sorting
Cell sorting was performed on 3-Laser FACSAriaTM (BD).CD3+CD4+T-cells sorted into: CD45RA+CD38dim (naïve),CD45RAnegCD38+++ (activated effector) and CD45RAnegCD38neg(resting memory) (Supplementary Fig. 3). CD8+CD45RAnegCD38++ also sorted, purity >90–99.8%. Sorted cells lysed in TRIzol�
(Invitrogen, Carlsbad, CA, USA), stored at �80 �C.
2.5. RNA extraction from sorted T-cells
For microarray analysis, RNA extraction was performed usingmodified small-scale method as described [17]. For confirmatoryqRT-PCR, RNA was extracted from lysed cells in TRIzol� followingmanufacturer’s protocol.
2.6. Preparation of cRNA and gene-chip hybridizations
Following manufacturer’s instructions, Two-Cycle Target Label-ling kit (Affymetrix, Inc., Santa Clara, CA, USA) was used to generatecRNA and hybridized to Affymetrix Human Genome U133 Plus 2.0Arrays (HG-U133 Plus 2.0). Scaling was performed using Microar-ray Analysis Suite Software 5.0 (Affymetrix).
2.7. Microarray analysis/bioinformatics
Microarray data were normalized, log2 transformed and anal-ysed with GenePattern (Broad Institute, Cambridge, MA, USA)[18]. Differential gene expression was determined using LimmaGP[19] applying multiple testing procedures, producing corrected p-values or q-values for each gene to control for False Discovery Rate(FDR). Q-values <0.05 were considered statistically significant.Comparisons were viewed using ComparativeMarkerSelectionViewer and heat maps generated with HeatMapImage.
2.8. Conversion of RNA to cDNA for qPCR
RNA was reverse transcribed into cDNA using iScriptTM SelectcDNA Synthesis Kit (Bio-Rad Laboratories, Hercules, CA, USA) on
iversity of Melbourne December 21, 2016.n. Copyright ©2016. Elsevier Inc. All rights reserved.
C. Mee Ling Munier et al. / Vaccine 34 (2016) 5251–5261 5253
an Eppendorf Mastercycler� epgradient S ThermoCycler (Eppen-dorf, Hamburg, Germany) following kit instructions.
2.9. qRT-PCR for gene expression confirmation
qRT-PCR was performed using primers for GzmB: forwardprimer, TGGGGGACCCAGAGATTAAAA, reverse primer, TTTCGTC-CATAGGAGACAATGC (Geneworks, Hindmarsh, SA, Australia);GzmA: forward primer, GACTCGTGCAATGGAGATTCTGGAA,reverse primer, CCCACGAGGGTCTCCGCATTT; GzmK: forwardprimer, GCAGCCCACTGCCAATATCGGT, reverse primer,TGGCTCCCCAGCCAGTAACCT (Sigma) and b-actin: forward primer,TCACCCACACTGTGCCCATCTACGA, reverse primer, CAGCGGAAC-CGCTCATTGCCAATGG [20].
Bio-Rad iQ5 was used for qRT-PCR, using EXPRESS SYBR�
GreenERTM qPCR SuperMix Universal (Invitrogen), following manu-facturer’s instructions. Assays were performed in duplicate withthese conditions, 95 �C for 2 min, 50 cycles: 95 �C for 15 s then60 �C for 1 min, then, melt curve analysis with 81 cycles of 55 �Cfor 10 s.
2.10. Determination of autologous VV-peptides using massspectrometry
Mass spectrometry was used to detect VV-epitopes bound toMHC, using immunoaffinity purification and peptide elution [21].In brief 2 � 109 autologous EBV transformed B-lymphoblastoid celllines (B-LCL) from PBMC of VV recipients were infected at MOI of 5with VV-Western Reserve strain (ATCC#VR1354), in serum freeDMEM for 30 min. Infected cells were grown in slow rotation for16 h at 37 �C in DMEM+FCS and L-glutamine. Cells were washed,pelleted and snap-frozen. Frozen cell pellets were ground in acryogenic mill (Mixer Mill MM 400, Retsch) and lysed in 0.5%IGEPAL, 50 mM Tris pH8.0 and complete protease inhibitor(Roche Molecular Biochemicals). Lysates were cleared by ultra-centrifugation and MHC-peptide complexes immunoaffinity puri-fied by Protein A cross-linked to anti-HLA DR mAb (clone L243).Peptides were eluted by addition of 10% acetic acid and purifiedand fractionated by RP-HPLC separation on ÄKTAmicroTM HPLCsystem (GE Healthcare) before MS analysis, as described [22].
Peptide fractions were analysed on TripleTOF� 5600+ massspectrometer (SCIEX) coupled on-line to Eksigent nano LC Ultra2DPlus combined with a Nanoflex cHiPLC system (SCIEX). Sampleswere loaded onto trap column (200 lm � 0.5 mm ChromXP C18-CL 3 lm 120 Å) and separated across an analytical column(75 lm � 15 cm ChromXP C18-CL 3 lm 120 Å) under increasing% buffer B (80% acetonitrile in water supplemented with 0.1% for-mic acid) conditions. Peptides were sequenced using ParagonTM
algorithm in ProteinPilotTM (SCIEX) as described [23,24].Peptides (>75% purity) were purchased from Mimotopes (Clay-
ton, Victoria) and stocks prepared at 10 mg/mL in 100% DMSO.
2.11. Generation of VV-specific T-cell lines
VV specific T-cell lines were generated as described [25]. Inbrief, PBMC stored at day-13 and 12 months post-vaccination froma VV-vaccinee with HLA-DRB1⁄10:01:01 and 15:02:01 werethawed and incubated at 2 � 106 cell/mL in IMDM Glutamax+hAbserum with autologous VV-peptide (final concentration 1 lg/mL).PBMC were stimulated 10 days with peptide, followed byre-stimulation with pre-mixed peptide+irradiated feeder mixture(PBMC+autologous B-LCL (9:1)). Following stimulation with anti-gen, cells were washed before resting with feeder mixture for9 days supplemented with 20 U/mL IL-2. Following rest period,cells were cycled through re-stimulation period with VV-peptidefor 4 days.
Downloaded from ClinicalKey.com.au at UniveFor personal use only. No other uses without permission. C
2.12. Cytotoxicity and degranulation assays
The CytoTox96� non-radioactive cytotoxicity assay (Promega,Madison, WI, USA) measures release of lactate dehydrogenase(LDH) following cell lysis, was performed following manufacturer’sinstructions. Briefly, VV-specific T-cell lines established from12 months post-VV-vaccination were used as effectors withHLA-matched (HLA-DRB1⁄10:01:01 and 15:02:01) andHLA-mismatched (HLA-DRB1⁄04:05:01 and 07:01:01G) B-LCL astargets. B-LCL were incubated with 5 lg/mL peptide for 1.5 h at37 �C in 5% CO2, seeded into 96 well U-bottom plate at20,000 cells/well prior to addition of effector cells at differenteffector:target ratios in triplicate. Following 4 h incubation at37 �C in 5% CO2, supernatant was harvested and LDH release mea-sured from target cells. Assay controls included, media alone, LDHspontaneous release from target and effector cells and LDH maxi-mum release from target cells.
The CD107a degranulation assay was performed as described[26]. Briefly, HLA-matched and HLA-mismatched B-LCL were usedas antigen presenting cells (APC) and incubated with peptide asabove. VV-specific T-cell lines from 13-days (DPL) and 12 monthspost-vaccination (DPD and DPL) were incubated with B-LCL at dif-ferent effector:APC ratios with CD107a-APC mAb, diluted BFA andBD GolgiStop for 4 h at 37 �C in 5%CO2. Following 4 h incubation,cells were permeabilised, stained with mAbs of interest, fixed withPFA and analysed on 4-Laser LSRII flow-cytometer (BD), data anal-ysed using FlowJo (TreeStar).
2.13. Statistical analysis
Unpaired non-parametric Mann-Whitney test and Spearman’scorrelation were used. P-values <0.05 were considered statisticallysignificant. Prism 6 for Macintosh (GraphPad Software Inc., La Jolla,CA, USA) was used.
3. Results
3.1. Study participant characteristics
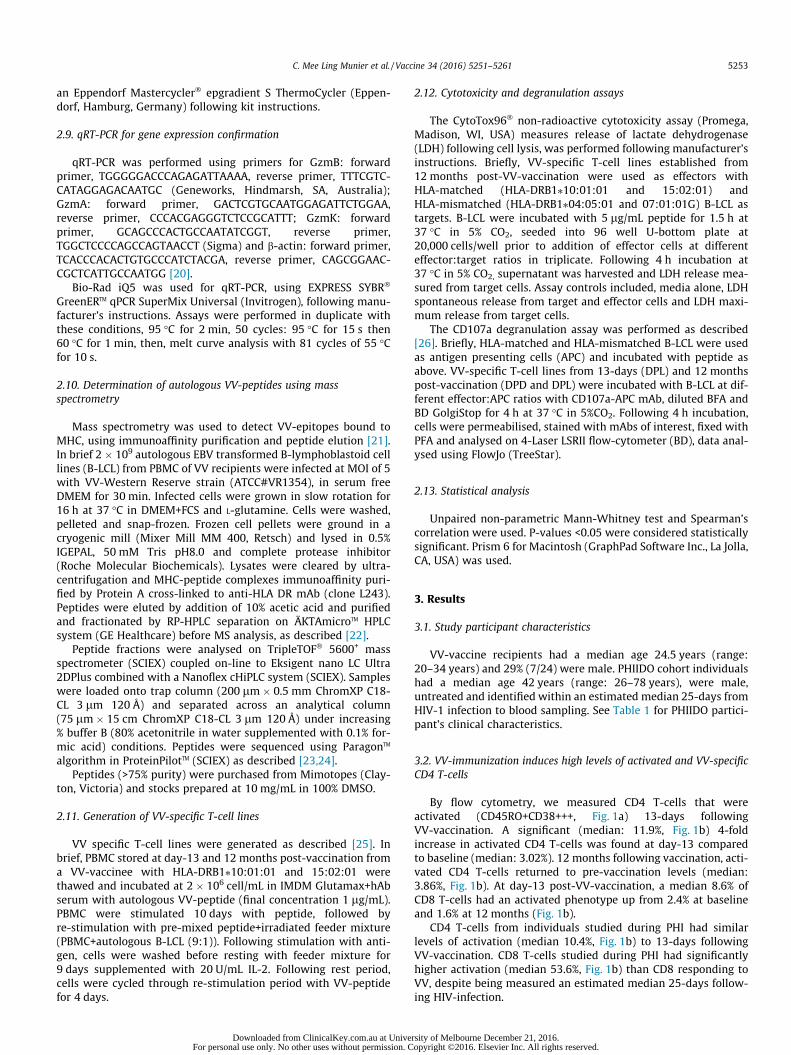
VV-vaccine recipients had a median age 24.5 years (range:20–34 years) and 29% (7/24) were male. PHIIDO cohort individualshad a median age 42 years (range: 26–78 years), were male,untreated and identified within an estimated median 25-days fromHIV-1 infection to blood sampling. See Table 1 for PHIIDO partici-pant’s clinical characteristics.
3.2. VV-immunization induces high levels of activated and VV-specificCD4 T-cells
By flow cytometry, we measured CD4 T-cells that wereactivated (CD45RO+CD38+++, Fig. 1a) 13-days followingVV-vaccination. A significant (median: 11.9%, Fig. 1b) 4-foldincrease in activated CD4 T-cells was found at day-13 comparedto baseline (median: 3.02%). 12 months following vaccination, acti-vated CD4 T-cells returned to pre-vaccination levels (median:3.86%, Fig. 1b). At day-13 post-VV-vaccination, a median 8.6% ofCD8 T-cells had an activated phenotype up from 2.4% at baselineand 1.6% at 12 months (Fig. 1b).
CD4 T-cells from individuals studied during PHI had similarlevels of activation (median 10.4%, Fig. 1b) to 13-days followingVV-vaccination. CD8 T-cells studied during PHI had significantlyhigher activation (median 53.6%, Fig. 1b) than CD8 responding toVV, despite being measured an estimated median 25-days follow-ing HIV-infection.
rsity of Melbourne December 21, 2016.opyright ©2016. Elsevier Inc. All rights reserved.
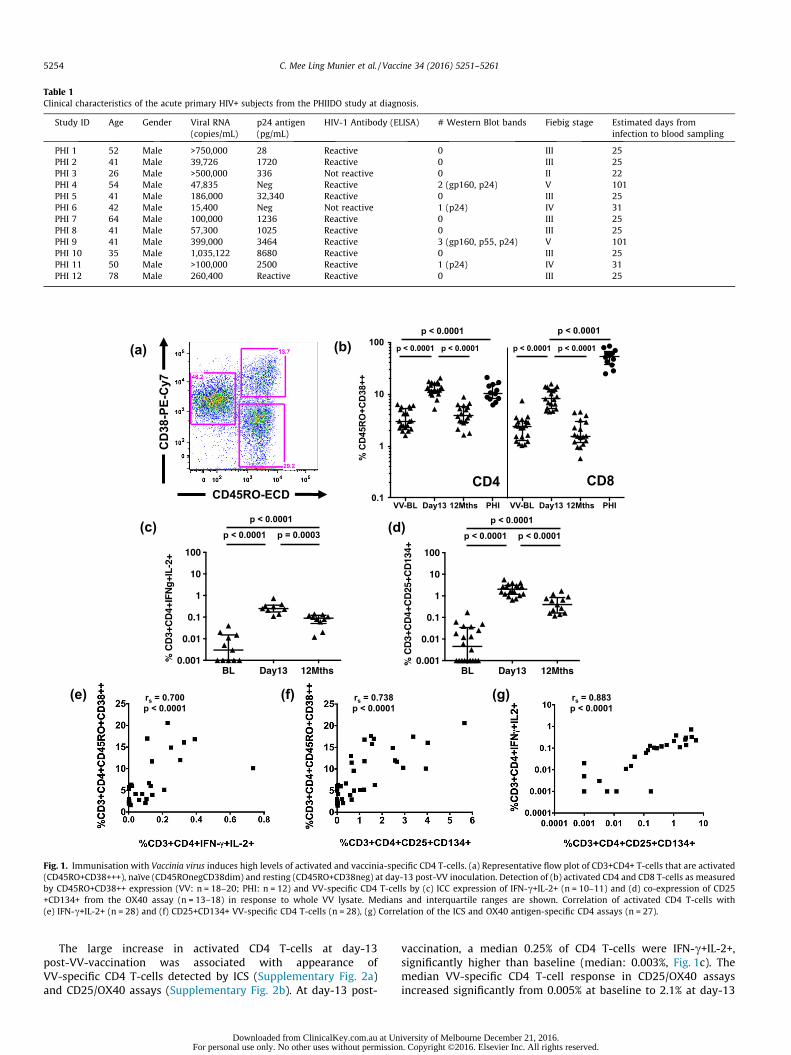
Table 1Clinical characteristics of the acute primary HIV+ subjects from the PHIIDO study at diagnosis.
Study ID Age Gender Viral RNA(copies/mL)
p24 antigen(pg/mL)
HIV-1 Antibody (ELISA) # Western Blot bands Fiebig stage Estimated days frominfection to blood sampling
PHI 1 52 Male >750,000 28 Reactive 0 III 25PHI 2 41 Male 39,726 1720 Reactive 0 III 25PHI 3 26 Male >500,000 336 Not reactive 0 II 22PHI 4 54 Male 47,835 Neg Reactive 2 (gp160, p24) V 101PHI 5 41 Male 186,000 32,340 Reactive 0 III 25PHI 6 42 Male 15,400 Neg Not reactive 1 (p24) IV 31PHI 7 64 Male 100,000 1236 Reactive 0 III 25PHI 8 41 Male 57,300 1025 Reactive 0 III 25PHI 9 41 Male 399,000 3464 Reactive 3 (gp160, p55, p24) V 101PHI 10 35 Male 1,035,122 8680 Reactive 0 III 25PHI 11 50 Male >100,000 2500 Reactive 1 (p24) IV 31PHI 12 78 Male 260,400 Reactive Reactive 0 III 25
(c) p < 0.0001
p < 0.0001 p < 0.0001
p < 0.0001 (d)
(e) rs = 0.700 p < 0.0001
(f) rs = 0.738 p < 0.0001
(g) rs = 0.883 p < 0.0001
p < 0.0001 p = 0.0003
(a)
CD
38-P
E-C
y7
CD45RO-ECD
(b)
VV-BL Day13 12Mths PHI VV-BL Day13 12Mths PHI0.1
1
10
100
% C
D45
RO
+CD
38++
CD4 CD8
p < 0.0001
p < 0.0001
p < 0.0001
p < 0.0001
p < 0.0001 p < 0.0001
Fig. 1. Immunisation with Vaccinia virus induces high levels of activated and vaccinia-specific CD4 T-cells. (a) Representative flow plot of CD3+CD4+ T-cells that are activated(CD45RO+CD38+++), naïve (CD45ROnegCD38dim) and resting (CD45RO+CD38neg) at day-13 post-VV inoculation. Detection of (b) activated CD4 and CD8 T-cells as measuredby CD45RO+CD38++ expression (VV: n = 18–20; PHI: n = 12) and VV-specific CD4 T-cells by (c) ICC expression of IFN-c+IL-2+ (n = 10–11) and (d) co-expression of CD25+CD134+ from the OX40 assay (n = 13–18) in response to whole VV lysate. Medians and interquartile ranges are shown. Correlation of activated CD4 T-cells with(e) IFN-c+IL-2+ (n = 28) and (f) CD25+CD134+ VV-specific CD4 T-cells (n = 28), (g) Correlation of the ICS and OX40 antigen-specific CD4 assays (n = 27).
5254 C. Mee Ling Munier et al. / Vaccine 34 (2016) 5251–5261
The large increase in activated CD4 T-cells at day-13post-VV-vaccination was associated with appearance ofVV-specific CD4 T-cells detected by ICS (Supplementary Fig. 2a)and CD25/OX40 assays (Supplementary Fig. 2b). At day-13 post-
Downloaded from ClinicalKey.com.au at UnFor personal use only. No other uses without permissio
vaccination, a median 0.25% of CD4 T-cells were IFN-c+IL-2+,significantly higher than baseline (median: 0.003%, Fig. 1c). Themedian VV-specific CD4 T-cell response in CD25/OX40 assaysincreased significantly from 0.005% at baseline to 2.1% at day-13
iversity of Melbourne December 21, 2016.n. Copyright ©2016. Elsevier Inc. All rights reserved.
Naive Act Eff Rest Mem0.1
1
10
100
%K
i-67+
p < 0.0001
p = 0.0003
p < 0.0001
Naive Act Eff Rest Mem0.1
1
10
100%
Bcl
2 lo
w
(c)p < 0.0001
p < 0.0001
p < 0.0001
Naive Act Eff Rest Mem0.1
1
10
100
%C
XCR
3+C
CR
6neg
(d) p = 0.0006
p = 0.0006
p = 0.0006
Naive Act Eff Rest Mem0.1
1
10
100
%T-
bet+
p < 0.0001
p = 0.0005
p < 0.0001 (e)
Naive Act Eff Rest Mem0.1
1
10
100
%EO
MES
+
p = 0.002 p = 0.007 (f)
(a)K
i-67-
FITC
Bcl-2-PE
CXC
R3-
ECD
CCR6-PB
T-
BET
-PE
EOMES-APC
(b)
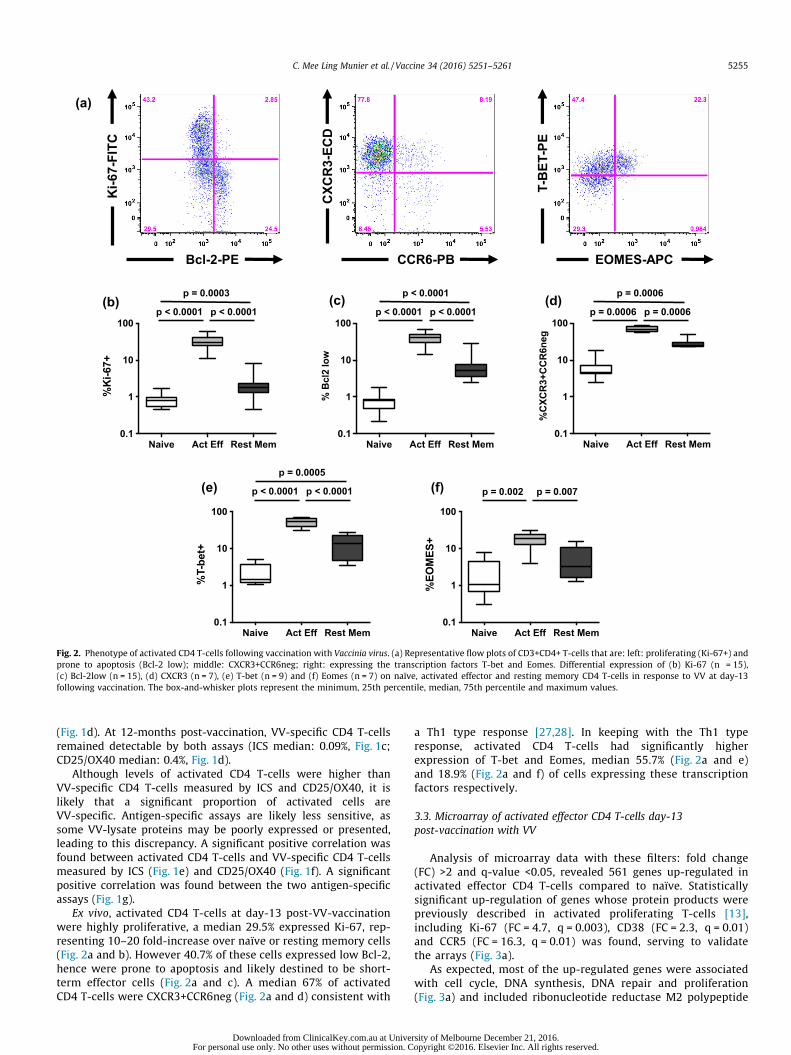
Fig. 2. Phenotype of activated CD4 T-cells following vaccination with Vaccinia virus. (a) Representative flow plots of CD3+CD4+ T-cells that are: left: proliferating (Ki-67+) andprone to apoptosis (Bcl-2 low); middle: CXCR3+CCR6neg; right: expressing the transcription factors T-bet and Eomes. Differential expression of (b) Ki-67 (n = 15),(c) Bcl-2low (n = 15), (d) CXCR3 (n = 7), (e) T-bet (n = 9) and (f) Eomes (n = 7) on naïve, activated effector and resting memory CD4 T-cells in response to VV at day-13following vaccination. The box-and-whisker plots represent the minimum, 25th percentile, median, 75th percentile and maximum values.
C. Mee Ling Munier et al. / Vaccine 34 (2016) 5251–5261 5255
(Fig. 1d). At 12-months post-vaccination, VV-specific CD4 T-cellsremained detectable by both assays (ICS median: 0.09%, Fig. 1c;CD25/OX40 median: 0.4%, Fig. 1d).
Although levels of activated CD4 T-cells were higher thanVV-specific CD4 T-cells measured by ICS and CD25/OX40, it islikely that a significant proportion of activated cells areVV-specific. Antigen-specific assays are likely less sensitive, assome VV-lysate proteins may be poorly expressed or presented,leading to this discrepancy. A significant positive correlation wasfound between activated CD4 T-cells and VV-specific CD4 T-cellsmeasured by ICS (Fig. 1e) and CD25/OX40 (Fig. 1f). A significantpositive correlation was found between the two antigen-specificassays (Fig. 1g).
Ex vivo, activated CD4 T-cells at day-13 post-VV-vaccinationwere highly proliferative, a median 29.5% expressed Ki-67, rep-resenting 10–20 fold-increase over naïve or resting memory cells(Fig. 2a and b). However 40.7% of these cells expressed low Bcl-2,hence were prone to apoptosis and likely destined to be short-term effector cells (Fig. 2a and c). A median 67% of activatedCD4 T-cells were CXCR3+CCR6neg (Fig. 2a and d) consistent with
Downloaded from ClinicalKey.com.au at UniveFor personal use only. No other uses without permission. C
a Th1 type response [27,28]. In keeping with the Th1 typeresponse, activated CD4 T-cells had significantly higherexpression of T-bet and Eomes, median 55.7% (Fig. 2a and e)and 18.9% (Fig. 2a and f) of cells expressing these transcriptionfactors respectively.
3.3. Microarray of activated effector CD4 T-cells day-13post-vaccination with VV
Analysis of microarray data with these filters: fold change(FC) >2 and q-value <0.05, revealed 561 genes up-regulated inactivated effector CD4 T-cells compared to naïve. Statisticallysignificant up-regulation of genes whose protein products werepreviously described in activated proliferating T-cells [13],including Ki-67 (FC = 4.7, q = 0.003), CD38 (FC = 2.3, q = 0.01)and CCR5 (FC = 16.3, q = 0.01) was found, serving to validatethe arrays (Fig. 3a).
As expected, most of the up-regulated genes were associatedwith cell cycle, DNA synthesis, DNA repair and proliferation(Fig. 3a) and included ribonucleotide reductase M2 polypeptide
rsity of Melbourne December 21, 2016.opyright ©2016. Elsevier Inc. All rights reserved.
p = 0.008
p = 0.008(d)
p = 0.008
p = 0.004(e)
p = 0.0002
p = 0.0002
p = 0.002
p = 0.0003
p = 0.02
p = 0.03
(f) p = 0.03
(a) (b)
Gzm
A-P
B
(c)
GzmK-PE
Gzm
B-A
F700
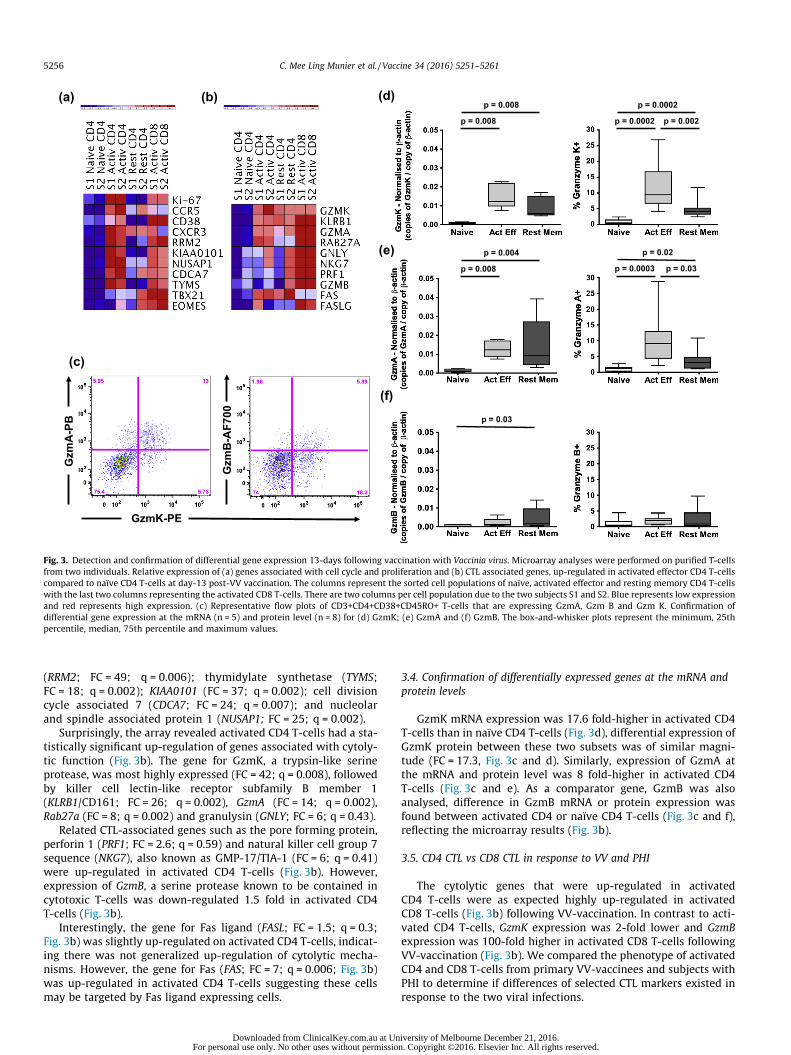
Fig. 3. Detection and confirmation of differential gene expression 13-days following vaccination with Vaccinia virus. Microarray analyses were performed on purified T-cellsfrom two individuals. Relative expression of (a) genes associated with cell cycle and proliferation and (b) CTL associated genes, up-regulated in activated effector CD4 T-cellscompared to naïve CD4 T-cells at day-13 post-VV vaccination. The columns represent the sorted cell populations of naïve, activated effector and resting memory CD4 T-cellswith the last two columns representing the activated CD8 T-cells. There are two columns per cell population due to the two subjects S1 and S2. Blue represents low expressionand red represents high expression. (c) Representative flow plots of CD3+CD4+CD38+CD45RO+ T-cells that are expressing GzmA, Gzm B and Gzm K. Confirmation ofdifferential gene expression at the mRNA (n = 5) and protein level (n = 8) for (d) GzmK; (e) GzmA and (f) GzmB. The box-and-whisker plots represent the minimum, 25thpercentile, median, 75th percentile and maximum values.
5256 C. Mee Ling Munier et al. / Vaccine 34 (2016) 5251–5261
(RRM2; FC = 49; q = 0.006); thymidylate synthetase (TYMS;FC = 18; q = 0.002); KIAA0101 (FC = 37; q = 0.002); cell divisioncycle associated 7 (CDCA7; FC = 24; q = 0.007); and nucleolarand spindle associated protein 1 (NUSAP1; FC = 25; q = 0.002).
Surprisingly, the array revealed activated CD4 T-cells had a sta-tistically significant up-regulation of genes associated with cytoly-tic function (Fig. 3b). The gene for GzmK, a trypsin-like serineprotease, was most highly expressed (FC = 42; q = 0.008), followedby killer cell lectin-like receptor subfamily B member 1(KLRB1/CD161; FC = 26; q = 0.002), GzmA (FC = 14; q = 0.002),Rab27a (FC = 8; q = 0.002) and granulysin (GNLY; FC = 6; q = 0.43).
Related CTL-associated genes such as the pore forming protein,perforin 1 (PRF1; FC = 2.6; q = 0.59) and natural killer cell group 7sequence (NKG7), also known as GMP-17/TIA-1 (FC = 6; q = 0.41)were up-regulated in activated CD4 T-cells (Fig. 3b). However,expression of GzmB, a serine protease known to be contained incytotoxic T-cells was down-regulated 1.5 fold in activated CD4T-cells (Fig. 3b).
Interestingly, the gene for Fas ligand (FASL; FC = 1.5; q = 0.3;Fig. 3b) was slightly up-regulated on activated CD4 T-cells, indicat-ing there was not generalized up-regulation of cytolytic mecha-nisms. However, the gene for Fas (FAS; FC = 7; q = 0.006; Fig. 3b)was up-regulated in activated CD4 T-cells suggesting these cellsmay be targeted by Fas ligand expressing cells.
Downloaded from ClinicalKey.com.au at UnFor personal use only. No other uses without permissio
3.4. Confirmation of differentially expressed genes at the mRNA andprotein levels
GzmK mRNA expression was 17.6 fold-higher in activated CD4T-cells than in naïve CD4 T-cells (Fig. 3d), differential expression ofGzmK protein between these two subsets was of similar magni-tude (FC = 17.3, Fig. 3c and d). Similarly, expression of GzmA atthe mRNA and protein level was 8 fold-higher in activated CD4T-cells (Fig. 3c and e). As a comparator gene, GzmB was alsoanalysed, difference in GzmB mRNA or protein expression wasfound between activated CD4 or naïve CD4 T-cells (Fig. 3c and f),reflecting the microarray results (Fig. 3b).
3.5. CD4 CTL vs CD8 CTL in response to VV and PHI
The cytolytic genes that were up-regulated in activatedCD4 T-cells were as expected highly up-regulated in activatedCD8 T-cells (Fig. 3b) following VV-vaccination. In contrast to acti-vated CD4 T-cells, GzmK expression was 2-fold lower and GzmBexpression was 100-fold higher in activated CD8 T-cells followingVV-vaccination (Fig. 3b). We compared the phenotype of activatedCD4 and CD8 T-cells from primary VV-vaccinees and subjects withPHI to determine if differences of selected CTL markers existed inresponse to the two viral infections.
iversity of Melbourne December 21, 2016.n. Copyright ©2016. Elsevier Inc. All rights reserved.
0
20
40
60
80
100
% P
ERFO
RIN
+
p < 0.0001 p = 0.005
p = 0.0006 (c)
0
20
40
60
80
100
% T
IA-1
+
p < 0.0001 p = 0.0004
p < 0.0001 (d)
0
20
40
60
80
100%
of P
ERFO
RIN
+ ex
pres
sing
Gzm
K
p = 0.002 p = 0.03
p = 0.0008 p = 0.006 (e)
0
20
40
60
80
100
% o
f TIA
+ ex
pres
sing
Gzm
K
p = 0.01 p < 0.0001
p = 0.0004 p < 0.0001 (f)
VV ACT CD4
VV ACT CD8
PHI ACT CD4
PHI ACT CD80
20
40
60
80
100
% o
f PER
FOR
IN+
expr
essi
ng G
zmB
p < 0.0001
p < 0.0001 (g)
VV ACT CD4
VV ACT CD8
PHI ACT CD4
PHI ACT CD80
20
40
60
80
100
% o
f TIA
+ ex
pres
sing
Gzm
B
p < 0.0001
p < 0.0001
p = 0.004 (h) TI
A-1-
ZEN
ON
-PB
PER
FOR
IN-P
E
GRANZYME K
(a)
(b)
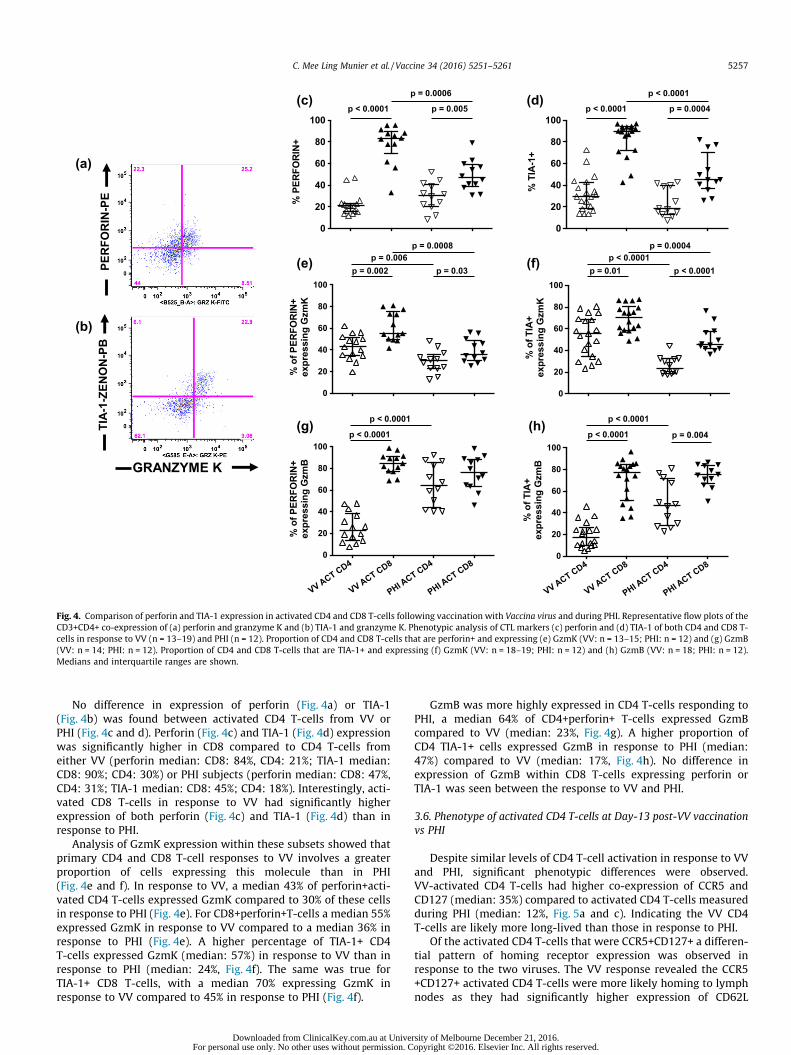
Fig. 4. Comparison of perforin and TIA-1 expression in activated CD4 and CD8 T-cells following vaccination with Vaccina virus and during PHI. Representative flow plots of theCD3+CD4+ co-expression of (a) perforin and granzyme K and (b) TIA-1 and granzyme K. Phenotypic analysis of CTL markers (c) perforin and (d) TIA-1 of both CD4 and CD8 T-cells in response to VV (n = 13–19) and PHI (n = 12). Proportion of CD4 and CD8 T-cells that are perforin+ and expressing (e) GzmK (VV: n = 13–15; PHI: n = 12) and (g) GzmB(VV: n = 14; PHI: n = 12). Proportion of CD4 and CD8 T-cells that are TIA-1+ and expressing (f) GzmK (VV: n = 18–19; PHI: n = 12) and (h) GzmB (VV: n = 18; PHI: n = 12).Medians and interquartile ranges are shown.
C. Mee Ling Munier et al. / Vaccine 34 (2016) 5251–5261 5257
No difference in expression of perforin (Fig. 4a) or TIA-1(Fig. 4b) was found between activated CD4 T-cells from VV orPHI (Fig. 4c and d). Perforin (Fig. 4c) and TIA-1 (Fig. 4d) expressionwas significantly higher in CD8 compared to CD4 T-cells fromeither VV (perforin median: CD8: 84%, CD4: 21%; TIA-1 median:CD8: 90%; CD4: 30%) or PHI subjects (perforin median: CD8: 47%,CD4: 31%; TIA-1 median: CD8: 45%; CD4: 18%). Interestingly, acti-vated CD8 T-cells in response to VV had significantly higherexpression of both perforin (Fig. 4c) and TIA-1 (Fig. 4d) than inresponse to PHI.
Analysis of GzmK expression within these subsets showed thatprimary CD4 and CD8 T-cell responses to VV involves a greaterproportion of cells expressing this molecule than in PHI(Fig. 4e and f). In response to VV, a median 43% of perforin+acti-vated CD4 T-cells expressed GzmK compared to 30% of these cellsin response to PHI (Fig. 4e). For CD8+perforin+T-cells a median 55%expressed GzmK in response to VV compared to a median 36% inresponse to PHI (Fig. 4e). A higher percentage of TIA-1+ CD4T-cells expressed GzmK (median: 57%) in response to VV than inresponse to PHI (median: 24%, Fig. 4f). The same was true forTIA-1+ CD8 T-cells, with a median 70% expressing GzmK inresponse to VV compared to 45% in response to PHI (Fig. 4f).
Downloaded from ClinicalKey.com.au at UniveFor personal use only. No other uses without permission. C
GzmB was more highly expressed in CD4 T-cells responding toPHI, a median 64% of CD4+perforin+ T-cells expressed GzmBcompared to VV (median: 23%, Fig. 4g). A higher proportion ofCD4 TIA-1+ cells expressed GzmB in response to PHI (median:47%) compared to VV (median: 17%, Fig. 4h). No difference inexpression of GzmB within CD8 T-cells expressing perforin orTIA-1 was seen between the response to VV and PHI.
3.6. Phenotype of activated CD4 T-cells at Day-13 post-VV vaccinationvs PHI
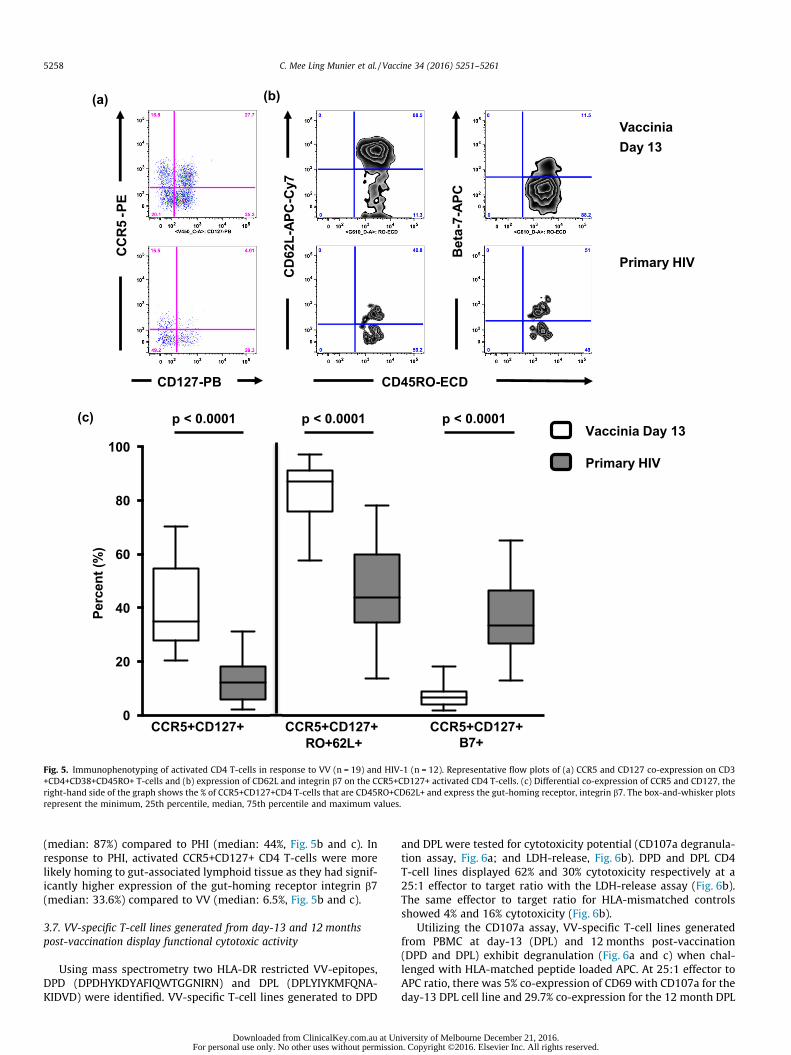
Despite similar levels of CD4 T-cell activation in response to VVand PHI, significant phenotypic differences were observed.VV-activated CD4 T-cells had higher co-expression of CCR5 andCD127 (median: 35%) compared to activated CD4 T-cells measuredduring PHI (median: 12%, Fig. 5a and c). Indicating the VV CD4T-cells are likely more long-lived than those in response to PHI.
Of the activated CD4 T-cells that were CCR5+CD127+ a differen-tial pattern of homing receptor expression was observed inresponse to the two viruses. The VV response revealed the CCR5+CD127+ activated CD4 T-cells were more likely homing to lymphnodes as they had significantly higher expression of CD62L
rsity of Melbourne December 21, 2016.opyright ©2016. Elsevier Inc. All rights reserved.
CCR5+CD127+ CCR5+CD127+CCR5+CD127+ RO+62L+ B7+
0
20
40
60
80
100
Perc
ent (
%)
Vaccinia Day 13
Primary HIV
p < 0.0001 p < 0.0001 p < 0.0001 (c)
Vaccinia Day 13
Primary HIV
(a)
CD127-PB
CC
R5
-PE
(b)
C
D62
L-AP
C-C
y7
B
eta-
7-AP
C
CD45RO-ECD
Fig. 5. Immunophenotyping of activated CD4 T-cells in response to VV (n = 19) and HIV-1 (n = 12). Representative flow plots of (a) CCR5 and CD127 co-expression on CD3+CD4+CD38+CD45RO+ T-cells and (b) expression of CD62L and integrin b7 on the CCR5+CD127+ activated CD4 T-cells. (c) Differential co-expression of CCR5 and CD127, theright-hand side of the graph shows the % of CCR5+CD127+CD4 T-cells that are CD45RO+CD62L+ and express the gut-homing receptor, integrin b7. The box-and-whisker plotsrepresent the minimum, 25th percentile, median, 75th percentile and maximum values.
5258 C. Mee Ling Munier et al. / Vaccine 34 (2016) 5251–5261
(median: 87%) compared to PHI (median: 44%, Fig. 5b and c). Inresponse to PHI, activated CCR5+CD127+ CD4 T-cells were morelikely homing to gut-associated lymphoid tissue as they had signif-icantly higher expression of the gut-homing receptor integrin b7(median: 33.6%) compared to VV (median: 6.5%, Fig. 5b and c).
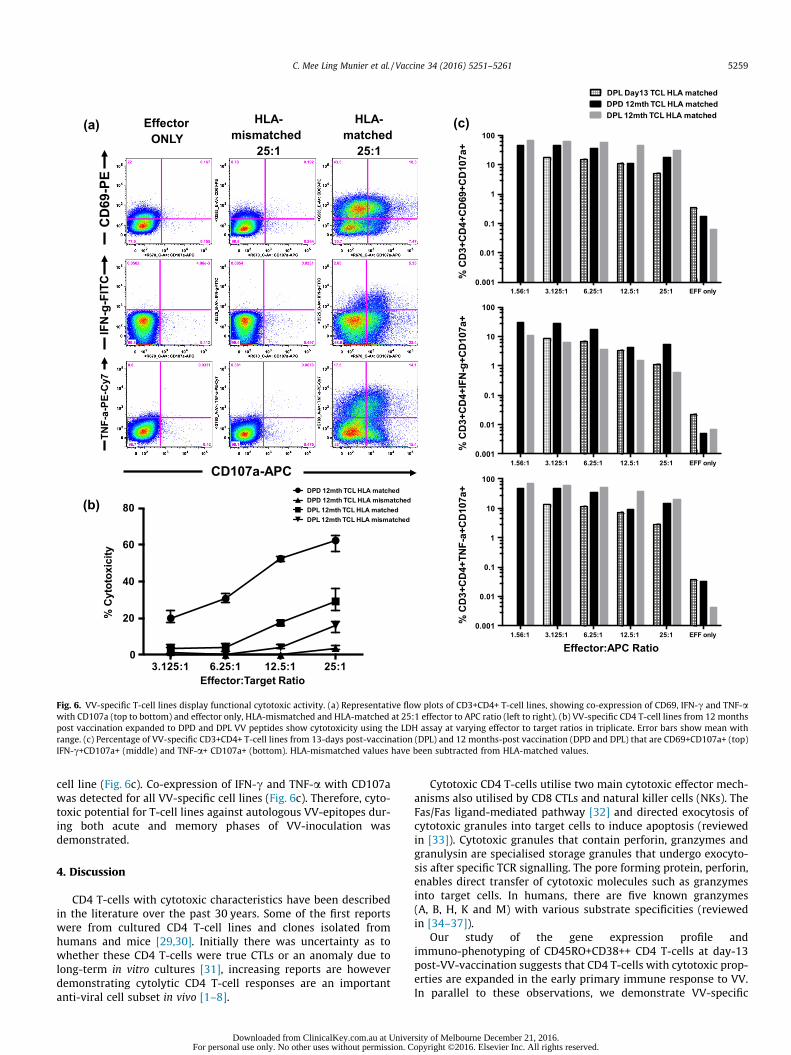
3.7. VV-specific T-cell lines generated from day-13 and 12 monthspost-vaccination display functional cytotoxic activity
Using mass spectrometry two HLA-DR restricted VV-epitopes,DPD (DPDHYKDYAFIQWTGGNIRN) and DPL (DPLYIYKMFQNA-KIDVD) were identified. VV-specific T-cell lines generated to DPD
Downloaded from ClinicalKey.com.au at UnFor personal use only. No other uses without permissio
and DPL were tested for cytotoxicity potential (CD107a degranula-tion assay, Fig. 6a; and LDH-release, Fig. 6b). DPD and DPL CD4T-cell lines displayed 62% and 30% cytotoxicity respectively at a25:1 effector to target ratio with the LDH-release assay (Fig. 6b).The same effector to target ratio for HLA-mismatched controlsshowed 4% and 16% cytotoxicity (Fig. 6b).
Utilizing the CD107a assay, VV-specific T-cell lines generatedfrom PBMC at day-13 (DPL) and 12 months post-vaccination(DPD and DPL) exhibit degranulation (Fig. 6a and c) when chal-lenged with HLA-matched peptide loaded APC. At 25:1 effector toAPC ratio, there was 5% co-expression of CD69 with CD107a for theday-13 DPL cell line and 29.7% co-expression for the 12 month DPL
iversity of Melbourne December 21, 2016.n. Copyright ©2016. Elsevier Inc. All rights reserved.
Effector ONLY
(a) HLA- matched
25:1
HLA- mismatched
25:1
C
D69
-PE
I
FN-g
-FIT
C
CD107a-APC
T
NF-
a-PE
-Cy7
0.001
0.01
0.1
1
10
100
% C
D3+
CD
4+C
D69
+CD
107a
+
DPL Day13 TCL HLA matchedDPD 12mth TCL HLA matchedDPL 12mth TCL HLA matched
0.001
0.01
0.1
1
10
100
% C
D3+
CD
4+IF
N-g
+CD
107a
+
1.56:1 3.125:1 6.25:1 12.5:1 25:1 EFF only
1.56:1 3.125:1 6.25:1 12.5:1 25:1 EFF only
1.56:1 3.125:1 6.25:1 12.5:1 25:1 EFF only0.001
0.01
0.1
1
10
100
% C
D3+
CD
4+TN
F-a+
CD
107a
+
(c)
Effector:APC Ratio 3.125:1 6.25:1 12.5:1 25:1
0
20
40
60
80
% C
ytot
oxic
ity
(b)
Effector:Target Ratio
DPD 12mth TCL HLA matched
DPL 12mth TCL HLA matchedDPD 12mth TCL HLA mismatched
DPL 12mth TCL HLA mismatched
Fig. 6. VV-specific T-cell lines display functional cytotoxic activity. (a) Representative flow plots of CD3+CD4+ T-cell lines, showing co-expression of CD69, IFN-c and TNF-awith CD107a (top to bottom) and effector only, HLA-mismatched and HLA-matched at 25:1 effector to APC ratio (left to right). (b) VV-specific CD4 T-cell lines from 12 monthspost vaccination expanded to DPD and DPL VV peptides show cytotoxicity using the LDH assay at varying effector to target ratios in triplicate. Error bars show mean withrange. (c) Percentage of VV-specific CD3+CD4+ T-cell lines from 13-days post-vaccination (DPL) and 12 months-post vaccination (DPD and DPL) that are CD69+CD107a+ (top)IFN-c+CD107a+ (middle) and TNF-a+ CD107a+ (bottom). HLA-mismatched values have been subtracted from HLA-matched values.
C. Mee Ling Munier et al. / Vaccine 34 (2016) 5251–5261 5259
cell line (Fig. 6c). Co-expression of IFN-c and TNF-a with CD107awas detected for all VV-specific cell lines (Fig. 6c). Therefore, cyto-toxic potential for T-cell lines against autologous VV-epitopes dur-ing both acute and memory phases of VV-inoculation wasdemonstrated.
4. Discussion
CD4 T-cells with cytotoxic characteristics have been describedin the literature over the past 30 years. Some of the first reportswere from cultured CD4 T-cell lines and clones isolated fromhumans and mice [29,30]. Initially there was uncertainty as towhether these CD4 T-cells were true CTLs or an anomaly due tolong-term in vitro cultures [31], increasing reports are howeverdemonstrating cytolytic CD4 T-cell responses are an importantanti-viral cell subset in vivo [1–8].
Downloaded from ClinicalKey.com.au at UniveFor personal use only. No other uses without permission. C
Cytotoxic CD4 T-cells utilise two main cytotoxic effector mech-anisms also utilised by CD8 CTLs and natural killer cells (NKs). TheFas/Fas ligand-mediated pathway [32] and directed exocytosis ofcytotoxic granules into target cells to induce apoptosis (reviewedin [33]). Cytotoxic granules that contain perforin, granzymes andgranulysin are specialised storage granules that undergo exocyto-sis after specific TCR signalling. The pore forming protein, perforin,enables direct transfer of cytotoxic molecules such as granzymesinto target cells. In humans, there are five known granzymes(A, B, H, K and M) with various substrate specificities (reviewedin [34–37]).
Our study of the gene expression profile andimmuno-phenotyping of CD45RO+CD38++ CD4 T-cells at day-13post-VV-vaccination suggests that CD4 T-cells with cytotoxic prop-erties are expanded in the early primary immune response to VV.In parallel to these observations, we demonstrate VV-specific
rsity of Melbourne December 21, 2016.opyright ©2016. Elsevier Inc. All rights reserved.
5260 C. Mee Ling Munier et al. / Vaccine 34 (2016) 5251–5261
CD4 T-cell lines up-regulate the machinery of cytotoxic degranula-tion and subsequently lyse HLA-matched target cells, loaded withautologous VV-peptides. Moreover, this CTL activity is carried fromacute VV replication (day-13) into the quiescent memory T-cellphase.
We show activated CD4 T-cells express high levels of GzmK13-days post-VV-vaccination. GzmK has previously been reportedto play a role in CD8 T-cell responses to viral infections includingFlu, CMV, EBV, HIV and dengue fever [38–40]. In our study, CD4and CD8 T-cells expressing perforin or TIA-1 in response to VVwere shown to have higher co-expression of GzmK than those cellsresponding to PHI. In contrast, GzmB was more highly expressed inCD4 T-cells responding to PHI. The divergent expression of GzmBand GzmK in response to these two viral infections may be dueto the time point these cells were measured post infection (VV:day-13; PHI: median 25-days) or the differentiation stage of thesecells as has been previously reported for CD8 T-cells [38,40].
We speculate that activated CD4 T-cells in response to VVin vivo could use these CTL molecules in a coordinated fashion totrigger apoptosis in target cells that express major histocompati-bility complex class II molecules for recognition. Likely targetsare antigen-presenting cells such as dendritic cells, monocytes,macrophages and B cells or even other CD4 cells. It is plausible thatGzmK expressing activated CD4 T-cells play a role in immune reg-ulation and perhaps represent another form of regulatory T-cells.
Cytotoxic markers such as those discussed here have beenextensively studied in CD8 CTL and NKs (reviewed in [41]). Impor-tantly, these markers of cytotoxicity are clearly associated in mur-ine models of viral infection with transient activated effectorphenotype CD8 T-cells that eventually become long-term memorycells [42,43]. It is plausible these markers are similarly expressedin the differentiation pathway of human anti-viral memory CD4T-cells.
This is the first description of CD4 CTL playing a role in the pri-mary immune response to VV. The data presented suggests thatCD4 T-cells expressing CTL molecules may be important in deter-mining the nature and effectiveness of the eventual immuneresponse. Understanding the role of this distinct CD4 T-cell subsetin the generation of effective memory may lead us closer to thedevelopment of more effective vaccines for diseases such as HIV.
Conflict of interest
The authors declare no conflict of interest.
Acknowledgements
Members of the PHIIDO study group are: Robert McFarlane,David Baker, Marilyn McMurchie at East Sydney Doctors, MarkBoyd, Andrew Carr, Anthony Kelleher at St Vincent’s Hospital Syd-ney, Mark Bloch at Holdsworth House Medical Practice, RobertFinalyson at Taylor Square Private Clinic, Derek Chan at AlbionStreet Clinic, and Pat Grey, Ansari Shaik The Kirby Institute, UNSWAustralia, Sydney, New South Wales, Australia.
The authors would like to thank the VV vaccine volunteers whoparticipated in this study, the PHIIDOpatients, the clinical trials teamat St Vincent’s Centre for Applied Medical Research, Bertha Fsadni,Maria Piperias, Julie Yeung and Kate Merlin for PBMC processingand storage, Ken Field for help with cell sorting, Trina So for helpwith microarrays, Wayne Dyer for vaccinia viral lysate, CharaniRanasinghe and Tamara Cooper for help with subject recruitmentand Thakshila Amarasena for help with blood collection.
This work was supported by grants from the AustralianNational Health and Medical Research Council (351041 to CMLM,510448 to DAC, SJK and ADK, 1052979 to DAC, SJK and ADK).
Downloaded from ClinicalKey.com.au at UnFor personal use only. No other uses without permissio
Appendix A. Supplementary material
Supplementary data associated with this article can be found, inthe online version, at http://dx.doi.org/10.1016/j.vaccine.2016.09.009.
References
[1] Appay V, Zaunders JJ, Papagno L, Sutton J, Jaramillo A, Waters A, et al.Characterization of CD4(+) CTLs ex vivo. J Immunol 2002;168:5954–8.
[2] Zaunders JJ, Dyer WB, Wang B, Munier ML, Miranda-Saksena M, Newton R,et al. Identification of circulating antigen-specific CD4+ T lymphocytes with aCCR5+, cytotoxic phenotype in an HIV-1 long-term nonprogressor and in CMVinfection. Blood 2004;103:2238–47.
[3] Soghoian D, Jessen H, Flanders M, Sierra-Davidson K, Cutler S, Pertel T, et al.HIV-specific cytolytic CD4 T cell responses during acute HIV infection predictdisease outcome. Sci Transl Med 2012;4. 123ra25.
[4] Johnson S, Eller M, Teigler JE, Maloveste SM, Schultz BT, Soghoian DZ, et al.Cooperativity of HIV-specific cytolytic CD4 T cells and CD8 T cells in control ofHIV viremia. J Virol 2015;89:7494–505.
[5] Suni M, Ghanekar S, Houck D, Maecker H, Wormsley S, Picker L, et al. CD4(+)CD8(dim) T lymphocytes exhibit enhanced cytokine expression, proliferationand cytotoxic activity in response to HCMV and HIV-1 antigens. Eur J Immunol2001;31:2512–20.
[6] van Leeuwen E, Remmerswaal E, Vossen M, Rowshani A, Wertheim-van DillenP, van Lier R, et al. Emergence of a CD4+CD28-granzyme B+, cytomegalovirus-specific T cell subset after recovery of primary cytomegalovirus infection. JImmunol 2004;173:1834–41.
[7] Omiya R, Buteau C, Kobayashi H, Paya C, Celis E. Inhibition of EBV-inducedlymphoproliferation by CD4(+) T cells specific for an MHC class II promiscuousepitope. J Immunol 2002;169:2172–9.
[8] Aslan N, Yurdaydin C, Wiegand J, Greten T, Ciner A, Meyer M, et al. CytotoxicCD4 T cells in viral hepatitis. J Viral Hepat 2006;13:505–14.
[9] Wahid R, Cannon M, Chow M. Virus-specific CD4+ and CD8+ cytotoxic T-cellresponses and long-term T-cell memory in individuals vaccinated againstpolio. J Virol 2005;79:5988–95.
[10] de Souza M, Ratto-Kim S, Chuenarom W, Schuetz A, Chantakulkij S, NuntapinitB, et al. The Thai phase III trial (RV144) vaccine regimen induces T cellresponses that preferentially target epitopes within the V2 region of HIV-1envelope. J Immunol 2012;188:5166–76.
[11] Sacha J, Giraldo-Vela J, Buechler M, Martins M, Maness N, Chung C, et al. Gag-and Nef-specific CD4+ T cells recognize and inhibit SIV replication in infectedmacrophages early after infection. Proc Natl Acad Sci USA 2009;106:9791–6.
[12] Demkowicz WJ, Littaua R, Wang J, Ennis F. Human cytotoxic T-cell memory:long-lived responses to Vaccinia virus. J Virol 1996;70:2627–31.
[13] Zaunders JJ, Dyer WB, Munier ML, Ip S, Liu J, Amyes E, et al. CD127+CCR5+CD38+++ CD4+ Th1 effector cells are an early component of the primary immuneresponse to Vaccinia virus and precede development of interleukin-2+ memoryCD4+ T cells. J Virol 2006;80:10151–61.
[14] Zaunders JJ, Ip S, Munier ML, Kaufmann DE, Suzuki K, Brereton C, et al.Infection of CD127+ (interleukin-7 receptor+) CD4+ cells and overexpressionof CTLA-4 are linked to loss of antigen-specific CD4 T cells during primaryhuman immunodeficiency virus type 1 infection. J Virol 2006;80:10162–72.
[15] Munier C, Zaunders J, Ip S, Cooper D, Kelleher A. A culture amplified multi-parametric intracellular cytokine assay (CAMP-ICC) for enhanced detection ofantigen specific T-cell responses. J Immunol Methods 2009;345:1–16.
[16] Zaunders J, Munier M, Seddiki N, Pett S, Ip S, Bailey M, et al. High levels ofhuman antigen-specific CD4+ T cells in peripheral blood revealed bystimulated coexpression of CD25 and CD134 (OX40). J Immunol2009;183:2827–36.
[17] Baugh L, Hill A, Brown E, Hunter C. Quantitative analysis of mRNAamplification by in vitro transcription. Nucleic Acids Res 2001;29:E29.
[18] Reich M, Liefeld T, Gould J, Lerner J, Tamayo P, Mesirov JP. GenePattern 2.0. NatGenet 2006;38:500–1.
[19] Wettenhall JM, Smyth GK. LimmaGUI: a graphical user interface for linearmodeling of microarray data. Bioinformatics 2004;20:3705–6.
[20] Suzuki K, Shijuuku T, Fukamachi T, Zaunders J, Guillemin G, Cooper D, et al.Prolonged transcriptional silencing and CpG methylation induced by siRNAstargeted to the HIV-1 promoter region. J RNAi Gene Silencing 2005;1:66–78.
[21] Dudek NL, Croft NP, Schittenhelm RB, Ramarathinam SH, Purcell AW. Asystems approach to understand antigen presentation and the immuneresponse. Methods Mol Biol 2016;1394:189–209.
[22] Croft NP, Smith SA, Wong YC, Tan CT, Dudek NL, Flesch IE, et al. Kinetics ofantigen expression and epitope presentation during virus infection. PLoSPathog 2013;9:e1003129.
[23] Shilov IV, Seymour SL, Patel AA, Loboda A, Tang WH, Keating SP, et al. Theparagon algorithm, a next generation search engine that uses sequencetemperature values and feature probabilities to identify peptides from tandemmass spectra. Mol Cell Proteomics 2007;6:1638–55.
[24] Illing PT, Vivian JP, Dudek NL, Kostenko L, Chen Z, Bharadwaj M, et al. Immuneself-reactivity triggered by drug-modified HLA-peptide repertoire. Nature2012;486:554–8.
iversity of Melbourne December 21, 2016.n. Copyright ©2016. Elsevier Inc. All rights reserved.
C. Mee Ling Munier et al. / Vaccine 34 (2016) 5251–5261 5261
[25] Yssel H, Spits H. Generation and maintenance of cloned human T cell lines.Curr Protoc Immunol 2002. Chapter 7: Unit 7 19.
[26] Betts MR, Koup RA. Detection of T-cell degranulation: CD107a and b. MethodsCell Biol 2004;75:497–512.
[27] Sallusto F, Lenig D, Mackay CR, Lanzavecchia A. Flexible programs ofchemokine receptor expression on human polarized T helper 1 and 2lymphocytes. J Exp Med 1998;187:875–83.
[28] Bonecchi R, Bianchi G, Bordignon PP, D’Ambrosio D, Lang R, Borsatti A, et al.Differential expression of chemokine receptors and chemotacticresponsiveness of type 1 T helper cells (Th1s) and Th2s. J Exp Med1998;187:129–34.
[29] Billings P, Burakoff S, Dorf M, Benacerraf B. Cytotoxic T lymphocytes specificfor I region determinants do not require interactions with H-2K or D geneproducts. J Exp Med 1977;145:1387–92.
[30] Maimone M, Morrison L, Braciale V, Braciale T. Features of target cell lysis byclass I and class II MHC-restricted cytolytic T lymphocytes. J Immunol1986;137:3639–43.
[31] Fleischer B. Acquisition of specific cytotoxic activity by human T4+ Tlymphocytes in culture. Nature 1984;308:365–7.
[32] Kischkel F, Hellbardt S, Behrmann I, Germer M, Pawlita M, Krammer P, et al.Cytotoxicity-dependent APO-1 (Fas/CD95)-associated proteins form a death-inducing signaling complex (DISC) with the receptor. EMBO J1995;14:5579–88.
[33] Trapani J, Smyth M. Functional significance of the perforin/granzyme celldeath pathway. Nat Rev Immunol 2002;2:735–47.
Downloaded from ClinicalKey.com.au at UniveFor personal use only. No other uses without permission. C
[34] Chowdhury D, Lieberman J. Death by a thousand cuts: granzyme pathways ofprogrammed cell death. Annu Rev Immunol 2008;26:389–420.
[35] Cullen S, Brunet M, Martin S. Granzymes in cancer and immunity. Cell DeathDiffer 2010;17:616–23.
[36] Anthony D, Andrews D, Watt S, Trapani J, Smyth M. Functional dissection ofthe granzyme family: cell death and inflammation. Immunol Rev2010;235:73–92.
[37] Bovenschen N, Kummer J. Orphan granzymes find a home. Immunol Rev2010;235:117–27.
[38] Harari A, Enders F, Cellerai C, Bart P, Pantaleo G. Distinct profiles of cytotoxicgranules in memory CD8 T cells correlate with function, differentiation stage,and antigen exposure. J Virol 2009;83:2862–71.
[39] Hertoghs K, Moerland P, van Stijn A, Remmerswaal E, Yong S, van de Berg P,et al. Molecular profiling of cytomegalovirus-induced human CD8+ T celldifferentiation. J Clin Invest 2010;120:4077–90.
[40] Bratke K, Kuepper M, Bade B, Virchow JJ, Luttmann W. Differential expressionof human granzymes A, B, and K in natural killer cells and during CD8+ T celldifferentiation in peripheral blood. Eur J Immunol 2005;35:2608–16.
[41] Barry M, Bleackley R. Cytotoxic T lymphocytes: all roads lead to death. Nat RevImmunol 2002;2:401–9.
[42] Opferman J, Ober B, Ashton-Rickardt P. Linear differentiation of cytotoxiceffectors into memory T lymphocytes. Science 1999;283:1745–8.
[43] Jacob J, Baltimore D. Modelling T-cell memory by genetic marking of memoryT cells in vivo. Nature 1999;399:593–7.
rsity of Melbourne December 21, 2016.opyright ©2016. Elsevier Inc. All rights reserved.