the prince edward island ecological footprint - gpi atlantic
TRANSCRIPT

MEASURING SUSTAINABLE DEVELOPMENT
APPLICATION OF THE GENUINE PROGRESS INDEX TO ATLANTIC CANADA
THE PRINCE EDWARD ISLANDECOLOGICAL FOOTPRINT
Prepared for the Province of Prince Edward Island
byAnne Monette, MES
Ronald Colman, Ph.DJeffrey Wilson, BES
September 2003

GENUINE PROGRESS INDEX ii Measuring Sustainable Development
EXECUTIVE SUMMARY
Small Province, Big Feet: Prince Edward Island’s Ecological Footprint
Development that is “sustainable” requires that:
1) we do not consume more resources than the planet can provide, and that we do notproduce more waste than the planet can assimilate;
2) we live in such a way that we meet the needs of the present without compromising theability of future generations to meet their needs; and
3) we do not consume resources at the expense of others’ basic survival and livelihood.
In other words, “sustainable development” requires that we live responsibly and with awareness,so as not to deplete our natural wealth and leave a poorer world for our children and others toinherit.
Measurements of sustainable development generally look at the “supply” side of the equation –whether we are harvesting our fish, logging our forests, and growing our food in sustainableways. But such measurements put the whole onus for sustainable development on the producer.The “ecological footprint” looks at the “demand” side of the equation and places theresponsibility for sustainable development equally on the consumer. The Nova Scotia GenuineProgress Index, a pilot project for Canada that includes 22 environmental, social and economiccomponents, measures sustainable development in both these ways.
How we eat, shop, travel, use energy and build our houses directly affects the environment.Almost everything we do consumes natural resources and produces waste. Our ecologicalfootprint is the amount of space we take up, or the amount of land and sea area it takes to meetour current levels of consumption. It tells us what impact our consumption patterns have on theenvironment and whether we are exceeding the capacity of the environment to satisfy our wants.
The world has a limited supply of productive land for growing food and timber, limited suppliesof fish, finite quantities of oil, gas, metals and other non-renewable resources, and a limitedcapacity to absorb waste. If we overload the earth’s capacities, or use up resources faster thanthey can replenish themselves, then the natural systems that support life on earth break down.
Living Beyond our Means
Scientists tell us that if we want to survive, we can’t use all the world’s productive land entirelyfor our own needs, and they suggest that at least 30% of land needs protection. World leadershave committed to set aside just 12% of our land to protect the millions of other species on theplanet, on whom our survival ultimately depends. If we set aside that 12% to protect biodiversity,and divide the remaining 88% of biologically productive area by the current world population,then we have 1.7 hectares (ha) per person to supply all our human needs and assimilate all ourwaste.

GENUINE PROGRESS INDEX iii Measuring Sustainable Development
Researchers at Redefining Progress have found that our global resource consumption and wasteproduction required 2.28 hectares per person in 1999. That is the average “ecological footprint”of a human being in the world today. In other words, human beings are in a state of “overshoot,”depleting resources faster than they can regenerate and producing more waste than the world canhandle.
This is like living in debt, with a gradually accumulating ecological deficit. Just as the presentgeneration is paying for over-spending in the 1970s and 1980s with reduced governmentservices, so future generations will inherit the ecological debt of current ecological overshoot.We may have already begun to see its effects in the collapse of Atlantic ground-fish stocks,global climate change, higher child asthma rates, and new environmental illnesses.
But all ecological footprints are not the same size. Thirty-two percent of the world’s populationconsumes 70% of the world’s resources, and produces 70% of the world’s waste. The averageAfrican ecological footprint was just 1.36 ha per person in 1999, and the average NorthAmerican footprint was 9.61 ha per person in 1999. The richest one-fifth of the world’s peopleconsumes 45% of all meat and fish, 58% of all energy and 84% of all paper, and it owns 87% ofall cars. The poorest one-fifth consumes just 5% of all meat and fish, less than 4% of energy,1.1% of paper, and less than 1% of all cars.
This GPIAtlantic report has found that Prince Edward Island’s average ecologicalfootprint in 1999 was 8.98 ha per person, far in excess of the 1.7 ha per person globallyavailable. If all the world’s people were to consume at PEI levels, we would need almostfive planets earth to provide the necessary resources and waste assimilation capacity.Ecological footprint analysis therefore makes it clear that global ecological sustainabilitydepends on the affluent reducing their present share of consumption so that those in poverty canmeet their basic human needs.
Of this 8.98 ha/capita, energy consumption accounts for 4.29 ha/capita, food for 3.49 ha/capita,and all other consumption for the remaining 1.2 ha/capita. Energy and food consumptiontogether account for 7.78 hectares per person or 87% of the average Prince Edward Islander'secological footprint. It is within these two areas that Prince Edward Islanders can make thegreatest reductions in their personal footprint and help lead Prince Edward Island toward ahealthy, sustainable future. These two areas should also be the primary focus of social andeconomic policy attention to guide Prince Edward Island toward sustainable transportation, landuse and consumption patterns.
Just as global ecological footprints differ, not all PEI ecological footprints are the same size.Charlottetown-Summerside residents have an average footprint of 8.30 ha per person, and thewealthiest 20% of Prince Edward Islanders have a footprint of 11.4 ha per person (compared to7.63 ha per person for the poorest 20%), because the wealthy consume more resources andproduce more waste.
The PEI ecological footprint has grown by 65% in the last 20 years, and is projected to increaseby another 20% to 10.8 ha per person in the next 20 years. PEI’s transportation footprint isexpected to increase by 24% in the next 20 years, as more cars log more kilometres. The increase

GENUINE PROGRESS INDEX iv Measuring Sustainable Development
in fuel-inefficient SUVs, minivans and light trucks has expanded the transportation footprintsharply, with one SUV averaging three times the impact on the environment of a small car.
Conventionally, gross domestic product (GDP) growth is taken as the primary indicator of how"well off" we are as a society, with a higher per capita GDP denoting higher consumption levelsand greater wellbeing. From the GPI perspective, on the other hand, a smaller ecologicalfootprint denotes less impact on the environment and correspondingly greater long-termwellbeing and sustainability. The GDP and the ecological footprint, however, are not simplyseparate indicator sets pointing towards contrasting assessment and measurement systems.Economic growth is the primary driver of ecological footprint growth, because it generallydenotes higher consumption levels.
Not surprisingly, the Canadian and Prince Edward Island per capita ecological footprints havelargely followed per capita GDP growth since the late 1980s, with both inclining upwardsthrough the 1990s. In conventional terms it is almost heresy to suggest that this growth is notinherently a “good” thing. Ecological footprint analysis, however, suggests that the morecomplex relationship between economic growth, increased consumption, environmentaldegradation, waste production, and the rate of resource depletion must at least be considered if asmuch value is placed on the wellbeing of future generations as is placed on the currentgeneration.
Reducing Prince Edward Island’s Ecological Footprint: A Quarter Million Hectare Targetfor 2005
This report, Canada’s third provincial ecological footprint analysis, concludes that PrinceEdward Islanders could quickly and easily reduce their collective ecological footprint by almostone quarter of a million hectares from 8.98 ha per person to 7 ha per person withoutcompromising their quality of life. Consuming fewer of some items, shifting certain consumptionchoices, and changing public policy priorities can actually improve wellbeing and quality of lifewhile reducing our impact on the environment.
There are a number of practical choices available to households that could significantly reducethe province's residential energy footprint. Indeed, household energy consumption choices areone of the simplest ways that ordinary citizens can reduce their ecological footprint and savemoney. A few intelligent energy choices can reduce household energy consumption by 50% andsave significantly on household energy costs:
• Switch to a time based-programmable thermostat and turn down the thermostat at night to17 degrees
• Switch to halogen bulbs or compact fluorescent bulbs• Install a low flow shower head• Switch to energy efficient appliances• Add an insulating blanket to hot water heater• Clean furnace filter regularly

GENUINE PROGRESS INDEX v Measuring Sustainable Development
Changes to driving style and driver education can significantly reduce the footprint oftransportation, as well as bringing overall fuel economy savings. Strategies to greener drivinginclude:
• Service vehicles regularly• Avoid idling• Accelerate and brake smoothly• Use the correct gears for the speed• Do not carry unnecessary weight• Check tire pressure regularly• Use air conditioning less frequently• Use a timer that will turn on the block heater just before driving
Commuting to work is a major contributor to transportation footprint. Commuting alone by carcontributes 12 times more than cycling and over 4 times more than taking the bus toecological footprint. Commuting footprint can be reduced by car-pooling, taking the bus, orcycling – one, three, or five days per week. Rethinking how we travel to and from work candramatically reduce our commuting footprint. For example, a small change like car-pooling withone other person results in a 50% reduction in our commuting footprint. Cycling to work andback every day instead of driving alone corresponds to a 92% reduction in the impact of ourcommuting habits on the environment.
Intelligent choices can be made that will substantially reduce food footprint and the impact offood consumption patterns on the environment. In particular, Islanders can:
• Maintain a healthy weight, reduce the tendency to overeat, and not waste food• Eat the amount of daily calories that are appropriate for one’s age and level of activity• Eat locally produced foods and support local farmers, thus reducing high transportation
and energy inputs into the food system• Eat organically grown and sustainably farmed foods, thus reducing footprint-intensive
energy and synthetic, petroleum-based inputs into agriculture.
Beyond such individual choices, this report also points to the social and political decisions thatare necessary to reduce the province’s ecological footprint to less than 7 ha per person, and tobecome a model of responsible and sustainable living. These social choices include:
• Investments in public transportation and bicycle lanes• Integrated land use/transportation planning to counter suburban sprawl• Tax incentives to support environmentally friendly Danish-style co-housing
developments• Support for local agriculture, sustainable farming methods, and nutritional education
Prince Edward Islanders have already dramatically reduced their solid waste footprint by 50%,and Prince Edward Island’s world leadership in composting, recycling and solid waste diversionis a model of government-citizen cooperation that can show a sustainable way forward into thefuture. The Premiers’ Conference and Tree Canada organized the first “carbon neutral”

GENUINE PROGRESS INDEX vi Measuring Sustainable Development
conference in PEI in 2003. This innovative plan offset the carbon dioxide emissions created bythe delegates attending the conference by calculating and planting the number of trees needed toabsorb those emissions. Clearly, footprint reductions are not only possible but have already beensuccessfully accomplished in PEI.
The average Prince Edward Islander’s total ecological footprint (8.98 ha/person in 1999) was 7%smaller than the size of the average American’s footprint (9.7 ha/person), but it was still 1.8times the average West European’s footprint (4.97 ha/person), indicating that we might moreproductively look to Europe and elsewhere for workable models of sustainable developmentrather than to the U.S. Denmark, for example, has become a world leader in wind energy; theNetherlands is actively promoting bicycle use and pesticide-free farming; BMW cars are nowmade with 35% recycled parts; and Curitiba, Brazil, has become a world leader in integrated landuse/transportation planning and mass transit use.
In sum, for a PEI determined to reduce its ecological footprint, there is no shortage ofoutstanding examples of sustainable living and development, including powerful ones within itsown borders. The purpose of this Ecological Footprint analysis is to encourage concrete public-private steps toward a more sustainable future that we are proud to leave to future generations.

GENUINE PROGRESS INDEX vii Measuring Sustainable Development
ACKNOWLEDGEMENTS
This Ecological Footprint analysis is built on the work of William Rees at the University ofBritish Columbia and Mathis Wackernagel at Redefining Progress. The authors would like toacknowledge William Rees and Mathis Wackernagel for their extraordinary insight,understanding and research in developing the Ecological Footprint concept as a remarkable toolto gauge the sustainability of human consumption patterns. The authors and GPIAtlantic deeplyappreciate the advice and assistance of Mathis Wackernagel and Chad Monfreda, of RedefiningProgress, in developing and updating the assessment methodologies used in this report.
Several people provided support for this project by supplying important reports and data. Theauthors appreciate the contributions of Sara Campbell Mates, World Wildlife Fund Canada;Karen Guilbault, Agriculture and Agri-Food Canada; Colin Dodds and Jennifer Scott,GPIAtlantic; and Diane Griffin, PEI Department of Fisheries, Aquaculture and Environment.
Inspiration for the Nova Scotia Genuine Progress Index came from the ground-breaking work ofRedefining Progress, which produced the first GPI in the U.S. in 1995. Although GPIAtlantic’smethods differ in many ways, particularly in not aggregating index components for a singlebottom line, we share with the original GPI the attempt to build a more comprehensive andaccurate measure of wellbeing than can be provided by market statistics alone. GPIAtlantic alsogratefully acknowledges the pioneers in the field of natural resource accounting and integratedenvironmental-economic accounting on whose work this study and the GPI natural resourceaccounts build.
This report was prepared for the Province of Prince Edward Island with funding assistance fromthe National Round Table on the Environment and the Economy. The views expressed in thisreport are those of the authors and do not necessarily represent the views of the Government ofPrince Edward Island, or the National Round Table. All analysis, interpretations and viewpointsexpressed, as well as any errors or misinterpretations, are the sole responsibility of the authorsand GPIAtlantic. While the authors have made every effort to provide accurate Internetaddresses at the time of publication, neither GPIAtlantic nor the authors assume anyresponsibility for errors or changes that occur after publication.
©GPIATLANTIC
Copies of this report and other GPIAtlantic publications may be obtained through the GPI website at www.gpiatlantic.org. For those interested in supporting the work of GPIAtlantic, pleasesee the membership information on this web site. The GPI News is also available on the web site,and contains updates on GPIAtlantic activities, work in progress, latest results, and usefulstatistics on social, environmental and economic realities.

GENUINE PROGRESS INDEX viii Measuring Sustainable Development
TABLE OF CONTENTS
Part I – Introduction
1. The Ecological Footprint and the Genuine Progress Index .................... 2
Onus for sustainability ........................................................................................................ 3Economic growth paradigm................................................................................................ 3Environmental sustainability, social justice and equity...................................................... 4Local consumption – global consequences......................................................................... 6
2. What the Ecological Footprint Measures ......................................................... 6
3. Methodology ..................................................................................................................... 9
The compound approach to footprint calculations.............................................................. 9
4. Understanding the Ecological Footprint ......................................................... 13
The ecological bottom line................................................................................................ 13The human footprint exceeds the sustainable capacity of the Earth................................. 14
A simple, but operational understanding of what sustainability means...................... 14Strong sustainability or weak sustainability ..................................................................... 15
Part II – Ecological Footprint – The Global Context
5. Not All Footprints Are the Same Size ............................................................... 18
6. The Connection Between Sustainability and Consumption ................. 24
7. Global Sustainability Deficit .................................................................................. 25
8. Protected Areas ........................................................................................................... 28
9. Summary: Exceeding Global Sustainability Limits .................................. 30
Part III – The Prince Edward Island Ecological Footprint
10. How Big is the Prince Edward Island Ecological Footprint? ............... 32

GENUINE PROGRESS INDEX ix Measuring Sustainable Development
11. How Does Prince Edward Island Compare to Canada? .......................... 34
What is being consumed? ................................................................................................. 35Prince Edward Island and Canadian energy sources .................................................. 36
Technologies in use .......................................................................................................... 37
12. The Charlottetown-Summerside Ecological Footprint ............................ 38
13. Not All Prince Edward Islanders Have Equal Footprint Sizes ............. 41
14. Ecological Footprint – A 40 Year Perspective ............................................. 43
15. Ecological Footprint and Gross Domestic Product ................................... 49
Part IV – Reducing Prince Edward Island’s Ecological Footprint
16. Transportation Footprint ......................................................................................... 52
An expanding transportation footprint.............................................................................. 52How does Prince Edward Island compare to Canada? ..................................................... 54Reducing Prince Edward Island’s transportation footprint............................................... 55
The footprint of commuting........................................................................................ 55Changes in driving style and driver education............................................................ 58Fuel efficiency and vehicle footprint .......................................................................... 58Summary: Reducing Prince Edward Island’s transportation footprint ...................... 61
17. Residential Energy Footprint................................................................................. 61
Canadians are heavy consumers of residential energy ..................................................... 61Reducing Prince Edward Island’s household energy footprint......................................... 62
18. Food Footprint ............................................................................................................... 64
Prince Edward Islanders are formidable food consumers................................................. 64Why is the food footprint so large?................................................................................... 65
Canadians are overeating ............................................................................................ 65Disparities in access to food ....................................................................................... 68The Canadian agriculture system is energy intensive and becoming more so ........... 69Much of Canada’s food is imported and exported...................................................... 71Diet changes................................................................................................................ 73
Reducing Prince Edward Island’s food footprint.............................................................. 74

GENUINE PROGRESS INDEX x Measuring Sustainable Development
19. The Footprint of Tourism......................................................................................... 75
Reducing the footprint of tourism..................................................................................... 79
20. A Good News Story: Prince Edward Island’s Solid Waste Footprint ............................................................................................................................................. 80
Waste generation and disposal.......................................................................................... 80Waste diversion................................................................................................................. 84
Prince Edward Island stewardship initiatives ............................................................. 85Municipal waste generation and “Generally Accepted Principles”.................................. 87Reducing Prince Edward Island’s solid waste footprint further ....................................... 88
Toward a zero waste target ......................................................................................... 88
21. Treading Lightly: Ecological Footprint Can Be Reduced ...................... 89
Appendix A – The Nova Scotia Genuine Progress Index: Purposes,Principles and Methods ................................................................................................... 94
Appendix B – The Nova Scotia Genuine Progress Index: List ofComponents ......................................................................................................................... 108
Appendix C – Food Footprint & Health .................................................................. 109

GENUINE PROGRESS INDEX xi Measuring Sustainable Development
LIST OF TABLES
Table 1. Global Sustainability Deficit of Selected Countries ....................................................... 26Table 2. Global Sustainability Deficit by Region......................................................................... 26Table 3. Ecological Footprint, Canada and Prince Edward Island, 1999 ..................................... 32Table 4. Prince Edward Island and Canada: Income, Consumption and Footprint..................... 35Table 5. Footprint Conversion Ratios for Fuel Source ................................................................. 37Table 6. Projected Renewable Energy Use for Atlantic Canada .................................................. 37Table 7. Ecological Footprint of Cities......................................................................................... 39Table 8. Ecological Footprint and Consumption Expenditure for Canada, Prince Edward Island,
and Charlottetown-Summerside, 1999........................................................................... 40Table 9. Prince Edward Island Ecological Footprint by Income Quintile, 1999.......................... 42Table 10. Percentage Increases in Footprint Size, Prince Edward Island and Canada, 1981-2000
...................................................................................................................................... 44Table 11. Historical Ecological Footprint Highlights................................................................... 44Table 12. Transportation Energy Demand, Prince Edward Island, 1990 and 2020...................... 53Table 13. Transportation Use, Prince Edward Island and Canada, 2000 ..................................... 54Table 14. Reduction in Commuting Footprint.............................................................................. 55Table 15. Sport Utility Vehicle Fuel Efficiency and Greenhouse Gas Emissions........................ 60Table 16. Reducing Household Energy Consumption.................................................................. 63Table 17. Caloric Intake World Wide, 1997................................................................................. 66Table 18. Annual Direct and Indirect Economic Costs of Obesity in Canada ............................. 68Table 19. Per Capita Global Food Availability ............................................................................ 69Table 20. Total Number and Area of Farms in Prince Edward Island, 1981-2001 ...................... 73Table 21. Tourism Expenditures by Commodity, Prince Edward Island, 1998 ........................... 79Table 22. Largest Per Capita Residential Waste Generators, 1997 .............................................. 81Table 23. Waste Disposal per Capita by Province, 1994-2000 .................................................... 83Table 24. Percentage of Overweight Canadians, Canada and Provinces, 2000/01 .................... 111

GENUINE PROGRESS INDEX xii Measuring Sustainable Development
LIST OF FIGURES
Figure 1. Disparity in Ecological Footprint Size by Country, 1999 ............................................. 19Figure 2. Disparity in Ecological Footprint Size by Region and Income, 1999........................... 20Figure 3. Ecological Footprint By Region, 1999.......................................................................... 20Figure 4. Global Distribution Above and Below Per Capita Global Biocapacity, 1999 .............. 22Figure 5. Global Ecological Footprint Breakdown, 1999............................................................. 23Figure 6. Per Capita Ecological Footprint of Selected Countries, 1999....................................... 25Figure 7. Global Sustainability Deficit of Selected Countries, 1999............................................ 27Figure 8. Global Sustainability Deficit by Region, 1999.............................................................. 27Figure 9. Proportion of Total Protected Land in Canada, as a Percentage of Total Land Area,
1901-2001 ................................................................................................................... 29Figure 10. Proportion of Total Protected Land by Province, 2001............................................... 29Figure 11. Ecological Footprints of Prince Edward Island and Canada, 1999 ............................. 34Figure 12. Ecological Footprints of Charlottetown-Summerside and Prince Edward Island, 1999
..................................................................................................................................... 38Figure 13. Metropolitan Area Public Transit Use in Commuting to Work, 2001 ........................ 40Figure 14. Ecological Footprint by Income Quintile, Prince Edward Island, 1999...................... 42Figure 15. Historical Ecological Footprints, Prince Edward Island, 1981-2000 .......................... 45Figure 16. Historical Ecological Footprints, Canada, 1981-2000 ................................................ 45Figure 17. Ecological Footprint, Prince Edward Island and Canada, 1981-2000......................... 46Figure 18. Projected Ecological Footprints, Prince Edward Island, 1995-2020........................... 48Figure 19. Projected Ecological Footprints, Canada, 1995-2020 ................................................. 48Figure 20. Gross Domestic Product and Ecological Footprint, 1981-2000.................................. 50Figure 21. Estimated Transportation Footprint, Prince Edward Island, 1990-2020..................... 53Figure 22. Mode of Transportation to Work, Prince Edward Island and Canadian Commuters,
2001............................................................................................................................. 56Figure 23. Median Commuting Distance, Canada and Provinces, 2001 ...................................... 57Figure 24. Commuting Distances of Prince Edward Island and Canadian Commuters, 2001 ..... 57Figure 25. Percentage of Overweight Canadians, Canada and Provinces, 2000/01 ..................... 67Figure 26. Tourism Shares of Gross Domestic Product, Canada and Provinces, 1996 and 199876Figure 27. Tourism Shares of Employment, Canada and Provinces, 1996 and 1998................... 78Figure 28. Municipal Waste Diversion Through Recycling and Composting, Selected OECD
Countries and Prince Edward Island, 1997................................................................. 82Figure 29. Municipal Waste Generation, Canada, 1960-1997...................................................... 83Figure 30. Prince Edward Island Waste Diversion Rates, 1989-2002, and Projected 2003 Waste
Diversion Rate ............................................................................................................ 85Figure 31. “Generally Accepted Principles” Municipality Diversion Rates, 2000 ...................... 88Figure 32. Body mass index, Canada, Prince Edward Island, and Prince Edward Island Health
Districts, 2000/01...................................................................................................... 111Figure 33. Consumption of Fruits and Vegetables, Canada and Provinces, 2000/01 (%).......... 113Figure 34. Consumption of Fruits and Vegetables, Canada, Prince Edward Island, and Prince
Edward Island Health Districts, 2000/01 (%) ........................................................... 113

GENUINE PROGRESS INDEX 1 Measuring Sustainable Development
PART IINTRODUCTION

GENUINE PROGRESS INDEX 2 Measuring Sustainable Development
THE PRINCE EDWARD ISLANDECOLOGICAL FOOTPRINT
1. The Ecological Footprint and the Genuine Progress Index
Ecological Footprint analysis is one of the core components of the Genuine Progress Index(GPI), a new measure that can provide more accurate and comprehensive information onwellbeing and sustainable development than current measures that are based on economic growthrates and related market statistics. GPIAtlantic is currently constructing such an index ofsustainable development for Nova Scotia, as a pilot project for Canada.
Conventionally, economists, politicians and journalists measure progress according to how fastthe Gross Domestic Product (GDP) is growing. The GDP simply measures the total market valueof goods and services produced, and the total amount of consumer spending. But measuringwellbeing and progress in this way sends very misleading signals to policy makers and thegeneral public. The GDP counts the depletion of our natural resource wealth as economic gain,because it measures only the market value of our resources once they are harvested. The morefossil fuels we burn, the more trees we cut down, the more fish we sell, and the more rapidly wedeplete our resources, the faster the economy will grow, which, in turn, is interpreted as a sign ofwellbeing and progress.
The GDP also does not care what is growing: more crime, sickness, pollution, accidents andnatural disasters all make the economy grow. And the GDP ignores anything that doesn’t have aprice tag – such as volunteer work, unpaid household work, free time, and vital life-supportingservices provided free by nature. The GDP can grow even as inequality and poverty grow. Inshort, the GDP and related economic growth statistics are incapable of telling us how “well off”we are, let alone whether our development is sustainable, and its architects never intended it as ameasure of wellbeing and progress, as it is used today.
By contrast, the Genuine Progress Index attempts to account for our social, environmental andeconomic health. Its 22 components include natural resource accounts, time use variables(including the value of unpaid work and free time), and indicators of health, educationalattainment, livelihood security, equity and environmental quality.1 It also counts liabilities suchas crime, pollution, greenhouse gas emissions, sickness and accidents as costs, rather than gainsto the economy.
Unlike the GDP, which measures only current income and spending regardless of itsconsequences, the GPI takes a long-term perspective and assesses whether we are leaving the 1 The 22 components of the Nova Scotia GPI are listed in Appendix B of this report.

GENUINE PROGRESS INDEX 3 Measuring Sustainable Development
world a better place for our children as well as ourselves. Therefore, it is called an index ofsustainable development because it assesses whether current production and consumptionpatterns can be sustained over time without depleting our wealth (our natural, social andproduced capital) and without denying a decent standard of living to our children and to others inthe world.
Ecological Footprint analysis is one of the most essential elements of the GPI, for four basicreasons:
• It assesses the demand side of the sustainable development equation as well as the supplyside, and places the onus for sustainability on the consumer as well as on the producer.
• It challenges fundamentally the economic growth paradigm and the assumption that“more” is necessarily “better.” In the GPI, a smaller footprint is a sign of genuineprogress.
• It links environmental sustainability clearly and directly with social justice and equity.• It links local consumption patterns with global consequences.
Let us briefly examine each of these functions in turn.
Onus for sustainability
Most measures of sustainable development implicitly place the onus of change on the producerrather than the consumer. Natural resource accounts, for example, assess whether timber, fish,agricultural products and other resources are being harvested sustainably, and they mayrecommend more sustainable harvesting methods (e.g. selection logging, restrictions on dragnettrawling, and shifts to organic farming) which require changes in production techniques. But fewmeasures place the onus for sustainability directly on the shoulders of the consumer. Because itaddresses the demand side of the sustainability equation and assesses the environmental impactsof our consumption patterns, the ecological footprint is an essential complement to other GPIcomponents that focus on the supply side of sustainable development.
Economic growth paradigm
Conventional measures of progress based on the GDP and related economic growth statisticsimplicitly assume that “more” is “better.” The more economic activity there is, and the moremoney people spend, the “healthier” and more “robust” our economy is said to be, and the“better off” we are assumed to be. When sales go up, economic experts and journalistspronounce that “consumer confidence is strong.” When sales go down, that confidence is said tobe “weak,” and the slowdown spells trouble. The language we use daily reflects the implicitassumption that “growth” equates to “health” and “wellbeing.”
The GPI challenges that core assumption directly, and contains several components in which“less” is frequently “better,” and a more accurate signal of societal wellbeing. As noted above,more crime, more pollution, more sickness and accidents, more greenhouse gas emissions and

GENUINE PROGRESS INDEX 4 Measuring Sustainable Development
natural disasters all make the economy grow simply because more money is being spent onprisons, police, hospitals, pollution cleanup and other regrettable expenditures. The prisonindustry is one of the fastest growing sectors of the U.S. economy, contributing $42 billion ayear to the U.S. GDP. The Exxon Valdez contributed more to the Alaska GDP by spilling its oilthan if it had delivered its oil safely to port.
By contrast, less crime, pollution, sickness, accidents and greenhouse gas emissions are signs ofgenuine progress and wellbeing in the GPI. This is common-sense economics, but it challengesour current reliance on economic growth statistics to assess societal wellbeing.
Ecological Footprint analysis clearly illustrates the point that “less” is sometimes “better.” Asustainable ecological footprint, which is significantly smaller than the current ecologicalfootprint of Prince Edward Islanders and Canadians, is a sign of genuine progress because itindicates that we are having less impact on the environment and preserving the health of ournatural wealth more successfully for the benefit of future generations. The large current footprintof Prince Edward Islanders and Canadians indicates quite simply that we are living beyond ourmeans, and that the Earth cannot indefinitely sustain our current consumption habits.
Scientists have noted that the natural world thrives on equilibrium and balance and rests firmlyon inherent limits to growth. The only biological organisms that thrive on unlimited growth –cancer cells – are inherently destructive. This is an apt metaphor and warning for a humaneconomic paradigm that remains wedded to a doctrine of limitless growth.2
The ecological footprint assessment is a tool devised by University of British Columbia scientistsWilliam Rees and Mathis Wackernagel to quantify the environmental impact of consumptionpatterns and to document the current ecological “overshoot” created by excess consumption inthe industrialized world.
Although not part of the original U.S. GPI produced by Redefining Progress in California, anecological footprint analysis is included in the GPI being developed for Nova Scotia, as the mostdirect and comprehensive challenge to the industrial and economic paradigm on which currentmeasures of wellbeing and progress are based.
Environmental sustainability, social justice and equity
The basic principle linking and integrating the components of new measures of progress andwellbeing is the view of “sustainable development,” which reflects a concern (a) to live withinthe limits of the world’s and the community’s resources and (b) to ensure the long-termprosperity and wellbeing of present and future generations.
Unlike measures of wellbeing based on economic growth, which implicitly assume that a risingtide lifts all boats, sustainable development measures acknowledge that there is no such thing asan indefinitely rising tide and that the metaphor seriously distorts nature’s processes. Measures 2 For one of the most thorough and systematic critiques of the economic growth paradigm, see Daly, Herman,Beyond Growth, Beacon Press, Boston, 1996.

GENUINE PROGRESS INDEX 5 Measuring Sustainable Development
based on a recognition of limited resources therefore acknowledge that societal wellbeing is adistributional issue and that poverty will not be solved simply by producing more goods andservices.
Unlike the GDP, which can grow despite increasing inequity and poverty, the GPI goes up whenequity increases and when poverty is reduced. Ecological Footprint analysis, by explicitlyrecognizing the relationship between income, consumption and environmental impact, linksenvironmental sustainability to social equity more clearly and directly than any other componentof the GPI.
That understanding is firmly rooted in accepted definitions of sustainable development.Both inter-generational and intra-generational equity are cited as specific characteristics ofsustainability in the Brundtland Commission’s seminal definition of sustainable development:
“Sustainable development is development that meets the needs of the presentwithout compromising the ability of future generations to meet their own needs...But physical sustainability cannot be secured unless development policies payattention to such considerations as changes in access to resources and in thedistribution of costs and benefits. Even the narrow notion of physicalsustainability implies a concern for social equity between generations, a concernthat must logically be extended to equity within each generation.”3
Statistics Canada notes that, from this definition,
“A consensus has emerged that sustainable development refers at once toeconomic, social and environmental needs... A clear social objective that falls outof the definition (of sustainable development) is that of equity, both amongmembers of the present generation and between the present and futuregenerations... It is clear that the spirit of sustainable development implies that allpeople have the right to a healthy, productive environment and the economic andsocial benefits that come with it.”4
The power of the ecological footprint is, therefore, that it explicitly links environmentalsustainability and social justice, not as a matter of ethics or ideology, but as a simple matter ofempirical description. If wealthy nations and wealthy individuals consume more resources andproduce more waste and greenhouse gas emissions, then their impact on the environment isproportionately greater.
In a world of limited resources and limited waste assimilation capacity, excess consumptionby the rich literally requires that others live in poverty if we are not to exceed the Earth’sphysical carrying capacity. Conversely, greater equity and a reduction in poverty requirethat excess consumption be curbed. In sum, ecological footprint analysis cuts through the
3 World Commission on Environment and Development (Brundtland Commission), 1987. Our Common Future,Oxford University Press, New York.4 Statistics Canada, 1997, Econnections: Linking the Environment and the Economy: Concepts, Sources andMethods of the Canadian System of Environmental and Resource Accounts, catalogue no. 16-505-GPE, Ottawa.

GENUINE PROGRESS INDEX 6 Measuring Sustainable Development
illusion that we can improve the living standards of the poor without also examining closelythe consumption patterns of the rich.
Local consumption – global consequences
Finally, most components of the GPI, including the natural resource accounts, assess localimpacts of local practices. However, the reality of an interdependent world and a global economyis that local behaviour has global impacts, and that distant events affect PEI. Local greenhousegas emissions, for example, have an impact on global warming that may produce flooding inBangladesh; and the destruction of the Amazon rainforest will affect the climate of Canada.
A particular contribution of the Ecological Footprint analysis, therefore, is its recognition thatlocal consumption practices may involve natural resource depletion far away. Wackernagel andRees recognize that we may indulge unsustainably high levels of consumption in North America,perhaps even without depleting local resources, but rather by “appropriating the carryingcapacity” of other countries through trade. The global perspective of the Ecological Footprintapproach is an important reminder that, ultimately, provincial and national “genuine progress”cannot be assessed in isolation from our impact on the world.
For all these reasons, the Ecological Footprint is an essential complement to the GPI naturalresource accounts, and a central component of the Genuine Progress Index. For more details onthe purposes, principles and framework of the Genuine Progress Index, please see the AppendixA and B of this report or visit the GPIAtlantic web site at www.gpiatlantic.org.
2. What the Ecological Footprint Measures
A “sustainable” society ensures the social, environmental, and economic wellbeing of all peoplewithout compromising the wellbeing of future generations. A tool known as ecological footprintanalysis, developed by researchers at the University of British Columbia, enables us to measureprogress toward sustainability by measuring the impact of human activities on the environmentaccording to how much land it takes to produce the resources necessary to sustain thoseactivities. This study is the third provincial ecological footprint analysis undertaken in Canada.Provincial ecological footprint analyses have been completed for Nova Scotia and Alberta.5, 6
5 Wilson, J., R. Colman and A. Monette (2001). The Nova Scotia Ecological Footprint. GPIAtlantic, Halifax, NS.The Nova Scotia Ecological Footprint details the environmental impact of consumption patterns, includingtransportation, residential energy use, and food consumption, including trends over time, projections to 2020 andassessments of alternative footprint reduction options. For more information, see the GPIAtlantic web site:www.gpiatlantic.org.6 Wilson, J. (2001). The Alberta GPI Accounts: Ecological Footprint. The Pembina Institute for AppropriateDevelopment, Drayton Valley, AB. This report presents the ecological footprint of Albertans, ecological footprinttrends over time, comparisons between Alberta, Canada and other regions of the world, the major contributors to theAlberta ecological footprint, projections over 20 years, the correlation between Alberta’s ecological footprint and

GENUINE PROGRESS INDEX 7 Measuring Sustainable Development
The Prince Edward Island Ecological Footprint assesses how much biologically productive areaPrince Edward Islanders need and utilize to maintain their current lifestyles. The results providea benchmark of how sustainable Prince Edward Islanders’ current lifestyles are, and they identifythe challenges Islanders face to reduce their ecological footprint and their impact on theenvironment. The study also suggests what individuals can do to reduce their personal ecologicalfootprint, and provides a mechanism to document progress toward a more sustainable PEI.Unlike measures of progress based on the GDP and related economic growth statistics in which“more” is assumed to be “better,” a smaller ecological footprint indicates greater sustainabilityand thus is considered a sign of progress in the Genuine Progress Index (GPI). The smaller anindividual’s ecological footprint, the less they are depleting the Earth’s limited resources anddegrading the natural environment, and the healthier the natural legacy and wealth we leave toour children.
The ecological footprint concept is based on the simple maxim that all human activities dependon nature, which is the basis of all life support functions. Nature provides the air we breathe, ourfood and water, the energy we need for heat, light, transportation and to operate our machines,and the materials we use to build our houses and to make our clothes, computers, cars, paperproducts and every other object that cycles through the economy. Nature also acts as the dumpfor our waste products. The carbon dioxide, acid gases, and particulate matter that our cars emit,the phosphates from our detergents and fertilizers, the synthetic chemicals found in plastics,paints and other artificial products, and the garbage we put out on the curb each week all end upin our environment.
Human beings therefore have an impact on the Earth simply because they consume nature’sproducts and services. Our personal ecological footprint, therefore, corresponds to the amount ofnature an individual uses or occupies in order to live. This need not be of concern as long as thehuman load remains within the “carrying capacity” of nature. “Carrying capacity” refers to theability of the natural world to support human activity and renew itself without depleting naturalresource stocks. The sustainability challenge, therefore, is to attain a high quality of life for allPrince Edward Islanders while ensuring that their resource consumption and waste generationremain within the carrying capacity of nature.
But are Islanders currently living in such a way? Ecological footprint analysis was designed toanswer this question by determining the extent of human impact on nature and whether thisimpact can be sustained into the future. It shows how much productive land and water a givenpopulation requires to produce all the resources it consumes and to take in all the wastes itcreates. The ecological footprint therefore becomes a benchmark for measuring the “bottomline” of sustainability. A footprint that corresponds with the capacity of nature to renew itself, tocontinue providing a flow of goods and services into the future, and to assimilate wastes withoutoverloading the environment, represents the precondition necessary for securing the wellbeing ofpresent and future generations.7, 8, 9, 10, 11
consumption, and how the ecological footprint can be used to create a more sustainable Alberta. For moreinformation, see the Pembina Institute’s web site: http://www.pembina.org.7 The ecological footprint concept discussed throughout this report is based on the work of Wackernagel and Rees(1996). Our Ecological Footprint: Reducing Human Impact on the Earth. New Society Publishers, Gabriola Island,BC. For details on the book, see www.newsociety.com/oef.html. For more details on the footprint method and its

GENUINE PROGRESS INDEX 8 Measuring Sustainable Development
Most measures of sustainable development subtly place responsibility on producers. Naturalresource accounts for forests, fisheries, soils and agriculture, for example, assess whether currentharvesting practices are sustainable. Ecological footprint analysis, by contrast, shiftsresponsibility to consumers by assessing the impact of consumption patterns on the naturalworld. The ecological footprint perspective cuts through the tendency to blame farmers, loggers,fishermen and businesses alone for the depletion and degradation of natural resource stocks, andplaces greater responsibility on the demand that consumers generate, and which producers aim tofulfill. The critical importance of this component of the GPI, therefore, is to make thesustainability challenge the shared collective responsibility of all Prince Edward Islanders.
Ecological footprint calculations are based on two simple facts: First, most of the resourcesconsumed by a population, and the wastes that are generated by that population, can beaccounted for. Secondly, this resource consumption and waste generation can be converted intothe biologically productive area necessary to sustain these functions. The ecological footprint ofany defined population (a single person, household, province, country) is the biologicallyproductive area required to:
1. Produce the food, wood, energy and all the other resources that humans consume;2. Provide room for infrastructure such as buildings and roads; and3. Absorb the wastes, carbon dioxide and other pollutants that result from human activity.
To provide results in comparable units of measure, all components are adjusted for theirbiological productivities. This means that land with higher than average productivity appearslarger in footprint accounts than resource-poor land. Since the resources we consume come fromall corners of the planet and the wastes we generate affect distant places, ecological footprintanalysis considers the sum of all our ecological impacts no matter where they occur on theplanet. For example, if Prince Edward Islanders eat bananas from Guatemala and use wood fromthe Amazon rainforest, the land area required in those countries to produce these commoditiesconsumed in PEI is counted as part of the PEI footprint.12, 13, 14, 15
applications, visit Redefining Progress at www.rprogress.org or the Anáhuac University of Xalapa’s Centre forSustainability Studies in Mexico at www.edg.net.mx/~mathiswa.8 Wackernagel, M., L. Onisto, P. Bello, A. Callejas Linares, I. S. López Falfán, J. Méndez García, A. I. SuárezGuerrero, and S. Guerrero (1999). “National natural capital accounting with the ecological footprint concept,”Ecological Economics, Vol. 29, pp. 375-390.9 Lewan, L., M. Wackernagel, and C. Borgstrom Hansson (1999). “Evaluating the Use of natural Capital with theEcological Footprint. Applications in Sweden and subregions,” Ambio 28(7), pp. 604-612.10 Onisto, L.J., E. Krause, and M. Wackernagel (1998). How Big Is Toronto’s Ecological Footprint? Using theConcept of Appropriated Carrying Capacity For Measuring Sustainability. Centre for Sustainable Studies and theCity of Toronto, Toronto, Canada.11 Wackernagel, M., L. Onisto, A. Callejas Linares, I.S. López Falfán, J. Méndez García, A.I. Suárez Guerrero, S.Guerrero (1997). Ecological Footprints of Nations: How Much Nature Do They Use? How Much Nature Do TheyHave? Commissioned by the Earth Council for the Rio+5 Forum. International Council for Local EnvironmentalInitiatives, Toronto.12 WWF International, Redefining Progress, United Nations Environment Program World Conservation MonitoringCentre (UNEP-WCMC), and Anáhuac University of Xalapa Centre for Sustainability Studies, 2000. Living PlanetReport 2000. Available at http://www.panda.org/downloads/general/lpr2000.pdf.13 WWF International, Redefining Progress, and United Nations Environment Program World ConservationMonitoring Centre (UNEP-WCMC), 2002. Living Planet Report 2002. Available athttp://www.panda.org/downloads/general/LPR_2002.pdf.

GENUINE PROGRESS INDEX 9 Measuring Sustainable Development
It is important to note that current ecological footprint estimates err on the conservative side.Low-end figures have been consistently used; areas set aside for the protection and treatment ofwater are not included in ecological footprint estimates, and areas for the absorption of wastes,pollutants and toxic materials, with the exception of carbon dioxide, have been omitted. Inaddition, the footprint analysis takes no account of the probability that chemical pesticide andfertilizer use, soil compaction, clear-cutting and other non-sustainable harvesting practices willreduce future soil productivity. The current biological productivity of a given piece of land isassumed to continue into the future. These assumptions render current footprint analyses highlyconservative.
3. Methodology
Two previous provincial ecological footprint analyses were completed for Nova Scotia andAlberta, and were based on the methodology developed by Rees and Wackernagel in OurEcological Footprint: Reducing Human Impact on The Environment and, more specifically, onthe results presented in Wackernagel’s 1996 Canadian Ecological Footprint estimate, which waspart of the Living Planet Report 2000.16, 17 This PEI ecological footprint analysis builds on thework of the Nova Scotia and Alberta analyses, and includes updates to the methodologiesdeveloped for the Living Planet Report 2002.18, 19 The Wackernagel and Rees approach, oftenreferred to as the “compound” approach to calculating the ecological footprint, measuresconsumption based on quantity and type of consumption as well as trade flows and energy data.20
The compound approach to footprint calculations
The following excerpt, from Sharing Nature’s Interest, summarizes the main elements of theecological footprint methodology:21
14 Wackernagel et al. (1997). See footnote 11.15 Wackernagel and Rees (1996). See footnote 7.16 Idem.17 Redefining Progress and the Centre for Sustainability Studies contributed to the Living Planet Report 2000 bycalculating the ecological footprint of the world’s 150 countries with a population over 1 million, using 1996 data,as well as the ecological footprint for the world population from 1961 to 1997. Calculations are available athttp://www.redefiningprogress.org/ef/LPR2000/ef1996.zip. The original study of national footprints was:Ecological Footprints of Nations: How Much Nature Do They Use? How Much Nature Do They Have? Seefootnote 11 above. The methods are also described in Wackernagel et al. (1999. See footnote 8) above.18 Living Planet Report 2002. See footnote 13 above.19 Wackernagel, M., C. Monfreda, and E. Gurarie (2002). Improvements to National Footprint Accounts Since TheLiving Planet Report 2000. Redefining Progress, Oakland, CA.20 An explanation of the “compound approach” and other approaches to calculating the ecological footprint areavailable in Chambers, N., C. Simmons, and Mathis Wackernagel (2000). Sharing Nature’s Interest. EarthscanPublications Ltd., London, p.67.21 Idem.

GENUINE PROGRESS INDEX 10 Measuring Sustainable Development
“The calculation is composed of three main parts. The first part consists of aconsumption analysis of over 50 biotic resources including meat, dairy, produce,fruit, vegetables, pulses, grains, tobacco, coffee, wood products, and so on.[22]
Consumption is calculated by adding imports to production and subtractingexports.[23] Where necessary, further adjustments are made to avoid doublecounting across categories. Using FAO [Food and Agriculture Organization of theUnited Nations] estimates of world average yield, consumption is translated intoappropriated ecologically productive area. In other words, the consumptionquantities are divided by their corresponding (world average) biotic productivity,which gives the arable, pasture, or forest land and productive sea area necessaryto sustain this consumption.
The second part of the calculation determines the energy balance – consideringboth locally generated energy and that embodied in over 100 categories of tradedgoods. Where the primary fuel used is known, this is adjusted for carbon content.This portion of the calculation is used to derive the energy footprint – usually theamount of forested land necessary to sequester the CO2 emissions.
The final part of the calculation summarizes the ecological footprint in sixcategories and gives the total, presented as per capita figures. Multiplying the percapita data by the country’s population gives the total footprint of the nation. Anadjustment is also made to express the result in world average productive land.‘Equivalence factors’ are used to scale the land categories in proportion to theirproductivities. The total is then compared with an estimate of how muchbiocapacity exists within the country. The actual land area is adjusted by a ‘yieldfactor’ to equate local productivity of each land category to the global average.This scales the national areas in proportion to their true productivities.’”
Results are presented as global hectares (gha) per capita. A global hectare is defined as onehectare (ha)24 of biologically productive space (including ocean, cropland, grazing land, forestland, inland waters, and built up land) with world-average productivity. A hectare of highlyproductive land represents more global hectares than the same surface of less productive land.
The ecological footprint calculations presented in the Living Planet Report 2002 include sixcategories that are mutually exclusive uses of the planet’s bioproductive surface that compete forthe Earth’s available biologically productive space:25
22 Each category includes both primary resources (such as raw timber or milk) and manufactured products that arederived from them (such as paper or cheese).23 Consumption is calculated by adding imports to, and subtracting exports from, the domestic production, i.e., NetConsumption = Domestic Production – Exports + Imports.24 A hectare (ha) is a unit of surface or land equivalent to 10,000 square metres (m2) or 2.47 acres.25 Summarized from Wackernagel, M., N.B. Schulz, D. Deumling, A.C. Linares, M. Jenkins, V. Kapos, C.Monfreda, J. Lohi, N. Myers, R. Norgaard and J. Randers (2002). Tracking the ecological overshoot of the humaneconomy. Proceedings of the National Academy of Sciences, 99 (14), pp. 9266–9271; and the Redefining Progressweb site (http://www.rprogress.org/programs/sustainability/ef/methods/components.html).

GENUINE PROGRESS INDEX 11 Measuring Sustainable Development
1. Cropland Footprint: growing crops for food, animal feed, fibre, oil, and rubber, andincludes growing tobacco; calculated as arable land used for crop production.
2. Grazing Land Footprint: grazing animals for meat, hides, wool, and milk; calculated aspasture land demand by cattle, sheep, goats, equines, and camels.
3. Forest Footprint: harvesting timber for wood, fibre, and fuel; calculated as natural andplantation forest land. Fuel wood is not included in the total Forest Footprint – it makesup part of the Total Energy Footprint.
4. Fishing Ground Footprint: marine and freshwater fishing; calculated as productivefishing ground.
5. Built-Up Land Footprint: accommodating infrastructure for housing, transportation,industrial production, and hydro-electric power; calculated as arable land used forinfrastructure, based on the assumption that human settlements are predominantly locatedin the most fertile areas of a country.
6. Total Energy Footprint: burning fossil fuel, calculated as the biologically productivearea that would be needed to sequester enough carbon dioxide (CO2) emissions to avoidan increase in atmospheric CO2. The total energy footprint includes CO2 emissions fromfossil fuels, fuel wood, and nuclear and hydro energy. This does not include energyrequired for the production of food (e.g., transportation of food, energy inputs intoagriculture), which are included in the cropland, grazing land and fishing groundfootprints.
The calculation of the PEI ecological footprint follows the methodology used for calculating theNova Scotia ecological footprint and summarizes the footprint in five slightly modifiedcategories:
1. Food Footprint: Cropland Footprint + Grazing Land Footprint + Fishing GroundFootprint – Non-Food Cropland Footprint
2. Other Crop Footprint: footprint of non-food items, including fibre crops (e.g., cotton),rubber, and tobacco
3. Forest Footprint: corresponds to the Living Planet Report 2002 Forest Footprintcategory (#3 above)
4. Built-Up Area Footprint: corresponds to the Living Planet Report 2002 Built-UpFootprint category (#5 above)
5. Energy Footprint: corresponds to the Living Planet Report 2002 Energy Footprintcategory (#6 above)
The compound approach to ecological footprint calculations takes its primary unit of analysis asthe nation state. Reliable data on trade flows, consumption, energy use and land categories areavailable at the national level. However the complete data set necessary to calculate theecological footprint at the provincial level using the compound approach is not currentlyavailable, primarily due to inadequacies in the inter-provincial trade flow data.

GENUINE PROGRESS INDEX 12 Measuring Sustainable Development
Therefore, the 1999 Prince Edward Island ecological footprint presented in this report wascalculated indirectly by adjusting the 1999 per capita Canadian footprint area, as calculated byRees, Wackernagel and their colleagues, to account for differences in consumption patternsbetween PEI and Canada. This is the approach recommended by Wackernagel who notes that“regional or municipal footprints can be extracted from the national footprint by comparing towhat extent the consumption in the region or municipality differs from the national average andadjusting the footprint accordingly.”26
The PEI consumption adjustments rely primarily on the following Statistics Canada surveys andsources: Food Expenditure Surveys, Family Expenditure Surveys, and other sources as listed inthe footnotes. PEI’s energy footprint is calculated using the National Energy Use Database ofthe Natural Resources Canada Office of Energy Efficiency. Because the most recent year forwhich a detailed footprint has been calculated for Canada is 1999, data for 1999 consumptionpatterns is used to adjust this footprint to PEI, and 1999 is used as the base year for all historicaland projected footprint trends in this report.
GPIAtlantic recognizes that using input-output tables at the provincial level to track resource andwaste flows through the economy would be a more accurate and comprehensive way ofcalculating human impacts on the environment. GPIAtlantic has recommended to StatisticsCanada that future updates of this report use the expanded input-output tables in the Material andEnergy Flow Accounts that are part of Statistics Canada’s new Canadian System ofEnvironmental and Resource Accounts. Although Statistics Canada has developed conventionalprovincial input-output tables, the expanded Material and Energy Flow Accounts still exist onlyat the national level. Statistics Canada hopes to develop corresponding provincial and regionalaccounts in the future, which will allow for significant improvements in the ecological footprintcalculations.
GPIAtlantic is aware of only one study to date that has used input-output tables to calculate anecological footprint. Interestingly, that New Zealand study produced results that were quite closeto those based on the methodology of Wackernagel and Rees in British Columbia. For thatreason, and because of the conservative assumptions described above, the authors andGPIAtlantic are confident that the results presented in this analysis are reasonable estimates.27 Atthe same time, we recognize clearly the limitations of the methodologies used in this study andwelcome improvements that will increase the accuracy of the estimates given here.
26 Wackernagel, M. (1998). “The Ecological Footprint of Santiago de Chile,” Local Environment, 3(2), p. 16.Chambers et al. (2000) also support this approach: “Where specific data about a city are not known then itsfootprint can be estimated by apportioning the per capita impact” (p.135). See footnote 20. Despite excellent workby Statistics Canada on inter-provincial trade flows, uncertainties in the data still do not permit accurate estimates ofprovincial imports and exports of the more than 100 categories of traded goods considered in the compoundapproach to ecological footprint calculations.27 A study undertaken by Bicknell et al., from Lincoln University, Canterbury, New Zealand used input-outputtables to calculate a New Zealand ecological footprint. Interestingly, the New Zealand analysis, using an entirelydifferent method, produced comparable results to the original UBC analysis. Bicknell, K.B., R.J. Ball, R. Cullen,H.R. Bigsby (1998). “New methodology for the ecological footprint with an application to the New Zealandeconomy,” Ecological Economics 27, 149-160. See also Statistics Canada, 1997 (footnote 4).

GENUINE PROGRESS INDEX 13 Measuring Sustainable Development
4. Understanding the Ecological Footprint
The ecological bottom line
If all the biologically productive land and sea on this planet is divided by the human population,there is an average of 1.9 hectares of biologically productive land and sea per person.28 If 12% ofthe ecologically productive land is set aside for biodiversity preservation, as recommended bythe Brundtland Commission, the available bioproductive space per person shrinks from 1.9 ha tojust under 1.7 ha.29, 30
Since we share the planet with over 10 million other species, it is clearly not possible to use theentire bioproductive ecological space of the planet solely for human consumption. Indeed, it isdoubtful that the human species itself could survive if it used all productive resources for its ownneeds at the expense of all other species. Conservative biologists recommend a minimum set-aside of 30% for biodiversity preservation, so the 12% set-aside, recommended by theBrundtland Commission and used in this report, actually minimizes the ecological scarcity seenby many scientists.31 Indeed, the 12% target is what is currently deemed politically feasiblebased on international agreements. The actual biodiversity preservation required for the longer-term self-preservation of the human species and to slow the current extreme rate of speciesextinction will likely require greater land protection.
In sum, sustainable living therefore requires that each global citizen fulfill all his or herphysiological, social, and economic needs within the 1.7 ha of biologically productive spaceavailable to each person. Any increase in the set-aside for biodiversity preservation willcorrespondingly decrease that estimate of available space.
The sustainability challenge will not become any easier with a projected population of 10 billionpeople within the next 30 to 50 years. At that time, the available space will be reduced to 1.1 haper person worldwide. Again it must be emphasized that this projection has not factored in theprobable loss of biologically productive space due to unsustainable harvesting methods, clear-cutting, soil erosion, and the expansion of the built environment, nor does it include the impact
28 About 11.4 billion hectares, slightly less than ¼ of the Earth’s surface, are biologically productive (Living PlanetReport 2002. See footnote 12 above). The remaining ¾ of the Earth’s surface including deserts, ice caps, and deepoceans, support comparatively low concentrations of bioproductivity. Biocapacity per capita in 1999 was calculatedat 1.9 ha per person based on a global population in 1999 of 5,978.7 million.29 In his Canadian Footprint analysis Wackernagel follows the internationally accepted Brundtland Commissionrecommendation to set aside 12% of bioproductive area for biodiversity preservation in order not to exaggerateecological scarcity. The Living Planet Report 2000 (see footnote 12) sets aside 10%, while conservative biologistsrecommend a minimum of 30%. The burden of this protection effort must clearly be shared by all of humanity andnot only those regions of the world where biologically productive spaces remain relatively untouched by humans(Wackernagel, 2001. What We Use and What We Have: Ecological Footprint and Ecological Capacity, RedefiningProgress. See the Redefining Progress web site: www.rprogress.org/).30 Brundtland, G. H., 1987. Our Common Future. Report of the World Commission on Environment andDevelopment, chaired by G. Brundtland, Oxford University Press, p.166.31 Wackernagel, (2001). See footnote 29 above.

GENUINE PROGRESS INDEX 14 Measuring Sustainable Development
of most waste products. Given these highly conservative assumptions and exclusions, the 1.7 haavailable per person can be considered a very generous estimate.32
The human footprint exceeds the sustainable capacity of the Earth
The 1999 average global ecological footprint is 2.3 ha per person.33 With an available space ofjust 1.7 ha per person, humanity already exceeds the sustainable capacity of the Earth by 35%.This means that humanity is consuming more than nature can regenerate, or human demand isexceeding nature’s supply. This global “ecological overshoot” is temporarily possible, but onlyby:
• depleting reserves of natural capital (e.g., oil, natural gas, old growth forests);• over-harvesting renewable resources to the brink of collapse (e.g., the Atlantic cod
fisheries);• causing irreversible ecological damage (e.g., species extinction, desertification); and• overloading the environment with waste products (e.g., air and water pollution, climate
change, stratospheric ozone depletion, and toxic chemical build up).
To take just one example from this list, scientists estimate that 100 living species become extinctevery day, largely from habitat destruction and pollution. If current trends continue, 50% of theworld’s flora and fauna will become extinct within the next century. The present speciesextinction rate is estimated to be one thousand times the natural rate.34
For a while, many of us can live quite comfortably in the midst of this overshoot and will not payfor its consequences in our own lifetimes. But our comfort is quite clearly at the expense offuture generations who will pay the ecological costs of current over-consumption, just astaxpayers are now struggling to service the public debt accumulated during the 1970s and 1980s.Not only does the current ecological overshoot deplete the biologically productive space orfootprint area that will be available for our children and their children to achieve healthy lives,but it also leaves them to deal with the toxic impacts of excess current waste generation.Reduced salmon and cod stocks, global warming, higher child asthma rates, and newenvironmental illnesses may well be current precursors of these longer-term consequences.
A simple, but operational understanding of what sustainability means35
“Sustainability is a simple idea. It is based on the recognition that worseningecological conditions ultimately threaten people’s wellbeing. Thus, sustainabilityis… a commitment to satisfying lives for all within the means of nature.
32 The Living Planet Report 2000. See footnote 12 above.33 Living Planet Report 2002. See footnote 13 above.34 Morell, V. (1999). “The Sixth Great Extinction,” National Geographic, 195(2).35 Wackernagel (2001). Framing Sustainability with the Ecological Footprint – Dismantling the taboo in order tounleash sustainability. Draft Document prepared for Environment Canada workshop on sustainable developmentindicators, January 23, 2001, Toronto, p. 2.

GENUINE PROGRESS INDEX 15 Measuring Sustainable Development
When humanity’s ecological demands in terms of resource consumption andwaste generation exceed what nature can supply, we move into what is termed‘ecological overshoot.’ Just as constant erosion of business capital weakens anenterprise, such overshoot erodes the planet’s ‘natural capital,’ and thus reducesthe ultimate means people depend on.36
At the core of the quest for sustainability is the need to be able to live withecological limits. These limits are not like a rigid wall that brings a speeding carto a halt. Rather, ecological limits can be transgressed easily. More timber can beharvested than regrows, more fish can be caught than are spawned, more CO2 canbe emitted than nature can reabsorb, and topsoil can be eroded while crops grow.Initially, most of these transgressions go unnoticed.
The importance of avoiding overshoot is still ignored not only in generalconversations but also in many public policy discussions of sustainability. In fact,our ability to transgress ecological limits without perceptible consequences maycreate influential misconceptions in the sustainability debate. For example, in arecent interview on reaching a world population of 6 billion, Nafis Sadik, thenExecutive Director of the UN Population Fund, stated that ‘manyenvironmentalists think [that the carrying capacity of the Earth] is four billion,maximum. But now we have six billion people.’37
Overshoot is also the driver behind inequities. In a world that is in overshoot,people not only compete with other species for ecological space, but against eachother. Overshoot obscures this reality by allowing the accumulation of ‘ecologicaldebts’ (or the depletion of the natural capital stock), leaving the burden for futuregenerations. In other words, it makes possible the trade off between increasingresource depletion, intra-generational equity and intergenerational equity.Overshoot is not merely an abstract construct, but can be measured. Thistranslates the ‘means of nature’ into a specific and accountable proposition.”
Strong sustainability or weak sustainability38
This approach is consistent with the notion of “strong sustainability” which requires thatnatural capital not be depleted, and that human societies live off the “interest” (or servicesprovided by natural capital stocks) without drawing down the “principal” (the natural capitalstocks themselves). The concept of “weak sustainability,” by contrast, implies that there be nodepletion of total capital, i.e. natural plus human-made capital. Weak sustainability policiesallow natural capital to be diminished as long as it is balanced by a commensurate increase inhuman-made capital.
36 See also Daly, H. (1996). Beyond Growth, Beacon Press, Boston.37 Motavalli, J. (1999). “Conversations with Dr. Nafis Sadik: The UN’s Prescription for Family Planning,” E: TheEnvironmental Magazine, 10(4), 10–13.38 Based on notes from Mathis Wackernagel, personal communication with Jeffrey Wilson, 2001; and Wackernageland Rees, Our Ecological Footprint, 1996, p. 37.

GENUINE PROGRESS INDEX 16 Measuring Sustainable Development
Apart from serious problems arising from the lack of adequate methods to compare the value ofhuman-made and natural capital, such weak sustainability would assume that there issubstitutability between human-made and natural capital. While there is some substitutabilityamong different aspects of natural capital (e.g. fuel wood versus bio-fuel from corn), and evensome marginal substitutability between natural capital and human-made capital (e.g. fuel-woodversus wind-mills), there is no absolute substitutability for essential ecosystem services, sincehuman and non-human life ultimately depend on the functioning of the biosphere. Put simply,the relationship between natural and human-made capital is not an equal two-way flow. Thehuman economy and human society depend completely on nature (for air, water, heat, energy,productive land, resources, climate regulation and other vital ecosystem services), but naturedoes not depend for its survival on human economy and society. That reality makes theassumption of substitutability highly questionable, although the assumption is widely accepted inactual practice.
In addition, it may be possible to substitute human-made capital for certain functions ofparticular natural capital assets. But these natural assets frequently perform a wide range offunctions, many of which are not performed by the human-made substitute. For example, asewage treatment plant may partially replace the natural waste cycling capacity of a river orother water body, but it cannot compensate for the many other vital life-supporting ecologicalfunctions performed by the river. In other words, the sewage treatment plant does not make theriver dispensable nor allow its health to be compromised without a wide range of otherconsequences, many of which are likely to be adverse to human wellbeing.
In the past, weak sustainability may have appeared as a sufficient criterion for beneficialdevelopment. But this illusion can no longer be sustained in a time of global overshoot. Sincehumanity is using the biosphere’s capacity more rapidly than it can regenerate, further trade-offsof building human-made capital at the expense of natural capital in order to maintain or increasetotal capital are highly likely to undermine the wellbeing of future generations.
Nevertheless, strong sustainability by no means condemns humanity to stagnation nor does itimply any barrier to human and social development and progress. On the contrary, long-termstagnation and regression are more likely under weak sustainability policies, since those policiescould continue to liquidate the natural capital assets on which human economic prosperityultimately depends. By contrast, strong sustainability provides stronger guarantees of long-termprosperity by preserving natural wealth for the benefit of future generations. Under such policies,societies are more likely to flourish through the development of appropriate technologies that canprovide services to society without drawing down natural capital reserves. As well, efforts tostabilize human population and curb excessive material consumption can help foster human andsocial development without increasing ecological overshoot.39
39 See also Beyond Growth, footnote 2.

GENUINE PROGRESS INDEX 17 Measuring Sustainable Development
PART IIECOLOGICAL
FOOTPRINT – THEGLOBAL CONTEXT

GENUINE PROGRESS INDEX 18 Measuring Sustainable Development
5. Not All Footprints Are the Same Size
Responsibility for ecological overshoot is not equally shared. As Figures 1 and 2 demonstrate,there is a great disparity between the ecological footprints of different countries and differentregions, with wealthy nations having a disproportionately greater impact on the environment.
As Figures 1 through 5 clearly show, the industrialized regions tend to live on footprintssignificantly larger than the less industrialized regions of the world. For example, Africa and theAsia/Pacific region had ecological footprints of 1.36 ha per capita and 1.37 ha per capita in 1999respectively, while North America and Western Europe had ecological footprints of 9.61 ha percapita and 4.97 ha per capita respectively.
Figure 3 shows the ecological footprints of seven geographical regions of the world in 1999:
• The size of each box is proportional to the aggregate footprint of each region.• The height of each box is proportional to the region’s average ecological footprint per
person;• The width of the box is proportional to the population of the region; and• The low, middle, and high income columns refer only to average ecological footprint per
person.
In fact, four billion people, or 68% of the world’s population, consume an average of just 1.1 haof bioproductive capacity per person, considerably less than the land and sea space available forhuman use (Figure 4). Arguably global environmental decline can therefore be attributed to 32%of the world’s population – the 1.9 billion people who consume an average of 4.1 ha ofproductive space per person. In fact, this 32% of the world’s population is responsible for 70% ofglobal resource consumption and waste generation and has an aggregate ecological footprintequal to 93% of the Earth’s total biologically productive area.40
This group of consumers is largely concentrated in the high income countries41 whose averageper capita ecological footprint in 1999 was 6.48 ha and the middle income countries42 whoseaverage ecological footprint in 1999 was 1.99 ha per capita. By contrast, the low income
40 The 32% of the population with the largest footprint is responsible for 70% of the world’s resource consumptionand waste generation. Because humans are in a state of global overshoot, the actual footprint area that this groupoccupies is equal to an area the size of 93% of the Earth’s total biologically productive area.41 High income countries in the Living Planet Report 2002 include: Australia; Austria; Belgium; Canada; Denmark;Finland; France; Germany; Greece; Ireland; Israel; Italy; Japan; Korea, Rep.; Kuwait; Netherlands; New Zealand;Norway; Portugal; Slovenia; Spain; Sweden; Switzerland; United Arab Emirates; United Kingdom; and the UnitedStates of America.42 Middle income countries in the Living Planet Report 2002 include: Algeria; Argentina; Belarus; Bolivia;Botswana; Brazil; Bulgaria; Chile; China; Colombia; Costa Rica; Croatia; Cuba; Czech Rep.; Dominican Rep.;Ecuador; Egypt; El Salvador; Estonia; Gabon; Georgia; Guatemala; Hungary; Indonesia; Iran; Iraq; Jamaica; Jordan;Kazakhstan; Korea, Dem. Rep.; Latvia; Lebanon; Libya; Lithuania; Macedonia; Malaysia; Mauritius; Mexico;Morocco; Namibia; Panama; Papua New Guinea; Paraguay; Peru; Philippines; Poland; Romania; RussianFederation; Saudi Arabia; Slovakia; South Africa, Rep.; Sri Lanka; Syria; Thailand; Trinidad and Tobago; Tunisia;Turkey; Ukraine; Uruguay; Uzbekistan; Venezuela; and Yugoslavia, Fed. Rep.
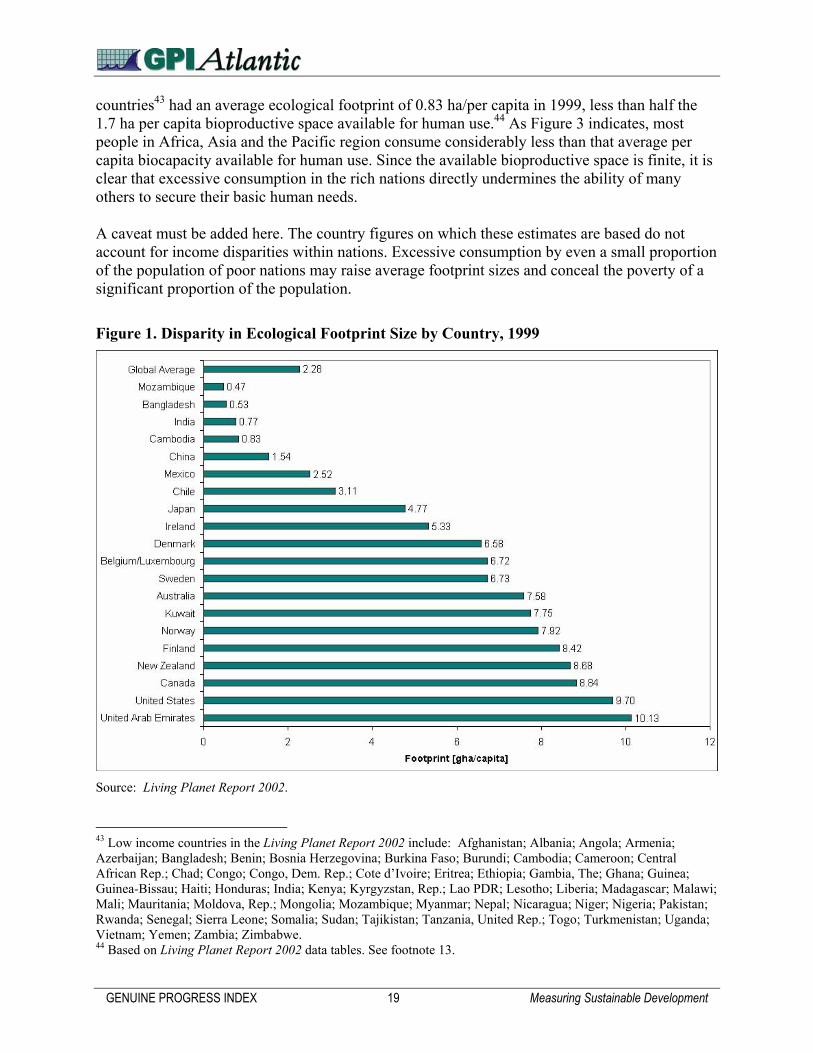
GENUINE PROGRESS INDEX 19 Measuring Sustainable Development
countries43 had an average ecological footprint of 0.83 ha/per capita in 1999, less than half the1.7 ha per capita bioproductive space available for human use.44 As Figure 3 indicates, mostpeople in Africa, Asia and the Pacific region consume considerably less than that average percapita biocapacity available for human use. Since the available bioproductive space is finite, it isclear that excessive consumption in the rich nations directly undermines the ability of manyothers to secure their basic human needs.
A caveat must be added here. The country figures on which these estimates are based do notaccount for income disparities within nations. Excessive consumption by even a small proportionof the population of poor nations may raise average footprint sizes and conceal the poverty of asignificant proportion of the population.
Figure 1. Disparity in Ecological Footprint Size by Country, 1999
Source: Living Planet Report 2002.
43 Low income countries in the Living Planet Report 2002 include: Afghanistan; Albania; Angola; Armenia;Azerbaijan; Bangladesh; Benin; Bosnia Herzegovina; Burkina Faso; Burundi; Cambodia; Cameroon; CentralAfrican Rep.; Chad; Congo; Congo, Dem. Rep.; Cote d’Ivoire; Eritrea; Ethiopia; Gambia, The; Ghana; Guinea;Guinea-Bissau; Haiti; Honduras; India; Kenya; Kyrgyzstan, Rep.; Lao PDR; Lesotho; Liberia; Madagascar; Malawi;Mali; Mauritania; Moldova, Rep.; Mongolia; Mozambique; Myanmar; Nepal; Nicaragua; Niger; Nigeria; Pakistan;Rwanda; Senegal; Sierra Leone; Somalia; Sudan; Tajikistan; Tanzania, United Rep.; Togo; Turkmenistan; Uganda;Vietnam; Yemen; Zambia; Zimbabwe.44 Based on Living Planet Report 2002 data tables. See footnote 13.

GENUINE PROGRESS INDEX 20 Measuring Sustainable Development
Figure 2. Disparity in Ecological Footprint Size by Region and Income, 1999
Note: For a list of countries included in the averages for the low, middle, and high income countries, see footnotes41 through 43.
Source: Living Planet Report 2002.
Figure 3. Ecological Footprint By Region, 1999
Note: This Figure is based on Figure 8 of the Living Planet Report 2002 (see footnote 13) and Figure 2 of The NovaScotia Ecological Footprint (see footnote 5).
Source: Living Planet Report 2002.

GENUINE PROGRESS INDEX 21 Measuring Sustainable Development
It has been argued that technological advances, such as genetically modified foods, mayeffectively expand the bioproductive space available for human consumption by making eachhectare of land and sea considerably more productive than it has been historically. In an earlierera, the “Green Revolution” held out the same promise. In keeping with the conservative natureof estimates in this report that exclude the probable degradation and loss of currently productiveland to soil erosion, compaction, nutrient leaching, desertification, pollution and other factors,and acknowledging that bioengineering and other yield-expanding innovations are still in theexperimental stage, this report assumes the same bioproductive capacity for each hectare of landinto the future as currently exists. From that perspective, available resources remain finite, andexcess consumption and waste generation by some in effect depend on the continued poverty anddeprivation of others.
Figure 4 illustrates both the average per capita ecological overshoot, and the overshoot of 32% ofthe world’s population, based on 1999 data. Figure 5 reveals the remarkable distribution ofecological footprints in 1999 by percentage of the world’s population and per capita GDP. The6% of the world’s population45 with the largest ecological footprints (including Canada and theU.S.) have an average footprint of 8.1 ha/capita or almost six times the 1.4 ha/capita footprint of40% of the world’s population, and over ten times the 0.8 ha/capita footprint of the poorest 27%of the world’s population.
Ecological footprint studies highlight the ethical dimensions of sustainability. In 1999, ninecountries occupied footprints at least four times larger than the biologically productive spaceavailable per global citizen.46 In marked contrast, 33 countries have footprints of 1 ha or less percapita.47
This empirical reality clearly demonstrates the equity dimension of sustainable development thatis explicit in the Brundtland Commission’s seminal definition. The Brundtland report remarksthat “even the narrow notion of physical sustainability implies a concern for social equitybetween generations, a concern that must logically be extended to equity within eachgeneration.”48 According to Statistics Canada, “the spirit of sustainable development implies thatall people have the right to a healthy, productive environment and the economic and socialbenefits that come with it.” Therefore “equity, both among members of the present generationand between the present and future generations (is) a clear social objective that falls out of thedefinition.”49
45 This includes United Arab Emirates; United States of America; Canada; New Zealand; Finland; Norway; Kuwait;Australia; Sweden; Belgium & Luxembourg; and Denmark. Based on Living Planet report 2002 ecological footprintresults and population figures. See footnote 13.46 These nine countries are United Arab Emirates, United States of America, Canada, New Zealand, Finland,Norway, Kuwait, and Australia. Based on Living Planet Report 2002. See footnote 13.47 These 33 countries are Sri Lanka; Gambia; Albania; Bolivia; Afghanistan; Congo; Cote d’Ivoire; Liberia;Georgia; Armenia; Madagascar; Angola; Malawi; Lesotho; Togo; Nepal; Cambodia; Haiti; Laos; Congo, Dem.Rep.; Eritrea; Ethiopia; India; Vietnam; Yemen; Myanmar; Guinea-Bissau; Tajikistan; Pakistan; Sierra Leone;Bangladesh; Burundi; and Mozambique. Based on Living Planet report 2002. See footnote 13 above.48 World Commission on Environment and Development (Brundtland Commission) (1987). See footnote 3 above.49 Statistics Canada, 1997. See footnote 4 above.

GENUINE PROGRESS INDEX 22 Measuring Sustainable Development
Figure 4. Global Distribution Above and Below Per Capita Global Biocapacity, 1999
Note: Overshoot (or ecological deficit) occurs when human consumption and waste production exceed the capacityof the earth to create new resources and absorb waste. During overshoot, natural capital is liquidated to supportcurrent resource use, reducing the Earth’s ability to support future life.
Source: Based on the 1999 ecological footprint calculations from the Living Planet Report 2002.
A finite amount of bioproductive capacity implies that if certain populations overuse resources,there will be less available for others. Raising the living standards and consumption levels of theworld’s poor without curbing excess consumption in the industrialized world would put anintolerable strain on the Earth’s resources and waste assimilation capacity.
The resource consumption disparities are vast: Globally, the 20% of the world’s people in thehighest-income countries account for 86% of total private consumption expenditures, while thepoorest 20% account for a mere 1.3%.
• The richest one-fifth consume 45% of all meat and fish, the poorest fifth consume just5%;
• The richest one-fifth consume 58% of total energy, the poorest fifth less than 4%;• The richest one-fifth consume 84% of all paper, the poorest fifth 1.1%; and• The richest one-fifth own 87% of the world’s vehicle fleet, the poorest fifth less than 1%.

GENUINE PROGRESS INDEX 23 Measuring Sustainable Development
Figure 5. Global Ecological Footprint Breakdown, 1999
Source: Based on the 1999 ecological footprint calculations from the Living Planet Report 2002.
The excessive consumption by wealthy individuals and the wealthier regions of the globe clearlyoccurs at the expense of the poorer regions and of millions living in absolute poverty. Currentresource consumption by the world’s poorest citizens is frequently insufficient to meet basicneeds. Of the 4.4 billion people in developing countries, nearly three-fifths lack basic sanitation.Almost a third have no access to clean water. A quarter do not have adequate housing. A fifthhave no access to modern health services. A fifth of children do not attend school to grade five.And a fifth do not get enough dietary energy and protein. Millions still die annually from chronichunger and malnutrition.50
It is clear that in a world of limited resources, excess consumption by the rich directlyundermines the prospects for the poor. Despite our expressed concern to raise the livingstandard of the world’s poorest, we actually need a billion human beings to live in absolutepoverty without sufficient resources to sustain life and health in order to retain currentconsumption patterns in industrialized countries.
This is an admittedly crude way of expressing the stark reality that raising global livingstandards to current levels in the wealthy countries would put an intolerable strain on theEarth’s resources. If everyone in the world were to consume at Canadian levels, we wouldneed 4.6 planets Earth to provide the necessary resources and waste assimilation capacity. If
50 Statistics Canada, 1997. See footnote 4.

GENUINE PROGRESS INDEX 24 Measuring Sustainable Development
everyone in the world were to consume at PEI levels, we would need 4.7 planets Earth toprovide the necessary resources and waste assimilation capacity.51 Ecological footprintanalysis therefore makes it clear that global ecological sustainability depends on theaffluent reducing their present share of consumption so that those in poverty can meettheir basic human needs.52
6. The Connection Between Sustainability and Consumption
Comparing the ecological footprints of various countries effectively communicates thecomparative impacts of different levels of consumption on the environment. Figure 6demonstrates that the average Canadian person has an ecological footprint over 11 times greaterthan that of the average Indian or Chinese person and almost 17 times greater than that of anaverage Bangladeshi. This suggests that the average Canadian places the same demand on theplanet’s resources and waste assimilation capacities as 11 individuals from India or China and 17individuals from Bangladesh.
This reality sheds a completely different light on the world’s “population problem.” While theretends to be a global consciousness that sustainability requires the need to address overpopulation,ecological footprint analysis highlights the fact that sustainability is very much a consumptionissue and that the impact of population growth is dependent on consumption patterns. Forexample, the average U.S. citizen has an impact on the environment 18 times greater than that ofthe average Bangladeshi. The current Bangladesh footprint is 0.53 ha/capita, while the U.S.footprint is 9.7 ha/capita (Figure 6).
Put another way, every additional American puts a strain on the world’s resources equivalent to18 additional Bangladeshis. Theoretically, the population of Bangladesh, which was 134 millionin 1999, could total 5.13 billion before it would place the same human load on the Earth as theU.S. did in 1999 with its population of 280.4 million.
Even this is a conservative estimate. Erlich et al., using a different methodology, estimate thatthe average U.S. citizen has an impact on the environment that is 70 times greater than that of theaverage Bangladeshi. This suggests that the population of Bangladesh could reach 19.1 billionpeople before placing the same human load on the Earth as the U.S.53, 54
51 The 1999 average ecological footprint of Canadians (8.84 ha/capita) multiplied by the global population (5,979.8million) equals a total world biocapacity needed of 52.9 billion hectares. Compared to a total world biocapacity of11.4 billion hectares, this means that 4.64 planets earth would be required if everyone in the world were to consumeat the 1999 Canadian rate. The 1999 average ecological footprint of Prince Edward Islanders (8.98 ha/capita)multiplied by the global population (5,979.8 million) equals a total world biocapacity needed of 53.7 billionhectares. Compared to a total world biocapacity of 11.4 billion hectares, this means that 4.71 planets earth would berequired if everyone in the world were to consume at the 1999 PEI rate.52 For more information on ecological footprints and sustainability, see Wackernagel and Rees (1996. See footnote 7above).53 Erlich, P.R., Ehrlich, A.H., and G.C. Daily (1995). The Stork And The Plow. G.P. Putnam’s Sons, New York.Erlich et al. use I=PAT estimates to assess human impact on the environment. The IPAT model assumes that Impact= Population x Affluence x Technology.

GENUINE PROGRESS INDEX 25 Measuring Sustainable Development
Simply put, every baby born in Canada or the U.S. will deplete the Earth’s capacity to supporthuman life far more rapidly than many babies born in developing nations. While we are used todescribing the population explosion as a problem of developing countries, ecological footprintanalysis demonstrates that reducing the population of industrialized nations would have a fargreater impact on conserving resources than controlling population in Africa, Asia and thePacific region.
Figure 6. Per Capita Ecological Footprint of Selected Countries, 1999
Source: Living Planet Report 2002.
7. Global Sustainability Deficit
Sustainability requires that human activity remain within the carrying capacity of nature. It wasnoted earlier that dividing all the biologically productive land and sea on this planet by thehuman population results in an average of 1.9 hectares per person in the year 1999. It was alsonoted that setting aside 12% of the ecologically productive land for biodiversity preservation, asrecommended by the Brundtland report, shrinks the available bioproductive space per personfrom 1.9 hectares to just under 1.7 hectares. The ecological footprint can therefore function as abenchmark of sustainability by comparing the actual per capita consumption of a definedpopulation with the global per capita share of 1.7 ha. Consumption in excess of 1.7 ha per capitaimplies that a particular population is using resources and services at an unsustainable rate.
This excess consumption in relation to the per capita global area available is called the “globalsustainability deficit.”55 The global sustainability deficit, which expresses the ecological
54 United Nations Population Fund (1998). State of World Population 1998. www.unfp.org.55 The global sustainability deficit is based on the ecological deficit calculated in The Ecological Footprint OfNations Study (footnote 11), the Living Planet Report 2000 (footnote 12), and the Living Planet Report 2002(footnote 13).

GENUINE PROGRESS INDEX 26 Measuring Sustainable Development
footprint area above 1.7 ha, is calculated by subtracting a region’s per capita footprint from theavailable global ecological capacity per capita. Global sustainability deficits are presented inTables 1 and 2 and Figures 7 and 8. If a region’s per capita footprint is less than 1.7 ha, then theglobal sustainability deficit is negative, which is denoted by a plus sign in Tables 1 and 2.
Table 1. Global Sustainability Deficit of Selected Countries56
Ecological Footprint[gha/cap]
Global Sustainability Deficit[gha/cap]
Canada 8.8 -7.2United Arab Emirates 10.1 -8.5United States 9.7 -8.0Australia 7.6 -5.9Sweden 6.7 -5.1Japan 4.8 -3.1Ireland 5.3 -3.7China 1.5 +0.1India 0.8 +0.9Bangladesh 0.5 +1.1Global Average 2.3 -0.6Global Availability 1.7
Source: Deficit calculations are based on data from the Living Planet Report 2002.
Table 2. Global Sustainability Deficit by Region
Region Ecological Footprint[gha/cap]
Global Sustainability Deficit[gha/cap]
North America 9.6 -7.9Western Europe 5.0 -3.3Central & Eastern Europe 3.7 -2.0Latin America & Caribbean 2.2 -0.5Middle East & Central Asia 2.1 -0.4Asia - Pacific 1.4 +0.3Africa 1.4 +0.3Low Income Countries 0.8 +0.8Middle Income Countries 2.0 -0.3High Income Countries 6.5 -4.8Global Average 2.3 -0.6Global Availability 1.7
Source: Deficit calculations are based on data from the Living Planet Report 2002.
56 The ecological footprint figures do not include space set aside to preserve biodiversity because they representactual consumption patterns. The global availability (available land and sea area), however, assumes that 12% ofecologically productive space is set aside to preserve biodiversity, as recommended by the Brundtland Commission.In other words, the “availability” figure represents a target that accounts for the necessity to preserve biodiversity.

GENUINE PROGRESS INDEX 27 Measuring Sustainable Development
Figure 7. Global Sustainability Deficit of Selected Countries, 1999
Figure 8. Global Sustainability Deficit by Region, 1999
Tables 1 and 2 and Figures 7 and 8 show that the lifestyle of the average Canadian, with afootprint of 8.8 ha per capita, is clearly not sustainable on a global scale, and requires that we areexplicitly willing to allow millions of our fellow global citizens to live in poverty. As noted

GENUINE PROGRESS INDEX 28 Measuring Sustainable Development
above, if everyone in the world had an ecological footprint as large as the average Canadianecological footprint, it would require 4.6 planets Earth to sustain that level of consumption.
As seen in Table 1, Canada has a footprint size significantly greater than the 1.7 ha available perperson that would ensure global sustainability. In other words, Canadians are consumingresources at a rate that is 5.2 times greater than what is sustainable from a global perspective.Only the United Arab Emirates and the U.S. have larger footprints and therefore larger globalsustainability deficits than Canada. Out of seven regions listed in Table 2, North America has thelargest average footprint at 9.6 ha/cap and the largest global sustainability deficit at –7.9ha/capita. In other words, North Americans are consuming resources at a rate that is 5.65 timesgreater than what is globally sustainable.
8. Protected Areas
Ecological footprint analysis indicates the level of ecological deficit reduction that is needed, andit can point towards the actions required to reduce that deficit. An essential policy optionrecommended in The Living Planet Report 2002 to help reduce the current ecological deficit isthe conservation of natural and managed ecosystems in order to maintain ecological services.This would include, among other actions, the establishment and maintenance of networks ofprotected areas covering all terrestrial, freshwater, and marine ecosystem types.
Figure 9 shows the proportion of protected areas in Canada as a percentage of total land areaover a one hundred year period. While the steady increase seen since the 1970s is promising, theaverage percentage of protected land area in Canada in 2001 was 10.5% – still less than the 12%target recommended by the Brundtland Commission. Figure 10 shows the proportions ofprotected land by province in 2001.57 Only Alberta, British Columbia, and the Yukon have morethan 12% of their land area designated as protected. The remaining provinces are all below 12%.In PEI, only 4.2% of the province’s total land area was under protection in 2001, according tointernational standards.
Some questions for Canadians:• How much land area should Canadians set aside for protection?• Why has Canada not yet met the 12% international target for protection recommended by
the Brundtland Commission?• Is the 12% minimum set-aside recommended by the Brundtland Commission really
enough to maintain biodiversity and ecosystem health?• In a country that is well-endowed with natural spaces and relatively sparsely populated in
relation to total land mass, do we have an obligation to protect more?
57 All provincial governments signed on to the Endangered Spaces Campaign, a World Wildlife Fund initiative thatran from 1989 to 2000, and sought to ensure the completion of a protected network of Canada’s terrestrial regionsby the start of the new millennium. The goal of the campaign was to ensure that none of Canada’s designatedlandscape and habitat types become extinct.

GENUINE PROGRESS INDEX 29 Measuring Sustainable Development
Figure 9. Proportion of Total Protected Land in Canada, as a Percentage of Total LandArea, 1901-2001
Source: Environment Canada (2003). Environmental Signals. Canada’s National Environmental Indicator Series2003. Available at http://www.ec.gc.ca/soer-ree/English/default.cfm. Based on data from the Canadian Council onEcological Areas, Canadian Wildlife Service, Environment Canada.
Figure 10. Proportion of Total Protected Land by Province, 2001
Source: Government of British Columbia, State of Environment Reporting. Across Canada Comparison ofProtected Areas. Available at: http://wlapwww.gov.bc.ca/soerpt/1protectedareas/gcomparison.html.

GENUINE PROGRESS INDEX 30 Measuring Sustainable Development
9. Summary: Exceeding Global Sustainability Limits
As indicated, sustainability from a global perspective requires that humanity live within theresources and waste assimilation capacity provided by an average of 1.7 hectares per globalcitizen. Yet the current average global ecological footprint of 2.3 hectares per person alreadyexceeds this amount, and Canadians exceed the limit more than five-fold. We are currently ableto maintain this ecological overshoot by:
• Depleting stocks of non-renewable natural capital;• Depleting current ecological capacity in the form of renewable capital at the expense of
future generations; and• Appropriating the ecological carrying capacity of other places at the expense of those
regions’ populations.

GENUINE PROGRESS INDEX 31 Measuring Sustainable Development
PART IIITHE PRINCE
EDWARD ISLANDECOLOGICALFOOTPRINT

GENUINE PROGRESS INDEX 32 Measuring Sustainable Development
10. How Big is the Prince Edward Island EcologicalFootprint?
The 1999 ecological footprints of Canada and Prince Edward Island are presented in Table 3.The area required to sustain Prince Edward Island resource use and waste production (totalecological footprint) in 1999 was 8.98 hectares per person.58 This corresponds to the size of 11football fields59 or almost ten city blocks60 per person.
Table 3. Ecological Footprint, Canada and Prince Edward Island, 1999
Canada Prince Edward IslandTotal Footprint Total Footprint
Footprint Area [gha/cap] Footprint Area [gha/cap]
Food Footprint total arable land 2.16 total arable land 2.86 total pasture land 0.31 total pasture land 0.38 total sea 0.19 total sea 0.24total food footprint 2.66 total food footprint 3.49
Other Crops Footprinttotal other crops footprint 0.02 total other crops footprint 0.01
Forest Footprinttotal forest footprint total forest footprint(excluding fuel wood) 1.12 (excluding fuel wood) 0.93
Energy Footprint residential energy use 0.82 residential energy use 0.73 commercial energy use 0.61 commercial energy use 0.45 industrial energy use 1.92 industrial energy use 1.69 transportation energy use 1.40 transportation energy use 1.44total CO2 absorption land 4.74 total CO2 absorption land 4.30
Built-Up Footprinttotal built area footprint 0.31 total built area footprint 0.26
Total EcologicalFootprint – Canada 8.84
Total EcologicalFootprint – PrinceEdward Island
8.98
Note: Numbers may not add to totals due to rounding.
58 The 1999 Ecological Footprint estimate for Prince Edward Island is calculated based on differences in per capitadisposable income and consumption expenditures between Canada and PEI. Because the most recent year for whicha detailed footprint has been calculated for Canada is 1999, data for 1999 consumption patterns is used to adjust thisfootprint to PEI, and PEI footprint results in this report are for the year 1999 (with the exception of historical andprojected trends which are calculated using 1999 as the base year). Calculation spreadsheets are available bycontacting GPIAtlantic at [email protected] Assuming a Canadian football field size of 65x150 yards (0.815 ha).60 Assuming a typical city block size of 100,000 square feet (0.929 ha).

GENUINE PROGRESS INDEX 33 Measuring Sustainable Development
In 1999, Prince Edward Island had a population of 137,980, and a land area of 5,684.39 km2
(568,439 hectares).61 With an average per person footprint of 8.98 hectares, Prince EdwardIslanders required 1,239,060 hectares of land to support their consumption levels in 1999. Thismeans that the citizens of Prince Edward Island used the productive output of a land area 2.2times larger than the geographical area of the province to sustain themselves.
To maintain their levels of consumption in 1999, Prince Edward Islanders not only used theecological capacity from within their own province but appropriated additional ecologicalcapacity elsewhere on the planet through trade of goods and services that are derived fromnatural capital.62 In fact, if we look closely at the products Islanders consume, we will quicklysee that the vast majority of materials from which these products are made come from outside theprovince. In order to maintain 1999 levels of consumption, Prince Edward Islanders therefore aredependent both on the natural capital of their own land base and, to a much larger extent, uponthe resources and natural capital assets of other regions.
By maintaining a constant supply of goods, trade disguises the negative consequences of over-consumption and unsustainable resource use by transferring the impacts to other regions.Ecological footprint analysis exposes this discrepancy by attributing the consequences of a givenpopulation’s consumption directly to that population, no matter where on the planet the impactsoccur. For example, one can imagine a society that enjoys high material standards based on theknowledge industries and high-end service sector jobs, and that boasts excellent populationhealth, high levels of education, and seemingly sustained growth in its manufactured capital andeven natural capital stocks. By most standard national or provincial measures and criteria, thissociety would represent the essence of sustainability. However, if local gains in natural,economic, or social capital accumulation come at the expense of accelerating ecological damageand social disintegration elsewhere, then local prosperity comes at a cost to global sustainability.
The same is true in reverse. For example, the accelerated rate of forest harvesting and the loss ofold forests in Canada are the consequence of the global demand for pulp, paper and other timberproducts. In this case Canadians are experiencing the local impacts of global consumptionpatterns, just as there are global impacts from our local consumption patterns. In short,ecological footprint analysis enables consumers to assess the impacts of their consumptionpatterns no matter where those impacts occur. This report therefore addresses the impact ofconsumption both locally, in Prince Edward Island, and globally, and thus provides a morecomplete picture of the consequences of PEI consumption habits and demands than naturalresource accounts for the Island alone could provide.
Sustainability requires that human activity remain within the carrying capacity of nature. It wasnoted earlier that dividing all the biologically productive land and sea on this planet by thehuman population results in an average of 1.9 hectares per person. It was also noted that settingaside 12% of the ecologically productive land for biodiversity preservation, as recommended bythe Brundtland report, shrinks the available bioproductive space per person from 1.9 hectares to
61 Population: Statistics Canada, Cansim II, Table 051-0001: Estimates of population, by age group and sex,Canada, provinces and territories, annual. Land area: Statistics Canada (2001). Land Area in Square Kilometres,2001. Available at: www.statcan.ca. Square kilometres are converted to hectares by multiplying by 100.62 Wackernagel et al. (1999). See footnote 8.

GENUINE PROGRESS INDEX 34 Measuring Sustainable Development
just under 1.7 hectares. The ecological footprint can function as a benchmark of sustainability bycomparing the actual per capita consumption of a defined population with the global per capitashare of 1.7 ha. Consumption in excess of 1.7 ha per capita (sustainability deficit) implies that aparticular population is using resources and services at an unsustainable rate.
Tables 1 and 2 (Chapter 4 above) show that the lifestyle of the average Prince Edward Islander,with a footprint of 8.98 ha per capita, is clearly not sustainable on a global scale, unless Islandersare explicitly willing to allow millions of their fellow global citizens to live in poverty. PEI has afootprint size significantly greater than the 1.7 ha available per person that would ensure globalsustainability. PEI, in fact, has a global sustainability deficit of 7.3 ha per capita. In other words,Islanders are consuming resources at a rate that is over five times greater than what is sustainablefrom a global perspective.
11. How Does Prince Edward Island Compare to Canada?
Prince Edward Island’s ecological footprint of 8.98 ha per person is 1.6% larger than theCanadian ecological footprint of 8.84 ha per person. Table 3 and Figure 11 show that PrinceEdward Islanders have a 31% larger per capita food footprint than the Canadian average.Islanders consume more fish, seafood, meat, fats and oils, and sugars and sweeteners than theCanadian average. All of these foods have high footprint intensities. PEI’s other crops footprint,built area footprint, energy footprint, and timber footprint are all smaller than the Canadianaverage.
Figure 11. Ecological Footprints of Prince Edward Island and Canada, 1999

GENUINE PROGRESS INDEX 35 Measuring Sustainable Development
Table 4. Prince Edward Island and Canada: Income, Consumption and Footprint
PrinceEdwardIsland
CanadaPrince Edward
Island vs.Canada
Average household income before tax (C$2002) $38,323 $48,010 20% lessAverage per person income before tax (C$2002) $14,627 $18,609 21% lessDisposable income per person (C$2002) $15,730 $18,943 17% lessConsumption per household (C$2002) $27,664 $33,264 17% lessConsumption per person (C$2002) $10,559 $12,893 18% lessPer capita energy demand (gigajoules/year) 165 232 29% lessCO2 equivalent emissions per capita (tonnes) 21.4 22.7 5.7% lessVehicles per capita 0.66 0.80 18% lessEcological Footprint (gha/capita) 8.98 8.84 1.6% more
Note: CO2 equivalent emissions per capita are 2000 estimates. Motor vehicles per capita are based on 2002 motorvehicle registrations. Ecological footprint estimates are based on 1999 data. All other values are for 1998. Dollarvalues were converted to constant 2002 dollars using Statistics Canada’s Consumer Price Index.
Sources: Population: Statistics Canada, Cansim Matrix 6367-6377. Income, consumption, household size:Statistics Canada (2000). Spending Patterns in Canada 1998. Catalogue No. 62-202-XPE. Consumer price indices:Statistics Canada Cansim II, Table 326-0002: Consumer price index (CPI), annual. Energy demand: StatisticsCanada Cansim II, Table 128-0002: Supply and demand of primary and secondary energy; Total primary andsecondary energy; Energy use, final demand. CO2 emissions: Natural Resources Canada (1999). Canada’sEmissions Outlook: An Update. Available at: http://www.nrcan.gc.ca/es/ceo/update.htm. Motor vehicles:Statistics Canada Cansim II, Table 405-0004: Road motor vehicles, registrations, annual.
As indicated in Table 4, Prince Edward Island’s per capita and per household income, per capitaand per household consumption, per capita energy use, and per capita greenhouse gas emissionsare all less than the Canadian averages (by between 5.7% and 29%). Yet Prince Edward Island’sper capita ecological footprint is 1.6% larger. This is primarily due to differences in the food andenergy footprints discussed below.
If the ecological footprint is largely a consumption issue and per capita average consumption inPrince Edward Island is 18% lower than the Canadian average, why is the average PEIecological footprint 1.6% greater than the average Canadian ecological footprint? In addition tothe overall quantity of consumption, two other very important consumption and productionpatterns affect the size of a region’s ecological footprint:
What is being consumed?Which technologies are in use?
What is being consumed?
When an individual makes a consumption choice, alternative forms of the product or servicebeing consumed often exist, which may have differential environmental impacts and thusincrease or decrease an ecological footprint. For example, coal is much more carbon intensivethan hydroelectricity; organic and locally grown foods are less degrading to nature and less

GENUINE PROGRESS INDEX 36 Measuring Sustainable Development
energy-intensive than foods imported and transported from far distances and grown with largechemical and energy inputs such as fertilizers, pesticides, and heavy machinery. There are alsofuel-efficient car models, alternative transportation options, and energy saving householdappliances on the market that allow reductions in a household’s energy footprint. Choosing tolive in a single detached home as opposed to a home in a multiple unit complex, and makingchoices such as turning the heat down at night or insulating the attic can significantly affecthousehold energy use. Consumption “choices” therefore influence the impact that our levels ofconsumption have on our overall ecological footprint.
These choices are even more significant at a societal level. For example public investment inmass transit and integrated land use/transportation planning, rather than public dollars spent onroads and highway construction, can substantially reduce a society’s transportation footprint.Thus, planning policies that encourage the revitalization of urban centres rather than policies thatencourage suburban and ex-urban sprawl can have a significant impact on footprint size. In fact,without such “societal” choices to support more sustainable household consumption practices, itbecomes difficult for households to reduce their footprints to sustainable levels. Existing patternsof automobile dependence, urban sprawl, dependence on non-renewable energy sources, andreliance on imported foods and consumer items hamper even the most dedicated individualefforts to reduce our personal ecological footprint.
Prince Edward Island and Canadian energy sources
PEI’s energy footprint makes up almost 48% of the Island’s total ecological footprint. Asignificant factor influencing PEI’s ecological footprint size compared to that of Canada is thesource of energy used in PEI. Although Prince Edward Islanders consume 29% less energy perperson than the Canadian average, the PEI per person energy footprint is only 9% less than theCanadian average. The reason for this is PEI’s heavy dependence on residential heating oil andcommercial and industrial heavy fuel oil, both of which have a more substantial impact on theenvironment than hydroelectricity, for example. However, it should be noted thathydroelectricity is not a practical option in PEI.
On a per capita basis, Prince Edward Islanders use over six times the Canadian averageresidential heating oil and less than half the Canadian average residential electricity. Theecological footprint for 100 Gigajoules per year of energy derived from petroleum-based fossilfuels is more than 1 ha compared to just 0.1 ha for the same amount of hydroelectricity. Thedifference in energy intensity is accounted for in the ecological footprint analysis usingconversion ratios for different fuel sources (Table 5).63
Switching to renewable energy sources can dramatically reduce the energy footprint. Solar,wind, biomass, and hydrogen fuel cell energy have virtually no ecological footprint. NationalEnergy Board projections show, however, that the use of renewable energy as a percentage of
63 The footprint conversion ratios are based both on the land required to sequester the carbon emitted by the fuelsource and on the built-up land required to support the energy type. Further explanation of the footprint conversionratios is available in Wackernagel and Rees (1996. See footnote 7 above).

GENUINE PROGRESS INDEX 37 Measuring Sustainable Development
overall end use energy consumption in Atlantic Canada is expected to increase only marginallyfrom 10.8% in 1996 to 13.2% in 2025 (see Table 6).
The popularity of wood for space heating in Atlantic Canada, and the use of hog fuel and pulpingliquor as energy sources in the pulp and paper industry, account for the relatively largeproportion of renewable fuels consumed in the region. Nevertheless, a dramatic decrease in theenergy footprint will require an energy mix that includes a significant increase in renewableenergy sources to accompany a substantial decrease in dependence on petroleum-based fossilfuels.
Table 5. Footprint Conversion Ratios for Fuel Source
Energy Type Gigajoules [ha/capita] ratioCoal consumption 0.0178Liquid fossil fuel consumption 0.0137Fossil gas consumption 0.0105Nuclear energy consumption (thermal) 0.0137Energy embodied in net imported goods 0.0137Hydroelectricity consumption 0.0010
Source: Wackernagel and Rees (1996). Our Ecological Footprint: Reducing Human Impact on the Earth.
Table 6. Projected Renewable Energy Use for Atlantic Canada
1996 2000 2005 2010 2015 2020 2025Steam (petajoules) 4.8 4.1 3.1 1.9 2.0 2.1 2.0Hog Fuel, Pulping Fuel,Wood (petajoules) 66.2 70.6 70.7 71.8 72.9 74.2 74.4
Solar - - - - - - -Percent of total end useenergy consumption 10.8% 11.5% 12.2% 13.2% 13.4% 13.1% 13.2%
Source: National Energy Board (1999). Canadian Energy Supply and Demand to 2025.
Technologies in use
Similarly, different technologies can substantially influence footprint size, beyond what might beindicated by a simple societal comparison of per capita consumption. The level and type oftechnology used in food production, wood harvesting, building design, and manufacturing willhelp determine a population’s footprint size. Energy, for example, can be derived frompetroleum, coal, natural gas, windmills, biomass, solar panels, or fuel cells, all of which havevery different impacts on the environment. Denmark’s increasing reliance on wind energy willreduce that country’s ecological footprint even if total energy consumption does not drop.
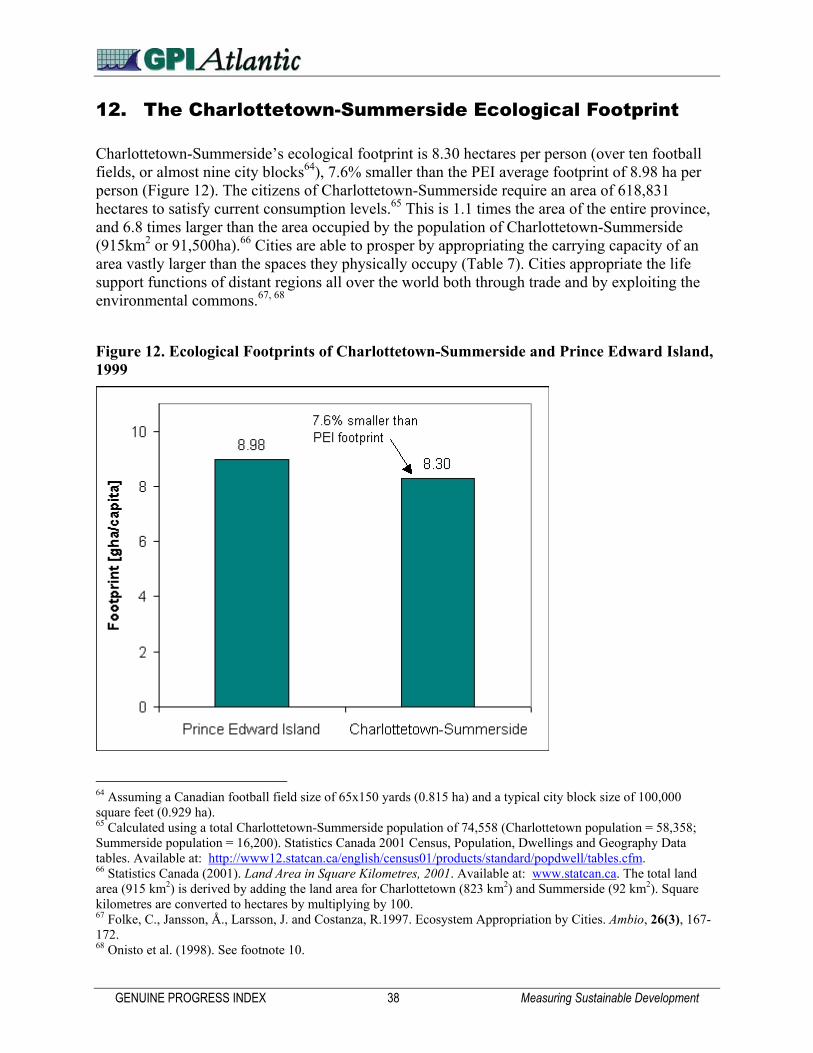
GENUINE PROGRESS INDEX 38 Measuring Sustainable Development
12. The Charlottetown-Summerside Ecological Footprint
Charlottetown-Summerside’s ecological footprint is 8.30 hectares per person (over ten footballfields, or almost nine city blocks64), 7.6% smaller than the PEI average footprint of 8.98 ha perperson (Figure 12). The citizens of Charlottetown-Summerside require an area of 618,831hectares to satisfy current consumption levels.65 This is 1.1 times the area of the entire province,and 6.8 times larger than the area occupied by the population of Charlottetown-Summerside(915km2 or 91,500ha).66 Cities are able to prosper by appropriating the carrying capacity of anarea vastly larger than the spaces they physically occupy (Table 7). Cities appropriate the lifesupport functions of distant regions all over the world both through trade and by exploiting theenvironmental commons.67, 68
Figure 12. Ecological Footprints of Charlottetown-Summerside and Prince Edward Island,1999
64 Assuming a Canadian football field size of 65x150 yards (0.815 ha) and a typical city block size of 100,000square feet (0.929 ha).65 Calculated using a total Charlottetown-Summerside population of 74,558 (Charlottetown population = 58,358;Summerside population = 16,200). Statistics Canada 2001 Census, Population, Dwellings and Geography Datatables. Available at: http://www12.statcan.ca/english/census01/products/standard/popdwell/tables.cfm.66 Statistics Canada (2001). Land Area in Square Kilometres, 2001. Available at: www.statcan.ca. The total landarea (915 km2) is derived by adding the land area for Charlottetown (823 km2) and Summerside (92 km2). Squarekilometres are converted to hectares by multiplying by 100.67 Folke, C., Jansson, Å., Larsson, J. and Costanza, R.1997. Ecosystem Appropriation by Cities. Ambio, 26(3), 167-172.68 Onisto et al. (1998). See footnote 10.

GENUINE PROGRESS INDEX 39 Measuring Sustainable Development
Table 7. Ecological Footprint of Cities
Region Area Occupied ByPopulation
Land Area Required ToSustain Population
Charlottetown-Summerside 915 km2 6.8 times area of cityHalifax Regional Municipality 5,580 km2 5 times area of cityToronto 630 km2 287 times area of cityLondon, England 1,580 km2 125 times area of citySantiago, Chile* 900 km2 300 times area of cityLargest 29 cities of BalticEurope
1% of Baltic Seadrainage basin
75% to 1.5 times the wholeBaltic Sea drainage area
* Santiago metropolitan area contains 791,581 ha of which 701,619 ha are ecologically protected and not occupiedby the population. Therefore the ecological footprint is assessed only for the non-protected portion of Santiago.
Sources: Charlottetown-Summerside: calculated by adjusting the PEI ecological footprint based on differences inconsumption and expenditures between Charlottetown-Summerside and PEI. Halifax Regional Municipality:Angus Schafenburg, Halifax Regional Municipality Planning Services Office, personal communication, 2000. TheHRM footprint is calculated based on income and consumption patterns in Statistics Canada’s Family Expenditurein Canada and Canadian Statistics, Households. Available at: www.statcan.ca. Toronto: Onisto et al., (1998. Seefootnote 10 above). London: Green Channel, 2000. Reducing London’s Ecological Footprint. Available at:www.greenchannel.com. Santiago de Chile: Wackernagel (1998. See footnote 26 above). Largest 29 cities ofBaltic Europe: Folke et al. (1997. See footnote 67 above).
Cities can, however, contribute significantly towards the overall sustainability of a region.This is possible because the high-density populations of cities offer the potential for moreefficient land and infrastructure use as well as reduced transportation and residential heatingrequirements. In contrast to the potential footprint savings that cities offer, there tends to be agreater concentration of wealth with a corresponding greater amount of consumption in urbancentres, which partly offsets ecological footprint gains due to economies of scale. TheCharlottetown-Summerside ecological footprint, for example, is 8.3 hectares, 7.6% smaller thanthe provincial average ecological footprint per person. Charlottetown-Summerside’s per capitaconsumption is 11% less than the Canadian average, but is 9.5% greater than the provincialaverage, so there is some ecological offset produced by the efficiencies of higher density living(Table 8).
In urban areas, larger populations can more easily support public transportation options. It is alsofar easier to implement policies that discourage personal vehicle use, such as high occupancyvehicle lanes, high parking costs and user-pay roads. Annual transit ridership in Canada has beenincreasing since 1998, reaching 1.5 billion in 2000, with service available to approximately 95%of urban residents and 61% of the 30 million residents of Canada.69 However, transit usage(passenger trips per capita) has not kept pace with population growth over the years. In PrinceEdward Island, only 0.2% of Charlottetown residents and 0.1% of Summerside residents usepublic transportation as a mode of transportation to work, in comparison to the Canadametropolitan area average of 10.5% (Figure 13). However, there is no significant publictransportation in PEI, compared to other metropolitan areas in Figure 13. 69 Transport Canada (2002). Urban Transport in Canada: Taking Stock. Available on the Transport Canada website: http://www.tc.gc.ca/programs/environment/urbantransportation/transitstudies/urban.htm.

GENUINE PROGRESS INDEX 40 Measuring Sustainable Development
High-density housing and typically smaller homes found in urban areas reduce residential energyrequirements. The higher density population also makes it easier to implement othersustainability initiatives such as compost and recycling programs that can sharply reducepressure on landfills.70 In short, the economics of scale in urban areas potentially allowconsiderably smaller ecological footprints than in more rural areas. Unfortunately, the trendtoward suburban and ex-urban sprawl in urban centres impedes the ability to realize thesepotential footprint reductions and efficiencies.
Table 8. Ecological Footprint and Consumption Expenditure for Canada, Prince EdwardIsland, and Charlottetown-Summerside, 1999
Canada Prince EdwardIsland
Charlottetown-Summerside
Consumption (C$2002/capita) $12,893 $10,559 $11,562Ecological Footprint (ha/capita) 8.84 8.98 8.30
Source: Consumption: Statistics Canada (2000). Spending Patterns in Canada 1998. Catalogue No. 62-202-XPE.
Figure 13. Metropolitan Area Public Transit Use in Commuting to Work, 2001
Source: Statistics Canada, 2001 Census, Commuting to Work. Catalogue No. 97F0015XCB01002.
70 For more information on the ecological footprint of cities please see Rees, W. (1997). “Is Sustainable City anOxymoron?” Local Environment, 2, 303-310.

GENUINE PROGRESS INDEX 41 Measuring Sustainable Development
13. Not All Prince Edward Islanders Have Equal FootprintSizes
Not everybody in Prince Edward Island has the same footprint size. Although the averagefootprint is large, there is considerable income disparity in the province, which is reflected indifferent consumption patterns and footprint sizes. In order to assess the difference between theecological footprints of higher and lower income Islanders, the average individual (per capita)disposable incom71 of each income quintile72 in Prince Edward Island has been adjustedaccording to the average Canadian individual consumption level by quintile.73, 74 Because theecological footprint is a function of consumption patterns, which in turn vary according toincome, this method is a reasonable proxy that can be used to adjust the average provincialfootprint for different income groups.
Table 9 and Figure 14 show that the poorest 20% of Prince Edward Islanders (1st quintile)consumed about 15% less energy, food, and other goods than the average Islander in 1999, whilethe richest 20% consumed about 27% more. Assuming consumption is proportional to ecologicalfootprint, it can be estimated that the poorest 20% of Prince Edward Islanders had a footprint of7.63 ha per person while the wealthiest 20% of Islanders had a footprint of 11.4 ha per person.This means that the average wealthy Islander had almost one and a half times the impact on theenvironment of the average low-income Islander. Although their footprint is larger, wealthyPrince Edward Islanders, by having greater spending options, have more potential control overconsumption choices that affect ecological footprint size.
71 “Disposable income” is the amount of income left over after income taxes and social security contributions havebeen paid. This is different from total income, which is calculated before income taxes are deducted. Disposableincome statistics are reported by Statistics Canada on a per household basis. Individual disposable income wascalculated using the average number of people per household by quintile. Using household size by quintile dataprovides for the difference in household size by income group.72 The term “quintile” simply means “one-fifth,” and refers to five income groups ranked from the top 20% ofincomes to the bottom 20% of incomes. To assess quintiles, all incomes in a given population are ranked from thelowest to the highest and then divided into five groups. Thus the bottom one-fifth of incomes is referred to as the“first quintile,” the top one-fifth as the “fifth quintile,” and the middle 20% of incomes as the “third quintile.”73 “Consumption” refers to expenses incurred for food, shelter, household operations, household furnishings andequipment, clothing, transportation, health care, personal care, recreation, reading materials, education, tobaccoproducts and alcoholic beverages, games of chance, and a miscellaneous group of items. Consumption statistics arealso reported by Statistics Canada on a per household basis. Individual consumption was calculated using theaverage number of people per household by quintile.74 Data sources: Statistics Canada (2000). Income in Canada, 1998. Catalogue No. 75-202-XIE; Statistics Canada(2000). Spending Patterns in Canada, 1998. Catalogue No. 62-202; and Statistics Canada Cansim II, Table 326-0002: Consumer Price Index. Detailed calculation spreadsheets are available by contacting GPIAtlantic [email protected].

GENUINE PROGRESS INDEX 42 Measuring Sustainable Development
Table 9. Prince Edward Island Ecological Footprint by Income Quintile, 1999
1stQuintile
2ndQuintile
3rdQuintile
4thQuintile
5thQuintile Average
Average household size, Canada 1.60 2.23 2.63 3.06 3.37 2.58Per capita consumption, Canada(C$2002) $9,022 $10,296 $11,906 $13,141 $17,034 $12,893
Per capita disposable income,Canada (C$2002) $5,713 $8,987 $11,581 $14,547 $23,182 $14,129
Ratio of consumption per capita todisposable income per capita,Canada
1.58 1.15 1.03 0.90 0.73 0.91
Per capita disposable income, PEI(C$2002) $7,250 $10,007 $12,330 $15,084 $23,227 $14,766
PEI consumption based onCanadian ratio of consumption todisposable income (C$2002/capita)
$11,448 $11,465 $12,676 $13,626 $17,067 $13,475
Ecological Footprint (ha/capita) 7.63 7.64 8.45 9.08 11.4 8.98
Sources: Statistics Canada (2000). Income in Canada, 1998. Catalogue No. 75-202-XIE; and Statistics Canada(2000). Spending Patterns in Canada, 1998. Catalogue No. 62-202. Dollar values were converted to constant 2002dollars using Statistics Canada’s Consumer Price Index.
Figure 14. Ecological Footprint by Income Quintile, Prince Edward Island, 1999

GENUINE PROGRESS INDEX 43 Measuring Sustainable Development
14. Ecological Footprint – A 40 Year Perspective
Using 1999 as the base year, the ecological footprints for Canada and Prince Edward Island werecalculated for 1981-1998 and 2000. To construct this timeline, the food, forest, and otherfootprints were adjusted for changes in consumption expenditures, the built-up footprint wasadjusted for changes in population, and the energy footprint was adjusted for changes in energydemand over this period. The assumptions underlying these adjustments are described below:
1) Based on the assumption that consumption is proportional to ecological footprint, asnoted in the previous section, historical data on average disposable income were adjustedto reflect changes in consumption levels, based on a four-year average ratio ofconsumption to disposable income. One reason this adjustment to the income data isnecessary is that there is likely to be a higher rate of savings at higher levels of disposableincome, whereas at lower levels, households are likely to spend a higher portion of theirincomes. Because historical consumption expenditure data are not available prior to1997,75 consumption data for 1997-2001 were used to adjust the available historicaldisposable income data to reflect consumption expenditures for both Canada and PEI.The adjusted disposable income data were then used to adjust the 1999 food, other crop,and forest footprints, according to the difference between adjusted per capita disposableincome in 1999 and each respective year.76
2) Assuming that population is proportional to built-up area footprint, the built-up areafootprints were calculated based on the difference between the population in 1999 andeach respective year.77
3) Assuming that per capita energy demand is proportional to energy footprint, historical percapita energy demand data were used to adjust the 1999 energy footprint according to thedifference between per capita energy demand in 1999 and each respective year.78
4) The above data were then combined to estimate the Canadian and Prince Edward Islandfootprints for each year.
As indicated in Table 10, Prince Edward Island’s total ecological footprint grew between 1981and 2000 by 65%, increasing from 5.79 hectares per capita to 9.53 hectares per capita. During 75 Until 1996, the Family Expenditure Survey was held every four years. Beginning with the 1997 reference year, anew annual survey, the Survey of Household Spending, was conducted. The Survey of Household Spending has asample size approximately 50% larger than that of the Family Expenditure Survey. The number of questions abouthousehold spending in the Family Expenditure Survey is considerably lower than in previous surveys, with the resultthat, for some expenditure categories, less detailed information is presented. Therefore, data from the Survey ofHousehold Spending and the Family Expenditure Survey are not directly comparable. In order to use the most up-to-date consumption data for this report, 1997-2001 consumption data for both Canada and PEI were used to calculatea four-year average ratio of consumption to disposable income which was then applied to historical disposableincome data for Canada and Prince Edward Island.76 Data sources: Statistics Canada Cansim II, Table 384-0012: Sources and disposition of personal income;Personal disposable income. Statistics Canada, Cansim II, Table 203-0001: Household current consumption.Individual consumption was calculated from household consumption using the average number of people perhousehold. Detailed calculation spreadsheets are available by contacting GPIAtlantic at [email protected] Statistics Canada, Cansim Matrix 6967-6977.78 Statistics Canada, Cansim II, Table 128-0002: Supply and demand of primary and secondary energy; Totalprimary and secondary energy; Energy use, final demand. Detailed calculation spreadsheets are available bycontacting GPIAtlantic at [email protected].

GENUINE PROGRESS INDEX 44 Measuring Sustainable Development
the same period the Canadian ecological footprint grew by 32% from 6.97 hectares per capita to9.18 hectares per capita. The food and “other footprint” (which includes the other crop, forest,and built-up footprints) categories, representing general purchases and overall consumptionlevels, saw the greatest increase between 1981 and 2000. PEI’s food footprint increased by 135%and PEI’s other footprint grew by 91% between 1981 and 2000. The Canadian food and otherfootprints increased by 115% between 1981 and 2000.
Table 10. Percentage Increases in Footprint Size, Prince Edward Island and Canada, 1981-2000
Prince Edward Island CanadaEnergy Footprint 29% 0%Food Footprint 135% 115%Other Footprint (other crop, forest,and built-up area footprints) 91% 115%
Total Ecological Footprint 65% 32%
Table 11 and Figure 15 reveal that Prince Edward Island’s ecological footprint was highest in2000 with a total footprint of 9.53 hectares per person. In 1981, PEI’s energy footprint made up3.57 hectares per capita, or 62% of the total ecological footprint per person. In 2000, PEI’senergy footprint of 4.59 hectares per capita was 48% of the Island’s total ecological footprint perperson. In 1981, Canada’s energy footprint of 4.86 hectares per capita made up 70% of thenational average total ecological footprint per person. The Canadian ecological footprint reachedits highest level in 2000 with a footprint of 9.18 hectares per capita including an energy footprintof 4.86 hectares per capita, or 53% of the total ecological footprint per person (Table 11 andFigure 16).
Table 11. Historical Ecological Footprint Highlights
Prince Edward Island1981 2000 Smallest footprint Largest footprint
Energy Footprint 3.57 4.59 3.16 (1983) 4.59 (2000)Food Footprint 1.57 3.68 1.57 (1981) 3.68 (2000)Other Footprint (other crop, forest,and built-up area footprints) 0.66 1.26 0.66 (1981) 1.26 (2000)
Total Ecological Footprint 5.79 9.53 5.79 (1981) 9.53 (2000)
Canada1981 2000 Smallest footprint Largest footprint
Energy Footprint 4.86 4.86 4.41 (1983) 4.86 (2000)Food Footprint 1.31 2.81 1.31 (1981) 2.81 (2000)Other Footprint (other crop, forest,and built-up area footprints) 0.71 1.52 0.71 (1981) 1.52 (2000)
Total Ecological Footprint 6.97 9.18 6.77 (1983) 9.18 (2000)

GENUINE PROGRESS INDEX 45 Measuring Sustainable Development
Figure 15. Historical Ecological Footprints, Prince Edward Island, 1981-2000
Figure 16. Historical Ecological Footprints, Canada, 1981-2000

GENUINE PROGRESS INDEX 46 Measuring Sustainable Development
Between 1981 and 2000, the PEI energy footprint grew by 29%, reflecting greater fossil fuelconsumption, while the Canadian energy footprint did not increase in the same time period, dueto greater reliance on hydroelectric and nuclear power rather than fossil fuels. According tohistorical data, Prince Edward Island and Canadian energy demand (and therefore energyfootprint sizes) showed a slight decrease in the early 1980s, primarily due to higher energyprices, improved energy efficiency, more fuel-efficient automobiles, improved building materialsand insulation, and other conservation measures. As well, the recession of the early 1980sreduced consumption spending. Increased consumption of energy in Canada in the 1990s,however, has outstripped the nation’s early energy efficiency gains.
Although the average PEI total ecological footprint per person was smaller than the averageCanadian ecological footprint per person between 1981 and 1990, the PEI footprint was largerthan the Canadian footprint in eight of the ten years between 1991 and 2000 (Figure 17). Thischange is due largely to the increase in PEI’s energy footprint, while Canada’s energy footprinthas remained stable. This reflects PEI’s continued reliance on fossil fuels, compared to Canada’sincreased reliance on hydroelectric and nuclear power. However, it should be noted thathydroelectricity is not a practical option for PEI, due to limited space for hydroelectric facilities.
Figure 17. Ecological Footprint, Prince Edward Island and Canada, 1981-2000
Using 1999 as the base year, the ecological footprints for Canada and Prince Edward Island wereprojected for five-year periods from 1995 to 2020. These estimates are also based on theassumptions that per capita consumption is proportional to the food, other crop, and forest

GENUINE PROGRESS INDEX 47 Measuring Sustainable Development
footprints, that population is proportional to the built-up area footprint, and that per capita energydemand is proportional to the energy footprint. Projected disposable income data for Canada andPEI were adjusted based on a four-year average ratio of Canadian and PEI consumptionexpenditures to disposable income. The projected consumption expenditures were then used toadjust the 1999 food, other crop, and forest, and footprints, according to the projected changes inadjusted per capita disposable income in 1999 and each respective year.79 Projected built-up areafootprints were estimated using Statistics Canada population projections.80 Projected per capitaenergy demand data were used to adjust the 1999 energy footprint according to the differencebetween per capita energy demand in 1999 and each respective year.81
The Prince Edward Island ecological footprint will continue to increase unless there is asignificant commitment to a sustainable future and major changes both in personal choices and insocial and political decision-making patterns. Based on current trends, the Prince Edward Islandper capita footprint is projected to grow by an additional 20% from 8.98 ha per person to 10.76ha per capita between 1999 and 2020 (Figure 18). Figure 18 shows that, while the province’senergy footprint is expected to stabilize due to natural gas conversion in the region, consumptionof goods and services is expected to increase.
Prince Edward Island’s per capita ecological footprint is projected to grow at a similar rate to theCanadian footprint, due primarily to similar projected growth in consumption, disposableincome, and energy demand (Figures 18 and 19). By 2020 the Canadian ecological footprint isexpected to total 10.81 ha per person (Figure 19), almost identical to the projected PrinceEdward Island footprint.
These GPI estimates are close to other Canadian ecological footprint projections. Studies byOnisto et al. (1998) suggest that the Canadian footprint could total 11.8 ha/capita by 2015,compared to our projected Canadian footprint of 10.48 ha (11% smaller) per person in 2015(Figure 19).82 It should be noted that the projections for PEI and Canada presented in Figures 18and 19 are more conservative than the actual historical footprint trends, based on historical data,shown in Figures 15 through 17. For example, the historical footprint for PEI in 2000, based onactual energy, population, income, and consumption data for that year, is 9.53 ha per person. Theprojected footprint for 2000, based on the assumptions about growth in energy demand,population, and consumption described earlier, is 8.95 ha per person, 6% less than the historicalfootprint. The same is true for the Canadian footprint, with the projected footprint 3% less thanthe historical footprint. In sum, the projections in Figures 18 and 19 below are likely to be low-end estimates, and the potential footprints may actually grow at a considerably more rapid ratethan indicated here, unless concerted action is taken in a timely way.
79 Natural Resources Canada (1999). Canada’s Emissions Outlook: An Update. Available at:http://www.nrcan.gc.ca/es/ceo/update.htm.80 Statistics Canada, Cansim Matrix 6900, Projected Population by Sex and Age Group, Projection 2 for Canada, andCansim Matrix 6902, Projected Population by Sex and Age Group, Projection 2 for PEI.81 National Energy Board (1999). Canadian Energy Supply and Demand to 2025. Appendix 3: Demand. TablesA3.9a: End Use Demand by Fuel, Case 1, Atlantic Provinces, PEI; and A3.1a: Demand, Case 1, Canada. Case 1(Current Demand Trends Case) refers to a business as usual scenario for economic growth, and an average growth inenergy demand of 1.4% per year.82 Onisto et al., (1998). See footnote 10.

GENUINE PROGRESS INDEX 48 Measuring Sustainable Development
Figure 18. Projected Ecological Footprints, Prince Edward Island, 1995-2020
Figure 19. Projected Ecological Footprints, Canada, 1995-2020

GENUINE PROGRESS INDEX 49 Measuring Sustainable Development
15. Ecological Footprint and Gross Domestic Product
Conventionally, GDP growth is taken as the primary indicator of how “well off” we are as asociety, with a higher per capita GDP denoting higher consumption levels and greater wellbeing.From the GPI perspective, on the other hand, a smaller ecological footprint denotes less impacton the environment and correspondingly greater long-term wellbeing and sustainability.
Whether a smaller footprint is indeed a sign of progress clearly depends on each nation’scircumstances. In the case of Prince Edward Island, with an average footprint of 8.98 ha perperson in 1999, a smaller footprint is essential to sustainability and to ensure the wellbeing offuture generations. On the other hand, many countries with exceptionally small footprints, suchas Bangladesh and India, will be able to increase both per capita GDP and their ecologicalfootprints in order to secure basic human needs, without exceeding the 1.7 ha per personecological “bottom line.” As indicated earlier, in a world of finite resources, large footprints bysome depend on smaller footprints for others, so the paths to sustainability are correspondinglydifferent, according to different circumstances and conditions.
The GDP and the ecological footprint, however, are not simply separate indicator sets pointingtowards contrasting assessment and measurement systems. Economic growth is the primarydriver of ecological footprint growth, because it generally denotes higher consumption levels.Figure 20 indicates that ecological footprint growth has largely followed per capita GDP growth.
The Prince Edward Island GDP per person grew by 57% between 1981 and 2000 from $13,281to $20,844 (C$2002).83 In conventional terms it is almost heresy to suggest that this growth is notinherently a “good” thing. Ecological footprint analysis, however, suggests that the morecomplex relationship between economic growth, increased consumption, environmentaldegradation, waste production, and the rate of resource depletion must at least be considered if asmuch value is placed on the wellbeing of future generations as is placed on the currentgeneration.
Just as excess spending can leave a massive legacy of debt, so continued growth andconsumption today are likely to leave a serious environmental debt that the next generation willbe forced to pay. By valuing natural wealth as well as human-made wealth, and by recordingnatural capital depletion as a cost in the same way that human-made capital depreciates and isused up, the GPI can provide an antidote to the over-simplistic equation of GDP growth withwellbeing. The suggestive alignment of GDP growth with ecological footprint growth furtherchallenges us to explore alternative ways of enhancing wellbeing other than by increasedmaterial accumulation and consumption.
83 Statistics Canada, Cansim II, Table 384-0002: Gross Domestic Product, expenditure-based. Dollar values wereconverted to constant 2002 dollars using Statistics Canada’s Consumer Price Index.

GENUINE PROGRESS INDEX 50 Measuring Sustainable Development
Figure 20. Gross Domestic Product and Ecological Footprint, 1981-2000
Source: Statistics Canada, Cansim II, Table 384-0002: Gross Domestic Product, expenditure-based. Dollar valueswere converted to constant 2002 dollars using Statistics Canada’s Consumer Price Index.

GENUINE PROGRESS INDEX 51 Measuring Sustainable Development
PART IVREDUCING PRINCEEDWARD ISLAND’S
ECOLOGICALFOOTPRINT

GENUINE PROGRESS INDEX 52 Measuring Sustainable Development
In 1999, energy (including transportation and household energy use) and food consumptionaccounted for 7.78 hectares per person or 87% of the average Prince Edward Islander’secological footprint. It is within these two areas that Prince Edward Islanders can make thegreatest reductions in their personal footprint and help lead Prince Edward Island toward ahealthy, sustainable future. These two areas should also be the primary focus of social andeconomic policy attention to guide Prince Edward Island toward sustainable transportation, landuse, and consumption patterns.
The PEI energy footprint alone, at 4.3 hectares per person, is over 2½ times greater than the totalglobal sustainability threshold of 1.7 ha per global citizen. Within the energy sector, social andpersonal decisions and actions concerning transportation and household energy use will have themost significant impact both on an individual’s personal footprint and on the provincial footprintas a whole.
The following sections therefore explore the Prince Edward Island transportation footprint,household energy footprint and food footprint separately, and conclude with reviews of PrinceEdward Island’s tourism industry and solid waste management practices, and their potentialimpact on the Island’s ecological footprint. These sections propose concrete actions can be takenas individuals and as a society to reduce the impact of the lifestyles of Islanders on the Earth andthereby to ensure a more secure future for future generations.
16. Transportation Footprint
An expanding transportation footprint
In 1999, Prince Edward Island’s average transportation footprint totaled an area of 1.44 ha perperson, or 16% of PEI’s total ecological footprint. The transportation footprint consists primarilyof direct fossil fuel combustion in driving; indirect energy consumption for car manufacturingand road maintenance; and the physical built space occupied by roads.
Between 1990 and 2020, the total energy demand for road transportation is expected to grow by33% in the province, average vehicle kilometres travelled (VKT) are projected to increase by8.4%, and the number of passenger vehicles is projected to increase by 41% (Table 12). Asindicated in Table 12, the average Prince Edward Island car travelled 26,200 kilometres a year in1990. Natural Resources Canada estimates that this will increase to 28,402 kilometres a year by2020. Factors contributing to VKT growth include suburban and ex-urban sprawl, longercommutes to the workplace, and an increase in domestic road vacations. These trends areexpected to increase the province’s transportation footprint by 24% between 1990 and 2020,compared to an increase of 21% in the national transportation footprint (Figure 21).84
84 The transportation footprints for 1990-1998 and 2000-2020 were calculated by adjusting the 1999 transportationfootprint according to the change between per capita transportation energy demand in 1999 and in each respectiveyear. Natural Resources Canada (1999). Canada’s Emissions Outlook: An Update. Available at:http://www.nrcan.gc.ca/es/ceo/update.htm. Detailed calculation spreadsheets are available by contactingGPIAtlantic at [email protected]

GENUINE PROGRESS INDEX 53 Measuring Sustainable Development
Table 12. Transportation Energy Demand, Prince Edward Island, 1990 and 2020
1990 2020 PercentageIncrease
Passenger car stock (number of cars) 39,000 55,000 41%Passenger cars per household 0.87 0.94 8.0%Average vehicle kilometres travelled (VKT/vehicle) 26,200 28,402 8.4%Transportation energy demand (petajoules) 9.9 13.2 33%Transportation energy demand per capita (gigajoules/capita) 75.6 77.5 2.5%Transportation footprint (ha/capita) 1.40 1.74 24%
Sources: Natural Resources Canada, 1999, Canada’s Emissions Outlook: An Update.
Figure 21. Estimated Transportation Footprint, Prince Edward Island, 1990-2020
Note: Projected transportation footprint from 2000 to 2020 increase assumes a 1.0% annual increase intransportation energy use based on Natural Resources Canada forecasts.
In addition to the burden of increased energy consumption, an increase in VKT and a largervehicle fleet will have significant impacts on overall ecological footprint in other ways. This willoccur from the need for more road infrastructure and maintenance, increased pollution and wasteproduction, and reduced wildlife habitat. Other more subtle and indirect costs of transportationand automobile dependence, such as reduced community interaction, decreased mobility for non-

GENUINE PROGRESS INDEX 54 Measuring Sustainable Development
drivers, and the extra burden placed on the health care system due to road accidents, also haveimpacts on quality of life and community wellbeing.85
How does Prince Edward Island compare to Canada?
Prince Edward Islanders depend heavily on their vehicles, driving an average of 27,310kilometres in 2000 per vehicle and spending an average of $6,988 a year per household ontransportation costs (Table 13). In comparison to other Canadians, Prince Edward Islanders haveslightly more registered vehicles per person, and drive slightly more kilometres per passengervehicle, while having shorter mean commuting distances to their places of work.
Table 13. Transportation Use, Prince Edward Island and Canada, 2000
Prince EdwardIsland Canada
Passenger car stock (number of cars) 43,000 10,874,000Motor vehicle registrations per capita 0.56 0.54Average vehicle kilometres travelled (VKT/vehicle) 27,310 19,995Transportation energy demand (petajoules) 10.9 2,476.5Transportation energy demand per capita (gigajoules/capita) 79.0 80.4Amount spent on transportation per household (C$2002) $6,988 $7,596% of household budget spent on transportation 15% 13%Mean commuting distance to workplace (kilometres) 5.5 7.2Transportation footprint (ha/capita) 1.44 9.19
Sources: Passenger car stock, average vehicle kilometres travelled, and transportation energy demand:Natural Resources Canada, 1999, Canada’s Emissions Outlook: An Update. Motor vehicle registrations:Statistics Canada, Cansim II, Table 405-004. Transportation expenditures: Statistics Canada, Cansim II, Table203-001. Commuting distance: Statistics Canada, Commuting Distance, 2001 Census, Catalogue No.97F0015XCB01001.
Prince Edward Islanders spend less per household on transportation than the Canadian average,but slightly more when transportation costs are considered as a percentage of the total householdbudget. Both Prince Edward Islanders and Canadians spend more on transportation than anyother expenditure category (including food) with the exception of shelter and taxes.86 Note thatthese transportation costs are direct internal costs only borne by households, and do not include“external” social and environmental costs like road maintenance, accidents, and pollution.
85 Burchell, et al. (1998). The Costs of Sprawl – Revisited, TCRP Report 39, Transportation Research Board.Available at: www.nas.edu/trb; Johnson, E. (1993). Avoiding the Collision of Cities and Cars, American Academyof Arts and Sciences, Chicago; and Appleyard, D. (1981). Livable Streets, University of California Press, Berkeley.86 PEI household expenditure breakdown 2002: 17% personal income tax, 18% shelter, 15% transportation, 13%food. Canada household expenditure breakdown 2002: 21% personal income tax, 19% shelter, 13%transportation, 11% food. Source: Statistics Canada, Cansim II, Table 203-001: Average household expenditures,provinces and territories.

GENUINE PROGRESS INDEX 55 Measuring Sustainable Development
Reducing Prince Edward Island’s transportation footprint
The footprint of commuting
In their landmark book Our Ecological Footprint, Reducing Human Impact on the Earth,Wackernagel and Rees (1996) estimated the footprint of commuting. A person living 5kilometres from work requires an extra 122 square metres of ecologically productive land forbicycling, 301 square metres for busing, and 1,442 square metres for driving alone by car.87 Theland for the cyclist is needed to grow extra food, while most of the land needed to support buspassengers and car drivers is used for absorbing CO2.
Commuting alone by car contributes 12 times more than cycling and over 4 times more thantaking the bus to the footprint of commuting. Table 14 shows how the footprint of commutingcan be reduced by car-pooling, taking the bus, or cycling – one, three, or five days per week.Rethinking how we travel to and from work can dramatically reduce the commuting footprint.For example, a small change like car-pooling once a week with one other person results in a 10%reduction in commuting footprint. Cycling to work and back every day instead of driving alonecorresponds to a 92% reduction in the impact of commuting on the environment.
Table 14. Reduction in Commuting Footprint
Change: 1 day a week 3 days a week All the timeFrom 1 person per vehicle to 2 10% reduction 30% reduction 50% reductionFrom 1 person per vehicle to 4 15% reduction 45% reduction 75% reductionFrom driving alone to taking the bus 16% reduction 47% reduction 79% reductionFrom driving to cycling 18% reduction 55% reduction 92% reduction
Note: The reductions indicated in this Table are not reductions in the overall ecological footprint, but in thecommuting portion of that footprint.
Source: Wackernagel and Rees, 1996, p. 107. See footnote 7.
As indicated in Figure 22, 91.5% of Prince Edward Islanders travel to work by car, truck, or vanwhile only 0.2% use public transit. The best way to reduce the footprint of commuting is to livenear one’s place of work. If this is not an option, car-pooling or taking public transportation canreduce commuting footprint by up to 79%. The average car in a Canadian city carries 1.3persons. A standard bus can replace up to 50 cars in rush hour.88 There is no significant publictransportation in PEI and the development of a public transportation system would help to reducethe ecological footprint of the province.
PEI commuters, with a median commuting distance to work of 5.5 kilometres, have a relativelyshort median commuting distance when compared to other provinces and the Canadian median(Figure 24). Almost 50% of PEI commuters travel less than 5 kilometres to their place of work, 87 Wackernagel and Rees (1996), p. 107. See footnote 7.88 Adapted from Canadian Urban Transit Association (1995). The Environmental Benefits of Urban Transit.

GENUINE PROGRESS INDEX 56 Measuring Sustainable Development
compared to 38% of Canadians (Figure 25). This indicates that cycling to work is a viable optionfor a larger proportion of Islanders than for most other Canadians. Yet Islanders are currentlyonly one-third as likely to cycle to work as other Canadians. Figures 22 through 24 indicate thatthe relatively shorter commuting distances of Islanders somewhat ameliorate their impact on theenvironment compared to other Canadians, and provide greater opportunities for cycling. Butthis advantage is currently offset by Islanders’ greater dependence on cars, trucks, and vans forcommuting purposes.
Concerted policy planning is required to bring about any substantial shift in commuting patterns.To influence how people travel to and from work, it is key that alternatives to automobile use bemade available. Without adequate access to public transit or a safe environment for biking andwalking, it will be difficult to encourage individuals to forego driving to the workplace.Coordinated land use/transportation planning is essential to turn around current suburban and ex-urban sprawl trends and thereby reduce the Prince Edward Island commuting footprint.
Figure 22. Mode of Transportation to Work, Prince Edward Island and CanadianCommuters, 2001
Note: “Other” includes motorcycle, taxicab, and all other modes of transportation. The car/truck/van categoryincludes drivers and passengers.
Source: Statistics Canada, 2001. Mode of Transportation to Work, Catalogue No. 97F0015XCB01002. Available at:http://www12.statcan.ca/english/census01/release/index.cfm.

GENUINE PROGRESS INDEX 57 Measuring Sustainable Development
Figure 23. Median Commuting Distance, Canada and Provinces, 2001
Source: Statistics Canada, 2001. Commuting Distance, Catalogue No. 97F0015XCB01001. Available at:http://www12.statcan.ca/english/census01/release/index.cfm.
Figure 24. Commuting Distances of Prince Edward Island and Canadian Commuters, 2001
Source: Statistics Canada, 2001. Commuting Distance, Catalogue No. 97F0015XCB01001. Available at:http://www12.statcan.ca/english/census01/release/index.cfm.

GENUINE PROGRESS INDEX 58 Measuring Sustainable Development
Choosing to walk or cycle to work not only offers environmental benefits but also contributes tobetter health and lowers health care costs. The Heart and Stroke Foundation reports that 66% ofCanadians are not active enough to maintain good health, and that devoting 30 minutes per dayto moderate exercise such as walking or cycling has been medically demonstrated to contributeto good health and wellbeing.89
Changes in driving style and driver education
Simple changes to driving style and driver education can result in overall fuel economy savings.That, in turn, can produce a reduction in the transportation footprint, since almost all of thatfootprint is related to energy consumption and fossil fuel combustion. Strategies to greenerdriving recommended by the U.S. Department of Energy, the U.S. Environmental ProtectionAgency (USEPA), and Natural Resources Canada include:90,91
• Servicing vehicles regularly. A vehicle that is not properly maintained can increase fuelconsumption by 50% and pollution emissions by 20%.
• Avoiding idling. Idling for 15 seconds requires more gas than restarting a car.• Accelerating and braking smoothly. Smooth accelerating and braking can bring fuel
savings of 10%.• Using the correct gears for the speed. Correct gear use can bring fuel savings of up to
25%.• Not carrying unnecessary weight.• Checking tire pressure regularly. Proper tire pressure can bring fuel savings of up to
3%.• Using air conditioning less frequently.• Using a timer that will turn on the block heater just before driving.
Fuel efficiency and vehicle footprint
The transportation footprint of vehicles is directly related to their fuel efficiency. Most of theenvironmental impacts associated with motor vehicles are a result of exhaust emissions and thepollution associated with supplying the fuel. The breakdown of life cycle (“cradle to grave”)energy use for a typical automobile reveals that nearly 90% of energy use is due to fuelconsumption.92 The USEPA estimates that light vehicles, including cars, SUVs, vans, and pick-
89 Heart and Stroke Foundation (2000). The Changing Face of Heart Disease and Stroke in Canada, 2000. To obtainthis publication and for more information about heart disease and stroke in Canada, visit the Heart and StrokeFoundation web site at www.heartandstroke.ca.90 U.S. Department of Energy and USEPA Fuel Economy web site. Available at:http://www.fueleconomy.gov/feg/index.htm.91 Natural Resources Canada (2003). Driving and Maintaining Your Vehicle. Available at:http://oee.nrcan.gc.ca/vehicles/tips/tips_driving.cfm.92 American Council for an Energy Efficient Economy (2001). Automobiles and the Environment, February 8, 2001.Available at: www.greenercars.org/news.html.

GENUINE PROGRESS INDEX 59 Measuring Sustainable Development
up trucks, account for approximately 40% of all petroleum consumption in the U.S. andcontribute about 20% of all carbon dioxide emissions in that country.93
Several web sites provide vehicle fuel efficiency information to help guide consumer productchoice, including the AutoSmart web site sponsored by Natural Resources Canada atwww.autosmart.nrcan.gc.ca/ and the U.S. Department of Energy web site atwww.fueleconomy.gov. Fuel economy and its subsequent impact on the environment varydramatically from vehicle to vehicle. For example, the model 2001 Honda Insight hybrid vehiclegets 61 miles per gallon (mpg) in city driving and 68 mpg in highway driving, with greenhousegas emissions of 3.1 tons per year based on average vehicle miles travelled.94 By contrast, themodel year 2001 Lincoln Navigator sport utility vehicle (SUV) gets 12 mpg in city driving and16 mpg in highway driving with greenhouse gas emissions of 14.3 tons per year.95 On average,one SUV has about three times the impact on the environment of a small car.
There is a significant discrepancy even within vehicle classes. For example, among model year2001 family sedans, the Honda Accord gets 25 mpg city driving and 32 mpg highway driving,with average greenhouse gas emissions of 7.0 tons per year. By comparison, the Ford Taurusgets 18 mpg city driving and 27 mpg highway driving, with greenhouse gas emissions of 8.9 tonsper year.96
The Light-Duty Automotive Technology and Fuel Economy Trends 1975 through 2000 report,published by the USEPA, notes that, despite advances in automotive technologies, fuel economyremains at a 20-year low in the U.S., due to a sharp increase in less fuel efficient vehicles such asminivans, SUVs, vans, and pickup trucks.97 Since 1988, average new light vehicle fuel economyin the U.S. has declined by 1.9 mpg, or more than 7%.98 Given that the U.S. has stricter fueleconomy standards than Canada and similar vehicle sales trends, it can safely be assumed thatU.S. fuel economy trends apply equally to Canada.
The increasing market share of SUVs and light trucks, which have significantly lower averagefuel economy than cars, accounts for much of the decline in fuel economy in the overall newlight vehicle fleet. SUV sales in the U.S. have increased 17-fold since 1975 and increased theirmarket share by more than a factor of ten, from less than 190,000 in 1975 (under 2% of theoverall new light vehicle market) to over 3.2 million in 2000 (20% of the market). Over the sameperiod, the market share for vans doubled from 4.5% to 9%, and for pickup trucks from 13% to17%. This means that SUVs, vans, and pick-up trucks together now comprise 46% of all light 93 Light vehicles include those vehicles that the USEPA and the U.S. Department of Transportation (DOT) classifyas cars or light-duty trucks (sport utility vehicles, vans, and pickup trucks with less than 8,500 pounds gross vehicleweight ratings). Heavenrich, R.M. and K.H. Hellman (2000). Light-Duty Automotive Technology and Fuel EconomyTrends, 1975 Through 2000. USEPA, Office of Transportation and Air Quality. Available at:www.epa.gov/otaq/fetrends.htm.94 Greenhouse gas emission estimates are based on 45% highway driving, 55% city driving, and driving 24,200kilometres annually (15,000 annual miles). Greenhouse gas emissions are expressed in CO2 equivalents. Estimatesare based on the full fuel cycle and exclude vehicle manufacture processes (U.S. Department of Energy, GREETModel, Argonne National Laboratory). See: www.fueleconomy.gov.95 Idem.96 Idem.97 Heavenrich and Hellman (2000). See footnote 93.98 Idem.

GENUINE PROGRESS INDEX 60 Measuring Sustainable Development
vehicle sales. Between 1975 and 2000, the market share for new passenger cars and wagonsdecreased correspondingly from 81% to 54%.99
The number of SUVs has doubled in the U.S. since 1992 alone. In 1999, nearly half of thepassenger vehicles sold in the U.S. were SUVs or light trucks.100 In Canada, SUVs, vans, andlight trucks made up 39% of the light vehicle fleet (vehicles under 4.5 tonnes) in 2002.101 InCanada, SUVs and light trucks are forecast to increase in number by 46% between 1997 and2020 and will likely make up almost 20% of the entire vehicle fleet within 20 years.102
From an environmental perspective, this sharp increase in SUV, light truck and minivan sales inthe 1990s is clearly of deep concern. SUVs generally have very poor fuel efficiency. The morefossil fuels that are burned, the greater the quantity of greenhouse gases and other air pollutantsthat are released, and the greater the long-term costs of non-renewable resource depletion. TheRange Rover, Navigator, Yukon, Durango, and Expedition all get 12 mpg city driving and 17mpg or less highway driving and emit 15 to 16.6 tons of greenhouse gases per year (Table 15).103
Fortunately, even within the SUV class, alternatives do exist. For example, the Toyota RAV 4,which is an electric vehicle, gets 117 mpg in city driving and 91 mpg in highway driving,emitting 4.1 tons of greenhouse gas emissions per year (see Table 15).
Table 15. Sport Utility Vehicle Fuel Efficiency and Greenhouse Gas Emissions
Model (2001 year) City milesper gallon
Highway milesper gallon
Annual greenhousegas emissions (tons)
Lincoln Navigator 12 16 14.3Land Rover Range Rover 12 15 14.3GMC K1500 Yukon 12 16 14.0Dodge Durango 12 17 13.7Ford Expedition 12 17 16.6Suzuki Vitara 2-door 25 28 7.2Toyota RAV 4 (electric) 117 91 4.1
Source: U.S. Department of Energy and USEPA, 2001. Fuel Economy web site. Available at:www.fueleconomy.gov.
Every gallon of gasoline that vehicles burn puts an average of 20 pounds of carbon dioxide intothe atmosphere. So even small differences in fuel efficiency can have a significant impact on anindividual’s personal contribution to global climate change and to ecological footprint. Choosinga vehicle that gets 25 rather than 20 mpg will prevent 10 tons of carbon dioxide from beingreleased over the lifetime of the vehicle.104 In sum, if an individual does need to purchase a
99 Heavenrich and Hellman (2000). Executive Summary, p.3. See footnote 93.100 USPIRG (2000). SUV Report. Available at: www.uspirg.org.101 Statistics Canada (2003). Canadian Vehicle Survey, Annual 2002. Available at:http://www.statcan.ca/english/freepub/53-223-XIE/53-223-XIE02000.pdf.102 Natural Resources Canada (1999). AutoSmart web site. Available at: www.autosmart.nrcan.ca.ca/.103 U.S. Department of Energy, GREET Model, Argonne National Laboratory. Available at: www.fueleconomy.gov.104 Idem. See “Why is Fuel Economy Important?”

GENUINE PROGRESS INDEX 61 Measuring Sustainable Development
vehicle, that individual’s transportation footprint and fuel costs can be reduced by selecting onethat meets their needs with the best fuel economy available. That choice also has the addedbenefit of substantial savings in fuel costs.
Summary: Reducing Prince Edward Island’s transportation footprint
Personal transportation accounts for almost 20% of the average Islander’s ecological footprint.There are many opportunities for consumers to make transportation choices that reduce theimpact of transportation on the environment: the mode of transportation, the type of vehicle, thetype of fuel, driving style, and proper vehicle maintenance. The most effective way to reduce thefootprint of transportation is to drive less, walk and cycle more, use public transportation, andcar-pool. Living near one’s place of work and near amenities such as grocery stores, shoppingestablishments, schools, and recreational facilities can significantly reduce dependency uponcars.
There is probably no public policy factor that more significantly impacts the capacity of a societyto reduce transportation footprint and car dependency than how a society designs its cities.Suburban and ex-urban sprawl necessitates substantially greater travelling distances. Businessdistricts and shopping venues located far from residential areas also encourage car use. Wheretravelling distance precludes walking or cycling, adequate public transportation facilities areessential to offset the substantial environmental impacts of automobile use. Individuals need notonly to choose to drive less, but, as citizens, demand that planners, builders, and policy makerspromote the conditions necessary to ensure sustainable communities. Even the most dedicatedpersonal efforts to reduce transportation footprint require a favourable and supportive social andpublic policy environment to create viable alternative transportation options.
17. Residential Energy Footprint
Canadians are heavy consumers of residential energy
Prince Edward Island’s residential energy footprint was 0.73 ha per person in 1999, over 8% ofthe province’s total ecological footprint. This was approximately 11% smaller than the Canadianaverage (0.82 ha per person). On average, Canadians consume 43.4 GJ/capita/year of residentialenergy, compared to 38.4 GJ/capita/year in Prince Edward Island.105
The lower average residential energy demand and residential energy footprint in Prince EdwardIsland in comparison to Canada are due primarily to a more moderate climate and lower heatingfuel needs. Despite a more moderate climate, however, PEI households are prone to a largeresidential energy footprint in other ways. For example, PEI has a greater number of older andlarger dwellings compared to the Canadian average. Almost a quarter (23%) of the dwellings in
105 Natural Resources Canada, Office of Energy Efficiency, National Energy Use Database. Available at:http://oee.nrcan.gc.ca/neud/dpa/data_e/database_e.cfm.

GENUINE PROGRESS INDEX 62 Measuring Sustainable Development
PEI were built before 1946 compared to only 14% in Canada.106 Modern homes tend to besignificantly more energy efficient, due to improvements in building materials and insulation,and therefore contribute to a smaller energy footprint. Many older homes have little or noinsulation, which can increase heating costs by up to 70%.107
Dwellings in Prince Edward Island are also, on average, slightly larger than in the rest ofCanada: 6.7 rooms in comparison to 6.3 rooms, due primarily to a lower level of urbanization.108
Larger dwellings use more material inputs and have greater space heating requirements, which inturn increases the residential energy footprint. In addition, 73% of PEI’s dwellings are singledetached houses – a rate that is 16% higher than the Canadian average.109 Single detacheddwellings require more material inputs and energy to heat than apartment dwellings, because ofthe greater number of exterior walls.
Reducing Prince Edward Island’s household energy footprint
There are a number of practical choices available to households that could significantly reducethe province’s residential energy footprint. Indeed, household energy consumption choices areone of the simplest ways that ordinary citizens can reduce their ecological footprint and savemoney. A few intelligent energy choices can reduce household energy consumption by 50% andsave significantly on household energy costs (Table 16).
Table 16 provides practical suggestions for how home energy consumption can be reduced invarious ways without having to make real sacrifices to lifestyle. Other major savings can bemade by:
• turning lights and appliances off when they are not needed;• limiting the use of air conditioners;• reducing time spent watching TV; and• having shorter showers.
Perhaps the most effective way to reduce household energy footprint is simply by raising one’slevel of daily awareness. If a conscious effort is made to evaluate the energy use of householdson an ongoing basis, numerous creative ways to reduce energy consumption can be found thatmatch particular needs and circumstances. Longer-term changes in technology can also assistefforts to reduce household energy footprint. Advances in building materials have alreadysignificantly decreased the heat loss in homes, and available technologies could reduce this evenfurther.110
106 Statistics Canada, 2001 Census, Period of Construction for Occupied Private Dwellings, Catalogue No.95F0325XCB01004.107 Residential Energy Efficiency Database (2000). Available at: www.its-canada.com/reed.108 Statistics Canada, 2001 Census, Household Size and Number of Rooms for Occupied Private Dwellings,Catalogue No. 95F0323XCB01004.109 Statistics Canada, 2001 Census, Structural Type of Dwelling for Occupied Private Dwellings, Catalogue No.95F0321XCB01004.110 Pembina Institute (2000). Climate Change Solutions. Available at www.climatechangesolutions.com.

GENUINE PROGRESS INDEX 63 Measuring Sustainable Development
Table 16. Reducing Household Energy Consumption
Action EnergySavings
Switch to a time based-programmable thermostat (from a standard non-programmable thermostat) 30%
Turn down the thermostat at night to 17 degrees (based on average householdtemperature of 21 degrees) 8%
Switch from standard incandescent bulbs to• Halogen bulbs• Compact fluorescent bulbs (assumes 150 operating hours per month)
55%75%
Install a low flow shower head (assumes a household of four) 50%Clothes Washer (assumes 34 loads per month)
• Switch to energy efficient model• Wash clothes in cold water instead of hot water
26%93%
Clothes dryer (assumes 34 loads per month)• Switch to energy efficient model• Hang clothes to dry
31%100%
Dish washer (assumes 34 loads per month)• Switch to energy efficient model 40%
Refrigerator (responsible for 15% of household energy use)• Switch to energy efficient model 47-53%
Air Conditioner (assumes 3 month use period)• Switch to an energy efficient model• Switch to a fan• Open windows
50%60%100%
Add an insulating blanket to hot water heater (assumes a household of three) 5%Clean furnace filter regularly 15%
Note: Percentage energy savings refer to savings compared to conventional non-energy efficient methods andmodels within each category. For example, switching from a conventional non-efficient dishwasher to an energyefficient dishwasher can save 40% of the energy costs normally associated with washing dishes. In other words, thepercentages in the second column do not refer to percentage savings of the total energy budget.
Sources: Adapted from Wilson et al. (2001).
Reducing household energy consumption on an individual and household level can certainlyproduce a major reduction in PEI’s average household energy footprint. The planning policiesand building codes in effect today will have a significant impact on future ecological footprint, asthey influence both the type of homes and the type of communities in which people will live inthe future as well as future transportation needs. It is fair to say that current building codes andplanning policies rarely consider energy footprint consequences, and even encourage detachedsingle-family home construction that limits personal energy reduction efforts. Higher densityhousing could encourage development of district heating models that can produce significantenergy savings.

GENUINE PROGRESS INDEX 64 Measuring Sustainable Development
When the size of the 1999 PEI footprint (8.98 ha per person) is considered against thebackground of the bioproductive land and sea actually available for human resource use andwaste assimilation (1.7 ha per person), it is clear that dedicated individual efforts alone will notprevent a continued ecological overshoot that imperils the wellbeing of future generations. Acollective political and social will and coordinated public policy planning are essential to reduceecological footprint and the impact of consumption on the environment substantially, and to takeon real responsibility for the wellbeing of future generations.
Fortunately, there are excellent examples and models of community and social efforts to reduceenergy consumption and live more efficiently and responsibly. The forthcoming GPIAtlantictransportation component, for example, notes the innovative transportation, planning and designoptions of Curitiba, Brazil, which has consciously designed itself as an “ecological city.”111
On the residential energy and planning front, one of the most effective and exciting models is theDanish co-housing experiment, which has been so successful that it has become a mainstreamreal estate option in that country. Recreating the modern equivalent of a traditional village, 20-25families typically live in much smaller dwellings but share a “common house” with a wide rangeof common facilities and appliances, and in which they prepare and eat dinners together. Thearrangement facilitates car-pooling, shared child-care, bulk buying, and other patterns ofcommunity interaction that significantly reduce per capita energy consumption andtransportation, while at the same time fostering community.112
The Danish co-housing model has spread to the Netherlands, Germany and Sweden, and has nowbegun to spawn similar experiments in North America.113 Tax incentives and building codes inCanada that promote the type of co-housing development that has proved so successful in Europewould encourage the kind of longer-term structural changes to Canadian housing stock that arenecessary to reduce the energy-intensity of current living patterns. The fact that these newhousing options can build community and strengthen social supports at the same time that theyincrease efficiency and reduce energy consumption and costs indicates that there are creativeways of reducing ecological footprint that enhance quality of life and wellbeing.
18. Food Footprint
Prince Edward Islanders are formidable food consumers
The average PEI food footprint was 3.49 ha per person in 1999, which amounts to 39% of thetotal provincial ecological footprint. Food consumption is the second largest footprint componentafter energy. The food footprint is the area of arable land, pasture land, and sea required to grow 111 C.R. dos Santos, Open University of the Environment, Curitiba, Brazil, presentation to “Halifax inMotion: Transportation and Land Use,” public forum, Halifax City Hall, March 7-8, 2001.112 McCamant, K. and C. Durrett (1988). Cohousing: A Contemporary Approach to Housing Ourselves,Habitat Press, Berkeley.113 Fromm, D. (1991). Collaborative Communities: Cohousing, Central Living, and other New Forms of Housingwith Shared Facilities. Van Nostrand Reinhold, New York.

GENUINE PROGRESS INDEX 65 Measuring Sustainable Development
and produce the food and raise the animals and fish that is consumed. If we factor in the energyused within the food system, which is estimated to be approximately 13.8% of total energy enduse, the total footprint devoted to feeding ourselves averages 3.97 ha per person, or 44% of the1999 total ecological footprint of the Island.114 PEI’s food footprint is clearly unsustainable. Afood footprint of 3.49 ha for the average Prince Edward Islander is over two times larger than thebioproductive space available per global citizen (1.7 ha/capita), if we assume equal distributionof the Earth’s biocapacity.
Prince Edward Islanders had a 31% larger per capita food footprint in 1999 than the Canadianaverage (2.66 ha/capita). Islanders consume more fish, seafood, meat, fats and oils, and sugarsand sweeteners than the Canadian average. All of these foods have high footprint intensities. Theecological space that Prince Edward Islanders occupy just to feed themselves is 480,170hectares, or 84.5% of the total provincial land area of PEI.115 The actual area in food-producingcrops in PEI is only 175,488 ha (31% of the provincial land area), or 36.5% of the area requiredto support the PEI food footprint.116 Prince Edward Island is able to adjust for this deficit byimporting food through trade. Not only does this make PEI enormously dependent on theecological capacity of other regions, but it also contributes significantly to the large foodfootprint.
Why is the food footprint so large?
Canadians are overeating117
On average, each Canadian eats 3,119 calories worth of food each day (see Table 17).118 Therecommended caloric intake for an active young man (19-24) is only 3,000 calories per day, withaverage optimal energy requirements just 2,500 calories for men and 1,900 calories for women(Table 17).119 Canadians and Prince Edward Islanders are not only eating more than they needfor good health, but they are also eating too much of the wrong kinds of food. For example,Canadian per capita consumption of fats and oils increased 44.3% between 1990 and 2001,
114 Wackernagel, M. (1994). Ecological Footprint and Appropriated Carrying Capacity: A Tool For PlanningToward Sustainability. Ph.D thesis, The University of British Columbia. Wackernagel bases the 13.8% estimate on anumber of sources, including Canadian agriculture statistics, U.S. Federal Energy Administration and U.S.Department of Agriculture studies, as well as studies done in Switzerland. Estimates of energy used in the foodsystem from these sources range from 12 to 20% of total energy use.115 3.48 hectares per person x 137,980 (1999 population estimate for PEI) = 480,170 hectares. This assumes 3.48 haper person which is the area of arable land, pasture land, and sea required to grow the food and raise the animals thatwe eat. It does not include the associated land required for the energy that can be attributed to the food system. Thetotal provincial land area of Prince Edward Island is 568,439 hectares.116 Statistics Canada, 2001 Census of Agriculture, Total area of farms, land tenure and land in crops.117 For more information on the connections between food footprint, health, and the genuine progress index, seeAppendix C of this report.118 Food and Agriculture Organization of the United Nations (1997). Statistical information. Available at:www.fao.com.119 Nova Scotia Heart Health Program (1993). Report of the Nova Scotia Nutrition Survey. Nova Scotia Heart HealthProgram, Nova Scotia Department of Health, and Health and Welfare Canada.

GENUINE PROGRESS INDEX 66 Measuring Sustainable Development
compared to an increase in consumption of fresh vegetables of 10.9% and an increase inconsumption of fresh fruit of only 3.4%.120
Table 17. Caloric Intake World Wide, 1997
Calories Protein FatTotal Vegetable Animal (grams) (grams)
Canada 3,119 73% 27% 97.7 126.3United States 3,699 73% 27% 112.3 142.8India 2,496 93% 7% 59.1 44.5World 2,782 84% 16% 73.9 32.6
Male 2,500 70.6 82.5Average daily foodenergy requirements* Female 1,900 61.3 62.7
* Average estimates used. Optimal daily food energy requirements vary according to sex, age category, genetics,and level of activity.
Sources: Caloric Intake: Food and Agriculture Organization of the United Nations, 1997. Statistics,www.fao.com. Average daily food energy requirements: Health and Welfare Canada, 1990. NutritionRecommendations.
Aside from increasing the size of the food footprint, overeating and eating too much of thewrong kinds of food are contributing causes to obesity and to a wide range of illnesses.Numerous studies have linked overweight and obesity to a wide range of health problems,especially cardiovascular disease, diabetes, hypertension, and some forms of cancer.121
Atlantic provinces have substantially higher rates of overweight than the Canadian average, withNewfoundland and Labrador registering the highest rates of overweight for both men andwomen. Counting men and women together, 43% of Newfoundlanders are overweight, as are38% of Prince Edward Islanders, 39% of Nova Scotians and New Brunswickers, and 32% ofCanadians (Figure 25).
Paradoxically, overeating contributes to economic growth many times over, and thereby to ourassessment of how “well off” we are. All the excess food grown, processed, transported,warehoused and sold makes the GDP grow. The food industry contributes $33 billion a year inadvertising to the U.S. and Canadian economies, more than any other industry, much of itpromoting the very foods that cause obesity. Fast food, candy, and sweetened cereals account formore than half of food advertising expenditures. The diet and weight loss industries contribute$35 billion more to the U.S. and Canadian economies, and obesity-related illnesses $60 billion
120 Statistics Canada, Cansim II, Table 002-0019: Per capita consumption of major food groups. Canadian annualconsumption of fats and oils 1990: 22.1kg; 2001: 31.9kg. Canadian annual consumption of fresh vegetables 1990:129.7kg; 2001: 143.9kg. Canadian annual consumption of fresh fruit 1990: 61.3kg; 2001: 63.4kg. For moreinformation on Canadian and PEI consumption of fruits and vegetables, see Appendix C of this report.121 Health Canada (1999). Statistical Report on the Health of Canadians. Health Canada, Ottawa, p. 264.

GENUINE PROGRESS INDEX 67 Measuring Sustainable Development
more. The five-fold increase in diabetes and the burgeoning demand for insulin have become a“growth market” for the pharmaceutical industry.122
Figure 25. Percentage of Overweight Canadians, Canada and Provinces, 2000/01
Note: “Overweight” is defined as individuals with a Body Mass Index (BMI ≥ 27) aged 20 to 64, and excludespregnant women. BMI, which relates weight to height, is a common method of determining if an individual’s weightis in a healthy range based on their height. For a detailed definition of BMI, see Appendix C.
Source: Statistics Canada, Canadian Community Health Survey, 2000/01, Health File. Available at:http://www.statcan.ca/english/freepub/82-221-XIE/01002/toc.htm.
By contrast, the GPI classifies the costs of overeating and obesity as a cost rather than a gain tothe economy, because excess food consumption taxes our natural resource base, our bodies, ourhealth care systems, and our pocketbooks. Lower rates of obesity, a reduction in obesity-relatedillnesses, and a smaller food footprint are signs of genuine progress in the GPI.
The direct costs of obesity to the Canadian health care system for 10 specific illnesses areestimated at $1.8 billion.123 When other illnesses such as osteoarthritis are included, and whenadjustments are made for demonstrated under-reporting of weight, it is likely that obesity coststhe Canadian health care system as much as $3.2 billion. GPIAtlantic estimates of the economiccosts of obesity for eight provinces are presented in Table 18. Based on the GPI estimates fromeight provinces, the direct costs of obesity are almost $3 billion annually. When the indirect costsare added, the total costs of obesity are between $6 billion and $6.6 billion annually.
122 Gardner and Halweil (2000). See footnote 198; Critser, Greg, “Let Them Eat Fat: The Heavy Truths AboutAmerican Obesity,” Harper’s Magazine, March 2000.123 Birmingham et al. (1999). See footnote 201. The total direct costs include expenditures on hospital care,physician services, services by other health professionals, drugs, other health care costs, and health research.
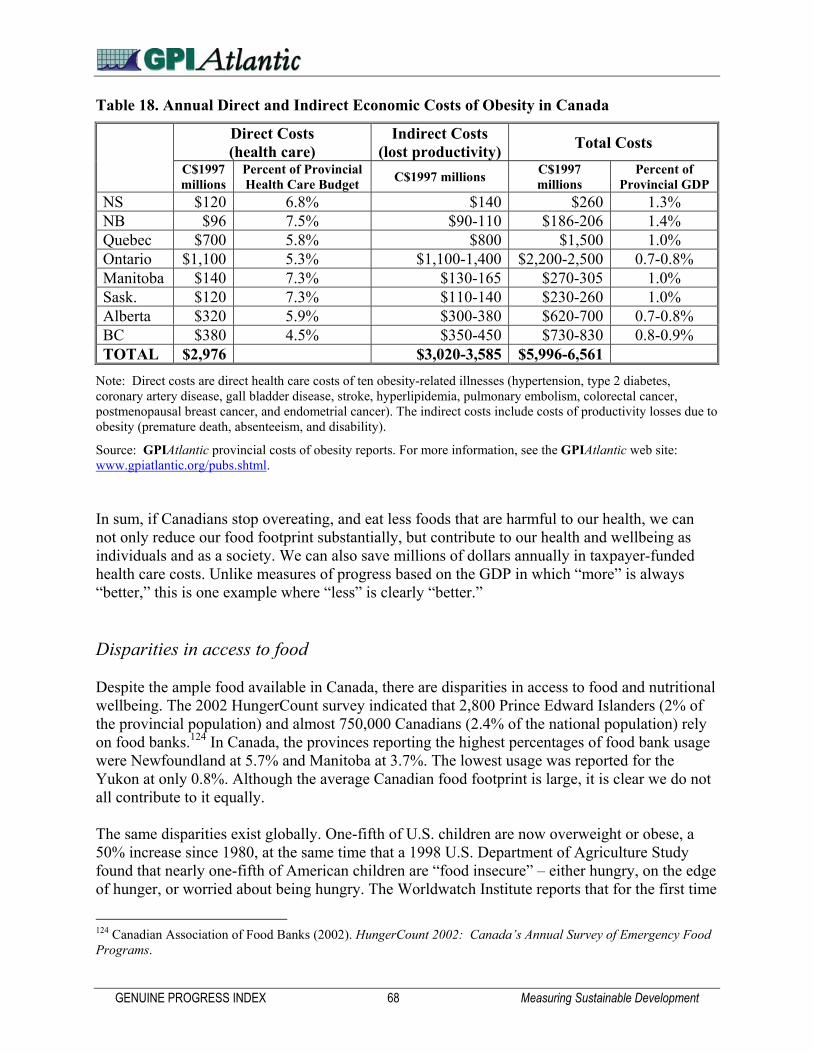
GENUINE PROGRESS INDEX 68 Measuring Sustainable Development
Table 18. Annual Direct and Indirect Economic Costs of Obesity in Canada
Direct Costs(health care)
Indirect Costs(lost productivity) Total Costs
C$1997millions
Percent of ProvincialHealth Care Budget C$1997 millions C$1997
millionsPercent of
Provincial GDPNS $120 6.8% $140 $260 1.3%NB $96 7.5% $90-110 $186-206 1.4%Quebec $700 5.8% $800 $1,500 1.0%Ontario $1,100 5.3% $1,100-1,400 $2,200-2,500 0.7-0.8%Manitoba $140 7.3% $130-165 $270-305 1.0%Sask. $120 7.3% $110-140 $230-260 1.0%Alberta $320 5.9% $300-380 $620-700 0.7-0.8%BC $380 4.5% $350-450 $730-830 0.8-0.9%TOTAL $2,976 $3,020-3,585 $5,996-6,561
Note: Direct costs are direct health care costs of ten obesity-related illnesses (hypertension, type 2 diabetes,coronary artery disease, gall bladder disease, stroke, hyperlipidemia, pulmonary embolism, colorectal cancer,postmenopausal breast cancer, and endometrial cancer). The indirect costs include costs of productivity losses due toobesity (premature death, absenteeism, and disability).
Source: GPIAtlantic provincial costs of obesity reports. For more information, see the GPIAtlantic web site:www.gpiatlantic.org/pubs.shtml.
In sum, if Canadians stop overeating, and eat less foods that are harmful to our health, we cannot only reduce our food footprint substantially, but contribute to our health and wellbeing asindividuals and as a society. We can also save millions of dollars annually in taxpayer-fundedhealth care costs. Unlike measures of progress based on the GDP in which “more” is always“better,” this is one example where “less” is clearly “better.”
Disparities in access to food
Despite the ample food available in Canada, there are disparities in access to food and nutritionalwellbeing. The 2002 HungerCount survey indicated that 2,800 Prince Edward Islanders (2% ofthe provincial population) and almost 750,000 Canadians (2.4% of the national population) relyon food banks.124 In Canada, the provinces reporting the highest percentages of food bank usagewere Newfoundland at 5.7% and Manitoba at 3.7%. The lowest usage was reported for theYukon at only 0.8%. Although the average Canadian food footprint is large, it is clear we do notall contribute to it equally.
The same disparities exist globally. One-fifth of U.S. children are now overweight or obese, a50% increase since 1980, at the same time that a 1998 U.S. Department of Agriculture Studyfound that nearly one-fifth of American children are “food insecure” – either hungry, on the edgeof hunger, or worried about being hungry. The Worldwatch Institute reports that for the first time
124 Canadian Association of Food Banks (2002). HungerCount 2002: Canada’s Annual Survey of Emergency FoodPrograms.

GENUINE PROGRESS INDEX 69 Measuring Sustainable Development
in history the number of overweight people in the world now equals the number of underfedpeople, with 1.1 billion in each group, and with both groups suffering from different forms of“malnutrition.” Among U.S. adults, 55% are now classified as overweight, while 56% ofchildren in Bangladesh are underweight.125
The global disparities in access to food and nutritional wellbeing indicate that the responsibilityfor food footprint reduction rests squarely on the shoulders of the over-consumers. Theoretically,there is sufficient food for all human beings in the world to meet their daily nutritionalrequirements (Table 19). However, over 800 million people – or more than 13% of the globalpopulation – are chronically undernourished, and are not eating enough to meet minimal energyrequirements. In addition, millions more suffer from acute malnutrition during transitory orseasonal food insecurity.126
Table 19. Per Capita Global Food Availability
World Industrialized Countries Developing CountriesTotal food available* 3939 kcal 6964 kcal 3007 kcal
male 2500 kcal 2500 kcal 2500 kcalOptimal energyrequirements** female 1900 kcal 1900 kcal 1900 kcal
*Food availability figures are total grown in the world, in industrialized countries, and in developing countries,divided by the population of the world, the industrialized countries, and developing countries respectively.
**Optimal energy requirements vary according to sex, age category, genetics and level of activity.
Source: Patriquin, D. (1999). Available at: http://is.dal.ca/~dp/reports/facts.html.
The Canadian agriculture system is energy intensive and becoming more so
Between 1981 and 1996, energy inputs within the Canadian agriculture system increased 7%,and fertilizer inputs grew by 26% (an annual growth rate of 1.4%).127 These dramatic increasesin fertilizer and energy inputs reflect both the increasing mechanization of agriculture and alsothe fact that more inputs are needed to maintain yields over time as soils become depleted ofnutrients. In addition, over this period, pesticide inputs increased by 20%.128
Total Canadian agricultural energy demand increased by 17% between 1990 and 2000, from 199petajoules (PJ) to 232 PJ.129 In PEI, total agricultural energy demand increased by 14% between1990 and 2000, from 1.4 PJ to 1.6 PJ.130 More intensive PEI agriculture affects the food footprintof all who consume PEI agricultural products – on and off the Island. The average energy input 125 Gardner and Halweil (2000), pp. 60-62. See footnote 198.126 FAO (1997). Statistical Information. Available at: www.fao.com.127 MacGregor, R.J., in McRae, T., Smith, C., and Gregorich, L (eds.) (2000). Environmental Sustainability ofCanadian Agriculture: Report of the Agri-Environmental Indicator Project. Agriculture and Agri-Food Canada.Draft report. Chapter 17: “Energy Use Time Series: 1981-1996.”128 Idem.129 Natural Resources Canada, Office of Energy Efficiency, National Energy Use Database. Available at:http://oee.nrcan.gc.ca/neud/dpa/data_e/database_e.cfm.130 Idem.

GENUINE PROGRESS INDEX 70 Measuring Sustainable Development
into the Canadian agriculture system between 1992 and 1996 was 18.2 PJ. The energy outputwas 8.1 PJ – a loss of 55% per unit of input.131 In 1910, the input/output ratio was 1 to 1.132 Astudy of energy inputs and outputs in Danish agriculture found that from 1939 to 1990, the ratioof food produced to fossil energy input declined from 3.9 to 1.0 mainly because of a largeincrease in the use of fertilizer, fuel, and electricity.133
For example, the increasing reliance on synthetic nitrogen fertilizer, made from fossil fuelsthrough an industrial nitrogen fixation process, is one factor in the energy intensity of Canadianagriculture. In addition to the energy intensity and direct greenhouse gas emissions associatedwith nitrogen fertilizer use, the production and transportation of nitrogen fertilizer itself isenergy-intensive and contributes to carbon dioxide emissions. For every kilogram of syntheticnitrogen fertilizer used on farms, one kilogram of carbon (or 3.7 kg of CO2) is released into theatmosphere.134 In these ways, increasingly intensive fertilizer, fuel, electricity, and pesticideinputs have sharply increased the size of the food, energy, and overall ecological footprints ofconsumers throughout the industrialized world.
Organic food production systems that integrate livestock and crop production on the same farm,which use manure as fertilizer, and which use no synthetic fertilizers and pesticides, are muchless energy intensive, and dramatically reduce the overall external inputs into agriculture incomparison to conventional food production systems. They come much closer to a balancedenergy input versus energy output ratio, while maintaining or increasing the long-term fertility ofsoils. Organically grown food may also be higher in nutritional value. For example, studies showdecreased levels of vitamin C and protein, and increased nitrate levels in chemically fertilizedcrops when compared to their organic counterparts.135 Not only do organically grown foodsreduce ecological footprint by requiring fewer energy inputs, but they may also be healthier –another example of the potential for ecological footprint reduction to increase rather thancompromise wellbeing.
In Prince Edward Island (2001), 23 farms reported production of certified organic products,accounting for only 1.3% of the total number of farms in the province.136 In Canada, 0.9% offarms produce certified organic products.137 PEI’s new Sustainable Resource Policy and its newFoodTrust brand may increase the proportion of organic and sustainably farmed produce in theprovince.138
131 McRae, et al. (2000). Op. cit., Chapter 18: “Regional Analysis of Environmental Sustainable Agriculture.”132 Pembina Institute (2000). Available at: www.cliamtechangesolutions.com.133 Schroll, H. (1994). “Energy-flow and ecological sustainability in Danish agriculture,” Agriculture, Ecosystemsand Environment, 51, 301-310.134 Janzen, H., Desjardins, R., Asselin, J., and Grace, B. (eds). 1998. The Health of Our Air: Toward SustainableAgriculture in Canada. Research Branch, Agriculture and Agri-Food Canada Publication 1981/E. Ottawa:Minister of Public Works, p.21.135 Jennifer Melanson ([email protected]), Coordinator, Nova Scotia Organic Growers Association (2000).Personal communication with Jeff Wilson.136 Statistics Canada, 2001 Census of Agriculture. Farms classified by certified organic products produced; andFarms classified by total farm area.137 Idem.138 For more information, see the Government of Prince Edward Island web site:http://www.gov.pe.ca/af/agweb/index.php3?number=72033; and the Prince Edward Island FoodTrust web site:http://www.foodtrustpei.com/.

GENUINE PROGRESS INDEX 71 Measuring Sustainable Development
Public policy can create a more favourable environment for individual food choices that canmake it easier for consumers to make ecologically conscious choices. Although it is moreenvironmentally benign and protects natural soil wealth more successfully, organic agriculture isstill a relatively marginal activity partly because locally grown organic produce is generally moreexpensive than conventionally grown imported produce. Tax incentives structured in proportionto lower energy and chemical inputs would make organic food more affordable, while taxpenalties for higher chemical and energy-intensive inputs would discourage more unsustainablefarming methods.
Much of Canada’s food is imported and exported139
The total value of food imports into Canada from the U.S. grew by 81% between 1990 and 1997.Imports from other countries increased by 60% in the same period. Canada imported a total of$15.8 billion in food products in 1997, including $9.4 billion from the U.S. and $6.4 billion fromother countries. The U.S. supplies almost all Canadian imports of meat, poultry and potatoes,while more than 80% of Canada’s imports of wine and cheese are from countries other than theU.S.140
Between 2000 and 2002, the total value of food imports into Prince Edward Island was just $8.2million.141 PEI imported the lowest amount of food of the four Atlantic provinces from 2000-2002: New Brunswick imported $783 million, Nova Scotia imported $555 million, andNewfoundland imported $46 million. During this same time period, PEI exported a total value of$833 million worth of food, making the province a net exporter of food products to the tune ofalmost $825 million.
Of the $833 million in exports, $609 million (73%) were frozen prepared or preserved potatoes.Almost 50% of the potatoes grown on PEI are used by the processing industry.142 Most areprocessed into frozen potato products, mostly french fries, which are available across Canadaand are exported to close to 30 countries around the world.143 The benefits of this industryinclude rural employment, relatively stable markets, and transfer of technology. However, thereliance on French fry exports also indicates a highly concentrated industry that produces highlyprocessed foods, relies heavily on the use of pesticides, and results in the planting of fewervarieties of potatoes – outcomes that have implications for environmental sustainability, bio-diversity, soil quality, and human health.
139 The authors are grateful to Jennifer Scott, author of GPIAtlantic’s Soils and Agriculture Accounts, for providingmany of the data sources and much of the information in this section of the report.140 Morin, N. (1999). Have American food products invaded the Canadian market? Available at:http://www.statcan.ca/english/kits/agric/market.htm.141 Import and export values used in this paragraph were obtained from Agriculture and Agri-Food Canada, TradeService, Trade Statistics. Available at: http://ats-sea.agr.ca/stats/stats-e.htm.142 Prince Edward Island Potato Board (2003). Why PEI Potatoes? Available at:http://www.peipotato.org/why_pei.asp.143 Idem. See also Agriculture and Agri-Food Canada (2000). 1999/2000 Canadian Potato Situation and Trends.Available at: http://www.agr.gc.ca/misb/hort/potato_eng.html.

GENUINE PROGRESS INDEX 72 Measuring Sustainable Development
In Canada, the average food item travels about 2,000 kilometres to get to the dinner table.144
Importing and exporting a high percentage of our food has a significant impact on the foodfootprint. The transportation costs of shipping food long distances contribute to increasedburning of fossil fuels, greenhouse gas emissions, and increased transportation infrastructurecosts. On a regional scale, increased reliance on imported food also undermines support of localfarmers and rural communities and increases our reliance on other regions of the globe. Similarlyover-reliance on single crops like potatoes and on food exports rather than diverse production forlocal markets renders farmers and rural communities vulnerable to commodity price fluctuations,crop disease, and import bans.
If the true costs of transportation and energy (including current taxpayer subsidies), as well as thecosts of air pollution, greenhouse gas emissions, and resource depletion were factored intomarket prices – in other words, if imported food were made to pay its full costs – then aconventionally grown California lettuce would not be cheaper at the supermarket checkoutcounter than a locally grown organic lettuce. A core purpose of the GPI full cost accountingmethods is to factor in social and environmental costs that are currently invisible in conventionalmarket and accounting mechanisms, and thus to make ecological footprint reduction “profitable”rather than costly for the consumer. Sound economic practice and a truly efficient market wouldsupport sustainable practices that ensure the maintenance of natural wealth and a reliable flow ofgoods and services for future generations.
When the grain trade is removed from calculations, Canada is a net importer of agriculturalproducts. Until just after World War II, Canada was self-sufficient in the production of basicfruits (plums, peaches, apricots, strawberries, pears), and vegetables, but by 1980, 28% to 57%of these five fruits were being imported.145 By 1987, Canada was only 71% self-sufficient in theproduction of fresh vegetables, and 45% in all fruits and berries.146 Reliance on imported foodsnot only increases the food footprint of an area by expending additional energy in transportation,but may also undermine long-term food security. Part of Canada’s dependency on food importsis due to the limitations of the Canadian growing season, but a significant percentage of the cropsthat comprise this growing deficit could be produced and stored here if a strong domesticagriculture sector were a policy priority.147, 148
The growing dependency on imported food sources in Canada has been accompanied by adecrease in the total area of farmland. The total Prince Edward Island area in farms in 1981 was283,024 hectares. By 2001 the total area in farms had shrunk by over 8% to 261,482 hectares(Table 20). During the same period, the number of farms on the Island declined by 42%,
144 National Round Table on the Environment and the Economy (1997). The Road to Sustainable Transportation inCanada, Renouf Publishing Co., Ottawa.145 Toronto Food Policy Council (1994). Health, Wealth and the Environment: the impact of the CUSTA, NAFTAand GATT on Canadian food security, pp. 20-24.146 Idem.147 Kneen, B. 1992. “Feeding the family, trading the leftovers.” The Ram’s Horn, 91, 1-4.148 Warnock, J.W. (1984). Canadian grain and the industrial food system. Presentation to Learned SocietiesConference, Guelph, ON. 10 June, 1984.

GENUINE PROGRESS INDEX 73 Measuring Sustainable Development
indicating increasing concentration, and the population increased by 9.5%.149 With farmlanddecreasing in the province, Prince Edward Island is gradually becoming more dependent on tradeto satisfy the food needs of the population.
Table 20. Total Number and Area of Farms in Prince Edward Island, 1981-2001
Prince Edward IslandYear Number of Farms Area in Farms (hectares)1981 3,154 283,0241986 2,833 272,4331991 2,361 258,8751996 2,217 265,2172001 1,845 261,482
Source: Statistics Canada, 2001 Census of Agriculture, Total area of farms, land tenure and land in crops.
Diet changes
Many foods that are energy intensive and have a large ecological footprint in energy intensity arealso detrimental to health. For example, major food sources of excess fats are meats, poultry,eggs, milk, cream and a wide range of processed foods. Although further work is needed on thefootprints of particular foods, it is likely that a reduction in fat intake could significantly reducethe food footprint because of the high energy demands of feedlot grain-fed meat as well asindustrial food processing and transportation.
A change in food consumption toward more grains, vegetables, fruits and natural foods maytherefore lead to a healthier diet as well as a reduced food footprint. A healthier diet, in turn, canreduce the current high incidence of cardiovascular disease, type 2 diabetes, hypertension, gallbladder disease and cancer, and improve the wellbeing and quality of life of Prince EdwardIslanders. Researchers at the World Cancer Research Fund and the American Institute for CancerResearch report that changes in diet alone could prevent 30% to 40% of all cancers world-wide,at least as many cases as could be prevented by a cessation of smoking.150
A healthy diet and sustainable agricultural policy that reduce food footprint do not have toeschew meat products. In an optimal food production system, raising livestock can in factupgrade human edible energy and protein output, and provide natural manure to fertilizevegetable crops.151 Livestock can consume food grown on lands not suitable for human food,feed not fit for human consumption such as vegetable culls, grains that do not meet standards,and apple pomace from cider pressings.152 Optimal food production requires finding the most
149 Statistics Canada, Cansim II, Table 051-0001: Estimates of population, by age group and sex, Canada, provincesand territories, annual. See also Statistics Canada, 2001 Census of Agriculture, Total area of farms, land tenure andland in crops.150 Birmingham, et al., 1999. See footnote 201; Colman, 2000, op. cit., page 18.151 Scott, J. (2002). GPI Agriculture Accounts, Part Two: Resource Capacity and Use: The Value of AgriculturalBiodiversity. GPIAtlantic, Halifax.152 Idem.

GENUINE PROGRESS INDEX 74 Measuring Sustainable Development
appropriate uses for different types of land and creating a multi-use food landscape.Unfortunately, current production choices are frequently not determined by careful distinctionsbased on differential soil quality and land use.153
Reducing Prince Edward Island’s food footprint
If the causes of PEI’s large food footprint are understood, intelligent choices can be made thatwill substantially reduce that footprint and the impact of food consumption patterns on theenvironment. In particular, Islanders can:
• Maintain a healthy weight, reduce the tendency to overeat, and not waste food;• Eat the amount of daily calories that are appropriate for one’s age and level of activity;• Eat locally produced foods and support local farmers, thus reducing high transportation
and energy inputs into PEI’s food system; and• Eat organically grown and sustainably farmed foods, thus reducing footprint-intensive
energy and synthetic, petroleum-based inputs into agriculture.
Public policy that supports local agriculture, organic farming methods, and the best use of land,that mandates high quality nutritional education, and that otherwise helps create a socialenvironment conducive to these consumption choices will produce the greatest and mosteffective food footprint reductions. As with PEI’s transportation and residential energyfootprints, personal choices regarding food are limited by incomplete market mechanisms that donot account for social and environmental costs and benefits, and that therefore send misleadingprice signals to consumers. A core goal of the GPI full-cost accounting mechanisms is to makeecological footprint reduction the natural and economically sound path for society to follow, forthe benefit of future generations.
Canada could feasibly reduce its food footprint through public policy measures that encouragesustainable farming practices. One example is given here. The increasing energy intensity offarm inputs, such as synthetic nitrogen fertilizer, is partly responsible for the size of our foodfootprint. But a 15-year study comparing three maize/soybean systems in the U.S. found thatlegume-based cropping systems reduced energy use by 50% compared to conventional nitrogenfertilizer-based systems that relied on maize/soybean rotations only.
Legumes reduce carbon and nitrogen losses and increase soil nitrogen storage, thereby reducingthe amount of nitrogen that must be applied to maintain yields.154 While both natural (legume)and industrial nitrogen fixation processes require energy, the first is a virtually “free” service ofnature and does not use up non-renewable resources, while the second is expensive and basedprimarily on the depletion of non-renewable resources.
153 Scott, J. (2002). GPI Agriculture Accounts, Part Two: Resource Capacity and Use: Soil Quality andProductivity. GPIAtlantic, Halifax.154 Drinkwater, L., Wagoner, P., and Sarrantonio, M. (1998). “Legume-based cropping systems have reduced carbonand nitrogen losses,” Nature 396, 262-265.

GENUINE PROGRESS INDEX 75 Measuring Sustainable Development
The study found that application of legume-based cropping practices in the major maize/soybeangrowing region in the U.S. would increase soil carbon sequestration by an amount equivalent to1% to 2% of the estimated annual carbon released into the atmosphere from fossil fuelcombustion in the U.S. This saving is in addition to the lower CO2 emissions from the legume-based farming systems that are due to their 50% reduction in energy use. Even though the U.S.has refused to ratify the Kyoto Accord, such a shift in agricultural practices would be asignificant contribution to the U.S.’ original Kyoto commitment to reduce CO2 emissions by 7%by 2008-2012.
Best of all, the 15-year U.S. study found no loss in economic viability associated with the shiftfrom conventional synthetic fertilizer-based production using strict maize/soybean rotations tofar less energy intensive legume-based cropping methods. Ten-year averages for 1986-1995maize yields were 7,140, 7,100 and 7,170 kg/ha respectively for legume systems with manure,legume systems without manure, and conventional systems with fertilizer. In other words, theshift to more sustainable, lower impact, and less energy-intensive farming produced nosignificant loss in yields. For the past ten years of the experiment, economic profitability fromthe three systems has been comparable. In the longer term, it is possible that the legume systemswill produce higher yields than conventional systems that are more likely to degrade soil qualityover time.
The results show the potential for more sustainable farming systems to contribute greatly to areduction in the size of our ecological footprint. From that perspective, government financialincentives and tax breaks to facilitate the transition to more sustainable farming methods wouldbe an outstanding investment in a sustainable future. This is even truer when other environmentalco-benefits are considered. For example, the fixed nitrogen currently used in agriculturalactivities is responsible for a 60% increase in global levels of biologically active nitrogen 22.155
A full cost-benefit analysis that considered such environmental values in addition to reductionsin energy intensity would likely judge financial incentives for sustainable agriculture highly cost-effective. Most importantly, for the purposes of this study, the example of legume-basedcropping methods described above demonstrates the necessity for joint government-citizeninitiatives to reduce excess ecological footprint. Farmers and ordinary citizens will take thenecessary actions to reduce their footprints if public policy encourages and rewards such actions.
19. The Footprint of Tourism
The number and activities of tourists can significantly affect ecological footprint calculations fora particular region. It is therefore necessary to consider the tourist population when estimatingper capita consumption, in order to avoid inflating the actual consumption of residents. It istherefore necessary to reduce the per capita consumption of residents by the per capitaconsumption of tourists.
155 Jennifer Scott, author of GPIAtlantic’s Soils and Agriculture Accounts, personal communication.

GENUINE PROGRESS INDEX 76 Measuring Sustainable Development
While adjusting the PEI footprint to account for the consumption of tourists, it is also necessaryto account for the impact of PEI residents when they travel outside the province. Time andresources did not permit such a comparative impact analysis, and we have therefore assumed inthis report that the impact of visitors to PEI on the PEI footprint is roughly equivalent to theimpact of Islanders on the footprints of other jurisdictions when they visit other regions. This isconsistent with the approach taken in the Living Planet Report 2002, which considers onlyconsumption within national boundaries.156 Whether or not the consumption of tourists isattributed to PEI or to the visitors’ regions of origin, the crucial issue from a policy perspective isthat there are significant opportunities for reducing the tourism footprint in PEI and therebyminimizing the environmental impact of the tourism industry on the province.
Tourism is an important contributor to Prince Edward Island’s economy, with almost 1.3 millionpeople visiting the Island in 1999 and almost 1.2 million visitors in 2000.157 Tourism accountedfor 3% of the provincial GDP in 1996 and 1998. Tourism shares of GDP in PEI rank thirdhighest among Canadian provinces, surpassed only by the Yukon and British Columbia in bothyears (Figure 26).158
Figure 26. Tourism Shares of Gross Domestic Product, Canada and Provinces, 1996 and1998
Source: Statistics Canada (2003). The provincial and territorial tourism satellite accounts for Canada, 1998.Catalogue No. 13-604-MIE - No. 040.
156 See footnote 13.157 Prince Edward Island Business Development, PEI Economic Statistics, 2001. Available on the Government ofPrince Edward Island web site at: http://www.peibusinessdevelopment.com/index.php3?number=60483.158 Statistics Canada (2003). The provincial and territorial tourism satellite accounts for Canada, 1998. CatalogueNo. 13-604-MIE - No. 040.

GENUINE PROGRESS INDEX 77 Measuring Sustainable Development
The tourism industry share of employment is also significant in PEI. Tourism employment isdefined as the sum of all employees contributing to tourism production, consisting of both full-and part-time employment of self-employed persons, employees, and unpaid family workers. In1996, 4.7% of employment in PEI was in the tourism industry, decreasing slightly to 4.6% in1998 (Figure 27). PEI again ranks third highest among Canadian provinces for tourism shares ofemployment, surpassed only by the Yukon and British Columbia.159
Tourism contributes to the economy through several different commodity groups. A tourismcommodity is a good or service for which a significant part of the overall demand comes fromvisitors. Therefore, air passenger transportation is considered a tourism commodity, whilegroceries – although occasionally bought by tourists – are considered non-tourist commodities.Most tourism commodities are purchased while travelling; however, goods and services boughtsolely for the purpose of travel are also included.160 Tourism commodities include:
Transportation• Passenger air, rail, and water• Interurban, charter and tour buses• Taxis• Vehicle rental, and repairs, parts, and fuel for rental vehicles
Accommodation• Hotels, motels, camping, other accommodation (includes outfitters, commercial cabins
and cottages)
Food and beverage services• Meals and alcoholic beverages from accommodation and restaurants• Meals and alcoholic beverages from other tourism industries
Other tourism commodities• Recreation and entertainment• Travel agency services• Convention fees• Pre-trip expenditures (includes tents, camping goods, sleeping bags, luggage, motor
homes, trailers and semi-trailers of the caravan type for camping)
Non-tourism commodities purchased by tourists• Groceries• Beer, wine and liquor from stores• Urban transit and parking• Miscellaneous commodities (includes tobacco products, clothing, maps, and souvenirs)
159 Idem.160 Idem.

GENUINE PROGRESS INDEX 78 Measuring Sustainable Development
It is estimated that 1.27 million pleasure and business tourists visited PEI during the 1999tourism season (May 15th to October 31st).161 During the 2000 tourism period, fewer pleasureand business tourists (1.18 million) visited the Island.162 The estimated number of visitorsincreased slightly during the 2001 tourism season, to 1.185 million.163
Total tourism demand is defined as the spending of Canadian and non-resident visitors ondomestically produced commodities. Total tourism demand within a particular province istherefore the sum of domestic demand (includes expenditures associated with tourism activitywithin a given province by residents of that province), international demand (expenditures bynon-residents of Canada on tourism in Canada), and inter-provincial demand (expenditures byCanadian tourists made in a province or territory in Canada where they are not a resident).
Figure 27. Tourism Shares of Employment, Canada and Provinces, 1996 and 1998
Source: Statistics Canada (2003). The provincial and territorial tourism satellite accounts for Canada, 1998.Catalogue No. 13-604-MIE - No. 040.
Tourism expenditures for PEI in 1998 by commodity are presented and summed as total tourismdemand in Table 21. The most significant commodity groups include transportation ($54.6million; 30% of total tourism demand), accommodation ($54.2 million; 29.8% of total tourismdemand), and food and beverage services ($38.7 million; 21.3% of total tourism demand). Eachof these commodity groups affect the provincial ecological footprint.
161 Prince Edward Island Tourism Policy, Planning and Research (1999). Economic Impact: Tourism 1999.162 Prince Edward Island Tourism Policy, Planning and Research (2000). Economic Impact: Tourism 2000.163 Prince Edward Island Tourism Policy, Planning and Research (2001). Economic Impact - Tourism 2001.

GENUINE PROGRESS INDEX 79 Measuring Sustainable Development
For example, transportation, the largest expenditure commodity group, contributes to PEI’secological footprint in a number of different ways. As noted in Chapter 3, the footprint createdby the burning of fossil fuel is calculated as the biologically productive area that would beneeded to sequester enough CO2 emissions to avoid an increase in atmospheric CO2. Whetherfuel is consumed by residents of PEI or by visitors, fuel consumed within the province thereforecontributes to the ecological footprint in the form of land used for CO2 absorption.Transportation also contributes to the built-up area footprint since transportation requires the useof land for roads and other infrastructure associated with transportation.
Accommodations used by visitors to PEI also contribute to the provincial energy and built-uparea footprints. Tourists at hotels, motels, campgrounds and other accommodations consumeenergy for heating or air conditioning, electricity, hot water, etc. Hotels, motels andcampgrounds all occupy built-up land.
Again, whether consumed by residents or visitors to PEI, food and beverages contribute to theecological footprint of the province. Food and beverages that are produced locally or importedrequire the use of cropland, pasture land, and sea area, all of which contribute to PEI’s foodfootprint. In addition, the production and transportation of food consumed by visitors in PEIcontribute to the province’s energy footprint.
Table 21. Tourism Expenditures by Commodity, Prince Edward Island, 1998
Total Tourism Demand(C$1998 millions)
Percent ofTotal
Transportation $54.6 30.0%Accommodation $54.2 29.8%Food and Beverage Services $38.7 21.3%Other Tourism Commodities $27.2 15.0%Non-Tourism Commodities Purchased by Tourists $38.1 21.0%Total Tourism Expenditures - All Commodities $181.6
Source: Statistics Canada (2003). The provincial and territorial tourism satellite accounts for Canada, 1998.Catalogue No. 13-604-MIE - No. 040.
Reducing the footprint of tourism
Tourism is important to the economy of PEI. The Island reaps the benefits of the influx of touristdollars, but these benefits must also be considered within the larger environmental and socialcontext indicated by ecological footprint analysis. In 1998, 52.3% of visitors to PEI were fromother provinces/territories in Canada and 33.1% were international visitors.164 Reducing theecological footprint of tourism is more challenging than reducing other components of theecological footprint of PEI, although some actions designed to reduce the footprint of residentswill also reduce the footprint of visitors to the province.
164 Statistics Canada (2003). The provincial and territorial tourism satellite accounts for Canada, 1998. CatalogueNo. 13-604-MIE - No. 040. Statistics Canada, Ottawa.

GENUINE PROGRESS INDEX 80 Measuring Sustainable Development
For example, policies promoting walking, riding a bicycle, or carpooling to reduce the province’stransportation footprint are aimed primarily at residents of PEI and will have a limited impact onthe transportation footprint of tourists. However, integrated land use/transportation planningwould help to decrease the transportation footprint of both residents and visitors by locatingcommercial and recreational facilities close to accommodations. The suggestions listed in Table16 for reducing household energy consumption could also be used by hotels and other providersof accommodation to help reduce the energy footprint of accommodations. Support for localagriculture and sustainable farming methods would help to reduce PEI’s food footprint,regardless of who is consuming the food within the province.
20. A Good News Story: Prince Edward Island’s SolidWaste Footprint
Finally, readers may wonder whether Prince Edward Islanders have the individual capacity andcollective political will to reduce their ecological footprint substantially. The answer to thatquestion is a simple one, and it is not theoretical. Islanders have already demonstrated in practicetheir ability to act quickly, decisively and effectively to reduce their footprint, in solid wastereduction. If they can act effectively in one key area to reduce their impact on the environmentwithout compromising their quality of life, then they most certainly can do so in any of the otherareas discussed in this report.
One of the most direct ways to assess the success of waste management systems is to examinewaste generation, disposal, and diversion data. This is especially relevant in Canada, given thatone of the organizing principles behind solid waste-resource systems in this country was a 1989commitment by the Canadian Council of Ministers of the Environment to reduce the amount ofmaterial being disposed of in landfills or through incineration by 50% (of 1989 levels) by 2000.Comparing waste management data indicates how provincial systems measure up within Canadaand within the international community.
Waste generation and disposal
Canadians generated an average of 490 kilograms of residential waste per capita in 1997, thetenth highest rate of waste generation in the world, and 11% higher than the Organisation forEconomic Co-operation and Development (OECD) average of 440 kilograms per capita (Table22).165 Canada’s waste generation decreased significantly during the mid 1990s. As recently as1990, Canada generated 690 kilograms of residential waste per capita, and was the third largestgenerator of residential waste per capita, behind only the U.S. and Australia. Waste generationestimates in Table 22 are based on OECD data. Due to differences in definitions and calculationmethods, OECD figures from the 1990s do not compare with Statistics Canada waste generationestimates, which are explored later in this section. 165 Organisation for Economic Co-operation and Development (1999). Towards More Sustainable HouseholdConsumption Patterns: Indicators to Measure Progress, Working Group on the State of the Environment.

GENUINE PROGRESS INDEX 81 Measuring Sustainable Development
Table 22. Largest Per Capita Residential Waste Generators, 1997
Country Waste Generated(kilograms/capita)
U.S. 720Australia 690Norway 630Switzerland 600Ireland 560Netherlands 560Denmark 560Austria 510Hungary 500Canada 490OECD average 440
Source: OECD, October 1999. Towards More Sustainable Household Consumption Patterns: Indicators toMeasure Progress, Working Group on the State of the Environment.
Of the 490 kg per capita generated, Canada disposed of 370 kg in landfills and 29 kg throughincineration.166 Canada’s per capita landfill disposal rate is 25% higher than the OECD averageof 296 kg per capita. Low levels of landfill waste disposal in countries such as Denmark, Japan,and Sweden can partly be attributed to high levels of incineration, though Switzerland boasts a40% municipal waste diversion rate through recycling and composting (see Figure 28). Japanand Sweden, for example, incinerate 96% and 81% respectively of their waste while Canadaincinerates less than 6%.167
Canada has long been one of the largest waste producers in the world. From 1960 until 1990,municipal waste generation per Canadian increased by about 65% (Figure 29).168 During the1980s, however, due to environmental contamination from landfills and increasing publicpressure against the placement of landfills and incinerators in local communities, dealing withwaste became a pressing issue for all levels of government. Governments and the public began torecognize the need to give priority to effective waste management and waste reduction strategies.
In 1989, two key national initiatives marked a transition in how Canadians viewed solid waste.The first was a commitment by provincial environment ministers to reduce waste disposal by 166 The Canadian average of 490 kilograms of waste disposed per capita reported by the OECD (1999) is 29% lowerthan the 690 kilograms per capita reported by Statistics Canada in 1996. Statistics Canada (2000). Disposal of Wasteby Province and Territory, 1998, Environment Accounts and Statistics Division. According to Statistics Canada,690 kilograms of waste disposed per capita was the national average in 1996 and 1998. The OECD figures are from1997 (see footnote 165). The OECD data include only municipal solid waste whereas the Statistics Canada datainclude municipal and construction and demolition wastes disposed of in provincial landfills.167 OECD (1999). Waste incineration estimates are from the mid-1990s (see footnote 165 above).168 Estimates for 1980, 1990, and 1997: OECD (1999). OECD Environmental Data Compendium 1999. OECDPublications, Paris, France. The 1960 and 1970 figures are estimations derived from U.S. historical waste generationdata: USEPA (1996). Characterization of MSW in the United States, 1996 update. Available at:www.epa.gov/epaoswer/non-hw/muncpl/factbook.

GENUINE PROGRESS INDEX 82 Measuring Sustainable Development
50% by 2000. The second was the introduction of a national packaging protocol, whichcommitted industry to reduce packaging by 50% (by weight), by 2000.
Figure 28. Municipal Waste Diversion Through Recycling and Composting, SelectedOECD Countries and Prince Edward Island, 1997
Note: OECD estimates for waste generation are from 1997. The percentages of waste recycled and composted arefrom the mid-1990s.
Sources: PEI diversion rate: D. Griffin, Assistant Deputy Minister, PEI Department of Fisheries, Aquaculture andEnvironment, personal communication, 2003. Other diversion rates: OECD, October 1999. Towards MoreSustainable Household Consumption Patterns: Indicators to Measure Progress.
Consequently, the 1990s marked an end to Canada’s 30-year trend of increasing wastegeneration and disposal, and arguably the beginning of a revolution in how we deal with andthink about waste. That decade saw a sharp 22% decline in waste generation, largely due to theimpacts of the National Packaging Protocol and a decline in the percentage of waste disposed inlandfills in some provinces due to the introduction of municipal recycling and compostingprograms.169
Within Canada, success in waste reduction has varied dramatically from province to province.The data in Table 23 are from Statistics Canada and do not correlate with the information inFigure 29, which is from the OECD, due to differences in waste definitions and calculationmethods. The OECD data, for example, include only municipal solid waste whereas the StatisticsCanada data include municipal as well as construction and demolition wastes disposed of inprovincial landfills. Due to provincial differences in waste disposal record keeping, even thecomparability of the provincial statistics in Table 23 is questionable. A national standard for the
169 OECD (1999) (see footnote 168).
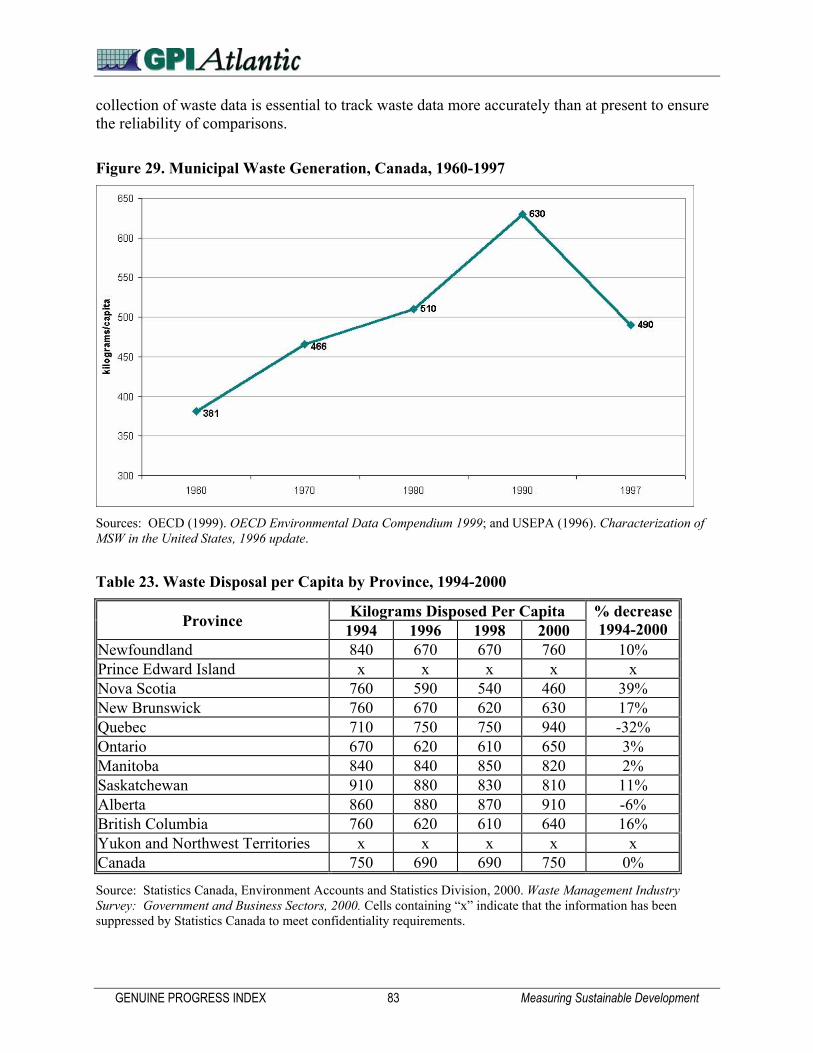
GENUINE PROGRESS INDEX 83 Measuring Sustainable Development
collection of waste data is essential to track waste data more accurately than at present to ensurethe reliability of comparisons.
Figure 29. Municipal Waste Generation, Canada, 1960-1997
Sources: OECD (1999). OECD Environmental Data Compendium 1999; and USEPA (1996). Characterization ofMSW in the United States, 1996 update.
Table 23. Waste Disposal per Capita by Province, 1994-2000
Kilograms Disposed Per CapitaProvince 1994 1996 1998 2000% decrease1994-2000
Newfoundland 840 670 670 760 10%Prince Edward Island x x x x xNova Scotia 760 590 540 460 39%New Brunswick 760 670 620 630 17%Quebec 710 750 750 940 -32%Ontario 670 620 610 650 3%Manitoba 840 840 850 820 2%Saskatchewan 910 880 830 810 11%Alberta 860 880 870 910 -6%British Columbia 760 620 610 640 16%Yukon and Northwest Territories x x x x xCanada 750 690 690 750 0%
Source: Statistics Canada, Environment Accounts and Statistics Division, 2000. Waste Management IndustrySurvey: Government and Business Sectors, 2000. Cells containing “x” indicate that the information has beensuppressed by Statistics Canada to meet confidentiality requirements.
GENUINE PROGRESS INDEX 84 Measuring Sustainable Development
Statistics for PEI, Yukon, and the Northwest Territories in Table 23 have been suppressed tomeet the confidentiality requirements of the Statistics Act. Statistics Canada collects wastedisposal information using surveys completed by the waste management industry. In the case ofPEI, there is only one company providing waste management services (the Island WasteManagement Corporation). Therefore, the confidentiality guaranteed under the Statistics Actwould not be possible to maintain if the statistics for PEI were published. Waste disposal percapita decreased by between 2% (Manitoba) and 39% (Nova Scotia) from 1994 to 2000 (Table23). During this same period, the Canadian average remained constant, largely due to increasesin waste disposal per capita of 6% in Alberta and 32% in Quebec.
Waste diversion
The OECD waste diversion estimates for 1997 are based on the percentage of waste recycled andcomposted as a proportion of total waste generation. The percentage of diversion in OECDcountries ranges from a high of 40% in Switzerland to a low of 0% in the Czech Republic,Hungary, and Italy. Canada, with a diversion rate of 19%, ranks slightly above the OECDaverage of 16% (Figure 28).170
Prince Edward Island’s 50% diversion rate in 1997 ranked higher than all the OECD nations.However, it is important to note that there are significant differences in the waste data definitionsand calculation methods among the OECD countries, and there is no international protocol forwaste diversion estimates. A comparison between PEI and the OECD countries, while subject tothese data limitations, is nevertheless useful to demonstrate that PEI is at least among the leadersin waste diversion internationally.
Solid waste management services in PEI are administered by the Island Waste ManagementCorporation (IWMC), a provincial Crown Corporation.171 The IWMC operates and maintainsprovincial disposal sites, and is responsible for the Waste Watch program, a three-stream wastemanagement system, based on source separation. The Waste Watch program sorts waste intorecyclables, compostables, and residual waste materials. Items such as paper, plastics, metal andglass are recycled, organics such as food and yard waste are composted at the Central CompostFacility, and remaining residuals are disposed of to landfill or incinerator.
Figure 30 shows the increase in the waste diversion rate in PEI between 1989 and 2002 and theprojected waste diversion rate for 2003. Between 1989 and 1997, the waste diversion rateincreased from 22% to 50% before dropping slightly to 48% in 2000 and increasing to 50%again in 2002. Prior to 2002, only a quarter of the population of PEI was on the Waste Watchpilot project. The entire province is now covered by the IWMC’s Waste Watch program, and it isanticipated that the diversion of material from landfill or incineration will be in the 65% range in2003.
170 OECD (1999). Waste generation data are from 1997. Recycling and composting data are from the mid-1990s (seefootnote 168 above).171 For more information, see the Island Waste Management Corporation’s web site at:http://www.iwmc.pe.ca/index.htm.

GENUINE PROGRESS INDEX 85 Measuring Sustainable Development
Figure 30. Prince Edward Island Waste Diversion Rates, 1989-2002, and Projected 2003Waste Diversion Rate
Source: D. Griffin, Assistant Deputy Minister, PEI Department of Fisheries, Aquaculture and Environment,personal communication, 2003.
Prince Edward Island stewardship initiatives172
Prince Edward Island participates in several stewardship initiatives that also lead to wastediversion, including the Refillable Beverage Container Programme, the Beverage ContainerRecycling Programme, the Lead Acid Battery Take Back Programme, the Used Oil RecoveryProgramme, and the Tire Recovery Programme. A short summary of each of these initiatives ispresented below, including information on their success rates.
Refillable Beverage Container Programme
The Refillable Beverage Container Programme is unique to Prince Edward Island, and covers theentire province. This mandatory program requires that beverage containers for beer andcarbonated flavoured beverages be sold in refillable glass containers. The main goals are toreduce roadside litter to the greatest extent possible, to recover as many of the refillablecontainers as possible, and to maintain a 98% recovery rate on containers.
Consumers have the option to return bottles to the retailer or to bottle depots. Both soft drinksand beer have a 98% return rate. Bottle washing replaces the manufacturing of new cans or
172 PEI’s stewardship initiatives are summarized on the Environment Canada web site at:http://www.ec.gc.ca/epr/inventory/en/searchResults.cfm?intProvince=110&newQuery=1.

GENUINE PROGRESS INDEX 86 Measuring Sustainable Development
bottles, thus reducing waste generation, resource depletion, and energy use. Containers circulatein a two-way stream between beverage producers and consumers instead of a one-way streamfrom manufacture to disposal. Since 1980 over one billion one-way containers have beeneliminated from use in PEI by the refillable system. The system also helps the Island’s localeconomy since local bottle washers are supported, rather than out-of-province and internationalcan and bottle manufacturers. Through the implementation of this program, therefore, disposal islargely eliminated and the local bottle washing industry is supported.
Beverage Container Recycling Programme
This mandatory province-wide wine and cooler beverage container recycling programme hasbeen in place since 1992 with the purpose of reducing roadside waste and collecting as manyrecyclable containers as possible. The Prince Edward Island Liquor Control Commission acceptsempty wine and cooler containers at all retail outlets and recycling depots. Deposits are $0.10 forbottles equal to or under 500ml, and $0.20 for bottles over 500ml. Consumers receive half of thedeposit ($0.05 to $0.10) back at retail outlets, or $0.03 and $0.07 when returning them torecycling depots. In 2000-2001 the recovery rate for these liquor containers was 60%.
Lead Acid Battery Take Back Programme
Introduced in 1993, this program focuses on lead acid batteries, including all vehicle batteries(car, truck, snowmobile, motorcycle, off-road vehicle, and ride-on lawnmower batteries).Regulations require retailers to charge a $5 fee on new battery purchases, unless an old battery isreturned within 30 days. Provincial regulations state that retailers must send old batteries to theappropriate facilities for recycling. The programme’s target is to recover all batteries sold in PEI.In 1998, there was a 65% recovery rate of batteries and battery-related materials, followed by a70-75% capture rate in 1999, and a remarkable 107% rate in 2000, as consumers returned morebatteries than they bought.
Used Oil Recovery Programme
Introduced in 1988, this programme includes all lubricating oils, which include engine oil,transmission fluid and gear oil. The program is based on a return to the point-of-purchase (i.e.,the seller), which includes any service stations, stores etc. that sell lubricating oil. Sellers arerequired to accept used oil in quantities of up to 10 litres per person per day or the equivalentsize of the largest container of lubricating oil that is sold on the premises. Once collected, it issent for recycling or other end-uses. In 2000, 463,586 litres of used oil were collected in PEIthrough the program.
Tire Recovery Programme
PEI Retailers charge a levy on all tires purchased within the province. The Island WasteManagement Corporation contracts the retailers and disposal facilities, which collect the tires.The annual levy income of $200,000 is spent to collect and bale about 100,000 tires a year.

GENUINE PROGRESS INDEX 87 Measuring Sustainable Development
The tires are sent to a site on the central-western part of the Island where they are baled intoblocks. Two projects in particular have used some of the baled material for sea wall applications.
Based on diversion and other waste management data, PEI is a leader both nationally andinternationally in waste diversion. At the international level, Prince Edward Island’s wastediversion rate is among the best in the world compared to all OECD countries. Along withSwitzerland, the Netherlands, and Austria, PEI leads the world in waste diversion,surpassing even those European leaders.
Municipal waste generation and “Generally Accepted Principles”
It is extremely difficult to compare waste diversion numbers between jurisdictions because of awide array of different approaches to measuring and reporting waste generation figures. Forexample, some municipalities include disposal of large appliances and furniture, as well as curb-side collection of waste from commercial establishments and multiple unit dwellings, whileothers do not. This lack of consistency in measurement methods has made it very difficult tocompare or aggregate municipal, provincial, and even federal waste generation and diversiondata. In early 2000, a non-profit organization called Corporations Supporting Recycling (CSR)established a Canada-wide group to examine municipal waste flow and diversion statistics in aneffort to apply standardized principles and practices to measuring waste flow.
The result was the development of “Generally Accepted Principles” (GAP). GAP is ameasurement protocol that ensures a consistent format for measuring and reporting waste flowand waste diversion at the residential level. Data on per capita disposal and diversion calculatedusing the GAP protocol are currently available for municipalities in Ontario, Alberta and NovaScotia. Although not all municipalities adhere to the GAP protocol, the number of participatingmunicipalities is growing, allowing for more consistent municipal waste generation comparisons.PEI municipalities do not currently participate in GAP reporting. For more information about theGAP model, visit the CSR web site at www.csr.org.173
The average residential waste generation for municipalities with GAP reports available was 374kg per person in 2000, 259 kg or 69% of which is disposed in landfills.174 Diversion rates for theGAP protocol are calculated (as are the OECD diversion rates) based on the proportion of totalwaste generated that is diverted from landfills by being reintroduced back into the flow ofmaterials.175 Halifax Regional Municipality, according to the GAP protocol, has a residentialdiversion rate of 57%, the highest diversion rate of all the municipalities with GAP reportsavailable (Figure 31). The HRM diversion rate is twice as high as the GAP average and over 3.5
173 Information about the GAP model can also be obtained by telephone at 416-594-3456, extension 238.174 Corporations Supporting Recycling (2001). GAP reports for municipalities reporting according to GAPguidelines are available at www.csr.org. The data set used in this report were accessed through the web site(www.csr.org) in November 2001.175 A GAP diversion rate is the percentage of waste generated that is diverted from landfills by being reintroducedback into the flow of materials. This is different from the diversion definition used by the Canadian Council ofMinisters of the Environment (CCME) in setting the goal of 50% waste diversion by 2000. The 50% diversion goalrefers to a 50% diversion from landfills compared to the amount being sent to landfills in 1989.

GENUINE PROGRESS INDEX 88 Measuring Sustainable Development
times the OECD average. If PEI municipalities were to report according to the GAP protocol,they would likely exceed the current HRM diversion rate.
Figure 31. “Generally Accepted Principles” Municipality Diversion Rates, 2000
Source: Corporations Supporting Recycling, November 2001 (www.csr.org).
Reducing Prince Edward Island’s solid waste footprint further
Toward a zero waste target
Although PEI has made great and commendable strides in diverting wastes from landfill, thereare still many other ways the Island can continue to reduce its solid waste footprint. In the past,most public policy on solid waste reduction has been narrowly focused on recycling and havebeen content with recycling targets ranging from 35-50%. But would Islanders accept 50%unemployment or 50% poverty, or a 50% reduction in famine or disease? Islanders would surelywish to see zero unemployment, zero poverty, zero famine and zero disease. By the same token,a society genuinely committed to sustainability can legitimately set “zero waste” as its ultimatetarget.
To make further substantial reductions in PEI’s solid waste footprint, a paradigm shift in theapproach waste issues is needed. Instead of concentrating on “managing” waste, resources

GENUINE PROGRESS INDEX 89 Measuring Sustainable Development
should be managed and waste should be eliminated. The concept of “zero waste” unitesenvironmental sustainability, community sustainability, and economic sustainability. Zero wasteis not only about recycling and diverting waste from landfills and incinerators, but envisions therestructuring of production and distribution systems to prevent waste from being created fromthe outset.176
Practical strategies for movement towards a zero waste target include:
• incentives for extended producer responsibility (taking responsibility for the product andits packaging from cradle-to-grave);
• incentives for environmentally friendly product design (products that are produced fordurability, easy repair, and/or easy upgrading, including design that accounts for theproduct’s entire life cycle);
• incentives that encourage the use of renewable resources rather than virgin resources;• resource recovery facilities to enable materials discarded by the community to be reused,
recycled, and remanufactured (for example, PEI’s Waste Watch Drop-Off Centers177);• legislation and economic instruments that encourage conservation and resource recovery,
and that penalize unsustainable practices.
PEI’s remarkable success in reducing its solid waste footprint by 50% in just a few yearsindicates that dramatic and substantial shifts in behaviour and action are actually possible. Notonly can PEI reduce its solid waste footprint even further, but the same basic principles andstrategy of government-citizen cooperation can be applied to footprint reductions in energy use,innovative transportation options, integrated land use/transportation planning, support ofsustainable agriculture, and exploration of renewable energy sources like wind power.
In the spirit of past successes, the last Chapter of this report proposes a specific footprintreduction target that PEI’s solid waste achievements tell us is well within the Island’s capacityand reach.
21. Treading Lightly: Ecological Footprint Can Be Reduced
The ecological footprint is primarily an educational tool that can help the citizens of PrinceEdward Island to clearly visualize the impact of their consumption patterns, to become moreresponsible for their choices, and to move PEI toward a healthy, sustainable community. Itallows all Islanders to share responsibility in this enterprise.
The 1999 PEI ecological footprint of 8.98 hectares per person is clearly not sustainable. Ageneral lack of awareness of the environmental impact of resource consumption and wasteproduction in the past has seriously degraded the natural world and undermined natural wealth.
176 Target Zero Canada (2001). Beyond Recycling – Zero Waste. Available at: www.targetzerocanada.org/.177 For information on Waste Watch Drop-Off Centers in PEI, visit the Island Waste Management Corporation’sweb site: http://www.iwmc.pe.ca/sites.htm.

GENUINE PROGRESS INDEX 90 Measuring Sustainable Development
While the complex scientific processes that underlie human interaction with the environment areoften difficult for ordinary citizens and policy makers to understand, let alone convert intopolicy, the ecological footprint is a simple yet powerful means to illustrate and represent theenvironmental impact of daily consumption patterns and life choices, and to suggest practicalmeans to reduce that impact.
To secure a healthy, vibrant future for the children of Prince Edward Islanders, individuals,businesses, and government can use the ecological footprint concept to accept full responsibilityfor current policy and consumption choices and to take the necessary actions to reduce thefootprint of PEI. The action can begin anywhere, because footprint savings add up quickly.
If all Prince Edward Islanders reduced their individual footprints from 8.98 ha/capita to 7.0ha/capita, which can easily be done through some of the very basic transportation, householdenergy, and food consumption shifts outlined in this report, the total provincial footprint wouldshrink by over one quarter of a million hectares. That would be a sign of “genuine progress.”GPIAtlantic therefore proposes that a quarter million hectare reduction in the province’secological footprint be set as an immediate goal, with a 2005 target date.
Clearly in the long term, the province’s ecological footprint needs to be reduced far moredramatically. However, as PEI’s solid waste reduction accomplishment has shown, oncefootprint reduction priorities and clear targets are set, and decisive actions are taken, substantialsuccesses can be achieved in a very short time period. As recently as 1981, the PEI footprint wasjust 5.79 ha per person, so substantial footprint reductions that do not impair quality of life arevery conceivable.
Here are a few basic suggestions to help Islanders get started:
• Walk and ride a bicycle whenever possible.• Car-pool or take public transportation to work instead of driving alone. In the case of
PEI, which currently has no significant public transportation, the development of a publictransportation system would help to reduce the ecological footprint of the province. In themeantime, Islanders can take advantage of their strong community and neighbourly tiesto institute an effective car-pooling system, while continuing to lobby for public transit.
• Keep vehicles well maintained.• Buy locally grown and organic foods.• Consume the number of calories that are appropriate for one’s age and level of activity.• Eat more grains and vegetables, and less meat products.• Reduce, reuse, recycle, and compost.• Reduce household energy use by turning off lights and replacing burned out bulbs with
halogen or compact fluorescent bulbs; turning down the temperature at night and whennot home; hanging out the laundry to dry; insulating walls and roofs; and investing inenergy efficient appliances.
• Select fuel-efficient vehicles, and avoid SUVs, minivans, light trucks and other fuel-inefficient vehicles.
• Live close to work or try to choose work in close proximity to where one lives.• Grow a food garden.

GENUINE PROGRESS INDEX 91 Measuring Sustainable Development
If all Prince Edward Islanders took just a few of these simple steps – many of which can improvehealth, wellbeing and quality of life, and save money – they could quickly reduce their individualfootprints by a hectare per person, and the provincial footprint by more than a quarter of amillion hectares. Prince Edward Island communities can compete with each other in a friendly,constructive way, to determine which one can reduce its footprint most effectively anddramatically, while enhancing the quality of life of its residents. As a province, PEI can becomea model for other Canadians and citizens world-wide by setting new standards of ecologicallyresponsible living.
Once started on this path, Prince Edward Islanders can go deeper. Islanders can begin to evaluatethe underlying nature of their consumer lifestyles in new ways and to ask themselves some toughquestions:
• How much of what we consume is a reflection of need? Do we really need that secondcar or third TV?
• How much of our consumption is excessive? How important is a large home?• How much of our consumption is driven by marketing and advertising?• How much of our consumption is an attempt to fulfill missing psychological needs?• Does consuming more really make us happier?• Might our wellbeing and quality of life have more to do with strong and caring
communities, a healthy environment, and long-term security than with more materialconsumption?
• How do our consumption habits affect our responsibility to our community, to PEI, toCanada, and to the world?
• How do we shift our public policy priorities to chart a more sustainable future for ourchildren?
Real footprint savings will come by consuming less, shifting consumption choices, and changingpublic policy priorities. Consumption choices determine the size of an individual ecologicalfootprint. The first choice is to exercise the right not to consume. Individuals also have the powerto exercise choice over what products they consume. Purchasing local foods and goods, fuel-efficient car models, and energy-saving household appliances and equipment creates a smallerfootprint than the usual alternatives.
Ultimately, if Islanders are to make the deep footprint reductions essential to curbing theircurrent overshoot and protecting their childrens’ future, they will have to act as a society ratherthan as individuals. Fortunately, there are many practical and constructive places to start that canimprove social wellbeing and strengthen communities, while at the same time substantiallyreducing ecological footprint.
Both in urban and rural areas, how communities are designed has an immense influence on theresource intensity of the lifestyles of members of that community. There are excellent existingmodels that can help develop an infrastructure that:
• reduces dependency on the automobile,• ensures safe and easy access to amenities,

GENUINE PROGRESS INDEX 92 Measuring Sustainable Development
• promotes attractive community and town centres and urban villages,• reduces urban sprawl,• promotes energy efficient homes and co-housing developments, and• encourages the use of energy efficient technologies.
How communities are designed today will directly influence the ecological footprint of futuregenerations, their quality of life, and the legacy they leave their own children.178
This report has also suggested policy actions that can support local agriculture, encouragesustainable farming methods, and promote nutritional education to reduce food footprint.Investments in public transit, construction of bicycle lanes, incentives for renewable energydevelopment, district heating investments, and a range of other policy initiatives can sharplyreduce PEI’s energy footprint.
Internationally, many towns, communities, and governments have successfully taken these andother initiatives to reduce their ecological footprints, and improve the health and wellbeing oftheir citizens. Islanders can learn from their examples, and borrow the best of what is alreadyavailable to suit PEI’s particular needs and circumstances.
Prince Edward Islanders can also learn from what we they already accomplished in the province.Islanders have already dramatically reduced their solid waste footprint and the Island’s worldleadership in composting, recycling and solid waste diversion is a model of government-citizencooperation that can show a sustainable way forward. In July 2003, the 44th Annual Premiers’Conference and the Tree Canada Foundation worked together to organize the first ever “carbonneutral” Premiers’ conference in Charlottetown.179 Tree Canada will plant 850 trees to offset theCO2 emissions of the delegates, including their method of travel and the energy consumed duringthe time they spent on PEI. Thirteen of the trees were planted by the premiers and territorialleaders in Charlottetown, with the remaining trees planted across the country. Through thissymbolic action, PEI has provided an outstanding example for the country, raised awarenessabout an important global issue, and helped reduce the ecological footprint of the conference.Clearly, footprint reductions are not only possible but have already been successfullyaccomplished in PEI.
In the early 1980s too, Prince Edward Islanders substantially reduced their energy footprint byswitching to smaller, fuel-efficient cars, insulating their homes, and adopting other conservationmeasures. However, the provincial energy footprint started to creep upwards again in the 1990s.In 1999, PEI’s total energy footprint (4.3 ha/person) was 29% larger than it was in 1981.The average Prince Edward Islander’s total ecological footprint in 1999 (8.98 ha/person) was 7%smaller than the average American’s footprint (9.7 ha/person), but it was still 1.8 times largerthan the average Western European’s footprint (4.97 ha/person), indicating that PEI might moreproductively look to Europe and elsewhere for workable models of sustainable development thanto the U.S. Denmark, for example, has become a world leader in wind energy; the Netherlands isactively promoting organic farming and bicycle use; BMW cars are now made with 35% 178 Onisto et al, 1998. See footnote 10.179 First “Carbon Neutral” Premiers’ Conference to be Held in PEI, press release available at:http://www.gov.pe.ca/news/getrelease.php3?number=3199.

GENUINE PROGRESS INDEX 93 Measuring Sustainable Development
recycled parts; 180 and Curitiba, Brazil, has become a world leader in integrated landuse/transportation planning and mass transit use.
In sum, for a PEI determined to reduce its ecological footprint, there is no shortage ofoutstanding examples of sustainable living and development, including powerful ones within itsown borders. The effort to reduce the Island’s ecological footprint will require government,business and citizen participation. Policy makers and businesses can play a key leadership role inencouraging, supporting and investing in sustainable initiatives. Prince Edward Islanders willhave to work together to bring about the changes necessary to make PEI a healthy, vibrant andsustainable province that Islanders are proud to leave as an inheritance to future generations, andthat can serve as a model for others.
180 “MP Looks for Better Method to Measure Canada’s Success,” The Kingston Whig-Standard, 21 February, 2001.

GENUINE PROGRESS INDEX 94 Measuring Sustainable Development
APPENDIX ATHE NOVA SCOTIA GENUINE PROGRESS INDEX:
PURPOSES, PRINCIPLES AND METHODS
Limitations of the Gross Domestic Product as a Measure of Progress
The most commonly used basis for assessing economic and social wellbeing is the GDP. Yet, inrecent years there has been increasingly widespread acknowledgement by leading economists ofthe shortcomings of the GDP as a comprehensive measure of progress. Indeed, as an aggregationof the market value of all goods and services, the GDP was not intended, even by its architects,as a composite index of economic welfare and prosperity.
Using GDP levels and economic growth rates to measure progress takes no account of the valueof natural, human and social capital, including environmental assets, unpaid work, and free time.It does not allow policy makers to distinguish the costs and benefits of different economicactivities, and it masks changes in income distribution. Such fundamental omissions andlimitations render the GDP an inadequate measure of social and economic wellbeing.
It should be noted that these are not flaws of the GDP per se, but of its misuse as a benchmark ofeconomic and social health, prosperity and welfare. Nobel Prize winner, Simon Kuznets, one ofthe principle architects of national income accounting and the Gross National Product, neverendorsed its modern use as an overall measure of progress. As early as 1934, Kuznets warned theU.S. Congress that “the welfare of a nation can scarcely be inferred from a measurement ofnational income.”181
As the GNP and its successor, the GDP, began increasingly to be used as a measure of generalsocial wellbeing and progress after the Second World War, Kuznets’ reservations about thelimitations of the system he helped create grew stronger and he argued that the whole system ofnational accounting needed to be fundamentally rethought. In 1962 he wrote:
“Distinctions must be kept in mind between quantity and quality of growth,between its costs and return and between the short and the long run. Goals for‘more’ growth should specify more growth of what and for what.”182
When the GDP is misused as a measure of wellbeing and progress, it frequently sendsmisleading and inaccurate signals to policy makers that in turn results in the depletion of vitalresources and investment in economic activities that carry hidden social and environmental costs.What we count and measure is a sign of what we value. By focusing on quantitative material
181 Cobb, C., Halstead, T., and Rowe, J., 1995, The Genuine Progress Indicator: Summary of Data andMethodology, Redefining Progress, San Francisco, California.182 Kuznets, Simon, The New Republic, Oct. 20, 1962, (cited in Cobb et al. 1995).

GENUINE PROGRESS INDEX 95 Measuring Sustainable Development
growth as our primary measure of progress, we under-value the human, community, and socialvalues, and environmental quality, which are the true basis of long-term wellbeing, prosperityand wealth. The flaws inherent in the misuse of the GDP as a measure of progress include thefollowing:
The failure to value natural capital
The GDP is a current income approach that fails to value natural and human resources as capitalassets subject to depletion and depreciation. As such it cannot send early warning signals topolicy makers indicating the need for re-investment in natural and human capital. For example,the GDPs of Newfoundland and Nova Scotia registered massive fish exports as economicgrowth, but the depletion of fish stocks appeared nowhere in the accounts. Similarly, the moretrees we cut down and the more quickly we cut them down, the faster the economy will grow.Measured from the consumption side, the more voraciously we consume energy, fish, timber,and other resource products, the “better off” we are assumed to be.
The failure to make qualitative distinctions
Secondly, the GDP itself is a quantitative measure only and fails to account for qualitativechanges, both in the mix of economic activity and in the quality of our goods and services,including ecosystem services.183 This failure can send perverse messages to policy makers, withpollution actually registering as a contribution to economic prosperity. The Exxon Valdez, forexample, contributed far more to the Alaska GDP by spilling its oil than if it had delivered its oilsafely to port, because all the clean-up costs, media activity, legal expenses, and salvageoperations made a huge contribution to the state’s economic growth statistics.
Thus, water pollution and bottled water sales are literally “better for the economy,” according toour economic growth statistics, than free, clean water, simply because more money is spent onthe former. Repairing the damage from extreme weather events and natural disasters due toclimate change is actually counted as a contribution to our prosperity and wellbeing when theGDP is used to assess how “well off” we are. This happens because the GDP blindly records allmoney spent as a contribution to the economy, without assessing whether this spending actuallysignifies an improvement in wellbeing or a decline.
This incongruity extends even to ordinary household purchases. There is no recordedrelationship, for example, between the cost of consumer durables as capital investments on theone hand and the quality of services they provide on the other, leading to the paradox that thequicker things wear out and have to be replaced, the better for the GDP.
183 The Canadian System of National Accounts (CSNA) as a whole does provide information on shifts in the mix ofeconomic activity by sector, industry, commodity, and province. These remarks, therefore, apply only to the use ofGDP as a measure of progress, since industry and commodity shifts registered in the CSNA are rarely invoked assignals of changes in societal wellbeing and prosperity.

GENUINE PROGRESS INDEX 96 Measuring Sustainable Development
In sum, this failure to account for qualitative changes means that increases in crime, divorce,gambling, road accidents, natural disasters, disease, obesity, mental illness, and toxic pollutionall make the GDP grow, simply because they produce additional economic activity. Moreprisons, security guards, burglar alarms, casinos, accident costs, storms, natural disasters, dietingpills, anti-depressants, lawyers, oil spill and pollution clean-ups, and the costs of setting up newhouseholds after family breakups, all add to the GDP and are thus conventionally counted as“progress.”
This anomaly led Robert Kennedy to remark 30 years ago:
“Too much and too long, we have surrendered community excellence andcommunity values in the mere accumulation of material things....The (GNP)counts air pollution and cigarette advertising and ambulances to clear ourhighways of carnage. Yet the gross national product does not allow for the healthof our children, the quality of their education, or the joy of their play. It measuresneither our wit nor our courage; neither our wisdom nor our learning; neither ourcompassion nor our devotion to our country. It measures everything, in short,except that which makes life worthwhile.”184
In short, because GDP statistics make no qualitative distinctions, they do not reveal whetherexpenditures signify an improvement in wellbeing or a decline. Standard economic growthmeasures are simply incapable of sending any meaningful signal about natural resource health,and of distinguishing gains from losses in wellbeing. Indeed, resource yield statistics, thoughconventionally used to signal industry health, may well signify the precise opposite from theperspective of long-term sustainability.
Other limitations
Thirdly, because it excludes most non-monetary production, the GDP records shifts in productiveactivity from the household and non-market sectors to the market economy as economic growth,even though total production may remain unchanged. Thus, paid child care, hired domestic help,and restaurant food preparation all add to the GDP, while the economic values of parenting,unpaid housework, home food preparation, and all forms of volunteer work remain invisible inthe economic accounts.
Fourthly, market productivity gains may result in greater output or increased leisure, but theGDP counts only the former. Longer paid working hours add to GDP growth by increasingoutput and spending, but free time is not valued in our measures of progress, so its loss countsnowhere in our accounting system. Given this imbalance, it is not surprising that the substantialeconomic productivity gains of the last 50 years have manifested in increased output, incomes,and spending, while there has been no real increase in leisure time.
184 Kennedy, R., 1993, “Recapturing America’s Moral Vision,” in RFK: Collected Speeches, Viking Press, NewYork.

GENUINE PROGRESS INDEX 97 Measuring Sustainable Development
Omitting the value of unpaid work and free time from our measures of progress has importantimplications for the changing role of women in the economy, who have entered the paidworkforce in growing numbers without a corresponding decline in their share of unpaid work.Indeed, as the “value of leisure time” module in the GPI demonstrates, women have experiencedan increase in their total work-load, higher rates of time stress, and an absolute loss of leisuretime.
The failure to value leisure time is directly related to natural resource and environmental healthand wellbeing. Blind economic growth and material gain have been the major anthropogenicforces fuelling ecological degradation, including the depletion and deterioration of vital naturalresources and the dangerous warming of the planet. Re-examining work patterns in industrializednations to value increased leisure rather than income growth alone as a key to wellbeing, canmake a vital contribution to ecological health and stability.185
Finally, GDP tells us how much income the economy generates, but tells us nothing about howthat income is shared. Because it does not account for income distribution, GDP growth maymask growing inequality. GDP may rise substantially, as it has in recent years, even while manypeople are getting poorer and experiencing an actual decline in real wages and disposableincome. The benefits of what experts refer to as “strong” and “robust” economic growth, basedon GDP measurements, may be distributed very unequally. The trend towards rising inequality ina period of strong economic growth has been even more pronounced in the U.S. than inCanada.186
These shortcomings and others led to a joint declaration by 400 leading economists, academics,and leaders, including Nobel Laureates:
“Since the GDP measures only the quantity of market activity without accountingfor the social and ecological costs involved, it is both inadequate and misleadingas a measure of true prosperity... New indicators of progress are urgently neededto guide our society... The GPI is an important step in this direction.”187
185 For an outstanding exposition of this relationship, see Anders Hayden, Sharing the Work, Sparing the Planet:Work Time, Consumption and Ecology, Between the Lines, Toronto, 1999186 Cobb, C., Halstead, T., and Rowe, J., 1995, The Genuine Progress Indicator: Summary of Data andMethodology, Redefining Progress, San Francisco, California; Messinger, Hans, 1997, Measuring SustainableEconomic Welfare: Looking Beyond GDP, Statistics Canada, unpublished manuscript, Ottawa. Messingerdemonstrates that the absolute decline in the original U.S. Genuine Progress Indicator since the early 1970s islargely due to growing disparities in income distribution in that country. Rising inequality is registered in column Bof the original GPI as an adjustment to personal consumption based on the share of national income received by thepoorest 20 percent of households.187 Signatories include Robert Dorfman, Professor Emeritus, Harvard University, Robert Heilbroner, ProfessorEmeritus, New School for Social Research, Herbert Simon, Nobel Laureate, 1978, Partha Dasgupta, OxfordUniversity, Robert Eisner, former president, American Economics Association, Mohan Munasinghe, Chief,Environmental Policy and Research Division, World Bank, Stephen Marglin and Juliet Schor, Harvard University,Don Paarlberg, Professor Emeritus, Purdue University, Emile Van Lennep, former Secretary General, OECD,Maurice Strong, Chair, Ontario Hydro and Secretary General, Rio Earth Summit and Daniel Goeudevert, formerChairman and President, Volkswagen AG. Full text and signatory list available from Redefining Progress, OneKearny St., San Francisco, CA. 94108.

GENUINE PROGRESS INDEX 98 Measuring Sustainable Development
The Development of Expanded Accounts
Fortunately, considerable progress has been made in the last 20 years by the World Bank,OECD, United Nations, World Resources Institute, and other international organizations, bynational statistical agencies, including Statistics Canada, and by leading research institutes anddistinguished economists, in developing expanded economic accounts which include criticalsocial and environmental variables. The internationally accepted guidelines in The System ofNational Accounts 1993 now suggest that natural resources be incorporated into national balancesheet accounts and that governments develop a “satellite system for integrated environmental andeconomic accounting,” and a satellite account to measure the value of unpaid household work.
Accordingly, Statistics Canada, in December, 1997, released its new Canadian System ofEnvironmental and Resource Accounts (CSERA), which consist of natural resource accountslinked to the national balance sheets, material and energy flow accounts linked to the input-output tables, and environmental protection expenditure accounts. Statistics Canada hassponsored an international conference on the measurement of unpaid work, has produced its ownextensive valuations of household work, and is developing a Total Work Accounts System(TWAS) which includes both paid and unpaid work (Statistics Canada 1997; Stone and Chicha1996). Every six years an extensive time use survey is now part of Statistics Canada’s GeneralSocial Survey. Other agencies are also moving in this direction. Human Resources DevelopmentCanada, for example, has issued an Index of Social Health for all the provinces and for thecountry as a whole.
Some composite indices, like the Measure of Economic Welfare (MEW), the Index ofSustainable Economic Welfare (ISEW), the Genuine Progress Indicator (GPI), and the Index ofEconomic Wellbeing (IEW), incorporate up to 26 social and environmental indicators, includingunpaid work, income distribution, changes in free time, and valuations of natural capital and thedurability of consumer goods.188 These indices also distinguish direct contributions to economicwelfare from defensive and intermediate expenditures and from economic activities that producean actual decline in wellbeing. There have been continuing improvements in methodologies anddata sources in recent years, and excellent models are now available for application.
In fact, the current interest in social indicators and comprehensive measures of progress owes astrong debt to the pioneers in this field of the late 1960s and early 1970s, who recognized thelimitations of the GDP and sought to go beyond them. Nordhaus and Tobin’s Measure ofEconomic Welfare and similar efforts to expand the definition of national wealth led to thedevelopment of new measurement instruments which today form the basis of recent efforts inthis field.
188 Cobb et al., op. cit., Messinger, op. cit., Osberg, Lars, and Sharpe Andrew, 1998, An Index of EconomicWellbeing for Canada, paper presented at the Conference on the State of Living Standards and the Quality of Life inCanada, Centre for the Study of Living Standards, Ottawa. Messinger compares the MEW and the original GPI andreplicates the models for Canada. On the original GPI (Genuine Progress Indicator), see Cobb et al. op. cit. See alsoGPIAtlantic, Measuring Sustainable Development: Application of the Genuine Progress Index to Nova Scotia,January, 1998 and Project Profile, March, 2000. This and other GPI materials are available on the GPIAtlantic website: www.gpiatlantic.org.

GENUINE PROGRESS INDEX 99 Measuring Sustainable Development
At that time, in the early 1970s, the pioneers’ understanding of the potential importance of timeuse surveys, environmental quality indicators, and other measures, was not matched by theavailability of data in these fields. The early recognition of the importance of valuing naturalresources, for example, initiated the process of gathering data that did not exist at the time. Thework of Andrew Harvey and others in constructing the first standard time use surveys, thedevelopment of state of the environment reporting in the same era, and the emergence of otherimportant social indicator measurement tools, have now produced and made available the actualdatabases that make the Genuine Progress Index possible.
For the first time, 10 and 20-year time series for social and environmental indicators can actuallybe created. In short, the construction of an actual policy-relevant GPI at this time should not beseen as a “new” phenomenon, but as a natural evolution of earlier work in the field. The basicprinciple linking and integrating the components of these expanded accounts is the view of“sustainable development,” which reflects a concern (a) to live within the limits of the world’sand the community’s resources and (b) to ensure the long-term prosperity and wellbeing offuture generations.
Both inter-generational and intra-generational equity are cited as specific characteristics ofsustainability in the Brundtland Commission’s seminal definition of sustainable development:
“Sustainable development is development that meets the needs of the presentwithout compromising the ability of future generations to meet their ownneeds....But physical sustainability cannot be secured unless development policiespay attention to such considerations as changes in access to resources and in thedistribution of costs and benefits. Even the narrow notion of physicalsustainability implies a concern for social equity between generations, a concernthat must logically be extended to equity within each generation. ”189
Statistics Canada notes that, from this definition,
“A consensus has emerged that sustainable development refers at once toeconomic, social and environmental needs.... A clear social objective that falls outof the definition (of sustainable development) is that of equity, both amongmembers of the present generation and between the present and futuregenerations....It is clear that the spirit of sustainable development implies that allpeople have the right to a healthy, productive environment and the economic andsocial benefits that come with it.”190
The new accounts also use cost-benefit analysis that includes environmental and social benefitsand costs and an investment-oriented balance sheet approach that includes natural and socialcapital assets, to provide a more comprehensive view of progress than is possible with thecurrent-income approach of the GDP.
189 World Commission on Environment and Development (Brundtland Commission), 1987, Our Common Future,Oxford University Press, New York.190 Statistics Canada, 1997, Econnections: Linking the Environment and the Economy: Concepts, Sources andMethods of the Canadian System of Environmental and Resource Accounts, catalogue no. 16-505-GPE, Ottawa.

GENUINE PROGRESS INDEX 100 Measuring Sustainable Development
The current emphasis on “growth” is replaced, in the new accounting systems, by a concern with“development,” as defined by former World Bank economist, Herman Daly:
“Growth refers to the quantitative increase in the scale of the physical dimensionof the economy, the rate of flow of matter and energy through the economy andthe stock of human bodies and artifacts, while development refers to thequalitative improvement in the structure, design and composition of physicalstocks and flows, that result from greater knowledge, both of technique and ofpurpose.”191
Values, approach, methods and data sources in the Nova Scotia Genuine ProgressIndex
In essence, the fundamental approach of the Nova Scotia Genuine Progress Index is to assess theeconomic value of our social and environmental assets and to calculate their depreciation ordepletion as costs. Maintenance of these capital assets is seen as providing the basis foreconomic prosperity. As such, the Nova Scotia GPI is a step towards fuller cost accounting thanis possible by valuations of produced capital alone.
Value-based measures
Any index is ultimately normative, since it measures progress towards defined social goals. Allasset values can therefore be seen as measurable or quantifiable proxies for underlying non-market social values such as security, health, equity, and environmental quality.192 In the case ofthis particular component of the GPI, the normative value or goal that serves as the standard formeasuring genuine progress is clean air, which is itself a component of a wider goal – namely, areduction in human impact on the environment.
Despite the inclusiveness of the GPI approach, there is no question that it does represent afundamental challenge to current assumptions and practices. When the GDP and economicgrowth statistics are used to assess wellbeing and prosperity, more production, more spending,and more consumption are signs of progress. In short, “more” is always “better.” In the GPI, bycontrast, “less” is frequently “better.” Less crime, pollution, sickness, accidents, natural resourcedepletion, and fossil fuel combustion (the primary source of greenhouse gas emissions) areindicators of genuine progress from the GPI perspective, in marked contrast to the GDP, whichcounts increases in all these areas as contributions to prosperity.
191 Daly, H., 1994, “Operationalizing Sustainable Development by Investing in Natural Capital,” in Jansson, A.,Hammer, M, Folke C., and Costanza, R. (editors), Investing in Natural Capital: The Ecological EconomicsApproach to Sustainability, International Society for Ecological Economics, Island Press, Washington, D.C.192 For the Nova Scotia GPI, these norms are defined in Measuring Sustainable Development: What the GenuineProgress Index Can Do For Nova Scotia, pages 12-15: presentation to the Nova Scotia Government Inter-Departmental Consultation, March 3, 1998, World Trade and Convention Centre, Halifax. For more information, seethe GPIAtlantic web site at For more information on the background, purposes, indicators, policy applications, andmethodologies of the Nova Scotia GPI as a whole, please see the background documents on the GPIAtlantic website at www.gpiatlantic.org.

GENUINE PROGRESS INDEX 101 Measuring Sustainable Development
Although the materialist illusion that “more” is always “better” is still pervasive, the GPIapproach is actually common-sense economics that reflects universally shared social values. TheGPI quite simply counts crime, pollution, sickness, natural resource depletion, and greenhousegas emissions as costs rather than gains to the economy, with reductions signifying “savings” tosociety and improvements in long-term wellbeing.
It must be emphasized here that there is no escape from the normative basis of any measure ofprogress. When the GDP is used to assess wellbeing, it is not objective (as is generally assumed),but embodies the value that “more” production and “more” spending are always “better.” TheGPI accounting system also has an explicit value base. In this case, the normative values are thatless crime, less pollution, a stable climate, and a healthy environment are “better” for humanwellbeing than more crime, more pollution, climate instability, and a degraded environment.
GPIAtlantic feels confident, as a result of 18 months of extensive consultations in 1996-98, thatits core GPI indicators represent consensus values among Canadians beyond any partisan orideological viewpoint, and are not counter-intuitive to basic common sense. It is the unexaminedassumption that the GDP and economic growth measures are “neutral” and “objective” measuresof wellbeing, that allows their misuse for a purpose that the architects of national incomeaccounting never intended. Once examined closely, that false assumption quickly falls apart, andthe GPI values are seen as representing the common goals and shared objectives of Canadians.
One important caveat must be added here for the natural resource and environmental componentsof the GPI. Unlike some of the GPI social and economic components like crime and employmentwhere impacts are more immediately felt, the impacts and costs of natural resource depletion anddegradation can be subtle and long-term. This lack of immediacy frequently blunts policyinitiatives designed to support more sustainable economic practices. The inclusion ofenvironmental and resource accounts in the Genuine Progress Index therefore requires that wetranscend a narrow short-term perspective and comprehend our wellbeing in terms of impacts onour children, on future generations, and on other species.
The challenge to conventional thinking is particularly acute because our own prosperity maytemporarily increase by expanding our consumption of the world’s resources, just as our standardof living appeared to rise in the 1980s through an expansion of government spending and debt.Again, it takes some raising of awareness to understand that the costs and impacts of excessivecurrent consumption will be borne by our children and by future generations, whether throughdebt-induced service reductions, university tuition increases, climate change damage costs, ordepleted natural resources.
Because the connection between natural resource health and wellbeing therefore clearly requiresa longer-term perspective than some other components of the GPI, and because the immediacy ofour narrower conventional desires frequently inhibits that perspective and undermines effectivepolicy initiatives, a key purpose of this report is simply to raise awareness among ordinary NovaScotians.
If this province is to take a lead in acting responsibly to protect the world’s resources andenvironment and the interests of future generations, a concerted educational campaign will be

GENUINE PROGRESS INDEX 102 Measuring Sustainable Development
necessary for Nova Scotians to support actions which can become a model for the country andthe world. This report is intended primarily as a contribution to that educational effort.
Data sources and methodology
The Nova Scotia GPI uses existing data sources in its valuations and applies the most practicaland policy-relevant methodologies already developed by the World Resources Institute, theOECD, the World Bank, national statistical agencies, and other established research bodies. Inparticular, the Nova Scotia GPI relies on published data from Statistics Canada, EnvironmentCanada, the NS Department of Natural Resources (DNR), Department of Fisheries and Oceans(DFO), the Canadian Institute for Health Information (CIHI), and other government sourceswhere ever possible, to ensure accessibility and ease of replication by other jurisdictions.
Inevitably, the assessment of the environmental impacts of human economic and social activityis an imprecise science, and predicted long-term changes due to current consumption patterns areuncertain. When future impacts are uncertain but potentially damaging and even irreversible, theGenuine Progress Index follows the “precautionary principle.” This widely accepted dictum,enshrined in the Nova Scotia Environment Act and in Canada’s international commitments, holdsthat scientific uncertainty must not be a cause for inaction when there is the potential for seriousenvironmental damage.
The fundamental approach used in all GPI natural resource accounts is to value resources asnatural capital assets that perform a wide range of interconnected ecological, social, andeconomic functions, and provide both direct and indirect services to human society and theeconomy. These assets are also subject to depreciation, just as manufactured capital is, with twoimportant caveats. First, unlike manufactured capital, the services provided by renewable naturalcapital can be sustained over time, and there is therefore no inherent reason for forests, soils,fisheries, air quality, and water resources to depreciate if they are used responsibly. Secondly,again unlike manufactured capital, lost ecosystem services are frequently irreplaceable, as forexample when species become extinct. Nevertheless, it is completely appropriate to considerresource depletion and degradation as a depreciation of value from an economic point of view.
A primary goal of the Nova Scotia GPI is to provide a data bank that can contribute to the NovaScotia government’s existing outcome measures. The reports and data will therefore be presentedto Nova Scotia policy makers stressing the areas of policy relevance. Conclusions will emphasizethe most important data requirements needed to update and maintain the index over time. TheGPI full-cost accounting methods, that include social and environmental values, can also be usedto evaluate the impacts of alternative policy scenarios and particular investment strategies onoverall progress towards sustainable development in the province.
What the GPI is not
Just as the GDP has been misused as a measure of progress, there are also several potentialmisinterpretations of the GPI and misuses of the data it presents. These are discussed in more

GENUINE PROGRESS INDEX 103 Measuring Sustainable Development
detail within each of the separate modules. But it may be helpful to list some of the major issueshere.
First, the GPI is not intended to replace the GDP. The GDP will undoubtedly continue tofunction for the purpose for which it was intended, as a gross aggregate of final marketproduction. It is not, therefore, that the GDP itself is flawed. It is the misuse of the GDP as acomprehensive measure of overall progress that is being challenged, and it is this need that theGPI attempts to address.
Identifying omissions from our measures of progress does not imply that the GDP itself shouldbe changed to include these assets. The purpose of the GPI reports, therefore, is not to suggestthat unpaid work and non-market forest values, for example, should be included in the GDP, orthat the costs of crime, water and air pollution, and climate change damage be subtracted fromthe GDP. Nor do the GPI natural resource accounts and environmental quality valuationsrecommend the creation of a “green GDP”, or “net domestic product” which subtracts defensiveexpenditures on environmental protection. This can be done, but it is not the purpose of the GPI.
Rather than suggesting changes to the GDP, the GPI in effect adopts a qualitatively differentapproach. While the GDP is a current income statement, the GPI presents a balance sheet ofsocial, economic, and environmental assets and liabilities and reports the long-term flows ortrends that cause our assets to appreciate or decline in value. It is only our current obsession withshort-term GDP growth trends that is misplaced. The GPI seeks to “put the GDP in its place”rather than to abolish or change it. If the GDP is simply used for the purposes its architectsintended, then there is no problem with the GDP per se.
The authors of the original U.S. GPI suggested that misuse of the GDP is analogous to evaluatinga policeman’s performance by adding up the total quantity of street activity he observes, with nodistinction between dog walkers, car thefts, children playing, and assaults. Just as we expectmore of our policeman – the capacity to distinguish benefit from harm, for example, so we needa performance measurement capable of distinguishing the benefits and costs of economicactivity. To extend the metaphor, the GDP is still necessary, just as the quantity of street activityis still important in order to decide where to deploy the policeman most effectively. But oncedeployed, effective policing and effective policy can only be judged by qualitative criteria.
Second, the GPI assesses the economic value of social and environmental assets by imputingmarket values to the services provided by our stock of human, social, and environmental capital.But this imputation of market values is not an end in itself. It is a temporary measure, necessaryonly as long as financial structures, such as prices, taxes, and monetary incentives, continue toprovide the primary cues for the actual behaviour of businesses, consumers, and governments.
Monetization is only a tool to communicate with the world of conventional economics, not aview that reduces profound human, social, and environmental values to monetary terms. It is anecessary step, given the dominance of the materialist ethic, in order to overcome the tendencyto undervalue the services of unpaid labour, natural resources, and other “free” assets; to maketheir contribution to prosperity clearly visible; and to bring these social and environmental assetsmore fully into the policy arena. Monetization also serves to demonstrate the linkages and

GENUINE PROGRESS INDEX 104 Measuring Sustainable Development
connections between non-market and market factors, such as the reality that depletion of anatural resource will eventually produce an actual loss of value in the market economy. Butmonetary values should never be taken as a literal description of reality.
In order to separate ends from means, the first two GPI reports on the value of unpaid workpresented time use valuations first as the basis of the secondary and dependent, monetaryvaluations. In the third GPI report, on costs of crime, crime rates were presented first as the basisof the secondary, dependent monetary valuation of the costs of crime. Similarly, in the GPInatural resource and environmental accounts, physical accounts will always precede and formthe basis for the subsequent monetary accounts. Secondary (derived) monetary values are alwaysdependent on primary physical valuations and have no inherent reality in their own right. Theyshould always be understood as simple strategies to bring neglected physical realities onto thepolicy agenda.
As the grip of market statistics on the policy arena is gradually loosened, the desired direction forthe GPI is to return to the direct use of time, environmental quality, and social indicators indecision making. This will also allow for greater accuracy and precision than relying onderivative economic values. For this reason, an ecological footprint analysis is also included inthe Nova Scotia GPI, even though it is the one component of the index in which no attempt atmonetization is made. The use of land values is actually a far more direct method of assessingenvironmental impacts than the use of monetary values.
While the assignment of monetary values to non-market assets may appear absurd and evenobjectionable, society does accept court awards for grief and suffering and insurance companypremiums on life and limbs as necessary measures to compensate actual human losses. We payhigher rents for dwellings with aesthetically pleasing views and we sell our time, labour, andintelligence often to the highest bidder. Similarly, in a world where “everything has its price,”monetizing social and environmental variables assigns them greater value in the policy arena andprovides a more accurate measure of progress than excluding them from our central wealthaccounts. For that reason, and to draw attention to vital assets that would otherwise remainhidden, these air quality accounts and other GPI components do use monetary values whereverpossible.
Ultimately, however, it must be acknowledged that money is a poor tool for assessing the non-timber values of a forest, the costs of pollution or climate change, the value of caring work, thequality of education, or the fear, pain and suffering of a crime victim. A materialist criterioncannot adequately assign value to the non-material values that give life meaning.
Eventually, therefore, the Genuine Progress Index itself should give way to multi-dimensionalpolicy analysis across a number of databases. New Zealand economist Marilyn Waring suggestsa central triad of indicators – time use studies, qualitative environmental assessments, and marketstatistics – as a comprehensive basis for assessing wellbeing and progress.193
193 Waring, Marilyn, 1998, “Women, Work and Wellbeing: A Global Perspective,” address delivered at KingsCollege, Halifax, Nova Scotia, 30 April, 1998.

GENUINE PROGRESS INDEX 105 Measuring Sustainable Development
In the meantime and only so long as market statistics dominate our economic thinking and ourpolicy and planning processes, the GPI can provide a useful tool for communication between themarket and non-market sectors. By pointing to important linkages between the sectors, the GPIitself can provide a means to move beyond monetary assessments towards a more inclusive andintegrated policy and planning framework.
Third, the Genuine Progress Index is not designed to be a final product, but it is a significant stepin the direction of more comprehensive measures of progress than are currently in use. The GPIitself should be seen as a work in progress subject to continuous revision, improvement inmethodologies, and inclusion of additional variables. It will continue to evolve in form andcontent with further research, the development of new methods of measurement, and theavailability of improved data sources. Given these caveats, all interpretations and viewpointsexpressed in this and other reports are designed to raise important issues for debate anddiscussion rather than as definitive or final conclusions or prescriptions.
For example, the GPI researchers have wrestled long and hard with definitions of “defensiveexpenditures” and the degree to which these might be interpreted in measures of progress,negatively as surrogate values for damage incurred or alternatively as positive investments inenvironmental restoration. In other words, are more defensive expenditures are sign of progressor not? Or do the indicators of genuine progress themselves need to be based squarely on thephysical indicators themselves, and separated entirely from the secondary economic valuations?
High expenditures on restorative forestry are, for example, both a cost of prior excess andneglect, and a positive sign that concerted efforts are being made to take necessary action. Forthis reason the actual quantity of defensive expenditures is not easily interpreted as a measure ofprogress and it is preferable to base such assessments and annual benchmarks on the corephysical indicators which are the basis for subsequent economic cost-benefit analyses.
Similarly, much more work needs to be done on separating resource stock accounts from flowdata like harvesting rates, and on distinguishing relative progress towards greater sustainability,which refers to changes in human activity, from a more absolute standard of sustainability basedon nature’s own balance and capacity to support human activity. For example, attainment of theinternationally agreed Kyoto targets, a sure sign of relative progress, will not prevent the furtheratmospheric accumulation of greenhouse gases or the acceleration of global climate change. Themore absolute standards require difficult assessments of sustainability thresholds and ecosystem“carrying capacity.” Rees and Wackernagel have made that leap towards assessments of globalcarrying capacity in constructing the ecological footprint paradigm. But they admit that theiranalysis does not include several key elements, including the sustainability of current harvestingmethods.
Rather than offering any pretence of definitive answer to these challenging questions,GPIAtlantic hopes that its natural resource and environmental quality accounts stimulate furtherproductive debate among researchers that will allow for every greater clarity and accuracy infuture updates of the GPI work. In sum, GPIAtlantic is not wedded to any particular method ofmeasurement or to any final assessment of results, but seeks to improve both its accounting

GENUINE PROGRESS INDEX 106 Measuring Sustainable Development
methodologies and the accuracy of its results over time in accord with the constructive feedbackits work receives.
Fourth and finally, it must be stated that the economic valuations are not precise. Any attempt tomove beyond simple quantitative market statistics to the valuation of goods and services that arenot exchanged for money in the market economy will produce considerable uncertainty. In theGPI report on the economic value of unpaid household work, for example, six different valuationmethods were compared, each producing different aggregates. In the GPI Cost of Crime report, arange of cost estimates was presented from the most conservative measurements to morecomprehensive estimates that included costs of unreported crimes; retail “shrinkage;” losses ofunpaid production; and suffering of crime victims. The GPI Greenhouse Gas Accounts and thecost-benefit case study in the GPI Water Quality Accounts similarly presented a range of valuesbased both on different discount rates and on high and low-end estimates of projected changes inclimate, tourism, property values, and a wide range of other variables.
This problem of precision is particularly acute in the natural resource accounts, with attempts toplace an economic value on ecological services and the non-market functions of natural assets.For example, there is no doubt that water bodies, wetlands, and forest watersheds provide vitallyimportant functions to human society, including waste and nutrient cycling; erosion, flood andstorm control; recreation; water filtration and purification; and food production; and that thesefunctions have vital economic value. But these functions have so long been accepted as “free,”that any diminution of functional capacity has gone unrecorded in standard accountingprocedures that track only market transactions in which money is exchanged.
How then, are such functions to be valued? Clearly a reduced natural nutrient or waste cyclingcapacity in a water body as a result of nutrient or waste overload, will have to be replaced bywaste treatment upgrades that compensate for the loss of “free” ecological services, if waterquality is to be maintained. In its Water Quality Accounts, for example, GPIAtlantic used thecapital costs of engineering upgrades as a surrogate value for the cost of lost nutrient cyclingcapacity. But should the operating costs of the replacement facility also be included? Thesedifficulties are vastly accentuated in the GPI Forest Accounts, for example, in estimating thepotential climate change damage costs from a loss of forest carbon sequestration capacity,because of the great difficulty in estimating the local impacts of global trends and global impactsof local forest practices.
Throughout the GPI environmental and resource accounts, there are many such difficultvaluation challenges, and the GPI valuations are based on the author’s best understanding of theavailable scientific and economic assessments. These few examples demonstrate that anyeconomic assessment of natural resource values, or costs of natural capital depreciation, cannotpretend to be precise.
What the GPI Can Contribute
Despite all these major qualifications, it is important not to throw the baby out with the bathwater! The GPI is in its earliest stages of development, but it is still considerably more accurateto assign explicit economic value to unpaid production, natural capital, and other social and
GENUINE PROGRESS INDEX 107 Measuring Sustainable Development
environmental assets than to assign them an arbitrary value of zero, as is currently the case in ourconventional economic accounting system. And it is far more precise to recognize naturalresource depletion, and crime, sickness and pollution costs as economic liabilities rather than tocount them as contributions to a more “robust” economy and to social progress, as is presentlydone.
Though the potential environmental impacts of current consumption practices are extraordinarilydifficult to estimate, and though the web of cause-effect relationships is infinitely complex, itwould be utterly foolhardy to deny the reality of these relationships or to pretend that costs willnot be incurred. While it is very important to improve on the precision and methodologies ofnatural resource accounting and of social and environmental valuations, the current lack ofprecision should not be taken as an excuse for any delay in incorporating these mechanisms intoour accounting systems. Efforts to value social and environmental assets, using the best availablemethodologies and data sources, still provide far greater accuracy and precision than continuedreliance on an accounting system and measure of progress that gives no value to these assets andcounts their depletion as gain.
In the long run, the GPI is intended as one step towards greater “full-cost accounting” both in ourcore national and provincial accounts and as the basis for taxation and financial policy that willultimately enable market prices themselves to reflect the full values and costs of embodiedresources. The transition from externalized to internalized costs, from non-market to marketvaluations, and from fixed to variable pricing mechanisms are the three core principles of full-cost accounting.
For example, the inclusion of climate change and air pollution costs in gasoline, energy, and roadpricing can be far more effective in encouraging resource conservation than taxation systemsbased entirely on income rather than resource usage. Similarly, very high market pricing of old-growth lumber would reflect the wide range of valuable services provided by ancient forests andencourage their preservation. Incorporation of natural resource valuations into our core economicaccounts is, therefore, the first essential step in improving the efficiency of market mechanisms,so that they reflect the full range of social, economic, and environmental benefits and costs ofboth production and consumption processes.
The Nova Scotia Genuine Progress Index is not an isolated effort, but part of a global movementto overcome the recognized flaws in our current measures of progress and to ensure a moresustainable future for our children and for the planet. Indeed, as we have seen, the new System ofNational Accounts, Canada’s own international commitments, and the considerable advances ofrecent years in developing expanded measures of progress, require that further efforts be made tointegrate social, economic, and environmental variables into our accounting mechanisms. Thecosts of continuing to ignore our social and environmental assets are too great. We have learnedthe hard way that measuring our progress in strictly materialist terms and without reference toour natural environment, which is the source of all life and of human survival, ultimatelyundermines wellbeing and prosperity.
In sum and with all its limitations, the GPI is a substantial step towards measuring sustainabledevelopment more precisely than prevailing accounts are able to do. It is itself a work in progressdesigned to help lay the foundations for the new economy of the 21st century, and economy thatwill genuinely reflect the social, spiritual, environmental, and human values of our society.

GENUINE PROGRESS INDEX 108 Measuring Sustainable Development
APPENDIX BTHE NOVA SCOTIA GENUINE PROGRESS INDEX:
LIST OF COMPONENTS
Time Use:* Economic Value of Civic and Voluntary Work* Economic Value of Unpaid Housework and Childcare* Costs of Underemployment* Value of Leisure Time
Natural Capital:* Soils and Agriculture* Forests* Marine Environment/Fisheries* Nonrenewable Subsoil Assets
Environment:* Greenhouse Gas Emissions* Sustainable Transportation* Ecological Footprint Analysis* Air Quality* Water Quality* Solid Waste
Socioeconomic:* Income Distribution* Debt, External Borrowing and Capital Movements* Valuations of Durability* Composite Livelihood Security Index
Social Capital:* Health Care* Educational Attainment* Costs of Crime* Human Freedom Index
GENUINE PROGRESS INDEX 109 Measuring Sustainable Development
APPENDIX CFOOD FOOTPRINT & HEALTH
As noted in Chapter 18, Canadians are overeating. This appendix explores the connectionsbetween food footprint, health, and the genuine progress index. Overeating and eating too muchof the wrong kinds of food contribute to a higher food footprint, and are contributing causes toobesity and to a wide range of illnesses. Numerous studies have linked overweight and obesity toa wide range of health problems, especially cardiovascular disease, diabetes, hypertension, andsome forms of cancer.194
The American Cancer Society conducted the most comprehensive study ever done on obesityand mortality. Examining one million people, the study found that overweight people have ahigher rate of premature death even if they don’t smoke and are otherwise healthy. The resultswere adjusted for age, education, physical activity, alcohol use, marital status, use of aspirin andestrogen supplements, and consumption of fats and vegetables. Harvard Universityendocrinologist, Dr. JoAnn Manson, concludes:
“The evidence is now compelling and irrefutable. Obesity is probably the second-leading preventable cause of death in the United States after cigarette smoking, soit is a very serious problem.”195
In 1997 the World Health Organization for the first time referred to obesity as a “globalepidemic.”196 According to one estimate, obesity has increased by 400% in the western world inthe last 50 years.197 Given the close association between obesity and adult-onset diabetes, it isnot surprising that the global population with this illness has jumped nearly five-fold from 30million in 1985 to 143 million in 1998. The average age of diabetics is getting younger, and theglobal incidence of the disease is expected to double to 300 million by the year 2025.198
A Statistics Canada analysis of the 1996-97 National Population Health Survey data found thatCanadians with a body mass index (BMI)199 of greater than 30 were four times as likely to have 194 Health Canada (1999). Statistical Report on the Health of Canadians. Health Canada, Ottawa, p. 264.195 Cited in the Halifax Chronicle-Herald, October 9, 1999, page C1.196 World Health Organization (1997). Obesity: Preventing and Managing the Global Epidemic, Report of a WHOConsultation on Obesity, Geneva.197 Montignac, Michel, in The Halifax Chronicle-Herald, March 28, 2000, page A10.198 Gardner, Gary, and Brian Halweil (2000). “Nourishing the Underfed and Overfed,” Chapter 4 in WorldwatchInstitute, State of the World 2000, W.W. Norton and Co., New York, p. 72.199 “Body Mass Index” (BMI) has become an internationally accepted indicator of relative weight. According toStatistics Canada, “[b]ody mass index (BMI) - Canadian standard, which relates weight to height, is a commonmethod of determining if an individual’s weight is in a healthy range based on their height. BMI is calculated asfollows: weight in kilograms divided by height in metres squared. The index is: under 20 (underweight), 20-24.9(acceptable weight), 25-27.0 (some excess weight) and greater than 27 (overweight). The index is calculated forthose aged 20 to 64 excluding pregnant women and persons less than 3 feet (0.914 metres) tall or greater than 6 feet11 inches (2.108 metres).” According to this measure, a BMI of 20 to 24.9 means that this weight to height ratioconfers no known health risk or likelihood of premature death. A BMI in this range translates into about 140 to 170

GENUINE PROGRESS INDEX 110 Measuring Sustainable Development
diabetes, 3.3 times as likely to have high blood pressure, 2.6 times as likely to report urinaryincontinence, 56% more likely to have heart disease, and 50% less likely to rate their healthpositively than Canadians with an acceptable weight. Even at a lower BMI, between 25 and 30,Canadians had a significantly higher risk of asthma, arthritis, back problems, high bloodpressure, stroke, diabetes, thyroid problems, activity limitations, and repetitive strain injuries.200
Across the country, and in Atlantic Canada, women are more likely to have an “acceptableweight” (BMI = 20-24.9) than men, with 46% of women and 40% of men in that range. All fourAtlantic provinces have substantially higher rates of overweight (BMI ≥ 27) than the Canadianaverage, with Newfoundland and Labrador registering the highest rates of overweight for bothmen and women. Counting men and women together, 43% of Newfoundlanders are overweight,as are 38% of Prince Edward Islanders, 39% of Nova Scotians and New Brunswickers, and 32%of Canadians (Figure 25, Chapter 13 and Table 24 below).
Without any exception, there is a higher proportion of overweight men and women in every oneof the 21 health districts in Atlantic Canada than the Canadian average (36.1% of men; 27.5% ofwomen.) Rural PEI has markedly higher rates of overweight (47.5% of men, 36.2% of women)than urban PEI (38.7% of men, 29.8% of women) (Figure 32).
Poor nutrition is an important contributing factor to obesity, which in turn is a major risk factorin hypertension, type 2 diabetes, coronary artery disease, gallbladder disease, stroke,hyperlipidemia, pulmonary embolism, colorectal cancer, endometrial cancer, andpostmenopausal breast cancer.201 In addition, unhealthy eating is a risk factor in its own right formany chronic illnesses. Health Canada estimates that the Canadian economy loses $6.3 billion ayear to preventable diet-related disease.202
pounds for a 5-foot-10-inch man; and about 105 to 135 pounds for a 5-foot-2-inch woman. Beginning with a BMI of25 (which is about 150 pounds for a 5-foot-5 woman and 174 pounds for a 5-foot-10 man), researchers have found agradually increasing risk of premature death and disease. Health Canada’s Statistical Report on the Health ofCanadians defines a BMI of between 25.0 and 26.9 as conferring a “possible health risk,” and a BMI of 27.0 orgreater as conferring a “probable health risk.” (Sources: Statistics Canada,http://www.statcan.ca/english/freepub/82-221-XIE/00502/defin1.htm#3; American Cancer Society report publishedin New England Journal of Medicine, October, 1999, and cited in the Halifax Chronicle-Herald, October 9, 1999,page C1, based on longitudinal research on participants in the U.S. national Cancer Prevention Study from 1982 to1996; and Health Canada, 1999 (see footnote 121 above).200 Gilmore, Jason (1999). “Body Mass Index and Health,” Health Reports, Statistics Canada, catalogue no. 82-003,11 (1), Summer, 1999, pp. 31-43.201 Birmingham, C. L., et al. (1999). “The Cost of Obesity in Canada.” Canadian Medical Association Journal, 23.202 Health Canada (2000). “Nutrition Labelling: The Background.” Available at http://www.hc-sc.gc.ca/english/archives/releases/2000/2000_103e.htm and follow the link to “Nutrition Labelling: Support forHealthy Eating”; for U.S. estimates of costs of diet-related diseases, see “Benefits of Nutrition Services – A Costand Marketing Approach,” Ross Laboratories Report of the Seventh Ross Roundtable on Medical Issues, August 18-19, 1986: 2-9, cited in Province of British Columbia (1996), Cost Effectiveness/Value of Nutrition Services: AnAnnotated Bibliography, Prevention and Health Promotion Branch, Ministry of Health, B.C., July, 1996, page 39.

GENUINE PROGRESS INDEX 111 Measuring Sustainable Development
Table 24. Percentage of Overweight Canadians, Canada and Provinces, 2000/01
Percentage Overweight(Body Mass Index higher than 27.0)
both male femaleNewfoundland and Labrador 42.8 47.9 37.7Prince Edward Island 38.3 43.4 33.1Nova Scotia 38.9 44.1 33.8New Brunswick 39.2 41.5 36.8Quebec 29.0 32.9 25.0Ontario 32.6 36.9 28.2Manitoba 35.7 40.1 31.2Saskatchewan 39.1 45.3 32.7Alberta 33.0 37.8 27.8British Columbia 27.0 30.8 23.1Canada 31.9 36.1 27.5
Source: Statistics Canada, Canadian Community Health Survey, 2000/01, Health File. Available at:http://www.statcan.ca/english/freepub/82-221-XIE/01002/toc.htm.
Figure 32. Body mass index, Canada, Prince Edward Island, and Prince Edward IslandHealth Districts, 2000/01
Note: Individuals aged 20 to 64, excluding pregnant women.
Source: Statistics Canada, Canadian Community Health Survey, 2000/01, Health File. Available at:http://www.statcan.ca/english/freepub/82-221-XIE/01002/toc.htm.

GENUINE PROGRESS INDEX 112 Measuring Sustainable Development
‘Rich’ diets, high in calories, cholesterol, saturated and total fats, and salt, and low in fibre, havebeen identified by analysts as “the primary and essential cause of epidemic CHD [coronary heartdisease]:”
“Rich diet is the pivotal mass exposure responsible for the coronary epidemic.Where rich diet does not prevail as a population wide trait, there is no CHDepidemic. This is the case even when high blood pressure and cigarette smokingare prevalent (witness Japan).”203
Rich diets include an excessive proportion of foods with a high ratio of calories to essentialnutrients, including high-fat animal products, dairy products, processed foods includingprocessed meats, junk food, and foods with high proportion of refined sugars, including manybaked goods. These foods are also frequently low in essential constituents such as potassium,fibre, and anti-oxidant vitamins.
Recommended dietary shifts include:
• reducing saturated fat and total fat consumption, as well as dietary cholesterol intakefrom animal products such as high-fat meat, dairy, and egg yolks;
• eating more complex carbohydrates and high fibre foods like whole grains, cereals, fruitsand vegetables; and
• reducing consumption of sodium, caffeine, alcohol, sugar, and highly processed foods.
One indicator of dietary practices is included here – fruit and vegetable consumption – due todata availability in Statistics Canada’s Canadian Community Health Survey. Preventive healthliterature and nutrition guides generally recommend that between five and ten servings of fruitand vegetables be consumed daily.204 While fruit and vegetable consumption is clearly only oneaspect of good nutrition, it serves here as a temporary proxy for healthy eating, with therecognition that further development of nutrition indicators is essential.
Most Canadians do not comply with the recommendation to consume between five and tenservings of fruits and vegetables daily. Across the country, women generally consume morefruits and vegetables than men. But more than two-thirds of Canadian men, and 57% ofCanadian women do not meet the recommended requirement.
Atlantic Canadians generally eat fewer fruits and vegetables than other Canadians, with less thanone-third eating enough fruits and vegetables for good health. Nearly three-quarters of Atlanticregion men eat insufficient fruits and vegetables for good health. Prince Edward Islanders eatsomewhat more fruits and vegetables than other Atlantic Canadians, and Newfoundlanders eatthe least, but all four Atlantic provinces rank below the national average for adequate fruit andvegetable consumption (Figure 33).
203 Stamler, Jeremiah and Rose, preface to Ockene, Ira, and Judith Ockene, Prevention of Coronary Heart Disease,Little, Brown and Company, Boston, 1992, pages xi and xii.204 Health Canada, http://www.hc-sc.gc.ca/hpfb-dgpsa/onpp-bppn/food_guide_rainbow_e.html

GENUINE PROGRESS INDEX 113 Measuring Sustainable Development
Figure 33. Consumption of Fruits and Vegetables, Canada and Provinces, 2000/01 (%)
Note: Consumption of fruits and vegetables is calculated for household population aged 12 and over.
Source: Statistics Canada, Canadian Community Health Survey, 2000/01, Health File. Available at:http://www.statcan.ca/english/freepub/82-221-XIE/01002/toc.htm.
Figure 34. Consumption of Fruits and Vegetables, Canada, Prince Edward Island, andPrince Edward Island Health Districts, 2000/01 (%)
Note: Consumption of fruits and vegetables is calculated for household population aged 12 and over.
Source: Statistics Canada, Canadian Community Health Survey, 2000/01, Health File. Available at:http://www.statcan.ca/english/freepub/82-221-XIE/01002/toc.htm.
GENUINE PROGRESS INDEX 114 Measuring Sustainable Development
In every one of the 21 Atlantic region health districts, women eat more fruits and vegetables thanmen. But there are some significant variations among women in the different health districts. Forexample, women in farming districts like rural PEI tend to eat somewhat more fruits andvegetables than their counterparts in other parts of Atlantic Canada. Fewer women in urban PEIconsume vegetables 5 to 10 times daily (33%) compared to rural PEI (39%) (Figure 34).
If we stop overeating, and eat less food that are is harmful to our health, we can not onlyreduce our food footprint substantially, but contribute to our health and wellbeing asindividuals and as a society. We can also save millions of dollars annually in taxpayer-funded health care costs. Unlike measures of progress based on the GDP in which “more”is always “better,” this is one example where “less” is clearly “better.”