the problem with government debt
TRANSCRIPT

COMMODITY &CURRENCY COMMENTS------ k M -------
Friedberg Commodity Management Inc. Volume 14, No. 1 January 24,1993
- B E R G
The problem with government debtRationally, interest and principal payments on the public
debt equate to an equivalent future tax liability. Therefore, it matters little whether the government taxes or borrows. This elegant proposition, named the Ricardian Equivalence Theorem (after the classical 19th century economist who first postulated it), is beginning to break down in the late 20th century.
How so?In the first place, there has been an important shortening
of the consumer’s economic horizon. A consumer who cares little about mounting credit card charges and the inevitable day of reckoning is unlikely to calculate the present value of imprecisely timed future taxes and the repayment of public debt, especially if it appears to be deferred well into the next generation. And so, if future tax liability can be pushed out of mind, government debt represents new net wealth. This nominal wealth is equal in all respects to currency, except that it pays interest.
But there is even a stronger argument for rejecting the Equivalence Theorem. To wit, as W. Michael Cox argues in “What is the Rule for Financing Public Debt” (Economic Review, Federal Reserve Bank of Dallas, September 1984) and “Inflation and Permanent Government Debt” (Economic Review, Federal Reserve Bank of Dallas, May 1985), public debt that is merely rolled over and whose interest charges are financed via more debt issuance cannot be deemed to be “backed” by future tax liabilities. The Equivalence Theorem may be valid for temporary debt, debt that is expected to be paid off in the not-too-distant-future via taxes, but it breaks down when dealing with permanent debt.
How is one to determine the degree of “backing” of a nation’s public debt? Simply by looking at the fraction of the fiscal deficit relative to interest outlays. If the fiscal deficit exceeds interest outlays (i.e., the ratio exceeds 1.0), the public debt is being “serviced” by more debt rather than by taxes. Conversely, to the extent that the fiscal deficit is smaller than interest outlays (i.e., the ratio is less than 1.0), some proportion of the public debt is said to be backed by taxes. Sharp increases in taxes to cover expected deficits announced routinely at budget time may serve as a reminder that, at least partially, the Equivalence Theorem is valid.
Our discussion is not merely theoretical: On the validity or lack thereof of the Ricardian Equivalence Theorem hangs
the health of many deficit-ridden developed and undeveloped economies of the world.
Canada is one of them. Chart 1 presents a comparison since 1973 of annual interest outlays on the public debt and the federal deficit. The overall ratio since 1973 exceeds 1.0, that is, the accumulated federal deficits exceeded the accumulated federal interest outlays. Only in the past seven years, aided by massive tax increases (the introduction of the GST among them), has the ratio fallen (very slightly) below 1.0.
By implication, the federal government has signalled that somehow, outlays on the public debt will be financed by taxes. Has the public accepted this implication? Given the pitifully small size of the improvement (note that the ratio over the past six months stands at 0.97), we doubt it.
In this issue
2 CanadaOntario: from chaos to catastrophe
4 Interest ratesClintonomics vs. the Fed
6 US Dollar Illusory strength
6 DeutschemarkGetting ready to go long
7 Japanese YenReliquification is the only way out
8 British PoundLight pounds are good for equities
8 French Franc Remain short
9 S&P 500The bull’s last gasp?Crude Oil Oil, oil everywhere Commodities Cocoa, sugar, com, silver
n Friedberg Capital MarketsA high-yield precious metals play
Contributions by Albert D. Friedberg, Neil Reynolds, Dr. Steve H. Hanke, David B. Rothberg, Michael D. Hart.
Futures and options trading is speculative and involes risk o f loss. Past trading results are not indicative o f future profits.
©1993 by Friedberg Commodity Management Inc. Reproduction in whole or in part prohibited.

FRIEDBERG’S
But if it ever came to believe that, indeed, an important portion of the public debt is backed by further taxes (perhaps that portion that will guarantee that the stock of public debt begins to recede, if ever so slightly, as a percentage of GDP), the effect on economic activity would be devastating.
With outstanding federal and provincial debt rising to $580 billion, 80% to 85% of GDP, even a small shift in expectation away from nil backed debt to 20% backing would have the same effect as a tax increase equal to 16% to 17% of GDP. It should be noted that the actual, immediate tax increase (or spending cutback) need not be that large: If the signal is strong enough, expectations will follow. Given the enormous size of the Canadian (and US) debt, we hypothesize that this phenomenon may account for the sluggishness in consumer spending.
The partial or total rejection of the Equivalence Theorem carries, on the other hand, the seeds of inflation. In effect, if public debt is viewed as being unbacked, then it is similar to currency in all respects, except that it is interest bearing.
Since the growth of money supply affects prices, a proposition well accepted by the monetarist Bank of Canada, it follows that the growth of unbacked federal debt will also affect prices. But even our well-meaning Central Bank seeks only to control the monetary base, not the stock of public debt.
At $580 billion, the stock of public debt is almost twice the broad money supply (M2). The Bank may appear to be tight by keeping M2 growth below 6% per annum, but what good will that do, in the long run, if unbacked debt begins to be perceived as nominal wealth, i.e., money? (Possibly, the cross-over to pure money can be kept at bay by continuously raising the interest paid on the debt, thus making it appear as if real interest rates are inordinately high, when in fact they merely represent a larger premium for future inflation — the size of the unbacked public debt affecting first the nominal rate of interest via expectations of future inflation rather than the current rate of inflation itself).
To sum it up, the monstrous growth of public debt in Canada, has begun to affect economic activity and the level of long-term interest rates. It will inevitably also affect the future rate of inflation. The final outcome will depend on the degree to which the public believes that government debt will be serviced out of future taxes; if high, the result will inevitably be a substantial fall in our standard of living. Contrariwise, inflation will accelerate beyond the reach of the Central Bank until it reaches a new equilibrium (and/or interest rates will soar).
Either way, we lose.
Chart 1Annual Interest Outlays and the Federal Deficit
<A> <B) <C>
INTEREST ON BUDGETARY <B)/<A)DATE PUBLIC DEBT DEFICIT
1973 <2,518) <10) 0.001974 <2,961) <435) 0. 151975 <3,705) <4,832) 1.301976 <4,519) <5,047) 1. 121977 <5,101) <8,299) 1.631978 <6,410) < 12,994) 2.031979 <8,080) <11,504) 1.421980 <9,897) <12,512) 1.261981 <13,739) <11,373) 0.831982 <16,675) <22,285) 1.341983 <17,412) <28,909) 1.661984 <21,320) <35,077) 1.651985 <24,620) <36,290) 1.471986 <26,107) <27,869) 1.071987 <27,801) <24,548) 0.881988 <31,688) <24,341) 0.771989 <37,357) <25,338) 0.681990 <41,543) <24,090) 0.581991 <41,815) <35,517) 0.85
1992*** <19,380) <18,879) 0.97
FROM 1973 FROM 1984 FROM 1987TO 1991 TO 1991 TO 1991
AVERAGE OF BUDGETARY DEFICIT TO INTEREST PAYMENT 1.09 0.99 0.75
m x * APRIL 1992 TO SEPTEMBER 1992
CANADA
Ontario: from chaos to catastropheIt’s kremlinesque. Established a decade before the Rus
sian Revolution to protect Ontario from greedy profiteers and to ensure low-cost “power to the people,” Ontario Hydro is now a bloated, bureaucratic, and bankrupt state-owned enterprise that blocks Ontario’s advance toward a market-disciplined economy.
The comparison is odious but not extravagant. Ontario Hydro is a Crown corporation with more debt than assets, with the best-paid apparatchiks in the country, and with an intense antipathy to the markets. As though it wanted to extend the similarity, it has now conducted an extraordinary purge of its emergent, dynamic, private-sector competitors. In a single stroke on Dec. 14, invoking its authority as a monopoly sup
plier of electricity, Ontario Hydro peremptorily forbade 64 market-driven power projects, all negotiated in partnership with Hydro, from proceeding.
Call it the Black December massacre. Call it the Nuking of the NUGs. Call it Socialist Realism. For the decision to kill off the province’s NUGs (non-utility generators) was made by Ontario’s socialist premier, Bob Rae, and his handpicked Hydro chairman, Maurice Strong. The announcement came only two weeks after Mr. Strong had assumed office. Although his own cabinet was deeply divided and his Ministry of Energy hesitant, Mr. Rae personally authorized the purge in a private, face-to-face chat with Hydro’s new Strongman.
What’s relevant here for the markets?
2 ©1993 by Friedberg Commodity Management Inc. Reproduction in whole or in part prohibited. January 24,1993

FRIEDBERG’S
1. Ontario Hydro is Ontario. Hydro’s repudiation of the market is no renegade act. Once an autonomous agency, Hydro is now firmly under the control of the reactionary and inept government that runs Canada’s largest province. Hydro’s statist stance is Ontario’s statist stance; Hydro’s antipathy to the market is Ontario’s antipathy to the market. Anyone who thinks this environment warrants their investment will love Uzbek.
2. Hydro’s action denies cost savings to thousands of companies, municipalities, and public institutions desperate for them. (NUG cogeneration plants can cut electricity costs from 20% to 40%.) For energy-intensive corporations most vulnerable to international competition, the impact will be lethal. For many of these enterprises, denial of savings equals denial of survival. In the past two years, Ontario has taken its worst recessionary hit in 50 years; it has lost 250,000 jobs; it has lost hundreds of manufacturing plants. Hydro’s purge prohibits more than $2 billion in immediate, committed investment
In 1993, with the recession technically past, watch for a record number of companies to exit the province, either in coffins or moving vans.
3. Hydro’s decision to “go it alone” will impose substantial new debt on the corporation itself and on the province. Hydro’s policy choice was simple. Nukes or NUGs. To preserve its monopoly for another decade, Hydro must undertake the $3 billion refit of a rundown nuclear plant, a project in which investment will exceed asset value by more than 30%.
It must borrow $3 billion in public debt for a single nuclear plant refit to kill off $2 billion in private investment that would yield the same amount of electricity. In an emergency “restraint” program, Mr. Strong has reduced Hydro’s capital spending needs by $1 billion a year; it will still require more than $3 billion a year in new debt, a 10% annual increase in Hydro’s $36 billion present debt obligations.
4. In clinging to the past (defined by monopoly and megaprojects), Hydro has paradoxically taken a decisive step into the future — toward bankruptcy. Why? By law, Hydro’s rates are dictated by its debt; its rates must cover all of its costs, including all of its debt obligations. In the past two years, Hydro has scraped through, declaring an annual “profit” only by raiding its emergency reserves. (By taking $457 million from its reserves, it has reported “profits” of $333 million.) Only by extravagantly goosing its rates (30% in three years) has Hydro survived the recession and its coincidental loss of customers, sales, and revenues.
However: In mid-summer 1992, the Rae government assumed direct control of Ontario Hydro through Bill 118, a collection of amendments to the Power Corporation Act that enabled Queen’s Park to stack Hydro’s board that authorized the Ministry of Energy to rule Hydro through binding “policy directives.” Among the provinces first instructions to Hydro was an edict that future rates not exceed the rate of inflation. Whatever the consequences, the government had to stop the rate spiral; major Ontario electrical consumers (Falconbridge, Dofasco, etc.) had equated their survival with price stability.
Yet even with projected 8% increases in rates, Hydro has
anticipated that it would be hard pressed to meet its interest payments ($3.2 billion a year on $36 billion in debt). In fact, it anticipated that its revenues for 1993 would be only 1.1 times its interest payments, a minuscule margin for error; and especially minuscule in an environment of cost-conscious energy conservation.
Here, then, are the relevant factors. Hydro’s debt is a fixed cost; any change in its debt load will now be upward. In response to soaring rates, electricity consumption is down, and could fall further. Yet Hydro must reduce its rate increases to 2%. The corporation is only theoretically solvent now. Ergo, Hydro’s bankruptcy is inevitable and, perhaps, imminent. And, as predictable as it is, Hydro’s bankruptcy must set off an investor scramble for the exits. In the ensuing rush, Ontario’s debt will look very much like Hydro’s debt.
Because Hydro debt is guaranteed by Ontario, the money markets have tolerated Hydro’s acquisition of unproductive debt with good grace. In 1992, though, the risk spread between Hydro bonds and Government of Canada bonds moved erratically higher — from 70 basis points to 95 basis points — and then narrowed. It was the first nervous tick. The only question is: Will Hydro’s bankruptcy be a progressive series of ticks or a convulsion?
Hydro’s vulnerability, ironically, renders it apparently inv incib le . H ydro’s apparatchiks ro u tin e ly use the corporation’s financial crisis to blackmail cabinet ministers and senior civil servants who dissent from their own self- preservation agenda. Thus we find, in the midst of the crisis and before alternative policy approaches are considered, the decision to buttress Hydro’s monopoly as a power supplier. For Hydro’s bankruptcy can be either a Big Bang bankruptcy or a Black Hole bankruptcy. A Big Bang would be politically and economically disastrous for the province; it could be triggered at any time; and it could be triggered very easily.
W ith its monopoly status now assured, H ydro’s bankruptcy proceedings, however, will presumably be handled discreetly — perhaps through the “sale” of Hydro “assets” to another off-budget Crown corporation. Within weeks of its purge of the private sector, Hydro’s Mr. Strong was talking publicly of a transfer of Hydro debt to the province. And the government has already moved to establish three such off- budget agencies as hiding places for part of its own spiralling debt. Under the government’s strategy, billions of dollars of spending will be relegated to these dummy corporations; whatever revenues they produce will be transferred back to the Treasury.
The mechanics don’t matter much, provided the Big Bang is avoided. The fundamentals don’t change. Hydro must be restructured; assets must be written down; Mr. Strong has already ordered a major reevaluation of Hydro’s assets. (By Hydro assessment now, its Darlington nuclear plant is worth $14 billion; in market terms, it’s worth perhaps $7 billion.)
Hydro’s restructuring is essential. Ontario Hydro is Canada’s largest Crown corporation, and its unproductive use of investment is legendary. The Economic Council of Canada has rated all of Canada’s public power producers unproduc
January 24,1993 ©1993 by Friedberg Commodity Management Inc. Reproduction in whole or in part prohibited. 3
FRIEDBERG’S
tive; Ontario Hydro is the worst of them all. With 28,000 employees, its productivity gap (compared, for example, with BC Hydro) represents a $5 billion-a-year loss.
Investors, though, must now look beyond Hydro to the province itself and its comprehensive debt obligations. As a percentage of Ontario GDP, the province’s net debt has almost doubled in five years; it will rise inexorably for another five years. The province’s “purchase” of perhaps $10 billion in Hydro’s debt (enough to permit Hydro’s mandated rate increases) does not alter the province’s net obligations as guarantor but does impair its own ability to meet its interest payments. Where will Ontario, whose deficits are now out of control, find an extra billion dollars a year for its increased interest payments?
Ultimately, in bankruptcy proceedings, the equity holder takes a hit; here, the equity holder is the Ontario taxpayer. The broadest-base tax is the income tax. Ontario Treasurer Floyd Laughren has warned that tax increases are on the way; most people anticipate a bunch of nuisance-tax increases, many new user-fee taxes, and perhaps an increase in the province’s sales tax. These won’t be enough. Watch, therefore, for Ontario to ratchet up its income tax rates; watch for a special hit on the “wealthy.” (And watch for Mr. Rae, who was a fellow Rhodes scholar with his famous contemporary, the American president, to call it “Clintonomics.”)
These rate increases will significantly retard Ontario’s recovery from recession. Ontario is saturated in taxes. As C.D. Howe economist Irene Ip warned a few weeks ago, "any increase in Ontario’s tax burden will be very damaging to Ontario’s growth prospects.” With annual deficits ranging anywhere from $12 billion to $15 billion for the next three years, Ontario moves inexorably from crisis to catastrophe.
In response, Mr. Rae has articulated a grand strategy that will only make things worse: 1) He will devote his energies to the defeat of the Conservative federal government in the next
election, which would in itself be a real downer for the Canadian dollar; 2) his government will do whatever it can to block the North American Free Trade Agreement. Mr. Rae is adamantly determined to preserve and protect the unillustrious past.
The independent Power Producers’ Society of Ontario, which represents the private sector NUGs, has described Hydro’s purge of the market “as definitive evidence to both large and small investors that Ontario is indeed closed for business.” It is right Investment in Ontario is a high-risk proposition now, and will remain so for the foreseeable future. In this environment, chaos theory suggests that investors race away as far and as fast as they can.
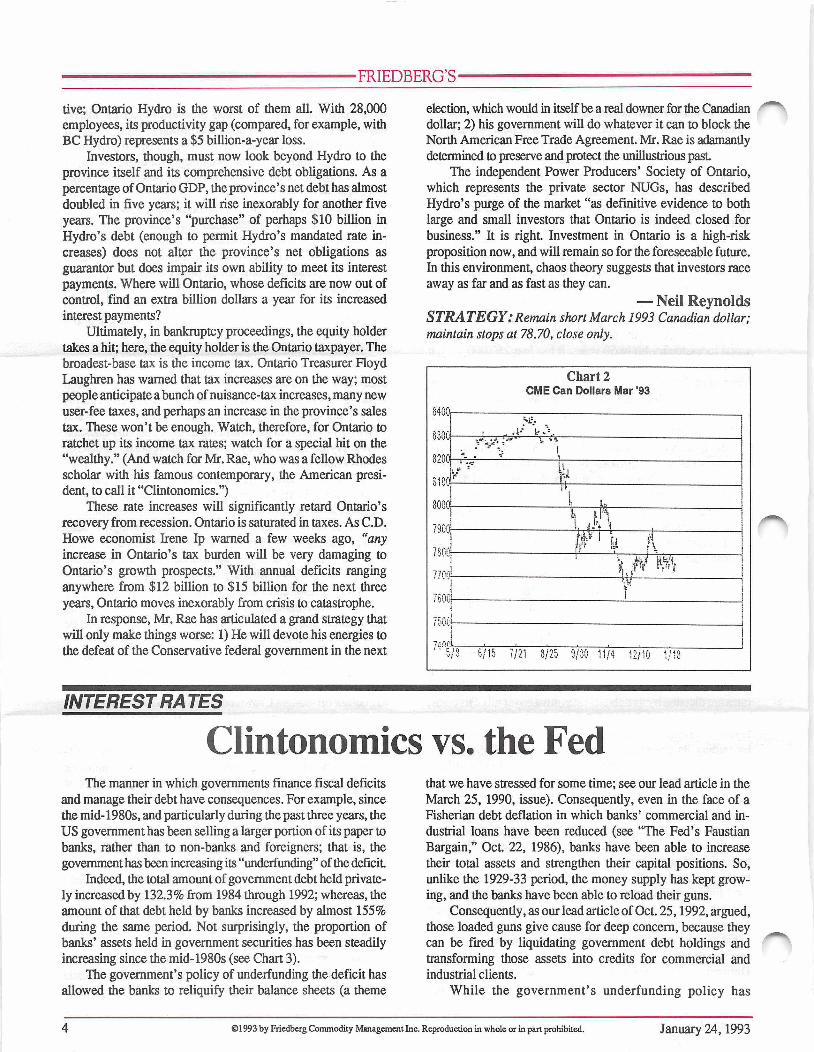
— Neil Reynolds STRATEGY : Remain short March 1993 Canadian dollar; maintain stops at 78.70, close only.
Chart 2
8400
CME Can Dollars Mar '93
.M f.
8300 - - - - - - - - - - u __ _ _ _ _ _ _ _ _ _ _ _ _ _ _ _ _ _ _ _ _ _ _ _ _ _ _ _ _S 3 ? r - > "
8200 « - . _ _ _ _ _ _ _ _ _ _ L _
8100. ■ U i£ _ _ _ _ _ _ _ _ _ _ _ _ _ _ _ _ _ _ _ M _ _ _ _ _ _ _ _ _ _ _ _ _
n- - - - - - - - - - - - - - - - - - - - - - - - - - - - - - - - - - - - - - - - - - -
8000 _ _ _ _ _ _ _ _ _ _ _ _ _ _ _ _ _ _ _ _ _ _ 1 u _ _ _ _ _ _ _ _
_ _ _ _ _ _ _ _ _ _ _ _ _ _ _ _ _ _ _ _ _ _ _ \ _ _ _ _ _ _ _ _ _ _ _ _ _ _ _ _ _7900
7 p ) _ _ _ _ _ _ _ _ _ _ _ _ _ _ _ _ _ _ _ _ _ _ _ _ r k _ _ _ _ _ _ _ _ _ _ _ _ _ _ _ _ _ _ _ _
7 7 0 r ^ X f t w r?h o r
y li
750 i
l & f i f
/S 6 /1 5 7 /2 1 8 /2 5 9 /3 0 1 1 /4 1 2 /1 0 1 /1 8
INTEREST RATES
Clintonomics vs. the FedThe manner in which governments finance fiscal deficits
and manage their debt have consequences. For example, since the mid-1980s, and particularly during the past three years, the US government has been selling a larger portion of its paper to banks, rather than to non-banks and foreigners; that is, the government has been increasing its “underfunding” of the deficit
Indeed, the total amount of government debt held privately increased by 132.3% from 1984 through 1992; whereas, the amount of that debt held by banks increased by almost 155% during the same period. Not surprisingly, the proportion of banks’ assets held in government securities has been steadily increasing since the mid-1980s (see Chart 3).
The government’s policy of underfunding the deficit has allowed the banks to reliquify their balance sheets (a theme
that we have stressed for some time; see our lead article in the March 25, 1990, issue). Consequently, even in the face of a Fisherian debt deflation in which banks’ commercial and industrial loans have been reduced (see “The Fed’s Faustian Bargain,” Oct. 22, 1986), banks have been able to increase their total assets and strengthen their capital positions. So, unlike the 1929-33 period, the money supply has kept growing, and the banks have been able to reload their guns.
Consequently, as our lead article of Oct. 25,1992, argued, those loaded guns give cause for deep concern, because they can be fired by liquidating government debt holdings and transforming those assets into credits for commercial and industrial clients.
W hile the government’s underfunding policy has
4 ©1993 by Friedberg Commodity Management Inc. Reproduction in whole or in part prohibited. January 24,1993

FRIEDBERG’S
cushioned the impact of the debt deflation on the banks’ balance sheets, it has created a potential money supply management problem for the Fed. Indeed, only a vigilant, if not hawkish, Fed can head off the inflationary consequences that would follow the discharge of the banks’ credit guns.
# # # s}t
Since we penned our October piece, we have had a presidential election, and our concerns have become greater. During the campaign, Governor Clinton avoided criticism of the Fed’s monetary policy. Indeed, unlike President Bush, Mr. Clinton said that the Fed had done all it could to promote a recovery.
However, after the election, Mr. Clinton switched gears. At a meeting on Hilton Head Island, the President-elect was quoted as saying, “What we’ve got to do is to keep interest rates down and get growth going.” Then, President Clinton’s lieutenants got on board. For example, the President’s new Director of the Office of Management and Budget, Mr. Leon Panetta, warned the Fed not to increase interest rates soon because that would allegedly make it harder to cut the deficit. If that weren’t enough, the President’s allies in the Congress joined in. Senator Paul Sarbanes, head of the Joint Economic Committee, warned the Fed that it could be stripped of its independence if it holds back the economic recovery by raising interest rates.
In light of the loaded credit guns and given that there are to be no more gridlocks in Washington, we have taken these utterances more seriously than the usual gas from the Washington gasbags.
It is clear that the Clinton administration is already trying to handcuff the Fed and box it into holding short rates at record-low levels. Consequently, the Fed will be unable to increase short rates rapidly when the banks fire their credit guns as the demand for commercial and industrial credit picks up. A credit boom and more inflation will be inevitable.
* * * * *
But that’s not the end of the story. What sent us skyward was a new idea about financing the deficit and refinancing the debt, which was proposed by the Democratic Study Groups (DSG), the House Democrats’ advisory panel. The DSG correctly noted that the average length of maturity for outstanding government debt steadily increased in the 1970s and 1980s (see Chart 4).
The DSG went on to argue that by shortening the average maturity on government debt, billions of dollars could be saved. To illustrate the DSG’s thinking, consider its most extreme argument: Since the Fed can control short-term rates at 3%, for example, deficit financing and debt refinancing could be limited exclusively to 90-day paper, and consequently interest expense would drop sharply from present levels towards 3% as a larger fraction of the government’s debt was moved to 90-day paper.
The Achilles’ heel of that proposal is long rates. Yes, short rates could be held at 3%, but long rates would take off under such a setup. But, the DSG argues, if there were no more issues of long bonds, their supply would be reduced, their
prices would rise, and long rates would fall.To put it mildly, the DSG’s analytics are flawed. Under
the DSG’s proposal, the Fed would be handcuffed and unable to control a credit boom and more inflation. Consequently, long rates, which contain inflation expectations, will move up rapidly.
What makes the DSG’s proposal so disconcerting is not their analytics, however. Rather, it is the fact that the Clinton administration has stated that it is seriously considering the DSG’s general proposal. With its general bias of favoring low short rates and a policy of shortening maturities of government debt to take advantage of those low short rates, the Clinton administration would destroy any possibility for the Fed to control credit and inflation. If that’s Clintonomics, the Fed is, to use President Bush’s felicitous phrase, in “deep doodoo.” IMPLICATIONS: In the short run, as the government stops issuing long-term instruments, their supply will fall, prices will increase, and rates will fall. However, the resulting flattening of the yield curve will be only temporary. In the long run, the yield curve will reverse course and steepen, with long rates going to the moon.
STRATEGY: Wait until the announcements that long-term instruments will no longer be offered and the short-run reaction. After the short-run reaction, add to your long put positions on long bonds, institute outright short positions on the long bonds and/or play the yield curve in anticipation o f a steeper curve.
— Dr. Steve H. Hanke
Chart 3The Structure of US Banks' Assets
“ L o a n s ” o r “ lo a n s an d le a s e s ”
i . e , le n d in g to p rivate s e c to r, m o stly
USg o v e rn m en t
s ec u ritie s
O th e rs ec u ritie s
1930 June 70.6% 10.2% 19.2%1948 Dec. 36.7% 55.1 8.21960 Dec. 59.1 30.3 10.51972 Dec. 68.2 15.5 16.31984 Dec. 76.7 15.2 8.21989 Dec. 77.6 15.4 7.01990 Dec. 76.9 16.6 6.51991 Dec. 73.9 19.8 6.31992 Nov. 71.7 22.3 6.1
Chart 4Maturity Classes and Average Maturity of Government Debt
YearMaturity Classes (%) Average Maturity
Within 1-5 5-10 10-20 20 + monthslyr. yrs. yrs. yrs. yrs years
1970 48.4% 36.2% 5.2% 5.0% 5.2% 3 8
1975 55.0 31.3 7.3 4.2 2.2 2 8
1980 47.5 33.6 8.4 5.6 4.9 3 9
1985 39.9 34.0 13.4 5.3 7.4 4 11
1990 34.0 34.2 14.5 4.5 128 6 1
1992 34.2 36.2 126 3.6 13.0 5 11
January 24,1993 ©1993 by Friedberg Commodity Management Inc. Reproduction in whole or in part prohibited. 5

FRIEDBERG’S
US DOLLAR
Illusory strengthContinuous expectations that the US economy is finning
have served to underpin the US dollar in foreign exchange markets. Nevertheless, against this background, we are forced to conclude that the dollar is “barely steady”: Europe is in the midst of a nasty slump while Japan is in the throes of a severe depressionary deflation, and yet the dollar has not made any headway beyond the DM1.60-DM1.62 level.
The answer, we suspect, lies around a number of concerns. Federal Reserve policy, as discussed in past issues, is too easy and threatens to unleash a severe bout of inflation (for more on this see Dr. Steve Hanke’s article, “Clintonomics vs. the Fed,” in this issue).
The Clinton cabinet lacks coherence, seems quite conventional in its views on taxes and the deficit, and downright dangerous on its views on international trade and environmental problems. Not a great magnet for international capital.
And finally, the recovery, now 22 months old, is itself being called into question: Neither employment nor personal income has improved in line with previous recoveries. Even if the recovery does not abort soon, per capita growth is likely to be nil or very close to it in coming months and years.
STRATEGY: The strong consensus o f opinion is that the US dollar will improve substantially in coming months. The mean forecast of between 20 and 30 banks o f blue-chip companies polled by The Economist Intelligence Unit is DM1.73 for January 1994, with a range o f 1.60-1.85. The six-month forecast is DM1.69 with a range o f 1.60-1.75, and the three- month forecast is DM1.67 within a range o f1.60-1.73. We are struck by the DM1.60 “ceiling." In our opinion the market will surprise the consensus and the DM1.60 ceiling may turn out to be a floor for yet many months.
DEUTSCHEMARK
Getting ready to go longGermany’s economic activity continues to show signs of
softening. The slowdown owes a great deal to the sharp decline in foreign demand. Export business has been further depressed by the appreciation of the DM in the EMS. According to the Bundesbank, the real external value of the DM against the currencies in 18 industrial countries has increased by 2 .5% since the end of July, although it is not higher now than it was at the beginning of 1987.
Despite the slowdown, inflation in Western Germany has remained high with the December year-on-year CPI stuck at 3.8%. In January the index will be affected by an increase in VAT from to 15% from 14%, which could add 0.5% to the CPI. This is the first impediment for a quick cut in interest rates.
A second concern is with the aggregate public sector deficits, which will probably once again hit almost 4.0% of GNP; adding the Treuhand agency, the Federal Railways, the East German Railways, and Post Office, aggregate borrowing requirements could reach a substantial 6.0% of GNP.
While the German government recently unveiled a plan to pay the mounting costs of absorbing Eastern Germany, which is to include a cut in social benefits and a rise in income taxes from 1995 on (the so called Solidarity Pact with unions, regional governments, and the opposition), the proposal has run into serious problems, and a pact is still a long way off. The Bundesbank has little to cheer about.
On December 10,1992, the Central Bank counsel adopted
a monetary target for 1993: M3 is to expand by 4.5% to 6.5% between the fourth quarter of 1992 and the fourth quarter of 1993. To arrive at this number, the Bundesbank allowed for an increase in aggregate production potential in 1993 of 3.0%, a normative price rise of 2.0%, and a 1% offset to the declining trend in the velocity of circulation of money and a price rise due to administrative decisions, such as rent, particularly in Eastern Germany. In setting the lower end of this range, the Bundesbank took account of the fact that the monetary aggregates were particularly high in the fourth quarter of 1992.
The Bundesbank has not commented on the very rapid rate of increase of M l, now showing a year-on-year rise of 11.2%. This is extraordinary given the absolute level of interest rates and the inverted shape of the yield curve, but it validates our view that monetary policy in Germany is still too expansionary.
In a world devoid of political pressures the Bundesbank would have to consider raising rates rather than lowering them. It may still do that, although of course it may not be politically feasible.
Which brings us to the Bunds and the short-dated Euromarks. At present levels they incorporate an unusually high level of expectations regarding lower interest rates. At 7 1/8% to 7 1/4% the yield on 10-year government paper is ■— lower today than it was before the breaching of the Berlin Wall in November 1989 and is below the average level of the last 25 years. This despite the enormous costs of reunification and
6 ©1993 by Friedberg Commodity Management Inc. Reproduction in whole or in part prohibited. January 24,1993

FRIEDBERG’S
an inflation rate stubbornly stuck around 4.0% per annum.At the same time June 1993 Euromarks, trading at a yield
of 7.16% have already discounted a very substantial 150 basis point decline from present three month rates. We believe that the market has exaggerated the Bundesbank’s true leeway in the matter of interest rates.
STRATEGY: We are preparing to reenter the long side of the DM vis d vis both the US dollar and the Japanese yen. Keep in close contact.
Purchase June 1993 92.5 and 92.75 striking Euro-DM put options. They are extremely cheap, and they give us an opportunity to recover the entire premium and then some even if spot rates stay unchanged.
JAPANESE YEN
Reliquification is the only way outJapan is caught in the most severe deflation of any in
dustrialized country since the ’30s.An unduly restrictive monetary policy has narrowed the
yield curve (3 months to 10 years) to 60 basis points compared with a recent 140 basis points. Furthermore, the Bank of Japan announced that the broadly defined money supply average of M2 + CDs shrank a preliminary 0.5% in December from a year earlier.
Reports that non-banks (finance subsidiaries of banks) may have bad loans of up to ¥5,800 billion is additional evidence, if more evidence is needed, that the Japanese banking system is crumbling. Its only way out is via reliquification d la Greenspan. This means ultimately dropping short-term rates to below 1.5% (where they would still provide a real rate of return!)
STRATEGY: We remain long Euro-yen futures on the SIMEX as per our Nov. 22 recommendation. Raise stops to 96.40, close only.
We also remain long the December' 93 yen versus the sale o f March ’93 yen on a spread basis.
January 24,1993 ©1993 by Friedberg Commodity Management Inc. Reproduction in whole or in part prohibited. 7

FRIEDBERG’S
BRITISH POUND
Light pounds are good for equitiesDisappointing figures for retail sales, manufacturing out
put, and unemployment revived hopes for a prompt and substantial cut in interest rates. With pay settlements currently averaging 3.25% and other measures of inflation equally subdued (note that house prices as measured by the Halifax and Nationwide building societies continued to fall last month), there is growing sentiment in the city for a 5.0% base rate.
Militating, however, against a very sharp fall in rates is Sterling’s vulnerability in the foreign exchange markets (see Chart 8).
Another constraint against the rapid inflation is renewed deterioration of the UK’s current account balance (see Chart 9), which seems to be extremely sensitive to fluctuations and industrial production.
Be that as it may, the further inevitable fall in interest rates
and the continuous depreciation of Sterling in the forex markets strongly favor equities over gilts. To the number of favorable ratios that we reviewed in previous issues, we add the following: 3-month Sterling LIBOR to cash dividends. At 1.56, this ratio is well below the 1976-93 average of 2.35. This means that top-rate taxpayers can achieve higher net returns in equities than they could achieve at most building societies.
STRATEGY: We remain bullish on the FTSE. Raise stops to 2728, basis spot index, close only.
A second recommendation: Sell Sterling/buy DM in equal dollar quantities; place initial stops at DM2.49, basis March 1993, close only.
C hart 9UK Current-Account Balance
FRENCH FRANC
Remain shortMembers of France’s National Association of Doctoral
Graduates in Economics, a group of private sector French economists, have concluded that France will not succeed in bringing its interest rates below those of Germany, despite enjoying a lower inflation rate.
Drawing on the UK’s recent experience, they urge that the monetary authorities lower the gap between France’s low inflation rate and its high nominal interest rates even if it
means exiting the ERM. They conclude that if a floated franc means a franc sinking against the D-mark, “it would be better to accept it as the price of stopping the asphyxiation of the French economy.”
Another crack in the establishment’s consensus on the need for a franc fort?
STR A TE G Y: Remain short French francs versus the D-mark.
8 ©1993 by Friedberg Commodity Management Inc. Reproduction in whole or in part prohibited. January 24,1993

S&P500
The bull’s last gasp?
------------------------------------------------------------FRIEDBERG’S ------------------------
Indicative of the final stages of the bull market, small capitalization, highly speculative stocks make dramatic gains while high capitalization, high grade stocks mark time.
Nowhere is this divergence more pronounced than in NASDAQ. The junior over-the-counter market has risen 28% from the October lows, while the senior Dow Jones industrial Average has barely managed to recover less than 6%. In the process, NASDAQ has recorded all-time highs, while the venerable Dow remains approximately 5% below its all-time highs achieved in the spring of 1992.
While the market has taken a distinctly speculative tone, breadth has confirmed record highs, and volume for January
Chart 108 Week Sell/Buy Ratio vs. Dow Industrials
Vickers Weekly Insider Report
has exceeded that achieved for any month in the past year, leaving us guessing as to the exact end of the party. Other than excessive (what is “excessive,” really?) speculation, insider activity is flashing caution ahead: The eight week sell/buy ratio prepared by Vickers Weekly Insider Report stands at a bearish 3.29 (see Chart 10), reflecting the increasingly pessimistic investment stance among executives and directors of publicly traded companies.
We would not fire the gun, yet.
S T R A T E G Y : Remain long futures and/or call options; raise stops to 426.75, basis March 1993, close only.
CRUDE OIL
Oil, oil everywhereProving once again that the world is not about to run out
of raw materials, much less oil and gas, Edinburgh-based Wood McKenzie reported that last year Norway boosted crude oil by 14% and gas production by 5%.
More significantly discoveries and reserve upgrades in 1992 reached 1.3 billion barrels oil equivalent, which more than replaced aggregate production of 985 million barrels. At the same time several oil discoveries in Ecuador’s Amazon region and new studies by the French Petroleum Institute have almost tripled the country’s proven reserves, to 4.3 billion barrels.
Finally, gradual improvements in extraction technology have made synthetic crude from tar sands competitive with
crude from more conventional sources. The giant Syncrude complex at Fort McMurry in Alberta, Canada, planned and built during the ’70s, reliably produces synthetic crude oil at a cost of just under $12/barrel compared with a cost of about C$25/barrel in 1980 dollars at the beginning of the last decade.
Syncrude estimates that a further 200 billion barrels, more than the reserves of the Gulf countries combined, are recoverable using present extraction technology. Estimates of total reserves run as high as a trillion (!) barrels.
Thanks to a surge in Iranian oil production, which reached 3.835 million barrels a day in November, OPEC produced 25.49 million barrels a day that month, the highest output since 1980. OPEC will have to cut output by almost 600,000 barrels
January 24,1993 ©1993 by Friedberg Commodity Management Inc. Reproduction in whole or in part prohibited. 9

FRIEDBERG’S
a day if it is to keep within its production ceiling. To keep prices from plunging , however, it will have to cut output by substantially more than that as we enter the low usage season.
New discoveries and new extraction techniques are certain to put enormous pressures on the high reserve countries such as Saudi Arabia, Kuwait, Iran, and Iraq. Oil in the ground is a depreciating commodity. Therefore, current oil production must be maximized. Inevitably the price of oil will fall to its marginal cost of production.
STRATEGY: Maintain short position via the cheap puts purchased over the past four months.
C hart 12 March 93 Crude Oil
2 2 0 0
71'.'[<!k,
_____________LU________
- - - - - - - - r,. ________ W____________w :2 0 0 0 .v, t
1 9 5 f
1 9 0 0
iij # 1 ■
18 5 0 WLISOf
17'.!' .‘ £' 4 8 / 2 7 9 / 2 2 1 0 /1 5 1 1 /9 1 2 /4 1 2 /3 0 1 / 2 5
COMMODITIES
Cocoa, sugar, corn, silverLet’s review our strategy. Back in our October 1992 letter
Albert Friedberg presented a thesis that the economy was on the verge of experiencing a shocking jolt of inflation. The thesis was original and compellingly argued. Based upon it, I recommended buying both cocoa and silver futures positions.
Underlying the recommendation was a view that we should begin to regard commodities in general as an asset category. We said as early as September 1991, when the CRB (Commodity Research Bureau) Futures Index was at 212.00 — 4.7% higher than it was in our October letter — that commodities were cheap in real terms, and utterly neglected by serious investors; i.e., ripe for picking. Cocoa and silver were the first two of what I imagined would be many commodities we would accumulate during the course of the inflationary phase. In November we added com to our portfolio. In December we added sugar.
As of today’s market closings (Jan. 22, 1993), the CRB index is virtually unchanged from where it was in October when we first embarked upon the current strategy, and we are about even on our four investments (down 0.45% if we use an average of the change in the four March futures contracts).
The accompanying charts suggest that for none of our investments does the future suggest caution. For sugar and cocoa the future looks hopeful.
In both sugar and cocoa the fundamentals have improved since we wrote about them.
Sugar output is now reliably estimated at between 114 and 115 min tonnes, some 2.0 to 2.5 min tonnes less than was generally expected as recently as last month. The new estimates are lower as enthusiasm has waned over the abilities of the former communist countries of Eastern Europe and the former Soviet Union to reconstruct the sugar industry to levels that existed before the breakdown of the communist regime.
Although cocoa data are still hard to come by at this relatively early stage in the growing season (which began Oct. 1), industry sentiment is that, at the very least, we should reasonably expect a deficit matching last year’s of approximately 150,000 tonnes. Actual positive numbers are Ghana’s weekly purchases — a proxy for demand — running some 30% higher than at the comparable period last year, and Ghana’s announcement of last week that it will have 200,000 tonnes less cocoa to export this year than last.
We may conclude that our investments in both these commodities are now even less vulnerable to a sell-off (from already depressed levels). Moreover it is reasonable to imagine that conditions are such that an “accident” would be enough to ignite a genuine bull market.
In the case of sugar, the accident would most likely — and could quite easily — take place in Cuba. Cuba is the world’s largest exporter of sugar. The beleagured nation is bereft of oil, which it vitally needs both to provide input to the crop in the form of fertilizer and to fuel harvesting machinary later in the year.
Until 1991, Cuban sugar was heavily subsidized by the Soviet Union in the form of oil-for-sugar swaps at four times world prices. Recent oil-for-sugar swaps were at virtual free- market cash prices.
Minister of sugar Bettancourt, during an interview last week, admitted problems were not unlikely, and refused to deny a reduction of as much as 750,000 tonnes was possible.
In the case of cocoa we know pod rot disease has attacked the crop of Ivory Coast the past two years. In neither year has their been any significant drawdown in production. Could this be the year?
STRATEGY: We remain long cocoa, sugar, corn and silver futures positions.
10 ©1993 by Friedberg Commodity Management Inc. Reproduction in whole or in part prohibited. January 24,1993
FRIEDBERG’S
FRIEDBERG CAPITAL MARKETS
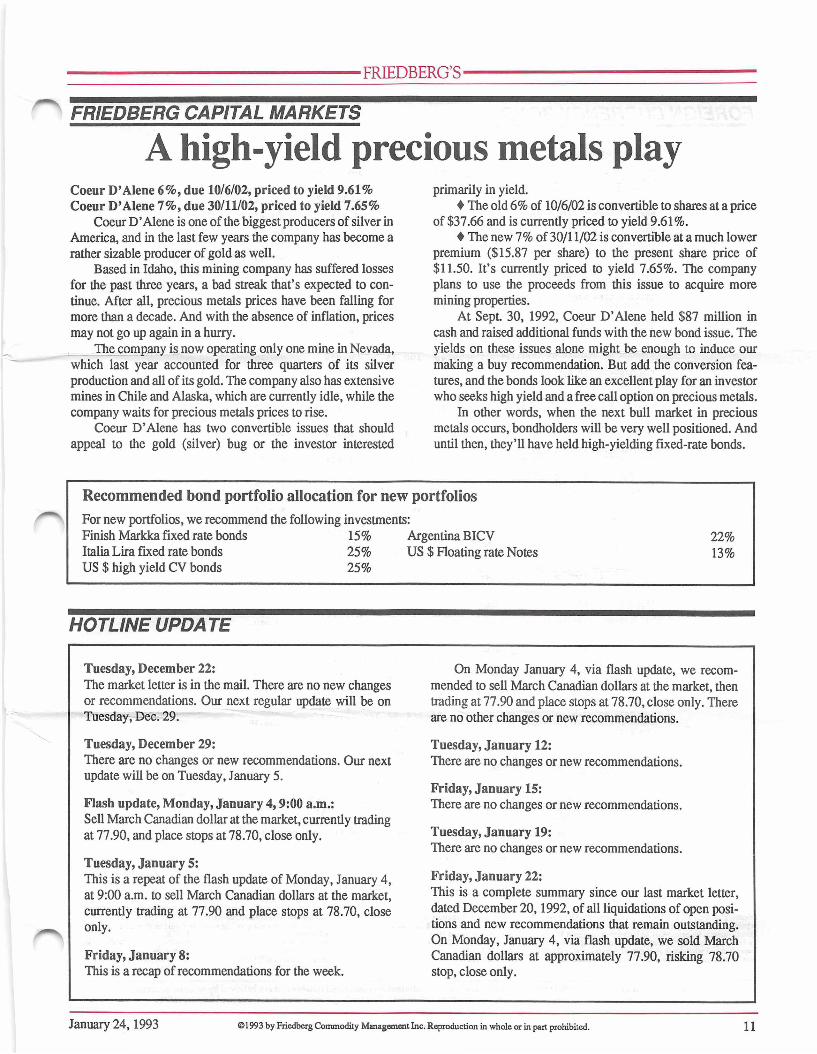
A high-yield precious metals playCoeur D’Alene 6%, due 10/6/02, priced to yield 9.61% Coeur D’Alene 7%, due 30/11/02, priced to yield 7.65%
Coeur D’Alene is one of the biggest producers of silver in America, and in the last few years the company has become a rather sizable producer of gold as well.
Based in Idaho, this mining company has suffered losses for the past three years, a bad streak that’s expected to continue. After all, precious metals prices have been falling for more than a decade. And with the absence of inflation, prices may not go up again in a hurry.
The company is now operating only one mine in Nevada, which last year accounted for three quarters of its silver production and all of its gold. The company also has extensive mines in Chile and Alaska, which are currently idle, while the company waits for precious metals prices to rise.
Coeur D’Alene has two convertible issues that should appeal to the gold (silver) bug or the investor interested
primarily in yield.♦ The old 6% of 10/6/02 is convertible to shares at a price
of $37.66 and is currently priced to yield 9.61%.♦ The new 7% of 30/11/02 is convertible at a much lower
premium ($15.87 per share) to the present share price of $11.50. It’s currently priced to yield 7.65%. The company plans to use the proceeds from this issue to acquire more mining properties.
At Sept. 30, 1992, Coeur D’Alene held $87 million in cash and raised additional funds with the new bond issue. The yields on these issues alone might be enough to induce our making a buy recommendation. But add the conversion features, and the bonds look like an excellent play for an investor who seeks high yield and a free call option on precious metals.
In other words, when the next bull market in precious metals occurs, bondholders will be very well positioned. And until then, they’ll have held high-yielding fixed-rate bonds.
Recommended bond portfolio allocation for new portfoliosFor new portfolios, we recommend the following investments:Finish Markka fixed rate bonds 15% Argentina BICV 22%Italia Lira fixed rate bonds 25 % US $ Floating rate Notes 13 %US $ high yield CV bonds 25%
HOTLINE UPDATE
Tuesday, December 22:The market letter is in the mail. There are no new changes or recommendations. Our next regular update will be on Tuesday, Dec. 29.
Tuesday, December 29:There are no changes or new recommendations. Our next update will be on Tuesday, January 5.
Flash update, Monday, January 4,9:00 a.m.:Sell March Canadian dollar at the market, currently trading at 77.90, and place stops at 78.70, close only.
Tuesday, January 5:This is a repeat of the flash update of Monday, January 4, at 9:00 a.m. to sell March Canadian dollars at the market, currently trading at 77.90 and place stops at 78.70, close only.
Friday, January 8:This is a recap of recommendations for the week.
On Monday January 4, via flash update, we recommended to sell March Canadian dollars at the market, then trading at 77.90 and place stops at 78.70, close only. There are no other changes or new recommendations.
Tuesday, January 12:There are no changes or new recommendations.
Friday, January 15:There are no changes or new recommendations.
Tuesday, January 19:There are no changes or new recommendations.
Friday, January 22:This is a complete summary since our last market letter, dated December 20,1992, of all liquidations of open positions and new recommendations that remain outstanding. On Monday, January 4, via flash update, we sold March Canadian dollars at approximately 77.90, risking 78.70 stop, close only.
January 24,1993 ©1993 by Friedberg Commodity Management Inc. Reproduction in whole or in part prohibited. l i

FRIEDBERG’S
FOREIGN CURRENCY BONDS
Date: J a n u a r y 21 / 1 9 9 3
W E O F F E R T H E F O L L O W I N G B O N D S S U B J E C T T O C H A N G E W I T H O U T P R I O R N O T I C E : M I N I M U M U S $ 5 . 0 0 0 ( C D N . $ 7 , 0 0 0 )I S S U E R / M A T U R I T Y D A T E / C O U P O N
D E U T S C H E M A R K D E N O M I N A T E D B A N K O F N O V A S C O T I A 5 5 / 8 % 0 7 / 0 5 / 9 6 R R S P e l i g i b l e W O R L D B A N K 5 7/8%4 / 0 2 / 9 7 R R S P e l i g i b l e W O R L D B A N K 9%1 3 / 1 1 / 0 0 R R S P e l i g i b l e
F I N N I S H M A R K K A D E N O M I N A T E D B O N D S REP. O F F I N L A N D 11% 1 5 / 6 / 9 5
I T A L I A N L I R A D E N O M I N A T E D B O N D S N O R D I C INV. B A N K 12 3 / 8 % 1 9 / 0 4 / 9 6
S W I S S F R A N C D E N O M I N A T E D B O N D S G O V T . O F A U S T R A L I A 5% 3 0 / 1 0 / 9 8
D A N I S H K R O N E D E N O M I N A T E D B O N D S K I N G D O M O F D E N M A R K 9% 1 5 / 1 1 / 9 4
E C U D E N O M I N A T E D B O N D SU N I T E D K I N G D O M 9 1 / 8 % 2 1 / 0 2 / 0 1
B R I T I S H P O U N D D E N O M I N A T E D B O N D S K G D M O F S W E D E N 8 3 / 4 % 2 9 / 5 / 9 6
F R E N C H F R A N C D E N O M I N A T E D B O N D S C R E D I T L Y O N N A I S E 9 1/2% 2 3 / 1 2 / 9 6
C U R R . A N N . Y L D . T O M T Y .
10 3 104
J A P A N E S E Y E N D E N O M I N A T E D B O N D SW O R L D B A N K 5 3 / 4 % 7 / 8 / 9 6 R R S P e l i g i b l e 1 0 5 . 4 0 1 0 6 . 1 5
C A N A D I A N D O L L A R D E N O M I N A T E D P O N D S O N T A R I O H Y D R O 10 7 / 8 %0 8 / 0 1 / 9 6 (semi a n n u a l )E K S P O R T F I N A N S 7 3 / 4 %5 / 1 1 / 9 7R O Y A L B A N K O F C A N A D A 9 1/8%7 / 1 / 9 7
E S C O M 11% 3 1 / 1 0 / 9 3 (semi)
A U S T R A L I A N D O L L A R D E N O M I N A T E D B O N D S C O M M O N W E A L T H B A N K O F A U S T R A L I A 14% 0 1 / 0 7 / 9 4
A R G E N T I N E A N P E S O D E N O M I N A T E D B O N D S A R G E N T I N A B I C V F I X E D / F L O A T I N G 1 / 0 5 / 2 0 0 1 c a l l a b l e in full o n a n y i n t e r e s t d a t e
8 . 2 5 %
3 . 8 5 %
1 0 6 3 / 4 1 0 7 3 / 4 8 . 0 3 %
98 3 / 4 99 3 / 4 7 . 8 0 %
101!* 102% 8 . 4 3 %
9 8 . 8 5 9 9 . 8 5 1 1 . 4 7 %
108% 109% 6 . 9 0 %
8 6 . 4 2 8 7 . 1 7 2 4 . 5 1 % IRR
N E X T P A Y M E N T D A T E _______
9 4 . 3 5 9 5 . 3 5 7 . 2 5 % M a y 07
9 7 . 6 0 9 8 . 3 5 6 . 3 5 % F e b . 04
1 1 2 . 6 5 1 1 3 . 4 0 6 . 7 3 % N o v .13
100% 10 1 1 0 . 4 4 % J u n .15
1 0 0 . 1 0 1 0 0 . 8 5 1 1 . 9 9 % A p r . 19
94 96 5 . 8 3 % O c t .30
9 9 . 4 0 1 0 0 . 1 5 8 . 8 7 % N o v . 15
1 0 4 . 4 0 1 0 5 . 1 5 8 . 2 2 % F e b . 21
10 2 7 / 8 1 03 5 / 8 7 . 4 6 % M a y 29
D e c .23
A u g .07
J u l . 0 8
N o v . 05
J u l . 7
A p r .30
J u l .07
4 t h d a y o f mth.
U.S. D O L L A R D E N O M I N A T E D F I X E D C O N V . P O N D S D A T A P O I N T CORP. 8 7 / 8 % 1 / 6 / 0 6 C V @ $ 1 8 . 1 1 p / s h (semi)
D I C E O N E L E C T R O N I C S 5 1 / 2 % 1 / 3 / 1 2 (semi) C V @ $ 3 9 . 5 0 p / s h
B U R N U P & S I M S 12% 1 5 / 1 1 / 0 0 (semi)C V @ $ 1 6 . 7 9 p / s h
A T A R I C O R P . 5 1 / 4 % 2 9 / 4 / 0 2 C V @ $ 1 6 . 3 1 p / s h
C O E U R D ' A L E N E 6% 1 0 / 6 / 0 2 C V @ $ 3 7 , 6 5 5 p / s h
C O E U R D ' A L E N E 7% 3 0 / 1 1 / 0 2 C V @ $ 1 5 . 8 7 p / s h (semi)
*U.S. D O L L A R D E N O M I N A T E D F I X E D R A T E B O N D S F A R M C R E D I T C O R P . 7 3 / 4 %1 0 / 0 6 / 9 6 R R S P e l i g i b l e
69% 72% 13 . 78% Jun. ,01
37% 40% 15 . 71% Mar. ,01
May. ,1587 89 14 . 90%
A p r ..2950 3 / 4 52 3/_4 - 1 5 . 0 0 %
J u n .. 1076% 78% 9. 61%
May. ,3194% 96% 7 . 65%
Jun, .10
U.S. D O L L A R D E N O M I N A T E D F L O A T I N G R A T E N O T E S BID U N I T E D K I N G D O M 2 4 / 0 9 / 9 6 q q q n3 m o . L I B I D - 1 / 8 ( q t l y ) ‘ c a l l a b l e 0 100
1 05 1 / 8 10 5 7 / 8 5 . 7 7 %
W1 0 0 . 2 0 33s%O F F E R C U R R E N T C O U P O N
M a r .31
A l t h o u g h w e m o n i t o r t h e s e i s s u e s s p e c i f i c a l l y , w e a l s o c a n fill a n y o r d e r in a n y foreic b o n d .
F o r f u r t h e r i n f o r m a t i o n a n d c u r r e n t p r i c e s p l e a B e call:F R I E D B E R G C A P I T A L M A R K E T S (416) 3 6 4 - 2 7 0 0 C a n a d a £> U . S . A . 1 - 8 0 0 - 4 6 1 - 2 7 0 0
Friedberg’s Commodity & Currency Comments (ISSN 0229-4559) is published by Friedberg Commodity Management Inc., 347 Bay Street, Toronto, Ontario, M5H 2R7. Contents copyright © 1993 by Friedberg Commodity Management Inc. All rights reserved. Reproduction i whole or in part without permission is prohibited. Brief extracts may be made with due acknowledgement
Subscription Enquiries forFriedberg’s Commodity & Currency Comments347 Bay Street, 2nd FloorToronto, Ontario, CanadaM5H 2R7(416)364-1171
Trading and Managed AccountsAll enquiries concerning trading accounts should be directed to:In Canada In U.S.Friedberg Mercantile Group Friedberg Mercantile Group Inc.347 Bay Street 67 Wall S t, Suite 1901Toronto, Ontario M5H 2R7 New York, N.Y. 10005(416) 364-2700 (212) 943-5300
All statements made herein, while not guaranteed, are based on information considered reliable and are believed by us to be accurate. Futures and options trading is speculative and involves risk of loss. Past trading results are not indicative of future profits.
12 ©1993 by Friedberg Commodity Management Inc. Reproduction in whole or in part prohibited. January 24,1993