the progressive export tax and indonesia’s palm oil
TRANSCRIPT

THE PROGRESSIVE EXPORT TAX AND INDONESIA’S PALM OIL PRODUCT
EXPORT COMPETITIVENESS
Hubungan Pajak Ekspor Progresif dengan Daya Saing Ekspor Produk Kelapa
Sawit Indonesia
Immanuel1, Suharno2, Amzul Rifin2
1Ministry of Trade, Jl. M.I. Ridwan Rais No.5, Jakarta, 10110, Indonesia 2Department of Agribusiness, Bogor Agricultural University
Jl. Kamper, Kampus IPB Darmaga, Bogor, West Java, 16680, Indonesia
E-mail: [email protected]
Naskah diterima: 24/05/2018; Naskah direvisi: 23/04/2019; Disetujui diterbitkan: 29/11/2019 Dipublikasikan online: 31/12/2019
Abstrak Hubungan antara daya saing produk kelapa sawit dan intervensi kebijakan pemerintah di Indonesia masih sering menjadi perdebatan diantara pemangku kepentingan. Terkait dengan hal tersebut, penelitian ini menganalisis hubungan antara pajak ekspor progresif dengan perubahan pangsa ekspor CPO Crude Palm Oil (CPO) dan Refined Palm Oil (RPO) serta mengkaji daya saing kedua komoditi. Metode yang digunakan adalah Revealed Compared Advantage (RCA) dan Export Product Dynamic (EPD) untuk mengukur perubahan pangsa ekspor serta tingkat daya saing produk CPO dan RPO ke negara tujuan utama ekspor. Untuk melihat dampak kebijakan tersebut, kajian ini membandingkan sebelum dan sesudah diberlakukannya kebijakan pajak ekspor progresif pada akhir tahun 2007 dan menggunakan data bulanan ekspor produk CPO dan RPO periode 1997-2018. Hasil analisis menunjukkan bahwa setelah diberlakukannya pajak ekspor progresif, pada komoditi CPO telah terjadi penurunan pangsa ekspor sebesar 21% dan pergeseran tingkat daya saing produk dari posisi Rising Star ke Lost Opportunity. Sebaliknya pada komoditi RPO terjadi peningkatan pangsa ekspor dan daya saing dari Falling Star ke Rising Star. Peningkatan pangsa ekspor dan daya saing RPO merupakan salah satu pencapaian dari tujuan kebijakan pajak ekspor. Analisis ini memberikan catatan penting bagi pemerintah dalam membuka alternatif pasar baru dengan tetap mempertahankan pangsa ekspor di negara tujuan ekspor utama. Kata Kunci: CPO, Pajak Ekspor, Daya saing, RCA, EPD
Abstract
The relationship between Indonesia’s palm oil product competitiveness and the government's policy intervention is still disputable among stakeholders. This research analyzes the association between the progressive export tax and the changes in export shares of Crude Palm Oil (CPO) and Refined Palm Oil (RPO) as well as the competitiveness of both commodities. Revealed comparative advantage (RCA) and export product dynamic (EPD) are used to measure the change in the export shares of CPO and RPO as well as of their export competitiveness to the main destination countries. To examine the impact of this policy, this research compares before and after the enactment of a progressive export tax policy at the end of 2007 and uses monthly export data for CPO and RPO products for the period 1997-2018. The result finds that after the enactment of the progressive export tax of CPO, the export share of CPO declined by 21% and the level of competitiveness of CPO products moved from Rising Star to Lost Opportunity compared with the condition during 1997-2007. In contrast, the export share of RPO products increased and its competitiveness level moved to a better position from Falling Star to Rising Star. Although shifting the export value of both CPO and RPO, as one of the objectives of the implementation of the export tax, was achieved, this study
The Progressive Export Tax and Indonesia's Palm Oil ..., Immanuel, Suharno, Amzul Rifin | 211

is highlighting essential commentary in which policymaker still needs to search for new export markets while maintaining export shares in the main export destinations.
Keywords: CPO, Export Tax, Competitiveness, RCA, EPD JEL Classification: Q17, F13, O24
INTRODUCTION
The estate crop sector as a one of
sources of Indonesia’s foreign exchange
has big contribution for developing
economy in Indonesia. The major
commodities of Indonesia’s crop sector
are Crude Palm Oil (CPO), Rubber,
Cocoa, and Coffee. From those,
Indonesia is the biggest producer and
exporter CPO in the world, Malaysia as
the second. During 2001-2017, on
average per year, world CPO’s export
value to all countries reached 7.2 Billion
USD, 55.9% or around 4 Billion USD
comes from Indonesia (UN
COMTRADE, 2019).
Figure 1. Crude Palm Oil (HS 151110)
World Export Value (1000
USD)
Source: UN COMTRADE (2019)
Figure 2. Palm Oil and Its Fraction
(HS 1511) World Export
Value (1000 USD) Source: UN COMTRADE (2019)
World palm oil production is
dominated by Indonesia and Malaysia.
Both countries produce about 85% to
90% of the total world's palm oil. The
dependency of the world on palm oil
products from Indonesia is indicated by
the worldwide high consumption of
vegetable oil in which palm oil has the
biggest share. In 2018 the total world
vegetable oil need reached 191 million
tons per year, to which Indonesia
supplied 18% (Statista, 2019).
Palm oil is exported in two primary
forms: CPO and Refined Palm Oil
(RPO). In 2017, the Indonesian CPO as
a staple commodity is mostly exported
to India (65,3%), the Netherlands (8,8%)
212 | Buletin Ilmiah Litbang Perdagangan, VOL.13 NO.2, DESEMBER 2019

and Malaysia (8,5%). The imposition of
the progressive export tax by the
government in 2007 has changed the
composition of the export volume in the
last nine years. The export tax policy
aims to guarantee the availability of
palm oil in domestic market, to control
the domestic palm oil price, in particular
to keep the cooking oil price stably, to
develop the downstream industry of
palm oil which has value added, and to
encourage export of value-added
products. As it was intended, the
composition of the Indonesian palm oil
exports shifted to the downstream
product during 2013-2017, as illustrated
in the figure 2.
According to WTO agreement,
this regulation has included in tariff
policy that is not forbidden. However, it
can affect the competitiveness of export
of CPO and RPO products due to the
increasing of the new price of both.
Because of the direct connection
between this policy and the
compositions of shares in the export of
CPO and RPO, hence, it is important to
answer two research questions such as:
1) How is the progressive export tax
related to the change in the share export
of CPO and RPO?; 2) How is the relation
of progressive export tax on the
competitiveness of the export of
Indonesia’s CPO and RPO?
One of the most general method
to measure competitiveness based on
market approach is market share or the
change in market share (Rifin 2010a).
Based on the previous explanation, this
paper aims to measure the change in
the export shares and in the
competitiveness of export of both
products to main country of destination
in relation to the imposition of the
progressive export tax. In addition, this
paper suggests RCA and EPD analysis
to predict how policy implemented by
the Indonesian government affect the
transformation in the export shares as
well as the competitiveness of export of
both products on the international CPO
market.
Empirical Studies of Export Tax on
Agricultural Commodities
In order to maintain the economic
situation inside globalization era, almost
all countries have been cooperating in
many sectors. The limitation of resource
or input production is causing them to
flow products and services from other
countries including Indonesia. Some
previous studies described international
trade such as Hsu and Tuan (2001);
Pujiati (2014); Nugroho (2014); and
The Progressive Export Tax and Indonesia's Palm Oil ..., Immanuel, Suharno, Amzul Rifin | 213

Kania (2014). All these researches used
similar concept from The Heckscjer-
Ohlin (H-O) theory, which emphasizes
the interaction between the different
proportions of the country’s production
factors, as well as the differences in the
usage of these factors on producing a
wide range of items. Feenstra and
Taylor (2008) revealed The H-O model
predicts that a country tends to export
the good, which uses its abundant factor
intensively. The H-O Model is explaining
that a country will export commodity that
possesses not only the low price of
production factors but also in much
quantities. Conversely, a country will
import commodity that the production of
it will absorb the high price and rare of
production factors (Salvatore, 1997).
The flowing of product and
service among countries has couple of
barriers that are called tariff and non-
tariff barriers. One of the types of the
tariff barriers is export tax. Many
researchers investigated the
consequences of export tax on Palm Oil
products. Hasan et al (2001); Obado et
al (2009); Rifin (2010b); Rachman
(2012); Rifin (2012); Purba (2012);
Abdulla et al (2014); Rifin (2014);
Syadullah (2014); Immanuel et al
(2016); Immanuel et al (2018) found that
the imposition of export tax was followed
by the decline in the level of
competitiveness of Palm Oil products.
Since this policy led to change the
share export of commodity, there are
several studies that have analyzed the
market share of agricultural commodity
as an indicator of competitiveness of the
commodity in global market. Using the
method of market share, Rifin (2010a);
Chen & Buwajian (2012); Nurcahyani et
al (2018) identified the competitiveness
of agricultural commodities as an impact
on the implementation of special
multilateral agreement with the main
trading partners as well on the market
transition from one producer country to
others.
Applying the method of Revealed
Comparative Advantage (RCA), Hassan
(2013); Elryah (2014); Kanaya & Firdaus
(2014); Sari (2015); Prasetyo et al
(2017) analyzed comparative
advantage of the export of agricultural
products in international market. All of
authors have similar type of data and
also tool of analysis. They used time
series data from some institutions with
the minimum lag of time analysis for ten
years. Examining the comparative
advantages can be continued with the
measurement of the competitive
214 | Buletin Ilmiah Litbang Perdagangan, VOL.13 NO.2, DESEMBER 2019
advantage by using another method that
is called Export Product Dynamic (EPD).
Hasibuan et al (2012); Ningsih (2013);
Sunardi (2015), Setyawati (2015);
Mulatsih and Putri (2017); Wiranthi and
Mubarok (2017) analyzed the position of
market of one country for specific
market destination. Researchers used
EPD for mapping the level of
competitiveness of Indonesia’s
agricultural commodities and textile.
Impact of Trade Policy
The Indonesian government
applied the export tax policy of Palm Oil
commodity and its fraction since
September 1994. This policy has two
objectives, namely (i) stabilizing the
inventory of the raw material that will use
for oil cooking industry and (ii)
developing the downstream Industry of
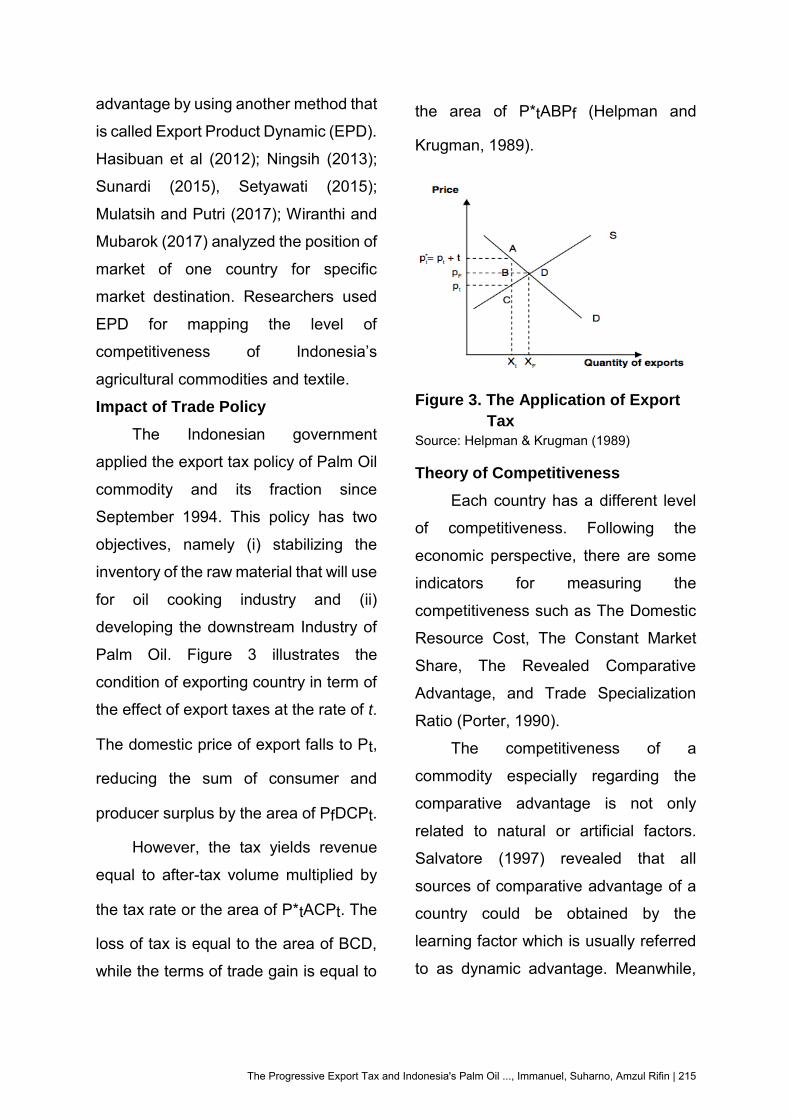
Palm Oil. Figure 3 illustrates the
condition of exporting country in term of
the effect of export taxes at the rate of t.
The domestic price of export falls to Pt,
reducing the sum of consumer and
producer surplus by the area of PfDCPt.
However, the tax yields revenue
equal to after-tax volume multiplied by
the tax rate or the area of P*tACPt. The
loss of tax is equal to the area of BCD,
while the terms of trade gain is equal to
the area of P*tABPf (Helpman and
Krugman, 1989).
Figure 3. The Application of Export
Tax
Source: Helpman & Krugman (1989)
Theory of Competitiveness
Each country has a different level
of competitiveness. Following the
economic perspective, there are some
indicators for measuring the
competitiveness such as The Domestic
Resource Cost, The Constant Market
Share, The Revealed Comparative
Advantage, and Trade Specialization
Ratio (Porter, 1990).
The competitiveness of a
commodity especially regarding the
comparative advantage is not only
related to natural or artificial factors.
Salvatore (1997) revealed that all
sources of comparative advantage of a
country could be obtained by the
learning factor which is usually referred
to as dynamic advantage. Meanwhile,
The Progressive Export Tax and Indonesia's Palm Oil ..., Immanuel, Suharno, Amzul Rifin | 215

the comparative advantage using labor
and capital is usually called static
advantage. Indonesia as a developing
country has a static advantage through
the excess supply of labor, however the
developed countries as providers of
technology have a dynamic advantage.
One method for measuring the
comparative advantage of a country is
the revealed compared advantage
method (RCA).
The comparative advantage of a
country is not automatically followed by
a competitive advantage. The result of
the combination of the vertical
agribusiness beginning with input
markets, on-farm and local markets and
ending with export-import is called
competitive advantage. In order to raise
the competitive advantage, it is
necessary to develop a robust
cooperation between the on-farm sector
and the off-farm sector of agribusiness.
Furthermore, the competitive advantage
of a commodity and its dynamic
movement can be measured by using
the export product dynamic method
(EPD).
METHODOLOGIES
On 2007 the Government of
Indonesia changed the mechanism of
export tariffs for palm oil and its
derivatives from constant export tax to
progressive export tax. The new
calculation of export tariff has been
determined based on reference prices at
applicable in international prices. As a
consequence, if international prices rise,
export tax of CPO will also increase
(Hafizah 2011). In addition, this policy
was implemented because of the
increase in the international price of
CPO without followed by the increasing
of export tariff, it was successfully
encouraging producer of CPO to export
its product rather than supplying CPO to
domestic market (Rifin 2014).
As a complement to previous
research, it is interesting to find out
regarding to the changing of the export
shares as well as the competitiveness of
export of both products particularly
before and after the implementation of
the progressive export tax of CPO of
Indonesia. Thereby, this study uses a
market approach that it can be predicted
by the changing of export share. In other
words, if CPO or RPO product from
Indonesia has a larger export share,
these product is more competitive in a
certain period and specific country
destination. RCA and EPD method are
used to analyze the competitiveness
advantage i.e competitiveness of CPO
216 | Buletin Ilmiah Litbang Perdagangan, VOL.13 NO.2, DESEMBER 2019

and RPO exports to the main destination
countries.
Revealed Comparative Advantage
(RCA)
The competitiveness of the CPO
or RPO of one country can be measured
by the RCA index. The export
performance of these products is a
variable measured by calculating the
share of CPO or RPO exports in the total
exports of all commodities to the main
partner countries, compared with the
share of these commodities in the world
exports to the same destination
countries.
The equation of the RCA index is
the following:
where:
Xij = Export value of CPO or RPO
commodity from Indonesia to
destination country
Xtj = Total export value for all
commodities from Indonesia to
destination country
Wij = The world export value of CPO or
RPO commodity to destination
country
Wtj = Total value of world exports to
destination country
The competitiveness is explained
by the interpretations of two results of
the RCA index. Firstly, RCA > 1 shows
that the share of CPO or RPO export in
the total export of Indonesia is higher
than the share of CPO or RPO export in
the world export. In other words,
Indonesia has comparative advantage
in CPO or RPO export, which can be
categorized as a big player in the field of
those products.
On the other hand, RCA < 1 means
that the share of CPO or RPO export in
the total export of Indonesia is lower
than the share of export of CPO and
RPO export in total world export. It
implies that Indonesia does not have
comparative advantage in CPO or RPO
export and is, therefore, not a dominant
player in the CPO or RPO world market.
Export Product Dynamic
The market position of the export
of one product from one country to a
specific destination country can be
determined by using EPD. This method
allows to assess the movement of a
commodity in the international market
based on the level of growth of this
commodity during a certain period. It
can also be applied to the movement of
CPO and RPO commodity.
RCA = Xij/Xtj
Wij/Wtj
The Progressive Export Tax and Indonesia's Palm Oil ..., Immanuel, Suharno, Amzul Rifin | 217

Mathematically, the X-axis can be
simulated as follows:
By contrast, the Y-axis is formulated
as follows:
Where, t is the year and T is
number of year analysis.
An EPD matrix consist of market
attractiveness and business-strength
information. The former is calculated
based on growth in demand for a
product in a certain market destination,
while the rest is measured based on
growth in the country’s market share of
a particular market destination
(Bappenas, 2009). The market position
of one product can be categorized using
a matrix that is divided into four levels.
Figure 4 consists of four areas
depicting export levels based on the
market share. All the levels make the
indicator of competitiveness visible in a
quantitative way. In a market, rising star
is the best position of a product which
rapidly develops a higher export share
value (being part of the group of the fast-
growing products). Lost opportunity
describes the circumstance of a
commodity decreasing in export share
value. Falling star shows the enhancing
of the market share value of a product,
although it does not grow in a dynamic
market. Retreat can be explained as a
commodity not needed by the market.
Figure 4. The position of
competitiveness by using
EPD method
Source: Estherhuizen (2006)
The position in the quadrants
represents the growth of Indonesia’s
market share for all commodities to the
destination country (placed in X-axis)
and the growth of market share for
Indonesia’s CPO or RPO to the
destination country (placed in Y-axis).
218 | Buletin Ilmiah Litbang Perdagangan, VOL.13 NO.2, DESEMBER 2019

Table 1. EPD Position Matrix
Competitiveness
Source: Ningsih (2013)
Data Description
This study compares the shift of the
export share value of Indonesia’s CPO
and RPO using data from eleven years
before and after the implementation of
the progressive export tax of CPO in
2008. The analysis uses yearly export
data from 2007 to 2018 and estimation
of RCA as well as EPD as an analysis
method. In other words, this study
compares the data from 1997-2007 with
those from 2008-2018. Thereby, the
changing of the structure of the export
value including CPO and RPO is
calculated. The top three destination
countries of Indonesia’s CPO export are
India, the Netherlands and Malaysia. In
contrast, China, Pakistan and India are
the main importer countries of
Indonesia’s RPO commodity.
This research uses secondary data
available from various sources.
Indonesia’s palm oil export data to the
main destination countries during 1997-
2018 has been generated by the Trade
Statistic for International Business
Development and further combined with
the United Nations Commodity Trade
Statistic Database (UN COMTRADE).
The palm oil and its fraction
product has the Harmonized System
(HS) code 1511 and is divided into
Crude Palm Oil (HS code: 151110) and
Refined Palm Oil but no chemically
modified (HS code: 151190).
RESULTS AND DISCUSSION
Indonesia’s Structure Export of Palm
Oil Products
For evaluating how the
progressive export tax influenced the
changing of the export share of CPO
and RPO, it is necessary to examine the
structure of the export shares of both
commodities.
In 1997-2007, the export value of
Palm Oil and Its Fraction product (HS
1511) from Indonesia to the world
reached 2.7 billion US$ and increased to
15.4 billion US$ in 2008-2018, which is
a growth of 466%. The reason for the
increasing of the export value of Palm
Oil and Its Fraction product is the
especially high demand by the two
biggest importers of its commodity,
China and India. These countries use
The Progressive Export Tax and Indonesia's Palm Oil ..., Immanuel, Suharno, Amzul Rifin | 219
CPO for the production of Biodiesel
(Immanuel et al, 2018).
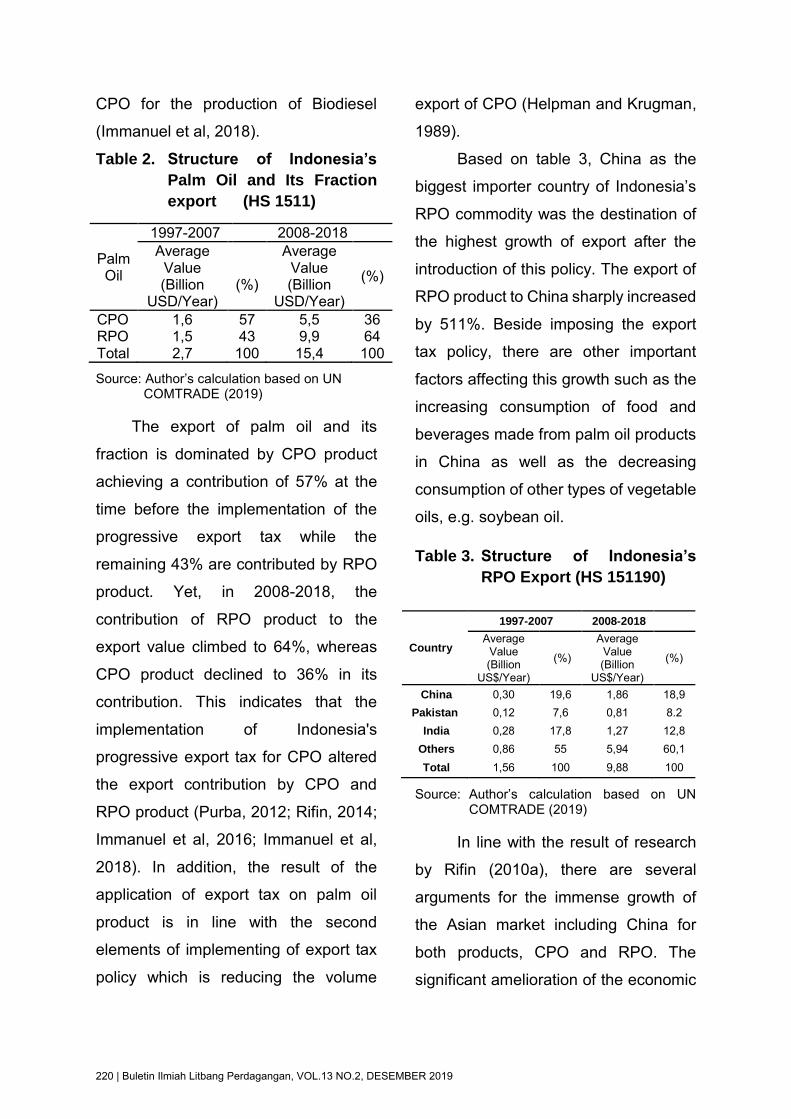
Table 2. Structure of Indonesia’s
Palm Oil and Its Fraction
export (HS 1511)
Source: Author’s calculation based on UN COMTRADE (2019)
The export of palm oil and its
fraction is dominated by CPO product
achieving a contribution of 57% at the
time before the implementation of the
progressive export tax while the
remaining 43% are contributed by RPO
product. Yet, in 2008-2018, the
contribution of RPO product to the
export value climbed to 64%, whereas
CPO product declined to 36% in its
contribution. This indicates that the
implementation of Indonesia's
progressive export tax for CPO altered
the export contribution by CPO and
RPO product (Purba, 2012; Rifin, 2014;
Immanuel et al, 2016; Immanuel et al,
2018). In addition, the result of the
application of export tax on palm oil
product is in line with the second
elements of implementing of export tax
policy which is reducing the volume
export of CPO (Helpman and Krugman,
1989).
Based on table 3, China as the
biggest importer country of Indonesia’s
RPO commodity was the destination of
the highest growth of export after the
introduction of this policy. The export of
RPO product to China sharply increased
by 511%. Beside imposing the export
tax policy, there are other important
factors affecting this growth such as the
increasing consumption of food and
beverages made from palm oil products
in China as well as the decreasing
consumption of other types of vegetable
oils, e.g. soybean oil.
Table 3. Structure of Indonesia’s
RPO Export (HS 151190)
Source: Author’s calculation based on UN COMTRADE (2019)
In line with the result of research
by Rifin (2010a), there are several
arguments for the immense growth of
the Asian market including China for
both products, CPO and RPO. The
significant amelioration of the economic
Palm Oil
1997-2007 2008-2018 Average
Value (Billion
USD/Year)
(%)
Average Value (Billion
USD/Year)
(%)
CPO 1,6 57 5,5 36 RPO 1,5 43 9,9 64 Total 2,7 100 15,4 100
Country
1997-2007 2008-2018
Average Value (Billion
US$/Year)
(%)
Average Value (Billion
US$/Year)
(%)
China 0,30 19,6 1,86 18,9 Pakistan 0,12 7,6 0,81 8.2
India 0,28 17,8 1,27 12,8 Others 0,86 55 5,94 60,1 Total 1,56 100 9,88 100
220 | Buletin Ilmiah Litbang Perdagangan, VOL.13 NO.2, DESEMBER 2019

condition in China encouraged the
demand for palm oil products
particularly in regard to the food and
oleo-chemical industry.
Table 4. Structure of Indonesia’s
CPO Export (HS 151110)
Source: Author’s calculation based on UN COMTRADE (2019)
A positive effect on Indonesia’s
Palm Oil export to China can also be
seen in the abolishing of China’s Tariff
Rate Quota (TRQ) for some
commodities including Palm Oil in 2006
and the import tariff of palm oil product
with a specified quantity being charged
a low tariff (Hsu & Tuan 2001). The Free
Trade Agreement (FTA) also had a
significant impact on Indonesia's palm
oil export value to China. According to
Pujiati (2014), after the China ASEAN
Free Trade Agreement (CAFTA) the
procurement of palm oil from trade
partner countries increased. In other
words, China imported more palm oil
from Indonesia being the biggest
exporter of this commodity. Besides this,
the growth of Indonesia’s RPO export
after the implementation of the
progressive export tax might be
influenced by the development of the
refinery industry in the main destination
countries such as India and Pakistan.
Referring to Kania (2014), black
campaigns for Indonesia’s Palm Oil
products in countries of the European
Union led to a switching of the market
from Europe to Asia. Hence, in
reference to table 4, the export share to
the Netherlands decreased from 15,3%
to 11,8% while the export share to India
increased from 39,9% to 51,2%.
The Comparative Advantage for
Indonesia’s CPO and RPO
Commodities
The comparative advantage of
palm oil commodities can be measured
by the RCA method. Table 5 shows the
RCA values for the top three largest
importing countries of Indonesia’s CPO
and RPO products. Generally, the
comparative advantage of Indonesia’s
CPO to the main destination countries
has a very strong value especially in the
Netherlands with an average RCA value
reaching 77,01 within period 1997-2007.
Country
1997-2007 2008-2018
Average Value (Billion
US$/Year)
(%)
Average Value (Billion
US$/Year) (%)
India 0,46 39,9 2,81 51,2
Netherland 0,18 15,3 0,65 11,8
Malaysia 0,10 8,4 0,46 8,4 Others 0,42 36,4 1,58 28,6 Total 1,16 100 5,50 100
The Progressive Export Tax and Indonesia's Palm Oil ..., Immanuel, Suharno, Amzul Rifin | 221

Table 5. Indonesia’s RCA value for
CPO (HS 151110) to selected
countries from 1997-2007
compare with 2008-2018
Source: Author’s calculation based on UN COMTRADE (2019)
In accordance with Nugroho
(2014), the export growth of CPO to the
Netherlands and India was induced by
the increased demand of the cooking oil
industry and also by the higher demand
for the derivative products of the CPO
industry, such as lotion and soap.
Looking at Indonesia RCA value to the
Malaysia, several arguments can be
brought forward to support the result
presented in the table. Firstly, Malaysia
is an exporter of CPO and since 2002
this country also has CPO plantations of
around 250,000 hectares in Indonesia to
provide the necessary raw material for
the RPO Industry in Malaysia. Secondly,
this country also imports CPO from
Indonesia to support the need for raw
material of CPO of the RPO industry
although Malaysia possesses palm oil
plantations (Rifin, 2010b).
An effect of the enactment of the
progressive export tax policy consisted
in the reduction of the movement of
Indonesia's CPO export value.
Comparing the RCA values in figure 5,
we can obtain the diminishing points of
the comparative advantage of CPO due
to the implementation of the progressive
export tax policy. In other words, the
implementation of this policy led the
changing of structure of Indonesia’s
CPO export into derivatives products
(Syadullah, 2014).
Figure 5. The Graphic of RCA Value
of Indonesia’s CPO (1997-
2018)
Source: Author’s calculation
The trend of the RCA value of the
top three destination countries goes
down after 2007. After 2007 as the year
which was chosen to divide the
observation time of this study, it was
predictable that the export of CPO to the
potential markets would decrease after
the introduction of the progressive
export tax. According to Obado et al
(2009), it can be affirmed that the export
tax policy reduced the competitiveness
Country Average RCA of CPO
1997-2007 2008-2018
India 27,18 27,29 Netherland 77,01 49,08 Malaysia 29,81 16,21
222 | Buletin Ilmiah Litbang Perdagangan, VOL.13 NO.2, DESEMBER 2019
of the Indonesian palm oil industry which
was detrimental to the producers of
CPO.
The comparative advantage of
Indonesia’s RPO can be explained by
comparing the average RCA value in
table 6. This can clearly be seen by the
RCA value of each importing country
being higher than one in the period
between 1997 and 2018.
China has a positive growth shown
by the fact that the share of RPO
commodity in the total export from
Indonesia to China is higher than the
average share of the world export of
RPO to China in all world exports to this
country. The stability of growth of the
export of RPO to China during this time
has a robust impact on the level of the
comparative advantage of RPO.
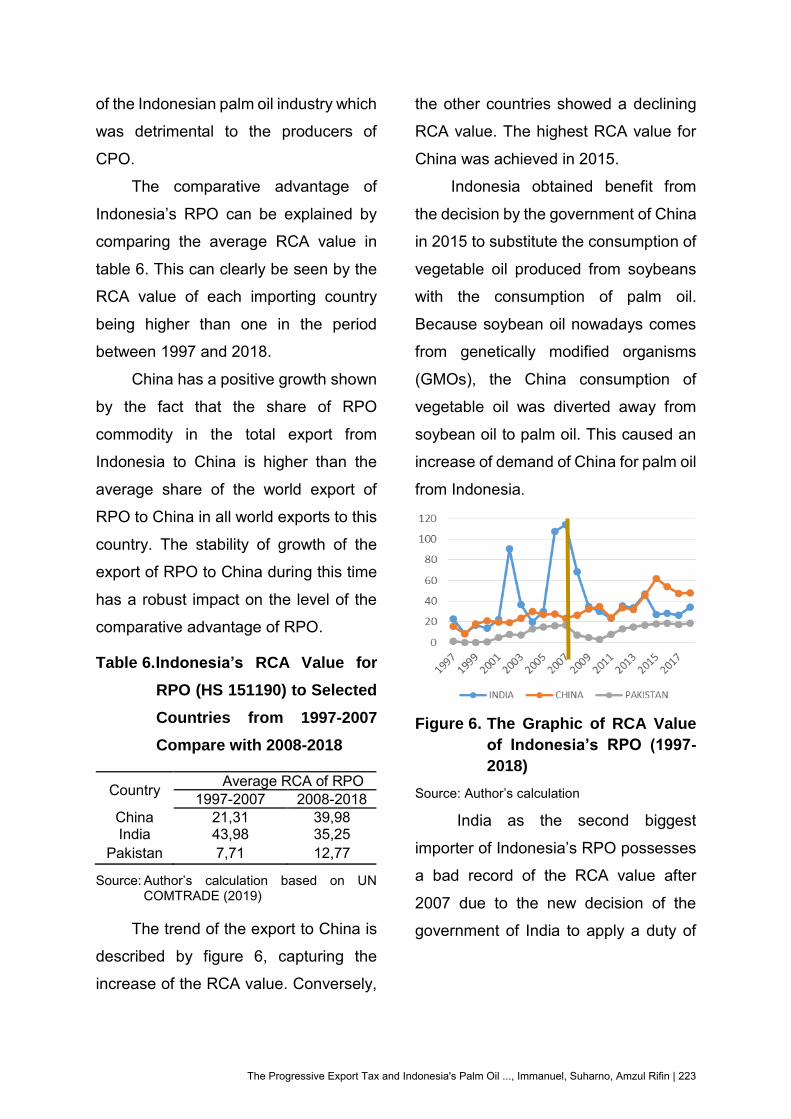
Table 6. Indonesia’s RCA Value for
RPO (HS 151190) to Selected
Countries from 1997-2007
Compare with 2008-2018
Country Average RCA of RPO 1997-2007 2008-2018
China 21,31 39,98 India 43,98 35,25
Pakistan 7,71 12,77
Source: Author’s calculation based on UN COMTRADE (2019)
The trend of the export to China is
described by figure 6, capturing the
increase of the RCA value. Conversely,
the other countries showed a declining
RCA value. The highest RCA value for
China was achieved in 2015.
Indonesia obtained benefit from
the decision by the government of China
in 2015 to substitute the consumption of
vegetable oil produced from soybeans
with the consumption of palm oil.
Because soybean oil nowadays comes
from genetically modified organisms
(GMOs), the China consumption of
vegetable oil was diverted away from
soybean oil to palm oil. This caused an
increase of demand of China for palm oil
from Indonesia.
Figure 6. The Graphic of RCA Value
of Indonesia’s RPO (1997-
2018)
Source: Author’s calculation
India as the second biggest
importer of Indonesia’s RPO possesses
a bad record of the RCA value after
2007 due to the new decision of the
government of India to apply a duty of
The Progressive Export Tax and Indonesia's Palm Oil ..., Immanuel, Suharno, Amzul Rifin | 223

7,5% on the import of CPO and
Soybean oil.
India’s import duty trimmed the
supply of palm oil from Indonesia to
India. Meanwhile, the RCA value to
Pakistan slowly decreased beginning
from 2008 because of the agreement
between the governments of Pakistan
and Malaysia to sign the Preferential
Trade Agreement (PTA) in November
2007 to cut the price of palm oil products
imported from Malaysia by a 10%
discount of the duty. This agreement
encouraged Pakistan to move from
Indonesia’s palm oil to Malaysia’s
product. Thereby, Indonesia’s palm oil
exports decreased beginning from 2007
to 2010 and it is reflected by a declining
of the RCA value. This problem was
solved by the government of Indonesia
by following the same strategy to make
an agreement with Pakistan in 2009.
Indonesia and Pakistan agreed to sign a
PTA in March 2009 to reduce 10% of its
import duty on Indonesia’s CPO product
(Rifin, 2010a).
Competitive Advantage for
Indonesia’s CPO and RPO
Commodities
By using the sample data of the
main destination countries of CPO or
RPO commodity, is possible to analyze
the extent of the competitive advantage
of these products to those countries.
The result of the EPD method for the
CPO product is shown in table 7.
The estimation result in table 7
describes that the overall position of
CPO’s market share has to be classified
as Lost Opportunity within 2008-2018,
except for Netherland which is stable on
Retreat. This means that under these
circumstances the export share value of
CPO commodity decreased
(Estherhuizen, 2006). This position was
unexpected and Indonesia lost the
chance to expand the cover area of this
product in the international market. The
result might indicate that the influence of
the progressive exports tax of CPO in
Indonesia changed the level of
competitive advantage of CPO product.
In the period from 1997 to 2007, some
countries still have a higher level of
competitiveness i.e. India and Malaysia
having a Rising Star position.
Meanwhile, Netherland’s position was
not altered and stayed in the position of
Retreat.
224 | Buletin Ilmiah Litbang Perdagangan, VOL.13 NO.2, DESEMBER 2019
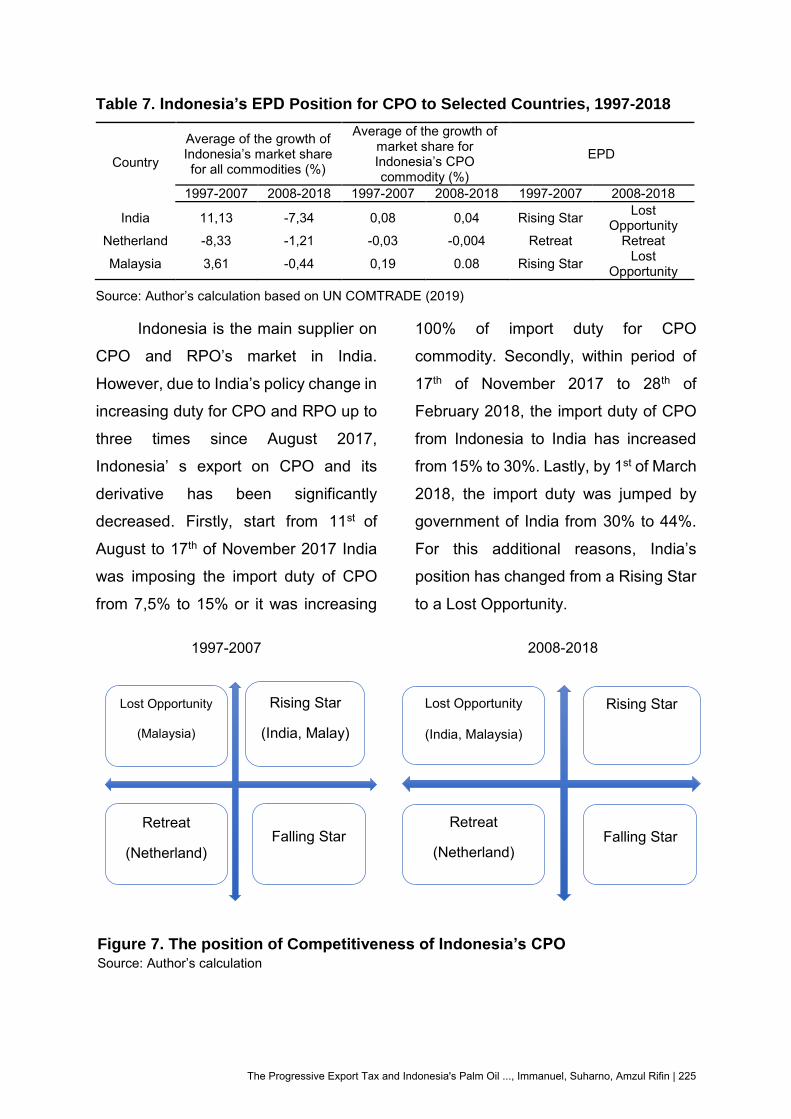
Table 7. Indonesia’s EPD Position for CPO to Selected Countries, 1997-2018
Country
Average of the growth of Indonesia’s market share for all commodities (%)
Average of the growth of market share for Indonesia’s CPO commodity (%)
EPD
1997-2007 2008-2018 1997-2007 2008-2018 1997-2007 2008-2018
India 11,13 -7,34 0,08 0,04 Rising Star Lost Opportunity
Netherland -8,33 -1,21 -0,03 -0,004 Retreat Retreat
Malaysia 3,61 -0,44 0,19 0.08 Rising Star Lost Opportunity
Source: Author’s calculation based on UN COMTRADE (2019)
Indonesia is the main supplier on
CPO and RPO’s market in India.
However, due to India’s policy change in
increasing duty for CPO and RPO up to
three times since August 2017,
Indonesia’ s export on CPO and its
derivative has been significantly
decreased. Firstly, start from 11st of
August to 17th of November 2017 India
was imposing the import duty of CPO
from 7,5% to 15% or it was increasing
100% of import duty for CPO
commodity. Secondly, within period of
17th of November 2017 to 28th of
February 2018, the import duty of CPO
from Indonesia to India has increased
from 15% to 30%. Lastly, by 1st of March
2018, the import duty was jumped by
government of India from 30% to 44%.
For this additional reasons, India’s
position has changed from a Rising Star
to a Lost Opportunity.
Lost Opportunity
(Malaysia)
Falling Star Retreat
(Netherland)
Rising Star
(India, Malay)
1997-2007
Lost Opportunity
(India, Malaysia)
Falling Star Retreat
(Netherland)
Rising Star
2008-2018
Figure 7. The position of Competitiveness of Indonesia’s CPO Source: Author’s calculation
The Progressive Export Tax and Indonesia's Palm Oil ..., Immanuel, Suharno, Amzul Rifin | 225

The Netherlands is the biggest
importer of CPO among the European
Union (EU) countries because of the
existence of the port of Rotterdam as the
center of CPO exports in Europe. As the
price of CPO is cheaper than another
vegetable oils, the supply of palm oil
products significantly affects European
economics (PASPI, 2014).
The Increasing of consumption of CPO
in the EU has influenced the increasing
of EU's dependence on CPO
commodity. To overcome it, EU
countries developed other vegetable oils
such as Rapeseed, soybean oil, canola
oil, and sunflower oil and they
conducted a black campaign against
CPO (Kania, 2014).
The issue of negative campaign
on the Indonesian palm oil products in
the world market particularly the EU due
to many forest fires in Indonesia during
the second half of 2015 (Immanuel et al,
2016). Recently, the EU Commission,
acknowledge in a platform of
Renewable Energy Directive (RED) II or
delegated act, had decided that palm oil
cultivation causes significant
deforestation, and thus Biodiesel
produced from palm oil cannot be
counted towards meeting ET green fuel
targets (IIASA 2015). Furthermore, the
EU Parliament and national
governments agreed to phase out the
use of the highest emitting biofuels or
high Indirect Land Use Change (ILUC)
risk biofuel by 2030.
Indonesia’s CPO should prove
that its meet three pillars of sustainability
to cope an issue of black campaign. In
other words, CPO products which
exported should be completed by palm
oil certification that is recognized by
imported countries. Certification of CPO
product, part of Technical Barrier to
Trade, would impede the export trade
flow of Indonesian CPO (Sari, 2015).
Malaysia, one of the world’s
largest palm oil exporter, has imported
CPO from Indonesia. Palm oil
production in Malaysia has increased
over the years in line with the
development of the industry of refining
of CPO. On 1997, the production of
CPO in Malaysia reached 8,5 million
tons, it sharply increased to 20,5 million
tons on 2018. The growth in CPO
production in Malaysia had affected
import CPO from Indonesia which can
be showed by the shifting Malaysia’s
position from a Rising Star to a Lost
Opportunity.
Based on table 8, Indonesia’s
RPO commodity has a better position
226 | Buletin Ilmiah Litbang Perdagangan, VOL.13 NO.2, DESEMBER 2019

compared with CPO in terms of the level
of competitive advantage. The position
of RPO product in China upgraded from
Falling Star position to Rising Star.
The average value of the growth of
Indonesia’s market share for all
commodities to China increased from
1.63% to 3.43%.
Table 8. Indonesia’s EPD Value for RPO to Selected Countries 1997-2018
Source: Author’s calculation based on UN COMTRADE (2019)
In addition, the average of the
growth of market share of Indonesia’s
RPO commodity to China also
increased from -0.03% to 0.02%. As
mentioned before, since China ASEAN
Free Trade Agreement (CAFTA), the
purchasing value of Palm Oil product
from Indonesia tends to enhance that
the commodity mostly used as an
industrial cooking oil for instant noodle,
potato snack food, fried chicken, and
other traditional snacks.
Country
Average of the growth of
Indonesia’s market share for all
commodities (%)
Average of the growth of market
share for Indonesia’s RPO commodity (%)
EPD
1997-2007 2008-2018
1997-2007
2008-2018 1997-2007 2008-2018
China 1,63 3,43 -0,03 0,02 Falling Star Rising Star
India 21,50 -15,04 0,08 0,04 Rising Star Lost Opportunity
Pakistan 4,26 2,51 0,17 0,11 Rising Star Rising Star
Figure 8. The position of competitiveness of Indonesia’s RPO Source: Author’s calculation
Lost Opportunity
Falling Star
(China)
Retreat
Rising Star (Pakistan,
India)
1997-2007
Lost Opportunity
(India)
Falling Star Retreat
Rising Star (China,
Pakistan)
2008-2018
The Progressive Export Tax and Indonesia's Palm Oil ..., Immanuel, Suharno, Amzul Rifin | 227

Palm Oil export from Indonesia to
China has shown significant growth as
China decreased soybean import from
the US following the trade war between
the two countries. Palm oil import from
Indonesian climbed 63% to 541.81
thousand tons on October 2018 from
332.52 thousand tons on September
2018. This circumstances drive a
China’s position from a Falling Star to a
Rising Star.
India, one of Indonesia’s largest
markets for RPO shipments, had
decided to raise import duties on RPO
from 15% on August 2017 to 25% on
November 2017, then it up to 40% on
December 2017. Lastly, the import duty
increased to 54% on March 2018.
Eventually, both tariffs, progressive
export tax and import duty had changed
the position of Indonesian RPO in India
market from a Rising Star to a Lost
Opportunity.
The competitiveness of export of
Indonesian RPO to Pakistan stable on a
Rising Star position. However, the level
of competitiveness in both sides decline.
It falls amount to 1,75% in the average
value of the growth of Indonesia’s
market share for all commodities to
Pakistan and it also drops amount to
0,06% in the average of the growth of
market share of Indonesia’s RPO
commodity to Pakistan. As a hub
country in the middle east and south
east Asia, Pakistan expected to become
the new backbone of Indonesia Palm Oil
exports. In other words, the government
of Indonesia needs to protect the market
share of palm oil export to Pakistan by
accelerate the ratification process of
PTA that it will benefits one of
Indonesia’s RPO product.
CONCLUSION AND POLICY
RECOMMENDATIONS
The progressive export tax export
successfully detracted the volume
export of CPO and increased the
volume export of RPO. Since The
government of Indonesia applied the
progressive export tax of Palm Oil
products, it was followed by a decrease
in the export share of CPO amount to
21% which has moved to an increase in
the export share of RPO and also the
change in the level of competitiveness of
CPO product from Rising Star to Lost
Opportunity in particular for RPO’s
market to India and Malaysia.
Meanwhile, Netherland’s position was
not altered and stayed in the position of
Retreat. In contrast, RPO’s market to
China had a better position from Falling
Star to Rising Star. For Pakistan’s
228 | Buletin Ilmiah Litbang Perdagangan, VOL.13 NO.2, DESEMBER 2019

market, although there were declining of
the level of competitiveness, Pakistan’s
position was stable in the position of
Rising Star. RPO’s competitiveness
decreased in India’s market from a
Rising Star to a Lost Opportunity.
Besides the implementation of
Indonesia’s progressive export tax of
Palm Oil and its derivative products,
several conditions influenced the
decreased of the supply of Indonesia’s
CPO to the international market and
increased the export of RPO product
derived from CPO product such as the
trade agreement with the destination
countries especially with Pakistan,
import duties of CPO and RPO products
in India, trade war between China and
US, negative campaign against palm oil
by EU countries and also the
development of production of
Malaysian Palm Oil. In addition, the flow
of exports was not only affected by the
implementation of this policy, but also by
several other factors such as, the
international price and the changing of
the preference between the types of
vegetable oil.
Under the revised export duty
structure, the competitiveness of both
commodities also changed in terms of
comparative and competitive
advantage. In this article, it became
evident that Indonesia missed the level
of comparative and competitive
advantage of CPO product which is
shown in the movement of the market
share of the top three destination
countries. However, there was also a
positive impact in regards to the China
market particularly for RPO product of
which the average of the growth of
market share still increases.
Government intervention in
enhancing Palm Oil competitiveness,
namely Indonesia Sustainable Palm Oil
(ISPO) revamping program, a
ratification process on PTA with
Pakistan, and demand creation market
of CPO such as Biodiesel and Green
diesel program in local market are
continuously to be applied.
Moreover, new market
penetration into non-traditional markets
could also be an option to expand the
export share of Indonesia’s CPO
product in the international market. In
addition, it might be better to set up one
special board particular for palm oil
sector hence Indonesian government
much easier to control the whole internal
system starts from upstream to
downstream sector of palm oil.
Furthermore, these board can be
The Progressive Export Tax and Indonesia's Palm Oil ..., Immanuel, Suharno, Amzul Rifin | 229

focused to acquire more non-traditional
markets by setting special export tariff’s
structure as well as accelerate domestic
market creation.
ACKNOWLEDMENT
The authors thank the Ministry of
Trade Republic of Indonesia and
German Academic Exchange Service
(DAAD) Scholarship for the support and
sponsorship on dual degree program
between Bogor Agricultural University
and the University of Goettingen.
REFERENCES
Abdulla, I., Arshad, M, F., Bala, B, K., Noh, M, K., Tasrif, M. (2014). Impact of CPO Export Duties On Malaysian Palm Oil Industry. American Journal of Applied Sciences 11 (8): 1301-1309.
Bappenas. (2009). Trade and Investment in Indonesia: A Note on Competititveness and Future Challenge. Jakarta: Bappenas.
Chen, J., Buwajian, A. (2012). Analysis of China’s Agricultural Exports to Five Asian Countries. Management Science and Engineering. Volume 6, No. 2: 96-102. 2012.
Elryah, Y. (2014). Back to the Agriculture - The Development of The Comparative Advantage Of Sudan’s Commodities. Xiamen University Xiamen, P. R. China. January 2015.
Estherhuizen, D. (2006). Measuring and Analyzing Competitiveness in The Agribusiness Sector: Methodological and Analytical Framework. University of Pretoria.
Feenstra, R. C., & Taylor, A. M. (2008). International economics. New York: Worth Publishers.
Hafizah, D. (2011.) Study on Indonesian government policy on CPO trade
using market integration approach. Journal of AGRISEP, pp. 10(2). September 2011.
Hasan, Mohamad F, Reed, Michael R, Marchant, Mary A. (2001). Effects of an Export Tax on Competitiveness: The Case of the Indonesian Palm Oil Industry. Journal of Economic Development. Vol. 26 No 2. December 2001.
Hassan, U, M, R. (2013). An Analysis of Competitiveness of Pakistan’s Agricultural Export Commodities. Journal of Business and Management. Vol. 11, Issue 5: 29-34. July- August 2013.
Hasibuan, A., Nurmalina, R., Wahyudi, A. (2012). Analysis of Performance And Competitiveness of Indonesian Cocoa And Its Intermediate Products In The International Market. RISTRI Buletin Volume 3, No 1. 2012
Helpman, E., Paul R.K. (1989). Trade Policy and Market Structure. Cambridge: MIT Press.
Hsu, H.H. & F. tuan. (2001). China’s Accession to WTO Would Boost of Edible Oils. Paper Presented at the WCC-101 Conference, Sonoma, California, USA., April 8-10, 2001.
Immanuel., Khaliqi, M., Amiruddin, A. (2016). The effect of estate-crop fund on Indonesia’s crude palm oil export competitiveness. Proceeding International Conference Strengthening Indonesian Agribusiness: Rural Development and Global Market Linkages. Department of Agribusiness, Bogor Agricultural University in collaboration with NICHE NUFFIC Programme-The Netherlands. April 2016.
Immanuel., Rifin, A., Suharno. (2018). Price Transmission and The Effect of Indonesia’s Export Tax on Crude Palm Oil Prices. Master Thesis. Postgraduate School, Bogor Agricultural University, Bogor; Indonesia.
230 | Buletin Ilmiah Litbang Perdagangan, VOL.13 NO.2, DESEMBER 2019

International Institute for Applied Systems Analysis. (2015). The Land Use Change of Biofuels Consumed in The EU, Quantification of Area and Greenhouse Gas Impacts. October 2015. Retrieved from https://ec.europa.eu/energy/sites/ener/files/documents/Final%20Report_GLOBIOM_publication.pdf
Kanaya I, A., Firdaus, M. (2014). Daya saing dan permintaan ekspor produk biofarmaka Indonesia di negara tujuan utama periode 2003-2012. Jurnal Manajemen dan Agribisnis. Volume 11 No.3. November 2014
Kania, A. (2014). Analysis of Competitiveness and Determinants of Indonesian CPO Export to India and Netherlands. Bachelor Thesis. Agribusiness Department, Bogor Agricultural University, Bogor; Indonesia.
Mulatsih, S., Putri, R.N. (2017). Analysis of Indonesian Men’s Apparel Exports to Seven Countries in European Union. Proceedings of the 2nd International Conference on Indonesia Economy and Development (ICIED 2017). Advances in Social Sciences, Education and Humanities Research (ASSEHR), Volume 126. August 2017.
Ningsih, A. (2013). Analysis of Competitiveness and Factors that Affect The Demand of Indonesian Essential Oils in Export Country. Bachelor thesis. Economy Science Department, Bogor Agricultural University, Bogor; Indonesia.
Nurcahyani, M., Masyhuri, Hartono S. (2018). The Export Supply of Indonesian Crude Palm Oil (CPO) to India. Journal of Agro Economy of Gajah Mada University Volume 29 No.1. June 2018
Nugroho, S. (2014). Analysis of Affecting Factors in Indonesia’s Crude Palm Oil and Palm Kernel Oil Export. Bachelor thesis. Resource and Environment
Economy Department, Bogor Agricultural University, Bogor; Indonesia.
Obado, J., Syaukat, Y., Siregar, H. (2009). The Impacts of Export Tax Policy On The Indonesian Crude Palm Oil Industry. Journal International Society for Southeast Asian Agricultural Sciences. Volume. 15 No. 2: 107-119. November 2009.
Palm Oil Agribusiness Strategic Policy Institute - PASPI. (2014). The Sustainability of Indonesian Palm Oil Industry. Bogor: PASPI.
Prasetyo, A., Marwanti, S., Darsono. (2017). Comparative Advantage and Export Performance of Indonesian Crude Palm Oil in International Markets. Journal of Agro Economy of Sebelas Maret University. Volume 35 No. 2. October 2017.
Porter, M. E. (1990). The Competitive Advantage of Nations. Harvard Business Review. Massachusetts (US): Harvard University.
Pujiati, R. (2014). The Impact of Free Trade Agreements on Commodity Trade Flows (Case Study: International Palm Oil Trade). Master Thesis. Postgraduate School, Bogor Agricultural University, Bogor; Indonesia.
Purba J, H, V. (2012). The Impact of Export Tax-Crude Palm Oil on Cooking Oil Industry in Indonesia. PhD Thesis. Postgraduate School, Bogor Agricultural University, Bogor; Indonesia.
Rachman, A. (2012). Market Integration and Price Transmission on the CPO and cooking oil markets in Indonesia. Master Thesis. Postgraduate School, Bogor Agricultural University, Bogor; Indonesia.
Rifin, A. (2010a). Export Competitiveness of Indonesia’s Palm Oil Product. Trends in Agriculture Economics, 3(1), 1-18.
Rifin, A. (2010b). The Effect of Export Tax on Indonesia’s Crude Palm Oil (CPO)
The Progressive Export Tax and Indonesia's Palm Oil ..., Immanuel, Suharno, Amzul Rifin | 231

Export Competitiveness. ASEAN Economic Bulletin 27, 1-18.
Rifin, A. (2012). The Impact of Export Tax Policy on Cocoa Farmers and Supply Chain In Indonesia. The International Trade Journal Volume 29. No. 1. January 2015.
Rifin, A. (2014). The Effect of Crude Palm Oil Export Tax on Export and Prices. ASEAN Journal of Economics, Management, and Accounting 2 (1&2). November 2014.
Salvatore, D. (1997). Ekonomi internasional. Jakarta (ID): Erlangga
Sari, A.R. (2015). Analysis of Non-Tariff Measures on Export of Indonesian Crude Palm Oil (CPO) to the Main Export Destinations. Master Thesis. Postgraduate School, Bogor Agricultural University, Bogor; Indonesia.
Setyawati, D. (2015). The Prospect of Indonesian Export Product to Peru and Factors Affecting Its Trade Flow to South America. Master Thesis. Postgraduate School, Bogor Agricultural University, Bogor; Indonesia.
Statista. (2019). Statistical Data. Accessed
March 2019 at https://www.statista.com/statistics/263937/vegetable-oils-global-consumption/
Sunardi, D. (2015). Analysis of Competitiveness and Determinants Export of Priority Commodities from Indonesia to Organization of Islamic Cooperation (OIC). Master Thesis. Postgraduate School, Bogor Agricultural University, Bogor; Indonesia.
Syadullah, M. (2014). Impact Tax Policy on CPO Exports. Center of Policy of Macro Economy Ministry of Finance. Volume 18 No. 3. December 2018
United Nations Statistical Division. (2019). Tade Data (UN Comtrade) [Data file]. Retrieved from https://comtrade.un.org/data/
Wiranthi, P.E., Mubarok, F. (2017). Competitiveness and The Factors Affecting Export of The Indonesia Canned Pineapple In The World and The Destination Countries. 2nd International Conference on Sustainable Agriculture and Food Security: A Comprehensive Approach. Volume 2017. November 2017
232 | Buletin Ilmiah Litbang Perdagangan, VOL.13 NO.2, DESEMBER 2019