the proposed corrib onshore system - cymcym.ie/documents/accufacts.pdf · the proposed corrib...
TRANSCRIPT

Accufacts Inc.
“Clear Knowledge in the Over Information Age”
The Proposed Corrib Onshore SystemAn Independent Analysis
Prepared for the Centre for Public Inquiry
By
Richard B. Kuprewicz
President, Accufacts Inc.
October 24, 2005
This document is based on an evaluation of information
readily available in the public domain
Table of ContentsI. EXECUTIVE SUMMARY ....................................................................................................................................1
II. THIS ISN’T A “NORMAL” ONSHORE NATURAL GAS PIPELINE..........................................................2
PRODUCTION PIPELINES.............................................................................................................................................3
TRANSMISSION PIPELINES .........................................................................................................................................3
DISTRIBUTION PIPELINES...........................................................................................................................................3
GAS PROCESSING/TREATMENT PLANT AKA TERMINAL ...........................................................................................4
THE MODEL ONE SYNDROME....................................................................................................................................4
III. ONSHORE PIPELINE DESIGN KEY ISSUES.................................................................................................6
PRESSURE AND SMYS (SPECIFIED MINIMUM YIELD STRENGTH) ...........................................................................6
GAS COMPOSITION.....................................................................................................................................................8
Wet Gas Versus Dry Gas......................................................................................................................................8
Gas Components Other Than Methane ...............................................................................................................8
TEMPERATURE ...........................................................................................................................................................8
CORROSION ISSUES ....................................................................................................................................................8
Internal Corrosion................................................................................................................................................9
External Corrosion.............................................................................................................................................12
GAS VELOCITY AND PIPE EROSION.........................................................................................................................13
ABNORMAL LOADING ISSUES..................................................................................................................................13
PIPELINE SAFETY EQUIPMENT.................................................................................................................................14
THE DIFFERENCE BETWEEN BASE DESIGN AND FUTURE OPERATION...................................................................15
IV. ONSHORE PIPELINE ROUTING ISSUES .....................................................................................................16
PROXIMITY TO POPULATION....................................................................................................................................16
UNDERSTANDING PIPELINE RELEASES....................................................................................................................16
A REALITY CHECK ON UNDERSTANDING GAS PIPELINE RUPTURES......................................................................17
CORRIB PIPELINE RUPTURE IMPACT ZONE .............................................................................................................20
SENSITIVE WATERWAYS..........................................................................................................................................24
V. PIPELINE CONSTRUCTION ISSUES.............................................................................................................25
THE THICK-WALLED PIPE CONUNDRUM ................................................................................................................25
GIRTH WELD INSPECTION AND INTEGRITY TESTING..............................................................................................26
VI. OPERATIONAL AND MAINTENANCE ISSUES OF CONCERN .............................................................26
CORROSION MONITORING PROGRAM......................................................................................................................26
SMART PIGGING AND THICK-WALLED PIPE............................................................................................................27
THIRD PARTY DAMAGE CONCERNS ........................................................................................................................27
REMOTE MONITORING OF PIPELINES ......................................................................................................................28
THE ILLUSIONS OF LEAK DETECTION......................................................................................................................28
VII. THE MYTH OF HIGHEST INTERNATIONAL STANDARDS ..................................................................30
MAJOR DIFFERENCES IN INTERNATIONAL STANDARDS .........................................................................................30
THE STANDARD DRIVING THIS PIPELINE................................................................................................................30
MISPERCEPTIONS AND MISAPPLICATIONS OF QRA................................................................................................31
VIII. WHY THE CORRIB GAS MUST BE TREATED...........................................................................................31
THE MAJOR CONTAMINANTS ..................................................................................................................................32
KEY EQUIPMENT ......................................................................................................................................................32
COLD VENTING ........................................................................................................................................................34
FLARING ISSUES.......................................................................................................................................................34
MORE TO COME........................................................................................................................................................35
IX. IS THE GAS PROCESSING PLANT SITE DRIVING THE PIPELINE ROUTE?...................................35
IN PIPELINE ROUTING, THE SHORTEST PATH IS SELDOM THE CHEAPEST ..............................................................35
LAND USE PLANNING ..............................................................................................................................................36

ii
X. ADVICE FOR GOVERNMENT, PUBLIC, AND REGULATORY AUTHORITIES................................36
VARIOUS OFFSHORE VS. ONSHORE OPTIONS..........................................................................................................36
Option 1 Deep Water Offshore Processing Platform Located at Corrib Field.............................................36
Option 2 Shallow Water Processing Platform with Processing Near Shore.................................................37
Option 3 Onshore Processing Plant ...............................................................................................................37
DANGERS ASSOCIATED WITH RETROFITTING NEW PROCESSES ONTO OLD SITES................................................38
THE FAILURE AND MISAPPLICATION OF QRA ........................................................................................................38
ENVIRONMENTAL FACTORS AND LONG TERM EFFECTS.........................................................................................38
THIRD WORLDING AND THE MISUSE OF LAND .......................................................................................................39
LIABILITY AND FINANCIAL IMPACTS OF POOR RISK MANAGEMENT .....................................................................39
XI. CONCLUSION AND RECOMMENDATIONS ...............................................................................................40
XII. BIBLIOGRAPHY .................................................................................................................................................41
Table of Figures
FIGURE 1. GAS PIPELINE SUPPLY SYSTEM - SIMPLIFIED FLOW SCHEME 2FIGURE 2. CORRIB PIPELINE DESIGN BASIS 4FIGURE 3. ONSHORE PIPELINE ROUTE THROUGH ROSSPORT 5FIGURE 4. INTERNAL CORROSION RATE ESTIMATES VS. TEMPERATURE 9FIGURE 5. PIPE FAILURE HOOP STRESS VS. CORROSION FLAW SIZE – CO2 INTERNAL
CORROSION RATE OF 2.5 MM/YR (0.098 INCH/YR) 9FIGURE 6. CORRIB PIPELINE IN OUTSIDE STORAGE 11FIGURE 7. PIPE FAILURE HOOP STRESS VS. CORROSION FLAW SIZE – EXTERNAL
CORROSION RATE OF 0.254 MM/YR (0.0098 INCH/YR) 13FIGURE 8 AREA LANDSLIDES 14FIGURE 9. CARLSBAD, NEW MEXICO NATURAL GAS TRANSMISSION PIPELINE RUPTURE 18FIGURE 10. CARLSBAD PIPELINE RUPTURE, THE AFTERMATH 19FIGURE 11 CARLSBAD RUPTURE CRATER 19FIGURE 12. CORRIB ONSHORE PIPELINE RUPTURE THERMAL FLUX VS. DISTANCE FROM
PIPELINE 150 BAR CASE 21FIGURE 13. CORRIB ONSHORE PIPELINE RUPTURE THERMAL FLUX VS. DISTANCE FROM
PIPELINE 345 BAR CASE 21FIGURE 14. “TIME TO” FOR VARIOUS THERMAL FLUXES ON PEOPLE AND WOODEN
STRUCTURES 22FIGURE 15. ROSSPORT 400 METRE RUPTURE IMPACT ZONE 24FIGURE 16. SRUWADDACON BAY 24FIGURE 17. LOOKING FROM SRUWADDACON BAY 26FIGURE 18. CORRIB PROPOSED ONSHORE GAS PROCESSING PLANT BASIC PROCESS FLOW
SCHEME 32FIGURE 19. GAS PLANT SITE LOOKING TOWARD CARROWMORE LAKE 33FIGURE 20. LOOKING WEST ONTO BAY AND PIPELINE ROUTE TO PLANT 34
TABLE 1. BASIC CORRIB GAS FIELD DEVELOPMENT OPTIONS 37
I. Executive Summary
Accufacts Inc. was commissioned by the Centre for Public Inquiry to perform an independent
review of the onshore proposals for the Corrib pipeline project, specifically the onshore
production pipeline and the gas processing plant at its terminus. All analyses in this report were
developed from information supplied in the many referenced public documents concerning this
very unusual, highly unique and controversial, “first of its kind” project in Ireland. This report
raises serious concerns about the completeness of previous key leveraging statements,
misrepresentations, mischaracterisations, prior risk analyses, and conclusions regarding safety
decisions driving current siting choices for the proposed Corrib onshore facilities. To assist
readers first skimming this report, coloured text boxes capturing many of the critical issues are
provided throughout the paper.
It is Accufacts’ opinion that the current direction for this project’s proposed siting reflects a lack
of specialised experience, or a serious breakdown in management and/or decision processes.
We find past Quantitative Risk Analysis (QRA) for the onshore pipeline not in compliance with
even the minimum basic risk analysis requirements defined in the now outdated and cited
design standard for this pipeline, BS 8010.1 Given the uniqueness of this project and the
incredibly high potential pipeline pressures in close proximity to civilians, easily exceeding the
limits of most normal pipelines, Accufacts believes a QRA is not the appropriate mechanism, or
satisfactory approach, for prudent project design and siting decisions for this unusual
experiment.
For background reference, a brief explanation of why the Corrib pipeline is anything but normal
is discussed. Key information is then presented that quickly dispels the illusion or myth that the
508 mm (20 inch) diameter 27.1 mm (1.07 inch) thick-wall Corrib pipe is somehow invincible
to specific threats associated with high-pressure production pipelines that can cause leaks or
ruptures. As a reality reference check, the well-documented “moderate” release gas
transmission pipeline rupture in Carlsbad, New Mexico (August 19, 2000) is presented in the
section on pipeline rupture consequences. The Carlsbad pipeline rupture graphically
demonstrates the consequence potential of even a lower pressure pipeline, which failed at
approximately 46.6 Bar (675 psig, or 58% Specified Minimum Yield Strength). The Carlsbad
pipeline failed as a result of aggressive selective internal corrosion and other operating factors,
and the age of the pipe played no role in its failure. Ironically, the pipeline operator complied
with corrosion monitoring programs defined by minimum U.S. federal pipeline regulations of
the time. Attempts to characterise that the Corrib pipeline cannot rupture from internal
corrosion need to be seriously challenged and investigated. The corrosion pipe failure
information presented in this report utilises well known and accepted pipeline industry tools.
Given the much greater thermal impact zones associated with a Corrib onshore pipeline rupture,
our analysis indicates that pipeline routing should be at least 200 metres from dwellings and 400
metres from unsheltered individuals to avoid massive casualties and/or multiple fatalities.
These recommended distances indicate that the current proposed onshore pipeline route is
unacceptable. The large safety zones necessitated by an onshore Corrib pipeline rupture reflect
the exotically high potential operating pressures and subsequent fatal radiation thermal fluxes
associated with a rupture. To date, the pipeline operator has failed to adequately or
satisfactorily demonstrate that the onshore pipeline will not experience pressures within the
boundary conditions of 150 to 345 Bar (2175 to 5000 psi) studied in this report.
This report also focuses on matters related to the onshore Gas Processing Plant. The impact thatplant siting has on factors affecting the onshore pipeline are clarified and explored. Pros andcons of gas processing plant site selection options are then presented, specifically focusing onmajor advantages/disadvantages of deep water off shore, shallow water off shore, and on shoregas plant processing options. We find that many of the previous statements driving the present
1 BS 8010, “Code of Practice for Pipelines – part 2. Pipelines on Land: Design, Construction and Installation, Section2.8 Steel for Oil and Gas,” 1992, has now gone out of date and is obsolete.
2
onshore gas plant site and onshore pipeline route to be overstating the difficulty and costs ofoffshore alternatives, while apparently understating the risks of the onshore proposal. This is amost troublesome example of what is called “Space Shuttle Syndrome,” the propensity to rushlaunch at all costs while downplaying or ignoring very real risks. Readers are welcome to formtheir own opinion as to whether this phenomenon is occurring on the Corrib project afterstudying this report.
Particular attention is paid to the issues of cold venting and excess flaring in gas processingplant design. More progressive governments have chosen to discourage cold venting and excessflaring practices for many prudent reasons and we would highly recommend avoiding eitherpractice.
Additional observations regarding siting considerations raise further concerns about the presentsiting process and use of QRAs. Various warning signs are also identified that signalinappropriate application of QRA, even though risk analysis may be allowed in pipelineregulations. Quite simply, QRA should never be utilised to supplant experience, soundengineering judgment, or prudent management practices. Lastly, further discussion is presentedon several other factors related to the impact on the decision making process when financialrewards are so great and liability impacts so small so as to rush or distort risk analysis resultingin very poor outcomes that are all too predictable. The impression of huge potential rewardwith little or no liability for poor decisions can cause even the brightest of organisations to makevery unwise decisions.
It is not up to the author to decide which option bests serves the community. It is hoped,however, that this paper injects appropriate factual information into a process that, based on lessthan complete information supplied to date, appears to be rapidly losing credibility, and theconfidence of the citizens.
II. This Isn’t a “Normal” Onshore Natural Gas Pipeline
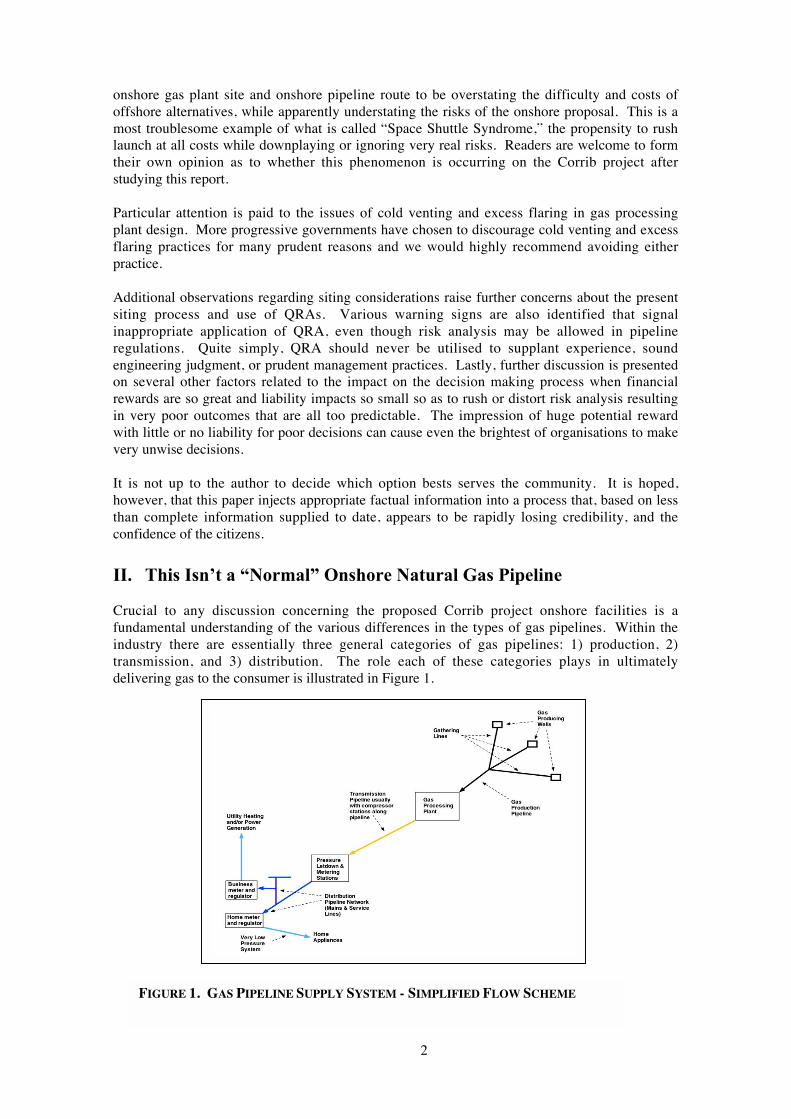
Crucial to any discussion concerning the proposed Corrib project onshore facilities is afundamental understanding of the various differences in the types of gas pipelines. Within theindustry there are essentially three general categories of gas pipelines: 1) production, 2)transmission, and 3) distribution. The role each of these categories plays in ultimatelydelivering gas to the consumer is illustrated in Figure 1.
FIGURE 1. GAS PIPELINE SUPPLY SYSTEM - SIMPLIFIED FLOW SCHEME
3
Production Pipelines
Production pipelines, more specifically gas production pipelines, also sometimes calledgathering or flow lines, are those pipelines connecting the gas producing field wells to gasprocessing plants that process or treat the gas to meet transmission pipeline qualityspecifications. Transmission pipeline gas is more restrictive in quality requirements for reasonsthat will be explained shortly. In rare cases, gas production pipelines connect directly totransmission pipelines as the gas produced from some wells either meets or does notsignificantly degrade gas moving in the transmission system. In most gas processing plants,liquid is removed and the gas dried to substantially reduce corrosion potential. Additionaltreatment of the gas may be required to remove certain higher risk contaminants, such as H2S ifpresent in sufficient quantities, to prevent problems on transmission pipelines.
Because most production gas can contain the multiple phases of solid, liquid (water andhydrocarbons), and gas, production pipelines must be able to withstand additional “reactiveforces,” both internal loading stresses (i.e., slugging2) and chemical, not encountered ontransmission or distribution pipelines. As production pipelines are usually remotely located, inmany countries the regulatory requirements for production pipelines can, ironically, be lessstringent than those for transmission or distribution pipelines. Production pipelines vary in sizeand pressure based on the specific quality and operating conditions of the gas field reservoir thatcan fluctuate or change considerably with time in any one producing field as the gas field isdepleted. Substantial variations can also occur in gas quality if other new gas fields are addedinto the main production pipeline, should further fields be discovered or developed. Thecomposition of the gas in the future is thus basically unknown. The corrosiveness and toxicityof the gas is dependent on the specific gas composition and there are usually very limited, ifany, regulatory restrictions on many contaminants that can seriously chemically attack, impactthe pipeline, or create other problems on their release. Depending on their pressures, productionpipelines can fail as either leaks or ruptures.
Transmission Pipelines
Gas transmission pipelines are those pipelines that move or transport conditioned or treatednatural gas, meeting various quality specifications, from the gas fields or processing plants tothe lower pressure distribution systems. Transmission pipelines tend to be larger in size,moderate to moderately high in pressure, and traverse long distances as their primary purpose isto move large volumes of non-reactive gas as economically as possible. Usually such mainarterial pipelines consist of one large diameter pipeline, though multiple main pipelines can berun in parallel (called looping) to increase capacity. Along the transmission pipelines arecompressor stations to re-pressure the gas as it moves down the system. Transmission pipelinesoperate under published quality specifications requiring that the gas carried be non-reactive andnon-corrosive to the pipeline.3 Transmission pipelines are operated as a single-phase, gas,mainly composed of methane and other minor components (i.e., ethane, propane) and inertgases (e.g., nitrogen, carbon dioxide). Odorant with a very distinctive smell is usually added tothe gas in transmission pipelines to aid in the identification of possible gas leaks from thesesystems. Not all countries require odorant on all transmission pipelines, however.
Distribution Pipelines
Distribution pipelines consist of that network of lower pressure gas pipelines usually taking gasfrom transmission pipelines, at various points down the system, through pressurereducing/metering stations that drop the gas pressure from the transmission system pressure tothe much lower pressure distribution system. Distribution pipeline systems consist of a grid of 2 Slugging occurs when liquid periodically drops out inside the pipeline and then is picked back up by thechanging flow of the gas stream, causing impulse forces on the pipeline that can be quite large.3 This does not mean that internal corrosion (i.e., selective corrosion attack) cannot take place, but the potential forboth general and selective internal corrosion on transmission systems are usually many orders of magnitude lowerthan that for production pipelines.
4
larger diameter pipes called mains, and smaller diameter service lines that run from the mains toconnect directly to homes or businesses. Because distribution systems are in close proximity tolarge concentrations of people, they are designed and operated at much lower pressures (usuallymuch lower than 14 Bar, or 200 psig) than production or transmission systems. Newer moderndistribution pipelines are made of steel or plastic while older networks may be cast, or wroughtiron, or other metals such as copper. Because of their much lower pressures, distributionpipelines fail as leaks rather than ruptures (see Section IV Pipeline Routing Issues, discussingthe difference between leaks and ruptures). Odorant is added to the gas in distribution pipelinesto aid in the identification of possible gas leaks, both in the distribution system piping and in themuch lower pressure home piping network (downstream of the home pressure regulator/meter)which is not considered part of the distribution pipeline system.
Gas Processing/Treatment Plant aka Terminal
Typically, along a production pipeline is a processing plant that contains equipment to processor treat gas gathered directly from field producing wells, permitting the natural gas to meetquality specifications for transmission pipelines. Depending on its capacity, a processingfacility may accept more than one production pipeline. Processing facilities are usually locatedon or near gas production fields particularly if the gas is especially reactive. For the Corribproposed project, the gas processing plant has, for some reason, been called a “Terminal.” Inthis paper we will call this specific facility what it really is: a “Gas Processing Plant.” A moredetailed discussion of the Gas Processing Plant and its influence on pipeline routing choices isprovided in Section VIII – Why the Gas Must be Treated.
The Model One Syndrome
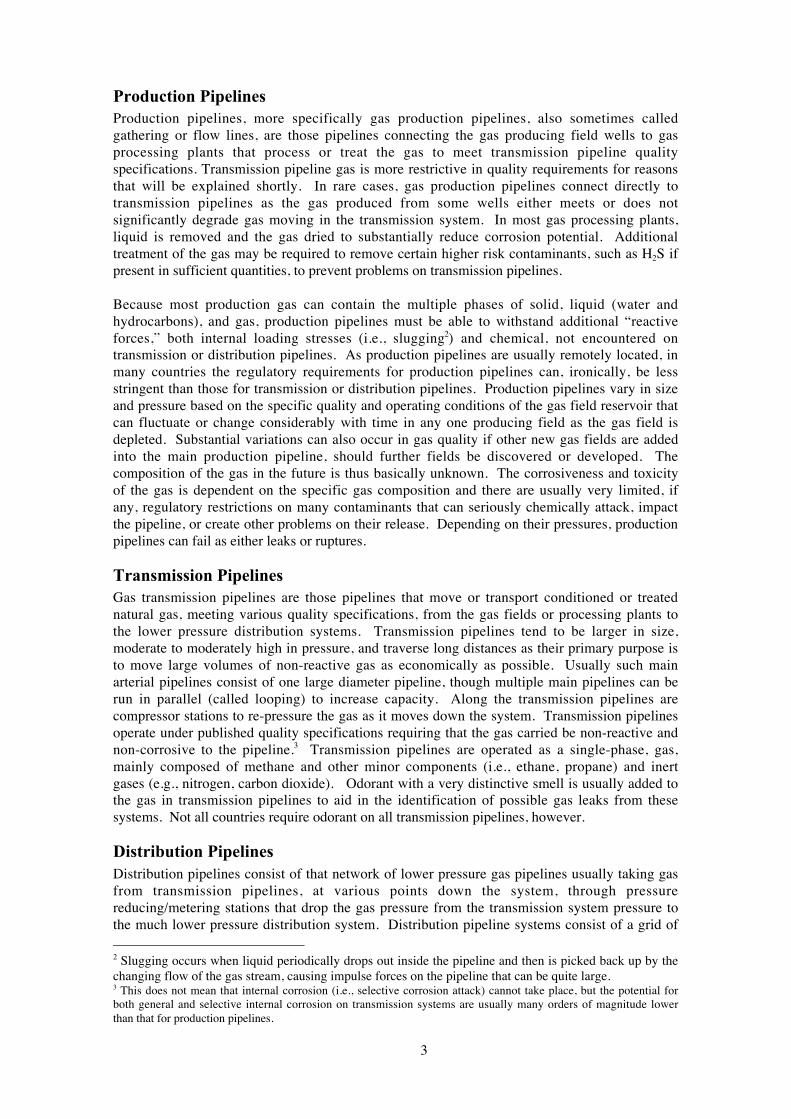
Because of the deep water (350 metres) and severe location of the Corrib producing field(approximately 80 kilometres into the Atlantic Ocean off the west coast of Ireland), theoperators have proposed to site the gas field wells on the ocean floor (subsea) eliminating the
FIGURE 2. CORRIB PIPELINE DESIGN BASIS
need (and significant expenses) of a deep-water offshore platform. Figure 2 briefly summarisesthe proposed Corrib pipeline system design basis.
The current Corrib design proposal gathers the production gas from various subsea producingwells into a 92 kilometre production pipeline, consisting of approximately 83 kilometres of508mm (20 inch OD) offshore underwater pipeline and approximately 9 kilometres of similaronshore pipeline to the onshore Gas Processing Plant. In addition, a utility pipeline runsparallel to the gas production pipeline. The utility pipeline will contain a package of smallerseparate pipes containing: 1) a methanol/corrosion inhibitor cocktail for injecting into the
5
production pipeline near or at the wellheads, 2) hydraulic fluid to drive well head valveoperation, and 3) communication fibre optics for gas field data relay.
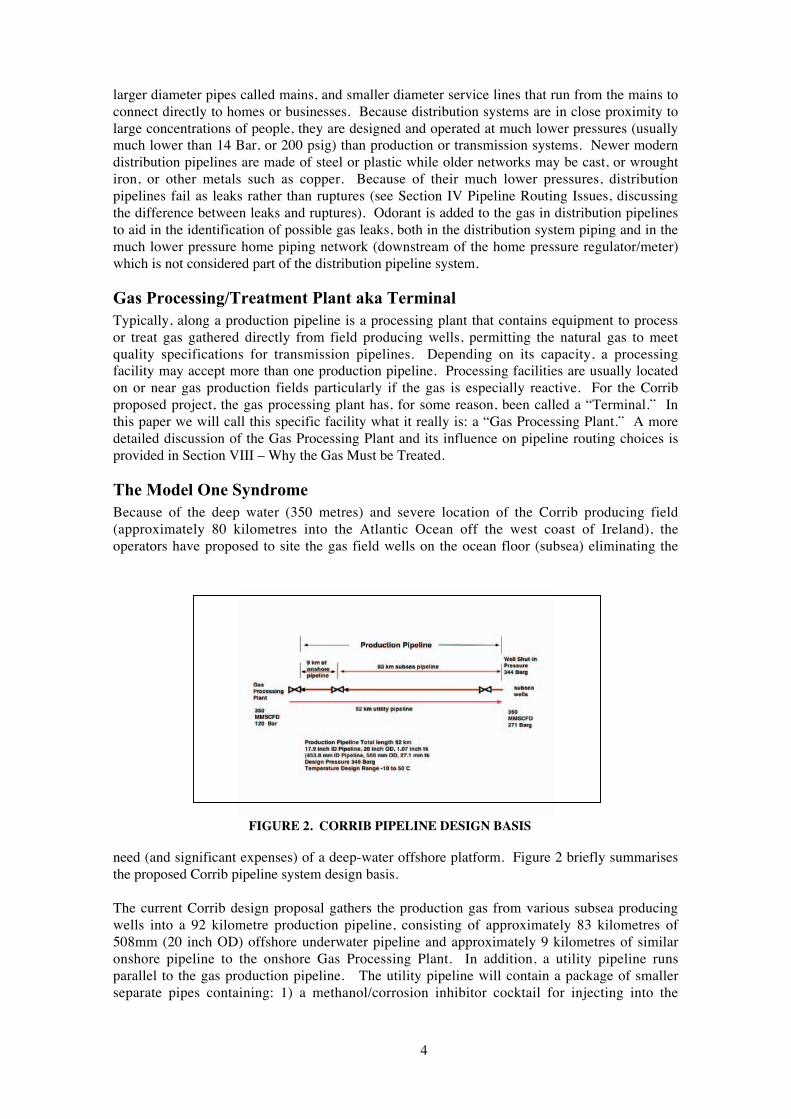
What makes this pipeline proposal highly unique is the long production pipeline, very high,even exotic, pressures, and onshore siting in close proximity to population (e.g., the citizens ofRossport; see Figure 3 Onshore Pipeline Route Through Rossport).
FIGURE 3. ONSHORE PIPELINE ROUTE THROUGH ROSSPORTIt would be fair to assumethat this is the first designof its kind or the “modelone” for Ireland. Onewould expect that giventhe uniqueness of thisp r o j e c t , c r i t i c a linformation related tos p e c i f i c d e s i g n ,operational, and routingi s s u e s w o u l d b eforthcoming.Unfortunately,i n c o n s i s t e n t a n dconflicting answers (suchas expected onshoremaximum opera t ingpressure) have onlyserved to increase localc o n c e r n s a n dapprehensions about thisp ro j ec t . Fu r the rinformation included inthis report should serve toraise more questions fromthe public about pastinformation presented forthis proposed project.
Given a detailed review ofthe many documentsdescribing the pressuresfor the pipeline system,we would surmise that theonshore segment has avery high probability, or acertainty, to reach orexceed 150 Bar, and a much lesser probability, though not zero, to attain 345 Bar pressures.Since the pipeline operator is not restricted to physically limiting onshore pipeline pressures tolower than 150 Bar, nor has any adequate design to avoid such overpressure been released,prudence would indicate a high likelihood of future onshore pipeline operating pressuresreaching the levels between 150 to 345 Bar, much more than suggested by past publicdocuments on this matter. As a result, this paper will benchmark further discussion on the 150and 345 Bar operating pressures as boundary conditions to illustrate important concepts thatshould be considered for this pipeline whatever the future holds for pressures for possibleoffshore gas field development.
6
III. Onshore Pipeline Design Key Issues
There are several key issues that play a critical role in informed decision making related toonshore pipeline design, operation, and siting. It is very important for both decision makers andthe public to understand these fundamental issues and how they influence the safety of apipeline. Many pipeline parameters, such as CO2 composition, operating pressure ortemperature, are not truly restricted, so a wide range in these variables is possible, even allowed.Once the pipeline has been installed, many critical assumptions as demonstrated in further detailin this report, can change and seriously increase the risk of failure for the onshore systems.Failure to incorporate these many potential operating changes, which are much more varied forproduction pipelines than their cousin transmission pipelines, can be regarded as reckless asthese changes can accelerate pipeline failure. As will be soon demonstrated, any pipeline breakat these pressures can be very unforgiving.
Should any present or future operating changes (e.g., pressure) placethe pipeline into a failure scenario, no pipeline regulations orstandards would necessarily have been violated. For example, flowrate, gas composition, and temperature can change in a manner thatcan seriously affect internal corrosion (i.e., additional fieldsconnected to the production pipeline). All too often QRAs fail toproperly incorporate future changes into the base case designpremise resulting in an incomplete or improper risk finding of no
significance. Any risk analysis should be clearly able to define its basis and identify criticalvariables that are leveraging to a risk call. Many of these important factors usually aren’t assignificant a problem for transmission pipelines because of their more restrictive gas qualityspecification limitations.
Pressure and SMYS (Specified Minimum Yield Strength)
While the impact that pressure plays on pipelines is somewhat obvious to most people, a secondrelated and important factor is not commonly understood, even by many pipeline operators:SMYS (or Specified Minimum Yield Strength).4 In order to perform a proper pressure analysison modern pipeline steel, the operating pressure and SMYS are needed (along with wallthickness and approximate pipe metal toughness) to define the containment capabilities of anypipe during its operation. Despite possible claims to the contrary, these basic factors applywhether the pipe is thin-walled or thick-walled, at least the thick-wall pipe proposed for thispipeline. All pipelines have anomalies. Flaws and anomalies exist in pipelines, even pipelinesthat have undergone strenuous hydrotesting.5 Hydrotesting removes or filters out largeranomalies but leaves smaller anomalies (the higher the test pressure, the smaller the remaininganomaly). Most anomalies are not an issue of concern, but some, such as those that arecorrosion influenced, can become problematic for various reasons over the life of a pipeline.Pressure in relation to SMYS plays a critical role in characterising if and how a pipe will fail,either as a leak or a rupture. Leaks are releases where the through wall failure in a pipe remainsessentially fixed or very close to its original size. Ruptures represent failure dynamicsassociated with high stress steel pipelines where the original through wall pipe failure goesunstable and rapidly (in microseconds) propagates down the pipeline, enlarging the initialfailure as the pipe shrapnels (usually resulting in a full bore release or its equivalent).
4 SMYS is a quality specification of the pipe, defined or usually specified at the time of its manufacture. The SMYSof the Corrib pipe is 70,000 psi (482 N/mm2).5 An anomaly is any imperfection in pipe wall or weld. All pipelines contain anomalies and many anomalies are notof concern. The purpose of a hydrotest is to remove anomalies that can fail at the hydrotest pressure. The key is tomaintain control of or avoid aggravating anomalies that remain after a hydrotest that could grow and then fail atpressures much lower than the hydrotest. Hydrotesting thus has limits in its application to control certain anomalies.
The maximum pressureth i s p ipe l ine i spermitted to experiencehas not been clearlydemonstrated.
7
Depending on the four characteristics mentioned above, graphs can be developed for a pipelinethat define anomalies that can be tolerated (i.e., usually won’t fail), their method of failure (leakor rupture), and, in some cases, estimated time to failure for time dependent anomalies.6 Not allanomalies are time dependent (e.g., some are stable and then become time dependent and viceversa), as their classification depends on the pipeline and its operating characteristics, which canalso change over time.
Such a series of graphs for corrosion have been developedand will be discussed in the following segment in thissection describing, in detail, internal and external corrosionissues. Depending on the anomaly, thick-wall pipe can beeven more susceptible to certain issues that can result inrupture or full bore releases than thin-walled pipe and viceversa. Risk analysis that portrays the myth of thick-walledpipe invincibility or superiority over thin-walled pipeusually misses the very real difficulties that can threaten thevery integrity of onshore highly stressed thick-walled pipe.The choice of either thick-walled or thin-walled pipedepends on many factors specific to a particular pipelineoperation and design, as well as its location.
Generally, and I emphasis this key word as there are some important exceptions, steel pipelinesoperating below 25 - 30% of SMYS will fail as leaks rather than ruptures. For example,requirements in BS 80107 establish that pipelines in most higher population densityclassification areas (i.e., Class 2 and Class 3, and high potential loading areas such as roadcrossings) incorporate a design factor (a maximum operating stress) for safety of 30% SMYS,and the preponderance (there are exceptions) of such failures in these lower design factor, lowstress areas are leaks rather than ruptures.
When reviewing any pipeline system, it is important to evaluate the downstream and upstreamfacilities to assess their potential to place the interconnecting pipeline system under highpressures that can result in high stress levels and cause anomalies in the pipe to fail. Anydownstream facility design that can close or block in the pipeline, or that overemphasizesreliance on electronic safeties to prevent overpressure events, needs to be carefully scrutinizedas the potential for such electronics to fail when most needed can be very high and theconsequences severe. In addition, upstream systems that can place any pipeline into high stressscenarios from elevated pressures must also be carefully reviewed. It is especially importantthat designers not rely on flow dynamics (i.e., pressure drop associated with fluid flow and piperesistance) to prevent excessive pressure. The potential for a pipeline to reach various pressuresmust be evaluated from the entire system point of view including the production wells, theoffshore pipeline, onshore pipeline, and gas plant processingfacility. To date we find descriptions of this system on thiscritically important pressure matter to be seriouslyincomplete. This is an acute deficiency given the exoticpotential pressures liable to occur on the pipeline and theextreme consequences associated with a failure in closeproximity to people.
6 Estimated time to failure usually incorporates very large safety margins because of major uncertainties associatedwith critical measurements of key variables.7 Ibid., BS 8010.
No pipeline, regardless of wallthickness, is impervious tofai lure . At tempts tocharacterise thick-walled pipeas somehow invincible or betterthan thin-walled pipe appear tobe incomplete efforts todeceive an uninformedgovernment, public , ormanagement team.
The design concept toprevent onshore pipelineoverpressure has not beenclearly demonstrated orcommunicated to the public.
8
Gas Composition
Gas composition factors are especially important on production gas pipelines as compositioncan seriously impact the operability of a pipeline, especially the pipeline’s integrity. Criticalcomposition issues include:
Wet Gas Versus Dry Gas
It is extremely unusual for gas produced from a gas field to be in a dry state. The presence
of water is almost always assured. Gas containing water is classified as “wet gas” and
brings with it certain risks to a pipeline operation. Water is required for internal corrosion
on pipelines to occur. In addition, water or other liquid slugs can seriously change loading
stresses on a pipeline. As mentioned earlier, slug catchers (large catch vessels to trap
liquids) are placed along production gas pipelines. The settlement of water in low points in
production pipelines can also serve to concentrate and accelerate selective internal corrosion
attacks that can occur much faster than general corrosion. As a result, over emphasis on a
general corrosion allowance to protect a pipeline can be ineffective at preventing pipeline
failure from selective rapid corrosion attack, especially on production pipelines most at risk
from such occurrences.
Gas Components Other Than Methane
Components other than methane in produced gas can have serious impacts on productionpipelines. Carbon dioxide and certain sulphur compounds (e.g., COS, H2S) in the presenceof water can lead to acid attack and internal corrosion. Heavier components, such aspropane butane and heavier (C5+) will also tend to form liquids and periodically drop outalong the pipeline adding to loading stresses associated with liquid slugging. As mentionedpreviously, it is important to realise that the stated design components and gas compositionmay not necessarily be the same as the field ages, or if a new gas field is brought on lineand tied into the same production pipeline. These changes can affect the internal corrosionrate as well as the internal corrosion potential on the pipe.
Temperature
Temperature can play a role in basically two areas. Higher temperatures can rapidly increase
the corrosion rate, especially for selective corrosion attack, decreasing time to failure estimates
from corrosion. The effect of temperature on rate can be better understood by reviewing Figure
4 in the internal corrosion discussion in the next section. Lower temperatures, depending on gas
composition, can increase the probability of hydrate (a solid) formation that can lead to
plugging of the pipeline and/or operating equipment while reducing the corrosion rate.
Methanol injection should inhibit the formation of hydrates that might pose a problem on this
system. The design temperature range on this pipeline has been stated as -10 to +50 °C. The
onshore pipeline should not see the upper temperature range realised at the wellhead, but even
at the lower temperatures expected to be encountered onshore, internal corrosion can be a
serious risk. Remarkably, there is no mention in any of the public documents of monitoring the
critically important temperature as it enters the onshore pipeline segment.
Corrosion Issues
Pipeline design considerations should properly address both internal and external corrosionpotentials. We have previously indicated the pitfalls of relying on a corrosion allowanceespecially for selective corrosion attack. Internal corrosion prevention has advanced over theyears, but over reliance on corrosion inhibitor programs can prove a serious mistake. Externalcorrosion design has also advanced considerably in the past forty years. Despite all theadvances in internal and external corrosion technology, there is still no steel pipeline that iscorrosion free.
9
Internal Corrosion
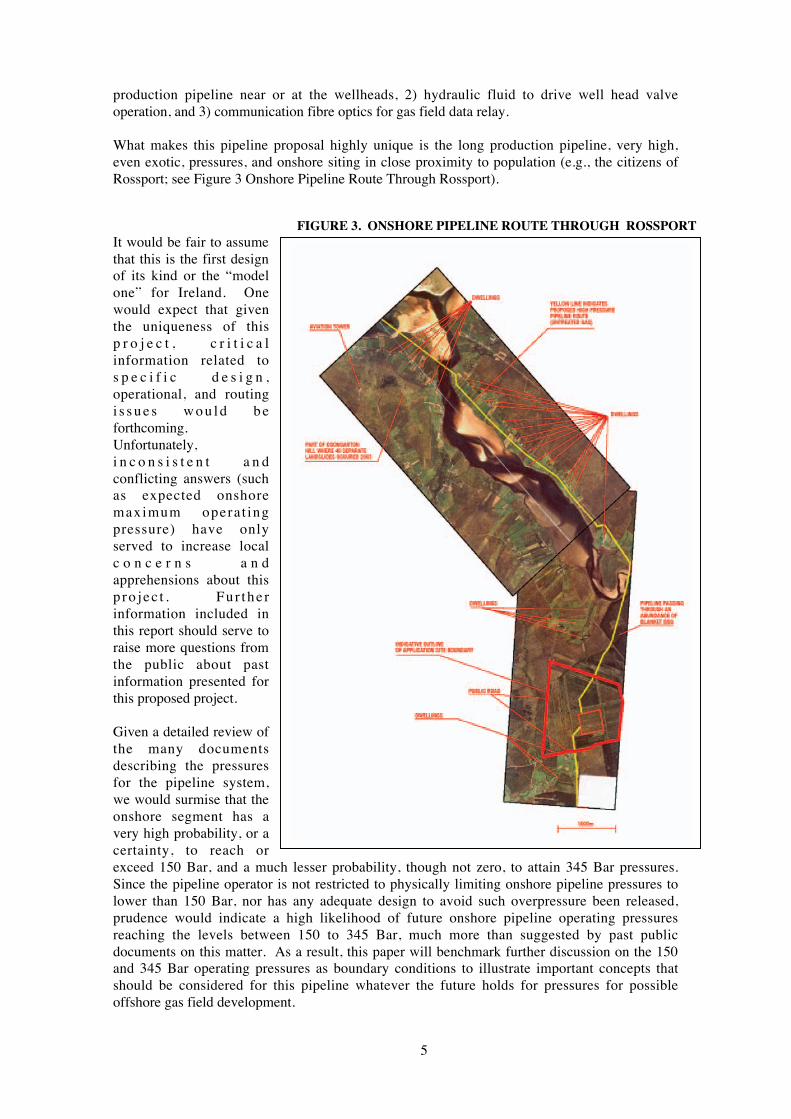
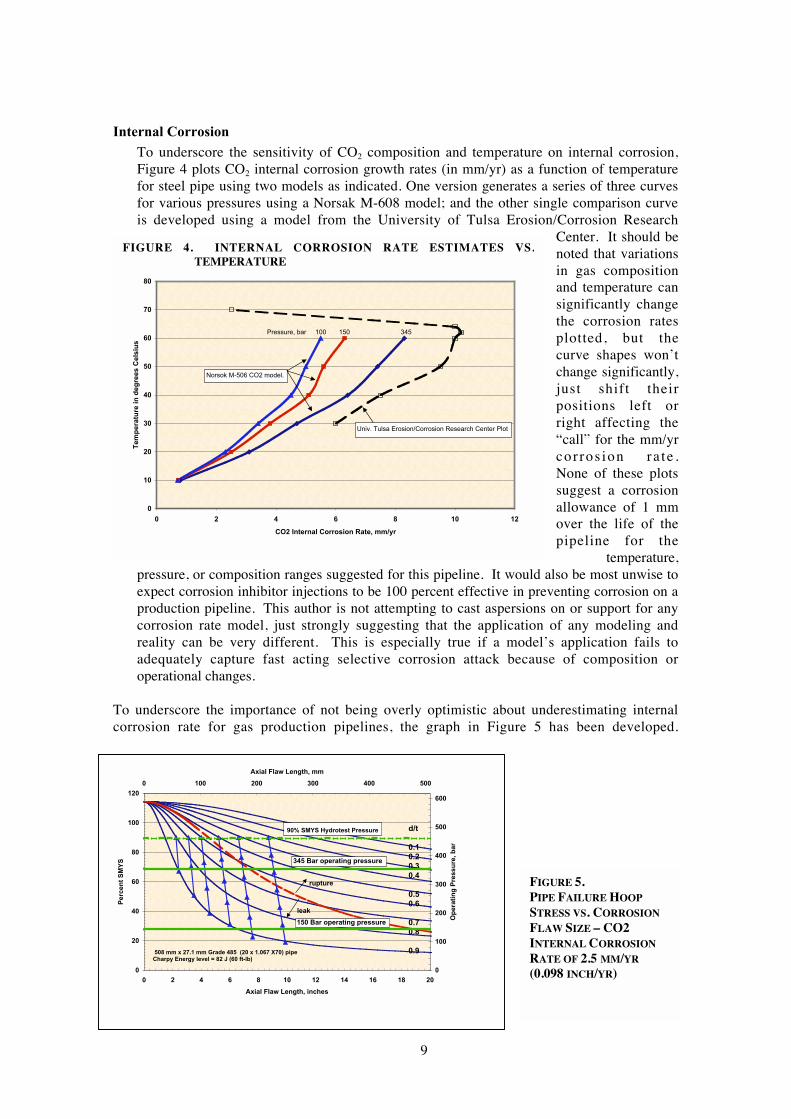
To underscore the sensitivity of CO2 composition and temperature on internal corrosion,Figure 4 plots CO2 internal corrosion growth rates (in mm/yr) as a function of temperaturefor steel pipe using two models as indicated. One version generates a series of three curvesfor various pressures using a Norsak M-608 model; and the other single comparison curveis developed using a model from the University of Tulsa Erosion/Corrosion Research
Center. It should benoted that variationsin gas compositionand temperature cansignificantly changethe corrosion ratesplotted, but thecurve shapes won’tchange significantly,just shift theirpositions left orright affecting the“call” for the mm/yrcor ros ion ra te .None of these plotssuggest a corrosionallowance of 1 mmover the life of thepipeline for the
temperature,pressure, or composition ranges suggested for this pipeline. It would also be most unwise toexpect corrosion inhibitor injections to be 100 percent effective in preventing corrosion on aproduction pipeline. This author is not attempting to cast aspersions on or support for anycorrosion rate model, just strongly suggesting that the application of any modeling andreality can be very different. This is especially true if a model’s application fails toadequately capture fast acting selective corrosion attack because of composition oroperational changes.
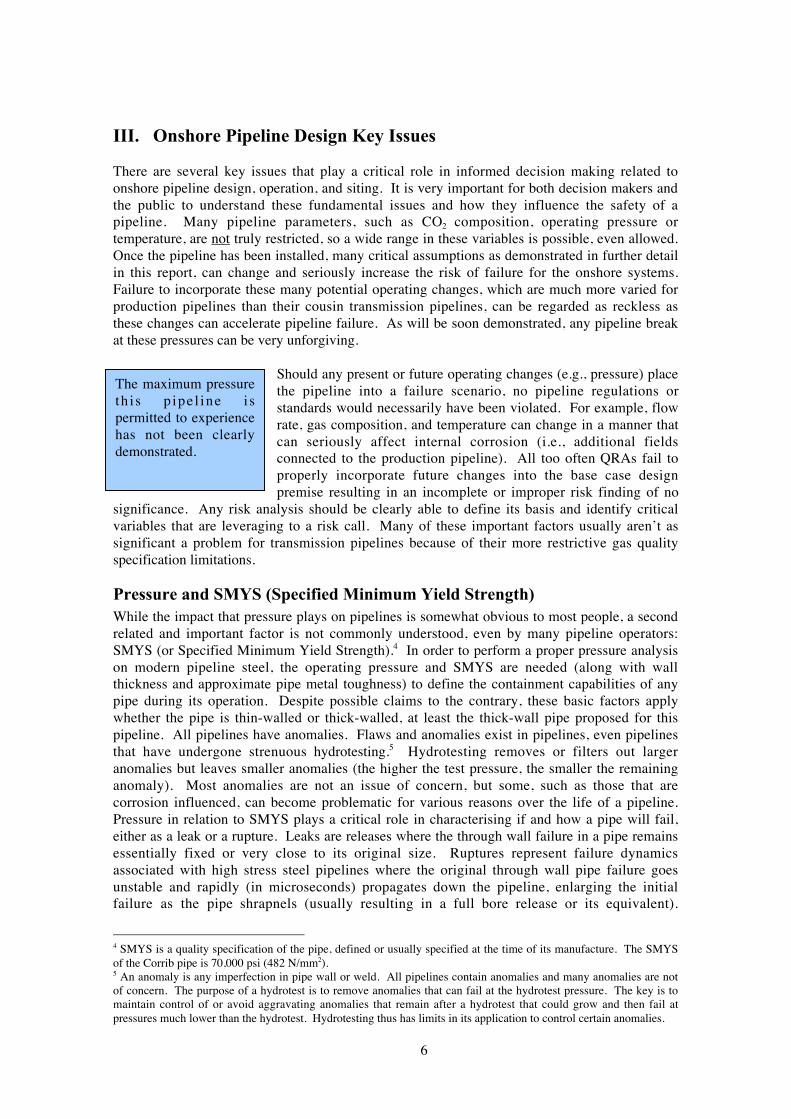
To underscore the importance of not being overly optimistic about underestimating internalcorrosion rate for gas production pipelines, the graph in Figure 5 has been developed.
FIGURE 4. INTERNAL CORROSION RATE ESTIMATES VS.TEMPERATURE
0
10
20
30
40
50
60
70
80
0 2 4 6 8 10 12
CO2 Internal Corrosion Rate, mm/yr
Tem
pera
ture
in
deg
rees C
els
ius
Norsok M-506 CO2 model.
Pressure, bar 100 150 345
Univ. Tulsa Erosion/Corrosion Research Center Plot
0
20
40
60
80
100
120
0 2 4 6 8 10 12 14 16 18 20
Axial Flaw Length, inches
Perc
en
t S
MY
S
0
100
200
300
400
500
600
0 100 200 300 400 500
Axial Flaw Length, mm
Op
era
tin
g P
ressu
re,
bar
90% SMYS Hydrotest Pressure d/t
0.1
0.2
0.3
0.4
0.5
0.6
0.7
0.8
0.9
rupture
leak
345 Bar operating pressure
150 Bar operating pressure
508 mm x 27.1 mm Grade 485 (20 x 1.067 X70) pipe Charpy Energy level = 82 J (60 ft-lb)
FIGURE 5.PIPE FAILURE HOOP
STRESS VS. CORROSION
FLAW SIZE – CO2INTERNAL CORROSION
RATE OF 2.5 MM/YR(0.098 INCH/YR)

10
This graph, known as a pipeline corrosion flaw growth plot, was developed utilising a wellestablished industry recognized pipe flaw failure program (PTFLAW) that predicts corrosionrelated failures on steel pipelines. This figure illustrates corrosion influence on anomaly flawlengths and depths that a steel pipeline can tolerate at various stress levels. Figure 5 is for theCorrib pipeline, a 508 mm by 27.1 mm Grade 485 pipe. A fracture toughness that maximisesthe flaw tolerance (tougher pipe will not tolerate longer or deeper flaws) was chosen at a CharpyEnergy of 82 J (60 ft-lb). If the pipe toughness is markedly lower, the flaw tolerance willslowly decrease resulting in failure at smaller flaw sizes than indicated in the figure. Figure 5may appear a little busy so additional discussion is warranted for such an important graph. Thiscorrosion tool will also be utilised in the next section discussing external corrosion.
On the vertical or Y-axis, the hoop stress is indicated as a percentage of SMYS (left axis) andoperating pressure (right axis), versus the axial flaw length (the most critical flaw orientation)on the horizontal or X-axis. Overlaid across the chart are various downward sloping thin linecurves representing flaw or anomaly depth as a ratio of flaw depth to pipe wall thickness, or d/t.For reference, three straight green horizontal lines across the chart represent pipe stress levels atthe minimum hydrotest pressure of 90% SMYS (the dashed green line), an operating pressurelimitation of 345 Bar, and 150 Bar, respectively (the solid green lines). Hoop stress andoperating pressure are directly related. The small blue triangles represent the flaws after eachyear’s assumed corrosion rate of 2.5 mm/yr that initially just survived the hydrotest (the firstblue triangle in each series is time = 0 which is hydrotest time) at various d/ts. The specifiedcorrosion rate of the flaws (both in depth and in length) in this case is assumed to be 2.5 mm/yr(based on the earlier Figure 4 Norsak curve for 150 Bar pressure and 20 °C). Lastly, the bolddashed red sloping curve line represents the transition point from leak to rupture. Corrosionflaws that develop to the right and above this red line will fail as ruptures and those that fallbelow and to the left will fail as leaks when the blue flaw growth indicators fall on or below thepressure ranges (150 to 345 Bar) indicated. This is a lot to work through so an example mayhelp to gain a better understanding. Some important general observations about this graph willthen be made.
Looking at the top right hand series of almost vertical blue triangles, the first uppermost triangleof this series indicates that at the hydrotest of 90%SMYS (dashed green line), a flaw that has adepth of 0.3 X 27.1 mm (d x t) = 8.13 mm and is almost 9 inches long could exist (doesn’t meanthere is one) and survive the hydrotest. Since each additional triangle represents a year’s worthof corrosion growth at the stated corrosion rate of 2.5 mm/yr it would take 2 years for thisparticular flaw to grow to where a pressure spike of 345 Bar would cause failure and this failurewould be a rupture as the growth flaw is to the right (upper part) of the leak/rupture transitioncurve. Following the triangle line for this same flaw series, another 3 triangles down or 3additional years of corrosion could occur before a pressure spike of 150 Bar or slightly abovewould cause failure, and this failure would be as a leak.Another way to look at this, should this same initial flaw existand if the operating pressure spikes above 150 Bar afterapproximately 5 years of corrosion, the pipe will fail. If thepressure goes much higher than 150 Bar, time to failure will beshorter than 5 years with the time and type of failure (leak orrupture) depending on how high the pressure spiked and theanomaly size at the time of failure.
Because engineers often start to believe their models actually calculate exact time to failure,several additional points need to be made about Figure 5. Anomalies that survive a hydrotestwill most likely be above rather than on the 90% SMYS (the dashed green line) suggesting aslightly longer time to failure from internal corrosion growth. Complicating this conclusion,however, is the proposed plan to allow the pipeline to sit in hydrotest water (probably inhibited
The main point to beappreciated is that thepressure has to only hitonce to cause pipefailure if the wrong sizeanomaly is present.
11
with chemical) for approximately one year.8 We do not advise this procedure as even inhibitedhydrotest water can act as an internal corrosion activator, increasing corrosion and shorteningtime to failure at selective pipeline wall sites. Because of various uncertainties, variations intime to flaw growth failure are in all probability plus or minus several years. If fatalities canresult from failure, one would be very unwise to operate by testing the operating pressures inthe uncertainty time range suggested by the plots. Each blue linked triangle series is just forillustration purposes as the specific anomaly may not exist, though bear in mind that no pipelineis anomaly free. For example, we could have illustrated an additional, almost parallel, bluetriangle series for d/t of 0.1 or 0.2 to this already busy chart that would have shown flaws thatcould grow to rupture. In reality there is an infinite series of almost parallel lines representing awide range of anomalies that can survive a hydrotest (some of these are manufacturing related,others are not). Initial anomalies that are deep and short in length can grow to leak failures,while initial shallow and long anomalies can grow to rupture failure.
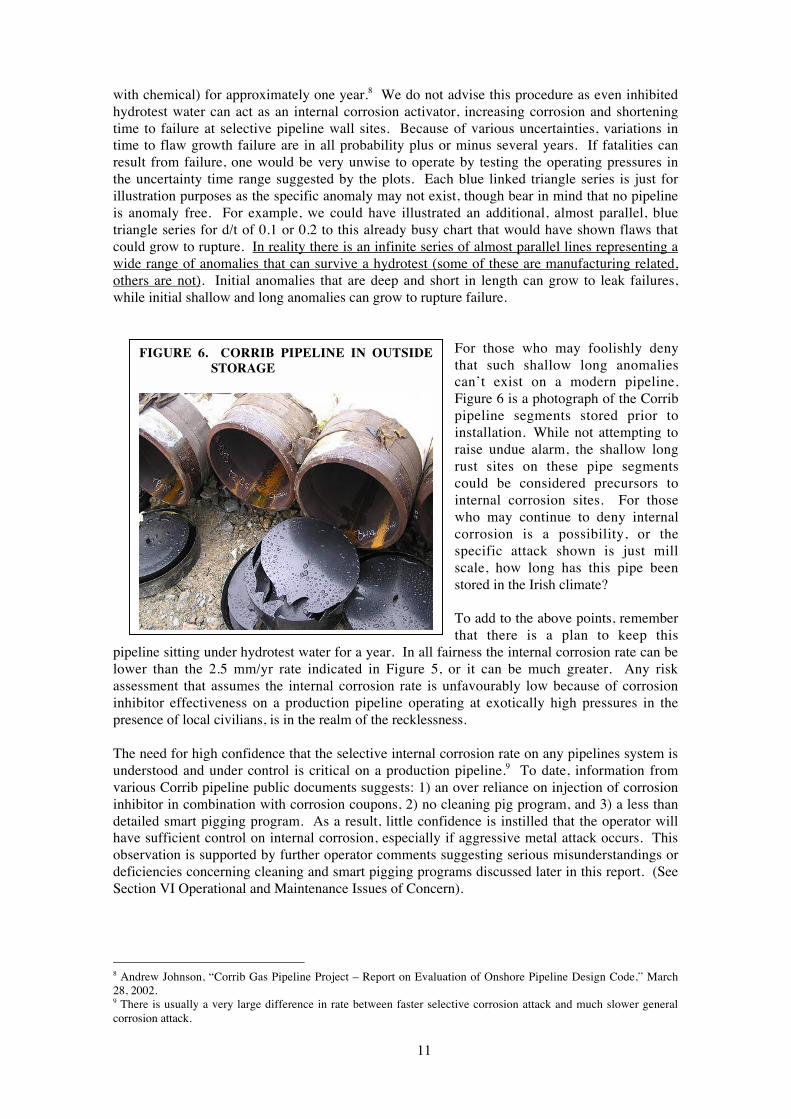
For those who may foolishly denythat such shallow long anomaliescan’t exist on a modern pipeline,Figure 6 is a photograph of the Corribpipeline segments stored prior toinstallation. While not attempting toraise undue alarm, the shallow longrust sites on these pipe segmentscould be considered precursors tointernal corrosion sites. For thosewho may continue to deny internalcorrosion is a possibility, or thespecific attack shown is just millscale, how long has this pipe beenstored in the Irish climate?
To add to the above points, rememberthat there is a plan to keep this
pipeline sitting under hydrotest water for a year. In all fairness the internal corrosion rate can belower than the 2.5 mm/yr rate indicated in Figure 5, or it can be much greater. Any riskassessment that assumes the internal corrosion rate is unfavourably low because of corrosioninhibitor effectiveness on a production pipeline operating at exotically high pressures in thepresence of local civilians, is in the realm of the recklessness.
The need for high confidence that the selective internal corrosion rate on any pipelines system isunderstood and under control is critical on a production pipeline.9 To date, information fromvarious Corrib pipeline public documents suggests: 1) an over reliance on injection of corrosioninhibitor in combination with corrosion coupons, 2) no cleaning pig program, and 3) a less thandetailed smart pigging program. As a result, little confidence is instilled that the operator willhave sufficient control on internal corrosion, especially if aggressive metal attack occurs. Thisobservation is supported by further operator comments suggesting serious misunderstandings ordeficiencies concerning cleaning and smart pigging programs discussed later in this report. (SeeSection VI Operational and Maintenance Issues of Concern).
8 Andrew Johnson, “Corrib Gas Pipeline Project – Report on Evaluation of Onshore Pipeline Design Code,” March28, 2002.9 There is usually a very large difference in rate between faster selective corrosion attack and much slower generalcorrosion attack.
FIGURE 6. CORRIB PIPELINE IN OUTSIDESTORAGE
12
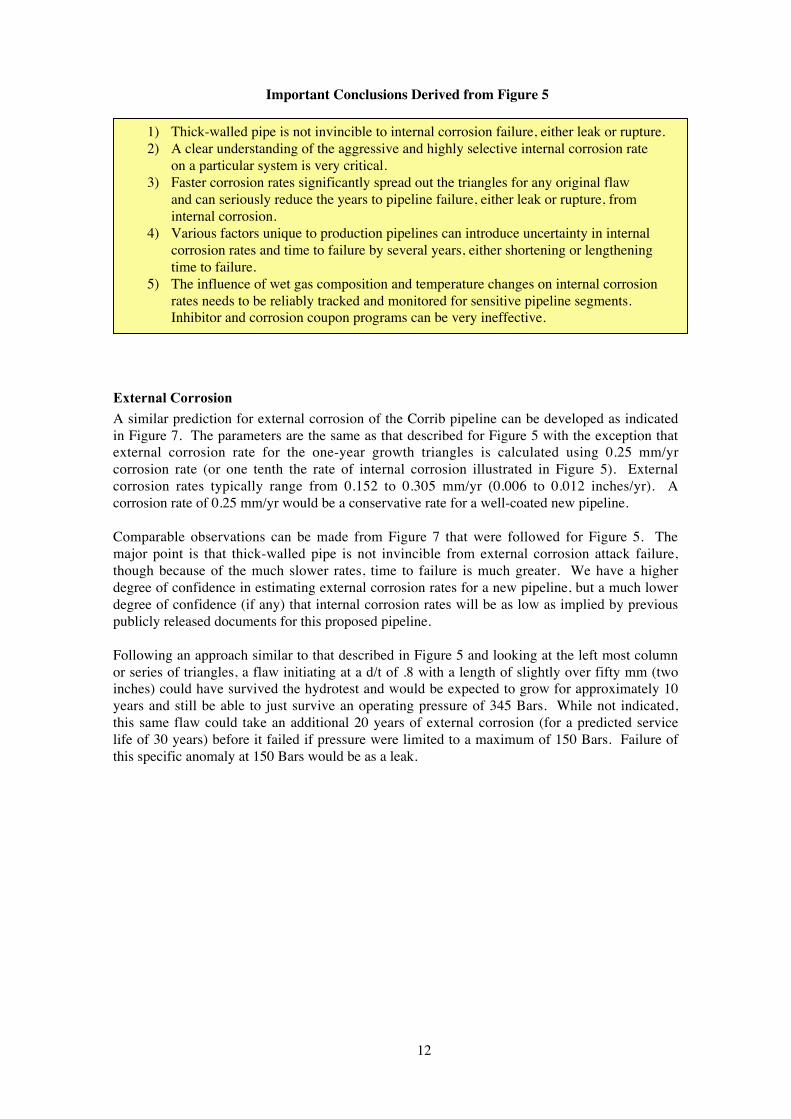
Important Conclusions Derived from Figure 5
External Corrosion
A similar prediction for external corrosion of the Corrib pipeline can be developed as indicatedin Figure 7. The parameters are the same as that described for Figure 5 with the exception thatexternal corrosion rate for the one-year growth triangles is calculated using 0.25 mm/yrcorrosion rate (or one tenth the rate of internal corrosion illustrated in Figure 5). Externalcorrosion rates typically range from 0.152 to 0.305 mm/yr (0.006 to 0.012 inches/yr). Acorrosion rate of 0.25 mm/yr would be a conservative rate for a well-coated new pipeline.
Comparable observations can be made from Figure 7 that were followed for Figure 5. Themajor point is that thick-walled pipe is not invincible from external corrosion attack failure,though because of the much slower rates, time to failure is much greater. We have a higherdegree of confidence in estimating external corrosion rates for a new pipeline, but a much lowerdegree of confidence (if any) that internal corrosion rates will be as low as implied by previouspublicly released documents for this proposed pipeline.
Following an approach similar to that described in Figure 5 and looking at the left most columnor series of triangles, a flaw initiating at a d/t of .8 with a length of slightly over fifty mm (twoinches) could have survived the hydrotest and would be expected to grow for approximately 10years and still be able to just survive an operating pressure of 345 Bars. While not indicated,this same flaw could take an additional 20 years of external corrosion (for a predicted servicelife of 30 years) before it failed if pressure were limited to a maximum of 150 Bars. Failure ofthis specific anomaly at 150 Bars would be as a leak.
1) Thick-walled pipe is not invincible to internal corrosion failure, either leak or rupture.2) A clear understanding of the aggressive and highly selective internal corrosion rate
on a particular system is very critical.3) Faster corrosion rates significantly spread out the triangles for any original flaw
and can seriously reduce the years to pipeline failure, either leak or rupture, frominternal corrosion.
4) Various factors unique to production pipelines can introduce uncertainty in internalcorrosion rates and time to failure by several years, either shortening or lengtheningtime to failure.
5) The influence of wet gas composition and temperature changes on internal corrosionrates needs to be reliably tracked and monitored for sensitive pipeline segments.Inhibitor and corrosion coupon programs can be very ineffective.

13
FIGURE 7. PIPE FAILURE HOOP STRESS VS. CORROSION FLAW SIZE –EXTERNAL CORROSION RATE OF 0.254 MM/YR (0.0098 INCH/YR)
From this figure it should be concluded with a high degree of confidence that externalcorrosion would not be a primary risk of concern for this pipeline. This observationassumes that the appropriate cathodic protection is made operational in a timely manner,and close interval surveys are properly undertaken to ensure no external selective corrosion“hot spots,” where external corrosion rate could be accelerated, develop over the life of thepipeline. Close interval surveys employ various above ground inspection techniques toperiodically determine the effectiveness of the CP system and pipeline coating to resistexternal corrosion on a pipeline.
Gas Velocity and Pipe Erosion
The actual gas velocity within a production pipeline is critical for two reasons: erosion velocityand liquid loading. Erosion can occur because of high velocities within the pipeline especiallyfrom gas associated with production wells that can contain solids such as sand. Velocitychanges can also place additional load stresses on a pipeline from liquid slugging as liquid thatis dropped out at lower flow rates is swept back up when gas flow is increased, causing changesin mass flow or “slugs.” Actual gas velocity is dependent on pressure. The higher the pressure,the lower the actual gas velocity within the pipe for the same design mass flow rate. At thedesign capacity and pressure ranges stated for this pipeline we do not see any critical concernsrelated to internal erosion, as actual flow velocities should be well below erosion thresholds.10
Abnormal Loading Issues
Paramount for the pipeline operator is the requirement to determine, calculate, and documentsolutions for all abnormal loading conditions, both internal (slugging, temperature change, etc.)and external (e.g., crush, earth movement such as landslide, etc.) that the pipeline mightexperience. While we would expect a thick-walled pipeline to absorb some limited earthmovement, we find very disturbing comments suggesting that a serious landslide can be
10 Maximum flow of pipeline from Figure 2 is 350 MMSCF/D, and using a pressure range of approximately 100 to345 Bar.
0
20
40
60
80
100
120
0 2 4 6 8 10 12 14 16 18 20
Axial Flaw Length, inches
Pe
rce
nt
SM
YS
0
100
200
300
400
500
600
0 100 200 300 400 500
Axial Flaw Length, mm
Op
era
tin
g P
res
su
re,
ba
r
90% SMYS Hydrotest Pressured/t
0.1
0.2
0.3
0.4
0.5
0.6
0.7
0.8
0.9
rupture
leak
345 Bar operating pressure
150 Bar operating pressure
10 year
20 year
30 year
508 mm x 27.1 mm Grade 485 (20 x 1.067 X70) pipe Charpy Energy level = 82 J (60 ft-lb)

14
absorbed by this pipeline without failure.11 Detailed loading calculations for major landmovement developed by the pipeline operator need to be carefully scrutinized as the authorknows of no pipeline that can take high mass, high momentum external loading associated withlarge landslides. Figure 8 speaks volumes for the kinds of land mass flow that can be expectedin the area. The author understands that a pipeline route that places the pipe above the landslidemight leave the pipe suspended and thick-walled pipe should be able to take someextreme “left hanging” loading forces.However, any suggestions that the pipelineshould be routed either at the base of suchlandmass, or within the major flow of potentialland movement needs to be seriouslychallenged and reviewed. Failure of the pipe inthese severe loading conditions, in allprobability, will result in full bore ruptures.There are methods to protect pipelines in suchhigh-risk land movement areas, but no mentionis made in any public documents of theseapproaches. In such higher risk land movementareas, a prudent pipeline operator may endeavorto reroute the pipeline out of the area, removing the risk. He could also elect to bury the pipedeep into stable bedrock or soil, or otherwise shelter the pipe, from the unstable soil. Reroute ispreferred as it is usually the most effective approach.
Peat, a unique form of boggy acidic soil, is a special type of environment that can placeabnormal loads on the pipeline from movement, especially as the design of this pipeline isnegatively buoyant, wanting to sink within the peat. The operator has indicated that the pipelinewill traverse these peat conditions by spanning the pipeline along stone column supports withinpeat bogs. The designers should be able to demonstrate through clear documentation andcalculations that a particular pipeline route, design, and span through peat will not generateabnormal loading on the pipe that can cause its failure.
Pipeline Safety Equipment
In the design of pipeline safety systems, there can be a tendency to stay on one course based onan original “game plan” while attempting to correct serious deficiencies by incorporatingadditional changes to “fix” the original flawed design premise. The very nature of these “fixes”introduces complexity that can inadvertently drive the system to the very failure needing to beavoided. In complex energy system design such as high-pressure pipelines, we call thisphenomenon of adding complexity to fix simple fundamental basic design premise errors,“Space Shuttle Syndrome.” This label was coined after theNASA Challenger space shuttle loss and verified again after thesecond Columbia shuttle loss, and subsequently reaffirmed inthe July, 2005 Discovery space shuttle launch. In Discovery’scase, after approximately two billion dollars and a two yearengineering effort, the foam hitting the shuttle on launch, thesame problem that caused the Columbia’s loss, had all tooobviously not been fixed. Space Shuttle Syndrome has come tomean a complex organisation rushing to launch at all costs,failing to fix or address fundamentally flawed initial approaches, while utilising poor riskmanagement to cloak their misguided confidence that everything will work.
11 Corrib Field Development Project, “Onshore Pipeline Quantified Risk Assessment,” Version F, dated April 22,2005.
Is the Corrib projectanother space shuttlerushing to launch at allcosts without listening toreason about a flawedinitial design or routingapproach?
FIGURE 8. AREA LANDSLIDES
15
It has been stated that the onshore Corrib Pipeline will be failsafe. This term has been gettingmuch misuse in the industry, especially with regard to its application in poor risk analysis. Asdefined by this author for this pipeline, failsafe is the design philosophy such that failure of acomponent or operator mis-operation cannot place the pipeline in an overpressure event thatcould result in pipe failure. As demonstrated in Figures 5 and 7, at these exotic pressures theroom for error on the onshore pipeline is very small. We find it incredible that, given these veryhigh pressures, more documentation has not been presented to clearly instill confidence that theonshore pipeline pressures will be maintained in the pressure ranges suggested by the operator.
For example, the wise addition of an onshore remote operated valve will reduce theoutrageously long depressurising time (many hours) associated with an onshore pipeline ruptureas the many kilometres of offshore system depressurising out the failure site will continueshould this valve not be quickly closed. Incredibly, this remote valve was apparently not in theoriginal design scheme suggesting a serious lack of appreciation of gas pipeline dynamics andfailure consequences by the decision team. This remote valve (even if it were designed toautomatically close), however, will not really impact the consequences associated with leaks orruptures on the onshore pipeline. For leaks, the gas inventory is so large that the leak will in allprobability result in an incident before the line can be depressurised. In a pipeline rupture, mostconsequences (i.e., fatalities) will occur in the early minutes of the rupture and the valve’sclosure will not occur in sufficient time to avoid a catastrophe from this highly compressedfluid. The valve on the boundary of the onshore pipeline is not really a true “safety” in theevent of an onshore pipeline failure, though it will reduce the number of minutes that anonshore rupture could blow down out the pipeline. As will be shown in Section IV OnshorePipeline Routing Issues, reducing the blow down time from a rupture to minutes will still resultin very large fatality zones.
The Difference Between Base Design and Future Operation
While on the subject of the onshore valve, there have been varying statements about what themaximum pressures will really be for the onshore pipeline. If the operator cannot adequatelydemonstrate that the onshore pipeline will be truly “failsafe” (e.g., protected to preventpressures in excess of 150 Bar, approximately 30 % SMYS), this pipeline needs to be movedand rerouted away from population.
We need to be very clear in keeping with the above system complexity comments that apressure letdown control device designed to drop pressure at the shoreline will not be a failsafedesign. Such a control would most likely introduce other system complexities that wouldsubstantially increase the likelihood of an onshore pipeline failure.
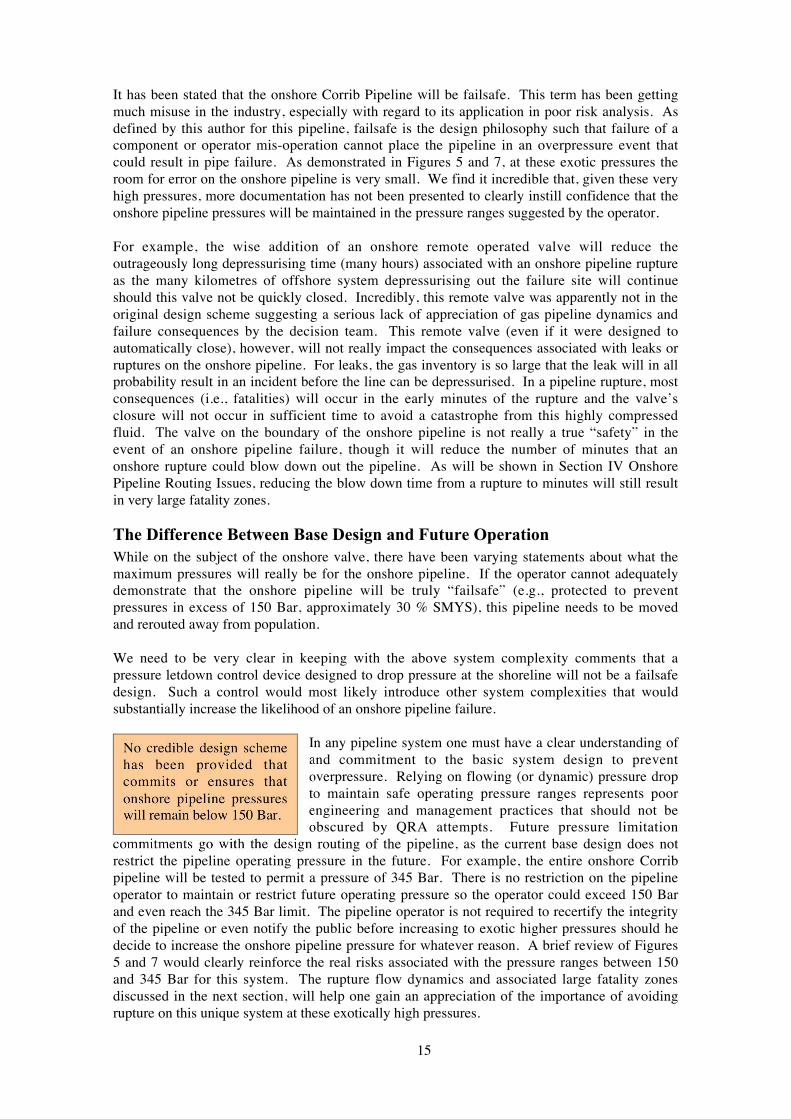
In any pipeline system one must have a clear understanding ofand commitment to the basic system design to preventoverpressure. Relying on flowing (or dynamic) pressure dropto maintain safe operating pressure ranges represents poorengineering and management practices that should not beobscured by QRA attempts. Future pressure limitation
commitments go with the design routing of the pipeline, as the current base design does notrestrict the pipeline operating pressure in the future. For example, the entire onshore Corribpipeline will be tested to permit a pressure of 345 Bar. There is no restriction on the pipelineoperator to maintain or restrict future operating pressure so the operator could exceed 150 Barand even reach the 345 Bar limit. The pipeline operator is not required to recertify the integrityof the pipeline or even notify the public before increasing to exotic higher pressures should hedecide to increase the onshore pipeline pressure for whatever reason. A brief review of Figures5 and 7 would clearly reinforce the real risks associated with the pressure ranges between 150and 345 Bar for this system. The rupture flow dynamics and associated large fatality zonesdiscussed in the next section, will help one gain an appreciation of the importance of avoidingrupture on this unique system at these exotically high pressures.
No credible design schemehas been provided thatcommits or ensures thatonshore pipeline pressureswill remain below 150 Bar.
16
IV. Onshore Pipeline Routing Issues
Proximity to Population
One major factor when determining the route for a new on land pipeline is its proximity topopulation, usually captured as dwellings and unsheltered gathering areas (schoolyards orsoccer fields for example). Depending on a country’s standards or regulations, there may beminimum distance requirements that set or influence some of the choices for a pipeline’s route.Various countries set no minimum distances between structures, unsheltered gathering sites, andpipelines, while others do.
BS 8010 attempts to address some of the concerns associated with population in proximity topipelines using a classification of location designation that sets a design factor. There is a majorweakness in setting the design factor for a pipeline via classification of location approach basedon a population density approach of so many people per hectare. 12 Population densitydeterminations don’t adequately address the issue where a pipeline may elect to come in closeto concentrations of people in sparsely populated countryside, that still meet the lower densityrequirement for location of class 1, such as small towns. A class 1 location permits pipelines tooperate up to 72% SMYS (for this pipeline this factor places pressures in serious pipelinerupture territory). To help address the shortcoming of population density in class locationapproaches, BS 8010 to its credit also sets for methane (in Figure 2 chart within Part 2 of thestandard) a minimum distance requirement for normally occupied buildings. Unfortunately, thischart only reflects pipeline pressures up to 100 Bar. The current proposed pipeline routethrough Rossport and other nearby villages meets the lowest population density class 1 location,but the pipeline pressures are off the chart and dwellings are close to the proposed pipelineroute. BS 8010 allows pipelines off the chart provided a risk analysis meeting certainrequirements is performed. A review of the proposed onshore pipeline route indicated in Figure3, highlighting dwellings in close proximity to the pipeline, should underscore the problem andthe reason for so much past effort being directed to risk assessments for this pipeline (the closestdwelling is apparently 70 metres from the pipeline).
Understanding Pipeline Releases
When discussing high pressure gas pipeline releases, it is important for the reader to understandthe two release scenarios associated with the discharge of highly compressed gas, leaks andruptures. At pressures greater than approximately 1 Bar, gas pipeline release will discharge atthe speed of sound. This phenomenon, also commonly known as choked flow, is a property ofthe ratio of the heat capacities and the temperature of the gas.13 For most natural gas richstreams and temperatures, the speed of sound is approximately 300 to 430 metres/sec (1000 to1400 ft/sec) depending on how one compensates for non-ideal gas factors associated withhighly turbulent high velocity flows. Regardless of the hole size, whether a pinhole leak or afull bore pipe rupture, the velocity of the gas will usually be limited by the speed of sound at thehole conditions. The major difference between a leak and a rupture, other than the fracturedynamics described earlier, is the difference in mass flow rate.
Mass flow rate determinations for leaks can be fairly easily calculated by assuming an orificehole size and estimating the pipeline pressure (which stays essentially constant at the leaklocation). Leaks can be very destructive if the gas can become capped or trapped in structureswhere it can then accumulate (leading to higher probability of building explosions). At thehigher operating pressures of this pipeline, leaks can still release a great deal of gas.
12 The design factor sets the maximum permitted percent of SMYS, or “internal design pressure,” that has a specificmeaning in the BS 8010 standard. The lower the design factor the lower the permitted maximum pressure.13 Gas composition will change the ratio of the heat capacities for a gas mixture.
17
Full bore ruptures release considerably larger mass at much higher rates than leaks. For rupture,the mass flow release rapidly spikes upward and then starts to decay with time. Mass release isdefined by the full bore orifice (combined rate from the two open ends of the pipeline) andupstream/downstream gas pressures that will not drop quickly on a high-pressure gas pipeline.The mass flow changes with time as the density of the gas, not the velocity, changes with time.These density changes are a function of various factors associated with a particular pipeline.This concept is difficult for the layman and many engineers to understand, but pipeline rupturesare not like a balloon bursting where loss of containment drops pressure to atmospheric almostinstantaneously.
The nature of a rupture mass release spike, or increase, and its subsequent decline depends onpipeline size, pressure, pipe hydraulics, pipeline length, deviation from ideal gas and, mostimportantly, the time to recognise and change the main gas flow near the rupture (time torecognise and actually close nearby valves if any are available). Dynamic simulation tools areused to predict mass releases over time for ruptures at specific locations on a specific pipeline.Depending on many complexities, there is a tendency for too many engineers to believe thesemodels calculate exact releases. In reality, they are far from exact, especially when their effortsfail to properly capture the poor recognition times associated with remotely identifying apipeline rupture. This delay adds greatly to already high mass release estimates, especially inthe critical early stages of a rupture where fatalities are most likely to occur because of highmass releases with ignition (which usually occurs within minutes if not seconds).
It is easy for inexperienced engineers to believe that their calculations modeling a pipelinerupture at a specific point are exact, when in reality many transients can easily modify suchcalculated results by a wide margin. Two major and serious deficiencies we find in riskmanagement approaches concerning pipeline ruptures are assumptions: 1) that rupture modelingassumes instantaneous or almost instantaneous identification by the SCADA or remotemonitoring system of a rupture, and rapid (nearby) valve closure, and 2) that the massiveair/fuel mixture doesn’t explode or ignite quickly. Neither one of these assumptions is realisticespecially for those very high pressures that can create their own ignition. Such erroneousassumptions critically understate the fatality zones and risks associated with a high-pressure gaspipeline rupture as will be explained in the next two sections.
A Reality Check on Understanding Gas Pipeline Ruptures
Given the incomplete information provided in previous public documents describing thedynamics and thermal consequence zones associated with a Corrib pipeline rupture, this authorbelieves additional detail about this failure consequence is warranted. As clearly demonstratedin Figures 5 and 7, thick-walled pipe is far from invincible to failure, either as a leak or arupture. Specifically focusing on ruptures, Figure 9 should serve as a reality check for anyonecalculating or attempting to model gas pipeline rupture impact zones for regulatory or standarddevelopment, or for siting of high pressure gas pipelines.
Figure 9 is a photo of the Carlsbad, New Mexico, August 19, 2000 natural gas transmissionpipeline rupture. This pipeline was a 30-inch pipeline with a 0.335 inch (8.51 mm) wallthickness (thin-walled pipe), Grade X-52 (52,000 psi SMYS), operating at a pressure of 675psig (46.6 Barg) that failed from internal corrosion.14 By now Figures 5 and 7 should havedispensed with any illusions that thick-walled and thin-walled pipe at these high stress leveloperating pressures will somehow fail differently.
14 NTSB Pipeline Accident Report, “Natural Gas Pipeline Rupture and Fire Near Carlsbad, New Mexico August 19,2000,” NTSB/PAR-03/01, Adopted February 11, 2003.

18
FIGURE 9. CARLSBAD, NEW MEXICO NATURAL GAS TRANSMISSION PIPELINERUPTURE (COURTESY OF THE NTSB)
To gain an appreciation of the height of the flame in Figure 9, the steel support towers are 24metres (80 feet) tall which would place the flame at almost 110 meters (370 ft) into the air.Given the time needed to get a camera to the site to take this picture (the flame burned forapproximately 55 minutes) it would be fair to assume that the photo was taken some time afterthe pipe rupture so the fuel release represented in the photo is well below the peak rapid spikeincreased mass flow which occurs at initial failure.
Figure 10 is an aerial photo of the Carlsbad failure site taken in the aftermath that should helpeveryone gain an appreciation of the thermal impact zone associated with a pipeline rupture.The nearest steel pipe support suspension tower on the river’s edge is approximately 183 meters(600 ft) from the rupture site. An extended family of 12 (including five children) campingapproximately 206 meters (675 ft) from the ruptured pipe all died as a result of the blast andthermal radiation received. Six of the victims, even though they were able to run and jump intothe river further away from the failure and in the shadow of the river gully, still received fatalthermal dosages and (given the extent of 3rd degree burns over their bodies) died within hours. Ido not provide these photos to scare or unduly alarm anyone, but rather to call serious attentionto the fact that engineers and risk managers sometimes forget that the numbers they areoftentimes overworking fail to match the reality, especially if they are mistaken in their criticalassumptions. Carlsbad serves as a very real reality check for anyone making poor riskmanagement pipeline decisions.
Referring to Figure 10, one can get an appreciation of how rupture events extend well beyondthe pipeline right of way. Once ignited, the large flame height significantly increases thethermal radiation dosage zone of the burning cloud. In the Carlsbad event, the steel towers werethermally stressed so badly that they and the pipelines they supported across the river had to beremoved from service.

19
FIGURE 10. CARLSBAD PIPELINE RUPTURE, THE AFTERMATH (COURTESY OF THE NTSB)
Because the phenomenon of gas jetting, roaring or blowing directly out the end of a pipelinerupture, is often misrepresented in risk analysis to understate impact zones or risk, furtherdiscussion is needed on this important issue. All buried gas pipeline ruptures gas jet and veryfew generate flames that hug the ground. In fact, Figure 9 represents a flame from a gas jettingfailure. Eventually, upon ignition, all the impact energy is dissipated and thermal energy raisesthe flame off the ground extending the impact zones. A closer examination of Figure 10 willindicate the typical circle of thermal impact zone from a rupture flame. In this case the photodoesn’t extend beyond the service bridge, but the thermal burn zone (described in the NTSBreport narrative) extended well beyond the service bridge and across the river, an areaapproximately 423 m (1400 ft) from the rupture site. The NTSB report clearly indicates thatpipeline emergency response personnel were not able to cross the service bridge with vehiclesto get to a nearby valve because of the high thermal flux. The point to be made here is that gasjetting doesn’t really reduce the radius for the thermal impact zone, it just moves the thermalzone circle down the pipeline and the zone can extend well beyond any right-of-way. Note therelative absence of extended severe thermal burning in the opposite direction of the towersupstream of the rupture crater site (toward top of the photo).
Finally, to put to rest any illusions thata gas jetting at sonic velocity from apipeline rupture may be an insignificantevent, Figure 11 is another photo of thecrater from the Carlsbad release.
This photo is looking downstream ofthe rupture toward the river (the bottomof Figure 10). The crater in this rupturecase was only approximately 34 m longby 16 m wide (113 ft long by 51 ftwide). The pipe missing between thearrows was shrapneled in several piecesmany hundreds of feet from the crater
FIGURE 11. CARLSBAD RUPTURE CRATER(COURTESY OF NTSB)
20
(part of the fracture process as the pipe fails in microseconds). The author has taken particulartime to benchmark the Carlsbad rupture because of the extensive clear documentation on thisspecific failure, including time to ignition that permits a reality check for those utilising variouspipeline rupture models. The author must state for the record that the Carlsbad pipeline failureis considered a moderate mass flow release for a high-pressure gas pipeline rupture. A CorribPipeline rupture, even though it is a smaller diameter pipeline, will release much more fuel at ahigher rate during the early critical minutes of a pipeline failure where ignition and subsequentfatalities are most likely (as will be described shortly).
Despite previous claims in some Corrib pipelinedocuments inferring that natural gas pipeline rupturesdon’t ignite, much less explode, the author invites thereader to review the website analysing the variousexplosions and blast forces determined for the Carlsbadevent recorded on distant seismographs.
The New Mexico Pipeline Explosion Seismic Signalssite where this information may be reviewed is:
http://www.ees.nmt.edu/Geop/Pipeline/pipeline.html
From these seismic measurements, time to ignition after pipe rupture at Carlsbad wasdetermined to be approximately 24 seconds. Contrary to previous opinions stated in Corribpipeline public documents, pipeline ruptures do not need a flame source to ignite a very largeand turbulent gas cloud. Despite the fairly tight flammability range of natural gas (5 to 15vol.%), many gas pipeline ruptures ignite for various reasons. Sparks generated by pipeshrapnel, thrown rocks sparking, and static electricity are just a few of the sources of ignition inaddition to flame sources. For these massive rate releases, ignition usually occurs in the earlyminutes of release when mass flow has spiked at its highest and is starting its decay, but is stillvery large.
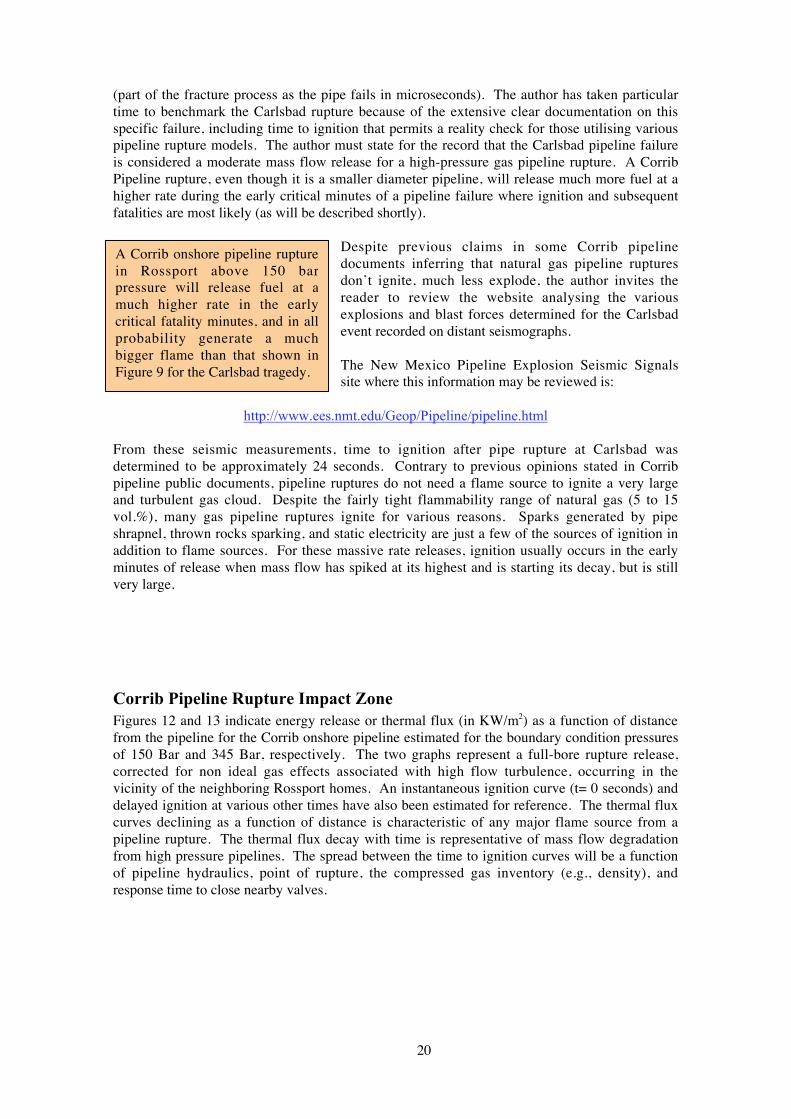
Corrib Pipeline Rupture Impact Zone
Figures 12 and 13 indicate energy release or thermal flux (in KW/m2) as a function of distancefrom the pipeline for the Corrib onshore pipeline estimated for the boundary condition pressuresof 150 Bar and 345 Bar, respectively. The two graphs represent a full-bore rupture release,corrected for non ideal gas effects associated with high flow turbulence, occurring in thevicinity of the neighboring Rossport homes. An instantaneous ignition curve (t= 0 seconds) anddelayed ignition at various other times have also been estimated for reference. The thermal fluxcurves declining as a function of distance is characteristic of any major flame source from apipeline rupture. The thermal flux decay with time is representative of mass flow degradationfrom high pressure pipelines. The spread between the time to ignition curves will be a functionof pipeline hydraulics, point of rupture, the compressed gas inventory (e.g., density), andresponse time to close nearby valves.
A Corrib onshore pipeline rupturein Rossport above 150 barpressure will release fuel at amuch higher rate in the earlycritical fatality minutes, and in allprobability generate a muchbigger flame than that shown inFigure 9 for the Carlsbad tragedy.
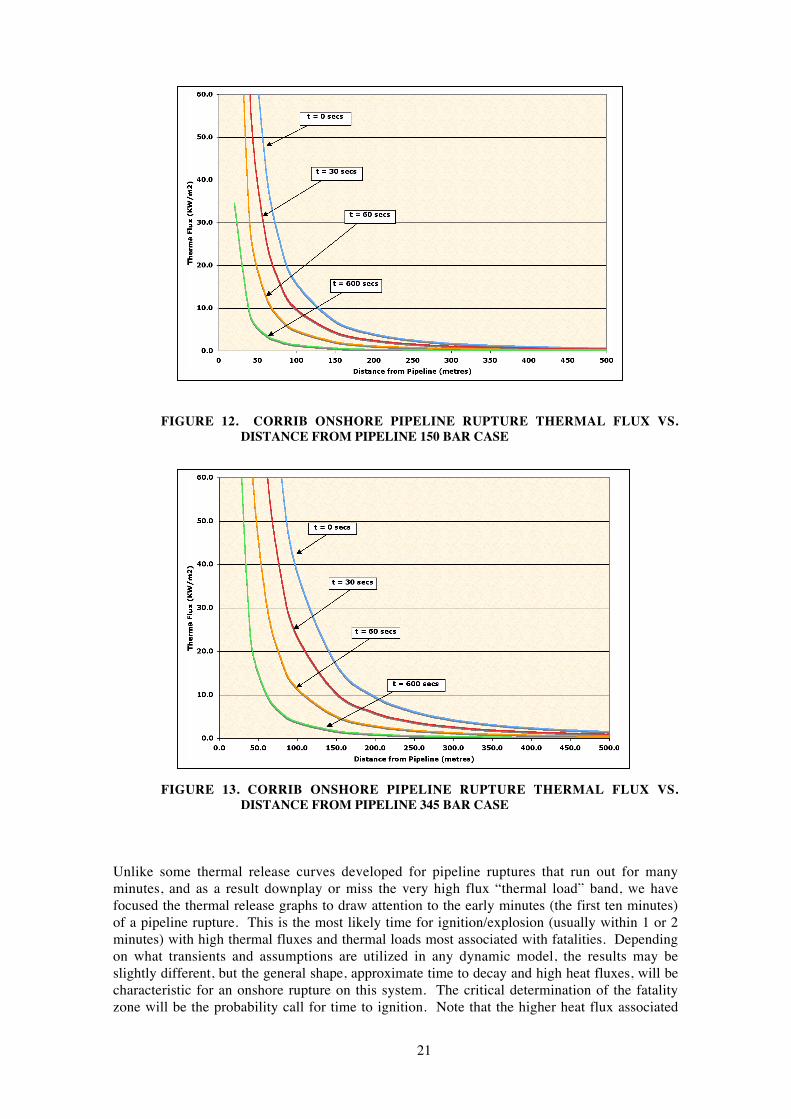
21
FIGURE 12. CORRIB ONSHORE PIPELINE RUPTURE THERMAL FLUX VS.DISTANCE FROM PIPELINE 150 BAR CASE
FIGURE 13. CORRIB ONSHORE PIPELINE RUPTURE THERMAL FLUX VS.DISTANCE FROM PIPELINE 345 BAR CASE
Unlike some thermal release curves developed for pipeline ruptures that run out for manyminutes, and as a result downplay or miss the very high flux “thermal load” band, we havefocused the thermal release graphs to draw attention to the early minutes (the first ten minutes)of a pipeline rupture. This is the most likely time for ignition/explosion (usually within 1 or 2minutes) with high thermal fluxes and thermal loads most associated with fatalities. Dependingon what transients and assumptions are utilized in any dynamic model, the results may beslightly different, but the general shape, approximate time to decay and high heat fluxes, will becharacteristic for an onshore rupture on this system. The critical determination of the fatalityzone will be the probability call for time to ignition. Note that the higher heat flux associated
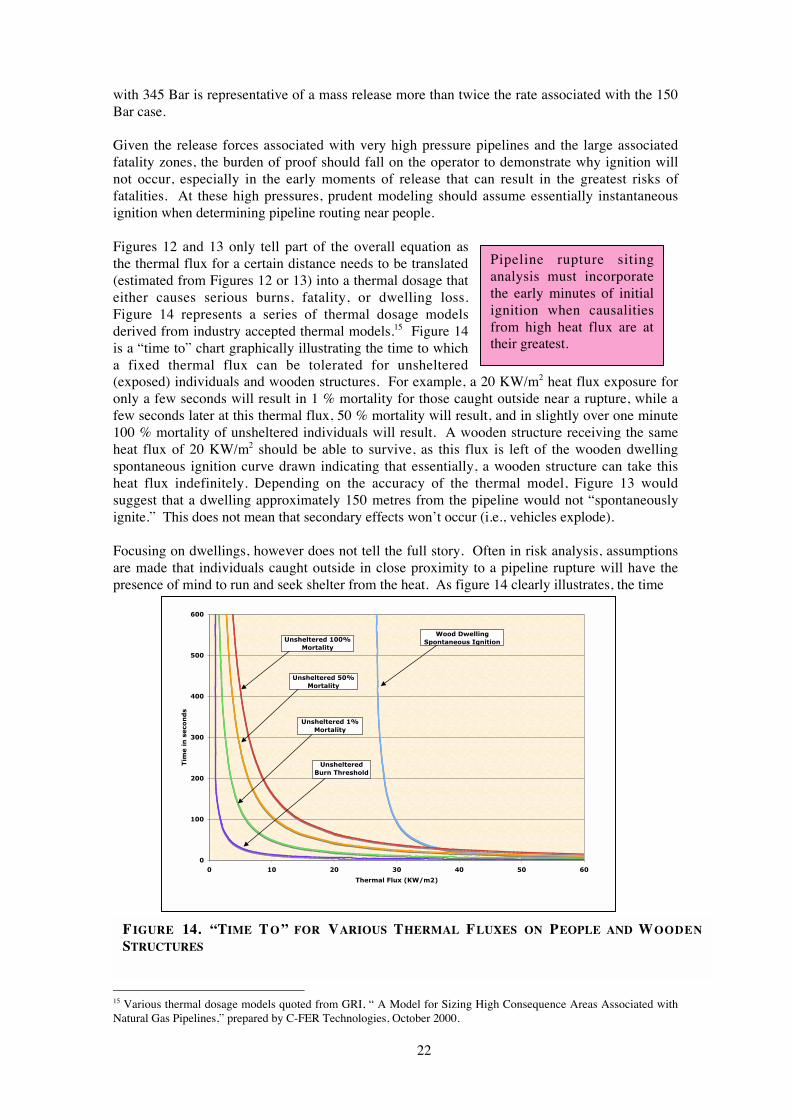
22
with 345 Bar is representative of a mass release more than twice the rate associated with the 150Bar case.
Given the release forces associated with very high pressure pipelines and the large associatedfatality zones, the burden of proof should fall on the operator to demonstrate why ignition willnot occur, especially in the early moments of release that can result in the greatest risks offatalities. At these high pressures, prudent modeling should assume essentially instantaneousignition when determining pipeline routing near people.
Figures 12 and 13 only tell part of the overall equation asthe thermal flux for a certain distance needs to be translated(estimated from Figures 12 or 13) into a thermal dosage thateither causes serious burns, fatality, or dwelling loss.Figure 14 represents a series of thermal dosage modelsderived from industry accepted thermal models.15 Figure 14is a “time to” chart graphically illustrating the time to whicha fixed thermal flux can be tolerated for unsheltered(exposed) individuals and wooden structures. For example, a 20 KW/m2 heat flux exposure foronly a few seconds will result in 1 % mortality for those caught outside near a rupture, while afew seconds later at this thermal flux, 50 % mortality will result, and in slightly over one minute100 % mortality of unsheltered individuals will result. A wooden structure receiving the sameheat flux of 20 KW/m2 should be able to survive, as this flux is left of the wooden dwellingspontaneous ignition curve drawn indicating that essentially, a wooden structure can take thisheat flux indefinitely. Depending on the accuracy of the thermal model, Figure 13 wouldsuggest that a dwelling approximately 150 metres from the pipeline would not “spontaneouslyignite.” This does not mean that secondary effects won’t occur (i.e., vehicles explode).
Focusing on dwellings, however does not tell the full story. Often in risk analysis, assumptionsare made that individuals caught outside in close proximity to a pipeline rupture will have thepresence of mind to run and seek shelter from the heat. As figure 14 clearly illustrates, the time
15 Various thermal dosage models quoted from GRI, “ A Model for Sizing High Consequence Areas Associated withNatural Gas Pipelines,” prepared by C-FER Technologies, October 2000.
0
100
200
300
400
500
600
0 10 20 30 40 50 60
Thermal Flux (KW/m2)
Tim
e i
n s
eco
nd
s
Wood Dwelling
Spontaneous IgnitionUnsheltered 100%
Mortality
Unsheltered 50%
Mortality
Unsheltered 1%
Mortality
Unsheltered
Burn Threshold
Pipeline rupture sitinganalysis must incorporatethe early minutes of initialignition when causalitiesfrom high heat flux are attheir greatest.
FIGURE 14. “TIME T O ” FOR VARIOUS THERMAL FLUXES ON PEOPLE AND WOODENSTRUCTURES

23
to get into a shelter, away from the heat is measured in seconds. Figure 14 would also suggestthat a 5 KW/m2 heat flux provides only minutes for people to leave the area if they can. At 5KW/m2 heat flux, individuals within 300 metres of the pipeline are at risk. The Carlsbad realitycheck would, however, suggests that a more appropriate buffer zone for unsheltered individualsis 400 to 500 metres, and 200 metres for dwellings.
BS 8010’s graph to 100 bars pressure is definitely coming upshort on dwelling survival distance, but in all fairness thestandard probably didn’t envision such high pressure pipelines,as in the Corrib proposal, that can generate large heat fluxesfor many minutes. These are large distance numbers, but againthese are exotically high pressures, which begs the question“Who would want to run such a high pressure pipeline nearpeople, especially when there appear to be many more remoterouting options?” More restrictive countries establish lowerKW/m2 values as an offsite acceptable heat flux for facilities that can generate high thermalflux, while less progressive countries have higher threshold values, or none at all, for pipelineevents.16
For those who may argue that someone located outside can run away from a pipeline flame andthus decrease the suggested safety zone, running will not compensate for the very high initialthermal load (radiation dosage) that can and will most likely occur on rupture. At these highthermal loads, credit for running to a safe distance is inappropriate. Imagine trying to maintaina frame of mind while running with your clothes and skin on fire! Referring back to Figure 10,the unfortunate victims in the Carlsbad tragedy, even if they had reached and crossed the servicebridge, had already received and were continuing to receive fatal thermal dosages from the veryhigh early thermal flux. In the Carlsbad case, no matter what direction and how fast theindividuals had run, they were well beyond (right of) the “Time to” curve for 100 % mortalityexposure shown in Figure 14 because of the severe initial thermal loading associated with earlyignition. It is a mistake to portray that such high thermal loading occurs on high pressure gaspipeline system ruptures only for a few seconds.
16 The U.S. has no defined federal pipeline siting regulations and no acceptable thermal flux limit for pipelineruptures, though a 15.8 KW/m2 (5000 BTU/hr ft2) is often implied in analysis wrongfully suggesting there are suchrequirements to justify poor pipeline route selection.
Early ignition scenariosand Carlsbad would placethe safe distance for adwelling at 200 metres andthe safe distances forunsheltered individualsbeyond 400 metres.

24
FIGURE 15. ROSSPORT 400 METRE RUPTURE IMPACT ZONE
The green band lines in Figure 15 represent an approximate 400 metre zone from the proposedpipeline in proximity to Rossport. Most of the citizens are within the band for unshelteredindividuals. Note the large number of dwellings in close proximity to the pipeline well within200 metres from the pipeline.
Sensitive Waterways
When reviewing possible routes for pipelines, priority is usually given to routes that avoidpeople as demonstrated by the discussion in the previous section. As possible routes areevaluated, additional environmental restrictions may come into play influencing routealternatives. Depending on a country’s regulatory environment, these restrictions usuallymanifest themselves as conditions pertaining to sensitive waterways containing susceptibleecosystems.
It is the nature of gas systems thattheir failure is less prone topermanent ly damage la rgeecosystems. There will beexceptions to this statement, but it isgenerally true. Ironically, for a gaspipeline system, most of theecological damage or risk from suchdamage usually occurs in theconstruction phase. Pipelineconstruction teams can get ahead ofthe operator’s best intentions,especially if project schedules arepressing (as they usually always are).
In first reviewing the proposedonshore pipeline route, this authorwas struck with the question of why is the land route in close proximity to so many people?
FIGURE 16. SRUWADDACON BAY

25
It is this author’s opinion that the current proposed land route has more to do with ease ofconstruction and shortest pipeline path (cheapest route mentality) than a properly evaluatedroute selection. Given this author’s experience and background, and a natural bias to first focuson protecting people, the next observation was why didn’t the operator consider a route up themiddle of the Sruwaddacon Bay? Closer examination suggests that a bay route does notprovide quite enough proximity distance. It also appears that the bay may be a sensitive routewith some very unusual construction and tidal surge challenges. This author has difficultyaccepting the premise that all the other options for possible pipeline landfall are so difficult orrestrictive so as to leave only the general bay location scheme.
V. Pipeline Construction Issues
The pipeline is to be constructed to DNV OS-F101 SAWLstandards, which is claimed to be equivalent to API 5L gradeX 70. The pipe will have a nominal outside diameter of508mm (20 inches) with a nominal thickness of 27.1 mm(1.07 inch). This is considered thick-walled pipe.
The Thick-Walled Pipe Conundrum
Thick-walled pipe brings certain positive benefits and certain different concerns. For example,thick-walled pipe operating at high stress levels increase the likelihood of third party damagebecoming a time dependent failure.17 It is important to realize that, in many cases, the thickerthe pipe the greater the safety margin. This safety benefit, however, rapidly diminishes as theoperating pressure as a percentage of SMYS increases. As mentioned and demonstrated indetail (see Figures 5 and 7), thick-walled pipe is not invincible to various failure threats such ascorrosion that can cause either leak or rupture releases. Any attempts to represent that thick-walled pipe is invincible or that it can be treated with disrespect needs to be seriouslychallenged, as modern pipe fracture mechanics will prove such perspectives most unwise.
Thick-walled pipe also presents difficulties for smart pig or inline inspection (ILI) as discussedin detail in Section VI Operational and Maintenance Issues of Concern. Certain smart piginspection technologies will not work well on thick-walled pipe, a point that has not beenmentioned in previous Corrib pipeline public documents, implying that ILI will be a highlyeffective safety net on this system. Given the importance that corrosion, especially internalcorrosion can play on possible premature pipe failure, specific information related to ILIinspection claims and performance need to be clearly defined and documented. Over relianceon ILI performance or effectiveness in a risk analysis to prevent pipe failure from corrosioncould prove fatal with this pipeline. New ILI inspection processes have recently beenpromulgated as an API industry standard to better define the limits of ILI applications on aspecific pipeline; a much needed improvement for the pipeline industry that may utilise ILI asan integrity management tool.18
17 It is a very serious mischaracterisation for any risk analysis to utilise historical databases in their statisticssuggesting the same third party damage frequencies on pipelines (even thick-walled) that are operating at much lowerstress levels.18 American Petroleum Institute, API Standard 1163, “In-line Inspection Systems Qualification Standard, “FirstEdition, August, 2005.
A further analysis ofpipeline route alternatives iswarranted to ensure thatoptions were properlyreviewed and analysedshould an onshore gas plantprove acceptable.
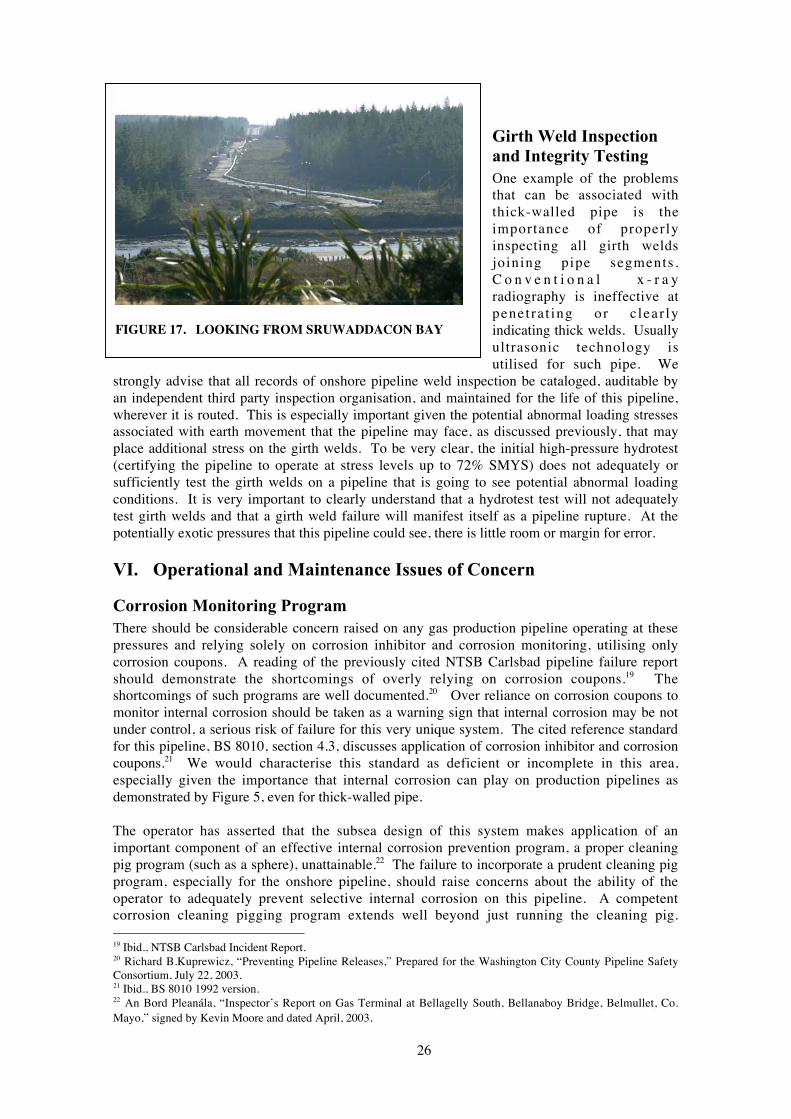
26
Girth Weld Inspection
and Integrity Testing
One example of the problemsthat can be associated withthick-walled pipe is theimportance of properlyinspecting all girth weldsjoining pipe segments.C o n v e n t i o n a l x - r a yradiography is ineffective atpenet ra t ing or c lear lyindicating thick welds. Usuallyultrasonic technology isutilised for such pipe. We
strongly advise that all records of onshore pipeline weld inspection be cataloged, auditable byan independent third party inspection organisation, and maintained for the life of this pipeline,wherever it is routed. This is especially important given the potential abnormal loading stressesassociated with earth movement that the pipeline may face, as discussed previously, that mayplace additional stress on the girth welds. To be very clear, the initial high-pressure hydrotest(certifying the pipeline to operate at stress levels up to 72% SMYS) does not adequately orsufficiently test the girth welds on a pipeline that is going to see potential abnormal loadingconditions. It is very important to clearly understand that a hydrotest test will not adequatelytest girth welds and that a girth weld failure will manifest itself as a pipeline rupture. At thepotentially exotic pressures that this pipeline could see, there is little room or margin for error.
VI. Operational and Maintenance Issues of Concern
Corrosion Monitoring Program
There should be considerable concern raised on any gas production pipeline operating at thesepressures and relying solely on corrosion inhibitor and corrosion monitoring, utilising onlycorrosion coupons. A reading of the previously cited NTSB Carlsbad pipeline failure reportshould demonstrate the shortcomings of overly relying on corrosion coupons.19 Theshortcomings of such programs are well documented.20 Over reliance on corrosion coupons tomonitor internal corrosion should be taken as a warning sign that internal corrosion may be notunder control, a serious risk of failure for this very unique system. The cited reference standardfor this pipeline, BS 8010, section 4.3, discusses application of corrosion inhibitor and corrosioncoupons.21 We would characterise this standard as deficient or incomplete in this area,especially given the importance that internal corrosion can play on production pipelines asdemonstrated by Figure 5, even for thick-walled pipe.
The operator has asserted that the subsea design of this system makes application of animportant component of an effective internal corrosion prevention program, a proper cleaningpig program (such as a sphere), unattainable.22 The failure to incorporate a prudent cleaning pigprogram, especially for the onshore pipeline, should raise concerns about the ability of theoperator to adequately prevent selective internal corrosion on this pipeline. A competentcorrosion cleaning pigging program extends well beyond just running the cleaning pig. 19 Ibid., NTSB Carlsbad Incident Report.20 Richard B.Kuprewicz, “Preventing Pipeline Releases,” Prepared for the Washington City County Pipeline SafetyConsortium, July 22, 2003.21 Ibid., BS 8010 1992 version.22 An Bord Pleanála, “Inspector’s Report on Gas Terminal at Bellagelly South, Bellanaboy Bridge, Belmullet, Co.Mayo,” signed by Kevin Moore and dated April, 2003.
FIGURE 17. LOOKING FROM SRUWADDACON BAY
27
Analysis of material removed with the pig, especially for corrosion products, is important toidentify internal corrosion activity at possible “hotspots” that the inhibitor may not prevent, orcoupons not indicate. This could lead to premature failure. The importance of properlyevaluating internal corrosion rate in any analysis on this pipeline should be evident from areview of Figures 4 and 5 as selective corrosion can seriously reduce the integrity of thispipeline. Assuming there is no internal corrosion because one’s corrosion inhibitor programand coupon monitoring program is assumed to work is a delusion fraught with much danger,especially given the proposed routing of this pipeline.
Smart Pigging and Thick-Walled Pipe
Smart pigging or inline inspection (ILI) is often claimed to be the superior method of inspectingpipelines for certain flaws or anomalies that can lead to failure, either leak or rupture. What isnot well understood is that misapplication of the smart pigging process, such as the choice ofthe wrong pig, and mismanagement of the pig determinations and verifications can seriouslyrender ILI ineffective.23 New industry standards have now been incorporated to address someof these serious shortcomings concerning the misapplication of ILI to confirm pipelineintegrity.24 We find the public documents published to date for the Corrib pipeline to beincomplete and seriously deficient in detail concerning the issues of ILI and thick-walled pipereliable inspection. Given the importance that ILI can play in preventing failure from corrosion,any risk analysis that fails to properly address ILI effectiveness on this system would be deemedcritically deficient.
The application of smart pigging on thick-walled pipelines is not without serious challenges.The implication that such tools will prevent failure are overstated, a definite risk when taken incombination with other missing elements of an effective corrosion program. No details areprovided about which ILI smart pig technology will be utilised to inspect this pipeline, a seriousdeficiency in any risk analysis approach. In all probabilitymore than one smart pig technology will be required asrunning only one type of ILI is usually considered anindication of an incomplete ILI program. There are at leasttwo serious threats that require different smart pigtechnologies, corrosion and third party damage of the typediscussed shortly, which can result in time dependent pipefailure. There is a serious probability that QRAs to datehave overstated the effectiveness of these importantprograms to prevent failure on this pipeline, and understatedthe likelihood of failure as a result.
Third Party Damage Concerns
While it is usually true that the thicker the pipe the higher the potential to avoid failure in manycases, this statement must be taken in the context of operating pressure, specifically the muchhigher likelihood that this pipeline will be operated at very high stress levels as mentionedpreviously. While thicker pipe tends to resist or prevent immediate failure from third party
damage, this damage (i.e., cuts, gouges,grooves) is subject to cycling growth-inducedfailure at a later date. For the high stress levelsexpected on this production pipeline, we findrisk analysis indicating that thick pipe will notbe subject to cycle induced fatigue failure and
thus “not a risk of concern” to be inadequate.
23 Richard B. Kuprewicz, “Observations on the Application of Smart Pigging on Transmission Pipelines,” preparedfor the Pipeline Safety Trust, September 5, 2005.24 Ibid., API Standard 1163.
Running a smart pig is theeasiest and usually cheapestpart of an overall effective ILIinspection program. Muchmore effort is involved inchoosing the right pig andverifying and responding topig observations.
Risk analysis conclusions dismissingfatigue cycle induced third party damagefailure on this high stress level pipelineappear incomplete.

28
It is the nature of production pipelines to load slug as liquid/solid carryover cycles the system.This, as well as the additional corrosion risks discussed in Section III, are some of thefundamental differences between design/operation of production and transmission pipelines.Theoretically, flaw growth plots similar to those for corrosion (Figures 5 and 7), can bedeveloped for sharp edged pipeline flaws such as third party damage gouges. The tests,theories, and many years of field verification that evolved for corrosion failure tools onpipelines have yet to be clearly developed for the sharp edged flaws. Corrosion anomalies tendto have varying thickness that do not concentrate the stresses in a manner such as that associatedwith sharp edge flaws (gouges). A fracture mechanics model developed for steel pipe wouldtake on a similar appearance to that of Figures 5 and 7, with flaw sizes of sharp edge permittedat the same pressure level being much smaller than that for corrosion. For a given pressure, apipeline can tolerate a corrosion flaw but not necessarily the same size (depth and length) sharpedge gouge anomaly. It is very important that any pipeline route take rational precautions toavoid and prevent possible third party damage on such a high-pressure pipeline that commandssuch a large potential impact zone.
Thicker pipe, even at the higher stress levels, does provide one definite benefit in regard to aspecific type of third party damage threat. Damages where a hit results in a stress concentratorwithin a dent (i.e., dent with a gouge, crack, or corrosion). Dent with stress concentrators arenot permitted in most codes or regulations as their time to failure are very unpredictable (theycan fail at any time). Most third party damage on thick-walled pipe will probably result in agouge rather then a gouge within a dent. The stress concentrator may not fail immediately, butsuch damage would be susceptible to fatigue cycling and possible failure that is still veryunpredictable.
Lastly, a major issue of concern regarding third party damage,that of the waiver from the requirement to utilise a 0.3 designcriteria (much thicker wall pipe) for road and railroadcrossings. The pipeline is proposed to be constructed with a0.72 design factor throughout the system, including roadcrossings. There are two major risks associated with crossings: 1) possible damage associatedwith third party activity that could hit and possibly gouge the pipeline as discussed above, and2) abnormal loading associated with heavy traffic crossing the pipeline. Requirements to installa concrete warning barrier and warning tape appear adequate to address the first risk of concern.Usually, to protect from the second risk of concern, the pipeline is either encased or buried verydeeply to spread the loading forces. We do not advise casing the pipe in this environment ascasing can accelerate selective external corrosion. The operator needs to provide detailedloading calculations assuring that each specific site crossing will provide adequate safetymargin from abnormal loading that could result in pipeline failure from crush or similar loading.Given the thickness of the pipe, road crossing abnormal loading should not be an area ofconcern, but this needs to be clearly demonstrated.
Remote Monitoring of Pipelines
Little mention is given in various public documents as to how this pipeline will be remotelyoperated or controlled. This is no surprise as most regulatory requirements do not address thisissue competently, or even provide minimal guidance. There is an indication that the controlcentre for the pipeline will be at the Gas Processing Plant control room. A clear reading of thispaper should raise new questions as to how this pipeline should be controlled, protected fromoverpressure, and monitored.
The Illusions of Leak Detection
Several studies concerning the Corrib pipeline have indicated a desire to improve safetyperformance and reduce risks by incorporating “sophisticated automatic leak detection” on thispipeline. While common sense would suggest an attempt at some form of leak detection on this
Road crossing loadingcalculations need to beadequately documented.
29
system, we must caution that any credit for such a system is highly illusionary for thisproduction pipeline. Despite claims that may be made by leak system manufacturers sellingsuch systems, the likelihood of any of these systems identifying leaks in real time is nearly zero(the author can’t rule out random luck accidentally flagging a release). We find claims,assertions, or inferences that any sophisticated automatic leak detection system operating on theCorrib pipeline will actually prevent casualties or fatalities near the pipeline to be without merit.For the record, the author has seen many “leak detection” systems and none has really workedreliably to date. An analysis of the long record of gas pipeline failures will prove thefrustrations of trying to get a remote leak detection system to properly signal a real release on ahighly compressed gas system (i.e., forget mass balance) without burdening the control roomoperator with a phalanx of false alarms that train operators to ignore alarms.
The truth of the matter is that for leaks (releases from fixed orifices as described in section IV –Understanding Pipeline Releases), the compressibility of the gas and the multiple phaseoperation of this production pipeline make leak discovery via remote monitoring extremelydifficult if not impossible. It must also be stressed that this gas will be unodorised (thetraditional method of alerting the public and neighborhood of possible signs of leaks on apipeline). The only method that has a chance of determining gas leaks on this onshore pipelineis the tried and true method of walking the pipeline with an appropriate gas detector, and eventhis approach is not infallible and only detects possible leaks at the time of the survey.
It is now important to discuss rupture releases and the inability of leakdetection monitoring systems to reliably determine such massivereleases. As incredible as this may appear, many in the pipelineindustry do not easily understand or grasp this concept so the averagelayman can be forgiven for not comprehending this point at first review.Leak detection systems are not able to determine the high mass ratereleases associated with ruptures in a gas pipeline in a timely manner.This is due to the many transient factors mentioned in Section IV suchas the compressed nature of the gas, choke flow, and pipe hydraulicdynamics. As a result, the various critical signals don’t get recognised
by detection devices either upstream or downstream of the rupture in sufficient time to respondto a rupture and prevent fatalities within the zone. In fact, the number one method for detectionof a gas pipeline rupture is a call in by observers who may witness such an event.Unfortunately, given the very large size of the rupture impact zone for this very unique pipeline,callers may not be nearby as those people near a rupture, in all probability, will be dead ordying. It has been suggested that the meter entering the Gas Processing Plant (at the end of theonshore pipeline) can be utilised to indicate a pipeline rupture on the onshore pipeline.Transient release calculations indicate the time it would take for such a clear indication to showup at the Gas Processing Plant, even at this relatively short distance, will be past the major andmultiple fatality exposure time for a rupture event.
Any claims that mass balance can identify leaks or failures on this pipeline need to be seriouslychallenged. Even if one could accurately mass balance in and out of the pipeline there is noway that a correct accounting of the change in gas inventory could permit an accurate leak orrupture detection. This pipeline contains a highly compressible fluid operating in the triplephase region (solid/liquid/gas) with a pipeline diameter that seriously affects transientdynamics. Under our obligation to maintain objectivity and completeness, a meter at the GasProcessing Plant end of the pipeline may eventually suggest a possible rupture, but by the timethis signal is indicated (it isn’t immediate because of line hydraulics), acknowledged, andresponded to by control centre personnel, in all probability the rupture cloud has ignited. Ourintent is not to scare, but this is serious material being transported at very high pressures.Frankness is merited especially given the extreme inexperience evidenced in previousstatements implying the effectiveness of leak detection to prevent fatalities.
In any riskanalysis no creditshould beincurred for“automatic” leakdetection on thissystem.

30
VII. The Myth of Highest International Standards
Major Differences in International Standards
Several international standards have been reported and compared in an accompanying studyrelated to the Corrib pipeline.25 A reading of that study will leave the observer questioning ifthere really is a clear guideline standard for this pipeline. There should be no surprise about thisconfusion as many of these standards are in a state of flux and do not adequately address thevery unique operation of the Corrib onshore pipeline. For example, none of the cited standardsdirectly address the extreme pressureoperation of the Corrib pipeline (e.g.,the pressure is off the chart invarious standards that attempt toquantify separation distances fromdwellings).
The author is often asked about which international pipeline standards are the best. We believethat no one standard is the best. Some standards are better in some areas, even leading edge incertain areas, and very incomplete in other areas. These differences, that can be veryimportant, vary from country to country. One particular country’s standards, even if they are“better” in certain areas, may not be applicable to a particular situation in another country asmany factors may be different. It is a myth perpetuated by the industry that there areinternational standards out there that reign supreme, especially if a country permits risk analysisto waive even those minimum requirements that may have been developed through years ofexperience.
Highest international standard statements tend to create an illusion that can be very dangerous,especially if this illusion relies on misapplication of risk analysis techniques, or if the projectteam starts to believe their own myths that nothing will fail, and takes very unnecessary orunwise risks in their design approach to reduce costs.
A pipeline design only complying with minimum regulations needs to be carefully analysed andscrutinised. This is especially critical if the project is pushing technical boundaries such asbeing a “model one” or “off the chart” in the minimum standards. There is nothing thatprevents an operator from exceeding any standard. By now it should be obvious to most readersthat critical information regarding this project has not been disclosed, and maybe not evenconsidered, and these important details need to be publicly discussed and the project’s proposeddesign reevaluated. This is especially important given the many serious misrepresentationsconcerning this project as identified in this report. One other important point regardinginternational pipeline standards is that the physical laws governing prudent engineeringapproaches know no international boundaries.
The Standard Driving This Pipeline
The standard most often cited in various public documents for the Corrib pipeline is BS 8010(circa 1992), a standard that has now gone out of date. Because of the need to restrict the lengthof this paper, the author will focus on the one major section of this code that appears to bedriving the over focus on risk analysis or QRA. The BS 8010 code, subsection 2.4.2.4 states“Pipeline designed to operate outside the range of maximum operating pressure and pipediameters shown in figure 2 may be acceptable provided a more detailed assessment of potentialadditional hazard is made in conjunction with a safety evaluation (see 2.3).”26 Figure 2 is achart of “Minimum distances from normally occupied buildings for methane (a category Dsubstance.)” The chart only goes up to 100 Bar maximum operating pressure. Subsection 2.3
25 Ibid., Andrew Johnson, “Corrib Gas Pipeline Project Report on Evaluation of Onshore Pipeline Design Code.”26 Ibid., BS 8010.
Proclamations claiming “highest internationalstandards” carry very little weight and appear to bea public relations attempt to placate an inquiringpublic challenging or raising real issues of concern.
31
outlines requirements of a safety evaluation and includes subsection 2.3.2 defining theminimum requirements needed to incorporatea “Risk Analysis.”
A comparison of the many key issues notedin this paper to previous QRAs for the Corribpipeline will clearly demonstrate seriousdeficiencies, mischaracterisations, and/ormisstatements in these prior efforts. TheQRA approach needs to be seriously re-evaluated for this unique onshore, very high pressure, pipeline system.
Misperceptions and Misapplications of QRA
While it should now be obvious after reading the above section why there is so much focus onQRA for this particular proposed pipeline, additional comments concerning the QRA processneed to be captured as a matter of public record. While this author has been very clear that riskanalysis for the Corrib proposal has failed to meet the minimum requirements for a risk analysisdefined in BS 8010, a brief commentary on several additional common errors observed in alltoo many risk analyses is necessary. Special attention should be given to any risk assessmentthat summarily dismisses specific failure cases as “not credible” without sufficient proof. Theburden of substantiation should rest on the risk performer to demonstrate why such an eventwas not evaluated. The dismissal of events as “not credible” can be overly utilised tomanoeuvre a risk analysis to a preordained conclusion. That is not the intent or purpose instandards that usually allow the use of this tool.
While a statistically based assessment of failure mode and frequency is required in some riskassessment approaches, all too often the statistical base does not represent the assets beingevaluated. For example, utilising past pipeline databases for rupture frequency that includedistribution as well as transmission pipelines seriously under represent the high stress pipelinefailure frequency, as distribution pipelines don’t rupture. Assuming a production pipeline hasthe same failure frequency from internal corrosion as a transmission pipeline also understatesproduction pipeline statistics for failure, as transmission pipelines are usually not permitted totransport the more corrosive fluids associated with production pipelines. And lastly, we mustcomment that statistical approaches mainly focusing on past historical events or databases don’tproperly apply to first of their kind or model one infrastructure. History is a very poor predictorof future failures for such new, complex, at-risk systems that may be pushing the envelope. Askthe NASA launch management team on the last Challenger launch about the follies of rushingto a pre-ordained objective based on past history prediction calls. Quite simply, it should beobvious by now that risk analysis is very inappropriate for this most unusual, first of its kind,application in Ireland.
VIII.Why the Corrib Gas Must be Treated
By now the reader should be starting to appreciate thatthe production gas from the Corrib field createsadditional risks on a steel pipeline (see Figure 4, 5, and7 for just the corrosion issues). The gas is notacceptable to be transported in gas transmission ordistribution pipelines. This begs the question of whywould such a high-pressure production pipeline beplaced in the close vicinity of population. The bulk ofthe previous discussion has focused on the pipeline for
very critical, and by now obvious, reasons. Pipelines can have very large impact footprints inclose proximity to people. From a safety perspective, an onshore Corrib pipeline rupture
The proposed onshore pipelineroute presents the greatest risk topopulation. The Gas ProcessingPlant placement greatly influencesrisks associated with the onshorepipeline.
Risk analyses to date for the Corribonshore pipeline have failed to properly oradequately comply with the five basicminimum requirements defined inStandard BS 8010, subsection 2.3 (athrough e) allowing risk analysis.
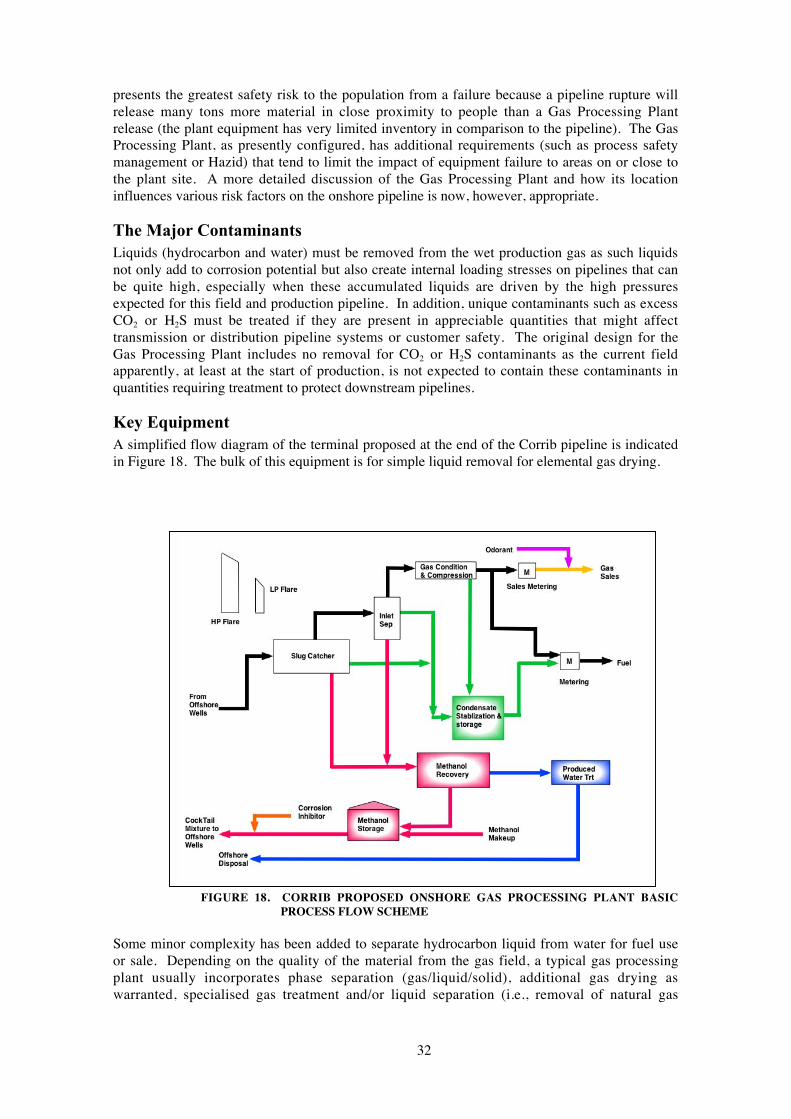
32
presents the greatest safety risk to the population from a failure because a pipeline rupture willrelease many tons more material in close proximity to people than a Gas Processing Plantrelease (the plant equipment has very limited inventory in comparison to the pipeline). The GasProcessing Plant, as presently configured, has additional requirements (such as process safetymanagement or Hazid) that tend to limit the impact of equipment failure to areas on or close tothe plant site. A more detailed discussion of the Gas Processing Plant and how its locationinfluences various risk factors on the onshore pipeline is now, however, appropriate.
The Major Contaminants
Liquids (hydrocarbon and water) must be removed from the wet production gas as such liquidsnot only add to corrosion potential but also create internal loading stresses on pipelines that canbe quite high, especially when these accumulated liquids are driven by the high pressuresexpected for this field and production pipeline. In addition, unique contaminants such as excessCO2 or H2S must be treated if they are present in appreciable quantities that might affecttransmission or distribution pipeline systems or customer safety. The original design for theGas Processing Plant includes no removal for CO2 or H2S contaminants as the current fieldapparently, at least at the start of production, is not expected to contain these contaminants inquantities requiring treatment to protect downstream pipelines.
Key Equipment
A simplified flow diagram of the terminal proposed at the end of the Corrib pipeline is indicatedin Figure 18. The bulk of this equipment is for simple liquid removal for elemental gas drying.
FIGURE 18. CORRIB PROPOSED ONSHORE GAS PROCESSING PLANT BASICPROCESS FLOW SCHEME
Some minor complexity has been added to separate hydrocarbon liquid from water for fuel useor sale. Depending on the quality of the material from the gas field, a typical gas processingplant usually incorporates phase separation (gas/liquid/solid), additional gas drying aswarranted, specialised gas treatment and/or liquid separation (i.e., removal of natural gas
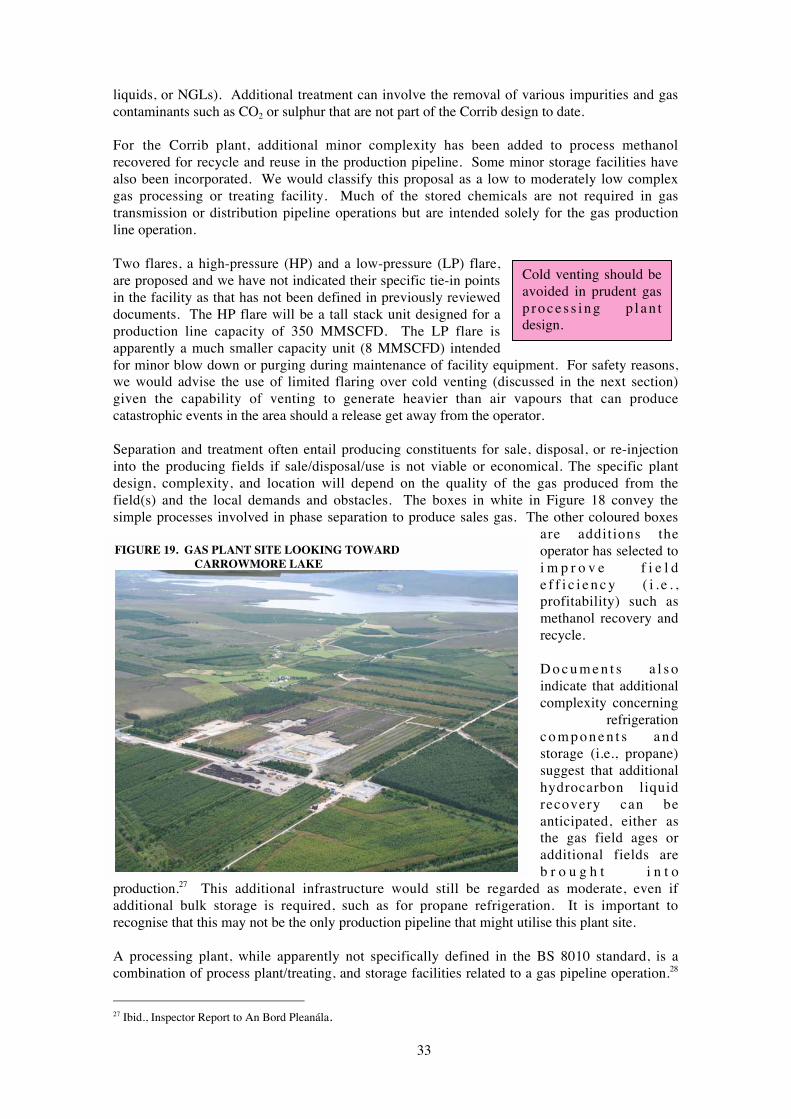
33
liquids, or NGLs). Additional treatment can involve the removal of various impurities and gascontaminants such as CO2 or sulphur that are not part of the Corrib design to date.
For the Corrib plant, additional minor complexity has been added to process methanolrecovered for recycle and reuse in the production pipeline. Some minor storage facilities havealso been incorporated. We would classify this proposal as a low to moderately low complexgas processing or treating facility. Much of the stored chemicals are not required in gastransmission or distribution pipeline operations but are intended solely for the gas productionline operation.
Two flares, a high-pressure (HP) and a low-pressure (LP) flare,are proposed and we have not indicated their specific tie-in pointsin the facility as that has not been defined in previously revieweddocuments. The HP flare will be a tall stack unit designed for aproduction line capacity of 350 MMSCFD. The LP flare isapparently a much smaller capacity unit (8 MMSCFD) intendedfor minor blow down or purging during maintenance of facility equipment. For safety reasons,we would advise the use of limited flaring over cold venting (discussed in the next section)given the capability of venting to generate heavier than air vapours that can producecatastrophic events in the area should a release get away from the operator.
Separation and treatment often entail producing constituents for sale, disposal, or re-injectioninto the producing fields if sale/disposal/use is not viable or economical. The specific plantdesign, complexity, and location will depend on the quality of the gas produced from thefield(s) and the local demands and obstacles. The boxes in white in Figure 18 convey thesimple processes involved in phase separation to produce sales gas. The other coloured boxes
are additions theoperator has selected toi m p r o v e f i e l de f f i c i e n c y ( i . e . ,profitability) such asmethanol recovery andrecycle.
D o c u m e n t s a l s oindicate that additionalcomplexity concerning
refrigerationc o m p o n e n t s a n dstorage (i.e., propane)suggest that additionalhydrocarbon liquidrecovery can beanticipated, either asthe gas field ages oradditional fields areb r o u g h t i n t o
production.27 This additional infrastructure would still be regarded as moderate, even ifadditional bulk storage is required, such as for propane refrigeration. It is important torecognise that this may not be the only production pipeline that might utilise this plant site.
A processing plant, while apparently not specifically defined in the BS 8010 standard, is acombination of process plant/treating, and storage facilities related to a gas pipeline operation.28
27 Ibid., Inspector Report to An Bord Pleanála.
FIGURE 19. GAS PLANT SITE LOOKING TOWARDCARROWMORE LAKE
Cold venting should beavoided in prudent gasp r o c e s s i n g p l a n tdesign.
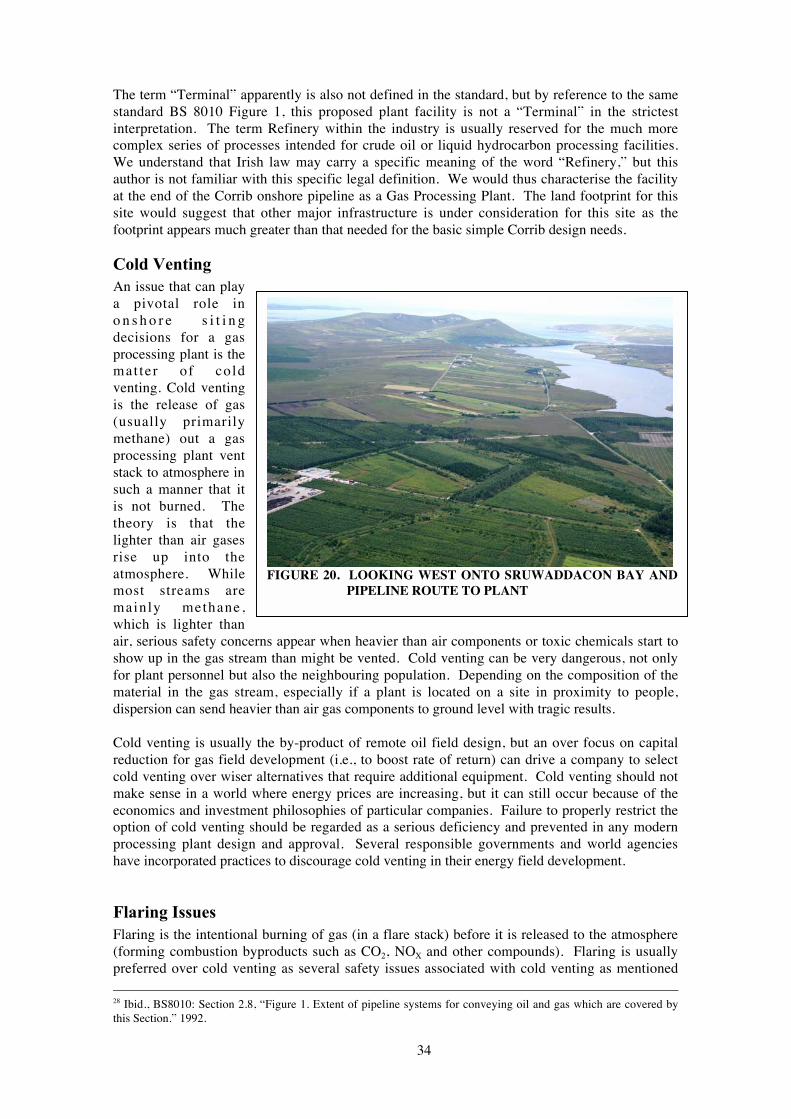
34
The term “Terminal” apparently is also not defined in the standard, but by reference to the samestandard BS 8010 Figure 1, this proposed plant facility is not a “Terminal” in the strictestinterpretation. The term Refinery within the industry is usually reserved for the much morecomplex series of processes intended for crude oil or liquid hydrocarbon processing facilities.We understand that Irish law may carry a specific meaning of the word “Refinery,” but thisauthor is not familiar with this specific legal definition. We would thus characterise the facilityat the end of the Corrib onshore pipeline as a Gas Processing Plant. The land footprint for thissite would suggest that other major infrastructure is under consideration for this site as thefootprint appears much greater than that needed for the basic simple Corrib design needs.
Cold Venting
An issue that can playa pivotal role ino n s h o r e s i t i n gdecisions for a gasprocessing plant is themat ter of co ldventing. Cold ventingis the release of gas(usually primarilymethane) out a gasprocessing plant ventstack to atmosphere insuch a manner that itis not burned. Thetheory is that thelighter than air gasesrise up into theatmosphere. Whilemost streams aremainly methane,which is lighter thanair, serious safety concerns appear when heavier than air components or toxic chemicals start toshow up in the gas stream than might be vented. Cold venting can be very dangerous, not onlyfor plant personnel but also the neighbouring population. Depending on the composition of thematerial in the gas stream, especially if a plant is located on a site in proximity to people,dispersion can send heavier than air gas components to ground level with tragic results.
Cold venting is usually the by-product of remote oil field design, but an over focus on capitalreduction for gas field development (i.e., to boost rate of return) can drive a company to selectcold venting over wiser alternatives that require additional equipment. Cold venting should notmake sense in a world where energy prices are increasing, but it can still occur because of theeconomics and investment philosophies of particular companies. Failure to properly restrict theoption of cold venting should be regarded as a serious deficiency and prevented in any modernprocessing plant design and approval. Several responsible governments and world agencieshave incorporated practices to discourage cold venting in their energy field development.
Flaring Issues
Flaring is the intentional burning of gas (in a flare stack) before it is released to the atmosphere(forming combustion byproducts such as CO2, NOX and other compounds). Flaring is usuallypreferred over cold venting as several safety issues associated with cold venting as mentioned
28 Ibid., BS8010: Section 2.8, “Figure 1. Extent of pipeline systems for conveying oil and gas which are covered bythis Section.” 1992.
FIGURE 20. LOOKING WEST ONTO SRUWADDACON BAY ANDPIPELINE ROUTE TO PLANT
35
above are avoided.29 The major issue with flaring is when plant operators flare excessively,either because of poor plant design or poor equipment maintenance, that results in frequentequipment breakdown causing long duration flaring. Excessive or frequent flaring, in additionto wasting a valuable commodity, can contribute to combustion pollutants, excessive noise(large flares can make a lot of noise), and light pollution. Excessive flaring can now be easilyeliminated by proper gas plant design, maintenance, and investment encouraged by propergovernmental permitting procedures.
More to Come
If the Gas Processing Plant were the only equipment to be placed at the onshore site it would befairly easy to recommend its placement as, relatively speaking, the equipment depicted inFigure 18 is fairly straightforward. The plant is limited in complexity and can be easily judgedas to its safety by a basic review of: 1) a plant layout drawing to review major equipmentplacement and separation, 2) various simple P& ID’s, and 3) an analysis of the HAZID.30 Thefootprint for a simple gas plant is not the large size currently projected (see Figure 3, large redquadrangle), suggesting that other processes may be in future schemes. Given the lack ofclarity related to this project to date and demonstrated by this report, it is understandable thatthe local citizens have little confidence in denials concerning future expectations for this site. Itis beyond the scope of this report to analyse all possible additional infrastructures that could besited, but it would not be beyond reason to assume that an oil refinery would be desired in closeproximity to a reliable gas source. It is usually the responsibility of local governmentsoverseeing land use planning to properly communicate the possible future infrastructure that anew energy supply brings to the area. Future site plans or alternatives for the proposed onshorefacility should be clearly communicated.
IX. Is the Gas Processing Plant Site Driving the Pipeline Route?
There is a strong appearance that the availability of the Gas Processing Plant land site may bedriving the decision to route a production pipeline in an unwise location. Given the choice tosite the Gas Processing Plant, the operators have proclaimed that the proposed route for theonshore pipeline is the best route available and other alternatives have serious conflicts orchallenges.31 A quick scan of the countryside would clearly indicate that there are many waysto get to the Gas Processing Plant without utilising the particular route selected by the operator.
In Pipeline Routing, the Shortest path is Seldom the Cheapest
Apparently, once the Gas Processing Plant sitewas chosen, the pipeline route near the bayappears to have been selected as the shortest andeasiest path to get to the terminal. Ironically, asseen from Figure 3, this route places a very uniquehigh-pressure production pipeline in closeproximity to population. We cannot stress theimportance of getting this highly unique
production pipeline away from people, not just dwellings. As the public becomes moreinformed about the lack of clear information about this system, the delays in this project willcost more than any original cost savings ever proposed for this unwise route selection. This isan often observed phenomenon in pipeline routing decisions. Pipeline operators choose theshortest or easiest path based on perceived cost savings only to discover the folly of such
29 Flaring is often incorporated as a safety design to protect processing plant and personnel. In these modern designschemes such plants rarely flare excessively for long periods of time as such flaring is only required during majorplant equipment malfunction or breakdown.30 P&IDs are pipe and instrument drawings, while HAZID stands for a hazard identification process required forfacilities falling under process safety management.31 Ibid., Inspector Report to An Bord Pleanála.
The burden of proof should fall on thepipeline operator to clearly explain anddemonstrate that alternative routes tothe plant were adequately explored andthe reasons for their rejection clearlypresented and properly communicated.
36
unwise tactics. An informed public becomes wise to their manoeuvres, and delays or changesthe project in ways that quickly consume any cost savings that the original easiest path everhoped to realise. The shortest pipeline path, especially if an unwise selection, is seldom thecheapest.
Land Use Planning
Land use planning as it relates to future activity near infrastructure is a critically importantactivity, not only when determining pipeline routes, but also for selecting other facilities such asgas processing plants or other complex infrastructure they may attract, such as refineries. Theimportance of keeping certain threats away from high-pressure pipelines that can releaseextremely large inventories of material should be obvious by now to the reader of this report.What is less understood is the importance of understanding the infrastructure that may beassociated with gas plant siting. Ironically, from a safety perspective, these other non pipelinefacilities usually, but not always, fall under the regulatory regime of process safetymanagement.
Process safety management is a basket of requirements that assure that a company’smanagement approach meets certain basic minimum process requirements and checks andbalances to avoid potential failures, especially large catastrophic events associated with certainplant assets. It is one of the requirements of process safety management, sometimes referred toas process hazard management, to carefully review plant siting, design, and operation issueswhen chemical inventories exceed a certain capacity. Unfortunately, process safetymanagement processes usually aren’t required of pipelines. Typically a process safety auditrequires an evaluation of the potential for various worse case events to leave the plant site.Please note that such a review does not involve an evaluation of environmental issues orconcerns, and usually doesn’t capture the impact or additional risk such a facility places on thepipeline.
X. Advice for Government, Public, and Regulatory Authorities
It is beyond the scope of this paper to pass judgment as to how a critical energy supply shouldbe developed for Ireland. That is an issue best left to the Irish government and its citizens andthe companies they choose to do business with. It is, however, clearly within the scope of thisreport to make observations as to the correctness of technical information related to this projectand various options.
Various Offshore vs. Onshore Options
There are three basic fundamental processing option schemes for the Corrib gas field. Thelengthy but very professional Inspector’s Report should serve as an important informationresource to explore these options in more detail if the reader is so inclined.32 Several importantfactors (pros and cons) for each option are summarised in Table 1 for the reader’s consideration.These options are briefly summarised as follows and are not intended to be an exhaustive list:
Option 1 Deep Water Offshore Processing Platform Located at Corrib Field
This scheme places a deepwater platform in water (350metres) with very harsh Atlanticweather conditions approximately 80 kilometres off the west coast of Ireland. Gasprocessing would be included on the platform and a gas transmission pipeline would run tolandfall. This is similar to earlier traditional North Sea processing schemes.
32 An Bord Pleanála, “Inspector’s Report on Gas Terminal at Bellagelly South, Bellanaboy Bridge,Belmullet, Co. Mayo,” signed by Kevin Moore and dated April 2003.
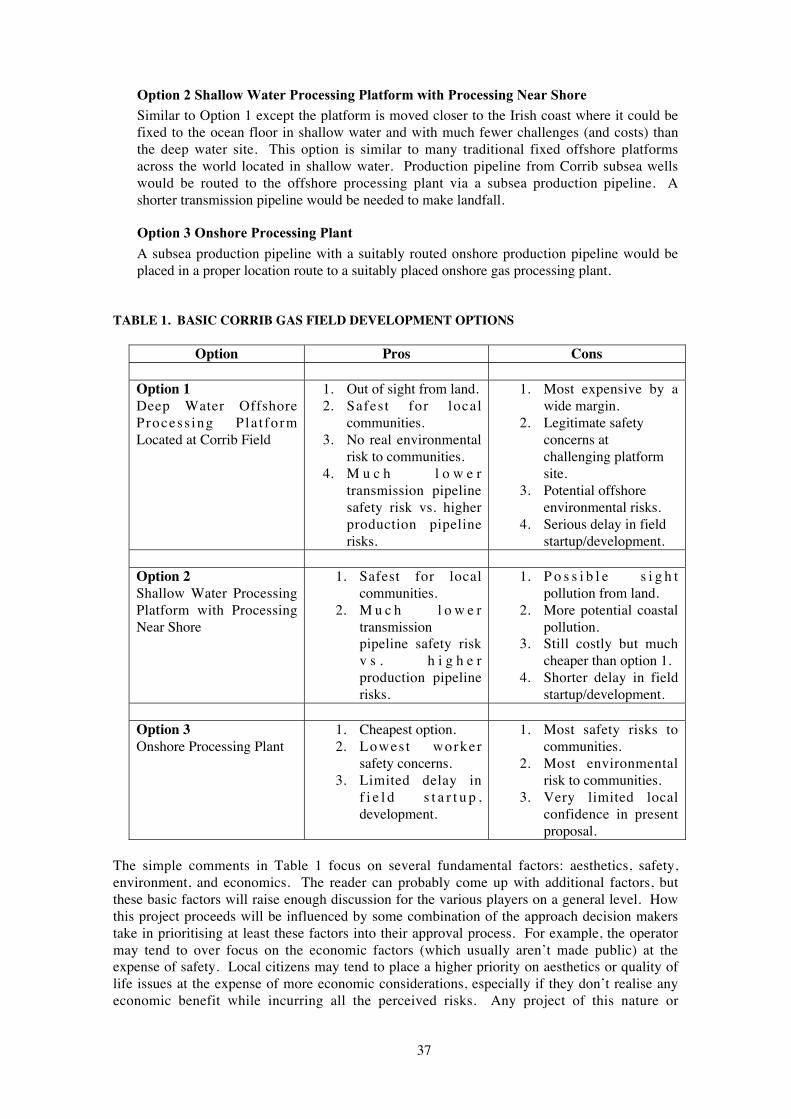
37
Option 2 Shallow Water Processing Platform with Processing Near Shore
Similar to Option 1 except the platform is moved closer to the Irish coast where it could befixed to the ocean floor in shallow water and with much fewer challenges (and costs) thanthe deep water site. This option is similar to many traditional fixed offshore platformsacross the world located in shallow water. Production pipeline from Corrib subsea wellswould be routed to the offshore processing plant via a subsea production pipeline. Ashorter transmission pipeline would be needed to make landfall.
Option 3 Onshore Processing Plant
A subsea production pipeline with a suitably routed onshore production pipeline would beplaced in a proper location route to a suitably placed onshore gas processing plant.
TABLE 1. BASIC CORRIB GAS FIELD DEVELOPMENT OPTIONS
Option Pros Cons
Option 1Deep Water OffshoreProcess ing P la t formLocated at Corrib Field
1. Out of sight from land.2. Safest for local
communities.3. No real environmental
risk to communities.4. M u c h l o w e r
transmission pipelinesafety risk vs. higherproduction pipelinerisks.
1. Most expensive by awide margin.
2. Legitimate safetyconcerns atchallenging platformsite.
3. Potential offshoreenvironmental risks.
4. Serious delay in fieldstartup/development.
Option 2Shallow Water ProcessingPlatform with ProcessingNear Shore
1. Safest for localcommunities.
2. M u c h l o w e rtransmissionpipeline safety riskv s . h i g h e rproduction pipelinerisks.
1. P o s s i b l e s i g h tpollution from land.
2. More potential coastalpollution.
3. Still costly but muchcheaper than option 1.
4. Shorter delay in fieldstartup/development.
Option 3Onshore Processing Plant
1. Cheapest option.2. Lowes t worker
safety concerns.3. Limited delay in
f i e l d s t a r t u p ,development.
1. Most safety risks tocommunities.
2. Most environmentalrisk to communities.
3. Very limited localconfidence in presentproposal.
The simple comments in Table 1 focus on several fundamental factors: aesthetics, safety,environment, and economics. The reader can probably come up with additional factors, butthese basic factors will raise enough discussion for the various players on a general level. Howthis project proceeds will be influenced by some combination of the approach decision makerstake in prioritising at least these factors into their approval process. For example, the operatormay tend to over focus on the economic factors (which usually aren’t made public) at theexpense of safety. Local citizens may tend to place a higher priority on aesthetics or quality oflife issues at the expense of more economic considerations, especially if they don’t realise anyeconomic benefit while incurring all the perceived risks. Any project of this nature or
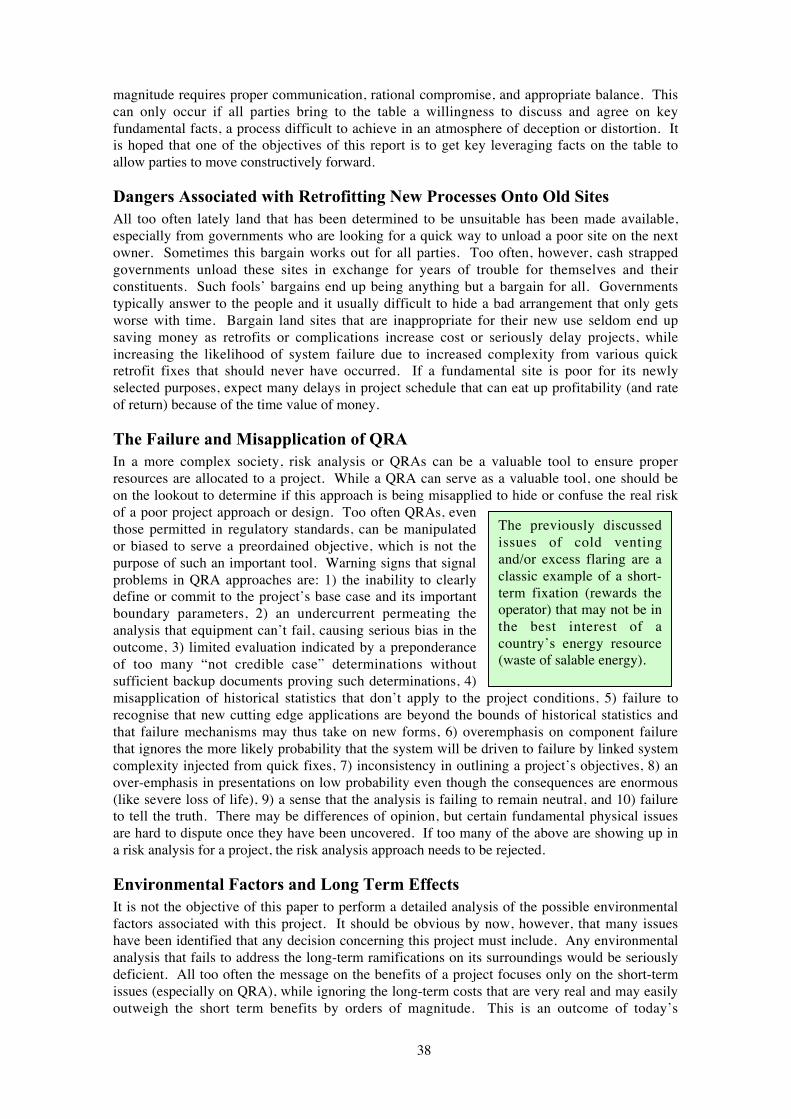
38
magnitude requires proper communication, rational compromise, and appropriate balance. Thiscan only occur if all parties bring to the table a willingness to discuss and agree on keyfundamental facts, a process difficult to achieve in an atmosphere of deception or distortion. Itis hoped that one of the objectives of this report is to get key leveraging facts on the table toallow parties to move constructively forward.
Dangers Associated with Retrofitting New Processes Onto Old Sites
All too often lately land that has been determined to be unsuitable has been made available,especially from governments who are looking for a quick way to unload a poor site on the nextowner. Sometimes this bargain works out for all parties. Too often, however, cash strappedgovernments unload these sites in exchange for years of trouble for themselves and theirconstituents. Such fools’ bargains end up being anything but a bargain for all. Governmentstypically answer to the people and it usually difficult to hide a bad arrangement that only getsworse with time. Bargain land sites that are inappropriate for their new use seldom end upsaving money as retrofits or complications increase cost or seriously delay projects, whileincreasing the likelihood of system failure due to increased complexity from various quickretrofit fixes that should never have occurred. If a fundamental site is poor for its newlyselected purposes, expect many delays in project schedule that can eat up profitability (and rateof return) because of the time value of money.
The Failure and Misapplication of QRA
In a more complex society, risk analysis or QRAs can be a valuable tool to ensure properresources are allocated to a project. While a QRA can serve as a valuable tool, one should beon the lookout to determine if this approach is being misapplied to hide or confuse the real riskof a poor project approach or design. Too often QRAs, eventhose permitted in regulatory standards, can be manipulatedor biased to serve a preordained objective, which is not thepurpose of such an important tool. Warning signs that signalproblems in QRA approaches are: 1) the inability to clearlydefine or commit to the project’s base case and its importantboundary parameters, 2) an undercurrent permeating theanalysis that equipment can’t fail, causing serious bias in theoutcome, 3) limited evaluation indicated by a preponderanceof too many “not credible case” determinations withoutsufficient backup documents proving such determinations, 4)misapplication of historical statistics that don’t apply to the project conditions, 5) failure torecognise that new cutting edge applications are beyond the bounds of historical statistics andthat failure mechanisms may thus take on new forms, 6) overemphasis on component failurethat ignores the more likely probability that the system will be driven to failure by linked systemcomplexity injected from quick fixes, 7) inconsistency in outlining a project’s objectives, 8) anover-emphasis in presentations on low probability even though the consequences are enormous(like severe loss of life), 9) a sense that the analysis is failing to remain neutral, and 10) failureto tell the truth. There may be differences of opinion, but certain fundamental physical issuesare hard to dispute once they have been uncovered. If too many of the above are showing up ina risk analysis for a project, the risk analysis approach needs to be rejected.
Environmental Factors and Long Term Effects
It is not the objective of this paper to perform a detailed analysis of the possible environmentalfactors associated with this project. It should be obvious by now, however, that many issueshave been identified that any decision concerning this project must include. Any environmentalanalysis that fails to address the long-term ramifications on its surroundings would be seriouslydeficient. All too often the message on the benefits of a project focuses only on the short-termissues (especially on QRA), while ignoring the long-term costs that are very real and may easilyoutweigh the short term benefits by orders of magnitude. This is an outcome of today’s
The previously discussedissues of cold ventingand/or excess flaring are aclassic example of a short-term fixation (rewards theoperator) that may not be inthe best interest of acountry’s energy resource(waste of salable energy).
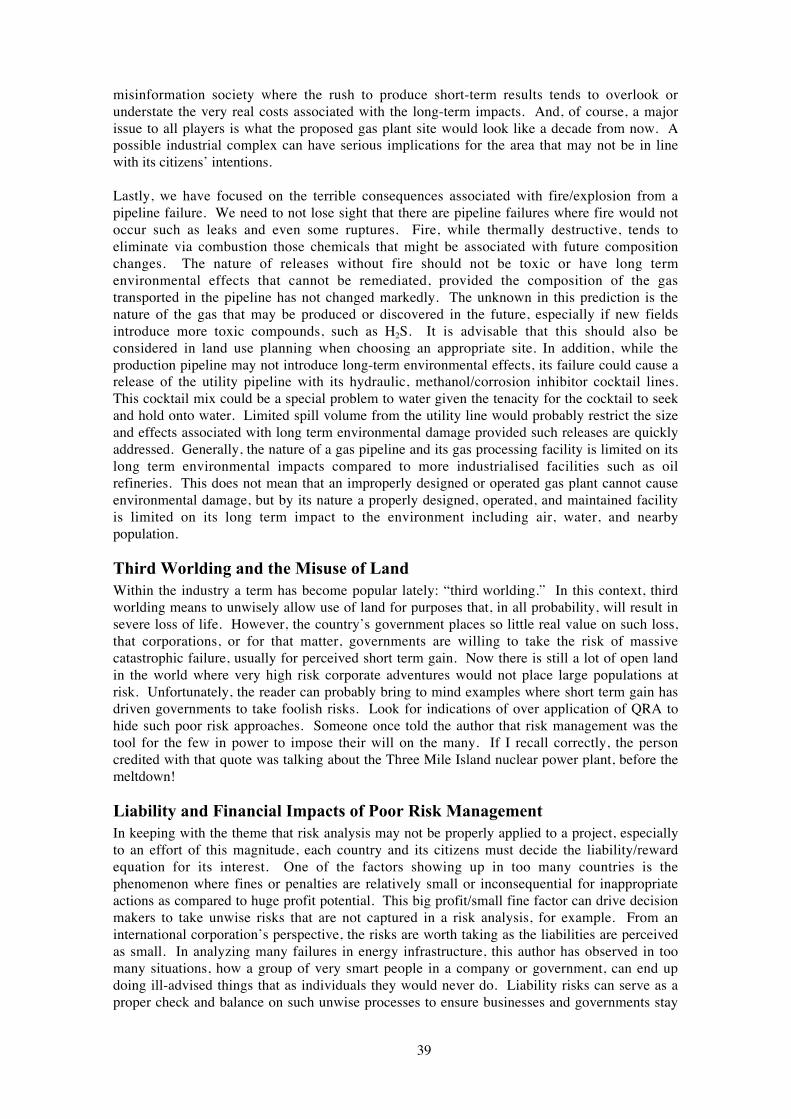
39
misinformation society where the rush to produce short-term results tends to overlook orunderstate the very real costs associated with the long-term impacts. And, of course, a majorissue to all players is what the proposed gas plant site would look like a decade from now. Apossible industrial complex can have serious implications for the area that may not be in linewith its citizens’ intentions.
Lastly, we have focused on the terrible consequences associated with fire/explosion from apipeline failure. We need to not lose sight that there are pipeline failures where fire would notoccur such as leaks and even some ruptures. Fire, while thermally destructive, tends toeliminate via combustion those chemicals that might be associated with future compositionchanges. The nature of releases without fire should not be toxic or have long termenvironmental effects that cannot be remediated, provided the composition of the gastransported in the pipeline has not changed markedly. The unknown in this prediction is thenature of the gas that may be produced or discovered in the future, especially if new fieldsintroduce more toxic compounds, such as H2S. It is advisable that this should also beconsidered in land use planning when choosing an appropriate site. In addition, while theproduction pipeline may not introduce long-term environmental effects, its failure could cause arelease of the utility pipeline with its hydraulic, methanol/corrosion inhibitor cocktail lines.This cocktail mix could be a special problem to water given the tenacity for the cocktail to seekand hold onto water. Limited spill volume from the utility line would probably restrict the sizeand effects associated with long term environmental damage provided such releases are quicklyaddressed. Generally, the nature of a gas pipeline and its gas processing facility is limited on itslong term environmental impacts compared to more industrialised facilities such as oilrefineries. This does not mean that an improperly designed or operated gas plant cannot causeenvironmental damage, but by its nature a properly designed, operated, and maintained facilityis limited on its long term impact to the environment including air, water, and nearbypopulation.
Third Worlding and the Misuse of Land
Within the industry a term has become popular lately: “third worlding.” In this context, thirdworlding means to unwisely allow use of land for purposes that, in all probability, will result insevere loss of life. However, the country’s government places so little real value on such loss,that corporations, or for that matter, governments are willing to take the risk of massivecatastrophic failure, usually for perceived short term gain. Now there is still a lot of open landin the world where very high risk corporate adventures would not place large populations atrisk. Unfortunately, the reader can probably bring to mind examples where short term gain hasdriven governments to take foolish risks. Look for indications of over application of QRA tohide such poor risk approaches. Someone once told the author that risk management was thetool for the few in power to impose their will on the many. If I recall correctly, the personcredited with that quote was talking about the Three Mile Island nuclear power plant, before themeltdown!
Liability and Financial Impacts of Poor Risk Management
In keeping with the theme that risk analysis may not be properly applied to a project, especiallyto an effort of this magnitude, each country and its citizens must decide the liability/rewardequation for its interest. One of the factors showing up in too many countries is thephenomenon where fines or penalties are relatively small or inconsequential for inappropriateactions as compared to huge profit potential. This big profit/small fine factor can drive decisionmakers to take unwise risks that are not captured in a risk analysis, for example. From aninternational corporation’s perspective, the risks are worth taking as the liabilities are perceivedas small. In analyzing many failures in energy infrastructure, this author has observed in toomany situations, how a group of very smart people in a company or government, can end updoing ill-advised things that as individuals they would never do. Liability risks can serve as aproper check and balance on such unwise processes to ensure businesses and governments stay
40
professional and avoid recklessness. A question that needs to be answered by the citizens ofIreland concerning the present proposal is whether Irish law would permit legitimate actions forcriminal negligence that caused serious environmental damage or loss of life. Some countrieshave such laws and effective processes in place to enforce them. This issue can be leveraging ifrisk management is applied in countries with few or illusionary liability risks that are not justreserved for third world countries.
XI. Conclusion and Recommendations
It should be fairly obvious by now that past information on this project has been less thancomplete. Much of this information appears to be of a propaganda nature intended to spinpublic relations to an ill informed or misinformed public or government. In today’s informationage this is a tactic fraught with risks as the deceptions are uncovered.
Regarding the proposed onshore pipeline route, serious challenges should be raised as to anyrisk analysis that fails to adequately address the issues raised by the production pipeline, as thethermal impact zones for this very unique high pressure pipeline are quite large with a highprobability of mortality. It is the opinion of the author that the risks of the pipeline have beenconsiderably understated. Various critical commitments that would ensure that the pipelinewould not fail have not been clearly demonstrated or obligated, a serious indication that in allprobability risk assessment is not appropriate for this project. If the Gas Processing Plant sitelocation were to remain as proposed, we advise a reroute of the proposed pipeline incorporatingsafety buffer zones of 200 metres for dwellings and at least 400 metres for unshelteredindividuals.
The recommendation concerning the placement of the onshore Gas Process Plant is morecomplicated by the unknowns associated with potential future complexities or possibleadditions that have not been defined in this project. The placement of a relatively simple GasProcess Plant onshore at the end of a production pipeline would not in itself create anunwarranted safety risk to the local public from the plant. Placement of a Gas Process Plant ona shallow offshore platform would substantially reduce production pipeline rupture impactzones associated with specific pipeline design modifications. A transmission pipeline fromsuch an offshore facility could be operated at lower pressures, move much higher quality gas,and permit appropriate cleaning and smart pigging programs that would reduce the potentialimpact zone associated with a gas transmission pipeline failure. The final decision on the GasProcess Plant site placement rests with the citizens. It is hoped that this report permits allparties to shift into a more responsible dialogue and reach a more informed and balanceddecision on this critical matter.
41
XII. Bibliography
AEA Technology, “Independent Review of Onshore Pipeline Quantified Risk Assessment forthe Corrib Field Development,” dated June 2005.
Allseas for Enterprise Oil, “Onshore Pipeline Quantified Risk Assessment, Corrib FieldDevelopment Project, Version D,” dated Feb 2002.
Allseas for Enterprise Oil, “Onshore Pipeline Quantified Risk Assessment, Corrib FieldDevelopment Project, Version E,” dated July, 2002.
Allseas, “Onshore Pipeline Quantified Risk Assessment, Corrib Field Development Project,Version F,” dated April, 2005.
American Society of Mechanical Engineers, ASME B31.8, “Gas Transmission and DistributionPipeline Systems,” 2004 edition.
American Society of Mechanical Engineers, ASME B31.8S, “Managing System Integrity ofGas Pipelines,” 2004 edition.
American Petroleum Institute, API Standard 1163, “In-line Inspection Systems QualificationStandard,” First Edition, August, 2005.
Bilio, M. and Kinsman, P.R., “Thermal Radiation Criteria Used in Pipeline Risk Assessment,”Pipes & Pipelines International, 1997.
BPA Report for PAD, DCMNR, “Corrib Gas Field Development – QRA Review,” dated May2005.
British Standard Institute BS 8010, “British Standard Code of Practice for Pipelines, Part 1.Pipelines on Land: General, 1989.
British Standard Institute BS 8010, “Code of Practice for Pipelines, Part 2. Pipelines on Land:Design, Construction and Installation, Section 2.8 Steel for Oil and Gas,” 1992.
British Standard Institute PD 8010-1:2004, “Code of Practice for Pipelines, Part 1. SteelPipelines on Land,” 2004.
Eiber, Robert J., “Prediction of Corrib Pipeline Life for External and Internal Corrosion,”September, 2005.
Eisenberg, N.A., Lynch, C.J. and Breeding, R.J., “Vulnerability Model: A Simulation Systemfor Assessing Damage Resulting from Marine Spills,” Environmental Control ReportCG-D-136-75, 1975.
Environmental Impact Statement, “Bellanboy Bridge Terminal” Section 4 the ProposedDevelopment,” Enterprise Energy Ireland Ltd.
Inspector’s Report to An Bord Pleanala, “Gas Terminal at Bellagelly South, Bellanaboy Bridge,Belmullet, Co. Mayo,” dated April, 2003.
Institute of Gas Engineers, “Steel Pipelines for High Pressure Gas Transmission.Recommendation on Transmission and Distribution Practice,” IGE/TD/1 Edition 3,1993.
42
IS 328, “Code and Practice for the Design and Installation of Gas Transmission Pipelines,”2002.
Gas Research Institute, “A Model for Sizing High Consequence Areas Associated with NaturalGas Pipelines,” prepared by C-FER Technologies, October, 2000.
Gas Research Institute, “Remote and Automatic Main Line Valve Technology Assessment,”Final Report July, 1995.
Health and Safety Authority, “Land-use Planning Advice for Mayo County Council In Relationto the Application By Shell E&P Ireland Limited to Construct a Facility At Bellanaboy Bridge,Co. Mayo,” dated April 8, 2004.
Hymes, I, “The Physiological and Pathological Effects of Thermal Radiation,” SystemsReliability Directorate, Report SRD, R275, Culcheth, Warrington, UK, 1983.
Johnston, Andrew, “Corrib Gas Pipeline Project – Report on Evaluation of Onshore PipelineDesign Code,” dated March 28, 2002.
Kuprewicz, Richard B., “Preventing Pipeline Releases,” prepared for the Washington CityCounty Pipeline Safety Consortium, July 22, 2003.
Kuprewicz, Richard B., “Observations on the Application of Smart Pigging on TransmissionPipelines,” prepared for the Pipeline Safety Trust, September, 2005.
National Transportation Safety Board Pipeline Accident Report, “Natural Gas Pipeline Ruptureand Fire Near Carlsbad, New Mexico August 19, 2000,” NTSB/PAR-03/01, adoptedFebruary 11, 2003.
NORSAK Standards M-506, “CO2 Corrosion Rate Calculation Model,” Rev 2, June, 2005 atweb site: www.standard.no/imaker.exe?id=10405.
PM Group Report, “Corrib Gas Field Quantified Risk Assessment – Executive Summary,”dated May, 2005.
Shell Exploration and Production Letter to Mr. J Sheeran, Health and Safety Authority, datedApril 6, 2004.
University of Tulsa Erosion/Corrosion Research Center, “CO2 Corrosion Research at theE/CRC Current Research Projects” web site: www.ecrc.utulsa.edu/crproj.htm.