the proposed fy 2017 national expenditure … 2017 dbcc... · the proposed fy 2017 national...
TRANSCRIPT
THE PROPOSED FY 2017 NATIONAL EXPENDITURE PROGRAM: ITS COMPOSITION, DISTRIBUTION, AND FINANCING
--------------
A Briefing Summary on the FY 2017 National Budget Prepared for the members of the
Senate Finance Committee
--------------
For the Presentation of the National Budget on Aug. 30, 2016 by members of the Development
Budget Coordination Committee (DBCC)
--------------
by
Legislative Budget Research & Monitoring Office (LBRMO)
Page 1 of 26
A. MACROECONOMIC ASSUMPTIONS
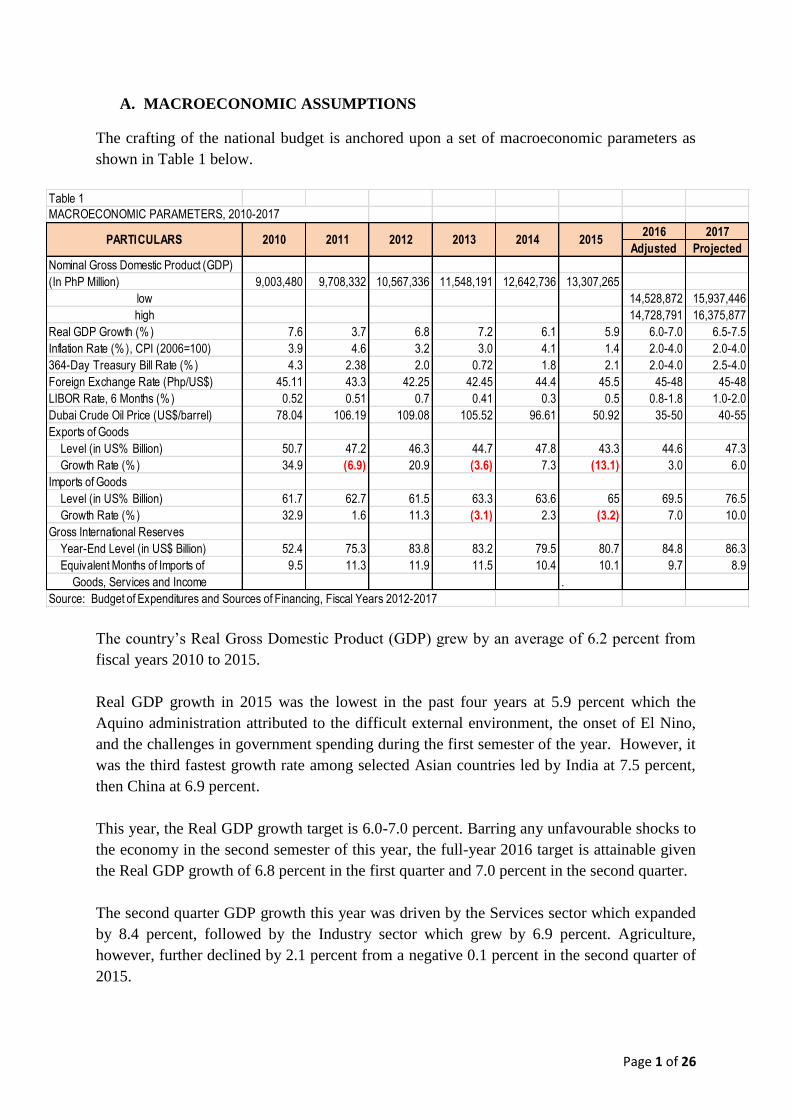
The crafting of the national budget is anchored upon a set of macroeconomic parameters as
shown in Table 1 below.
The country’s Real Gross Domestic Product (GDP) grew by an average of 6.2 percent from
fiscal years 2010 to 2015.
Real GDP growth in 2015 was the lowest in the past four years at 5.9 percent which the
Aquino administration attributed to the difficult external environment, the onset of El Nino,
and the challenges in government spending during the first semester of the year. However, it
was the third fastest growth rate among selected Asian countries led by India at 7.5 percent,
then China at 6.9 percent.
This year, the Real GDP growth target is 6.0-7.0 percent. Barring any unfavourable shocks to
the economy in the second semester of this year, the full-year 2016 target is attainable given
the Real GDP growth of 6.8 percent in the first quarter and 7.0 percent in the second quarter.
The second quarter GDP growth this year was driven by the Services sector which expanded
by 8.4 percent, followed by the Industry sector which grew by 6.9 percent. Agriculture,
however, further declined by 2.1 percent from a negative 0.1 percent in the second quarter of
2015.
Table 1
2016 2017
Adjusted Projected
Nominal Gross Domestic Product (GDP)
(In PhP Million) 9,003,480 9,708,332 10,567,336 11,548,191 12,642,736 13,307,265
low 14,528,872 15,937,446
high 14,728,791 16,375,877
Real GDP Growth (% ) 7.6 3.7 6.8 7.2 6.1 5.9 6.0-7.0 6.5-7.5
Inflation Rate (% ), CPI (2006=100) 3.9 4.6 3.2 3.0 4.1 1.4 2.0-4.0 2.0-4.0
364-Day Treasury Bill Rate (%) 4.3 2.38 2.0 0.72 1.8 2.1 2.0-4.0 2.5-4.0
Foreign Exchange Rate (Php/US$) 45.11 43.3 42.25 42.45 44.4 45.5 45-48 45-48
LIBOR Rate, 6 Months (%) 0.52 0.51 0.7 0.41 0.3 0.5 0.8-1.8 1.0-2.0
Dubai Crude Oil Price (US$/barrel) 78.04 106.19 109.08 105.52 96.61 50.92 35-50 40-55
Exports of Goods
Level (in US% Billion) 50.7 47.2 46.3 44.7 47.8 43.3 44.6 47.3
Growth Rate (%) 34.9 (6.9) 20.9 (3.6) 7.3 (13.1) 3.0 6.0
Imports of Goods
Level (in US% Billion) 61.7 62.7 61.5 63.3 63.6 65 69.5 76.5
Growth Rate (%) 32.9 1.6 11.3 (3.1) 2.3 (3.2) 7.0 10.0
Gross International Reserves
Year-End Level (in US$ Billion) 52.4 75.3 83.8 83.2 79.5 80.7 84.8 86.3
Equivalent Months of Imports of 9.5 11.3 11.9 11.5 10.4 10.1 9.7 8.9
Goods, Services and Income .
Source: Budget of Expenditures and Sources of Financing, Fiscal Years 2012-2017
2014 2015
MACROECONOMIC PARAMETERS, 2010-2017
PARTICULARS 2010 2011 2012 2013
Page 2 of 26
Although the Aquino administration may be credited with consistently high GDP growth
rates in the past six years, the challenge is how to attain a more inclusive growth that will be
felt by Filipinos still living below the poverty line.
At 1.4 percent, the inflation rate in 2015 was the lowest recorded in many years. In July
2016, it was recorded at 1.9 percent, the same rate posted in June 2016, but significantly
higher than the 0.8 percent noted in July 2015. In particular, higher annual increases were
observed in the indices of alcoholic beverages and tobacco, furnishing, household equipment
and routine maintenance of the house, and recreation and culture.
The peso-dollar rate recorded in 2015 was P45.50 to $1, the highest in the past six years. The
projected foreign exchange rate in 2016 and 2017 is at P45-48 to a dollar. A higher exchange
rate increases the cost of servicing, both in terms of principal and interest payments, of our
country’s foreign debt.
Total Exports of Goods posted a growth of 4.1 percent in the second quarter of 2016 from 2.2
percent in 2015. Such improvement may be attributed to the following increases: Electronic
Data Processing, by 28.0 percent; Telecommunications, by 70.3 percent; and Consumer
Electronics, by 21.2 percent. Meanwhile Exports of Services decelerated by 15.3 percent for
the same period.
While Total Imports of Goods expanded by 22.9 percent from 10.1 percent during the
previous year, Imports of Services decelerated by 13.3 percent from 23.2 percent in the same
period last year.
During the second quarter of 2016, a Trade Deficit of P276.6 billion resulted out of Total
Exports of P966.7 billion vis-à-vis higher Total Imports of P1.243 trillion.
Gross International Reserves stood at US$80.7Billion in 2015, equivalent to 10.1 months of
imports of goods, services and income. In general, the international financial community
considers three to four months’ of import cover as adequate.
Page 3 of 26
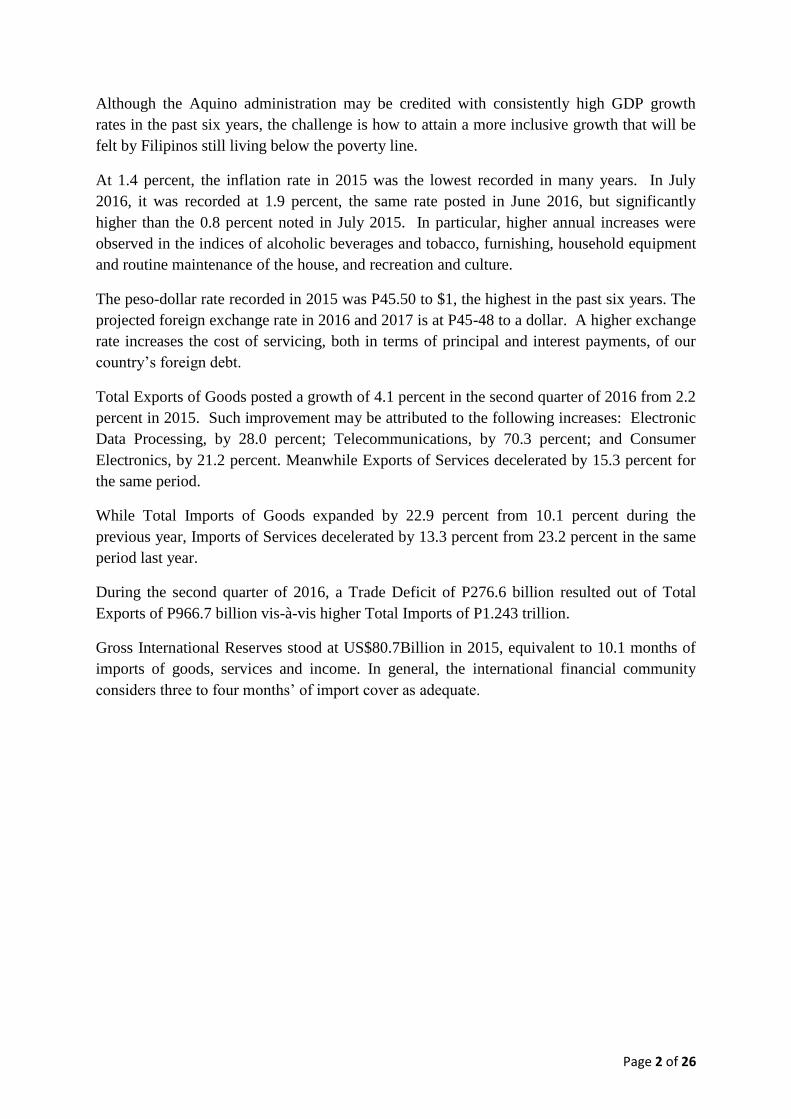
Table 2 above shows the effect of certain macroeconomic parameters to revenues,
disbursements, and the budget balance.
A P1 depreciation on the peso-dollar rate will increase revenues by P9.2 billion due to the
higher cost of imports that will boost tax collections, increase disbursements by P2.0 billion
due to bigger debt servicing costs and higher dollar-denominated expenditures, and in effect
would increase the budget balance by P7.2 billion.
A 1 percentage point increase in Treasury Bill rates will increase the budget deficit by P2.7
billion. This will result from an increase in disbursements by P3.2 billion due to the higher
cost of debt servicing arising from higher interest rates, which will be partially offset by a
smaller P0.5 billion increase in Revenues, specifically the 20 percent withholding tax on
interest income.
A percentage increase in the 180-day LIBOR will increase the budget deficit by P4.6 billion
due to higher debt servicing expenditures.
A 1 percentage point increase in the Inflation Rate will increase Revenue by P18.4 billion
because of the increase in prices of taxable products, thus reducing the budget deficit by the
same amount.
A 1 percentage point increase in the real GDP growth rate will increase revenues and in
effect, reduce our budget deficit by P19.3 billion due to higher tax collections arising out of a
larger tax base.
A 1 percentage point increase in the growth rate of imports will increase revenues from taxes
by P3.7 billion, thereby reducing our budget deficit by the same amount.
Revenues DisbursementsBudget Balance
1/
Peso-to-US dollar
exchange rate P1 depreciation 9.2 2 7.2
Treasury Bill Rate 1 percentage
(all maturities) point increase 0.5 3.2 -2.7
LIBOR 1 percentage
(180-Day) point increase 4.6 -4.6
1 percentage
Inflation Rate point increase 18.4 18.4
Real GDP 1 percentage
Growth Rate point increase 19.3 19.3
Growth Rate 1 percentage
of Imports point increase 3.7 3.7
Source: 2017 BESF
1/ A negative figure in the budget balance means an increase in deficit.
Table 2
BUDGET SENSITIVITY TO MACROECONOMIC PARAMETERS, FY 2017
(In billion pesos)
Indicator Change
2017

Page 4 of 26
B. DIMENSIONS OF THE 2017 EXPENDITURE PROGRAM
The proposed national government (NG) budget of P3.350 trillion for FY 2017 is dubbed
as “A Budget of Real Change, By the People and For the People” The said amount is
higher by 11.6 percent or P348.2 billion over the current year’s P3.002 trillion NG total
obligations. It is geared towards the achievement of the new administration’s 10-point
socioeconomic development agenda, as pronounced during President Duterte first State of
the Nation Address, to wit:
1. Continue and maintain current macroeconomic policies, including fiscal,
monetary, and trade policies.
2. Institute progressive tax reform and more effective tax collection, indexing taxes
to inflation.
3. Increase competitiveness and the ease of doing business.
4. Accelerate annual infrastructure spending to account for 5percent of GDP, with
Public-Private Partnerships playing a key role.
5. Promote rural and value chain development toward increasing agricultural and
rural enterprise productivity and rural tourism.
6. Ensure security of land tenure to encourage investments, and address bottlenecks
in land management and titling agencies.
7. Invest in human capital development, including health and education systems, and
match skills and training.
8. Promote science, technology, and the creative arts to enhance innovation and
creative capacity.
9. Improve social protection programs, including the government's Conditional Cash
Transfer program.
10. Strengthen implementation of the Responsible Parenthood and Reproductive
Health Law.
The budget can be presented through the following dimensions:
1. By Sources of Appropriations
2. By Expense Class
3. By Cost Structure
4. By Sector
5. By Recipient Units
6. By Geographical Distribution
B.1. BY SOURCE OF APPROPRIATIONS
The P3.350 trillion budget is equivalent to 21 percent of GDP, posting a slight increase from
the current year’s level of 20.7 percent. The appropriations cover for the budget will come
from the following:
Page 5 of 26
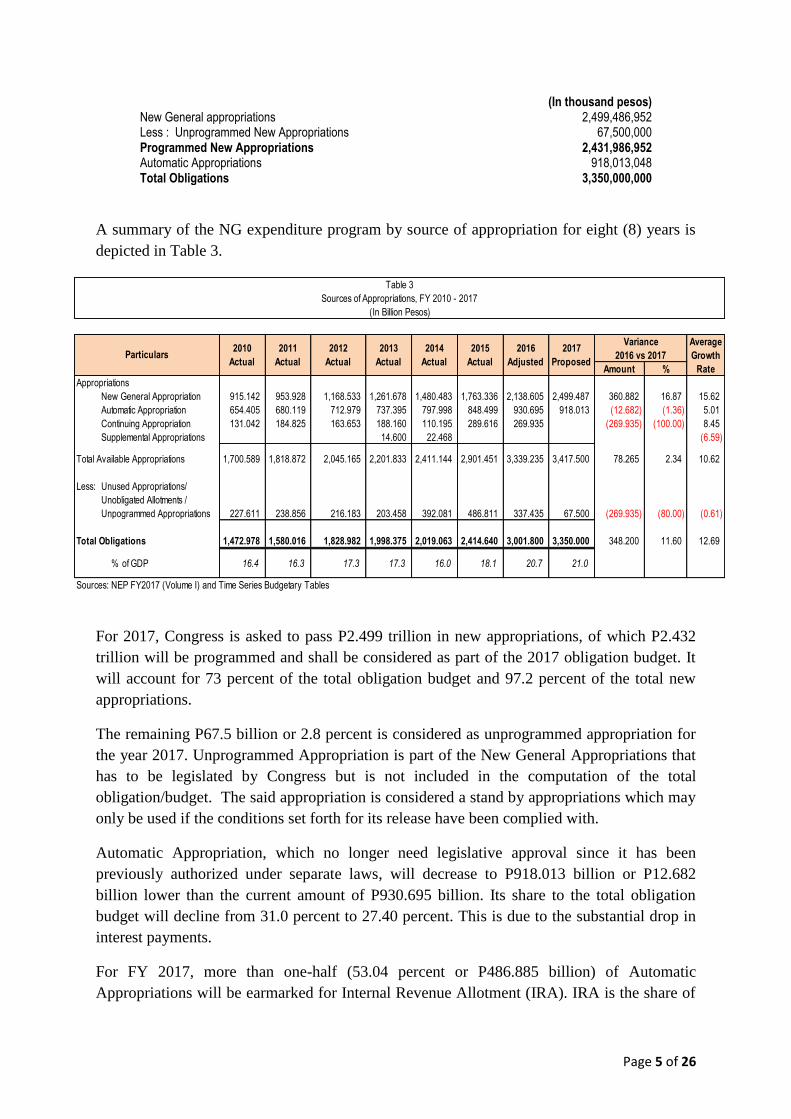
(In thousand pesos) New General appropriations 2,499,486,952 Less : Unprogrammed New Appropriations 67,500,000 Programmed New Appropriations 2,431,986,952 Automatic Appropriations 918,013,048 Total Obligations 3,350,000,000
A summary of the NG expenditure program by source of appropriation for eight (8) years is
depicted in Table 3.
For 2017, Congress is asked to pass P2.499 trillion in new appropriations, of which P2.432
trillion will be programmed and shall be considered as part of the 2017 obligation budget. It
will account for 73 percent of the total obligation budget and 97.2 percent of the total new
appropriations.
The remaining P67.5 billion or 2.8 percent is considered as unprogrammed appropriation for
the year 2017. Unprogrammed Appropriation is part of the New General Appropriations that
has to be legislated by Congress but is not included in the computation of the total
obligation/budget. The said appropriation is considered a stand by appropriations which may
only be used if the conditions set forth for its release have been complied with.
Automatic Appropriation, which no longer need legislative approval since it has been
previously authorized under separate laws, will decrease to P918.013 billion or P12.682
billion lower than the current amount of P930.695 billion. Its share to the total obligation
budget will decline from 31.0 percent to 27.40 percent. This is due to the substantial drop in
interest payments.
For FY 2017, more than one-half (53.04 percent or P486.885 billion) of Automatic
Appropriations will be earmarked for Internal Revenue Allotment (IRA). IRA is the share of
Amount %
Appropriations
New General Appropriation 915.142 953.928 1,168.533 1,261.678 1,480.483 1,763.336 2,138.605 2,499.487 360.882 16.87 15.62
Automatic Appropriation 654.405 680.119 712.979 737.395 797.998 848.499 930.695 918.013 (12.682) (1.36) 5.01
Continuing Appropriation 131.042 184.825 163.653 188.160 110.195 289.616 269.935 (269.935) (100.00) 8.45
Supplemental Appropriations 14.600 22.468 (6.59)
Total Available Appropriations 1,700.589 1,818.872 2,045.165 2,201.833 2,411.144 2,901.451 3,339.235 3,417.500 78.265 2.34 10.62
Less: Unused Appropriations/
Unobligated Allotments /
Unpogrammed Appropriations 227.611 238.856 216.183 203.458 392.081 486.811 337.435 67.500 (269.935) (80.00) (0.61)
Total Obligations 1,472.978 1,580.016 1,828.982 1,998.375 2,019.063 2,414.640 3,001.800 3,350.000 348.200 11.60 12.69
% of GDP 16.4 16.3 17.3 17.3 16.0 18.1 20.7 21.0
Sources: NEP FY2017 (Volume I) and Time Series Budgetary Tables
Table 3
Sources of Appropriations, FY 2010 - 2017
(In Billion Pesos)
Average
Growth
Rate
Particulars2013
Actual
2014
Actual
2015
Actual
Variance
2016 vs 20172010
Actual
2011
Actual
2012
Actual
2016
Adjusted
2017
Proposed
Page 6 of 26
local government units (LGUs), aggregately corresponding to 40 percent of the national
internal revenue taxes based on the collection of the third fiscal year preceding the current
fiscal year. The share of each local LGU is determined pursuant to the provisions of the Local
Government Code. The IRA at P486.885 billion will allot LGUs an additional P58.266
billion over its 2016 IRA allocation of P428.62 billion. The IRA will grow by 13.59 percent
which is much higher than the growth of the national budget of 11.6 percent.
Interest Payments on NG Debts of P334.88 billion is 36.48 percent of the automatic
appropriation and will reflect a decrease of P57.92 billion from the FY 2016 figure of
P392.797 billion.
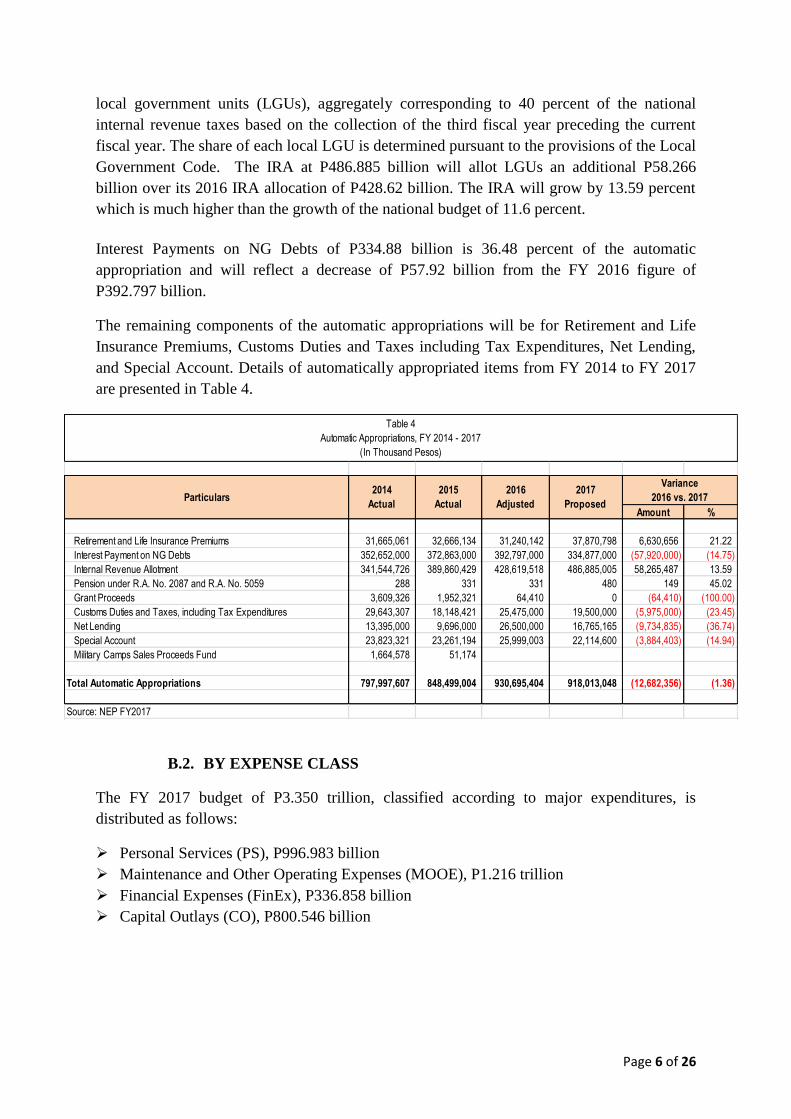
The remaining components of the automatic appropriations will be for Retirement and Life
Insurance Premiums, Customs Duties and Taxes including Tax Expenditures, Net Lending,
and Special Account. Details of automatically appropriated items from FY 2014 to FY 2017
are presented in Table 4.
B.2. BY EXPENSE CLASS
The FY 2017 budget of P3.350 trillion, classified according to major expenditures, is
distributed as follows:
Personal Services (PS), P996.983 billion
Maintenance and Other Operating Expenses (MOOE), P1.216 trillion
Financial Expenses (FinEx), P336.858 billion
Capital Outlays (CO), P800.546 billion
Amount %
Retirement and Life Insurance Premiums 31,665,061 32,666,134 31,240,142 37,870,798 6,630,656 21.22
Interest Payment on NG Debts 352,652,000 372,863,000 392,797,000 334,877,000 (57,920,000) (14.75)
Internal Revenue Allotment 341,544,726 389,860,429 428,619,518 486,885,005 58,265,487 13.59
Pension under R.A. No. 2087 and R.A. No. 5059 288 331 331 480 149 45.02
Grant Proceeds 3,609,326 1,952,321 64,410 0 (64,410) (100.00)
Customs Duties and Taxes, including Tax Expenditures 29,643,307 18,148,421 25,475,000 19,500,000 (5,975,000) (23.45)
Net Lending 13,395,000 9,696,000 26,500,000 16,765,165 (9,734,835) (36.74)
Special Account 23,823,321 23,261,194 25,999,003 22,114,600 (3,884,403) (14.94)
Military Camps Sales Proceeds Fund 1,664,578 51,174
Total Automatic Appropriations 797,997,607 848,499,004 930,695,404 918,013,048 (12,682,356) (1.36)
Source: NEP FY2017
Table 4
Automatic Appropriations, FY 2014 - 2017
(In Thousand Pesos)
Particulars2014
Actual
2015
Actual
2016
Adjusted
Variance
2016 vs. 20172017
Proposed
Page 7 of 26
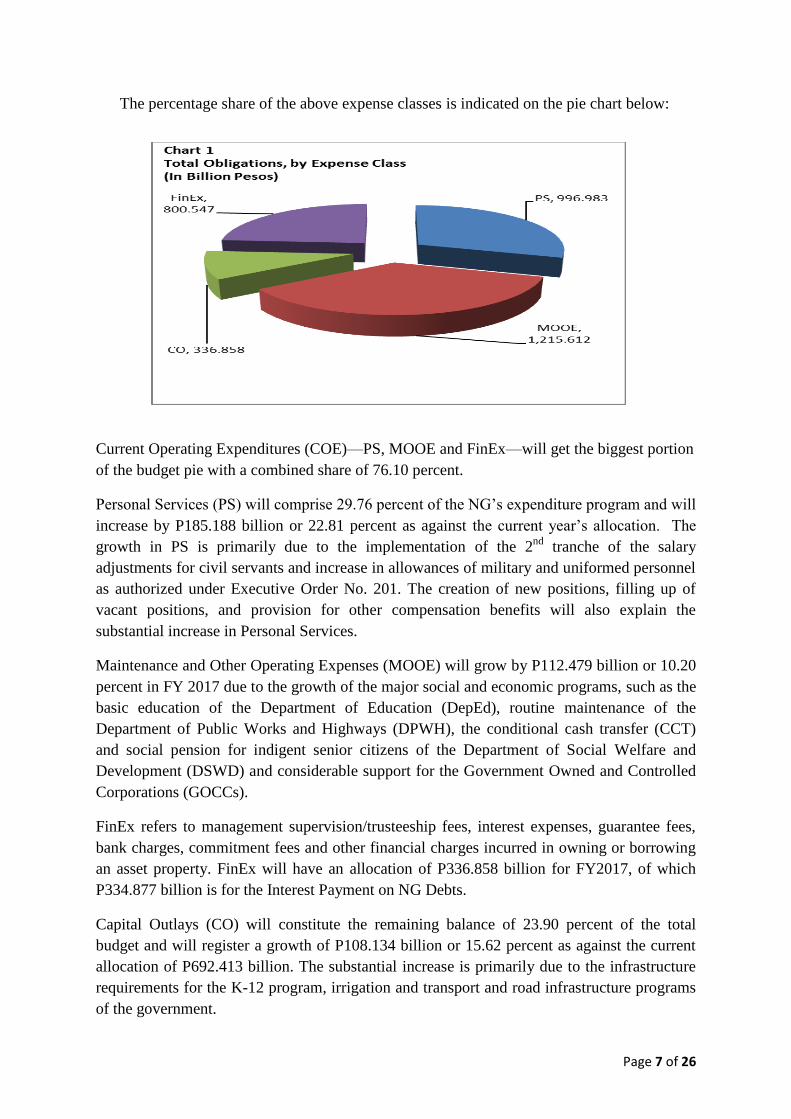
The percentage share of the above expense classes is indicated on the pie chart below:
Current Operating Expenditures (COE)—PS, MOOE and FinEx—will get the biggest portion
of the budget pie with a combined share of 76.10 percent.
Personal Services (PS) will comprise 29.76 percent of the NG’s expenditure program and will
increase by P185.188 billion or 22.81 percent as against the current year’s allocation. The
growth in PS is primarily due to the implementation of the 2nd
tranche of the salary
adjustments for civil servants and increase in allowances of military and uniformed personnel
as authorized under Executive Order No. 201. The creation of new positions, filling up of
vacant positions, and provision for other compensation benefits will also explain the
substantial increase in Personal Services.
Maintenance and Other Operating Expenses (MOOE) will grow by P112.479 billion or 10.20
percent in FY 2017 due to the growth of the major social and economic programs, such as the
basic education of the Department of Education (DepEd), routine maintenance of the
Department of Public Works and Highways (DPWH), the conditional cash transfer (CCT)
and social pension for indigent senior citizens of the Department of Social Welfare and
Development (DSWD) and considerable support for the Government Owned and Controlled
Corporations (GOCCs).
FinEx refers to management supervision/trusteeship fees, interest expenses, guarantee fees,
bank charges, commitment fees and other financial charges incurred in owning or borrowing
an asset property. FinEx will have an allocation of P336.858 billion for FY2017, of which
P334.877 billion is for the Interest Payment on NG Debts.
Capital Outlays (CO) will constitute the remaining balance of 23.90 percent of the total
budget and will register a growth of P108.134 billion or 15.62 percent as against the current
allocation of P692.413 billion. The substantial increase is primarily due to the infrastructure
requirements for the K-12 program, irrigation and transport and road infrastructure programs
of the government.
Page 8 of 26
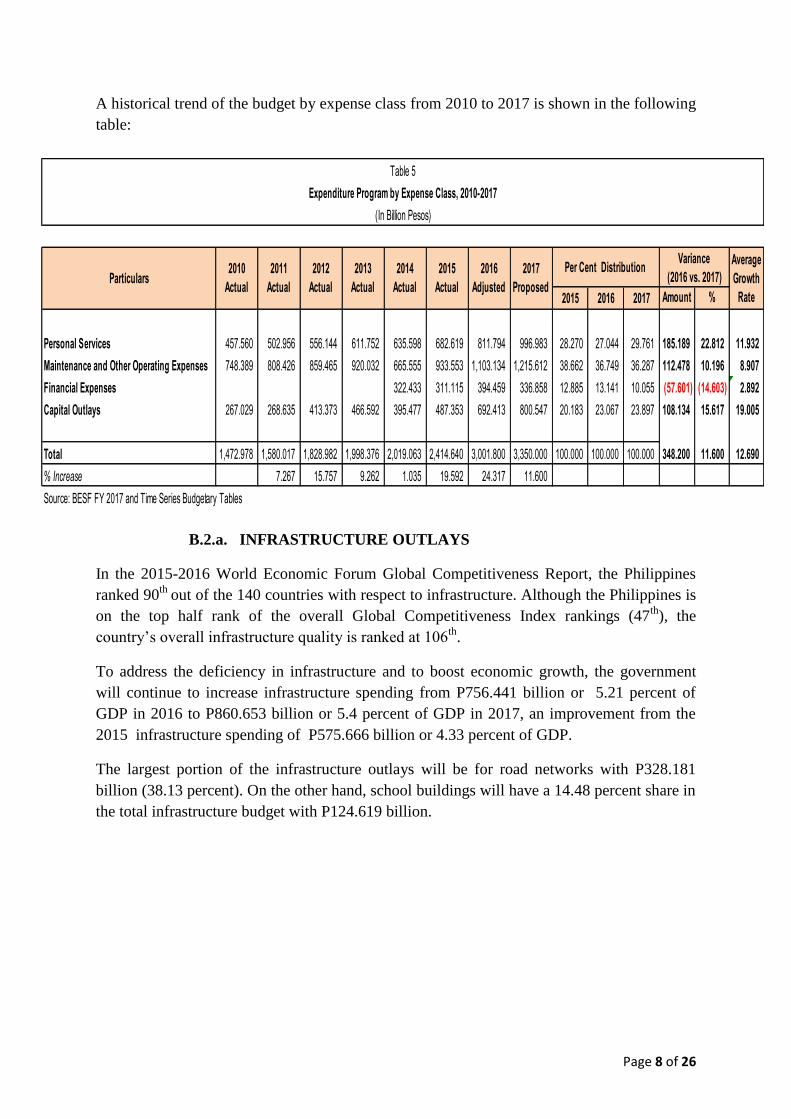
A historical trend of the budget by expense class from 2010 to 2017 is shown in the following
table:
B.2.a. INFRASTRUCTURE OUTLAYS
In the 2015-2016 World Economic Forum Global Competitiveness Report, the Philippines
ranked 90th
out of the 140 countries with respect to infrastructure. Although the Philippines is
on the top half rank of the overall Global Competitiveness Index rankings (47th
), the
country’s overall infrastructure quality is ranked at 106th
.
To address the deficiency in infrastructure and to boost economic growth, the government
will continue to increase infrastructure spending from P756.441 billion or 5.21 percent of
GDP in 2016 to P860.653 billion or 5.4 percent of GDP in 2017, an improvement from the
2015 infrastructure spending of P575.666 billion or 4.33 percent of GDP.
The largest portion of the infrastructure outlays will be for road networks with P328.181
billion (38.13 percent). On the other hand, school buildings will have a 14.48 percent share in
the total infrastructure budget with P124.619 billion.
2015 2016 2017 Amount %
Personal Services 457.560 502.956 556.144 611.752 635.598 682.619 811.794 996.983 28.270 27.044 29.761 185.189 22.812 11.932
Maintenance and Other Operating Expenses 748.389 808.426 859.465 920.032 665.555 933.553 1,103.134 1,215.612 38.662 36.749 36.287 112.478 10.196 8.907
Financial Expenses 322.433 311.115 394.459 336.858 12.885 13.141 10.055 (57.601) (14.603) 2.892
Capital Outlays 267.029 268.635 413.373 466.592 395.477 487.353 692.413 800.547 20.183 23.067 23.897 108.134 15.617 19.005
Total 1,472.978 1,580.017 1,828.982 1,998.376 2,019.063 2,414.640 3,001.800 3,350.000 100.000 100.000 100.000 348.200 11.600 12.690
% Increase 7.267 15.757 9.262 1.035 19.592 24.317 11.600
Table 5
2014
Actual
2015
Actual
2016
Adjusted
Variance
(2016 vs. 2017)2017
Proposed
Per Cent DistributionAverage
Growth
Rate
Source: BESF FY 2017 and Time Series Budgetary Tables
Expenditure Program by Expense Class, 2010-2017
(In Billion Pesos)
Particulars2010
Actual
2011
Actual
2012
Actual
2013
Actual
Page 9 of 26
B.3. BY COST STRUCTURE
About 56 percent or P1.859 trillion of the proposed budget for FY 2017 will be used to
finance the Programs of the national government (NG). Allocation for locally funded and
foreign assisted projects, on the other hand, will account for P1.139 trillion or 34 percent of
the whole budget pie. Debt Service-Interest Payments will have a share of 10 percent while
Net Lending, the advances by the NG for the servicing of government guaranteed corporate
debt during the year (net of repayments on such advances) including loans outlays or
proceeds from program loans relent to government corporations, will obtain the smallest
portion of 0.50 percent. The following chart highlights this distribution:
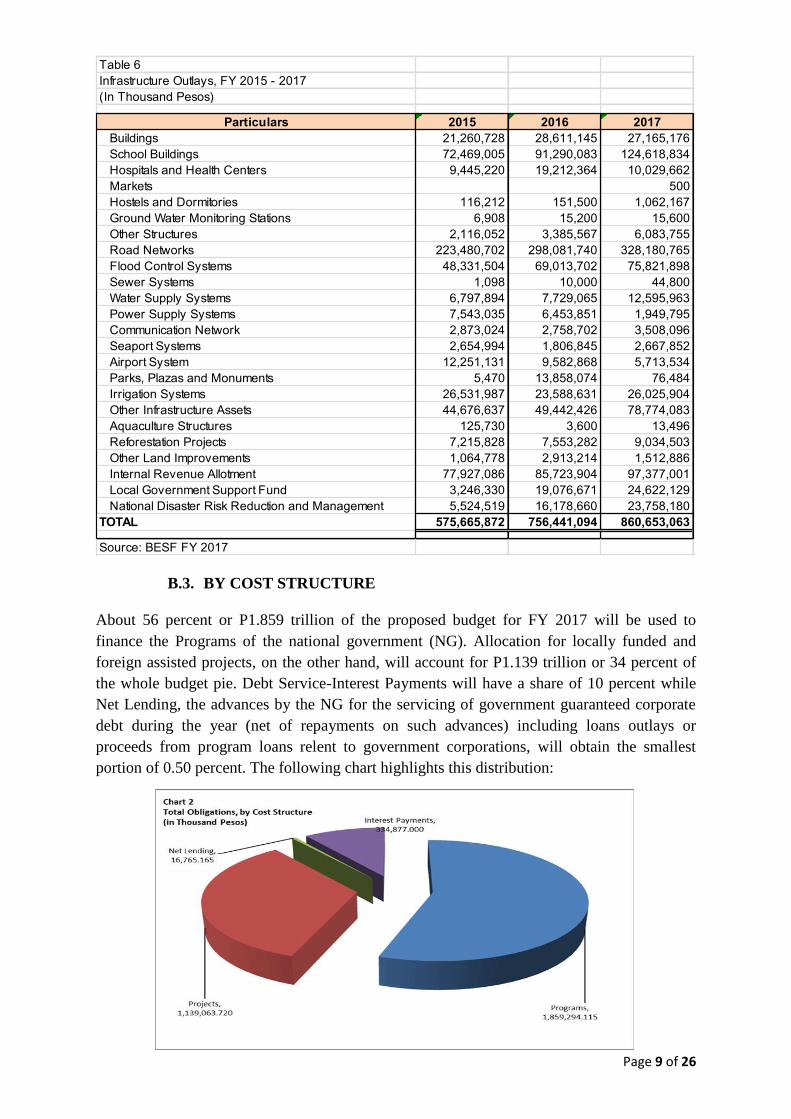
Table 6
Infrastructure Outlays, FY 2015 - 2017
(In Thousand Pesos)
Particulars 2015 2016 2017
Buildings 21,260,728 28,611,145 27,165,176
School Buildings 72,469,005 91,290,083 124,618,834
Hospitals and Health Centers 9,445,220 19,212,364 10,029,662
Markets 500
Hostels and Dormitories 116,212 151,500 1,062,167
Ground Water Monitoring Stations 6,908 15,200 15,600
Other Structures 2,116,052 3,385,567 6,083,755
Road Networks 223,480,702 298,081,740 328,180,765
Flood Control Systems 48,331,504 69,013,702 75,821,898
Sewer Systems 1,098 10,000 44,800
Water Supply Systems 6,797,894 7,729,065 12,595,963
Power Supply Systems 7,543,035 6,453,851 1,949,795
Communication Network 2,873,024 2,758,702 3,508,096
Seaport Systems 2,654,994 1,806,845 2,667,852
Airport System 12,251,131 9,582,868 5,713,534
Parks, Plazas and Monuments 5,470 13,858,074 76,484
Irrigation Systems 26,531,987 23,588,631 26,025,904
Other Infrastructure Assets 44,676,637 49,442,426 78,774,083
Aquaculture Structures 125,730 3,600 13,496
Reforestation Projects 7,215,828 7,553,282 9,034,503
Other Land Improvements 1,064,778 2,913,214 1,512,886
Internal Revenue Allotment 77,927,086 85,723,904 97,377,001
Local Government Support Fund 3,246,330 19,076,671 24,622,129
National Disaster Risk Reduction and Management 5,524,519 16,178,660 23,758,180
TOTAL 575,665,872 756,441,094 860,653,063
Source: BESF FY 2017
Page 10 of 26
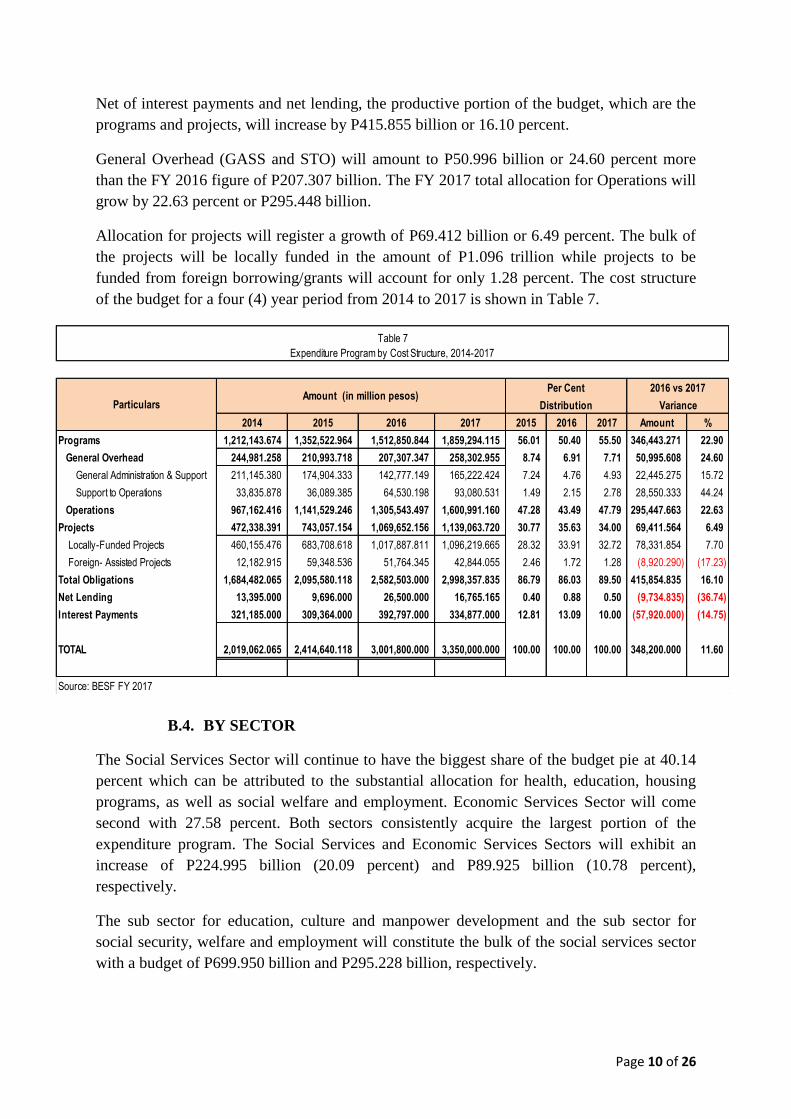
Net of interest payments and net lending, the productive portion of the budget, which are the
programs and projects, will increase by P415.855 billion or 16.10 percent.
General Overhead (GASS and STO) will amount to P50.996 billion or 24.60 percent more
than the FY 2016 figure of P207.307 billion. The FY 2017 total allocation for Operations will
grow by 22.63 percent or P295.448 billion.
Allocation for projects will register a growth of P69.412 billion or 6.49 percent. The bulk of
the projects will be locally funded in the amount of P1.096 trillion while projects to be
funded from foreign borrowing/grants will account for only 1.28 percent. The cost structure
of the budget for a four (4) year period from 2014 to 2017 is shown in Table 7.
B.4. BY SECTOR
The Social Services Sector will continue to have the biggest share of the budget pie at 40.14
percent which can be attributed to the substantial allocation for health, education, housing
programs, as well as social welfare and employment. Economic Services Sector will come
second with 27.58 percent. Both sectors consistently acquire the largest portion of the
expenditure program. The Social Services and Economic Services Sectors will exhibit an
increase of P224.995 billion (20.09 percent) and P89.925 billion (10.78 percent),
respectively.
The sub sector for education, culture and manpower development and the sub sector for
social security, welfare and employment will constitute the bulk of the social services sector
with a budget of P699.950 billion and P295.228 billion, respectively.
2014 2015 2016 2017 2015 2016 2017 Amount %
Programs 1,212,143.674 1,352,522.964 1,512,850.844 1,859,294.115 56.01 50.40 55.50 346,443.271 22.90
General Overhead 244,981.258 210,993.718 207,307.347 258,302.955 8.74 6.91 7.71 50,995.608 24.60
General Administration & Support 211,145.380 174,904.333 142,777.149 165,222.424 7.24 4.76 4.93 22,445.275 15.72
Support to Operations 33,835.878 36,089.385 64,530.198 93,080.531 1.49 2.15 2.78 28,550.333 44.24
Operations 967,162.416 1,141,529.246 1,305,543.497 1,600,991.160 47.28 43.49 47.79 295,447.663 22.63
Projects 472,338.391 743,057.154 1,069,652.156 1,139,063.720 30.77 35.63 34.00 69,411.564 6.49
Locally-Funded Projects 460,155.476 683,708.618 1,017,887.811 1,096,219.665 28.32 33.91 32.72 78,331.854 7.70
Foreign- Assisted Projects 12,182.915 59,348.536 51,764.345 42,844.055 2.46 1.72 1.28 (8,920.290) (17.23)
Total Obligations 1,684,482.065 2,095,580.118 2,582,503.000 2,998,357.835 86.79 86.03 89.50 415,854.835 16.10
Net Lending 13,395.000 9,696.000 26,500.000 16,765.165 0.40 0.88 0.50 (9,734.835) (36.74)
Interest Payments 321,185.000 309,364.000 392,797.000 334,877.000 12.81 13.09 10.00 (57,920.000) (14.75)
TOTAL 2,019,062.065 2,414,640.118 3,001,800.000 3,350,000.000 100.00 100.00 100.00 348,200.000 11.60
Per Cent
Distribution
Source: BESF FY 2017
Table 7
Expenditure Program by Cost Structure, 2014-2017
Particulars
2016 vs 2017
VarianceAmount (in million pesos)
Page 11 of 26
On the other hand, the sub-sector for communications, roads and other transport will receive
P480.265 billion or 52 percent of the economic services sector, and will include the
enhancement of industrial/agricultural production capacities, like the development of natural
resources, promotion of trade and industry, and the setting up of infrastructure and utilities.
General Public Services Sector will increase by P83.860 billion or 16.84 percent while the
Defense Sector will grow by 13.07 percent which will be used to strengthen domestic
security.
Debt service and net lending will both reflect a decline of 14.75 percent and 36.74 percent,
respectively.
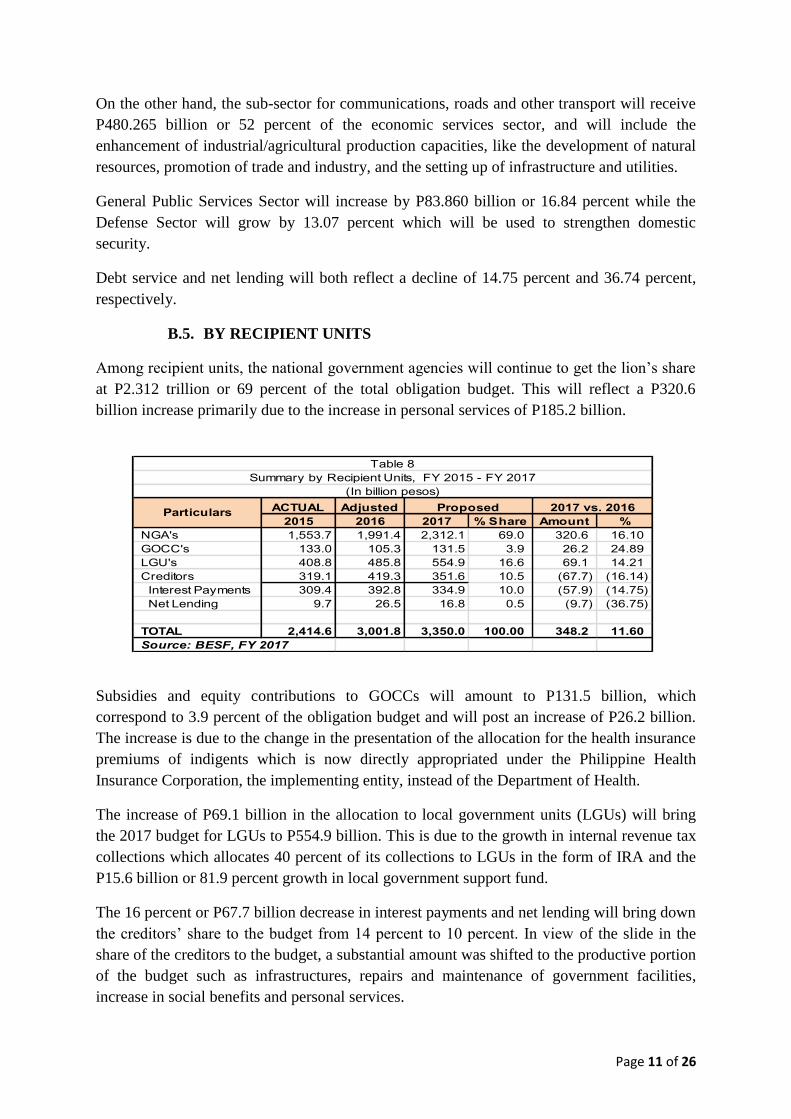
B.5. BY RECIPIENT UNITS
Among recipient units, the national government agencies will continue to get the lion’s share
at P2.312 trillion or 69 percent of the total obligation budget. This will reflect a P320.6
billion increase primarily due to the increase in personal services of P185.2 billion.
Subsidies and equity contributions to GOCCs will amount to P131.5 billion, which
correspond to 3.9 percent of the obligation budget and will post an increase of P26.2 billion.
The increase is due to the change in the presentation of the allocation for the health insurance
premiums of indigents which is now directly appropriated under the Philippine Health
Insurance Corporation, the implementing entity, instead of the Department of Health.
The increase of P69.1 billion in the allocation to local government units (LGUs) will bring
the 2017 budget for LGUs to P554.9 billion. This is due to the growth in internal revenue tax
collections which allocates 40 percent of its collections to LGUs in the form of IRA and the
P15.6 billion or 81.9 percent growth in local government support fund.
The 16 percent or P67.7 billion decrease in interest payments and net lending will bring down
the creditors’ share to the budget from 14 percent to 10 percent. In view of the slide in the
share of the creditors to the budget, a substantial amount was shifted to the productive portion
of the budget such as infrastructures, repairs and maintenance of government facilities,
increase in social benefits and personal services.
2015 2016 2017 % Share Amount %
NGA's 1,553.7 1,991.4 2,312.1 69.0 320.6 16.10
GOCC's 133.0 105.3 131.5 3.9 26.2 24.89
LGU's 408.8 485.8 554.9 16.6 69.1 14.21
Creditors 319.1 419.3 351.6 10.5 (67.7) (16.14)
Interest Payments 309.4 392.8 334.9 10.0 (57.9) (14.75)
Net Lending 9.7 26.5 16.8 0.5 (9.7) (36.75)
TOTAL 2,414.6 3,001.8 3,350.0 100.00 348.2 11.60
Source: BESF, FY 2017
Table 8
Summary by Recipient Units, FY 2015 - FY 2017
(In billion pesos)
2017 vs. 2016Adjusted ProposedACTUALParticulars
Page 12 of 26
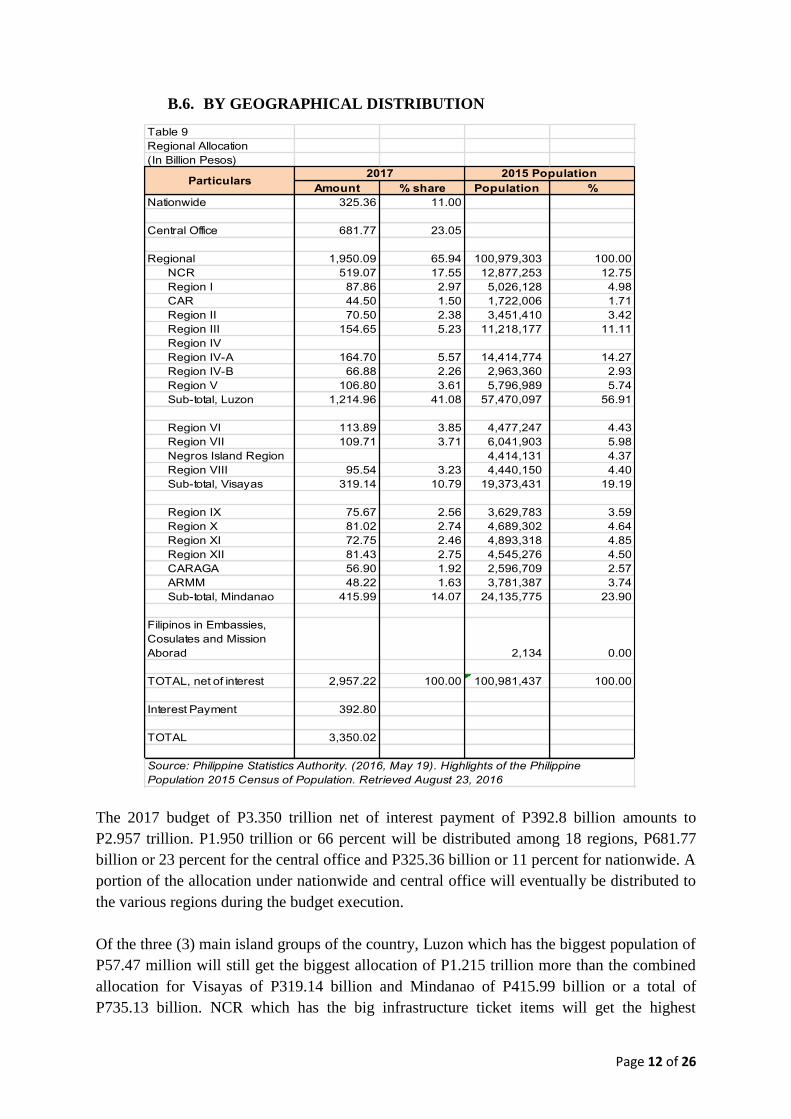
B.6. BY GEOGRAPHICAL DISTRIBUTION
The 2017 budget of P3.350 trillion net of interest payment of P392.8 billion amounts to
P2.957 trillion. P1.950 trillion or 66 percent will be distributed among 18 regions, P681.77
billion or 23 percent for the central office and P325.36 billion or 11 percent for nationwide. A
portion of the allocation under nationwide and central office will eventually be distributed to
the various regions during the budget execution.
Of the three (3) main island groups of the country, Luzon which has the biggest population of
P57.47 million will still get the biggest allocation of P1.215 trillion more than the combined
allocation for Visayas of P319.14 billion and Mindanao of P415.99 billion or a total of
P735.13 billion. NCR which has the big infrastructure ticket items will get the highest
Table 9
Regional Allocation
(In Billion Pesos)
Amount % share Population %
Nationwide 325.36 11.00
Central Office 681.77 23.05
Regional 1,950.09 65.94 100,979,303 100.00
NCR 519.07 17.55 12,877,253 12.75
Region I 87.86 2.97 5,026,128 4.98
CAR 44.50 1.50 1,722,006 1.71
Region II 70.50 2.38 3,451,410 3.42
Region III 154.65 5.23 11,218,177 11.11
Region IV
Region IV-A 164.70 5.57 14,414,774 14.27
Region IV-B 66.88 2.26 2,963,360 2.93
Region V 106.80 3.61 5,796,989 5.74
Sub-total, Luzon 1,214.96 41.08 57,470,097 56.91
Region VI 113.89 3.85 4,477,247 4.43
Region VII 109.71 3.71 6,041,903 5.98
Negros Island Region 4,414,131 4.37
Region VIII 95.54 3.23 4,440,150 4.40
Sub-total, Visayas 319.14 10.79 19,373,431 19.19
Region IX 75.67 2.56 3,629,783 3.59
Region X 81.02 2.74 4,689,302 4.64
Region XI 72.75 2.46 4,893,318 4.85
Region XII 81.43 2.75 4,545,276 4.50
CARAGA 56.90 1.92 2,596,709 2.57
ARMM 48.22 1.63 3,781,387 3.74
Sub-total, Mindanao 415.99 14.07 24,135,775 23.90
Filipinos in Embassies,
Cosulates and Mission
Aborad 2,134 0.00
TOTAL, net of interest 2,957.22 100.00 100,981,437 100.00
Interest Payment 392.80
TOTAL 3,350.02
Source: Philippine Statistics Authority. (2016, May 19). Highlights of the Philippine
Population 2015 Census of Population. Retrieved August 23, 2016
Particulars2017 2015 Population
Page 13 of 26
allocation among regions. Regions 1V- A, the most populous region, with a population of
14.41 million and Region III with a population of 11.22 million will get P164.7 billion and
P154.65 billion, respectively.
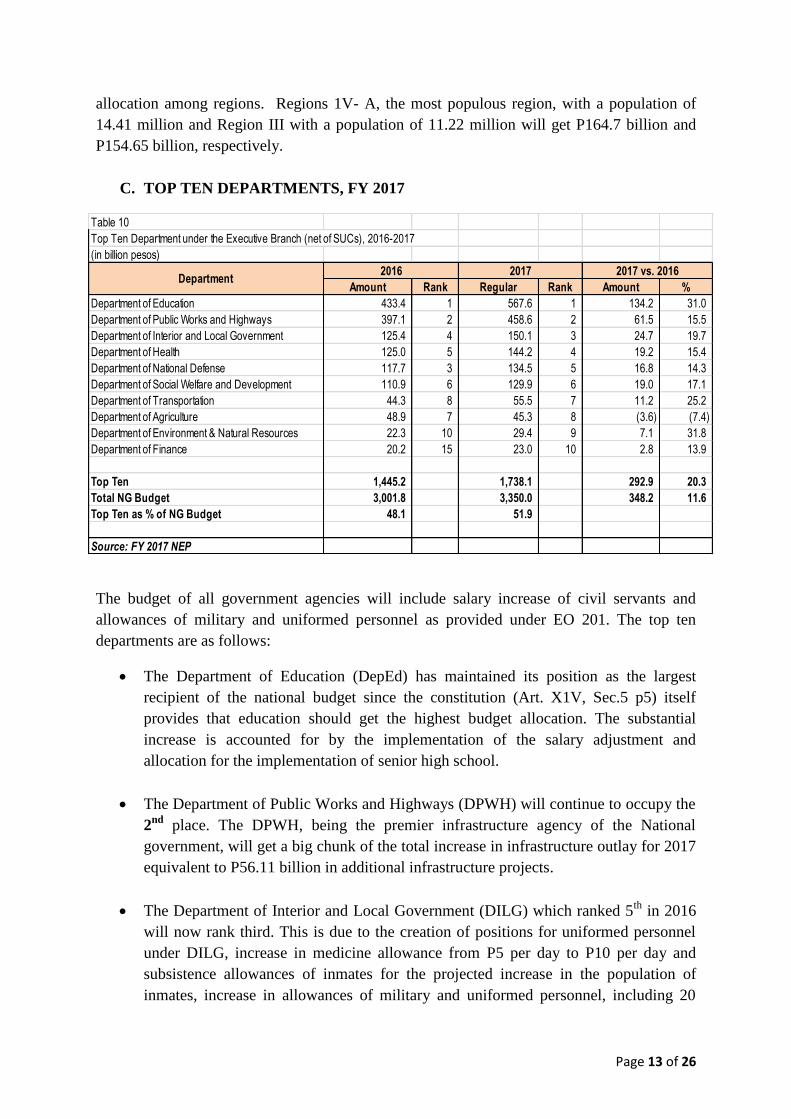
C. TOP TEN DEPARTMENTS, FY 2017
The budget of all government agencies will include salary increase of civil servants and
allowances of military and uniformed personnel as provided under EO 201. The top ten
departments are as follows:
The Department of Education (DepEd) has maintained its position as the largest
recipient of the national budget since the constitution (Art. X1V, Sec.5 p5) itself
provides that education should get the highest budget allocation. The substantial
increase is accounted for by the implementation of the salary adjustment and
allocation for the implementation of senior high school.
The Department of Public Works and Highways (DPWH) will continue to occupy the
2nd
place. The DPWH, being the premier infrastructure agency of the National
government, will get a big chunk of the total increase in infrastructure outlay for 2017
equivalent to P56.11 billion in additional infrastructure projects.
The Department of Interior and Local Government (DILG) which ranked 5th
in 2016
will now rank third. This is due to the creation of positions for uniformed personnel
under DILG, increase in medicine allowance from P5 per day to P10 per day and
subsistence allowances of inmates for the projected increase in the population of
inmates, increase in allowances of military and uniformed personnel, including 20
Table 10
Top Ten Department under the Executive Branch (net of SUCs), 2016-2017
Amount Rank Regular Rank Amount %
Department of Education 433.4 1 567.6 1 134.2 31.0
Department of Public Works and Highways 397.1 2 458.6 2 61.5 15.5
Department of Interior and Local Government 125.4 4 150.1 3 24.7 19.7
Department of Health 125.0 5 144.2 4 19.2 15.4
Department of National Defense 117.7 3 134.5 5 16.8 14.3
Department of Social Welfare and Development 110.9 6 129.9 6 19.0 17.1
Department of Transportation 44.3 8 55.5 7 11.2 25.2
Department of Agriculture 48.9 7 45.3 8 (3.6) (7.4)
Department of Environment & Natural Resources 22.3 10 29.4 9 7.1 31.8
Department of Finance 20.2 15 23.0 10 2.8 13.9
Top Ten 1,445.2 1,738.1 292.9 20.3
Total NG Budget 3,001.8 3,350.0 348.2 11.6
Top Ten as % of NG Budget 48.1 51.9
2016 2017 vs. 20162017
Source: FY 2017 NEP
(in billion pesos)
Department
Page 14 of 26
kilos of rice per month. A substantial amount is also provided for the construction of
jail buildings and fire stations.
The Department of Health (DOH), including the subsidy for Philhealth to cover the
insurance premiums of indigents and senior citizens will maintain its ranking at 4th
place. Although the health facilities enhancement program was reduced, this will be
offset by the allocation for the construction of treatment and rehabilitation centers and
additional spending for medical assistance, immunization, family health and
responsible parenting and disease prevention.
The Department of National Defense (DND) budgetary ranking will slide down from
the 3rd
place in 2016 to 5th
place in 2017. The P134.5 billion budget of the DND will
cover additional allowance for military personnel under EO 201, including 20 kilos
per month of rice subsidy. A bigger amount for ammunition and Intelligence fund is
also provided. The engineering brigade of the Philippine Army will be activated and
will get P1.3 billion.
Ranked sixth (6th
) is the budget allotted for the Department of Social Welfare and
Development (DSWD) which will continue to implement the conditional cash transfer
(CCT) program. The number of beneficiaries for CCT will remain the same at 4.6
million of which 3 million regular CCT beneficiaries will receive 20 kilos per month
in rice subsidies. Additional fund is also provided for all indigent senior citizens.
The Department of Transportation (DoTr) budget of P55.5 billion is P11.2 billion
higher than its 2016 allocation and will now rank 7th
among the departments. This will
cover additional funding for railways, roads, and Road Transport IT Infrastructure
Project. Its MOOE will include allocation for STRADCOM payable in the amount of
P1.829 billion.
Since the budget of the Department of Agriculture of P45.3 billion will reflect a
reduction of P3.6 billion, it will slide down to the 8th
slot among the top ten
departments. The decrease in the DA’s budget is due to the transfer of the allocation
for PAyapa at MAsaganang PamayaNAn (PAMANA) Program projects to the Office
of the Presidential Adviser on Peace Process (OPPAP) and the deletion of Bottom-Up
Budgeting (BUB) projects. However, the allocation for Extension Support, Education
and Training will get a substantial increase.
The ninth (9th
) place among the executive departments is for the budget of the
Department of Environment and Natural Resources (DENR). The P29.371 billion
budget of the DENR will mostly support the following increase in personnel services;
implementation of forest protection plan; Ecotourism Development Program;
Philippine Islands Inventory Project; and the National Greening Program.
Page 15 of 26
Ranked in tenth (10th
) place will be the budget for the Department of Finance (DOF)
which will cover the construction of new buildings of the BOC and the BIR and for
the purchase of speedboat for the anti-smuggling campaign. Included also in the DOF
budget is the allocation for capital or quota subscription and revaluation or
maintenance of value to foreign financial institutions that has been reviewed by the
DFA and the International Commitments Fund Panel, which was carved out from the
allocation of the International Commitment Fund under the Department of Foreign
Affairs (DFA).
D. OFF-BUDGET ACCOUNTS
Aside from the P3.350 trillion budget in the FY 2017, the NG is expected to spend an
additional amount of P48.977 billion or 78.32 percent of the projected receipts of P62.535
billion. These are called Off-budgetary funds or receipts which are authorized to be deposited
with government financial institutions for expenditure items which are not part of the
National Expenditure Program (NEP). These are categorized into:
o retained income/receipts
o revolving funds, and
o receipts from borrowing from the BTr.
Included under these Off-Budget Funds/Items are: (a) income from hostels, seminar fees
which shall be used for MOOE of hostels and expenses in the conduct of seminars, (b)
hospital income which will be used to augment its MOOE and for the purchase of additional
equipment, (c) fees in excess of the regular passport fees collected due to special
consideration or issuance beyond regular office hours to be used for PERA, wages and
overtime pay, and (d) internally generated income of SUCS to be used for PS, MOOE and
CO.
E. NATIONAL GOVERNMENT REVENUES
E.1. 2017 REVENUE TARGETS
The 2017 revenue program of P2.482 trillion will partly finance the P2.960 trillion
government cash requirements. To achieve this, government collections must grow by 10
percent over the adjusted 2016 level of P2.257 trillion.
Page 16 of 26
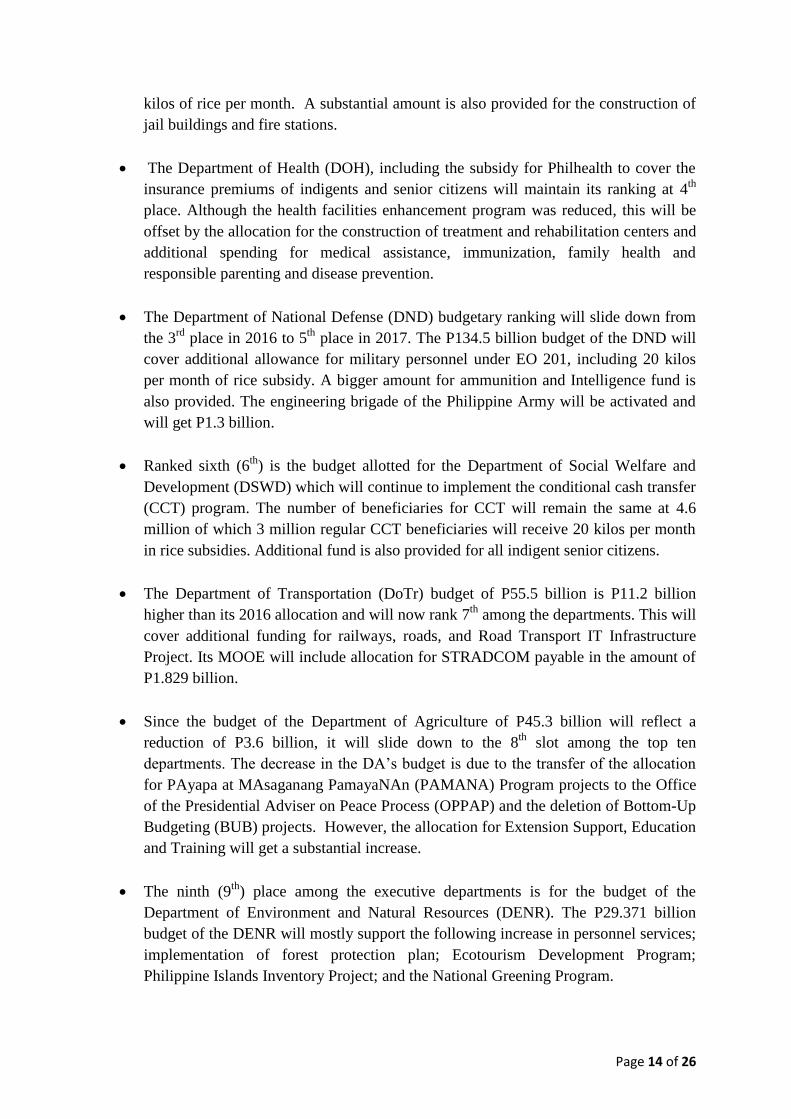
The revenue target was originally placed at P3.040 trillion, which is 18.5 percent of the
projected P16.457 trillion GDP, but was slashed to a more realistic level of P2.482 trillion by
the current administration. This revised revenue target is 15.6 percent of the downscaled GDP
target of P15.937 trillion. Tax, non-tax revenue and proceeds from privatization comprise the
NG revenue targets.
Tax revenues are projected to reach P2.313 trillion which is equivalent to a tax effort of 14.5
percent. The Bureau of Internal Revenue (BIR) is tasked to collect P1.829 trillion of the
projected tax revenues, while the Bureau of Customs (BOC) will collect the remaining 20
percent or P467.9 billion.
Non-tax revenues which include fees and charges, income from treasury operations and NG
income collected by the Bureau of Treasury (BTr) such as dividends from GOCCs, NG share
from airport terminal fees, PAGCOR income, and MIAA profit are expected to reach P166.5
billion. This is P44.2 billion less than the 2016 projections of P210.7 billion. The Budget of
Expenditures and Sources of Financing (BESF) shows that most of the non-tax revenue
sources for 2017 are projected to decrease.
The above table shows that non-tax revenues have consistently increased and the fact that the
1st semester non-tax revenue collections have reached 78 percent of its target indicates that
the 2016 projection will be exceeded. Accordingly, the 2017 non tax revenue targets are
unusually low.
The 2017 projected revenue effort of 15.6 percent reflects a slight increase compared with the
revenue effort of 2016 of 15.5 percent, but compared with 2015, it is .2 percentage (0.2
percent) lower than the 2015 tax effort of 15.8 percent.
The NG intends to submit a comprehensive tax reform program which proposes a reduction
in the corporate income tax from 30 percent to 25 percent and for the revision of the schedule
of rates of personal income tax from 32 percent to 25 percent which will both result to
revenue losses.
Table 11
NG Revenues, FY 2010-2017
(Amounts In Billion Pesos)
Particulars 2010 2011 2012 2013 2014 2015 2016 2017
Total Revenues 1,207.93 1,359.94 1,534.93 1,716.09 1,908.53 2,108.96 2,256.72 2,481.54
% of GDP 13.42 14.01 14.53 14.87 15.10 15.85 15.53 15.57
Tax Revenues 1,093.64 1,202.07 1,361.08 1,535.70 1,720.12 1,815.48 2,044.00 2,313.02
% of GDP 12.15 12.38 12.89 13.30 13.61 13.64 14.07 14.51
BIR 822.62 924.15 1,057.92 1,216.66 1,334.76 1,433.30 1,620.00 1,829.25
BOC 259.24 265.11 289.87 304.93 369.28 367.53 409.00 467.90
Other Offices 11.78 12.81 13.30 14.11 16.08 14.65 15.00 15.87
Non-Tax Revenues 113.37 156.95 165.50 177.46 186.47 230.70 210.72 166.53
Privatization 0.91 0.93 8.35 2.94 1.94 62.8 2.0 2.0
GDP Nominal 9,003.480 9,708.332 10,561.089 11,542.286 12,642.736 13,307.265 14,528.872 15,937.446
Source: 2017 BESF, (2015-2017 data)
DBM Time Series Handbook (2010-2014 data)
Page 17 of 26
The said measures are expected to expand economic activities due to an increase in the take-
home pay of workers, giving them more money to spend. It also expects to improve business
climate that will encourage investment.
The forgone revenues will be compensated by accompanying proposals to index excise tax on
oil products to inflation, rationalization of fiscal incentives and to expand the value-added tax
base.
In addition, administrative measures will also be adopted to include the improvement of the
systems and capacity of the BIR and the BOC. To plug loopholes that abet tax evasion, the
NG will propose that the Bank Secrecy Law be relaxed while the Anti-Money Laundering
Act has to be amended to make tax evasion a predicate crime to money laundering.
The effects of these proposals on the revenue targets are not inputted in the 2017 revenue
projections. Thus, if these measures will be passed in 2017, it will affect the revenue targets.
For government to maintain its fiscal position, Congress must ensure that it will pass the
revenue measures that will offset whatever revenue losses will result from the proposal to
reduce income taxes. Increase in deficit will mean increase in borrowings which will impact
on the interest payments.
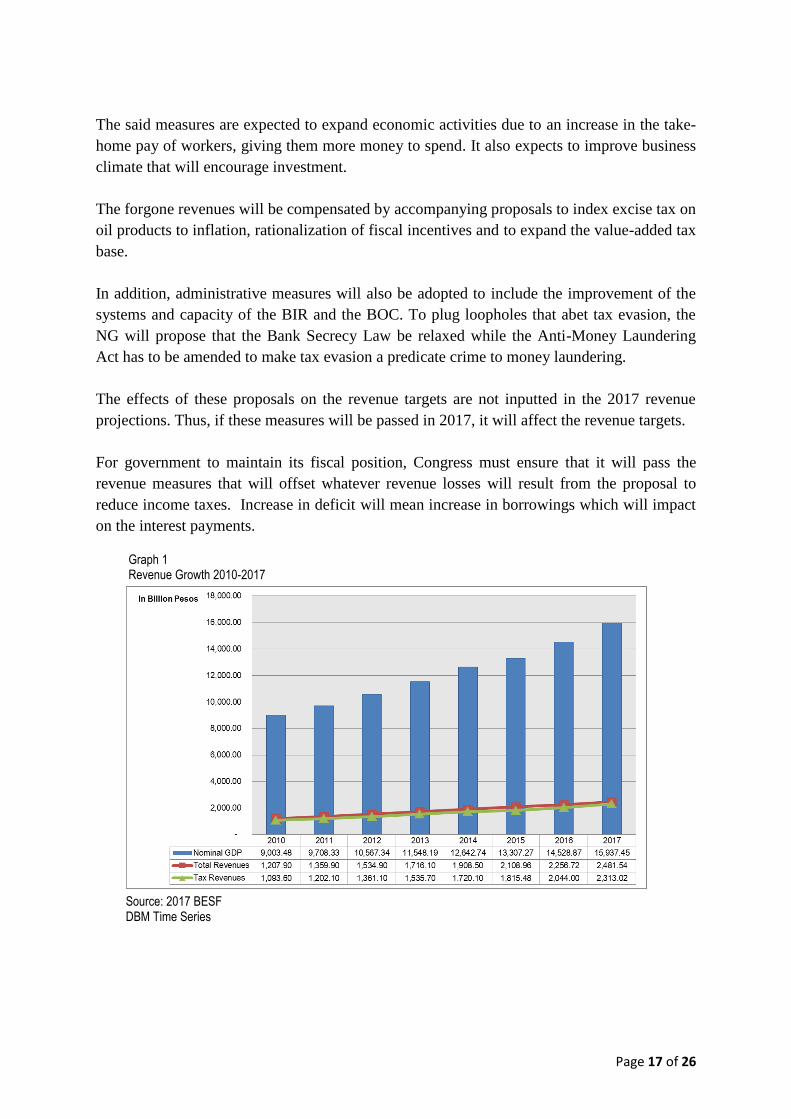
Graph 1 Revenue Growth 2010-2017
Source: 2017 BESF DBM Time Series

Page 18 of 26
E.2. REVENUE PERFORMANCE (2015 AND 1ST
SEMESTER OF 2016)
Revenue collections for 2015 reached P2.109 trillion which is equivalent to a revenue effort
of 15.9 percent. Tax revenue collections reached P1.815 trillion while non-tax revenues will
amount to P230.7 billion. Both BIR and BOC missed its adjusted revenue targets of P1.674
trillion and P436.6 billion by 14.4 percent and 15.8 percent, respectively. Non-tax revenues,
on the other hand, exceeded its target by 58.45 percent due to the higher than expected
dividend collection, income from treasury operation, and other non-tax revenue items.
For 2016, the first semester revenue performance amounted to P1.101 trillion or 40.82
percent of the whole-year revenue. Of this amount, tax revenue collection accounts for
P982.04 billion or 89 percent and is equivalent to 38.61 percent of its whole-year target,
indicating that the tax revenue collecting agencies will again miss their targets.
Non-revenue tax collections amounted to P118.47 billion which is equivalent to 78 percent of
its whole-year target, while Proceeds from privatization have reached P745 million.
Graph 1 illustrates the actual revenue growth from 2010 – 2017 which averages 11.09
percent. The first semester 2016 revenue performance indicates that the original projected
growth rate of 27.9 percent is not attainable. However, the downscaled 2016 revenue target of
P2.257 trillion, which reflect a 7 percent growth rate over the 2015 actual revenue, is way
below the average growth rate of 11.09 percent for the past five (5) years.
F. CASH DISBURSEMENT PROGRAM
In determining the cash disbursement program, the computation will include the prior years’
obligations authorized under previous appropriation laws which have not been paid and the
proposed 2017 expenditures that will be obligated and will require cash payment during the
year. Expenditures for 2017 which will not be paid during the year will impact on the cash
disbursement of the following year.
Table 12
NG Cash Disbursement Program , 2010-2017
Particulars 2010 2011 2012 2013 2014 2015 2016 2017
(Amounts In Billion Pesos)
Total Revenues 1,207.93 1,359.94 1,534.93 1,716.09 1,908.53 2,108.96 2,256.72 2,481.54
Disbursements 1,522.38 1,557.70 1,777.76 1,880.16 1,981.62 2,230.65 2,645.59 2,959.67
% of GDP 16.91 16.04 16.83 16.29 15.67 16.76 18.21 18.57
Surplus/(Deficit) (314.45) (197.76) (242.83) (164.07) (73.09) (121.69) (388.87) (478.13)
% of GDP (3.49) (2.04) (2.30) (1.42) (0.58) (0.91) (2.68) (3.00)
GDP Nominal 9,003.480 9,708.332 10,561.089 11,542.286 12,642.736 13,307.265 14,528.872 15,937.446
Source: 2017 BESF,(2015-2017 data)
DBM Time Series Handbook (2010-2014 data)

Page 19 of 26
Thus, for 2017, the government must raise P2.960 trillion, through revenue collections and
borrowings, to meet its cash requirements arising from previous years’ obligations and a
portion of the 2017 obligations. This will reflect an increase of P314.10 billion or 12 percent
from the 2016 disbursement level of P2.646 trillion and as a percentage of GDP, it will
increase from 18.2 percent in 2016 to 18.6 percent in 2017. Disbursements for 2016 and
2017 are distributed as follows:
Table 13 Disbursement by Expense Class, FY 2015-2017
Particulars 2015 2016 2017
COE 1,784.91 1,973.05 2,208.53
CO 436.04 655.71 734.37
NL 9.70 16.82 16.77
Total 2,230.65 2,645.58 2,959.67
GDP Nominal 13,307.265 14,528.872 15,937.446
% of GDP 16.76 18.21 18.57 Source: 2017 NEP
Current Operating Expenses, which includes payment of Personnel Services, interest
payments, allotment to LGUs and MOOE will account for 74.6 percent of the cash
disbursements while Capital Outlays account for 24.8 percent. This percentage distribution
among expense class is the same level with the 2016 disbursement program.
G. NATIONAL GOVERNMENT DEFICIT
Since the projected revenue of P2.482 trillion is not sufficient to cover the cash disbursement
requirements of P2.960 trillion, the government will incur a deficit of P478.1 billion which
corresponds to 3 percent of GDP.
Graph 2 NG Deficit, 2010-2017
Source: 2027 BESF DBM Time Series
Page 20 of 26
The deficit of 3 percent to GDP is the highest since 2011. The lower revenue growth at 10
percent for 2017 (average growth for the past five years is 11.09 percent) and accelerated
disbursements, which can be partly attributed to the inclusion of a provision in the 2017
proposed NEP that limits the validity of the new appropriations to one year will explain the
higher deficit.
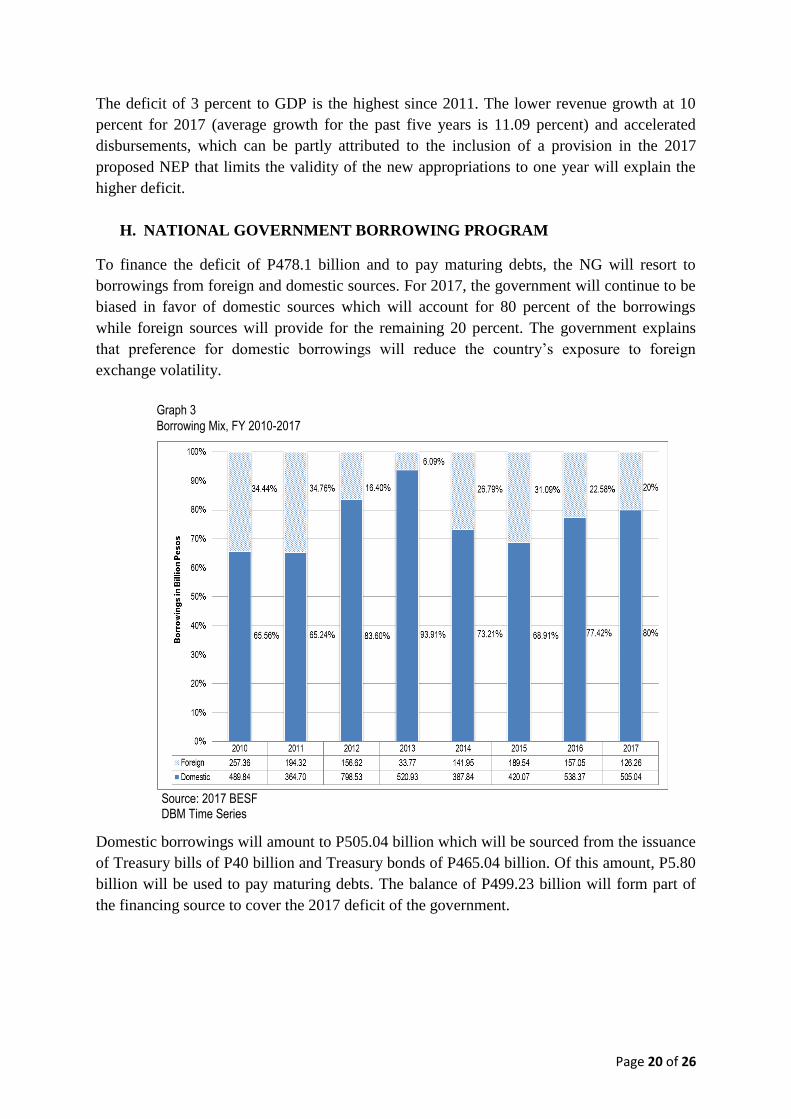
H. NATIONAL GOVERNMENT BORROWING PROGRAM
To finance the deficit of P478.1 billion and to pay maturing debts, the NG will resort to
borrowings from foreign and domestic sources. For 2017, the government will continue to be
biased in favor of domestic sources which will account for 80 percent of the borrowings
while foreign sources will provide for the remaining 20 percent. The government explains
that preference for domestic borrowings will reduce the country’s exposure to foreign
exchange volatility.
Domestic borrowings will amount to P505.04 billion which will be sourced from the issuance
of Treasury bills of P40 billion and Treasury bonds of P465.04 billion. Of this amount, P5.80
billion will be used to pay maturing debts. The balance of P499.23 billion will form part of
the financing source to cover the 2017 deficit of the government.
Graph 3
Borrowing Mix, FY 2010-2017
Source: 2017 BESF DBM Time Series
Page 21 of 26
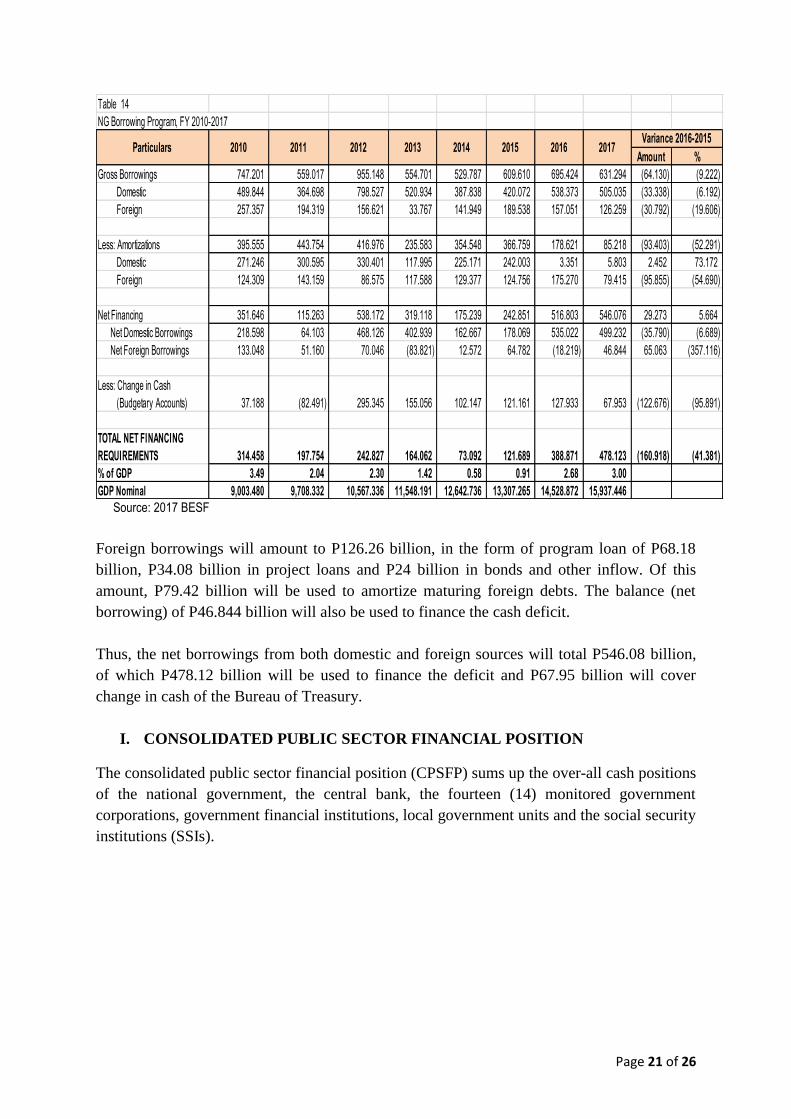
Foreign borrowings will amount to P126.26 billion, in the form of program loan of P68.18
billion, P34.08 billion in project loans and P24 billion in bonds and other inflow. Of this
amount, P79.42 billion will be used to amortize maturing foreign debts. The balance (net
borrowing) of P46.844 billion will also be used to finance the cash deficit.
Thus, the net borrowings from both domestic and foreign sources will total P546.08 billion,
of which P478.12 billion will be used to finance the deficit and P67.95 billion will cover
change in cash of the Bureau of Treasury.
I. CONSOLIDATED PUBLIC SECTOR FINANCIAL POSITION
The consolidated public sector financial position (CPSFP) sums up the over-all cash positions
of the national government, the central bank, the fourteen (14) monitored government
corporations, government financial institutions, local government units and the social security
institutions (SSIs).
Table 14
NG Borrowing Program, FY 2010-2017
Amount %
Gross Borrowings 747.201 559.017 955.148 554.701 529.787 609.610 695.424 631.294 (64.130) (9.222)
Domestic 489.844 364.698 798.527 520.934 387.838 420.072 538.373 505.035 (33.338) (6.192)
Foreign 257.357 194.319 156.621 33.767 141.949 189.538 157.051 126.259 (30.792) (19.606)
Less: Amortizations 395.555 443.754 416.976 235.583 354.548 366.759 178.621 85.218 (93.403) (52.291)
Domestic 271.246 300.595 330.401 117.995 225.171 242.003 3.351 5.803 2.452 73.172
Foreign 124.309 143.159 86.575 117.588 129.377 124.756 175.270 79.415 (95.855) (54.690)
Net Financing 351.646 115.263 538.172 319.118 175.239 242.851 516.803 546.076 29.273 5.664
Net Domestic Borrowings 218.598 64.103 468.126 402.939 162.667 178.069 535.022 499.232 (35.790) (6.689)
Net Foreign Borrowings 133.048 51.160 70.046 (83.821) 12.572 64.782 (18.219) 46.844 65.063 (357.116)
Less: Change in Cash
(Budgetary Accounts) 37.188 (82.491) 295.345 155.056 102.147 121.161 127.933 67.953 (122.676) (95.891)
TOTAL NET FINANCING
REQUIREMENTS 314.458 197.754 242.827 164.062 73.092 121.689 388.871 478.123 (160.918) (41.381)
% of GDP 3.49 2.04 2.30 1.42 0.58 0.91 2.68 3.00
GDP Nominal 9,003.480 9,708.332 10,567.336 11,548.191 12,642.736 13,307.265 14,528.872 15,937.446
2015 2016 20172010 2011 2012 2013 2014Variance 2016-2015
Particulars
Source: 2017 BESF
Page 22 of 26
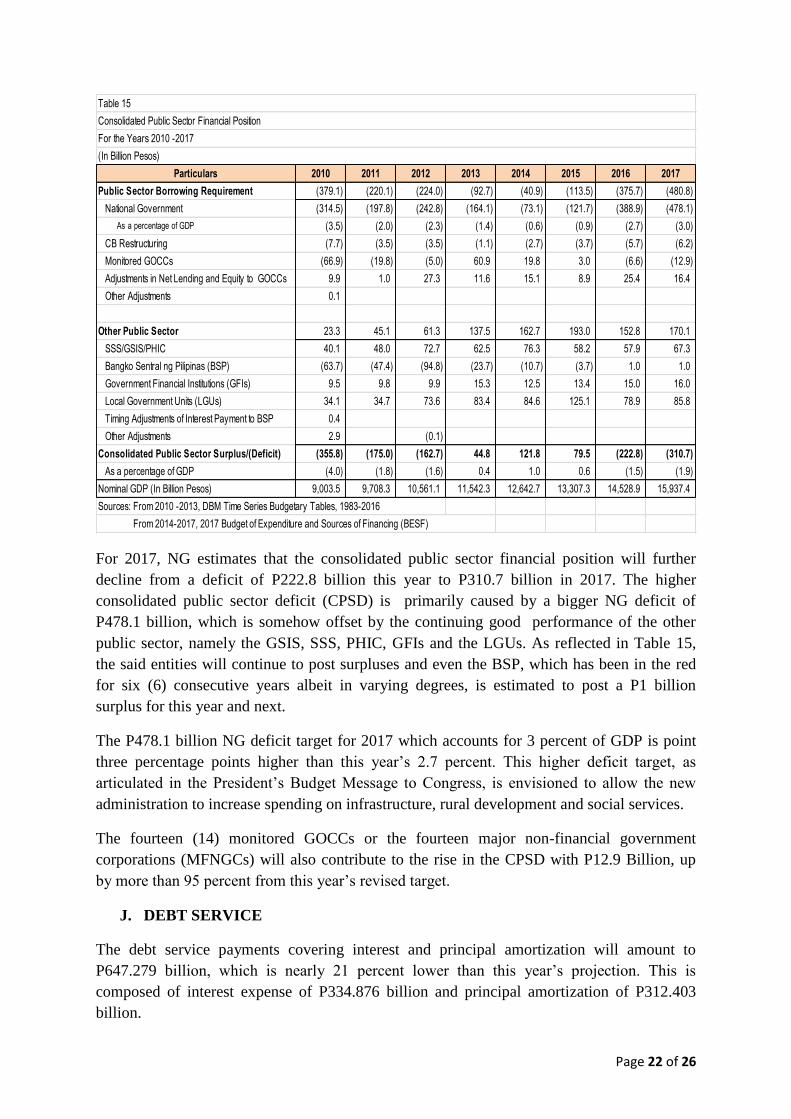
For 2017, NG estimates that the consolidated public sector financial position will further
decline from a deficit of P222.8 billion this year to P310.7 billion in 2017. The higher
consolidated public sector deficit (CPSD) is primarily caused by a bigger NG deficit of
P478.1 billion, which is somehow offset by the continuing good performance of the other
public sector, namely the GSIS, SSS, PHIC, GFIs and the LGUs. As reflected in Table 15,
the said entities will continue to post surpluses and even the BSP, which has been in the red
for six (6) consecutive years albeit in varying degrees, is estimated to post a P1 billion
surplus for this year and next.
The P478.1 billion NG deficit target for 2017 which accounts for 3 percent of GDP is point
three percentage points higher than this year’s 2.7 percent. This higher deficit target, as
articulated in the President’s Budget Message to Congress, is envisioned to allow the new
administration to increase spending on infrastructure, rural development and social services.
The fourteen (14) monitored GOCCs or the fourteen major non-financial government
corporations (MFNGCs) will also contribute to the rise in the CPSD with P12.9 Billion, up
by more than 95 percent from this year’s revised target.
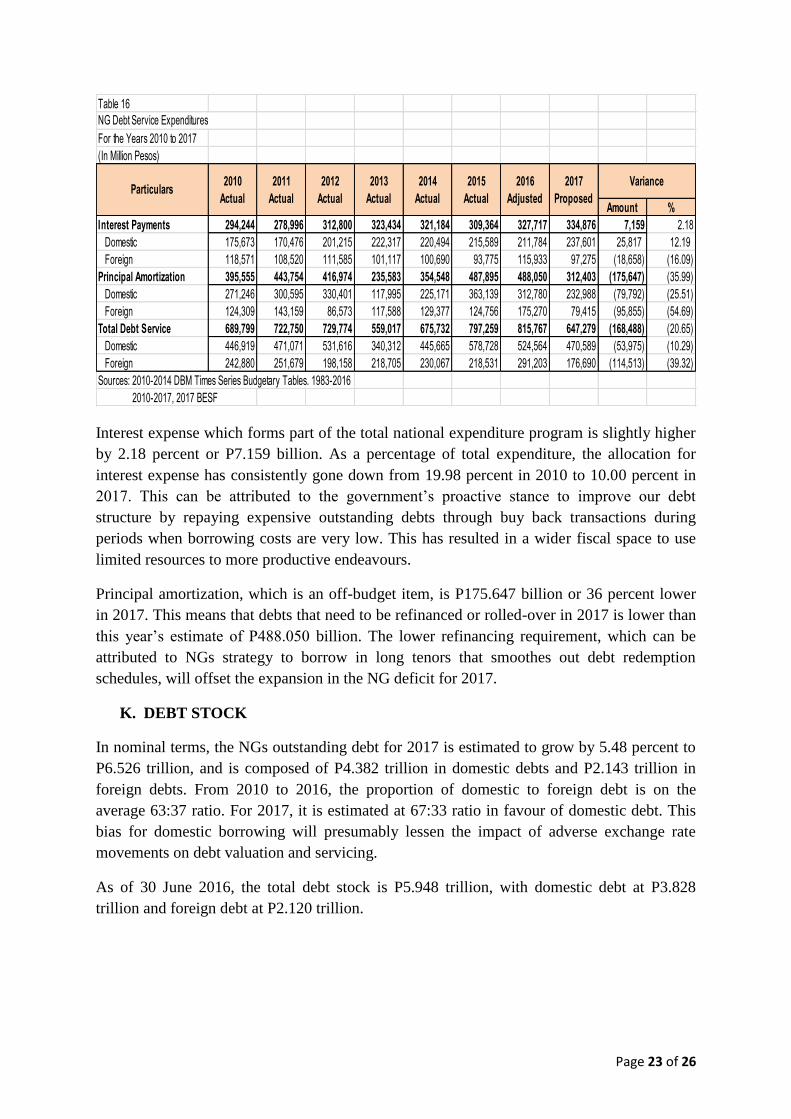
J. DEBT SERVICE
The debt service payments covering interest and principal amortization will amount to
P647.279 billion, which is nearly 21 percent lower than this year’s projection. This is
composed of interest expense of P334.876 billion and principal amortization of P312.403
billion.
Particulars 2010 2011 2012 2013 2014 2015 2016 2017
Public Sector Borrowing Requirement (379.1) (220.1) (224.0) (92.7) (40.9) (113.5) (375.7) (480.8)
National Government (314.5) (197.8) (242.8) (164.1) (73.1) (121.7) (388.9) (478.1)
As a percentage of GDP (3.5) (2.0) (2.3) (1.4) (0.6) (0.9) (2.7) (3.0)
CB Restructuring (7.7) (3.5) (3.5) (1.1) (2.7) (3.7) (5.7) (6.2)
Monitored GOCCs (66.9) (19.8) (5.0) 60.9 19.8 3.0 (6.6) (12.9)
Adjustments in Net Lending and Equity to GOCCs 9.9 1.0 27.3 11.6 15.1 8.9 25.4 16.4
Other Adjustments 0.1
Other Public Sector 23.3 45.1 61.3 137.5 162.7 193.0 152.8 170.1
SSS/GSIS/PHIC 40.1 48.0 72.7 62.5 76.3 58.2 57.9 67.3
Bangko Sentral ng Pilipinas (BSP) (63.7) (47.4) (94.8) (23.7) (10.7) (3.7) 1.0 1.0
Government Financial Institutions (GFIs) 9.5 9.8 9.9 15.3 12.5 13.4 15.0 16.0
Local Government Units (LGUs) 34.1 34.7 73.6 83.4 84.6 125.1 78.9 85.8
Timing Adjustments of Interest Payment to BSP 0.4
Other Adjustments 2.9 (0.1)
Consolidated Public Sector Surplus/(Deficit) (355.8) (175.0) (162.7) 44.8 121.8 79.5 (222.8) (310.7)
As a percentage of GDP (4.0) (1.8) (1.6) 0.4 1.0 0.6 (1.5) (1.9)
Nominal GDP (In Billion Pesos) 9,003.5 9,708.3 10,561.1 11,542.3 12,642.7 13,307.3 14,528.9 15,937.4
From 2014-2017, 2017 Budget of Expenditure and Sources of Financing (BESF)
Table 15
Consolidated Public Sector Financial Position
For the Years 2010 -2017
(In Billion Pesos)
Sources: From 2010 -2013, DBM Time Series Budgetary Tables, 1983-2016
Page 23 of 26
Interest expense which forms part of the total national expenditure program is slightly higher
by 2.18 percent or P7.159 billion. As a percentage of total expenditure, the allocation for
interest expense has consistently gone down from 19.98 percent in 2010 to 10.00 percent in
2017. This can be attributed to the government’s proactive stance to improve our debt
structure by repaying expensive outstanding debts through buy back transactions during
periods when borrowing costs are very low. This has resulted in a wider fiscal space to use
limited resources to more productive endeavours.
Principal amortization, which is an off-budget item, is P175.647 billion or 36 percent lower
in 2017. This means that debts that need to be refinanced or rolled-over in 2017 is lower than
this year’s estimate of P488.050 billion. The lower refinancing requirement, which can be
attributed to NGs strategy to borrow in long tenors that smoothes out debt redemption
schedules, will offset the expansion in the NG deficit for 2017.
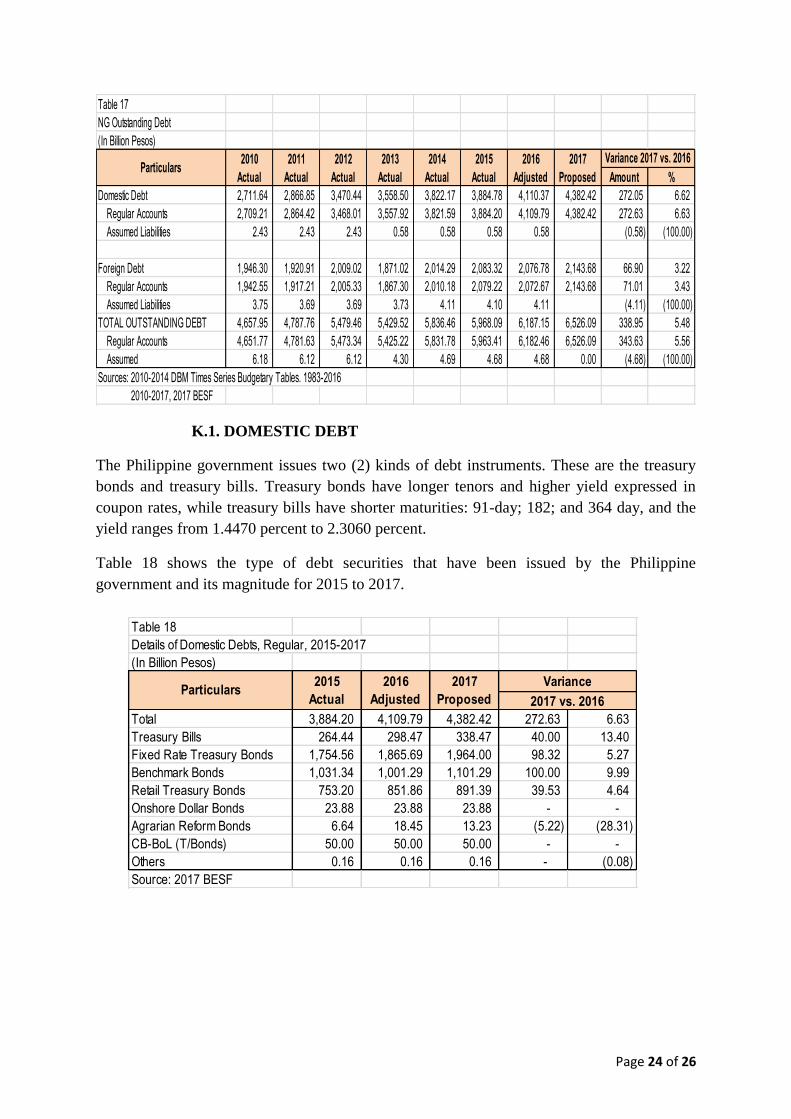
K. DEBT STOCK
In nominal terms, the NGs outstanding debt for 2017 is estimated to grow by 5.48 percent to
P6.526 trillion, and is composed of P4.382 trillion in domestic debts and P2.143 trillion in
foreign debts. From 2010 to 2016, the proportion of domestic to foreign debt is on the
average 63:37 ratio. For 2017, it is estimated at 67:33 ratio in favour of domestic debt. This
bias for domestic borrowing will presumably lessen the impact of adverse exchange rate
movements on debt valuation and servicing.
As of 30 June 2016, the total debt stock is P5.948 trillion, with domestic debt at P3.828
trillion and foreign debt at P2.120 trillion.
Table 16
For the Years 2010 to 2017
(In Million Pesos)
Amount %
Interest Payments 294,244 278,996 312,800 323,434 321,184 309,364 327,717 334,876 7,159 2.18
Domestic 175,673 170,476 201,215 222,317 220,494 215,589 211,784 237,601 25,817 12.19
Foreign 118,571 108,520 111,585 101,117 100,690 93,775 115,933 97,275 (18,658) (16.09)
Principal Amortization 395,555 443,754 416,974 235,583 354,548 487,895 488,050 312,403 (175,647) (35.99)
Domestic 271,246 300,595 330,401 117,995 225,171 363,139 312,780 232,988 (79,792) (25.51)
Foreign 124,309 143,159 86,573 117,588 129,377 124,756 175,270 79,415 (95,855) (54.69)
Total Debt Service 689,799 722,750 729,774 559,017 675,732 797,259 815,767 647,279 (168,488) (20.65)
Domestic 446,919 471,071 531,616 340,312 445,665 578,728 524,564 470,589 (53,975) (10.29)
Foreign 242,880 251,679 198,158 218,705 230,067 218,531 291,203 176,690 (114,513) (39.32)
Sources: 2010-2014 DBM Times Series Budgetary Tables. 1983-2016
2010-2017, 2017 BESF
2017
Proposed
NG Debt Service Expenditures
ParticularsVariance2010
Actual
2011
Actual
2012
Actual
2013
Actual
2014
Actual
2015
Actual
2016
Adjusted
Page 24 of 26
K.1. DOMESTIC DEBT
The Philippine government issues two (2) kinds of debt instruments. These are the treasury
bonds and treasury bills. Treasury bonds have longer tenors and higher yield expressed in
coupon rates, while treasury bills have shorter maturities: 91-day; 182; and 364 day, and the
yield ranges from 1.4470 percent to 2.3060 percent.
Table 18 shows the type of debt securities that have been issued by the Philippine
government and its magnitude for 2015 to 2017.
Table 17
NG Outstanding Debt
(In Billion Pesos)
Amount %
Domestic Debt 2,711.64 2,866.85 3,470.44 3,558.50 3,822.17 3,884.78 4,110.37 4,382.42 272.05 6.62
Regular Accounts 2,709.21 2,864.42 3,468.01 3,557.92 3,821.59 3,884.20 4,109.79 4,382.42 272.63 6.63
Assumed Liabilities 2.43 2.43 2.43 0.58 0.58 0.58 0.58 (0.58) (100.00)
Foreign Debt 1,946.30 1,920.91 2,009.02 1,871.02 2,014.29 2,083.32 2,076.78 2,143.68 66.90 3.22
Regular Accounts 1,942.55 1,917.21 2,005.33 1,867.30 2,010.18 2,079.22 2,072.67 2,143.68 71.01 3.43
Assumed Liabilities 3.75 3.69 3.69 3.73 4.11 4.10 4.11 (4.11) (100.00)
TOTAL OUTSTANDING DEBT 4,657.95 4,787.76 5,479.46 5,429.52 5,836.46 5,968.09 6,187.15 6,526.09 338.95 5.48
Regular Accounts 4,651.77 4,781.63 5,473.34 5,425.22 5,831.78 5,963.41 6,182.46 6,526.09 343.63 5.56
Assumed 6.18 6.12 6.12 4.30 4.69 4.68 4.68 0.00 (4.68) (100.00)
Sources: 2010-2014 DBM Times Series Budgetary Tables. 1983-2016
2010-2017, 2017 BESF
ParticularsVariance 2017 vs. 20162010
Actual
2011
Actual
2012
Actual
2013
Actual
2014
Actual
2015
Actual
2016
Adjusted
2017
Proposed
Table 18
Details of Domestic Debts, Regular, 2015-2017
(In Billion Pesos)
Total 3,884.20 4,109.79 4,382.42 272.63 6.63
Treasury Bills 264.44 298.47 338.47 40.00 13.40
Fixed Rate Treasury Bonds 1,754.56 1,865.69 1,964.00 98.32 5.27
Benchmark Bonds 1,031.34 1,001.29 1,101.29 100.00 9.99
Retail Treasury Bonds 753.20 851.86 891.39 39.53 4.64
Onshore Dollar Bonds 23.88 23.88 23.88 - -
Agrarian Reform Bonds 6.64 18.45 13.23 (5.22) (28.31)
CB-BoL (T/Bonds) 50.00 50.00 50.00 - -
Others 0.16 0.16 0.16 - (0.08)
Source: 2017 BESF
2017
ProposedParticulars
Variance
2017 vs. 2016
2015
Actual
2016
Adjusted

Page 25 of 26
K.2. EXTERNAL OR FOREIGN DEBT
By 2017, the country’s external debt will amount to P2.144 trillion or 32.85 percent of the
total outstanding debts. In US dollar, it is equivalent to US$44.660 Billion.
The biggest component of our foreign debt is the debt securities issued by the national
government for budgetary support amounting to US27.564 Billion Dollars. This accounts for
more than 61 percent of the total foreign debt.
The Asian Development Bank (ADB) continues to be our biggest foreign creditor with
US6.209 Billion Dollars; followed by the International Bank for Reconstruction and
Development (IBRD) and the Japan International Cooperation Agency (JICA) with US 5.060
Billion Dollars and US 4.054 Billion Dollars, respectively.
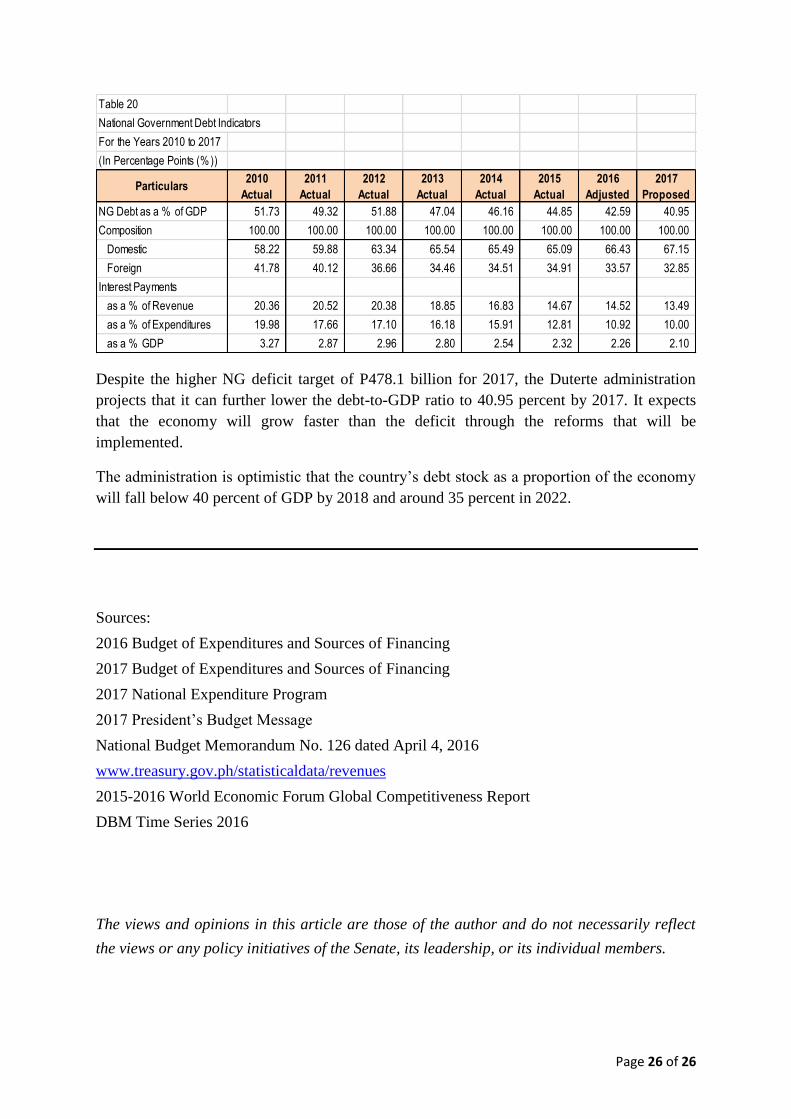
The debt-to-GDP ratio has been on a downward trajectory since 2001. By the end of this
year, it is estimated to be at 42.59 percent.
Table 19
Outstanding Foreign Debt, Regular Liabilities
(In Thousand US Dollars)
Particulars 2014 Actual 2015 Actual 2016 Adjusted 2017 Proposed
Total 41,878,812 43,316,973 43,180,657 44,659,948
Asian Development Bank (ADB) 4,701,962 5,264,451 5,559,065 6,209,430
Int'l. Bank for Reconstruction and Dev. (IBRD) 3,644,269 4,354,727 4,571,557 5,060,319
Int'l Development Association (IDA) 113,059 103,853 92,859 80,134
Int'l Fund for Agricultural Development (IFAD) 68,208 72,460 85,438 96,514
OPEC Fund for International Development 16,515 21,550 19,628 18,100
Japan Eximbank 241,992 204,041 160,982 116,565
Japan International Cooperation Agency (JICA) 4,133,253 4,186,272 4,132,314 4,054,451
KFW 42,115 39,064 35,634 32,204
Public Law 480 184,692 165,842 149,880 134,357
US Agency for International Dev't. (USAID) 30,195 23,764 18,372 13,890
French Protocol 42,363 36,285 31,122 26,462
Other Foreign Creditors 1,322,233 1,216,930 1,237,574 1,253,879
Paris Club Account 20
Debt Securities for Budgetary Support 27,337,936 27,627,734 27,086,232 27,563,643
Source: 2017 BESF
Page 26 of 26
Despite the higher NG deficit target of P478.1 billion for 2017, the Duterte administration
projects that it can further lower the debt-to-GDP ratio to 40.95 percent by 2017. It expects
that the economy will grow faster than the deficit through the reforms that will be
implemented.
The administration is optimistic that the country’s debt stock as a proportion of the economy
will fall below 40 percent of GDP by 2018 and around 35 percent in 2022.
Sources:
2016 Budget of Expenditures and Sources of Financing
2017 Budget of Expenditures and Sources of Financing
2017 National Expenditure Program
2017 President’s Budget Message
National Budget Memorandum No. 126 dated April 4, 2016
www.treasury.gov.ph/statisticaldata/revenues
2015-2016 World Economic Forum Global Competitiveness Report
DBM Time Series 2016
The views and opinions in this article are those of the author and do not necessarily reflect
the views or any policy initiatives of the Senate, its leadership, or its individual members.
Table 20
For the Years 2010 to 2017
(In Percentage Points (% ))
Particulars2010
Actual
2011
Actual
2012
Actual
2013
Actual
2014
Actual
2015
Actual
2016
Adjusted
2017
Proposed
NG Debt as a % of GDP 51.73 49.32 51.88 47.04 46.16 44.85 42.59 40.95
Composition 100.00 100.00 100.00 100.00 100.00 100.00 100.00 100.00
Domestic 58.22 59.88 63.34 65.54 65.49 65.09 66.43 67.15
Foreign 41.78 40.12 36.66 34.46 34.51 34.91 33.57 32.85
Interest Payments
as a % of Revenue 20.36 20.52 20.38 18.85 16.83 14.67 14.52 13.49
as a % of Expenditures 19.98 17.66 17.10 16.18 15.91 12.81 10.92 10.00
as a % GDP 3.27 2.87 2.96 2.80 2.54 2.32 2.26 2.10
National Government Debt Indicators