the prospective pravastatin pooling project l i p i d carecare ppp project investigators am j...
TRANSCRIPT
The Prospective Pravastatin Pooling Project
L I PL I P I DI DL I PL I P I DI D
CARECARECARECARE
PPP Project Investigators Am J Cardiol 1995; 76:899–905
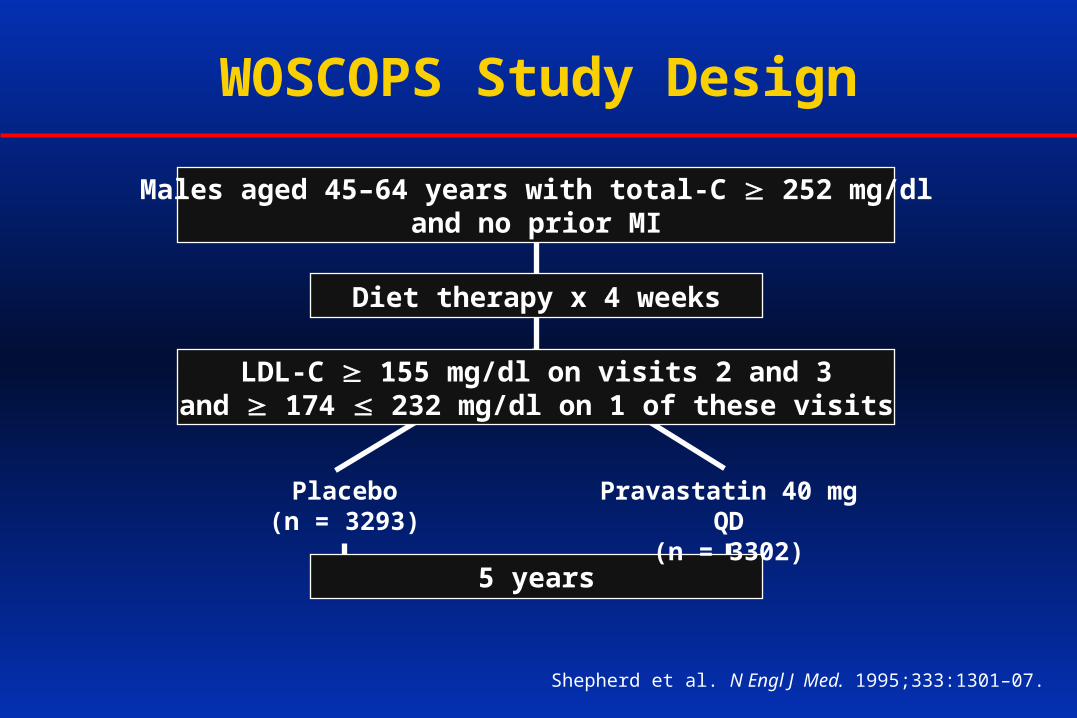
WOSCOPS Study Design
Males aged 45–64 years with total-C 252 mg/dland no prior MI
Diet therapy x 4 weeks
LDL-C 155 mg/dl on visits 2 and 3and 174 232 mg/dl on 1 of these visits
5 years
Placebo(n = 3293)
Pravastatin 40 mg QD(n = 3302)
Shepherd et al. N Engl J Med. 1995;333:1301–07.

WOSCOPS: Baseline Characteristics
Age at visit 1 (years) 55 55
History of MI (%) 0 0
Mean LDL-C at baseline (mg/dl) 192 192
History of hypertension (%) 15 16
Current cigarette smoker (%) 35 35
Shepherd et al. N Engl J Med. 1995;333:1301–07.
PlaceboPlacebo Pravastatin Pravastatin(n = 3293)(n = 3293) (n = 3302) (n = 3302)
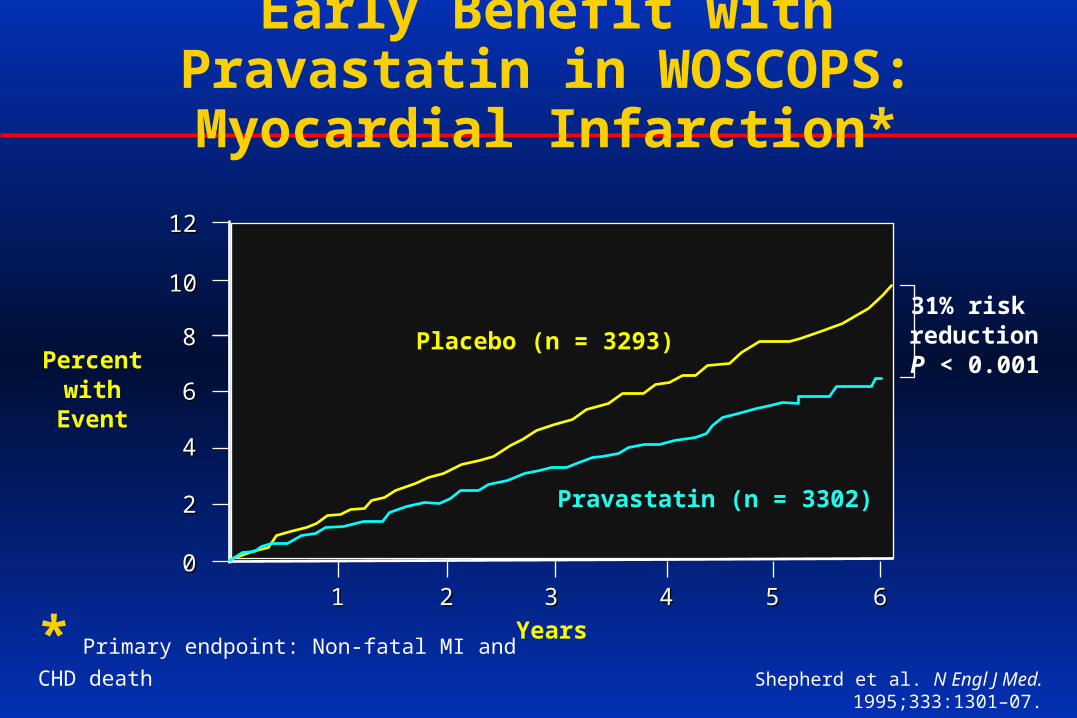
Early Benefit with Pravastatin in WOSCOPS: Myocardial Infarction*
Shepherd et al. N Engl J Med. 1995;333:1301–07.
00
11
22
44
66Percent
withEvent
88
1010
1212
22 3 3
Years44 55 66
Pravastatin (n = 3302)
Placebo (n = 3293)
31% risk reduction P < 0.001
* Primary endpoint: Non-fatal MI and CHD death
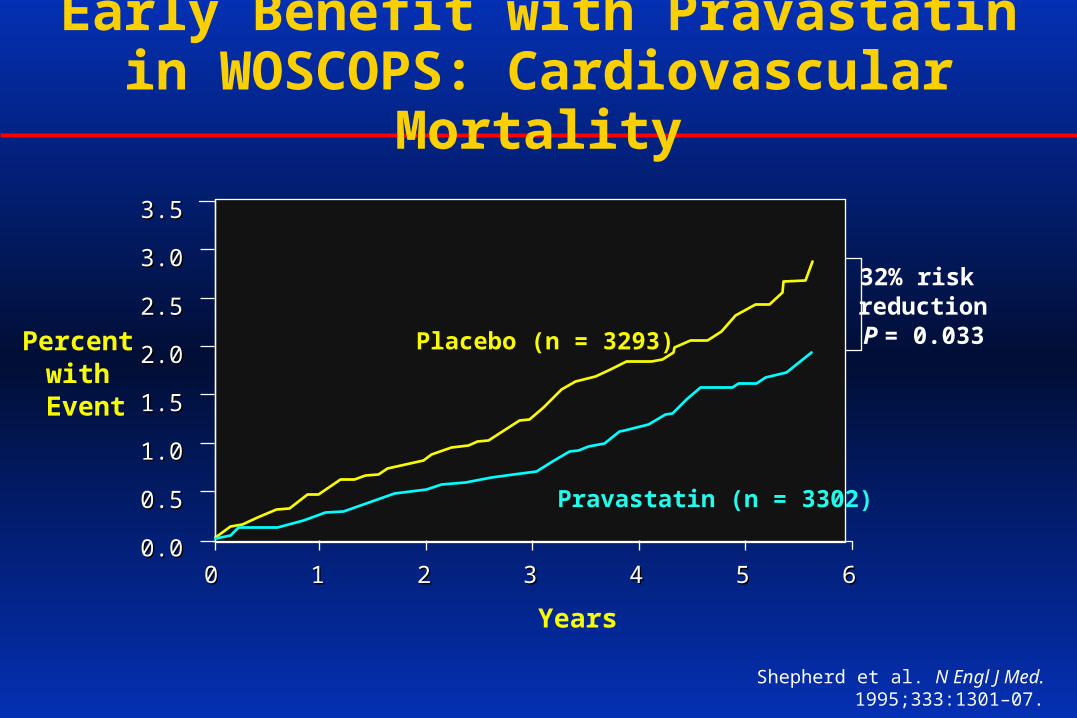
Early Benefit with Pravastatin in WOSCOPS: Cardiovascular Mortality
Shepherd et al. N Engl J Med. 1995;333:1301–07.
0.00.000 11 22 33
Years
44 55 66
0.50.5
1.01.0
1.51.5
2.02.0Percent with Event
2.52.5
3.03.0
3.53.5
32% risk reduction P = 0.033
Pravastatin (n = 3302)
Placebo (n = 3293)

Benefit with Pravastatin in WOSCOPS: Total Mortality
Shepherd et al. N Engl J Med. 1995;333:1301-7.
00
11
11
22
33
Percentwith
Event
44
55
66
22 3 3
Years44 55 66
22% riskreductionP = 0.051
Pravastatin (n = 3302)
Placebo (n = 3293)
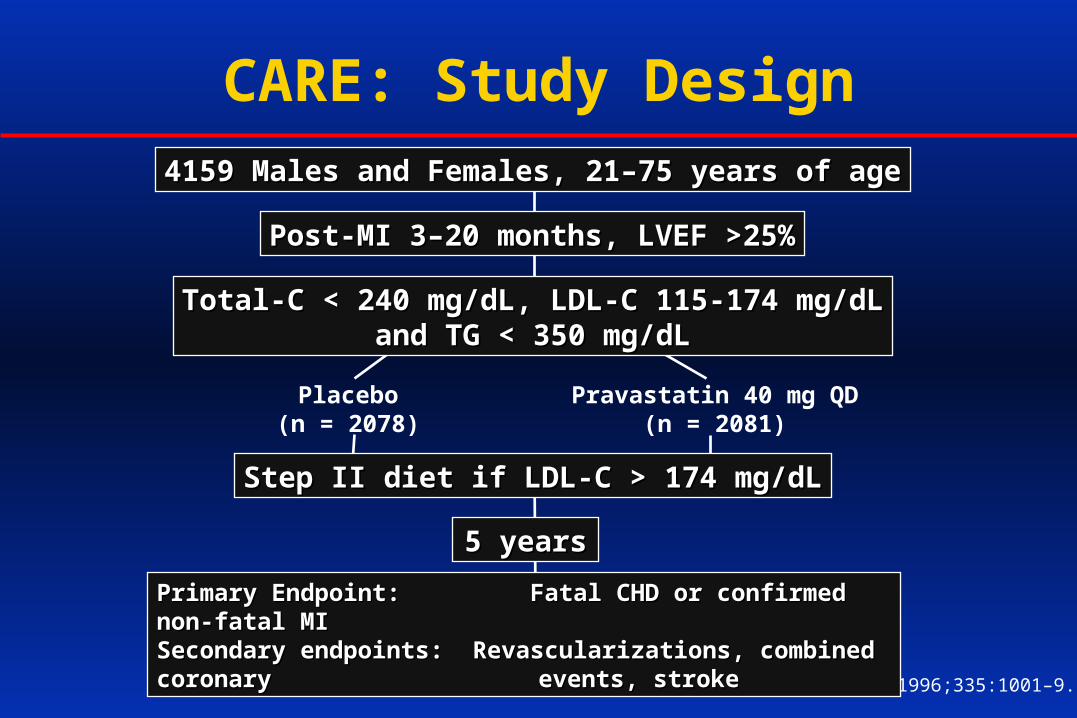
CARE: Study Design
Sacks et al. N Engl J Med. 1996;335:1001–9.
4159 Males and Females, 21–75 years of age4159 Males and Females, 21–75 years of age
Post-MI 3–20 months, LVEF >25%Post-MI 3–20 months, LVEF >25%
Total-C < 240 mg/dL, LDL-C 115-174 mg/dLTotal-C < 240 mg/dL, LDL-C 115-174 mg/dLand TG < 350 mg/dLand TG < 350 mg/dL
Step II diet if LDL-C > 174 mg/dLStep II diet if LDL-C > 174 mg/dL
5 years5 years
Placebo(n = 2078)
Pravastatin 40 mg QD(n = 2081)
Primary Endpoint: Fatal CHD or confirmed non-fatal MIPrimary Endpoint: Fatal CHD or confirmed non-fatal MISecondary endpoints: Revascularizations, combined coronary Secondary endpoints: Revascularizations, combined coronary
events, stroke events, stroke

CARE: Baseline Characteristics
Sacks et al. N Engl J Med. 1996;335:1001–09.
PlaceboPlacebo PravastatinPravastatinCharacteristicCharacteristic n = 2078n = 2078 n = 2081n = 2081
Other MedicationsOther Medications
Age (years)Age (years)
Women/Men (%)Women/Men (%)
History of HTN (%)History of HTN (%)
Diabetes (%)Diabetes (%)
Total Chol. mg/dL (mean)Total Chol. mg/dL (mean)
LDL mg/dL (mean)LDL mg/dL (mean)
Aspirin (%)Aspirin (%)
4343
1515
14/8614/86
5959
209209
139139
8383 8383
139139
209209
1414
4242
14/8614/86
5959
Antihypertensives (%)Antihypertensives (%) 8282 8282
Current Cig. Smoker (%) 21 21

CARE: Cardiovascular Events: Reduction of Relative Risk
Sacks et al. N Engl J Med. 1996;335:1001–09.
% Risk% RiskReductionReduction
CHDDeath
orNon-fatal
MI*
CHDDeath
Fatal MI
Non-fatalMI*
CABG*
PTCA*
UnstableAngina
Stroke*
-10
-20
-30
-40
0
* p < 0.05* p < 0.05
-24%
-20%
-37%
-23%-26%
-23%
-13%
-31%
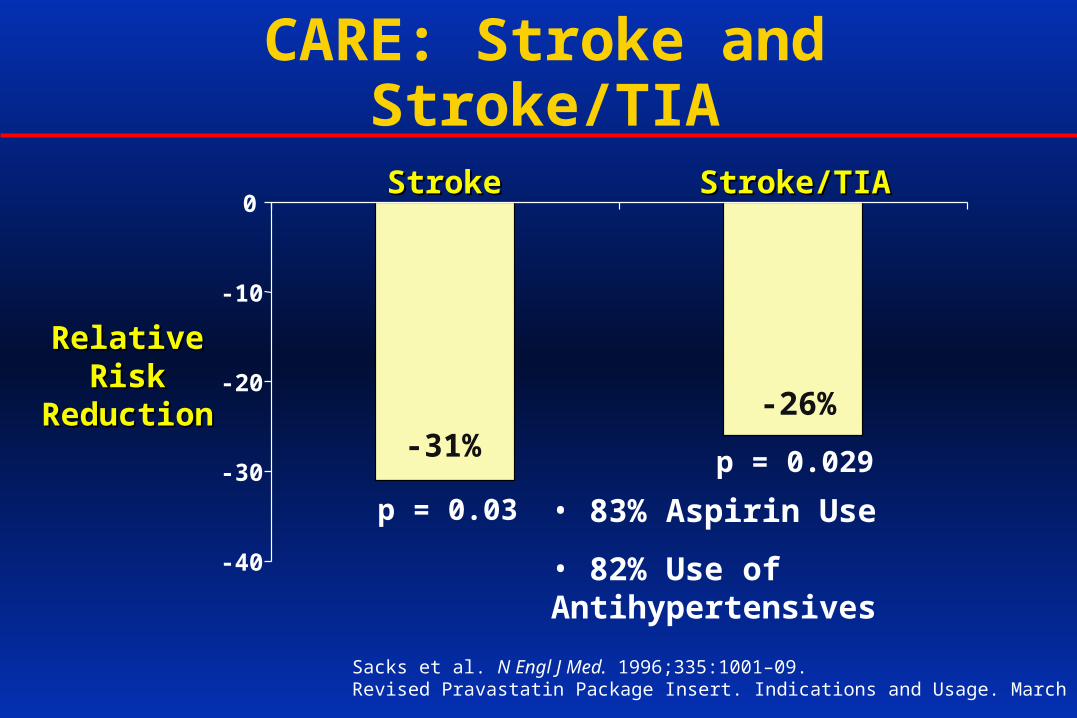
CARE: Stroke and Stroke/TIA
-40
-30
-20
-10
0StrokeStroke Stroke/TIAStroke/TIA
RelativeRelative Risk Risk
ReductionReduction
p = 0.029
p = 0.03
-31%-26%
Sacks et al. N Engl J Med. 1996;335:1001–09.Revised Pravastatin Package Insert. Indications and Usage. March 1998.
• 83% Aspirin Use
• 82% Use of Antihypertensives

Long-term Intervention with Pravastatin Ischemic Disease (LIPID) Trial Design
Males & females aged 31–75 years with average cholesteroland a prior history of acute MI or unstable angina
Diet therapy x 8 weeks
Total cholesterol between 155–271 mg/dl,Triglycerides
< 445 mg/dl, stratified by Diagnosis
6.0 years
Placebo(n = 4502)
Pravastatin 40 mg QD(n = 4512)
The LIPID Study Group. Am J Cardiol. 1995;76:474–79.
Primary Primary endpoint: Coronary mortality : Coronary mortality
Secondary endpoints: Total mortality, nonfatal MI & CHD death, stroke etc.Secondary endpoints: Total mortality, nonfatal MI & CHD death, stroke etc.
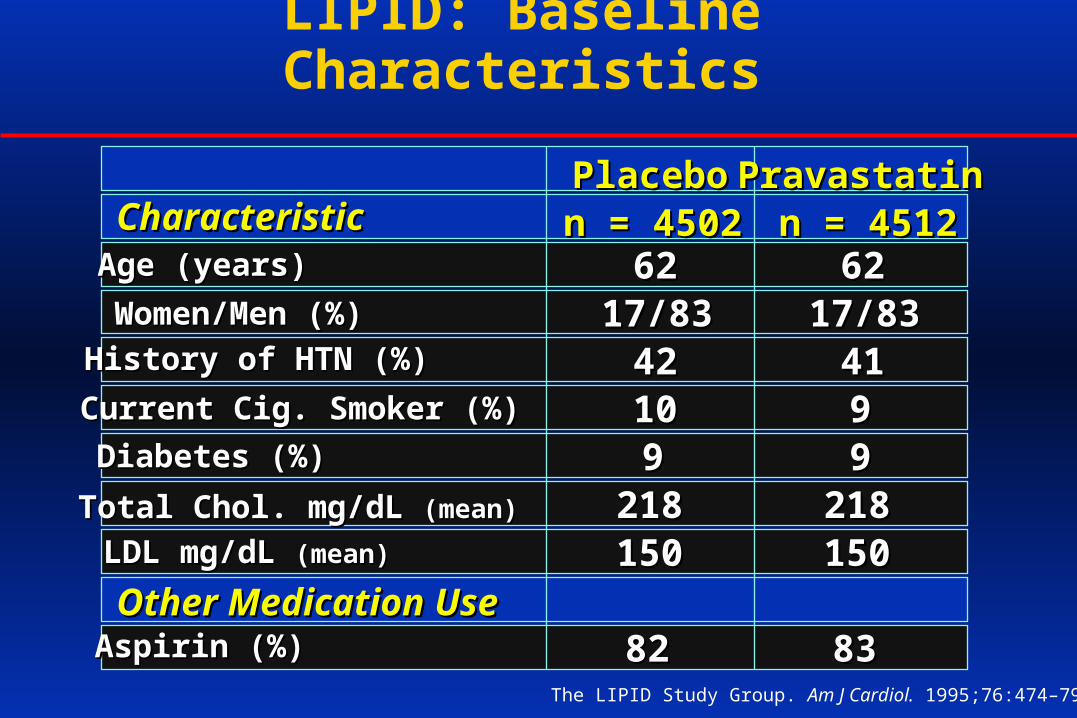
LIPID: Baseline Characteristics
The LIPID Study Group. Am J Cardiol. 1995;76:474–79.
PlaceboPlacebo PravastatinPravastatinCharacteristicCharacteristic n = 4502n = 4502 n = 4512n = 4512
Other Medication UseOther Medication Use
Age (years)Age (years)
Women/Men (%)Women/Men (%)
History of HTN (%)History of HTN (%)
Current Cig. Smoker (%)Current Cig. Smoker (%)
Diabetes (%)Diabetes (%)
Total Chol. mg/dL Total Chol. mg/dL (mean)(mean)
LDL mg/dL LDL mg/dL (mean)(mean)
Aspirin (%)Aspirin (%)
4242
991010
17/8317/836262
218218150150
8282 8383
150150218218
99994141
17/8317/836262

Years Since Randomization0 1 2 3 4 5 6 7
0%
5%
10%
Cu
mu
lati
ve R
isk
p = 0.0004 Placebo
Pravastatin
24% reduction
CHD MortalityCHD Mortality
LIPID: Total & CHD LIPID: Total & CHD Mortality
Total MortalityTotal Mortality
Years Since Randomization0 1 2 3 4 5 6 7
0%
5%
15%
Cu
mu
lati
ve R
isk
p = 0.00002
Placebo
Pravastatin
23% reduction
10%
The LIPID Study Group. N Engl J Med. 1998;339:1349–57.
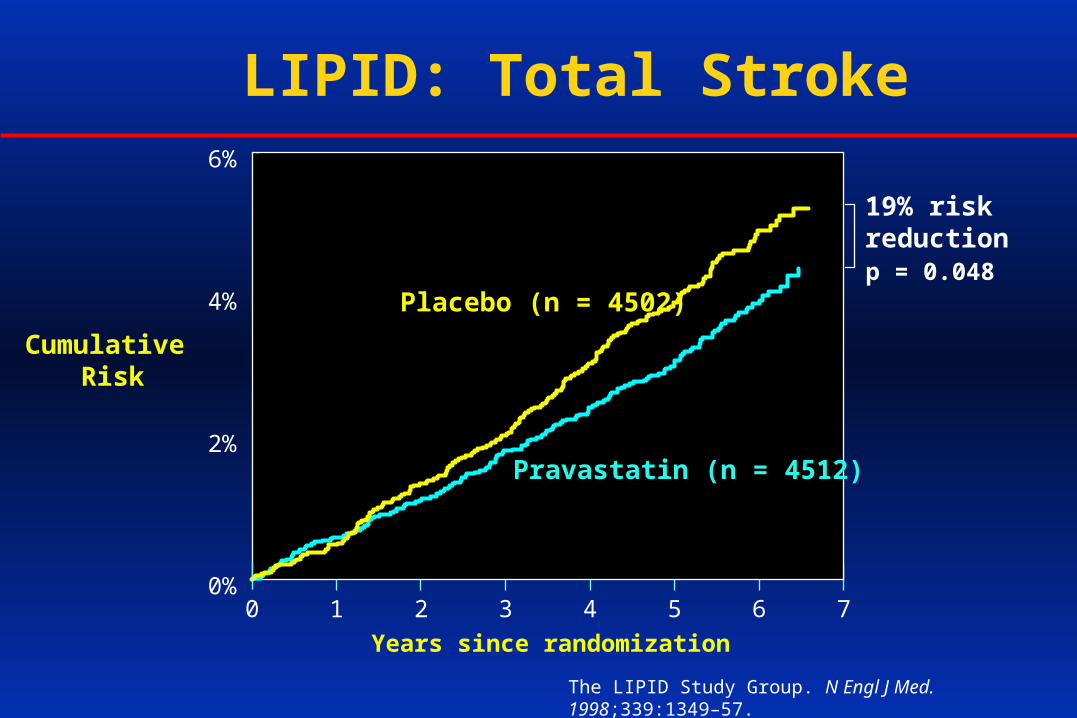
LIPID: Total Stroke
0 1 2 3 4 5 6 7
Years since randomization
0%
2%
4%
6%
Cumulative Risk
Placebo (n = 4502)
Pravastatin (n = 4512)
19% riskreductionp = 0.048
The LIPID Study Group. N Engl J Med. 1998;339:1349–57.

Benefit of Pravastatin in Reducing Stroke
-40
-30
-20
-10
0 CARECARE LIPIDLIPID
RelativeRelative Risk Risk
ReductionReduction p = 0.048
p = 0.03
In both trials, stroke was a pre-specified endpoint and 83% of all pravastatin patients received aspirin.
-31%
-19%
Sacks et al. N Engl J Med. 1996;335:1001–09.
Tonkin et al. ACC, March 1998.

CARECARE(U.S./Canada)(U.S./Canada)
4159 M&F4159 M&FAge: 21–75Age: 21–75
100% MI100% MI
WOSCOPSWOSCOPS(Scotland)(Scotland)6595 Males6595 MalesAge: 45–64Age: 45–645% Angina5% Angina
0% MI0% MI
LIPIDLIPID(Australia /N. Zealand)(Australia /N. Zealand)
9014 M&F9014 M&FAge: 31–75Age: 31–75
64% MI64% MI36% Unstable 36% Unstable
Angina PectorisAngina Pectoris
The PPP Investigators. Am J Cardiol. 1995;76:899–905.
Pravastatin Pooling Project (PPP)
Over 110,000 patient-years of follow-up
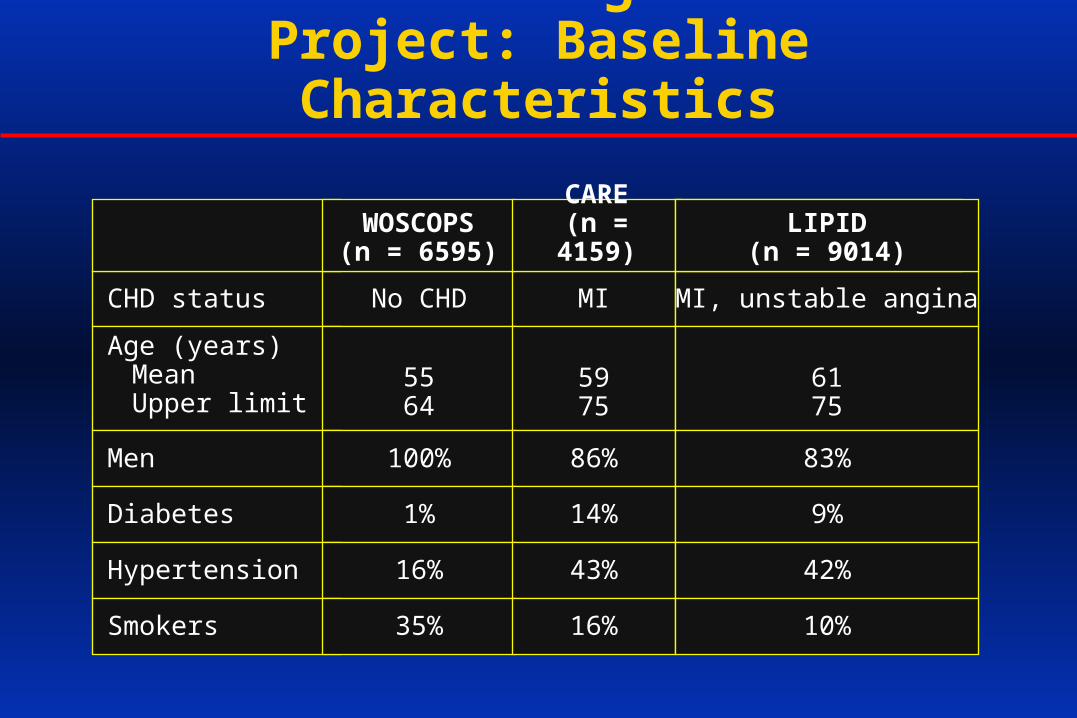
Prospective Pravastatin Pooling Project: Baseline Characteristics
CHD status No CHD MI
WOSCOPS(n = 6595)
CARE(n = 4159)
MI, unstable angina
LIPID(N=9014)
LIPID(n = 9014)
Age (years)MeanUpper limit
5564
5975
6175
Men 100% 86% 83%
Diabetes 1% 14% 9%
Hypertension 16% 43% 42%
Smokers 35% 16% 10%

Prospective Pravastatin PoolingProject: Baseline Lipids
Lipids(mg/dL)
WOSCOPS(n = 6595)
CARE(n = 4159)
LIPID(N=9014)
LIPID(n = 9014)
Total cholesterolLimitsMean
> 252272
< 240209
155–271219
LDL cholesterolLimitsMean
174–232192
115–174139
None150
HDL cholesterolMean 44 39 37
Triglycerides Limits
Mean< 533 162
< 350 156
< 445 159
0
10
20
30
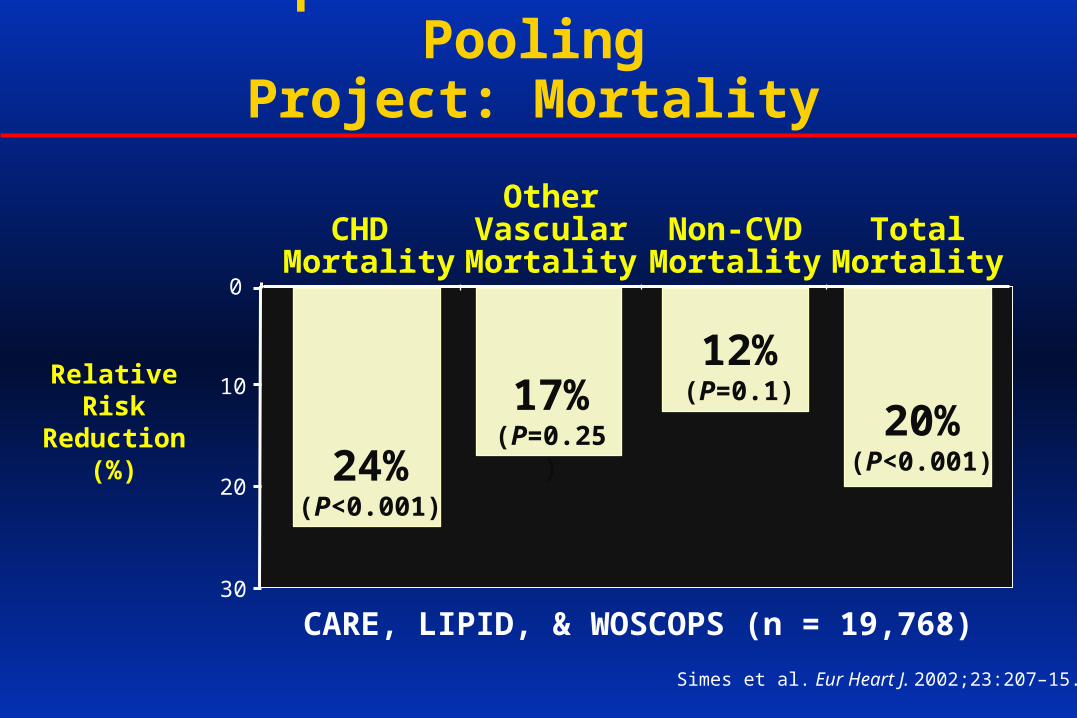
24%(P<0.001)
12%(P=0.1)17%
(P=0.25)
RelativeRisk
Reduction(%)
CHD Mortality
OtherVascularMortality
Non-CVDMortality
Prospective Pravastatin PoolingProject: Mortality
Simes et al. Eur Heart J. 2002;23:207–15.
20%(P<0.001)
TotalMortality
CARE, LIPID, & WOSCOPS (n = 19,768)
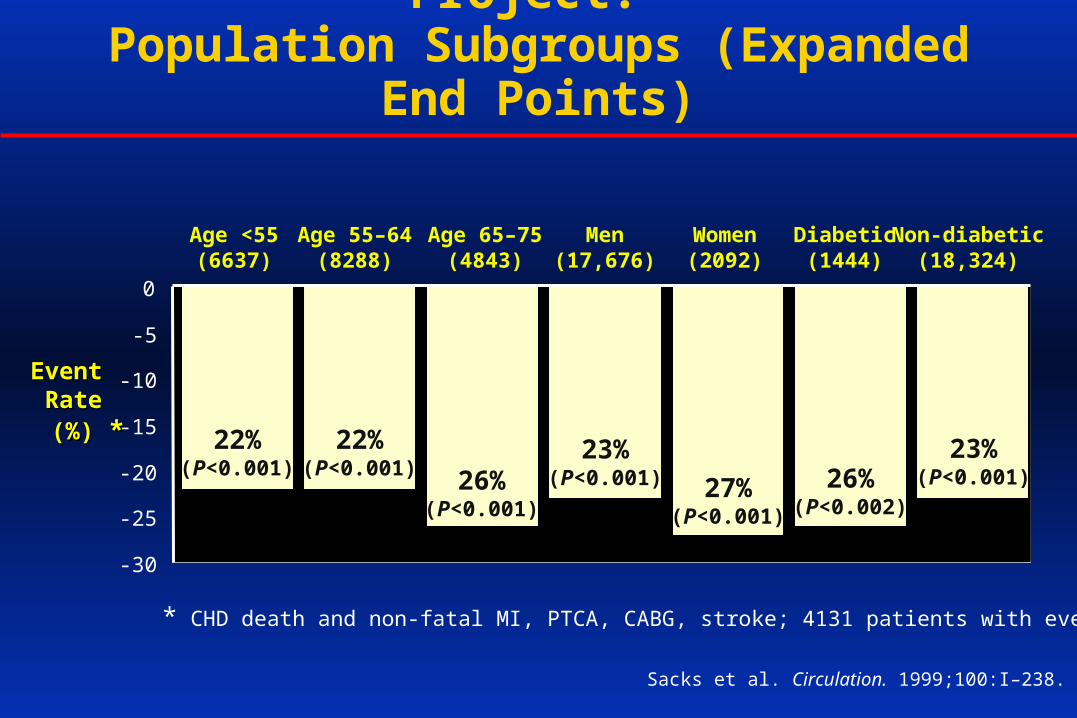
Prospective Pravastatin Pooling Project: Population Subgroups (Expanded End Points)
Age <55(6637)
Age 55–64(8288)
Age 65–75(4843)
Men(17,676)
Women(2092)
Diabetic(1444)
Non-diabetic(18,324)
-30
-25
-20
-15
-10
-5
0
22%(P<0.001)
22%(P<0.001) 26%
(P<0.001)
23%(P<0.001) 27%
(P<0.001)
26%(P<0.002)
23%(P<0.001)
Event Event RateRate
(%) (%) **
* CHD death and non-fatal MI, PTCA, CABG, stroke; 4131 patients with events
Sacks et al. Circulation. 1999;100:I–238.
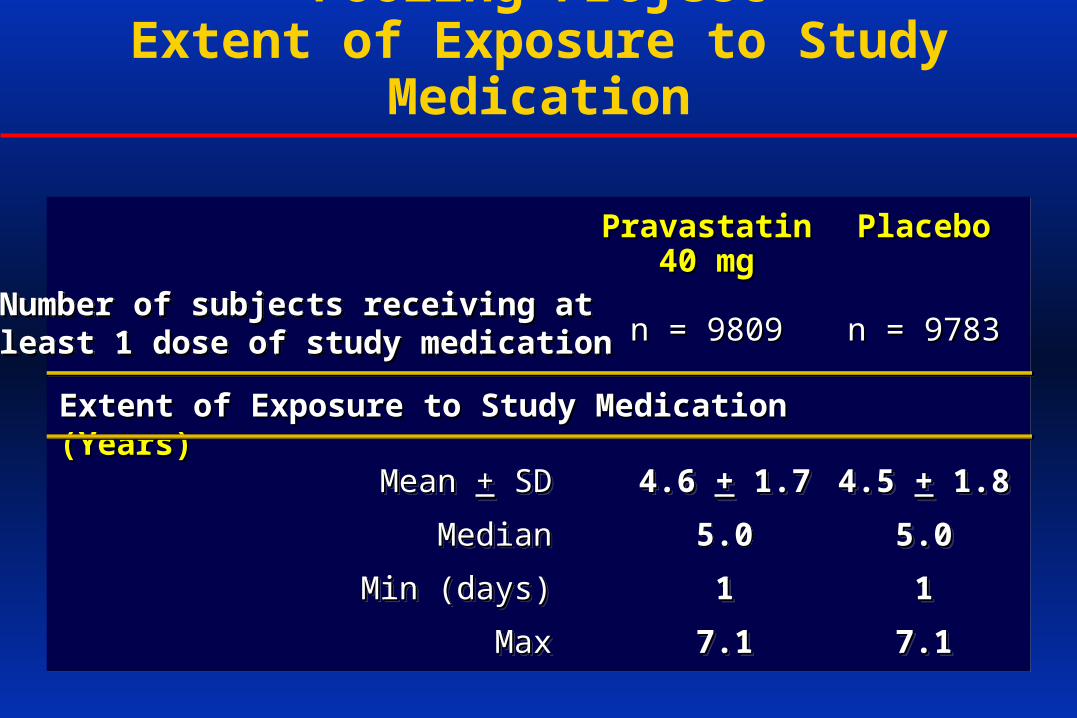
The Prospective Pravastatin Pooling ProjectExtent of Exposure to Study Medication
Number of subjects receiving atNumber of subjects receiving atleast 1 dose of study medicationleast 1 dose of study medicationNumber of subjects receiving atNumber of subjects receiving atleast 1 dose of study medicationleast 1 dose of study medication
PravastatinPravastatin40 mg40 mg
n = 9809n = 9809
PlaceboPlacebo
n = 9783n = 9783
Extent of Exposure to Study Medication Extent of Exposure to Study Medication (Years)(Years)
Mean Mean ++ SD SD
MedianMedian
Min (days)Min (days)
MaxMax
Mean Mean ++ SD SD
MedianMedian
Min (days)Min (days)
MaxMax
4.6 4.6 ++ 1.7 1.7
5.0
11
7.17.1
4.6 4.6 ++ 1.7 1.7
5.0
11
7.17.1
4.5 4.5 ++ 1.8 1.8
5.05.0
11
7.17.1
4.5 4.5 ++ 1.8 1.8
5.05.0
11
7.17.1

755
431 339579
2227
3488
1690
826
538 449710
2465
3322
1473
0
1000
2000
3000
4000
< 1 1 - < 2 2 - < 3 3 - < 4 4 - < 5 5 - < 6 > 6
Num
ber
of S
ubje
cts
Num
ber
of S
ubje
cts
Years of ExposureYears of Exposure
The Prospective Pravastatin Pooling Project Extent of Exposure to Study Medication
Pfeffer MA et al. Pfeffer MA et al. European Heart JEuropean Heart J 2001;22:271. 2001;22:271.
PravastatinPravastatin PlaceboPlacebo
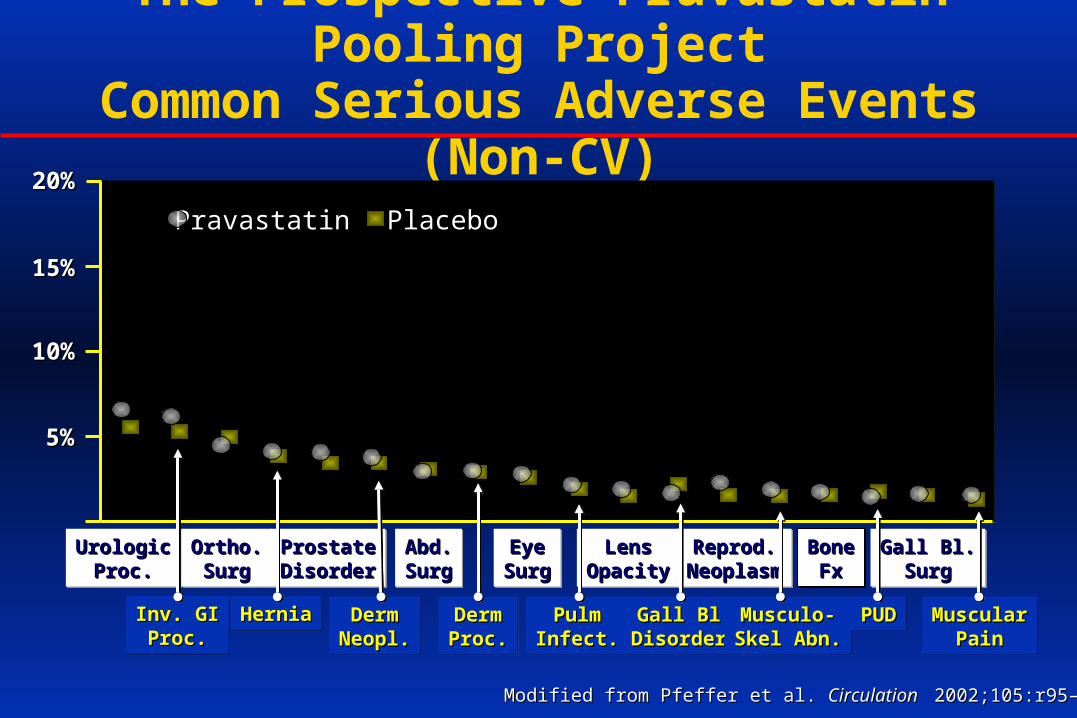
The Prospective Pravastatin Pooling ProjectCommon Serious Adverse Events (Non-CV)
Modified from Pfeffer et al. Modified from Pfeffer et al. Circulation Circulation 2002;105:r95–r100. 2002;105:r95–r100.
5%5%
10%10%
15%15%
20%20%
UrologicUrologicProc.Proc.
UrologicUrologicProc.Proc.
MuscularMuscularPainPain
MuscularMuscularPainPain
Inv. GIInv. GIProc.Proc.
Inv. GIInv. GIProc.Proc.
Ortho.Ortho.SurgSurg
Ortho.Ortho.SurgSurg
ProstateProstateDisorderDisorderProstateProstateDisorderDisorder
Abd.Abd.SurgSurgAbd.Abd.SurgSurg
HerniaHerniaHerniaHernia DermDermNeopl.Neopl.DermDermNeopl.Neopl.
DermDermProc.Proc.DermDermProc.Proc.
PulmPulmInfect.Infect.PulmPulmInfect.Infect.
Gall BlGall BlDisorderDisorderGall BlGall Bl
DisorderDisorder
EyeEyeSurgSurgEyeEyeSurgSurg
LensLensOpacityOpacity
LensLensOpacityOpacity
Musculo-Musculo-Skel Abn.Skel Abn.Musculo-Musculo-Skel Abn.Skel Abn.
PUDPUDPUDPUD
Reprod.Reprod.NeoplasmNeoplasmReprod.Reprod.
NeoplasmNeoplasmBoneBone
FxFxBoneBone
FxFxGall Bl.Gall Bl.
SurgSurgGall Bl.Gall Bl.
SurgSurg
PlaceboPlaceboPravastatinPravastatin
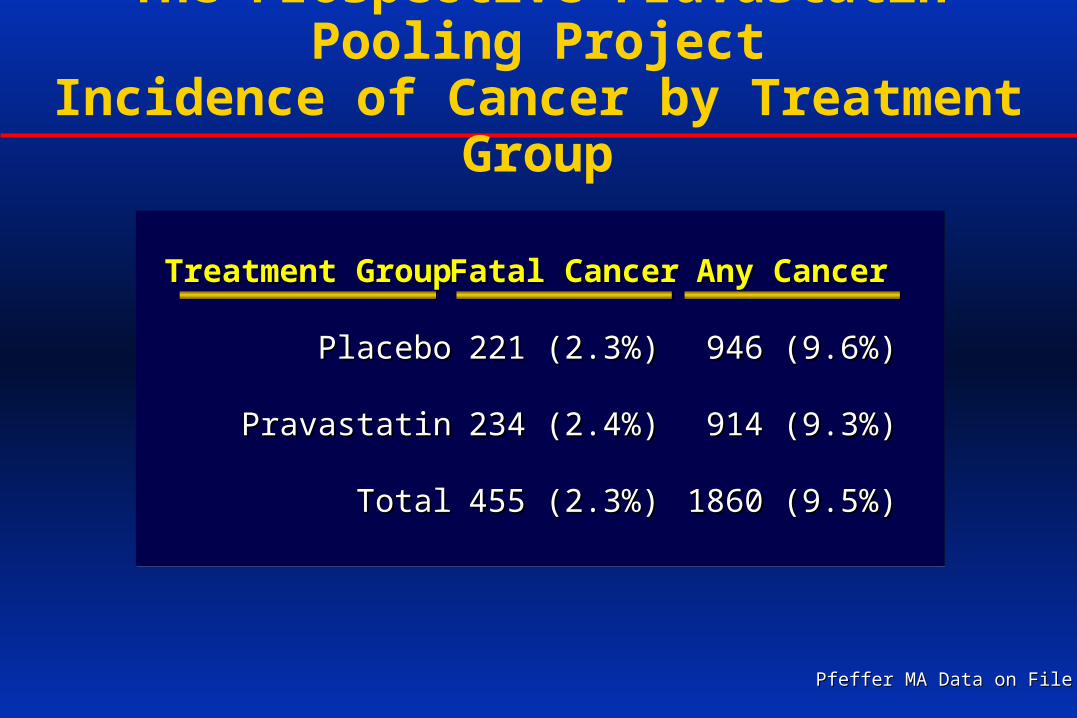
The Prospective Pravastatin Pooling ProjectIncidence of Cancer by Treatment Group
Pfeffer MA Data on FilePfeffer MA Data on File
Treatment GroupTreatment Group
PlaceboPlacebo
PravastatinPravastatin
TotalTotal
Fatal CancerFatal Cancer
221 (2.3%)221 (2.3%)
234 (2.4%)234 (2.4%)
455 (2.3%)455 (2.3%)
Any CancerAny Cancer
946 (9.6%)946 (9.6%)
914 (9.3%)914 (9.3%)
1860 (9.5%)1860 (9.5%)
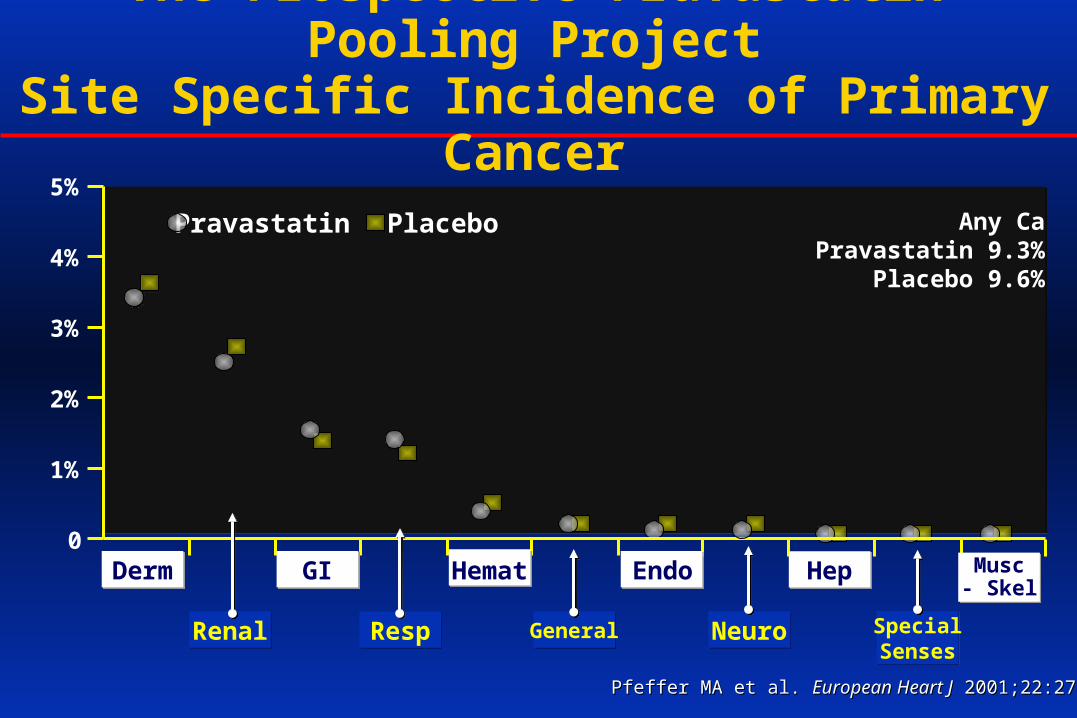
The Prospective Pravastatin Pooling ProjectSite Specific Incidence of Primary Cancer
Pfeffer MA et al. Pfeffer MA et al. European Heart JEuropean Heart J 2001;22:271. 2001;22:271.
PlaceboPravastatin
HematDerm GI Endo Hep Musc- Skel
Renal Resp General Neuro SpecialSenses
Any CaPravastatin 9.3%
Placebo 9.6%
0
5%
3%
4%
2%
1%
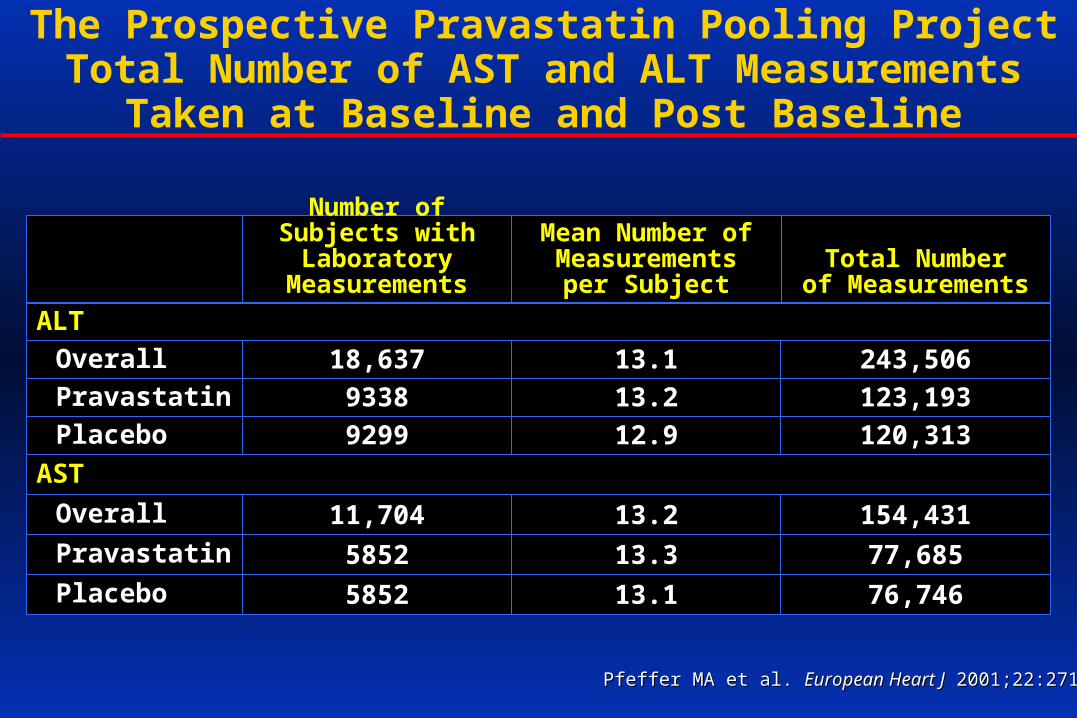
The Prospective Pravastatin Pooling ProjectTotal Number of AST and ALT Measurements Taken at
Baseline and Post Baseline
Total Numberof Measurements
Number of Subjects with Laboratory Measurements
Mean Number ofMeasurements
per Subject
AST
154,431Overall 11,704 13.2
77,685Pravastatin 5852 13.3
76,746Placebo 5852 13.1
ALT
243,506Overall 18,637 13.1
123,193Pravastatin 9338 13.2
120,313Placebo 9299 12.9
Pfeffer MA et al. Pfeffer MA et al. European Heart JEuropean Heart J 2001;22:271. 2001;22:271.

PravastatinPravastatin Placebo Placebo 95% 95% CICIAny Elevated ALT 804 / 9185 Any Elevated ALT 804 / 9185 (8.8%) (8.8%) 746 / 9152 746 / 9152 (8.2%)(8.2%) -0.21, 1.42 -0.21, 1.42
> 1.5 - > 1.5 - << 3 X ULN 3 X ULN 676 676 (7.4%)(7.4%) 615 615 (6.7%)(6.7%) -0.11, 1.39 -0.11, 1.39
> 3 - > 3 - < < 5 X ULN 5 X ULN 84 84 (0.9%)(0.9%) 90 90 (1.0%)(1.0%) -0.36, 1.39 -0.36, 1.39
> 5 - > 5 - < < 7 X ULN 7 X ULN 24 24 (0.3%)(0.3%) 19 19 (0.2%)(0.2%) -0.10, 0.21 -0.10, 0.21
> 7 - > 7 - < < 9 X ULN9 X ULN 6 6 (<0.1) (<0.1) 9 9 (<0.1%)(<0.1%) -0.13, 0.06 -0.13, 0.06
> 9 X ULN > 9 X ULN 14 14 (0.2%)(0.2%) 13 13 (0.1%)(0.1%) -0.11, 0.13 -0.11, 0.13
Any Elevated ALT 804 / 9185 Any Elevated ALT 804 / 9185 (8.8%) (8.8%) 746 / 9152 746 / 9152 (8.2%)(8.2%) -0.21, 1.42 -0.21, 1.42
> 1.5 - > 1.5 - << 3 X ULN 3 X ULN 676 676 (7.4%)(7.4%) 615 615 (6.7%)(6.7%) -0.11, 1.39 -0.11, 1.39
> 3 - > 3 - < < 5 X ULN 5 X ULN 84 84 (0.9%)(0.9%) 90 90 (1.0%)(1.0%) -0.36, 1.39 -0.36, 1.39
> 5 - > 5 - < < 7 X ULN 7 X ULN 24 24 (0.3%)(0.3%) 19 19 (0.2%)(0.2%) -0.10, 0.21 -0.10, 0.21
> 7 - > 7 - < < 9 X ULN9 X ULN 6 6 (<0.1) (<0.1) 9 9 (<0.1%)(<0.1%) -0.13, 0.06 -0.13, 0.06
> 9 X ULN > 9 X ULN 14 14 (0.2%)(0.2%) 13 13 (0.1%)(0.1%) -0.11, 0.13 -0.11, 0.13
The Prospective Pravastatin Pooling ProjectPost Baseline Elevations in ALT
Pfeffer MA et al. Pfeffer MA et al. European Heart JEuropean Heart J 2001;22:271. 2001;22:271.

The Prospective Pravastatin Pooling Project: Total Number of CPK MeasurementsTaken at Baseline and Post Baseline
Total Numberof Measurements
Number of Subjects with Laboratory Measurements
Mean Numberof Measurements
per Subject
CPK1
126,370Overall 10,576 11.9
63,452Pravastatin 5295 12.0
62,918Placebo 5281 11.9
LIPID does not include CORE Lab CPK Pfeffer MA et al. Pfeffer MA et al. European Heart JEuropean Heart J 2001;22:271. 2001;22:271.

Pravastatin Placebo 95% CIPravastatin Placebo 95% CI
Any Elevated CPK 587 / 5245 Any Elevated CPK 587 / 5245 (11.2%) (11.2%) 563 / 5233 563 / 5233 (10.8%)(10.8%) -0.78, 1.65-0.78, 1.65
> 1.5 - > 1.5 - << 3 X ULN 3 X ULN 480 480 (9.2%)(9.2%) 460 460 (8.8%)(8.8%) -0.75, 1.48-0.75, 1.48
> 3 - > 3 - < < 5 X ULN 5 X ULN 84 84 (1.6%)(1.6%) 79 79 (1.5%)(1.5%) -0.40, 0.59-0.40, 0.59
> 5 - > 5 - < < 7 X ULN 7 X ULN 8 8 (0.2%)(0.2%) 16 16 (0.3%)(0.3%) -0.36, 0.05-0.36, 0.05
> 7 - > 7 - < < 9 X ULN 9 X ULN 6 6 (0.1) (0.1) 6 6 (0.1%)(0.1%) -0.15, 0.15-0.15, 0.15
> 9 X ULN > 9 X ULN 9 9 (0.2%)(0.2%) 2 2 (<0.1%)(<0.1%) -0.02, 0.28-0.02, 0.28
The Prospective Pravastatin Pooling Project:Post Baseline Elevations in CPK
Pfeffer MA et al. Pfeffer MA et al. European Heart JEuropean Heart J 2001;22:271. 2001;22:271.
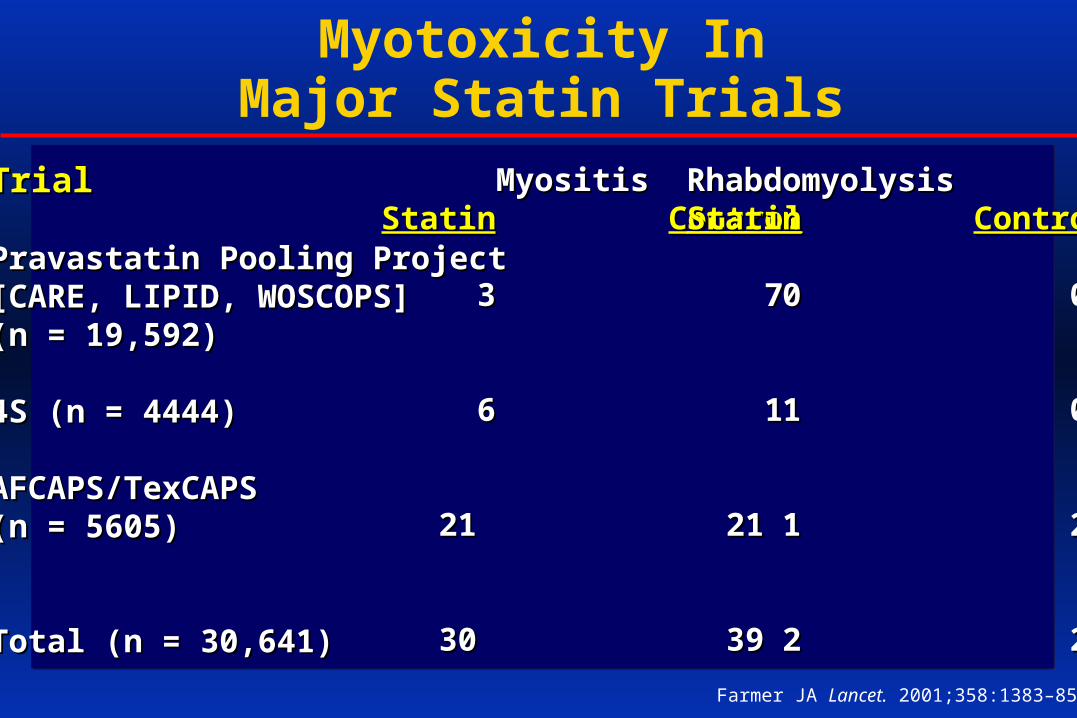
Myotoxicity In Major Statin Trials
TrialTrial
Pravastatin Pooling ProjectPravastatin Pooling Project[CARE, LIPID, WOSCOPS][CARE, LIPID, WOSCOPS](n = 19,592)(n = 19,592)
4S (n = 4444)4S (n = 4444)
AFCAPS/TexCAPS AFCAPS/TexCAPS (n = 5605)(n = 5605)
Total (n = 30,641)Total (n = 30,641)
Farmer JA Lancet. 2001;358:1383–85.
MyositisMyositisStatinStatin ControlControl
33 7 7
66 1 1
21 21 21 21
3030 39 39
RhabdomyolysisRhabdomyolysisStatinStatin ControlControl
00 0 0
11 0 0
1 1 2 2
22 2 2
Proportion Proportion of Subjectsof Subjects
Still On Still On MedsMeds
0.0
0.2
0.4
0.6
0.8
1.0
2 3 4 5 6 71Years of Follow-upYears of Follow-up
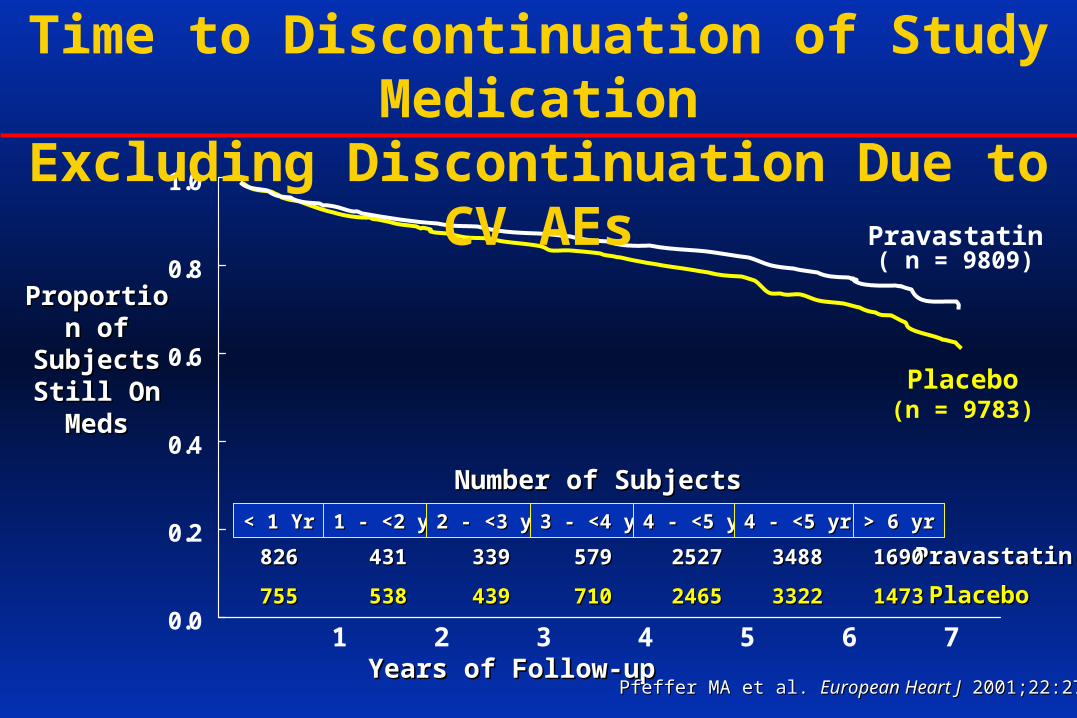
Time to Discontinuation of Study MedicationExcluding Discontinuation Due to CV AEs
Pravastatin( n = 9809)
Placebo(n = 9783)
Pfeffer MA et al. Pfeffer MA et al. European Heart JEuropean Heart J 2001;22:271. 2001;22:271.
PlaceboPlacebo
PravastatinPravastatin
538538
431431
439439
339339
755755
826826
710710
579579
24652465
25272527
33223322
34883488
14731473
16901690
Number of SubjectsNumber of Subjects
< 1 Yr< 1 Yr 1 - <2 yr1 - <2 yr 2 - <3 yr2 - <3 yr 3 - <4 yr3 - <4 yr 4 - <5 yr4 - <5 yr 4 - <5 yr4 - <5 yr > 6 yr> 6 yr

The Prospective Pravastatin Pooling Project:Predicting Medication Discontinuation
A Multivariate Cox Model
ParameterParameter Hazard Ratio Hazard Ratio p-value p-value
Treatment Group (Pravastatin)Treatment Group (Pravastatin) 0.690.69 0.00010.0001
History of DiabetesHistory of Diabetes 1.341.34 0.00010.0001
Presence of CV SAEPresence of CV SAE 0.760.76 0.00010.0001
Current SmokerCurrent Smoker 1.251.25 0.00010.0001
Gender (males)Gender (males) 0.830.83 0.00010.0001
Primary/Secondary PreventionPrimary/Secondary Prevention 1.151.15 0.00420.0042
AgeAge 1.001.00 0.47180.4718
Pfeffer MA et al. Pfeffer MA et al. European Heart JEuropean Heart J 2001;22:271. 2001;22:271.