the quality of drinking water in ireland - kilkennycoco.ie · drinking water in ireland a report...
TRANSCRIPT

The Quality ofDrinking Water in Ireland
A Report for the Year 2003 with aReview of the Period 2001-2003
ENVIRONMENTAL PROTECTION AGENCYAn Ghníomhaireacht um Chaomhnú ComhshaoilPO Box 3000, Johnstown Castle Estate, Co Wexford, Ireland
Telephone: +353-53-60600; Fax: +353-53-60699E-mail: [email protected] Website: www.epa.ie
Lo Call: 1890 335599

The Quality of Drinking Water in Ireland A Report for the Year 2003
ii
Environmental Protection Agency 2004
All or part of this publication may be reproduced without further permission,provided the source is acknowledged.
Although every effort has been made to ensure the accuracy of the material contained in thispublication, complete accuracy cannot be guaranteed. Neither the Environmental Protection Agencynor the author(s) accept any responsibility whatsoever for loss or damage occasioned or claimed tohave been occasioned, in part or in full, as a consequence of any person acting, or refraining fromacting, as a result of a matter contained in this publication.
The Quality of Drinking Water in Ireland
A Report for the Year 2003 with a Review of the Period2001-2003
Authors: Mr. Darragh Page, Mr. Jim Moriarty, Ms. Yvonne Doris and Dr.Matt Crowe
ISBN 1- 84095 - 143 - 5 11/04/750
Price: €26

The Quality of Drinking Water in Ireland A Report for the Year 2003
iii
EXECUTIVE SUMMARY .............................................................................................................. VIII
1. INTRODUCTION.........................................................................................................................1
1.1. THE EUROPEAN COMMUNITIES (QUALITY OF WATER INTENDED FOR HUMANCONSUMPTION) REGULATIONS 1988 ..........................................................................................1
1.2. THE EUROPEAN COMMUNITIES (DRINKING WATER) REGULATIONS, 2000 .......3
2. PARAMETER BY PARAMETER ANALYSIS OF DRINKING WATER.............................6
2.1. INTRODUCTION.................................................................................................................6
2.2. ALUMINIUM .......................................................................................................................7
2.3. AMMONIUM......................................................................................................................10
2.4. TOTAL & FAECAL COLIFORMS....................................................................................11
2.5. COLOUR.............................................................................................................................17
2.6. FLUORIDE .........................................................................................................................18
2.7. HEAVY METALS ..............................................................................................................20
2.8. IRON ...................................................................................................................................21
2.9. MANGANESE ....................................................................................................................23
2.10. NITRATES..........................................................................................................................24
2.11. NITRITE..............................................................................................................................28
2.12. ODOUR...............................................................................................................................29
2.13. TASTE.................................................................................................................................30
2.14. PH ........................................................................................................................................31
2.15. TRIHALOMETHANES......................................................................................................33
2.16. TURBIDITY........................................................................................................................34
2.17. CRYPTOSPORIDIUM .......................................................................................................35
2.18. THE EUROPEAN COMMUNITIES (DRINKING WATER) REGULATIONS, 2000 .....36
2.19. PARAMETERS WITH REVISED STANDARDS IN THE 2000 REGULATIONS .........40
3. SANITARY AUTHORITY RESULTS .....................................................................................44
3.1. INTRODUCTION AND OVERVIEW ...............................................................................44
3.2. CARLOW............................................................................................................................46
3.3. CAVAN...............................................................................................................................47
3.4. CLARE................................................................................................................................48

The Quality of Drinking Water in Ireland A Report for the Year 2003
iv
3.5. CLONMEL..........................................................................................................................49
3.6. CORK CITY........................................................................................................................50
3.7. CORK (NORTHERN AREA).............................................................................................51
3.8. CORK (SOUTH AREA) .....................................................................................................52
3.9. CORK (WEST AREA)........................................................................................................53
3.10. DONEGAL..........................................................................................................................54
3.11. DROGHEDA.......................................................................................................................55
3.12. DUBLIN CITY....................................................................................................................56
3.13. DUNDALK .........................................................................................................................57
3.14. DUN LAOGHAIRE-RATHDOWN....................................................................................58
3.15. ENNIS .................................................................................................................................59
3.16. FINGAL ..............................................................................................................................60
3.17. GALWAY CITY .................................................................................................................61
3.18. GALWAY (COUNTY) .......................................................................................................62
3.19. KERRY................................................................................................................................63
3.20. KILDARE............................................................................................................................64
3.21. KILKENNY ........................................................................................................................65
3.22. LAOIS .................................................................................................................................66
3.23. LEITRIM.............................................................................................................................67
3.24. LIMERICK (COUNTY)......................................................................................................68
3.25. LIMERICK CITY................................................................................................................69
3.26. LONGFORD .......................................................................................................................70
3.27. LOUTH................................................................................................................................71
3.28. MAYO.................................................................................................................................72
3.29. MEATH...............................................................................................................................73
3.30. MONAGHAN .....................................................................................................................74
3.31. NORTH TIPPERARY.........................................................................................................75
3.32. OFFALY..............................................................................................................................76
3.33. ROSCOMMON...................................................................................................................77
3.34. SLIGO TOWN ....................................................................................................................78
The Quality of Drinking Water in Ireland A Report for the Year 2003
v
3.35. SLIGO COUNTY................................................................................................................79
3.36. SOUTH DUBLIN................................................................................................................80
3.37. SOUTH TIPPERARY .........................................................................................................81
3.38. WATERFORD CITY..........................................................................................................82
3.39. WATERFORD COUNTY...................................................................................................83
3.40. WESTMEATH....................................................................................................................84
3.41. WEXFORD .........................................................................................................................85
3.42. WICKLOW .........................................................................................................................86
4. EPA AUDITS...............................................................................................................................87
4.1. INTRODUCTION...............................................................................................................87
4.2. AUDITS ..............................................................................................................................87
5. CURRENT ISSUES ....................................................................................................................91
5.1. INTRODUCTION...............................................................................................................91
5.2. RESPONSIBILITY FOR PRODUCING AND MONITORING DRINKING WATER.....91
5.3. CHLORINATION...............................................................................................................91
5.4. FLUORIDATION ...............................................................................................................92
5.5. QUALITY IN RURAL WATER SCHEMES .....................................................................94
5.6. IMPLEMENTATION OF THE 2000 DRINKING WATER REGULATIONS .................96
5.7. IMPROVED COMMUNICATION.....................................................................................96
6. CONCLUSIONS .........................................................................................................................97
7. RECOMMENDATIONS............................................................................................................99
7.1. MANAGEMENT OF DRINKING WATER.......................................................................99
7.2. SAMPLING, MONITORING AND REPORTING ..........................................................100
7.3. MANAGEMENT OF WATER TREATMENT SLUDGES .............................................101
7.4. COMMUNICATION ........................................................................................................101
7.5. INFRASTRUCTURE AND PLANNING .........................................................................102
7.6. EUROPEAN COMMUNITIES (DRINKING WATER) REGULATIONS 2000.............102
7.7. ENFORCEMENT OF THE DRINKING WATER REGULATIONS ..............................102
SUGGESTED FURTHER READING..............................................................................................103

The Quality of Drinking Water in Ireland A Report for the Year 2003
vi
Acknowledgements
The help of those sanitary authorities which contributed data to the Environmental Protection Agencyfor the purposes of this report is gratefully acknowledged. Thanks are also due to EPA staff membersMs. Shirley Murphy, Ms. Eileen Carroll, Mr. David Smith, Ms. Niamh O’Neill, Ms. Mary FrancesRochford, Ms. Avril Boland and Mr. Frank Clinton.

The Quality of Drinking Water in Ireland A Report for the Year 2003
vii
Abbreviations & Symbols
Al Aluminium
Cd Cadmium
Co County
Co Co County Council
Cr Chromium
Cu Copper
EPA Environmental Protection Agency
F Fluoride
Fe Iron
Gr Groundwater
GWS Group Water Scheme/Schemes
HACCP Hazard Analysis Critical Control Points
Hg Mercury
MAC Maximum Admissible Concentration
mg/l Milligrams per litre
Mn Manganese
MRC Minimum Required Concentration
na Information not available to sanitary authority and / or EPA
n/a Not applicable
NDSC National Disease Surveillance Centre
NH4 Ammonium
Ni Nickel
NO3 Nitrate
NO2 Nitrite
NTU Nephelometric Turbidity Units
Pb Lead
PWS Public Water Supply/Supplies
µg/l Micrograms per litre
SMP Small Private Supplies/Wells
WHO World Health Organisation
The Quality of Drinking Water in Ireland A Report for the Year 2003
viii
Executive Summary
Overview
The classification of water as fit for human consumption is based on the European Communities(Quality of Water Intended for Human Consumption) Regulations, 1988, which give formal effect inIrish law to the EU Drinking Water Directive [80/778/EEC]. The Drinking Water Regulations cover atotal of 53 bacteriological, chemical and physical parameters (there are also two further parameters forsoftened waters which fix Minimum Required Concentrations). For each of the 53 parametersspecified in Irish law, an upper concentration limit (or maximum admissible concentration) is specified.Hence, a comparison between monitoring results from a drinking water tap and the upper concentrationlimits allows one to judge whether a supply is fit for human consumption.
Persons producing drinking water must provide water, which conforms to the quality standards as laiddown by the 1988 Regulations. Though up to 53 different quality standards exist, there is a smallergroup of “core” parameters, between 8 and 15 in all, which form a suitable basis on which thepotability of water may be generally assessed in the majority of cases.
The drinking waters produced and distributed by local authorities are termed public water supplies(PWS) and in 2003 monitoring results were submitted to the EPA for 906 such supplies (or supplyzones). Public water supplies produce by far the greater quantity of water (Figure 1) though thenumber of group water schemes far exceeds that of public water supplies. In 2003, the EPA receivedmonitoring results for 1,805 group water schemes, representing a slight decrease in the number ofschemes monitored compared to 2002 (when 1,913 schemes were monitored). It is estimated that thereare over 5,500 group water schemes in Ireland, serving approximately 10% of the population. Groupwater schemes can be broken down into two distinct groups, those that obtain their water from thesanitary authority and distribute it themselves (‘public’ group water schemes) or those that source anddistribute their own water (‘private’ group water schemes). Of the schemes monitored in 2003, 791were ‘public’ group water schemes while the remaining 1,014 were ‘private’ group water schemes.
In the year 2003, routine monitoring of drinking water supplies in Ireland consisted of the analysis of26,987 samples which involved 235,042 individual determinations of the 53 parameters specified in theRegulations (an increase of over 7%). The Environmental Protection Agency (EPA) estimates thatlocal authorities (also called sanitary authorities) produced and distributed 91.9% of the sampleddrinking water with 8.1% of the water distributed by group water schemes (Figure 1). The EPAestimates that approximately 1,700,000 m3/day of water is produced by the sanitary authorities and thegroup water schemes. Furthermore, based on the details submitted to the EPA, the bulk of watersupplied originates from surface water sources (Figure 2). This is particularly so for public watersupplies whereas group water schemes tend to be slightly more reliant on groundwater or spring water.

The Quality of Drinking Water in Ireland A Report for the Year 2003
ix
Public WaterSupplies
91.9%
Private GroupWater Schemes
5.6%
Public GroupWater Schemes
2.5%
Figure 1: Population Served by Water Supplies Monitored in 2003.
Surface Water83%
Groundwater11%
Unknown1%
Spring5%
Figure 2: Sources of Drinking Water in 2003.
The overall level of compliance with the 53 drinking water standards for public water supplies andgroup water schemes in 2003 was 96.1%, an improvement of 0.2% compared to 2002 (Figure 4)1. Forpublic water supplies the overall compliance rate improved from 97.4% in 2002 to 97.7% in 2003while the compliance rate in group water schemes improved from 91.5% in 2002 to 91.8% in 2003.
1 Overall compliance is based on the number of individual tests for each of the 53 parameters specifiedin the Regulations that meet the standards.

The Quality of Drinking Water in Ireland A Report for the Year 2003
x
Recent trends in the total number of exceedances for core parameters and compliance rates for theparameters for public water supplies and group water schemes are presented in Tables 1 and 2 as wellas a breakdown of number of exceedances and percentage compliance for ‘public’ and ‘private’ groupwater schemes for 2003. The trend over ten years in the number of analyses for the core parameters isillustrated in Figure 3.
0
40,000
80,000
120,000
160,000
200,000
1994 1995 1996 1997 1998 1999 2000 2001 2002 2003
Year
No
.of
Tes
ts
No. of Compliant Tests No. of Tests Exceeding the Standards
Figure 3: Compliance with the 14 Core Parameter Drinking Water Standards 1994 to 2003.
Compliant Tests96.1%
Tests Exceedingthe Standards
3.9%
Figure 4: Overall Compliance in 2003.

The Quality of Drinking Water in Ireland A Report for the Year 2003
xi
Table 1: Total Number of Exceedances of the Core Parameters from 2001 to 2003
Public Water Supplies Group Water Schemes2003
Exceedances22001 2002 2003 2001 2002
Public Private247Aluminium 547 468 377 37 47
225 2271Ammonium 14 12 14 63 83
28 43578Colour 503 594 352 518 722
148 430875Faecal Coliforms 422 235 196 1,073 887
81 79419Fluoride 311 250 329 26 14
13 64Heavy Metals 16 13 15 5 1
0 4322Iron 324 288 224 258 285
119 203348Manganese 259 240 214 315 290
110 24834Nitrates 33 30 19 44 30
0 3436Nitrites 16 16 13 40 102
19 1784Odour 588 410 451 180 42
69 15118pH 133 119 116 104 72
19 9910Taste 276 165 271 101 3
2 81719Total Coliforms 1,124 1,000 990 1,793 1,552
283 1436178Turbidity 204 185 89 234 205
53 125
2 Exceedances for Group Water Schemes for 2003 are listed in total terms first with the number of exceedances in‘public’ and ‘private’ group water schemes then detailed. For example, there were 875 exceedances of the FaecalColiforms standard in 2003, with 81 of these in ‘public’ group water schemes and 794 in ‘private’ group waterschemes.

The Quality of Drinking Water in Ireland A Report for the Year 2003
xii
Table 2: Trends in Percentage Compliance for the Core Parameters from 2001 to 2003.
Public Water Supplies Group Water Schemes20032001 2002 2003 2001 2002
Public Private92Aluminium 91.2 91.7 93.2 92.1 94.2
85.8 98.598.3Ammonium 99.7 99.8 99.7 98.1 97.8
98.5 98.286.9Colour 94.6 93.8 96.3 85.4 82.4
92.7 81.983.2Faecal Coliforms 97.2 98.4 98.7 74.1 80.9
96.1 74.991.9Fluoride 95.8 96.5 95.3 89.5 95.5
85.2 96.199.8Heavy Metals 99.8 99.9 99.9 99.5 99.9
100 99.892.1Iron 94.7 94.7 96 87.6 88.7
94.0 90.491.4Manganese 95.1 95.7 96.1 84.7 88.5
94.4 88.399.2Nitrates 99.3 99.4 99.6 98.7 99.2
100 98.699.1Nitrites 99.6 99.6 99.7 98.7 97.1
99.0 99.295.2Odour 94.7 95.8 95.6 94.5 97.6
88.8 98.797.4pH 98.6 98.8 98.8 97.1 98.2
99.1 96.298.0Taste 96.9 97.8 96.5 93.7 99.6
98.7 98.767.1Total Coliforms 92.6 93.3 93.4 56.8 66.5
86.3 54.796Turbidity 97.7 97.9 99 93.3 94.8
97.4 94.9
Key Indicators
Overall Level of Compliance
Recent trends in overall compliance with the standards for all 53 parameters are presented in Figure 5for all supplies combined, public water supplies and group water schemes. The overall rate ofcompliance for drinking water supplies in Ireland has improved by 0.2% in 2003 to 96.1%. However,the compliance rate for public water supplies improved by 0.3% in 2003 to 97.7% but is up 0.7% overthe three year period. Overall compliance in group water schemes improved by 2.2% over the period2001-2003. As in previous years water supplied by public water supplies is of a higher quality thanthat supplied by group water schemes. Within group water schemes, water supplied by ‘public’ groupwater schemes is of a higher quality than that supplied by ‘private’ group water schemes.

The Quality of Drinking Water in Ireland A Report for the Year 2003
xiii
75%
80%
85%
90%
95%
100%
Overall PWS GWS
Per
cen
tag
eC
om
plia
nce
2001 2002 2003
Figure 5: Overall Compliance with the Standards in all Supplies Combined, Public WaterSupplies and Group Water Schemes.
Total and Faecal Coliforms
Coliforms may be present in a drinking water sample due to inadequate treatment, post treatmentcontamination or where there are excessive nutrients in the water. As such, the presence of coliformsin a drinking water sample indicates the failure of the supply or distribution systems. Compliance inpublic water supplies improved slightly by 0.1% in 2003 to 93.4%. There was also an overallimprovement in the compliance rate in group water schemes from 66.5% in 2002 to 67.1% in 2003.When examined on a scheme by scheme basis, 69.0% of public water supplies and 53.8% of groupwater schemes monitored were compliant with the standard for total coliforms.
For the 2003 returns, all local authorities were asked to distinquish between ‘public’ group waterschemes and ‘private’ group water schemes. This allowed a comprehensive assessment of the groupwater scheme sector and further pinpoints where the quality deficiency arises. In terms of the numberof samples analysed, ‘public’ group water schemes were of far superior quality than ‘private’ schemes.The compliance rate with the total coliform standard for ‘private’ group water schemes was just 54.7%in 2003 compared to 86.3% in ‘public’ group water schemes. On a scheme by scheme basis, just 39%(392 of 1005 schemes monitored) of the ‘private’ group water schemes complied with the standard fortotal coliforms during 2003 while 79% of the ‘public’ schemes (569 of 781 schemes monitoredcomplied).

The Quality of Drinking Water in Ireland A Report for the Year 2003
xiv
50%
60%
70%
80%
90%
100%
1994 1995 1996 1997 1998 1999 2000 2001 2002 2003
Year
Per
cen
tag
eC
om
plia
nce
Public Water Supplies Group Water Schemes
Figure 6: Percentage of Samples Free from Total Coliforms over the Period 1994 to 2003.
Not all coliforms are of faecal origin and to obtain a better picture of the quality of water in a supply atest is carried out to determine whether the coliforms detected are of faecal origin. The presence of afaecal coliform in a water supply is a definite indication that faecal contamination (human or animal) ofthe water supply has occurred. There has been a welcome reduction in the overall number of samplescontaminated with faecal coliforms in 2003. The overall compliance rate for faecal coliformsimproved from 94.2% in 2002 to 94.7% in 2003. The number of samples containing faecal coliformsreduced to 196 (down from 235 in 2002 and 422 in 2001) in public water supplies and to 875 (downfrom 887 in 2002 and 1,073 in 2001) in group water schemes. The net result is an improvement in thecompliance rates for public water supplies to 98.7% in 2003 (up from 98.4% in 2002) and for groupwater schemes to 83.2% in 2003 (up from 80.9%), as illustrated on Figure 7. However, the compliancerate in ‘public’ group water schemes was 96.1% in 2003 while it was just 74.9% in the ‘private’ groupwater schemes (Figure 7). It is also worth noting that the compliance rate for faecal coliforms in publicwater supplies serving greater than 5,000 people was 99.7% (compared with 99.3% for 2002). As withthe total coliform group of organisms the main reason for the lower rate of compliance with the faecalcoliform standard in the group water sector is due to the poor quality of “private” group water schemesin comparison to the “public” group water schemes.

The Quality of Drinking Water in Ireland A Report for the Year 2003
xv
74.9%
96.1%98.7%
0%
20%
40%
60%
80%
100%
PWS Public GWS Private GWS
Figure 7: Percentage Compliance with the Faecal Coliform standard in Public Water Supplies,‘Public’ Group Water Schemes and ‘Private’ Group Water Schemes.
Though the continued improvement in compliance with the faecal coliform standard is welcome, thepresence of faecal coliforms in any water supply at any time is unacceptable. Analysis of theexceedances of the faecal coliform standard on a supply by supply basis indicate that 788 (88.8%)public water supplies and 1,358 (76.1%) group water schemes were free of faecal contamination during2003. This is a slight improvement from 2002 where 84.6% and 74.1% of public water supplies andgroup water schemes respectively were free of faecal contamination. However, this still means that112 (11.2%) public water supplies and 426 (23.9%) group water schemes exhibited some degree offaecal contamination during 2003. The majority of these exceedances were moderate in nature thoughexceedances in 33 of the public water supplies were serious (down from 45 in 2002). Of the 426 groupwater schemes that were contaminated with E. coli during 2003, 366 of these schemes were privatelysourced. Thus, of the group water schemes 92% (667 of 781) of the publically sourced schemescomplied compared to just 63.5% of the privately sourced schemes (638 of 1004).
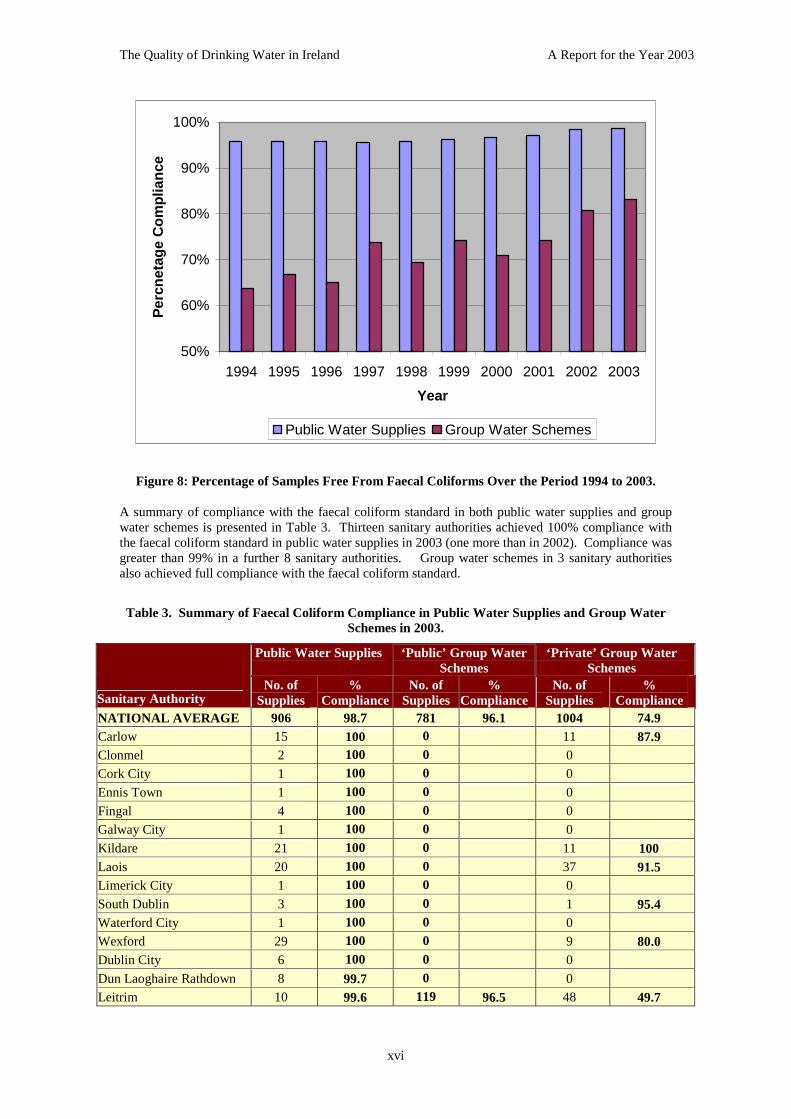
The Quality of Drinking Water in Ireland A Report for the Year 2003
xvi
50%
60%
70%
80%
90%
100%
1994 1995 1996 1997 1998 1999 2000 2001 2002 2003
Year
Per
cnet
age
Co
mp
lian
ce
Public Water Supplies Group Water Schemes
Figure 8: Percentage of Samples Free From Faecal Coliforms Over the Period 1994 to 2003.
A summary of compliance with the faecal coliform standard in both public water supplies and groupwater schemes is presented in Table 3. Thirteen sanitary authorities achieved 100% compliance withthe faecal coliform standard in public water supplies in 2003 (one more than in 2002). Compliance wasgreater than 99% in a further 8 sanitary authorities. Group water schemes in 3 sanitary authoritiesalso achieved full compliance with the faecal coliform standard.
Table 3. Summary of Faecal Coliform Compliance in Public Water Supplies and Group WaterSchemes in 2003.
Public Water Supplies ‘Public’ Group WaterSchemes
‘Private’ Group WaterSchemes
Sanitary AuthorityNo. of
Supplies%
ComplianceNo. of
Supplies%
ComplianceNo. of
Supplies%
ComplianceNATIONAL AVERAGE 906 98.7 781 96.1 1004 74.9Carlow 15 100 0 11 87.9Clonmel 2 100 0 0
Cork City 1 100 0 0
Ennis Town 1 100 0 0
Fingal 4 100 0 0
Galway City 1 100 0 0
Kildare 21 100 0 11 100Laois 20 100 0 37 91.5Limerick City 1 100 0 0
South Dublin 3 100 0 1 95.4Waterford City 1 100 0 0
Wexford 29 100 0 9 80.0Dublin City 6 100 0 0
Dun Laoghaire Rathdown 8 99.7 0 0
Leitrim 10 99.6 119 96.5 48 49.7

The Quality of Drinking Water in Ireland A Report for the Year 2003
xvii
Public Water Supplies ‘Public’ Group WaterSchemes
‘Private’ Group WaterSchemes
Sanitary AuthorityNo. of
Supplies%
ComplianceNo. of
Supplies%
ComplianceNo. of
Supplies%
ComplianceSouth Tipperary 24 99.4 0 13 75.0Sligo Town 3 99.3 0 0
Cork (South) 59 99.3 0 21 72.7Westmeath 13 99.3 0 2 100Meath 38 99.1 0 5 95.5Offaly 21 99.1 0 20 93.0Longford 8 98.9 54 97.3 3 100Limerick County 59 98.8 0 70 91.6Clare 27 98.8 115 92.9 62 86.8Kilkenny 15 98.7 0 26 88.2Donegal 53 98.7 0 16 82.0Dundalk Town 1 98.7 0 0
Sligo County 8 98.7 18 100 15 46.7Cavan 17 98.7 32 100 52 52.2Louth 15 98.2 0 11 88.2Wicklow 44 98.2 0 16 56.9Drogheda Town 2 98.2 0 0
Monaghan 14 97.8 0 15 90.9Cork (North) 63 97.5 0 11 81.8Galway County 44 97.2 63 98.6 214 74.4Kerry 65 97.2 81 97.2 62 73.5Roscommon 18 97.2 126 97.1 56 69.0Mayo 23 97.1 173 93.9 149 50.9Waterford 91 95.6 0 7 100North Tipperary 22 95.3 0 38 95.3Cork (West) 30 94.8 0 7 82.0
The Challenges Ahead
The European Communities (Drinking Water) Regulations, 2000 (SI 439 of 2000) took effect on 1st
January 2004 and present a considerable challenge to the sanitary authorities charged with theirimplementation as well as operators of group water schemes and the private supplies that are nowcovered by the Regulations. These challenges include the establishment of a completely newmonitoring and sampling programme and the requirement that each exceedance of a drinking waterstandard is investigated.
Improvement in the group water scheme sector is occurring but the pace of improvement will have toaccelerate considerably to ensure compliance with the 2000 Regulations. The exceptionally poorquality of the privately sourced group water schemes is clear to see and it is imperative that allprivately sourced schemes be prioritised and included in investment programmes. Group waterschemes that fail to engage in this process and the change that is required should be actively pursued bythe sanitary authorities in accordance with Article 9 of the Regulations. In this regard, sanitaryauthorities must pursue non-compliant schemes and request them to prepare action programmes inaccordance with the timeframes set out in the Regulations. New powers of prosecution under Article14 should be utilised where progress is lacking in the preparation or implementation of theseprogrammes. It is unacceptable that in 2004 a significant proportion of the population of Ireland is stillreceiving water that is not fit for consumption.

The Quality of Drinking Water in Ireland A Report for the Year 2003
xviii
Though there has been an improvement in public water supplies there are still a significant number ofschemes that are supplying drinking water of an unacceptable standard. In particular the repeatedfailure of sanitary authorities to deal with supplies that breach the nitrate standard is intolerable.Sanitary authorities must deal with the small number of supplies that are repeatedly failing to meet thestandards. The failure of treatment plants to meet the aluminium, colour and turbidity standards mustalso not be ignored. Though these parameters have been reclassified as indicator parametric values inthe 2000 Regulations, they indicate that the treatment process is not operating adequately. The largenumber of supplies that repeatedly fail to meet the aluminium standard is unacceptable as aluminium isused as a treatment chemical and thus levels of aluminium in the final water are entirely under thecontrol of the operator of that plant. Though not of concern in themselves the colour and turbiditybreaches can indicate that there are other problems in the water supply (e.g. colour breaches mayindicate THM formation and turbidity breaches may indicate an inadequately operating treatmentsystem which may increase the risk of Cryptosporidium getting into the water distribution network).
The Quality of Drinking Water in Ireland A Report for the Year 2003
1
1. INTRODUCTION
Public health and aesthetics (i.e., appearance, taste and smell) are the principal reasons underpinningthe need for the treatment of water intended for human consumption. At the start of the 1900’s diseasessuch as cholera and typhoid fever prompted the development of water treatment technologies such asfiltration and disinfection devices. In the 1970s there were significant developments in treatmenttechnologies and this was coupled with an increasing understanding of the potential health effects oforganic and inorganic substances present in drinking water. This has led to a broadening of what isunderstood by “water fit for human consumption” and a consequent need for more extensivemonitoring of drinking water.
The classification of water as potable (i.e., fit for human consumption) or otherwise is based on theEuropean Communities (Quality of Water Intended for Human Consumption) Regulations, 1988 (S.I.No. 81 of 1988) which give formal effect in Irish law to the EU Drinking Water Directive[80/778/EEC]. These Regulations set standards for in excess of 50 parameters, which includemicrobiological, organic and inorganic standards. In Ireland, bodies whose function it is to providedrinking water are known as “Sanitary Authorities” and these comprise mostly County and BoroughCouncils as well as City and Town Councils. Regular sampling of water supplies is carried out by or onbehalf of these authorities and the samples are analysed for a range of constituents, generally referredto as “parameters of water quality”. Testing covers physical, chemical and bacteriological aspects ofwater quality and the results form the basis on which the overall quality of drinking water can beassessed. The task of providing good quality drinking water, distributing it and assessing its quality asit reaches the consumer is the responsibility of the relevant sanitary authority.
The Environmental Protection Agency (EPA) has statutory responsibilities in regard to drinking water.Section 58 of the Environmental Protection Agency Act, 1992, requires the Agency to prepare andsubmit to the Minister for the Environment, Heritage and Local Government a report each year on themonitoring by sanitary authorities of drinking water supplies and an assessment of the results. Thepresent report, the fourteenth in the series, covers the year 2003 and gives a comparative assessment ofdata for the period 2001-2003. The analytical data on which this report is based is generated by sanitaryauthorities by virtue of their monitoring programmes under the European Communities (Quality ofWater Intended for Human Consumption) Regulations, 1988.
In the report, quality variations on a national basis are considered, emphasis being placed largely on aparameter-by-parameter assessment. The report presents information on 15 key parameters, andprovides a summary overall assessment of drinking water quality in each sanitary authority area. Moredetailed analysis of the monitoring data submitted by the sanitary authorities is included on the CDROM version of “The Quality of Drinking Water in Ireland: A Report for the Year 2003”.
1.1. THE EUROPEAN COMMUNITIES (QUALITY OF WATER INTENDEDFOR HUMAN CONSUMPTION) REGULATIONS 1988
The European Communities (Quality of Water Intended for Human Consumption) Regulations, 1988(S.I. 81 of 1988) gives formal effect in Irish law to the EU Drinking Water Directive [80/778/EEC].Chief among the requirements of the 1988 Regulations are the following:
��all water for human consumption, whether in its original state or after treatment,regardless of origin, is covered, including water used in the food industry but excludingnatural mineral waters or medicinal waters;
��national quality standards, the legal limits which must not be exceeded, are fixed for over50 parameters;
��in particular circumstances, and only where there is no risk to public health, the Ministerfor the Environment may grant “departures” [exemptions] from the standard set forparticular parameters;

The Quality of Drinking Water in Ireland A Report for the Year 2003
2
��minimum frequencies of sampling and analysis, for the respective groups of parameterswhich are also defined, are established by the Regulations. Samples are to be taken fromwater at the point where it is made available to the consumer; that is, at the consumer’stap.
With regard to remedying water quality deficiencies confirmed by sampling and analysis, therequirements of the 1988 Regulations were subsequently supplanted by those of the EuropeanCommunities (Quality of Water Intended for Human Consumption) (Amendment) Regulations, 1999(S.I. No. 350 of 1999), which are broader in their coverage. However, it was subsequently decided thatfurther Regulations would be required to deal comprehensively with the problematic private suppliesand in June 2000 the European Communities (Quality of Water Intended for Human Consumption)(Amendment) Regulations, 2000 (S.I. No. 177 of 2000) were made. These Regulations were furtheramended in June 2003 (the European Communities (Quality of Water Intended for HumanConsumption (Amendment) Regulations, 2003 (S.I. No. 259 of 2003) in response to a Judgement of theEuropean Court of Justice on 14th November, 2002, which found that the transposing Irish legislationfailed “to reflect the binding character of the requirements of Annex 1 to the Directive in relation togroup water schemes”. The 2003 Amendment Regulations placed a binding responsibility for thepreparation and implementation of corrective action programmes on the sanitary authorities in relationto public water supplies and on the operators/trustees of group water schemes. Failure to adhere to therequirements of a notice served on the operator/trustee of a group water scheme could result in fines ofup to €3,000 and/or up to six months imprisonment. These Regulations were effective until 31st
December 2003 whereupon there were replaced by the European Communities (Drinking Water)Regulations, 2000 (S.I. 439 of 2000).
The 1988 Regulations also address the frequency of sampling and analysis. The basic principleunderlying the monitoring is that the extent to which sampling and analysis are carried out increaseswith the magnitude of the populations served by the respective supplies. Table 1-1 below (taken fromthe Regulations) shows the population bands and the minimum analysis frequencies specified for each.Table 1-2 provides a description of the monitoring requirements referred to in Table 1-1. These coverpopulations from 1,000 to 1,000,000 people (assuming a daily per capita consumption of 200 litres).Only in two cases does the frequency remain to be determined by the sanitary authorities.
Table 1-1. Minimum Frequency of Standard Analysis Required by the Regulations.
Volume ofwater
produced/distributed
m³/day
PopulationConcerned (onbasis of 200 l.per person per
day)
Minimum Number of Samples per Year
ANALYSIS
C1 C2 C3 C4
200 1,000 2 1 (a)
500 2,500 3 1 (a)
1,000 5,000 6 2 1
2,000 10,000 12 3 1
10,000 50,000 60 6 1
20,000 100,000 120 12 2
30,000 150,000 180 18 3
60,000 300,000 360 36 6
100,000 500,000 360 60 10
200,000 1,000,000 360 120 20
Frequency to be determined by thesanitary authority as the situationrequires
(a) Frequency to be determined by the sanitary authority but the requirement in article 7 (5) shall also apply. [ Therequirement, mentioned above, is that water used in the food industry and effecting the wholesomeness of the foodstuff inits finished form shall be monitored at least once a year]
The Quality of Drinking Water in Ireland A Report for the Year 2003
3
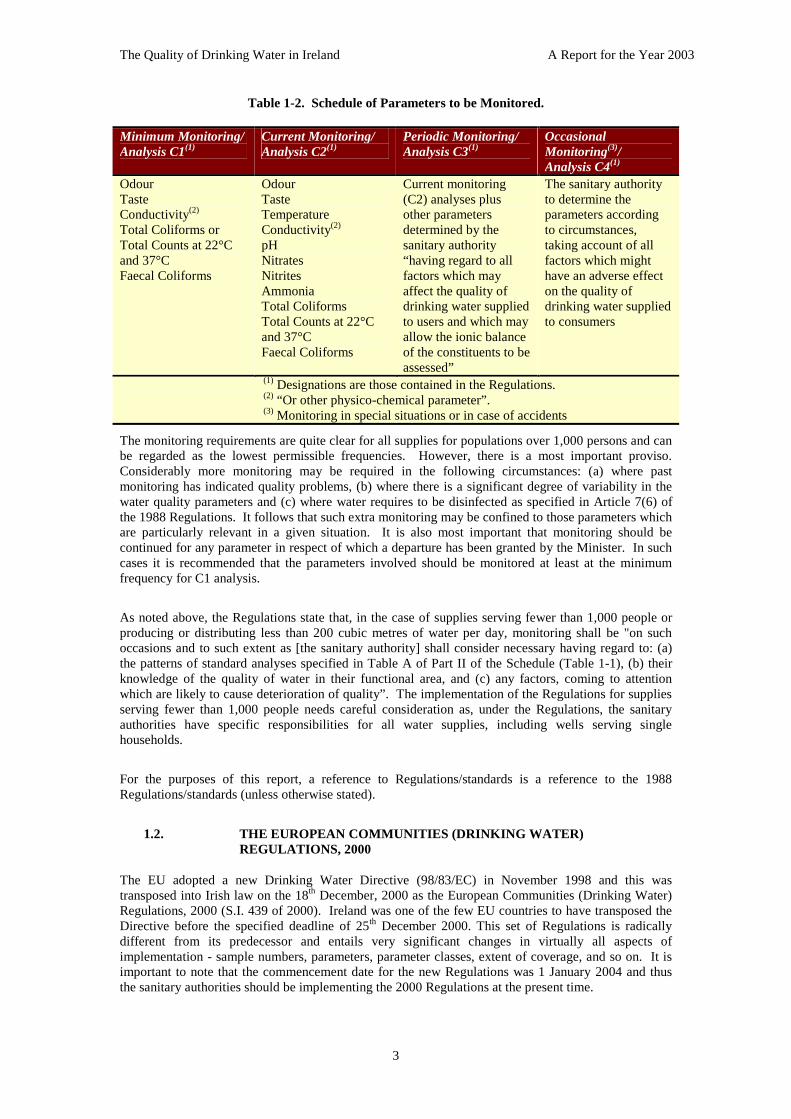
Table 1-2. Schedule of Parameters to be Monitored.
Minimum Monitoring/Analysis C1(1)
Current Monitoring/Analysis C2(1)
Periodic Monitoring/Analysis C3(1)
OccasionalMonitoring(3)/Analysis C4(1)
OdourTasteConductivity(2)
Total Coliforms orTotal Counts at 22°Cand 37°CFaecal Coliforms
OdourTasteTemperatureConductivity(2)
pHNitratesNitritesAmmoniaTotal ColiformsTotal Counts at 22°Cand 37°CFaecal Coliforms
Current monitoring(C2) analyses plusother parametersdetermined by thesanitary authority“having regard to allfactors which mayaffect the quality ofdrinking water suppliedto users and which mayallow the ionic balanceof the constituents to beassessed”
The sanitary authorityto determine theparameters accordingto circumstances,taking account of allfactors which mighthave an adverse effecton the quality ofdrinking water suppliedto consumers
(1) Designations are those contained in the Regulations.(2) “Or other physico-chemical parameter”.(3) Monitoring in special situations or in case of accidents
The monitoring requirements are quite clear for all supplies for populations over 1,000 persons and canbe regarded as the lowest permissible frequencies. However, there is a most important proviso.Considerably more monitoring may be required in the following circumstances: (a) where pastmonitoring has indicated quality problems, (b) where there is a significant degree of variability in thewater quality parameters and (c) where water requires to be disinfected as specified in Article 7(6) ofthe 1988 Regulations. It follows that such extra monitoring may be confined to those parameters whichare particularly relevant in a given situation. It is also most important that monitoring should becontinued for any parameter in respect of which a departure has been granted by the Minister. In suchcases it is recommended that the parameters involved should be monitored at least at the minimumfrequency for C1 analysis.
As noted above, the Regulations state that, in the case of supplies serving fewer than 1,000 people orproducing or distributing less than 200 cubic metres of water per day, monitoring shall be "on suchoccasions and to such extent as [the sanitary authority] shall consider necessary having regard to: (a)the patterns of standard analyses specified in Table A of Part II of the Schedule (Table 1-1), (b) theirknowledge of the quality of water in their functional area, and (c) any factors, coming to attentionwhich are likely to cause deterioration of quality”. The implementation of the Regulations for suppliesserving fewer than 1,000 people needs careful consideration as, under the Regulations, the sanitaryauthorities have specific responsibilities for all water supplies, including wells serving singlehouseholds.
For the purposes of this report, a reference to Regulations/standards is a reference to the 1988Regulations/standards (unless otherwise stated).
1.2. THE EUROPEAN COMMUNITIES (DRINKING WATER)REGULATIONS, 2000
The EU adopted a new Drinking Water Directive (98/83/EC) in November 1998 and this wastransposed into Irish law on the 18th December, 2000 as the European Communities (Drinking Water)Regulations, 2000 (S.I. 439 of 2000). Ireland was one of the few EU countries to have transposed theDirective before the specified deadline of 25th December 2000. This set of Regulations is radicallydifferent from its predecessor and entails very significant changes in virtually all aspects ofimplementation - sample numbers, parameters, parameter classes, extent of coverage, and so on. It isimportant to note that the commencement date for the new Regulations was 1 January 2004 and thusthe sanitary authorities should be implementing the 2000 Regulations at the present time.

The Quality of Drinking Water in Ireland A Report for the Year 2003
4
The 2000 Regulations:
• set standards in relation to the quality of water intended for drinking water, cooking, foodpreparation, other domestic purposes and food production (other than natural mineral waters,bottled water, certain medicinal products and exempted supplies);
• provide for temporary departures from the standard where there is no threat to human health; and
• require that information is made available to consumers in relation to various matters includingwater quality, exempted supplies, departures granted, precautionary measures and remedial actionin case of non-compliant supplies.
In general, a wide ranging overhaul of the original 1988 Regulations has been carried out. As well asintroducing a series of new or revised standards, termed “parametric values”, and downgrading someexisting standards to “indicator” status, the new Regulations introduce a revised regime for correctingbreaches of standards.
The Regulations prescribe 48 parametric values which are classified as being either microbiological,chemical or indicator parameters. New parameters include E. coli, Enterococci, acrylamide, benzene,benzo(a)pyrene, bromate, 1,2 dichloroethane, epichlorohydrin, polycyclic aromatic hydrocarbons,tetrachloroethene and trichloroethene, trihalomethanes, vinyl chloride, Clostridium perfringens, tritiumand total (radioactive) indicative dose. It is noted that the standards specified in the new Regulationsfor ammonium and fluoride are more stringent than those specified in the 1998 Directive.
Parameters no longer specified are faecal coliforms (replaced by E. coli), barium, magnesium,organochlorine compounds, phosphorus, potassium, silver, surfactants, zinc, alkalinity, calcium, dryresidues, hydrogen sulphide, kjeldhal nitrogen, phenols, substances extractable in chloroform,suspended solids, temperature and total hardness.
The two monitoring categories are respectively designated check monitoring and audit monitoring,the latter requiring the fewer number of samples but being by far the more demanding in analyticalterms.
The purpose of check monitoring is to provide information on the organoleptic and microbiologicalquality of the water supplied for human consumption as well as information on the effectiveness ofdrinking-water treatment (especially of disinfection) where it is used.
The purpose of audit monitoring is to provide the information necessary to determine whether or not allthe standards specified in Part I of the Schedule to the Regulations are being complied with. All suchparameters must be subject to audit monitoring unless it can be established by a sanitary authority, for aperiod of time to be determined by it, that a parameter is not likely to be present in a given supply inconcentrations which could lead to the risk of a breach of the relevant parametric value.
Table 1-3 provides the minimum sampling frequencies that apply.

The Quality of Drinking Water in Ireland A Report for the Year 2003
5
Table 1-3: Minimum Monitoring Frequencies
Volume of water distributedor produced each day
within a supply zone (m3)
EstimatedPopulation Served
Check monitoringNumber of samples
per year
Audit monitoringNumber of samples
per year
>10 ≤ 100 50-500 2 To be determined bythe sanitary authority
>100 ≤ 1,000 500-5,000 4 1
>1,000 ≤10,000 >5,000-50,0001
+ 1 for each 3,300m3/d
[16,500 pop] and partthereof the total
volume
>10,000 ≤100,000 >50,000-500,0003
+1 for each 10,000m3/d
[50,000 pop] and partthereof of the total
volume>100,000 >500,000
4
+3 for each 1,000 m3/d[5,000 pop] and partthereof of the total
volume
10+1 for each 25,000m3/d [125,000 pop]and part thereof ofthe total volume
Other features of the Regulations include:
• the applicability of the Regulations to all supplies supplying greater than 10 m3/d (or > 50 persons)as well as to those supplies serving less than 10 m3/d but that supply water as part of a commercialor public activity;
• the assignment to the EPA of the function of granting departures from the standards as of 1st
January 2004;
• the introduction of time limits for compliance with the standards by public and private suppliers;
• the provision for offences and penalties in the case of private water suppliers which fail to complywith a notice served by a sanitary authority.
A guidance note entitled “European Communities (Drinking Water) Regulations, 2000: A Handbookon Implementation for Sanitary Authorities” has been published by the Agency to assist sanitaryauthorities in the implementation of the Regulations. This Handbook can be purchased from the EPAPublications Office, McCumiskey House, Richview, Clonskeagh Road, Dublin 14 or can bedownloaded from the Public Authority Enforcement section of the EPA website (www.epa.ie).
The Quality of Drinking Water in Ireland A Report for the Year 2003
6
2. PARAMETER BY PARAMETER ANALYSIS OFDRINKING WATER
2.1. INTRODUCTION
The classification of a water as potable (i.e., fit for drinking) or otherwise is based on the requirementsof the Drinking Water Regulations, 1988. The Drinking Water Regulations cover a total of 53bacteriological, chemical and physical parameters for each of which an upper concentration limit orMAC [Maximum Admissible Concentration] is specified. There are two further parameters forsoftened waters which fix Minimum Required Concentrations [MRC].
The relevance of the various standards depends in large part on the local circumstances, which apply toa given water supply. For example, if the source is a boggy surface water, consideration of colour andpH (i.e., acidity or alkalinity) may be important. In a mineral-rich area the presence of iron ormanganese may be a major influence on quality. If the water is supplied, say, to a block of older urbanhouses with metallic piping the presence of lead may be an issue.
As a general rule in Ireland, the most important standards are those which relate to contamination bysewage or animal slurries. The relevant standards are those for “Total Coliforms” and “FaecalColiforms”, though others may also be applied in particular circumstances. This chapter providesdetails of the extent of compliance (or otherwise) with the Regulations for 15 principal water qualityparameters. Details are also provided of the results of the monitoring for trihalomethanes andCryptosporidium though these are not included as part of the current set of Regulations.
In an attempt to put the 15 principal water quality parameters into context, a brief backgrounddescription for each parameter is presented along with a categorisation of any exceedance, whichoccurs into one of four bands. The bands are intended to indicate in approximate terms moderate,serious, very serious and gross degrees of contamination. The bands are customised for each parameter,taking account of the maximum admissible concentration as set out in the Regulations. Thus forexample, the maximum admissible concentration for faecal coliforms is 0 mg/l and any exceedance forthis parameter is divided into one of the following four bands as shown in Table 2-1.
Table 2-1. Classification of Faecal Coliform Exceedances.
Band Concentration Type of Exceedance
1 ≤ 20 Moderate
2 > 20 and ≤ 200 Serious
3 > 200 and ≤ 500 Very Serious
4 >500 Gross
The discussion below deals largely with exceedances of the Drinking Water Regulations. Whereexceedances occur, it is essential that the sanitary authorities address them. However, there are clearlydegrees of gravity in the effects for the health and well-being of the public who consume drinkingwater. The consequences of supplies which, say, contain one or two total coliforms per 100 ml, on theone hand, and hundreds of faecal coliforms, on the other will be significantly different. It should not beinferred from this example that the EPA condones minor exceedances of the standards. On thecontrary, what this report seeks to present is an objective statement of the facts derived from thesanitary authority monitoring activities, and to set the analytical details in perspective.

The Quality of Drinking Water in Ireland A Report for the Year 2003
7
2.2. ALUMINIUM
Aluminium is one of the most abundant elements in the earth’s crust. A salt, aluminium sulphate, isvery widely used for colour and colloid-removal in the treatment of waters for drinking. The WorldHealth Organisation (WHO) suggests that human exposure to aluminium may occur through a varietyof routes, with drinking water probably contributing less than 5% of the total intake.
The WHO Guidelines for Drinking-Water Quality (Draft 3rd Edition) states that “On the whole, thepositive relationship between aluminium in drinking water and Alzheimer’s Disease, which wasdemonstrated in several epidemiological studies, cannot be discounted. However, strong reservationsabout inferring a causal relationship are warranted in view of the failure of these studies to account fordemonstrated confounding factors and total aluminium intake from all sources. Taken together, therelative risks from Alzheimer’s Disease from exposure to aluminium in drinking water above 100 µg/l(i.e., 0.1 mg/l), as demonstrated in these studies, are low”
A total of 8,643 samples were analysed for aluminium in 2003 which represented an increase of overone third on the previous year. The number of samples analysed in public water supplies remainedessentially the same (5,565 samples in 414 supplies) while the number of samples analysed in groupwater schemes rose dramatically due to the inclusion of aluminium in the monitoring suite for the RuralWater Monitoring Programme. The number of samples analysed from group water schemes rose to3,078 in 1,001 schemes (an increase of 280%). The overall level of compliance with the aluminiumstandard rose to 92.8% in 2003 from 92.0% in 2002 (Figure 2-1). The improvement was due to theincrease in compliance with the standard in public water supplies which rose from 91.7% in 2002 to93.2% in 2003. The drop in compliance in the group water schemes is due to the poor rate ofcompliance in the ‘public’ group water schemes which receive their water from public water supplies(85.8% compared to 98.5% in ‘private’ group water schemes). It is likely that the poor rate ofcompliance in ‘public’ group water schemes is due to a combination of elevated levels of aluminium inthe water received from the sanitary authority and inadequate maintenance of the mains (regularflushing of the mains will flush out aluminium deposits in the distribution network).
75
80
85
90
95
100
Public Water Supplies Group Water Schemes
%C
om
plia
nce
2001
2002
2003
Figure 2-1. Aluminium Compliance in the Period 2001 to 2003.

The Quality of Drinking Water in Ireland A Report for the Year 2003
8
0.00
1.00
2.00
3.00
4.00
5.00
6.00
≤0.4 ≤0.6 ≤1.0 >1.0
Band (mg/l)
%E
xcee
dan
ces
200120022003
Figure 2-2. Distribution of Aluminium Exceedances over the Period 2001 to 2003 (measured as apercentage of the total samples analysed).
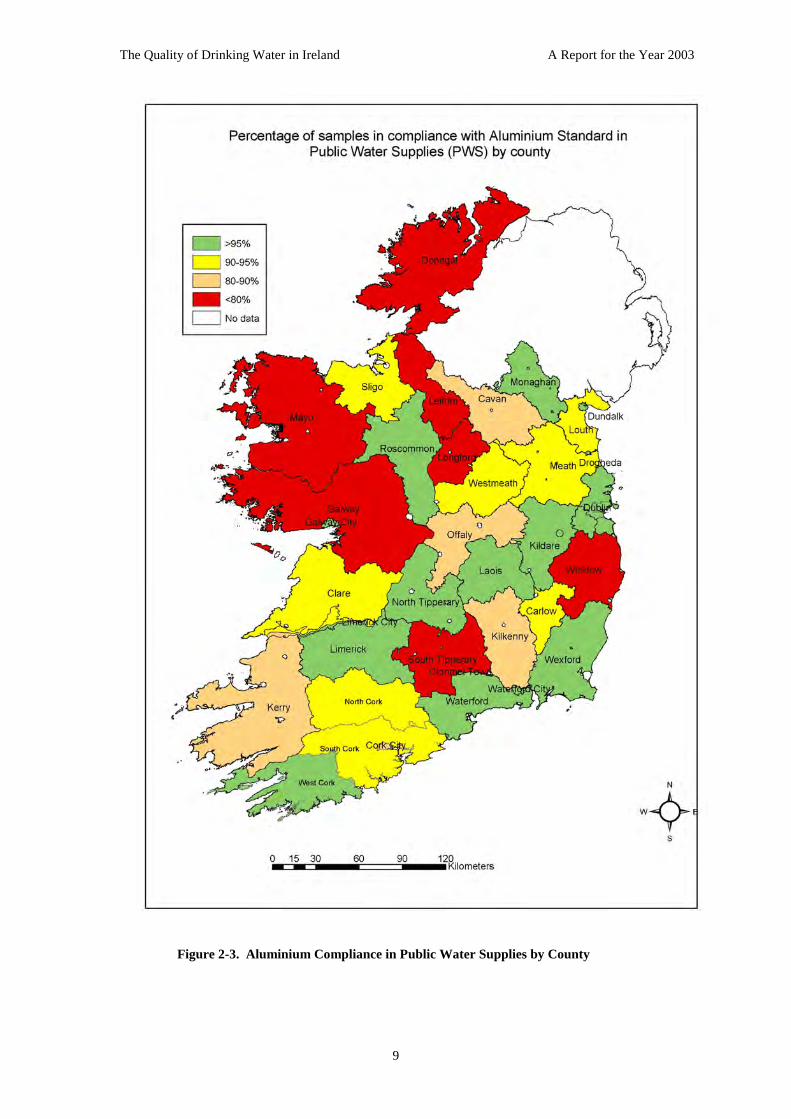
Throughout the review period the majority of aluminium exceedances are in the moderate band (i.e.<0.2 mg/l); however, in 2003 there was an increase in the percentage of gross exceedances (>1.0 mg/l).Poorly performing plants include Youghal Regional (Cork South), Ballyshannon and Gortahork–Falcarragh (both Donegal), Carrigallen and Drumkeeran (both Leitrim), Tullamore (Offaly),Louisburgh (Mayo) and Laragh/Anamoe (Wicklow). In each of these supplies less than one quarter ofthe samples analysed complied with the standard. Exceedances of the aluminium standard were mostlikely due to inadequate control over the alum dosing regime at the plant particularly where the sourceis an upland river and where there is no provision for raw water storage at the treatment plant.Inadequate flushing of the mains may also contribute to some of the exceedances reported. Monitoringfor aluminium was undertaken in 41 sanitary authorities with full compliance achieved in just 9 ofthese. Poor compliance was reported in Donegal (66%), Galway County (50%), Leitrim (61%),Longford (75%), Mayo (61%), South Tipperary (77%) and Wicklow (76%). The rates of compliancefor aluminium for public water supplies in each sanitary authority is shown on Figure 2-3.
The Quality of Drinking Water in Ireland A Report for the Year 2003
9
Figure 2-3. Aluminium Compliance in Public Water Supplies by County

The Quality of Drinking Water in Ireland A Report for the Year 2003
10
2.3. AMMONIUM
Ammonia is generally present in natural waters, though in very small amounts, as a result ofmicrobiological activity which causes the reduction of nitrogen-containing compounds. When presentin levels above 0.1mg/l N, sewage or industrial contamination may be indicated. From the viewpoint ofhuman health the significance of ammonia is marked because it indicates the possibility of sewagepollution and the consequent possible presence of pathogenic micro-organisms.
There was a moderate increase (4%) in the number of samples analysed for ammonium in 2003 due toan increase in ammonium monitoring in group water schemes (13% increase). In 2003 a total of 8,875samples were analysed for ammonium, 4,668 in public water supplies and 4,207 in group waterschemes. The overall rate of compliance improved to 99.0% in 2003 reversing the drop seen in 2002.Compliance in public water supplies remained essentially the same in 2003 as it was throughout thelast three years at 99.7% (Figure 2-4). The compliance rate in group water schemes improved from97.8% in 2002 to 98.3% in 2003.
75
80
85
90
95
100
Public Water Supplies Group Water Schemes
%C
om
plia
nce
2001
2002
2003
Figure 2-4. Ammonium Compliance over the Period 2001 to 2003.
Not only has there been an overall reduction in the number of exceedances of the ammonium standardthere has also been a shift in the exceedances from gross, very serious and serious to moderate (Figure2-5). In other words, the number of moderate exceedances has increased at the expense of the moreserious breaches which is to be welcomed. Compliance with the ammonium standard remains high.Of the 41 sanitary authorities that monitored for aluminium in public water supplies 34 were fullycompliant (the same as in 2002). In 2003, group water schemes in 18 sanitary authorities (of 29) fullycomplied with the standard.

The Quality of Drinking Water in Ireland A Report for the Year 2003
11
0.00
0.05
0.10
0.15
0.20
0.25
0.30
0.35
<0.4 <0.6 <1.0 >1.0
Band (mg/l)
%E
xcee
dan
ces
200120022003
Figure 2-5. Distribution of Ammonium Exceedances over the Period 2001 to 2003 (measured as apercentage of the total samples analysed).
2.4. TOTAL & FAECAL COLIFORMS
Faecal coliforms originate in human and animal waste. Total coliforms include faecal bacteria and alsoother bacteria with similar properties which originate in soil and are non-faecal.
The risk of infection to consumers from drinking contaminated waters will vary depending on thenumbers of pathogenic organisms present (i.e., the actual disease-causing organisms). The number ofpathogens in a sewage-contaminated water depends on whether persons carrying the pathogens in theirbodies (so-called “carriers”) are present in the local population. As the latter is an unknown quantity,and as the positive identification of specific bacteria may be a very difficult task, an indirect approachis universally adopted. To ensure a high factor of safety when testing for coliform contamination, thepractice has been to monitor indicator organisms. These, by definition, should be (a) easily detectedand identified, (b) of the same origin as the pathogens (i.e., from the human or animal intestine), (c)present in far greater numbers than the pathogens, (d) present whenever the pathogens are likely to bepresent and (e) able to show the same or better survival characteristics than the pathogens and, ofcourse, they must not be in themselves pathogenic.
To date the universal indicator organisms have been coliforms, specifically Escherichia coli. Thesebacteria are of definite faecal origin (human and animal) and are excreted in vast numbers. Theirpresence in a water supply is taken as proof that faecal contamination has occurred and it is therefore adefinite indication of the risk that pathogens may be present. The absence of these faecal coliformsindicates strongly the probability that pathogens are absent.
Some coliform organisms are able to grow in soil and are not of faecal origin thus a second analysis iscarried out for the presence of total coliforms, giving an indication of the general level ofmicrobiological contamination of a water.
In 2003, 14,907 samples were analysed for total coliforms in 887 public water supplies representing anincrease of just over 0.5%. Compliance with the standard improved marginally from 93.3% in 2002 to93.4% in 2003 (Figure 2-6). Twenty two sanitary authorities achieved compliance rates of greater than95%, up from 18 in 2002) with full compliance achieved in Ennis Town Council and Galway CityCouncil. However, compliance was less than 90% in Donegal, Dublin City, Kerry, Longford and

The Quality of Drinking Water in Ireland A Report for the Year 2003
12
Monaghan. When analysed on a scheme by scheme basis 613 (69.0 %) supplies complied with thetotal coliforms standard in 2003.
A total of 5,230 samples were analysed for total coliforms in 1,784 group water schemes representingan increase of over 12% in the number of samples analysed. There was a further slight improvement inthe group water scheme compliance rate from 66.5% in 2002 to 67.1%. Although this is the thirdsuccessive improvement in the compliance rate and the compliance rate for group water schemes is atits highest since the preparation of the first report on the quality of drinking water in Irelandcompliance nonetheless remains unacceptably low. Furthermore, the rate of improvement seen in 2003is not sufficient and much greater improvements are required. Compliance rates of less than 50% werereported in Cavan (36%), North Cork (27%), Wexford (40%) and Wicklow (40%).
In the returns submitted to the Agency in 2003 a clear distinction was made between ‘public’ and‘private’ group water schemes by each sanitary authority. An analysis of these results clearly indicateswhere the quality deficiency lies. The compliance rate for total coliforms in ‘public’ group waterschemes was 86.3% in 2003 compared to 54.7% in ‘private’ group water schemes. While these resultsclearly indicate that serious quality problems exist in privately sourced group water schemes they alsoindicate that the ‘public’ group water schemes have some problems. ‘Public’ group water schemesreceive their water from public water supplies operated by the sanitary authorities. Thus, it would beanticipated that the compliance rate for public water supplies should be roughly similar to that of‘public’ group water schemes. Based on the results for 2003 it would appear that the microbiologicalquality of ‘public’ group water schemes is inferior to that of public water supplies (86.3% compliancein ‘public’ group water schemes compared to 93.4% in public water supplies). The reason for thisdifference most likely is due to the management regime of the distribution network. Failure toregularly flush and repair mains (as would be common in public water supplies) can lead to microbialregrowth in the distribution network and this may be causing the compliance rate to dip in the ‘public’group water schemes.
0
20
40
60
80
100
Public Water Supplies Group Water Schemes
%C
om
plia
nce
200120022003
Figure 2-6. Total Coliforms Compliance over the Period 2001 to 2003.
As discussed previously, faecal coliforms is a more appropriate indicator of faecal contamination of awater supply than total coliforms. The test for faecal coliforms is invariably carried out in tandem withthe analysis for total coliforms and as such the number of samples analysed for faecal coliforms isalmost identical to that of the total coliforms. Unlike the total coliforms where, if a sufficient numberof samples have been analysed, up to 5% of the samples can contain total coliforms with the supplystill being in compliance with the Regulations, the presence of a single faecal coliform in a watersupply is in breach of the Regulations and therefore unacceptable.

The Quality of Drinking Water in Ireland A Report for the Year 2003
13
There were 14,906 samples analysed for faecal coliforms in public water supplies in 2003 (an increaseof just over 0.5%). The number of samples failing to meet the standard fell from 235 in 2002 to 196 in2003. This has led to an improvement in the compliance rate from 98.4% in 2002 to 98.7% in 2003(Figure 2-7). This improvement is to be welcomed though the presence of faecal material in anysample of drinking water is unacceptable and sanitary authorities should strive to identify supplies thatare still failing to meet the standards. Action programmes should be prepared for these supplies tobring them into compliance. Of the 41 sanitary authorities that carried out monitoring for faecalcoliforms, 12 reported results that were fully compliant with the standards for all supplies within theirfunctional area. All other sanitary authorities reported compliance rates in excess of 95% with theexception of West Cork (94.8% compliance). When examined on a scheme by scheme basis 88.8%(788 of 887) of public supplies were free of faecal coliforms at all times they were monitored during2003. This is up from 84.6% in 2002.
A significant increase in the numbers of samples analysed for faecal coliforms in group water schemeswas also reported in 2003. A total of 5,222 samples were analysed for faecal coliforms representing anincrease of over 12% in the number of samples analysed. An improvement in the faecal coliformcompliance rate in group water schemes was reported in 2003 for the third successive year. Theoverall group water scheme compliance rate with the faecal coliform standard was 83.2% in 2003 upfrom 80.7% in 2002 (Figure 2-7). This rate of improvement must not only be sustained but must beincreased as the quality of drinking water in group water schemes is still unacceptably low. Rates ofcompliance were particularly low in Cavan (63%), South Cork (73%), West Cork (63%), Mayo (73%)and in particular, Wicklow (57%). As with the total coliform results the faecal results can be brokendown further into ‘public’ group water schemes and ‘private’ group water schemes. The quality of theformer is far superior (96.1%) to that of the latter (74.9%) and it is most objectionable that almost onequarter of samples from ‘private’ group water schemes were contaminated with faecal material in 2003.When analysed on a scheme by scheme basis the quality deficiency is even more apparent. Of the 780‘public’ group water schemes monitored in 2003, 720 (92.3%) were free of faecal coliforms at all timesthey were tested during 2003 while of the 1,004 ‘private’ group water schemes monitored, just 638(63.5%) were free of faecal coliforms. Thus, of those schemes monitored, 60 ‘public’ and 366‘private’ group water schemes were contaminated with human or animal waste during 2003.
50
60
70
80
90
100
Public Water Supplies Group Water Schemes
%C
om
plia
nce
200120022003
Figure 2-7. Faecal Coliform Compliance over the Period 2001 to 2003.
The overall improvement in compliance with the faecal coliform standard has led to a reduction inexceedances across all bands as shown on Figure 2-8 in particular the serious, very serious and gross

The Quality of Drinking Water in Ireland A Report for the Year 2003
14
bands. Compliance with the faecal coliform standard in both public and group water schemes in 2003in each sanitary authority is shown in Figures 2-9 and 2-10 respectively.
0.00
1.00
2.00
3.00
4.00
5.00
6.00
≤20 ≤200 ≤500 >500
Band (No./100ml)
%E
xcee
dan
ces
20012002
2003
Figure 2-8. Distribution of Faecal Coliform Exceedances over the Period 2001 to 2003 (measuredas a percentage of the total samples analysed).
As stated in previous years reports, the single most important characteristic of drinking water, as far asthe general health of the Irish public is concerned, is the bacteriological quality of the water. Themajority of exceedances of the drinking water standards are due to the presence of coliforms. Ofparticular concern is the presence of faecal coliforms in a water supply which as previously stated istaken as a definitive indication that faecal contamination of the water supply has occurred. An incidentwhere the presence of faecal coliforms is detected in concentrations greater than 20 cfu/100ml isclassified by the EPA as being serious. Table 2-2 presents a summary of the serious incidents of faecalcoliform contamination that occurred in 2003. There has been a further reduction in the number ofpublic water supplies with serious faecal coliform exceedances in 2003 compared to 2002. In total 34incidents of serious exceedances in 33 public water supplies were reported in 2003, down from 45 in2002 and 52 in 2001. However, of concern is that in 12 of these incidents follow-up monitoring wasnot reported to have taken place for more than 7 days. There were two serious incidents inLisdoonvarna/Killaney (Clare) and Cregane (North Cork) where no follow up samples were reportedfor the rest of the year following the detection of the initial serious exceedance. The former is due tothe fact that the supply was subsequently abandoned while there was no explanation for the absence offollow up monitoring in the Cregane (North Cork) supply.
Table 2-2: Analysis of Serious Faecal Coliforms Incidents in Public Water Supplies in 2003.
Summary of Serious Faecal Coliform Incidents No. of Incidents
Serious Faecal Coliform Incidents (>20/100ml) 34
Serious Incidents not Resampled within 7 days 12
Serious Incidents not Resampled in 2003 2

The Quality of Drinking Water in Ireland A Report for the Year 2003
15
Figure 2-9. Faecal Coliform Compliance in Public Water Supplies by County.

The Quality of Drinking Water in Ireland A Report for the Year 2003
16
Figure 2-10. Faecal Coliform Compliance in Group Water Schemes by County.

The Quality of Drinking Water in Ireland A Report for the Year 2003
17
2.5. COLOUR
Natural colour reflects the presence of complex organic molecules derived from vegetable (humic)matter such as peat, leaves, branches and so on. Its effect can be enhanced by the presence ofsuspended matter but this is normally eliminated in the analysis by filtration. Therefore, the morevegetable matter there is in water the greater the colour. Exceptionally, natural colour may arise fromthe presence of colloidal iron/manganese in a water but organic matter is almost always the cause.
Objections to high colour are generally made on aesthetic rather than health grounds. Consumers arereluctant to drink water, however safe, which has a strong colour. The 1998 EU Drinking WaterDirective, in contrast to its 1980 predecessor, did not set a quantitative standard for colour, effectivelyleaving the matter to the reactions of consumers.
Nonetheless, it must be noted that the presence of colour on a persistent basis in a water which is thendisinfected by chlorination is highly undesirable. This is because of the readiness with which thecolour-causing substances react with the added chlorine, giving rise to the presence of trihalomethanes.The latter compounds are a potential hazard to public health and will be discussed later in this chapter.
Due to its origin in vegetable matter the degree of colour in a water will vary. The highest colourlevels in rivers occur during floods, especially the first flood after a dry season when accumulateddeposits of decaying leaves and debris are swept up into the heavy flow.
A total of 13,942 samples were analysed for colour in 2003 (an increase of slightly over 2% comparedto 2002) of which 9,544 and 4,398 samples were analysed in public water supplies and group waterschemes respectively. The overall level of compliance rose from 90.4% in 2002 to 93.3% in 2003(Figure 2-11). This was due to an improvement in compliance in both public water supplies (up 2.5%)and group water schemes (up 4.5%).
75
80
85
90
95
100
Public Water Supplies Group Water Schemes
%C
om
plia
nce
200120022003
Figure 2-11. Colour Compliance over the Period 2001 to 2003.
Full compliance was achieved by 14 of the 37 sanitary authorities that carried out monitoring for colourin 2003, an improvement from 9 in 2002. Compliance remained low in Cavan (78%), Roscommon

The Quality of Drinking Water in Ireland A Report for the Year 2003
18
(82%) and Sligo Borough (85%). Although the compliance rate for colour improved in group waterschemes just 10 of the 26 sanitary authorities that carried out monitoring for colour were fullycompliant. Compliance was particularly poor in group water schemes in Cavan (53%) and Monaghan(66%).
The improvement in the overall level of compliance with the colour standard reversed the trend in2001-2002 and thus there was also a corresponding reduction in the percentage of exceedances acrossall bands (Figure 2-12). In particular, the number of gross exceedances (>150 mg/l Pt/Co) was reducedand just 9 such exceedances were reported in 2003.
0.00
1.00
2.00
3.00
4.00
5.00
6.00
7.00
<40 <80 <150 >150
Band (mg/l Pt/Co)
%E
xcee
dan
ces
2001
20022003
Figure 2-12. Distribution of Colour Exceedances over the Period 2001 to 2003 (measured as apercentage of the total samples analysed).
2.6. FLUORIDE
Fluoride arises almost exclusively from fluoridation of public water supplies and from industrialdischarges, although it occurs naturally in quite rare instances. Health studies have shown that theaddition of fluoride to water supplies at levels above 0.6mg/l F leads to a reduction in tooth decay ingrowing children and that the optimum beneficial effects were thought to occur around 1.0 mg/l3. Atlevels markedly over 1.5mg/l an inverse effect occurs and mottling of teeth (or severe damage at grosslevels) will arise. For this reason there is a constraint on fluoride levels, the effects of which vary withtemperature. In recent years some authors have questioned the practice of adding fluoride to drinkingwater on ethical and medical grounds. This important debate has been addressed by the Forum onFluoridation set up by the Minister for Health and Children in May 2000, which published its findingsin September 2002. An expert group was set up by the Minister in April 2004 charged with theimplementation of the recommendations of the forum.
The fluoride levels in fluoridated public water supplied in Ireland are legally restricted to the range 0.8-1.0 mg/l. In making the 1988 Drinking Water Regulations the then Minister for the Environment fixed1.0 mg/l F [1,000 µg/l F] as the MAC. This value is lower than the MAC set in both the 1980 and therevised 1998 EC Drinking Water Directives, which set a value of 1.5 mg/l. The lack of monitoring ingroup water schemes is due to the fact that while it is a legal requirement for public water supplies tobe fluoridated there is no such obligation on the sanitary authority in respect of group water schemes.
3A new target dose of between 0.6 and 0.8 mg/l F, with a target of 0.7 mg/l, was proposed by the Forum on Fluoridation in
September 2002 at which it was considered that the optimal beneficial effects occur.
The Quality of Drinking Water in Ireland A Report for the Year 2003
19
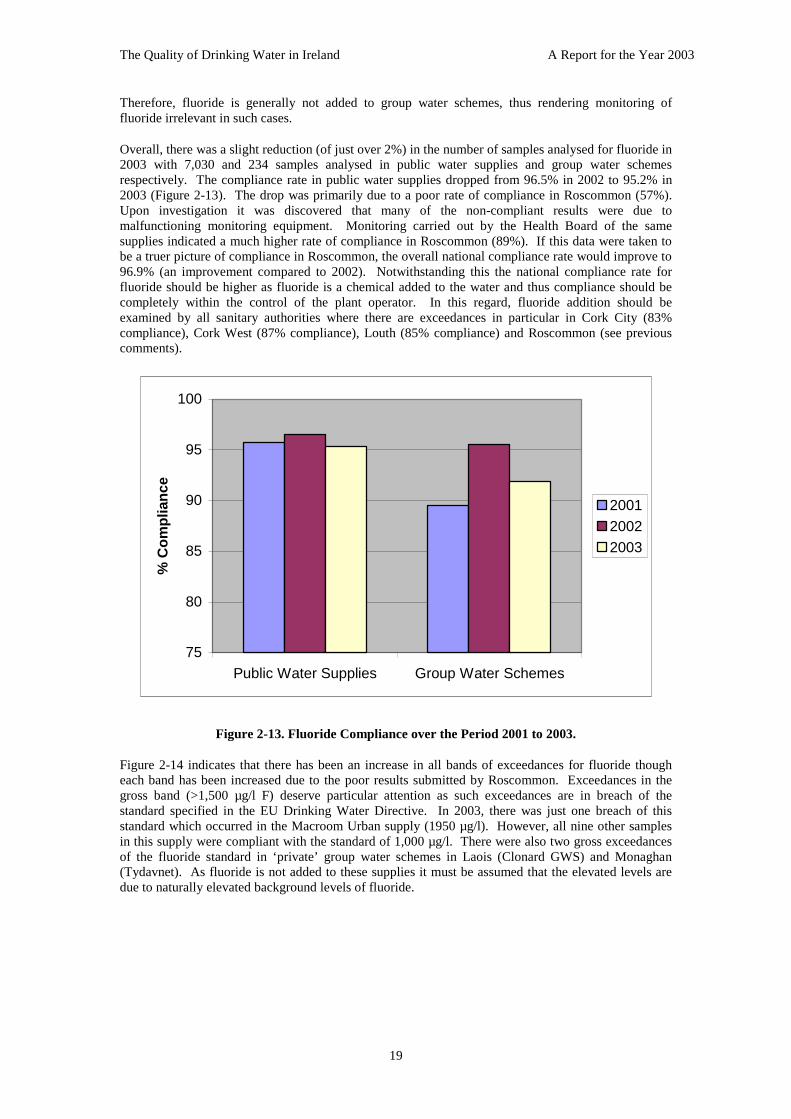
Therefore, fluoride is generally not added to group water schemes, thus rendering monitoring offluoride irrelevant in such cases.
Overall, there was a slight reduction (of just over 2%) in the number of samples analysed for fluoride in2003 with 7,030 and 234 samples analysed in public water supplies and group water schemesrespectively. The compliance rate in public water supplies dropped from 96.5% in 2002 to 95.2% in2003 (Figure 2-13). The drop was primarily due to a poor rate of compliance in Roscommon (57%).Upon investigation it was discovered that many of the non-compliant results were due tomalfunctioning monitoring equipment. Monitoring carried out by the Health Board of the samesupplies indicated a much higher rate of compliance in Roscommon (89%). If this data were taken tobe a truer picture of compliance in Roscommon, the overall national compliance rate would improve to96.9% (an improvement compared to 2002). Notwithstanding this the national compliance rate forfluoride should be higher as fluoride is a chemical added to the water and thus compliance should becompletely within the control of the plant operator. In this regard, fluoride addition should beexamined by all sanitary authorities where there are exceedances in particular in Cork City (83%compliance), Cork West (87% compliance), Louth (85% compliance) and Roscommon (see previouscomments).
75
80
85
90
95
100
Public Water Supplies Group Water Schemes
%C
om
plia
nce
200120022003
Figure 2-13. Fluoride Compliance over the Period 2001 to 2003.
Figure 2-14 indicates that there has been an increase in all bands of exceedances for fluoride thougheach band has been increased due to the poor results submitted by Roscommon. Exceedances in thegross band (>1,500 µg/l F) deserve particular attention as such exceedances are in breach of thestandard specified in the EU Drinking Water Directive. In 2003, there was just one breach of thisstandard which occurred in the Macroom Urban supply (1950 µg/l). However, all nine other samplesin this supply were compliant with the standard of 1,000 µg/l. There were also two gross exceedancesof the fluoride standard in ‘private’ group water schemes in Laois (Clonard GWS) and Monaghan(Tydavnet). As fluoride is not added to these supplies it must be assumed that the elevated levels aredue to naturally elevated background levels of fluoride.

The Quality of Drinking Water in Ireland A Report for the Year 2003
20
0.00
0.50
1.00
1.50
2.00
2.50
3.00
<1050 <1250 <1500 >1500
Band (ug/l)
%E
xcee
dan
ces
20012002
2003
Figure 2-14. Distribution of Fluoride Exceedances over the Period 2001 to 2003 (measured as apercentage of the total samples analysed).
2.7. HEAVY METALS
Heavy metals are a very important category of drinking water parameters and comprise principallyantimony, arsenic, beryllium, cadmium, chromium, cobalt, copper, lead, mercury, molybdenum, nickel,selenium, silver, tellurium, thallium, tin, titanium, uranium, vanadium and zinc. Arsenic, though non-metallic, is included for convenience as it is toxic and is generally referred to as a constituent of thisgroup. The term “heavy metals” is rather inaccurate and, indeed could be misleading. It arises fromthe high atomic weights of several metals in the broad group, although other metals in the same grouphave low atomic weights. Nonetheless, the term is both widely current and a useful descriptor. Inprevious years reports, compliance was based on a discussion of the four metals that are mostcommonly analysed (i.e., copper, zinc, lead and cadmium). The calculation of compliance with theheavy metals standards has been expanded in this report to include all heavy metals specified in the1988 Regulations i.e., Copper, Zinc, Silver, Arsenic, Cadmium, Chromium, Mercury, Nickel, Lead,Antimony and Selenium.
Sources of heavy metals include effluent discharges, distribution piping, or geological formations.Heavy metals are toxic to humans (to a greatly varying degree depending on the metal) and, to a lesserextent, fish. They bioaccumulate in fish and other animal tissue and are hence liable to enter thehuman food chain.
There were 18,138 and 2,154 samples analysed for the heavy metals in public water supplies and groupwater schemes respectively in 2003 representing an increase of over 40% in the monitoring carried out.Compliance in the public water supplies remained high at 99.9% in 2003 and there were just 15exceedance of the heavy metals standards. These were for copper (4), barium (4), cadmium (1),chromium (1) and lead (5). Similarly, the results for group water schemes were high with just 4exceedances for copper (3) and lead (1).

The Quality of Drinking Water in Ireland A Report for the Year 2003
21
90
92
94
96
98
100
Public Water Supplies Group Water Schemes
%C
om
plia
nce
200120022003
Figure 2-15. Heavy Metal Compliance over the Period 2001 to 2003.
2.8. IRON
Iron is present in significant amounts in soils and rocks, principally in insoluble forms. However,many complex reactions which occur naturally in ground formations can give rise to more solubleforms of iron which will therefore be present in water passing through such formations. Appreciableamounts of iron may therefore be present in ground waters. Serious problems can be caused indrinking water supplies by the presence of iron. Problems with iron are primarily aesthetic, as thesoluble (reduced) ferrous (Fe++) iron is oxidised in air to the insoluble ferric (Fe+++) form, resulting incolour or turbidity (or, in severe cases, precipitate formation). Laundry may become stained if washedin water with excessive iron and vegetables may become discoloured on cooking. Taste problems mayalso occur. When waters rich in iron are used to make tea (in which tannins are present) there may be areaction giving rise to off-colours which may in severe cases resemble that of ink.
Iron, along with manganese, is an abundant naturally-occurring metal which can exist in soluble andinsoluble states. Where iron occurs in the larger, treated public supplies it almost invariably arisesfrom distribution mains made of the metal, and concentrations tend to be not greatly above the MAC.In smaller supplies - the minor public ones and especially the group schemes - its presence is both morefrequent and more pronounced. Such waters are very largely derived from ground waters and the ironis present in the geological composition of the source area.
The problem with iron is that, in the ground, it exists in a reduced form which is soluble, and a wellwater when drawn may be clear, uncoloured and pleasant in appearance. However, on exposure to air -especially with agitation by stirring or boiling - the iron converts to the insoluble oxidised form. Thewater turns brown; it may become turbid; or it even may deposit solids in the container or, worse (fromthe domestic viewpoint), on food being cooked or clothes being washed. Hence its designation as a“nuisance” parameter.
There were 5,663 and 4,099 samples analysed for iron in public water supplies and group waterschemes respectively in 2003 representing an increase of over 20% in the level of monitoring. Overallcompliance improved from 92.8% in 2002 to 94.4% in 2003 (Figure 2-16). There was an improvementin the level of compliance in 2003 in public water supplies (up 1.3% to 96.0%) and group waterschemes (up 3.4% to 92.1%). In spite of the improvement full compliance was achieved in all publicwater supplies in just 5 (of 40) sanitary authorities and in group water schemes in 9 (of 24) sanitaryauthorities.

The Quality of Drinking Water in Ireland A Report for the Year 2003
22
75
80
85
90
95
100
Public Water Supplies Group Water Schemes
%C
om
plia
nce
2001
20022003
Figure 2-16. Iron Compliance over the Period 2001 to 2003.The World Health Organisation (WHO, 2003), in its review of the Guidelines for Drinking WaterQuality, states that a level of 2 mg/l in drinking water does not present a risk to human health.However, it also notes that the taste and appearance of drinking water will be affected at levels belowthis. Indeed, iron becomes a nuisance at a concentration of >0.3 mg/l Fe where it stains laundry andplumbing fixtures. It may be noted that the majority of exceedances in Irish drinking water are below0.8 mg/l [800 µg/l] which, although much below the figure mentioned by the WHO, is still four timesthe legal limit.
There has been a welcome reduction in the percentage of exceedances across all bands of exceedancesin 2003 (Figure 2-17). However, compliance remains poor in public water supplies in a number ofsanitary authority areas.
0.00
0.50
1.00
1.50
2.00
2.50
3.00
3.50
4.00
4.50
<400 <800 <1250 >1250
Band (ug/l)
%E
xcee
dan
ces
20012002
2003
Figure 2-17. Distribution of Iron Exceedances over the Period 2001 to 2003 (measured as apercentage of the total samples analysed).

The Quality of Drinking Water in Ireland A Report for the Year 2003
23
2.9. MANGANESE
As with iron, manganese is found widely in soils and is a constituent of many groundwaters. Similar toiron it may be brought into solution in reducing conditions and the excess metal will be later depositedas the water is reaerated. The general remarks for iron apply to manganese but the staining problemswith this metal may be even more severe, hence the quite stringent limits. A second effect of thepresence of manganese much above the limits is an unacceptable taste problem. There are no particulartoxicological connotations. The objections to manganese, in common with iron, are aesthetic.
There was an overall increase of over 17% in the number of samples analysed for manganese in 2003with 5,493 and 4,063 samples analysed in public water supplies and group water schemes, respectively.The overall compliance rate improved for the fourth successive year and now stands at 94.0% (up from93.5% in 2002). This improvement was due to an increase in the level of compliance with themanganese standard in both public water supplies (up 0.4% to 96.1%) and group water schemes (up2.7% to 91.2%).
75
80
85
90
95
100
Public Water Supplies Group Water Schemes
%C
om
plia
nce
2001
20022003
Figure 2-18. Manganese Compliance over the Period 2001 to 2003.
Though there was an overall reduction in the number of failures to meet the standards the percentage ofexceedances in the moderate and gross bands actually increased (Figure 2-19). Full compliance withthe manganese standard was achieved in 7 of the 39 sanitary authorities that carried out monitoring formanganese while 6 of the 23 sanitary authorities that carried out monitoring for manganese were fullycompliant. Poor levels of compliance were reported in public water supplies in Cork City (79%),Monaghan (78%) and Meath (71%) though a derogation was in place in Cork City for manganese.

The Quality of Drinking Water in Ireland A Report for the Year 2003
24
0.00
0.50
1.00
1.50
2.00
2.50
3.00
3.50
4.00
<100 <250 <500 >500
Band (ug/l)
%E
xcee
dan
ces
20012002
2003
Figure 2-19. Distribution of Manganese Exceedances over the Period 2001 to 2003 (measured as apercentage of the total samples analysed).
Manganese is primarily regarded as a “nuisance” parameter, that is, it poses problems of discoloration(both in the water and in laundry or cooking where the water is used) and, if concentrations are veryhigh, it may cause problems with taste and turbidity. Due to these largely aesthetic and domesticeffects its standard is quite low – 50 µg/litre. It has not been considered a hazard to consumer healthbut has been considered in detail by the WHO. This body has noted that its “acceptability threshold” is0.1 mg/litre [100 µg/l], i.e., twice the standard in the Regulations, as the problems mentioned are eithermild or imperceptible below 0.1 mg/l.
The WHO (WHO, 2003), in its review of the “Guidelines for Drinking Water Quality”, states that“there have been epidemiological studies that report adverse neurological effects following extendedexposure to very high levels in drinking water. However, there are a number of significant potentialconfounding factors in these studies and a number of studies have failed to observe adverse effectsfollowing exposure through drinking water”. Due to this the WHO revised its provisional health-basedguideline value to 0.4 mg/l [400 µg/l].
It should be noted that a water with an exceedance level anywhere near this provisional WHO valuewould be most unpalatable.
2.10. NITRATES
Relatively little of the nitrates found in natural waters is of mineral origin, most coming from organicand inorganic sources. Organic sources include waste discharges and the main inorganic source isartificial fertiliser. However, bacterial oxidation and fixing of nitrogen by plants can both producenitrates.
Interest is centred on nitrate concentrations for various reasons. Most importantly, high nitrate levels inwaters to be used for drinking will render them hazardous to infants as they may induce the “bluebaby” syndrome (methaemoglobinaemia). The nitrate itself is not a direct toxicant but is a healthhazard because of its conversion to nitrite which reacts with blood haemoglobin to causemethaemoglobinaemia.

The Quality of Drinking Water in Ireland A Report for the Year 2003
25
Eutrophication of water bodies due to excess nutrient loading is a major environmental issue in Ireland,as it causes adverse impacts on fish and other biota, on abstraction of waters for industrial or domesticuse and on recreational activities. Nitrates may cause particular eutrophication problems in estuaries,arising there primarily as a result of sewage and industrial discharges and due to losses fromagricultural land. The presence of nitrate in groundwaters is cause for suspicion of sewage pollutionor of excess levels of fertilisers or manure slurries spread on land.
There was little change in the numbers of samples analysed for nitrate in 2003 with a slight reductionin the number of samples analysed in public water supplies and a moderate increase in the number ofsamples analysed in group water schemes. A total of 4,853 samples in 749 supplies were analysed inpublic water supplies with just 19 of those samples failing to meet the standard (99.6% compliance).The number of exceedances in public water supplies dropped compared to 2002 where 30 exceedanceswere reported. The reason for this is that some of the supplies reporting breaches were abandoned assources and the improving results (or indeed the high rates of compliance) should not be interpreted assuggesting that nitrate levels in Irish waters are low as many of the elevated supplies are simplyabandoned rather than remediated. However, it is a welcome development that nitrate exceedanceswere reported in just 9 public water supplies in Ireland in 2003 (down from 14 in 2002). Fullcompliance with the nitrate standard was reported in 34 of the 40 sanitary authorities that monitored fornitrate in 2003 (an increase from 30 in 2002). Public water supplies in breach of the standard in 2002that were still in breach in 2003 include Conna Village and Glanworth (both North Cork), Lisnacru(South Cork), Castletownkinnagh (West Cork), Castlmitchell Housing and Kilmeade/Moatview (bothKildare) and Adramone (Waterford).
Of the 4,262 samples analysed for nitrate in 1,528 group water schemes just 35 samples (99.2%compliance) in 23 schemes failed to meet the standards. Though the overall rate of complianceremains unchanged from 2002 the number of group water schemes, all of which were privatelysourced, reporting nitrate exceedances has increased from 20 to 23 in 2003. Sanitary authorities inwhose functional area an exceedance of the nitrate standard was reported are highlighted on Figure 2-22.
90
92
94
96
98
100
Public Water Supplies Group Water Schemes
%C
om
plia
nce
2001
20022003
Figure 2-20. Nitrate Compliance over the Period 2001 to 2003.
Though compliance remains high a worrying trend is noticeable when the bands into which theexceedances are classified is examined (Figure 2-21). There appears to be a reduction in the number ofmoderate and serious exceedances and a concurrent increase in the number of very serious and gross

The Quality of Drinking Water in Ireland A Report for the Year 2003
26
exceedances. This indicates that those supplies that are exceeding are actually deteriorating and thatlevels of nitrates are rising in these supplies. This trend must be reversed and indeed all supplies withnitrate exceedances must be prioritised for the implementation of action programmes by the relevantsanitary authorities immediately.
0.00
0.05
0.10
0.15
0.20
0.25
0.30
0.35
0.40
≤55 ≤65 ≤75 >75
Band (mg/l)
%E
xcee
dan
ces
2000
20012002
Figure 2-21. Distribution of Nitrate Exceedances over the Period 2001 to 2003 (measured as apercentage of the total samples analysed).

The Quality of Drinking Water in Ireland A Report for the Year 2003
27
Figure 2-22. Number of Public Water Supplies (PWS) and Group Water Schemes (GWS) with Nitrate Exceedances in 2002

The Quality of Drinking Water in Ireland A Report for the Year 2003
28
2.11. NITRITE
Nitrites exist normally in very low concentrations and even in wastewater treatment plant effluentlevels are relatively low, principally because the nitrogen will tend to exist in the more reduced(ammonia; NH3) forms. Nitrite is an intermediate in the oxidation of ammonia to nitrate, and thisprocess can take place in soil. Sewage is a rich source of ammonia nitrogen, and as such waters whichshow an appreciable amount of nitrite are regarded as being of highly questionable quality andcontamination with sewage is suspected. Levels in unpolluted waters are normally low, below 0.03mg/l NO2
-. Values greater than this may indicate sewage pollution. The role of nitrite inmethaemoglobinemia has been discussed in the previous section on nitrate.
There were 8,181 samples analysed for nitrite in 2003, an increase of 3%, of which 4,282 and 3,896samples were from public water supplies and group water schemes respectively. The overall rate ofcompliance improved from 98.5% in 2002 to 99.4% in 2003 due to improving compliance in publicwater supplies (up 0.1% to 99.7%) and group water schemes (up 2% to 99.1%) (Figure 2-23). Fullcompliance with the nitrite standard was achieved in 32 (of 41) sanitary authorities for public watersupplies and 21 (of 28) sanitary authorities for group water schemes.
90
92
94
96
98
100
Public Water Supplies Group Water Schemes
%C
om
plia
nce
200120022003
Figure 2-23. Nitrite Compliance over the Period 2001 to 2003.
The rise in the overall rate of compliance has also led to a reduction in the percentage of samplesexceeding the standard across all bands of exceedances (Figure 2-24)

The Quality of Drinking Water in Ireland A Report for the Year 2003
29
0.00
0.10
0.20
0.30
0.40
0.50
0.60
0.70
≤0.15 ≤0.2 ≤0.4 >0.4
Band (ug/l)
%E
xcee
dan
ces
20012002
2003
Figure 2-24. Distribution of Nitrite Exceedances over the Period 2001 to 2003 (measured as apercentage of the total samples analysed).
2.12. ODOUR
Related to taste, a strong odour from a water for consumption may cause rejection on the part of theconsumer. Its cause is normally dissolved volatile organic compounds, small concentrations of whichmay have significant organoleptic (i.e., associated with the senses) effects.
The majority of odour incidences arise from the presence of excess chlorine in the waters delivered toconsumers. Care must be taken in interpreting odour non-compliances because of the fact thatchlorination is commonplace in public water supplies but is practised on a much reduced scale in thegroup water schemes.
Chlorine concentrations in drinking water, even when in excess, are not a direct hazard to theconsumer. A water which had toxic chlorine levels would be so totally foul and thus utterly repugnant,it would be rejected out of hand by the consumer. Chlorine in levels above the working targetconcentration of 0.1-0.2 mg/l (there is no statutory level for chlorine in drinking water) would make theodour and taste of the affected waters aesthetically unacceptable. Despite this, the World HealthOrganisation has issued a guideline value of 5 mg/l for chlorine in drinking water.
The significant drop in the level of monitoring for odour seen in 2002 was somewhat reversed in 2003with a slight increase in the numbers of samples analysed (up 3%). In total, 10,151 and 1,737 sampleswere analysed for odour in public water supplies and group water schemes respectively with an overallcompliance rate of 95.5% in 2003 down from 96.1% in 2002. Compliance in both public watersupplies and group water schemes deteriorated in 2003 (Figure 2-25). The former was down 0.2% to95.6% while the latter decreased by 2.4% to 95.2%. Compliance was low and in need of improvementin public water supplies in Leitrim (77% compliance), Roscommon (76% compliance) and Westmeath(69% compliance). The majority of exceedances were due to the presence of excessive amounts ofchlorine in the water. While the majority of these malodours in the water are not harmful to health theydo reduce consumer satisfaction and confidence in drinking water and should be avoided whereverpossible.

The Quality of Drinking Water in Ireland A Report for the Year 2003
30
90
92
94
96
98
100
Public Water Supplies Group Water Schemes
%C
om
plia
nce
200120022003
Figure 2-25. Odour Compliance over the Period 2001 to 2003.
2.13. TASTE
As with odour, taste is a parameter which can lead to adverse consumer reaction. While astringenttastes can be caused by the presence of excessive amounts of metals or dissolved salts, there are oftenother more serious problems which arise in such cases. Purely organoleptic (i.e., associated with thesenses) taste problems arise most commonly from algae and from phenols after chlorination. Decayingalgae masses can release trace organic compounds (including phenol) into the water which produceoffensive tastes after chlorination.
A total of 7,682 and 505 samples were analysed for taste in public water supplies and group waterschemes respectively in 2003 representing a modest increase of 2% in the level of monitoring. Therewas a reversal of the previous years improvement in compliance in both public water supplies andgroup water schemes (Figure 2-26) with compliance in public water supplies dropping by 1.3% to96.5% in 2003 while compliance in group water schemes also dropped by 1.6% to 98.0% in 2003.Again the majority of these exceedances relate to excessive amounts of chlorine in the water.Compliance was poor and in need of improvement in Ennis (88%) and Roscommon (76%).

The Quality of Drinking Water in Ireland A Report for the Year 2003
31
90
92
94
96
98
100
Public Water Supplies Group Water Schemes
%C
om
plia
nce
200120022003
Figure 2-26. Taste Compliance over the Period 2001 to 2003.
2.14. PH
pH is a measure of whether a liquid is acid or alkaline. The pH scale ranges from 0 (very acid) to 14(very alkaline). The range of natural pH in fresh waters extends from around 4.5, for acid, peaty uplandwaters, to over 10.0 in waters where there is intense photosynthetic activity by algae. However, themost frequently encountered range is 6.5-8.0.
In waters with low dissolved solids, which consequently have a low buffering capacity (i.e., lowinternal resistance to pH change), changes in pH induced by external causes may be quite dramatic.Extremes of pH can affect the palatability of a water but the corrosive effect on distribution systems isa more urgent problem. The control of pH is a critical component of water treatment and distributioninfluencing the effectiveness of coagulation, disinfection and the concentration of plumbing materials(such as lead, nickel and copper) in the final product.
There was an increase of 5% in the number of samples analysed for pH in both public water suppliesand group water schemes. A total of 10,030 and 4,615 samples were analysed for pH in public watersupplies and group water schemes respectively in 2003. There was a slight reduction in the combinedcompliance rate from 98.6% in 2002 to 98.4% in 2003. This was due to a decrease in the number ofsamples in group water schemes compliant with the standard which resulted in a decrease in groupwater scheme compliance from 98.2% in 2002 to 97.4% in 2003. The level of compliance in publicwater supplies remained unchanged at 98.8% (Figure 2-27). The rate of compliance was 95% orgreater in all sanitary authorities with the exception of Waterford County (87%). Full compliance wasachieved in 24 of the 41 sanitary authorities that carried out monitoring for pH in pubic water supplieswhile 13 of the 30 sanitary authorities that carried out monitoring for pH in group water schemes werefully compliant.

The Quality of Drinking Water in Ireland A Report for the Year 2003
32
90
92
94
96
98
100
Public Water Supplies Group Water Schemes
%C
om
plia
nce
2001
20022003
Figure 2-27. pH Compliance over the Period 2001 to 2003.
Almost three quarters of the exceedances reported were due to low pH and there was an increase in allbands of exceedances in 2003 (Figure 2-28). Although the pH of drinking water can be significantlyaffected by some elements of the treatment process, there is virtually always a compensatingadjustment of the pH before the water is distributed. It follows that the majority of pH exceedancesreflect the geographical influences on the source, usually causing a lowering of the pH rather than anincrease. However, as noted in previous reports, the lower pH levels found were not of any greatconsequence as far as the consumer is concerned, as pH is not a “problem” parameter.
0.00
0.20
0.40
0.60
0.80
1.00
1.20
<5.5 <6.0 >9.0 >9.5
Band (pH units)
%E
xcee
dan
ces
20012002
2003
Figure 2-28. Distribution of pH Exceedances over the Period 2001 to 2003 (measured as apercentage of the total samples analysed).

The Quality of Drinking Water in Ireland A Report for the Year 2003
33
2.15. TRIHALOMETHANES
Trihalomethanes (THMs), as the name indicates, are derivatives of the simplest organic compound -methane, CH4 - in which three of the hydrogen atoms are substituted by halogen atoms. The principalhalogens are fluorine (F2), chlorine (Cl2), bromine (Br2) and iodine (I2), but while many combinationsare theoretically possible, the term trihalomethanes is applied to four specific compounds containingonly chlorine and/or bromine as the halogen elements. The four compounds are chloroform (CHCl3),bromodichloromethane (CHBrCl2), dibromochloromethane (CHBr2Cl) and bromoform (CHBr3). Astwo of the four substances are chloroform and bromoform, the alternative designation haloforms is alsoquite frequently applied to the group.
Chlorine (or appropriate compounds of it) is undoubtedly the most important chemical used in watertreatment in Ireland today as it has been in the past. Although it is a highly poisonous gas in its pureform and a powerful oxidising agent, chlorine in very dilute solution is a most effective agent for thedisinfection of water. It is very efficient at destroying those bacteria which originate in human oranimal waste and which cause wholly undesirable and dangerous contamination of drinking water.
As a powerful oxidising agent, chlorine also breaks down the complex – and inert – organic moleculeswhich are the colouring agents, forming smaller, reactive entities. These entities react with chlorine(and with bromine derived from the oxidation by chlorine of bromide naturally present) to form theTHM compounds, the most abundant of which is chloroform. There is thus a fairly straightforwardrelationship between the degree of colour in the water prior to chlorination and the quantities of THMs
present following chlorination. If colour is present at the point of chlorination, THMs are likely beformed.
THM compounds are undesirable in drinking water for two reasons. Firstly the actual compoundsthemselves may pose a hazard to the health of the consumer if present in excessive amounts aschloroform is a suspected carcinogen. Secondly, the presence of the THM group may be an indicatorof the possible presence of other organic by-products of chlorination in trace amounts. The WHOadvises that “In controlling trihalomethanes, a multistep treatment system should be used to reduceorganic trihalomethane precursors, and primary consideration should be given to ensuring thatdisinfection is never compromised”.
Trihalomethanes were not required to be monitored under the 1988 Regulations and as such there wasno standard for the parameter prior to the introduction of the 2000 Drinking Water Regulations whichintroduced an interim standard for total trihalomethanes of 150µg/l which takes effect from 1st January2004 and will be replaced by the standard of 100µg/l from 1st January 2007.
It is difficult to make a complete assessment of the true compliance with the THM parametric value asthe results submitted to the EPA are not representative of all sanitary authorities (not all sanitaryauthorities have carried out THM monitoring) and thus may not be representative of the country as awhole.
There was a slight reduction (9%) in the number of samples analysed for trihalomethanes in 2003 with704 samples analysed in public water supplies, 5 in ‘public’ group water schemes and a further 76 in‘private’ group water schemes. In total 294 water supplies in 23 sanitary authorities were monitoredfor trihalomethanes in 2003 representing approximately 10% of the total number of water supplies in2003. As such, it is difficult to make a complete assessment of the true compliance with the THMparametric value as the results submitted to the EPA are not representative of all sanitary authorities(not all sanitary authorities have carried out THM monitoring) and thus may not be representative ofthe country as a whole. Notwithstanding this limitation, of the 785 samples analysed for THMs in2003, 35 samples in 22 public water supplies and 3 ‘private’ group water schemes reported values inexcess of the interim standard that was introduced on 1 January 2004. Furthermore, examination ofthese results in comparison with the long term standard to be introduced on 1 January 2007 indicatesthat 102 samples in 43 public water supplies and 7 group water schemes are not currently meeting thisstandard of 100 µg/l. In other words just over 17% of water supplies are currently not in a position tomeet the relevant standards. If the results to date are representative of the rest of the country it is clearthat corrective action will be necessary in a significant number of supplies if the incoming parametricvalues are to be adhered to. Attention should focus on small surface water supplies where there is littleor no treatment (apart from disinfection).

The Quality of Drinking Water in Ireland A Report for the Year 2003
34
2.16. TURBIDITY
Turbidity in water arises from the presence of very finely divided solids, called colloids (which are notfilterable by routine methods). The existence of turbidity in water will affect its acceptability toconsumers and it will also affect markedly its utility in certain industries. The particles causing theturbidity may also interfere with the treatability of waters having adverse consequences for thedisinfection process. As turbidity can be caused by sewage matter in water, there is a risk thatpathogenic organisms could be shielded by the particulate matter and hence escape the action of thedisinfectant.
There were 13,418 samples analysed for turbidity in 2003, an increase of over 6% in the number ofsamples analysed. A total of 8,940 and 4,478 samples were analysed in public water supplies andgroup water schemes respectively. The combined compliance rate for turbidity increased from 96.9%in 2002 to 98.0% in 2003. The improvement was due to an increase in the compliance rate in publicwater supplies from 97.9% in 2002 to 99.0% in 2003 and in group water schemes from 94.8% in 2002to 96.0% in 2003 (Figure 2-29). The higher rate of compliance in public water supplies was due to thehigher degree of treatment in such supplies. Full compliance in public water supplies with the turbiditystandard was achieved in 16 of the 41 sanitary authorities that carried out turbidity monitoring (up from15 in 2002) while 10 of the 30 sanitary authorities that carried out turbidity monitoring in group waterschemes were fully compliant (unchanged from 2002). Just one sanitary authority reported acompliance rate of <95% in public water supplies (Cavan – 90%) while compliance was less than 95%in group water schemes in Cavan (86%), Donegal (90%) and Laois (75%).
75
80
85
90
95
100
Public Water Supplies Group Water Schemes
%C
om
plia
nce
200120022003
Figure 2-29. Turbidity Compliance over the Period 2001 to 2003.
The overall reduction in the number of exceedances of the turbidity standard has led to a reduction inthe percentage of exceedances across each band of exceeedances (Figure 2-30).

The Quality of Drinking Water in Ireland A Report for the Year 2003
35
0.00
0.50
1.00
1.50
2.00
2.50
3.00
<20 <40 <50 >50
Band (mg/l SiO2 or NTUs)
%E
xcee
dan
ces
20012002
2003
Figure 2-30. Distribution of Turbidity Exceedances over the Period 2001 to 2003 (measured as apercentage of the total samples analysed).
2.17. CRYPTOSPORIDIUM
Cryptosporidium is a small (microscopic) protozoan parasite present in faecal material that haspathogenic effects in both children and adults when it enters the gastrointestinal tract and causes aninfection termed cryptosporidiosis. Cryptosporidiosis can cause fever, stomach upsets, weight loss anddiarrhoea and can be fatal in the young and old and those with weakened immune systems.Cryptosporidium is protected by an outer shell (cyst) permitting it to survive for long periods outsidethe body. The cyst is very resistant to destruction by chlorine and other disinfectants, although it isdestroyed by boiling water. Outbreaks of cryptosporidiosis caused by its presence in drinking watersupplies have been reported in the US and other countries and in more recent times a number of smalloutbreaks have been reported in Ireland. From 1 January 2004 cryptosporidiosis became a notifiabledisease under the Infectious Disease Regulations. This means that all cases of cryptosporidiosisidentified by a laboratory must be notified to the National Disease Surveillance Centre (NDSC).Information on notifications is available on the NDSC web-site (www.ndsc.ie).
There are no standards in current Irish legislation concerning Cryptosporidium in drinking wateralthough a circular letter was issued by the Department of Environment and Local Government (L7/98)which addresses the issue of monitoring of water supplies for Cryptosporidium oocysts. This circularstates that water supplies should be monitored for Clostridium perfringens. Where the level ofClostridium perfringens exceeds 0 per 100 ml, consideration should be given to monitoring forCryptosporidium in raw and treated water. Based on monitoring submitted to the Agency in 2003, atotal of 2,828 samples were analysed for Clostridium perfringens of which 14 samples in 11 publicwater supplies and 499 samples in group water schemes exceeded the guideline of 0 per 100 ml. Of the11 public water supplies, monitoring for Cryptosporidium was subsequently carried out in just 2supplies. No monitoring for Cryptosporidium was subsequently carried out in any of the group waterschemes.
A total of 135 samples were analysed for Cryptosporidium in 25 public water supplies and 3 groupwater schemes in 2003. Only 1 sample taken from the Galway City supply detected the presence ofCryptosporidium at a concentration of 1 oocyst per 10 L. However, it was not detected in any other ofthe 23 samples analysed from the supply in 2003.
The 2000 Regulations, which came into force on January 1st, 2004, contain a general provision thatwater “is free from any micro-organisms and parasites and from any substances which, in numbers orconcentrations, constitute a potential danger to public health”. There is also an indirect requirementfor monitoring of Cryptosporidium in the new Regulations. Where levels of Clostridium perfringens

The Quality of Drinking Water in Ireland A Report for the Year 2003
36
are detected in excess of the standard of 0 per 100 ml, “the supply shall be investigated to ensure thatthere is no potential danger to human health arising from the presence of pathogenic micro-organismse.g. Cryptosporidium”.
In the UK there is a treatment standard of 1 oocyst per 10 litres which, it must be stressed, is a not ahealth related standard due to the wide variation in susceptibility throughout the population. InNorthern Ireland there is a ‘formal notification threshold’ of 1 oocyst per 10 litres and an ‘alert level’of 0.1 oocyst per 10 litres. Experience in the UK has shown that there is evidence that where outbreaksof cryptosporidiosis have occurred the concentrations of oocysts were in excess of 1 oocyst per 10litres. The UK approach to risk reduction is centred on the requirement to install and operate physicalbarriers to optimise removal of Cryptosporidium from water supplies. The approach in NorthernIreland and Scotland has been one of risk assessment whereby the most vulnerable treatment works areidentified and prioritised for upgrading to suitable standards.
A draft report on waterborne cryptosporidiosis has been prepared by the National Disease SurveillanceCentre (NDSC, 2002) which includes a number of recommendations in relation to Cryptosporidiumsurveillance, health board and local authority response, prevention and education about the risksassociated with Cryptosporidium. In particular the Agency welcomes the recommendation in the draftreport that a risk assessment approach be adopted in relation to Cryptosporidium and its possiblepresence in water supplies. Increased monitoring and reporting of occurrence of the parasite will aidimproved source protection and ultimately to a reduction in the occurrence of cryptosporidiosis.
There is an established relationship between elevated turbidity in a drinking water and the presence ofCryptosporidium oocysts. The 1988 Regulations have a standard of 4.0 NTU’s for turbidity in treatedwater which is replaced in the 2000 Regulations by “acceptable to consumers and no abnormal change”with the following note: “In the case of surface water treatment, a parametric value not exceeding 1.0NTU in the water ex treatment works must be strived for”. Elevated levels of turbidity (above 1.0NTU) may indicate the failure of the treatment process to remove turbidity particles and hence mayindicate that Cryptosporidium oocysts have bypassed the treatment process. In the UK, the BouchierReport (Bouchier et al., 1998) recommended that increases in turbidity in the final waters shouldtrigger monitoring for Cryptosporidium.
2.18. THE EUROPEAN COMMUNITIES (DRINKING WATER)REGULATIONS, 2000
INTRODUCTION
The European Communities (Drinking Water) Regulations, 2000 introduce comprehensive changes tothe monitoring and maintenance of drinking water in Ireland. Details of the changes in terms ofmonitoring requirements and associated corrective action have already been discussed in Section 1.2and the new parameters that will be required to be monitored in 2004 were outlined. In this sectionthese new parameters are discussed in more detail and the level of monitoring of these parameters in2003 is described. However, it must be noted that none of the parameters discussed below wererequired to be monitored until 1 January 2004 and hence absence of monitoring of these parameters atpresent does not indicate non-compliance or otherwise with the existing Regulations. Trihalomethaneshave not been included in the discussion below as they were dealt with separately in section 2.15.
OVERALL COMPLIANCE WITH THE NEW PARAMETRIC VALUES
The monitoring results submitted for 2003 were compared to the parametric values specified in the2000 Regulations. This analysis included all public water supplies and group water schemes serving>50 persons (it was not possible to identify supplies serving <50 persons that supplied water as part ofa commercial or public activity). Compliance with the microbiological parameters in the 2000Regulations was 95.4% based on the data submitted in 2003 (Table 2-3).
Table 2-3. Compliance with the Microbiological Parameters in the 2000 Regulations (based onmonitoring data for the 1988 Regulations).
Parameter No. of Samples No. of Exceedances % ComplianceE. coli 18,129 832 95.4Enterococci 2 1 50.0
Total 18,131 833 95.4
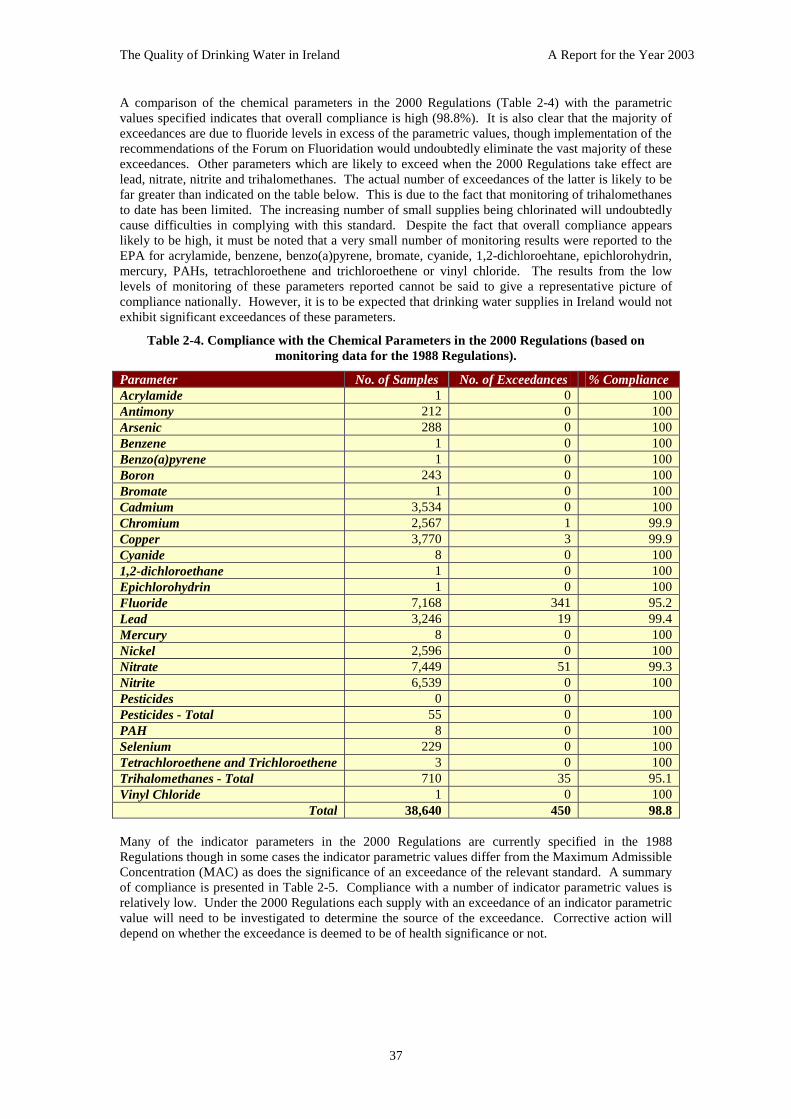
The Quality of Drinking Water in Ireland A Report for the Year 2003
37
A comparison of the chemical parameters in the 2000 Regulations (Table 2-4) with the parametricvalues specified indicates that overall compliance is high (98.8%). It is also clear that the majority ofexceedances are due to fluoride levels in excess of the parametric values, though implementation of therecommendations of the Forum on Fluoridation would undoubtedly eliminate the vast majority of theseexceedances. Other parameters which are likely to exceed when the 2000 Regulations take effect arelead, nitrate, nitrite and trihalomethanes. The actual number of exceedances of the latter is likely to befar greater than indicated on the table below. This is due to the fact that monitoring of trihalomethanesto date has been limited. The increasing number of small supplies being chlorinated will undoubtedlycause difficulties in complying with this standard. Despite the fact that overall compliance appearslikely to be high, it must be noted that a very small number of monitoring results were reported to theEPA for acrylamide, benzene, benzo(a)pyrene, bromate, cyanide, 1,2-dichloroehtane, epichlorohydrin,mercury, PAHs, tetrachloroethene and trichloroethene or vinyl chloride. The results from the lowlevels of monitoring of these parameters reported cannot be said to give a representative picture ofcompliance nationally. However, it is to be expected that drinking water supplies in Ireland would notexhibit significant exceedances of these parameters.
Table 2-4. Compliance with the Chemical Parameters in the 2000 Regulations (based onmonitoring data for the 1988 Regulations).
Parameter No. of Samples No. of Exceedances % ComplianceAcrylamide 1 0 100Antimony 212 0 100Arsenic 288 0 100Benzene 1 0 100Benzo(a)pyrene 1 0 100Boron 243 0 100Bromate 1 0 100Cadmium 3,534 0 100Chromium 2,567 1 99.9Copper 3,770 3 99.9Cyanide 8 0 1001,2-dichloroethane 1 0 100Epichlorohydrin 1 0 100Fluoride 7,168 341 95.2Lead 3,246 19 99.4Mercury 8 0 100Nickel 2,596 0 100Nitrate 7,449 51 99.3Nitrite 6,539 0 100Pesticides 0 0Pesticides - Total 55 0 100PAH 8 0 100Selenium 229 0 100Tetrachloroethene and Trichloroethene 3 0 100Trihalomethanes - Total 710 35 95.1Vinyl Chloride 1 0 100
Total 38,640 450 98.8
Many of the indicator parameters in the 2000 Regulations are currently specified in the 1988Regulations though in some cases the indicator parametric values differ from the Maximum AdmissibleConcentration (MAC) as does the significance of an exceedance of the relevant standard. A summaryof compliance is presented in Table 2-5. Compliance with a number of indicator parametric values isrelatively low. Under the 2000 Regulations each supply with an exceedance of an indicator parametricvalue will need to be investigated to determine the source of the exceedance. Corrective action willdepend on whether the exceedance is deemed to be of health significance or not.

The Quality of Drinking Water in Ireland A Report for the Year 2003
38
Table 2-5. Compliance with the Indicator Parameters in the 2000 Regulations (based onmonitoring data for the 1988 Regulations).
Parameter No. of Samples No. of Exceedances % ComplianceAluminium 7,486 533 92.9Ammonium 7,230 32 99.6Chloride 4,021 1 99.9Clostridium perfringens 2,189 307 86.0Colour 12,112 Note 1Conductivity 14,610 2 99.9pH 12,795 550 95.7Iron 7,955 414 94.8Manganese 7,852 413 94.7Odour 11,029 471 95.7Oxidisability 6 0 100Sulphate 3,312 0 100Sodium 991 5 99.5Taste 7,969 280 96.5Colony Count 22°C 4,870 Note 1Coliform Bacteria 18,133 2134 88.2Total Organic Carbon 220 Note 1Turbidity 11,600 188 98.4
Total (Note 2) 117,178 5,330 95.5Note 1: No indicator parametric value is specified for these parameters in the 2000 Regulations.Note 2: The totals specified exclude those parameters that do not have a parametric value as does theoverall compliance rate for the indicator parameters.
NEW PARAMETERS INTRODUCED IN THE 2000 REGULATIONS
Several new parameters are introduced in the 2000 Regulations. A brief description of each isprovided. There has been practically no monitoring of these new parameters in 2003 with theexception of Clostridium perfringens.
MICROBIOLOGICAL PARAMETERS
Enterococci
Enterococci originate in both animal and human faeces and are mainly used as an indicator of faecalpollution of a water supply although they do have some intrinsic pathogenic properties. As they can bereliably and easily determined their estimation is useful in clarifying the position in waters which showno E. coli but large numbers of coliform bacteria as a group. In the 1988 Drinking Water Regulationsthe relevant parameter was Faecal Streptococci but in the 2000 Regulations this has been replaced bythe broader parameter Enterococci. The ‘Parametric Value’ in the 2000 Regulations for Enterococci is0 per 100 ml.
CHEMICAL PARAMETERS
Acrylamide
Acrylamide is a highly toxic carcinogenic substance that can be absorbed through unbroken skin.Polyacrylamide is used as a flocculant aid in water treatment and the polymeric substance inevitablycontains traces of the acrylamide monomer. The WHO Guidelines note that “the most importantsource of drinking water contamination by acrylamide is the use of polyacrylamide flocculants thatcontain residual acrylamide monomer” and that “concentrations in drinking water can be controlledby product and dose specification”. The ‘Parametric Value’ in the 2000 Regulations for acrylamide is0.10µg/l.

The Quality of Drinking Water in Ireland A Report for the Year 2003
39
Benzene
Benzene is a constituent of some petroleum products, it originates from industrial raw materials and isalso used as a solvent. Benzene is a carcinogenic substance, which affects the central nervous system.Pollution of water from industrial sources as well as emissions from motor vehicles account for most ofthe benzene in the aquatic environment. The ‘Parametric Value’ in the 2000 Regulations for benzene is1.0 µg/l.
Benzo(a)pyrene
Benzo(a)pyrene is a synthetic organic compound formed by pyrolysis or combustion of organicmaterials. Benzo(a)pyrene is a carcinogenic and mutagenic substance which is highly undesirable indrinking water, although food is the main source of human exposure to this substance. The ‘ParametricValue’ in the 2000 Regulations for benzo(a)pyrene is 0.010µg/l.
Bromate
Bromate occurs in water when bromide ions present in water are oxidised by ozone and some otheroxidising agents (possibly chlorine). It is both carcinogenic and mutagenic. The ‘Parametric Value’ inthe 2000 Regulations for bromate is 1.0 µg/l.
1,2-dichloroethane
1,2-dichloroethane is a synthetic organic solvent that is used in various industries. It is a toxicsubstance that causes a variety of ill-effects in humans including eye damage, dermatitis and narcoticeffects. The ‘Parametric Value’ in the 2000 Regulations for 1,2-dichloroethane is 3.0 µg/l.
Epichlorohydrin
Epichlorohydrin is a synthetic chlorinated solvent. It is a toxic substance which is a strong skin irritantand which can cause kidney and other damage. The ‘Parametric Value’ in the 2000 Regulations forepichlorohydrin is 0.10µg/l.
Tetrachloroethene and Trichloroethene
Tetrachloroethene is a synthetic solvent used in the dry cleaning industry and for degreasing metals. Itis a toxic solvent, which can cause narcosis, dermatitis and ultimately fatal intoxication.Trichloroethene is also a synthetic solvent used in various industrial and manufacturing processes, indry cleaning and for degreasing metals. It is a potential carcinogen and causes narcosis and effectssimilar to alcohol inebriation. The ‘Parametric Value’ in the 2000 Regulations for the sum oftetrachloroethene and trichloroethene is 10µg/l.
Vinyl Chloride
Vinyl chloride is a synthetic gaseous compound which polymerises very rapidly and is an importantraw material in the manufacture of plastics. It is also used as a refrigerant. Vinyl chloride, being veryvolatile, can cause local frostbite if spilled on skin. It is also a suspected causative agent of livercancer. The ‘Parametric Value’ in the 2000 Regulations for vinyl chloride is 0.50µg/l.
INDICATOR PARAMETERS
Clostridium perfringens
Clostridia are anaerobic spore-forming organisms, largely but not solely of intestinal origin. Theirspores can survive in water much longer than organisms of the coliform group and they are much moreresistant to disinfection. The WHO Guidelines note that “Their presence in disinfected watersmay…indicate deficiencies in treatment and that disinfection-resistant pathogens could have survivedtreatment” and adds the observation that they are indicative of intermittent or remote contamination,with the caution that “Because they tend to survive and accumulate, they may be detected long after

The Quality of Drinking Water in Ireland A Report for the Year 2003
40
and far from the pollution and thus give rise to false alarms”. The ‘Parametric Value’ in the 2000Regulations for Clostridium perfringens is 0 per 100 ml. In 2003, 2,189 samples were analysed forClostridium perfringens in supplies that are covered by the 2000 Regulations of which 307 were inexcess of the indicator parametric value.
2.19. PARAMETERS WITH REVISED STANDARDS IN THE 2000REGULATIONS
The European Communities (Drinking Water) Regulations, 2000, introduce revised standards termed‘parametric values’ for a number of parameters that already have standards in the 1988 Regulations.Table 2-6 details those parameters for which the standard has been revised in the 2000 Regulations(which become effective in 2004). An assessment is carried out comparing compliance with thecurrent standard to that of the revised standard for each of the parameters listed.
Table 2-6. Parameters where the Standard has changed in S.I. No. 439 of 2000.
Parameter S.I. No. 81 of 1988EC (Quality of WaterIntended for Human
Consumption) Regulations1988 MAC
S.I. No. 439 of 2000EC (Drinking Water)
Regulations 2000Parametric Value
Comments
Antimony 10 µg/L 5.0 µg/L More stringent standardArsenic 50 µg/L 10 µg/L More stringent standardCopper 3000 µg/L 2000 µg/L See text for commentLead 50 µg/L 10 µg/L 25 µg/L – interim standard
to be achieved by 2004Nickel 50 µg/L 20 µg/L More stringent standardNitrite 0.1 mg/L 0.5 mg/L Less stringent standardPAH 0.2 µg/L 0.1µg/L More stringent standardBoron 2000 µg/L 1.0 mg/L More stringent standardSodium 150 mg/L 200 mg/L Less stringent standardpH 6.0 – 9.0 6.5 – 9.5 pH range has changed
Antimony
Antimony is a naturally occurring trace element used in the metal industry and in flame retardantmaterials. Antimony can occur naturally in water from weathering of rocks but is more likely to arisefrom industrial effluents. The standard in the 2000 Regulations for antimony is now 5µg/l, which ishalf the MAC in the 1988 Regulations. None of the 212 samples analysed for antimony during 2003were in breach of the parametric value in the 2000 Regulations.
Arsenic
There has been a five-fold reduction in the standard from 50 µg/l to 10 µg/l. There has been asignificant increase in the research database for arsenic over the last 10 years. These studies haveshown that arsenic is one of the few substances shown to cause cancer in humans through consumptionin drinking water. Arsenic is widely distributed in the earth’s crust and according to the WHOGuidelines “it is introduced into water through the dissolution of minerals and ores, from industrialeffluents and from atmospheric deposition; concentrations in groundwater in some areas aresometimes elevated as a result of erosion from natural sources”. As such arsenic may be a problem ingroundwater sources where arsenic is a constituent of the geology. However, none of the 288 samplesanalysed for arsenic during 2003 were in breach of the parametric value in the 2000 Regulations.
Copper
The copper standard in the 2000 Regulations has been revised from the standard in the 1988Regulations. In the 1988 Regulations there are two standards that relate to copper depending on wherethe sample has been taken. A standard of 500 µg/L relates to samples taken at the outlet of pumping

The Quality of Drinking Water in Ireland A Report for the Year 2003
41
and/or treatment works and substations while a standard of 3,000 µg/L relates to samples taken afterthe water has been standing in the piping and at the point where the water is made available to theconsumer. The standard of 2,000 µg/L in the 2000 Regulations applies to a sample of water intendedfor human consumption obtained by an adequate sampling method (to be determined by the Minister)at the tap and the sample is to be taken so as to be representative of a weekly average value ingested byconsumers and to take account of the occurrence of peak levels that may cause adverse effects onhuman health. Consequently, a comparison between compliance with the current standard and therevised standard is not possible.
Lead
The 1998 Drinking Water Directive, in line with WHO recommendations, sets a revised limit of 10 µg/lfor lead – one fifth of the current standard. As there is still a significant amount of lead piping inpremises EU-wide it was appreciated that some Member States may have difficulty initially in meetingthe revised lead limit, and the Directive takes account of this by setting an interim limit of 25 µg/l(which is effective from 1st January 2004 until 25th December 2013) whereupon the standard of 10 µg/lmust be met. This “Parametric Value” applies to a sample of water intended for human consumptionobtained by an adequate sampling method at the tap. It is to be taken so as to be representative of aweekly average value ingested by consumers and to take account of the occurrence of peak levels thatmay cause adverse effects on human health. The EPA Handbook on Implementation for SanitaryAuthorities recommends that sanitary authorities use the Random Day Time sampling method todetermine compliance with the parametric value. A comparison of the 2003 results with the standardfrom the 1988 Regulations, the 2000 interim and long term standard is presented on Table 2-7.However, care must be taken in interpreting these results as sanitary authorities currently fully flush thetap prior to taking a sample for lead while the recommended method samples the first litre of waterfrom the tap prior to flushing. As such the actual number of lead exceedances is expected to be higherwhen this method of sampling is in full use.
Table 2-7. Compliance with the current, interim and long term lead standard.
Standard No. of Exceedances
PWS GWS
Percentage Compliance
PWS GWS
1988 Regulations – 50 µg/l 5 1* 99.8% 99.8%
2000 Regulations – Interim Standard of 25 µg/l 19 0 99.4% 100%
2000 Regulations – Long Term Standard – 10 µg/l 57 4 98.1% 99.4%
*this exceedance was in a supply exempt from the 2000 Regulations
Nickel
The primary sources of nickel are minerals and industrial wastes, although drinking water samples canbe contaminated by nickel as a result of nickel coated tap fittings. A total of 2,596 samples wereanalysed for nickel in supplies covered by the 2000 Regulations none of which were in breach of the1988 standard of 50 µg/l or the 2000 standard of 20 µg/l. As with the lead standard the EPAHandbook on Implementation for Sanitary Authorities recommends that sanitary authorities use theRandom Day Time sampling method to determine compliance with the parametric value. As such, caremust be taken in interpreting these results as sanitary authorities currently fully flush the tap prior totaking a sample for nickel while the recommended method samples the first litre of water from the tapprior to flushing. As such the actual number of nickel exceedances may be higher when this method ofsampling is in full use.

The Quality of Drinking Water in Ireland A Report for the Year 2003
42
Table 2-8. Compliance with the current and revised nickel standard.
Standard No. of Exceedances Percentage Compliance
1988 Regulations – 50 µg/l 0 100%
2000 Regulations – 20 µg/l 0 100%
Nitrite
Compliance with the current nitrite standard in 2002 is discussed in detail in section 2.11. There is alarge body of data to permit a comparison of the effect the increase in the nitrite standard will have onthe level of compliance when the 2000 Regulations take effect. A total of 6,539 samples were analysedin supplies covered by the 2000 Regulations with no sample exceeding the parametric value of 0.5 mg/l
Table 2-9. Compliance with the current and revised nitrite standard.
Standard No. of Exceedances
PWS GWS
Percentage Compliance
PWS GWS
1988 Regulations – 0.1 µg/l 13 36 99.7% 99.1%
2000 Regulations – 0.5 µg/l 0 0 100% 100%
PAHs
The standard for PAH’s is reduced from 0.2 µg/l to 0.1 µg/l. However, under the 1988 Regulations,PAH’s are defined as comprising six substances, namely; fluoranthene, 3,4-benzofluorathene, 11,12-benzofluorathene, 3,4-benzopyrene, 1,12-benzoperylene and indeno(1,2,3-cd)pyrene. Whereas, in the2000 Regulations the definition for PAH’s does not include fluoranthene and 3,4-benzopyrene is listedas a separate parameter. Thus in the 2000 Regulations, PAH’s comprise the remaining four parameterslisted above. Therefore, a comparison between the current and revised standard is not possible.
Boron
Boron is a naturally occurring trace element that is also used in cleaning compounds and in alloys.Excessive levels of boron have been linked to problems in the human nervous system. A total of 243samples were analysed for boron in 2003 none of which exceeded the standard in the 1988 Regulationor the parametric value in the 2000 Regulations.
Sodium
Sodium is an abundant natural constituent of rocks and soil and is always present in natural waters.Excessive intake can cause hypertension. The current standard of 150 mg/l has been increased in the2000 Regulations to 200 mg/l. The effect of the new standard on the number of exceedances is shownin Table 2-10.

The Quality of Drinking Water in Ireland A Report for the Year 2003
43
Table 2-10. Compliance with the current and revised sodium standard.
Standard No. of Exceedances Percentage Compliance
1988 Regulations – 150 mg/l 7 99.3%
2000 Regulations – 200 mg/l 5 99.5%
pH
Compliance with the current pH standard in 2003 is discussed in detail in section 2.14. The 2000Regulations have resulted in a change in the pH band for acceptable drinking water. The currentrequirement is that the pH must lie between 6.0 and 9.0 while the revised range will be between pH 6.5and 9.5. The effect this has on compliance is shown in Table 2-11. The increase in the number ofexceedances is due to a failure to meet the revised level of 6.5.
Table 2-11. Compliance with the current and revised pH standard.
Standard No. of Exceedances Percentage Compliance
1988 Regulations – 6.0>pH<9.0 234 98.4%
2000 Regulations – 6.5>pH<9.5 550 95.7%
Sanitary authorities should review their monitoring results for pH to ensure that appropriate pHcorrection takes place in order to comply with the indicator parametric value.

The Quality of Drinking Water in Ireland A Report for the Year 2003
44
3. SANITARY AUTHORITY RESULTS
3.1. INTRODUCTION AND OVERVIEW
This section of the report provides a general assessment of the results of monitoring undertaken byeach sanitary authority during 2003. Separate reports are provided for each sanitary authority. Eachreport provides summary information on the numbers of public water supplies and group waterschemes monitored during 2003, the estimated population served by these schemes, an assessment ofthe monitoring results for 2003 and a review of the period 2001 – 2003. More detailed informationincluding the supply details, numbers of samples, list of exceedances and the complete monitoringresults for each supply in each sanitary authority are published on the CD ROM version of this reportwhich is available from the EPA Publications Office, McCumiskey House, Richview, ClonskeaghRoad, Dublin 14. To assist in interpreting sanitary authority reports, comparable national figures areprovided in Table 3-1.
Table 3-1. Summary of National Compliance with the Drinking Water Standards.
Summary InformationNumber of Public Water Supplies Monitored during 2003: 906Estimated Population Served by Public Water Supplies Monitored during 2003: 3,236,412 personsOverall Percentage Compliance in Public Water Supplies 97.7%Number of Group Water Schemes Monitored during 2003: 1,805Estimated Population Served by Group Water Schemes Monitored during 2003: 286,020 personsOverall Percentage Compliance in Group Water Schemes 91.5%
Results of Microbiological Analysis:Number of Public Water Supplies Monitored Free of Faecal Coliforms: 788Number of Group Water Schemes Monitored Free of Faecal Coliforms: 1,358
Percentage of Samples Free of Faecal Coliforms in Public Water Supplies: 98.7%Percentage of Samples Free of Faecal Coliforms in Group Water Schemes: 83.2%
The most important factor governing the extent of sampling required under the Regulations for therespective supplies is the volume supplied. There are no specific monitoring requirements for suppliesof less than 200 m3/day volume, or populations below 1,000 persons, though this situation will changein 2004. Many group water schemes fall below both these thresholds and hence the Regulations allowthat monitoring be undertaken at a frequency to be determined by the sanitary authority. Though thesethresholds do not constitute a minimum below which no monitoring is required, the practice has beenthat most sanitary authorities monitor group schemes once per year and in some cases in three yearlycycles. Hence, while comments on the results for group water schemes and small private supplies aremade below, it is clear that the small number of samples analysed for such supplies (in general) militateagainst making an informed assessment.
Sanitary Authority Compliance with the 53 Parameters
The overall national compliance rate for all 53 parameters for public water supplies was 97.7% withjust 12 sanitary authorities achieving overall compliance rates of >99%. The sanitary authorities withthe highest and lowest rates of compliance for public water supplies are shown in Table 3-2.

The Quality of Drinking Water in Ireland A Report for the Year 2003
45
Table 3-2. Overall Compliance in Public Water Supplies - Highest and Lowest PerformingSanitary Authorities
Highest % Compliance Lowest % ComplianceWexford 99.6 Roscommon4 89.3Galway City 99.3 Cavan 94.5South Dublin 99.3 Monaghan 94.9Dundalk Town 99.2 Leitrim 95.4Laois 99.2 Longford 95.8
Overall compliance in group water schemes was significantly lower than that of the public watersupplies at 91.5%. The sanitary authorities with the highest and lowest rates of compliance for groupwater schemes are shown in Table 3-3.
Table 3-3. Overall Compliance in Group Water Schemes – Highest and Lowest PerformingSanitary Authorities
Highest % Compliance Lowest % ComplianceKildare 98.1 Wicklow 84.5North Tipperary 97.5 Cavan 85.0South Dublin 97.4 Wexford 85.6Meath 96.7 Louth 86.6Cork South 96.7 Galway 88.0
4 A contributing factor to Roscommon’s low compliance rate was a large number of exceedances reported for fluoride. Uponinvestigation these exceedances were reportedly due to malfunctioning monitoring equipment. However, replacement of theRoscommon lab data for fluoride with health board data for fluoride only raises the compliance rate to 91.2%.

The Quality of Drinking Water in Ireland A Report for the Year 2003
46
3.2. CARLOW
Summary InformationNumber of Public Water Supplies Monitored during 2003: 15Estimated Population Served by Public Water Supplies Monitored during 2003: 33,335 personsOverall Percentage Compliance in Public Water Supplies 98.0%Number of Group Water Schemes Monitored during 2003: 11Estimated Population Served by Group Water Schemes Monitored during 2003: 2,358 personsOverall Percentage Compliance in Group Water Schemes 93.1%
Results of Microbiological Analysis:Number of Public Water Supplies Monitored Free of Faecal Coliforms: 15Number of Group Water Schemes Monitored Free of Faecal Coliforms: 7
Percentage of Samples Free of Faecal Coliforms in Public Water Supplies: 100%Percentage of Samples Free of Faecal Coliforms in Group Water Schemes: 88.9%
Assessment of the Monitoring Results for 2003
There were 15 public water supplies and 11 group water schemes monitored in Carlow County Councilin 2003 collectively supplying water to a population of 35,693 people.
Overall compliance with the drinking water standards in public water supplies in Carlow was slightlyabove average at 98.0%. Full compliance with the faecal coliform standard in public water supplieswas achieved during 2003. All public water supplies in Carlow County Council were also fullycompliant with the standards for odour, pH and the heavy metals. However, one sample (of 12samples analysed) in the North Regional Water Supply reported elevated levels of nitrate in 2003.
The overall compliance rate for group water schemes in Carlow County Council was above the nationalaverage at 93.1%. Of the 11 schemes monitored 4 were found to be contaminated with faecalcoliforms in 2003. Elevated levels of nitrates were also reported in the Craan/Newstown scheme.
Review of the Period 2001-2003
The general quality of drinking water in public water supplies in Carlow County Council wassatisfactory during the review period though there was a slight drop in compliance in 2003 compared to2002. Compliance with the faecal coliform standard remains good through-out the review period andwas excellent in 2003.
The overall quality of drinking water in group water schemes was satisfactory in 2003. The smallnumber group water schemes monitored in 2002 (just one was monitored in 2002) prevent ameaningful analysis of trends over the three year period.
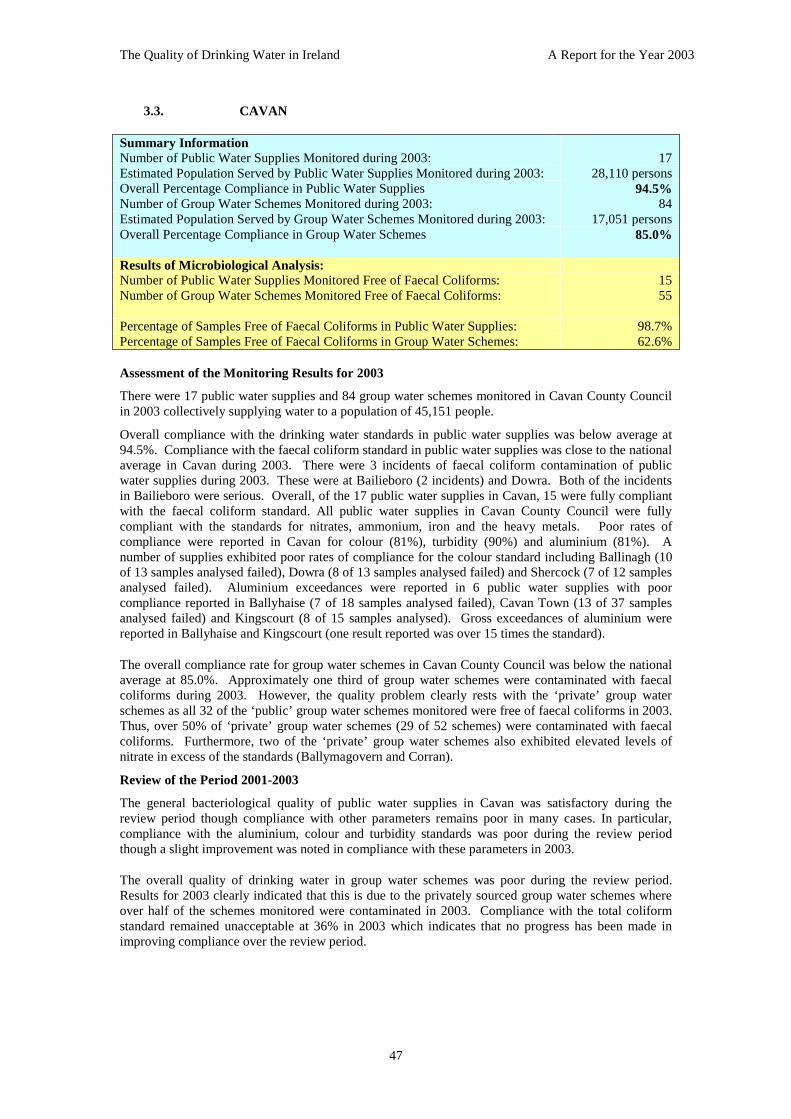
The Quality of Drinking Water in Ireland A Report for the Year 2003
47
3.3. CAVAN
Summary InformationNumber of Public Water Supplies Monitored during 2003: 17Estimated Population Served by Public Water Supplies Monitored during 2003: 28,110 personsOverall Percentage Compliance in Public Water Supplies 94.5%Number of Group Water Schemes Monitored during 2003: 84Estimated Population Served by Group Water Schemes Monitored during 2003: 17,051 personsOverall Percentage Compliance in Group Water Schemes 85.0%
Results of Microbiological Analysis:Number of Public Water Supplies Monitored Free of Faecal Coliforms: 15Number of Group Water Schemes Monitored Free of Faecal Coliforms: 55
Percentage of Samples Free of Faecal Coliforms in Public Water Supplies: 98.7%Percentage of Samples Free of Faecal Coliforms in Group Water Schemes: 62.6%
Assessment of the Monitoring Results for 2003
There were 17 public water supplies and 84 group water schemes monitored in Cavan County Councilin 2003 collectively supplying water to a population of 45,151 people.
Overall compliance with the drinking water standards in public water supplies was below average at94.5%. Compliance with the faecal coliform standard in public water supplies was close to the nationalaverage in Cavan during 2003. There were 3 incidents of faecal coliform contamination of publicwater supplies during 2003. These were at Bailieboro (2 incidents) and Dowra. Both of the incidentsin Bailieboro were serious. Overall, of the 17 public water supplies in Cavan, 15 were fully compliantwith the faecal coliform standard. All public water supplies in Cavan County Council were fullycompliant with the standards for nitrates, ammonium, iron and the heavy metals. Poor rates ofcompliance were reported in Cavan for colour (81%), turbidity (90%) and aluminium (81%). Anumber of supplies exhibited poor rates of compliance for the colour standard including Ballinagh (10of 13 samples analysed failed), Dowra (8 of 13 samples analysed failed) and Shercock (7 of 12 samplesanalysed failed). Aluminium exceedances were reported in 6 public water supplies with poorcompliance reported in Ballyhaise (7 of 18 samples analysed failed), Cavan Town (13 of 37 samplesanalysed failed) and Kingscourt (8 of 15 samples analysed). Gross exceedances of aluminium werereported in Ballyhaise and Kingscourt (one result reported was over 15 times the standard).
The overall compliance rate for group water schemes in Cavan County Council was below the nationalaverage at 85.0%. Approximately one third of group water schemes were contaminated with faecalcoliforms during 2003. However, the quality problem clearly rests with the ‘private’ group waterschemes as all 32 of the ‘public’ group water schemes monitored were free of faecal coliforms in 2003.Thus, over 50% of ‘private’ group water schemes (29 of 52 schemes) were contaminated with faecalcoliforms. Furthermore, two of the ‘private’ group water schemes also exhibited elevated levels ofnitrate in excess of the standards (Ballymagovern and Corran).
Review of the Period 2001-2003
The general bacteriological quality of public water supplies in Cavan was satisfactory during thereview period though compliance with other parameters remains poor in many cases. In particular,compliance with the aluminium, colour and turbidity standards was poor during the review periodthough a slight improvement was noted in compliance with these parameters in 2003.
The overall quality of drinking water in group water schemes was poor during the review period.Results for 2003 clearly indicated that this is due to the privately sourced group water schemes whereover half of the schemes monitored were contaminated in 2003. Compliance with the total coliformstandard remained unacceptable at 36% in 2003 which indicates that no progress has been made inimproving compliance over the review period.

The Quality of Drinking Water in Ireland A Report for the Year 2003
48
3.4. CLARE
Summary InformationNumber of Public Water Supplies Monitored during 2003: 27Estimated Population Served by Public Water Supplies Monitored during 2003: 58,145 personsOverall Percentage Compliance in Public Water Supplies 99.1%Number of Group Water Schemes Monitored during 2003: 177Estimated Population Served by Group Water Schemes Monitored during 2003: 28,405 personsOverall Percentage Compliance in Group Water Schemes 94.7%
Results of Microbiological Analysis:Number of Public Water Supplies Monitored Free of Faecal Coliforms: 25Number of Group Water Schemes Monitored Free of Faecal Coliforms: 159
Percentage of Samples Free of Faecal Coliforms in Public Water Supplies: 98.8%Percentage of Samples Free of Faecal Coliforms in Group Water Schemes: 90.4%
Assessment of the Monitoring Results for 2003
There were 27 public water supplies and 177 group water schemes monitored in Clare County Councilin 2003 collectively supplying water to a population of 86,550 people.
Overall compliance with the drinking water standards in public water supplies was above average at99.1%. Compliance with the faecal coliform standard in public water supplies was close to the nationalaverage in Clare during 2003. There were 2 incidents of faecal coliform contamination of public watersupplies during 2003 both of which were serious. These were at Ballyvaughan and Lisdoonvarna. Theformer was due to a malfunctioning chlorine pump which was replaced while the latter supply is nolonger in use. Overall, of the 27 public water supplies in Clare County Council, 25 were fullycompliant with the faecal coliform standard. All public water supplies in Clare County Council werefully compliant for ammonium, colour, nitrate, nitrite, odour, taste and turbidity. The only other issueof note was the poor rate of compliance with the aluminium standard in the Miltown/Malbay supply (3of 5 samples analysed failed) where two of the exceedances were gross (i.e. >1 mg/l).
The overall compliance rate for group water schemes in Clare County Council was above the nationalaverage at 94.7%. However, 9 of the 115 ‘public’ group water schemes as well 9 of 62 ‘private’ groupwater schemes were contaminated with faecal coliforms during 2003. Though microbiologicalcompliance was above the national average compliance with the standards for aluminium (90%compliance), iron (90%) and fluoride (85%) remains poor.
Review of the Period 2001-2003
The general quality of drinking water in public water supplies in Clare County Council was goodduring the review period. Compliance with the microbiological standards remained high during thereview period. Though compliance with the aluminium standard dropped from 88% in 2001 to 80% in2002 it improved in 2003 to 91%. Compliance with the fluoride standard improved from 89% in 2001to 98% in 2003.
Though the overall quality of drinking water in group water schemes was above the national averageduring the review period it was nonetheless unsatisfactory. Compliance with the iron and aluminiumstandards remained low during the review period.

The Quality of Drinking Water in Ireland A Report for the Year 2003
49
3.5. CLONMEL
Summary InformationNumber of Public Water Supplies Monitored during 2003: 2Estimated Population Served by Public Water Supplies Monitored during 2003: 15,000 personsOverall Percentage Compliance in Public Water Supplies 99.1%Number of Group Water Schemes Monitored during 2003: N/AEstimated Population Served by Group Water Schemes Monitored during 2003: N/AOverall Percentage Compliance in Group Water Schemes N/A
Results of Microbiological Analysis:Number of Public Water Supplies Monitored Free of Faecal Coliforms: 2Number of Group Water Schemes Monitored Free of Faecal Coliforms: N/A
Percentage of Samples Free of Faecal Coliforms in Public Water Supplies: 100%Percentage of Samples Free of Faecal Coliforms in Group Water Schemes: N/A
Assessment of the Monitoring Results for 2003
There were 2 public water supplies monitored in Clonmel Borough Council in 2003 collectivelysupplying water to a population of 15,000 people.
Overall compliance with the drinking water standards in public water supplies was high and was aboveaverage at 99.1%. The supplies were of excellent microbiological quality during 2003 with noexceedances of the faecal coliforms standard. Compliance with all other parameters was also goodwith a small number of exceedances reported with the colour standard.
Review of the Period 2001-2003
The general quality of drinking water in public water supplies in Clonmel Borough Council wassatisfactory during the review period improving to good in 2003. The only issue regarding compliancewas the exceedances reported with the colour standard during the review period.

The Quality of Drinking Water in Ireland A Report for the Year 2003
50
3.6. CORK CITY
Summary InformationNumber of Public Water Supplies Monitored during 2003: 1Estimated Population Served by Public Water Supplies Monitored during 2003: 128,000 personsOverall Percentage Compliance in Public Water Supplies 96.3%Number of Group Water Schemes Monitored during 2003: N/AEstimated Population Served by Group Water Schemes Monitored during 2003: N/AOverall Percentage Compliance in Group Water Schemes N/A
Results of Microbiological Analysis:Number of Public Water Supplies Monitored Free of Faecal Coliforms: 1Number of Group Water Schemes Monitored Free of Faecal Coliforms: N/A
Percentage of Samples Free of Faecal Coliforms in Public Water Supplies: 100%Percentage of Samples Free of Faecal Coliforms in Group Water Schemes: N/A
Assessment of the Monitoring Results for 2003
There was one public water supply monitored in Cork City in 2003 collectively supplying water to apopulation of 128,000 people.
Overall compliance with the drinking water standards in public water supplies was below the averageat 96.3%. Full compliance with the faecal coliform standard was achieved in the Cork City supplyduring 2003. The overall compliance rate was less than the average as a result of low rates ofcompliance with the odour (91%), taste (91%), aluminium (88%) and fluoride (83%) standards, thoughmost of the exceedances were moderate in nature. The Cork City supply also has in place derogationsfrom the iron and manganese standards.
Review of the Period 2001-2003
The microbiological quality of the water supply in Cork City was good during the review periodthough compliance with some other parameters was unsatisfactory with compliance rates dropping foraluminium (95% in 2001 to 88% in 2003) and fluoride (96% in 2001 to 83% in 2003).

The Quality of Drinking Water in Ireland A Report for the Year 2003
51
3.7. CORK (NORTHERN AREA)
Summary InformationNumber of Public Water Supplies Monitored during 2003: 63Estimated Population Served by Public Water Supplies Monitored during 2003: 52,125 personsOverall Percentage Compliance in Public Water Supplies: 97.4%Number of Group Water Schemes Monitored during 2003: 11Estimated Population Served by Group Water Schemes Monitored during 2003: 520 personsOverall Percentage Compliance in Group Water Schemes: 94.6%
Results of Microbiological Analysis:Number of Public Water Supplies Monitored Free of Faecal Coliforms: 58Number of Group Water Schemes Monitored Free of Faecal Coliforms: 9
Percentage of Samples Free of Faecal Coliforms in Public Water Supplies: 97.5%Percentage of Samples Free of Faecal Coliforms in Group Water Schemes: 81.8%
Assessment of the Monitoring Results for 2003
There were 63 public water supplies and 11 group water schemes monitored in North Cork in 2003collectively supplying water to a population of 52,625 people.
Overall compliance with the drinking water standards in public water supplies was slightly below theaverage at 97.4%. Compliance with the faecal coliform standard in public water supplies was alsobelow the national average in North Cork during 2003. There were 5 incidents of faecal coliformcontamination of public water supplies during 2003. These were in the Banteer, Conna Village,Cregane, Glenduff and Killavullen supplies. The Cregane and Kilavullen incidents were both seriousin nature (>20 cfu/100ml) and of particular concern is the fact that there was no evidence of a follow upsample in the results submitted to the Agency by Cork County Council taken following the incident inCregane. Overall, of the 63 public water supplies in North Cork, 58 were fully compliant with thefaecal coliform standard. All public water supplies in North Cork were fully compliant with thestandards for odour, taste, ammonium and nitrites. As in previous years nitrate exceedances werereported in the Conna Village and Glanworth supplies, with one sample analysed for the latterexceeding 90 mg/l.
The overall compliance rate for group water schemes in North Cork was above the national average at94.6%. Two of the 11 ‘private’ group water schemes monitored recorded incidents of faecalcontamination during 2003. However, compliance with the total coliform standard was very low (9 of11 samples analysed failed) while compliance with the pH standard was also problematic (4 of 11samples analysed failed).
Review of the Period 2001-2003
The general quality of drinking water in public water supplies in North Cork was satisfactory duringthe review period. Compliance with the microbiological standards for total and faecal coliforms hasimproved during the review period though there is still room for further improvement.. Nitrates stillremain a problem in the Conna Village and in particular the Glanworth supplies.
The overall quality of drinking water in group water schemes was unsatisfactory during the reviewperiod. It is regrettable that the full compliance with the faecal coliform standard achieved in 2002 wasnot repeated in 2003. Of concern is the decline in the level of compliance with the total coliformstandard from 68% in 2001 to 27% in 2003.

The Quality of Drinking Water in Ireland A Report for the Year 2003
52
3.8. CORK (SOUTH AREA)
Summary InformationNumber of Public Water Supplies Monitored during 2003: 58Estimated Population Served by Public Water Supplies Monitored during 2003: 116,950 personsOverall Percentage Compliance in Public Water Supplies: 98.5%Number of Group Water Schemes Monitored during 2003: 21Estimated Population Served by Group Water Schemes Monitored during 2003: 1,092 personsOverall Percentage Compliance in Group Water Schemes: 96.7%
Results of Microbiological Analysis:Number of Public Water Supplies Monitored Free of Faecal Coliforms: 55Number of Group Water Schemes Monitored Free of Faecal Coliforms: 15
Percentage of Samples Free of Faecal Coliforms in Public Water Supplies: 99.3%Percentage of Samples Free of Faecal Coliforms in Group Water Schemes: 72.7%
Assessment of the Monitoring Results for 2003
There were 58 public water supplies and 21 group water schemes monitored in South Cork in 2003collectively supplying water to a population of 118,042 people.
Overall compliance with the drinking water standards in public water supplies was above average at98.5%. Compliance with the faecal coliform standard in public water supplies was also above thenational average in South Cork during 2003. There were 3 incidents of faecal coliform contaminationof public water supplies during 2003 in the Ballinacurrig/Lisgoold, Ballingeary and Crookstownsupplies. The incident in the latter was serious (>20 cuf/100ml) while the other two were moderate innature though all three supplies did not exhibit faecal exceedances again during 2003. Overall, of the58 public water supplies in South Cork, 55 were fully compliant with the faecal coliform standard. Allpublic water supplies in South Cork were fully compliant for the standards for turbidity, taste,ammonium and the heavy metals. The low rate of compliance with the aluminium standard (92%) wasdue to exceedances reported in the Glanmire Regional (3 of 7 samples analysed failed), MacroomUrban (6 of 12 samples analysed failed) and the Youghal Regional (8 of 9 samples analysed failed)supplies. The latter two supplies have been highlighted repeatedly in successive reports and correctiveaction is required to ensure both supplies are returned to compliance. Nitrate exceedances were alsoreported in two public water supplies, Roberts Cove and Lisnacru in 2003.
The overall compliance rate for group water schemes in South Cork was above the national average at96.7%. Compliance with the faecal coliform standard was relatively low during 2003 with over aquarter of schemes (6 of 21) contaminated with faecal material at one time during the year. One nitrateexceedance was also reported in the Lisquinlan group water scheme.
Review of the Period 2001-2003
The general quality of drinking water in public water supplies in South Cork was satisfactory duringthe review period and compliance with the faecal coliform standard has improved slightly over thereview period. However, compliance with the aluminium standard was unacceptably low during thereview period particularly in the Macroom and Youghal supplies.
The overall quality of drinking water in group water schemes was poor during the review period withcompliance dropping from 90% in 2001 to 72% in 2003. The total coliform compliance rate improvedto 55% in 2003 compared to 12% in 2002 though still remained below the compliance rate in 2001(69%).

The Quality of Drinking Water in Ireland A Report for the Year 2003
53
3.9. CORK (WEST AREA)
Summary InformationNumber of Public Water Supplies Monitored during 2003: 30Estimated Population Served by Public Water Supplies Monitored during 2003: 31,025 personsOverall Percentage Compliance in Public Water Supplies: 97.2%Number of Group Water Schemes Monitored during 2003: 7Estimated Population Served by Group Water Schemes Monitored during 2003: 422 personsOverall Percentage Compliance in Group Water Schemes: 95.8%
Results of Microbiological Analysis:Number of Public Water Supplies Monitored Free of Faecal Coliforms: 25Number of Group Water Schemes Monitored Free of Faecal Coliforms: 4
Percentage of Samples Free of Faecal Coliforms in Public Water Supplies: 94.8%Percentage of Samples Free of Faecal Coliforms in Group Water Schemes: 62.5%
Assessment of the Monitoring Results for 2003
There were 30 public water supplies and 7 group water schemes monitored in West Cork in 2003collectively supplying water to a population of 31,447 people.
Overall compliance with the drinking water standards in public water supplies was close to the nationalaverage at 97.2%. Compliance with the faecal coliform standard in public water supplies was belowthe national average in West Cork during 2003 and was in fact the lowest in the country during 2003.There were 7 incidents of faecal coliform contamination of public water supplies during 2003. Thesewere in the Clonakilty, Durrus, Kealkill, Skibbereen and Snave (3 incidents) supplies. The incidents inKealkill and one in Snave were serious (>20 cfu/100ml) and it is of particular concern that half of thesamples analysed in Snave during 2003 were contaminated with faecal coliforms. Overall, of the 30public water supplies in West Cork, 25 were fully compliant with the faecal coliform standard. Allpublic water supplies in West Cork were fully compliant for taste, nitrites and the heavy metals. Therate of compliance with the fluoride standard was particularly low during 2003 at 87% and was due toexceedances reported in all of the supplies to which fluoride is added; however, all of theseexceedances were just above the standard. The Castletownkinnagh supply continues to have nitrateexceedances which should be dealt with as a priority.
The overall compliance rate for group water schemes in West Cork was above the national average at95.8%. Almost half of the schemes monitored (3 out of of 7 schemes) were contaminated with faecalcoliforms during 2003.
Review of the Period 2001-2003
The general quality of drinking water in public water supplies in West Cork was satisfactory during thereview period. Compliance with the microbiological standards for total and faecal coliforms hasimproved slightly during the review period though there is still room for further improvement. Of noteis the drop in compliance with the fluoride standard from 95% in 2001 to 87% in 2003 (100%compliance was achieved in 2002). There has been a welcome improvement in the aluminiumcompliance rate during the review period from 88% in 2001 to 96% in 2003.
The overall quality of drinking water in group water schemes has deteriorated during the review period.The increase in the number of schemes with incidents of faecal contamination is regrettable and thistrend must be reversed.

The Quality of Drinking Water in Ireland A Report for the Year 2003
54
3.10. DONEGAL
Summary InformationNumber of Public Water Supplies Monitored during 2003: 53Estimated Population Served by Public Water Supplies Monitored during 2003: 117,564 personsOverall Percentage Compliance in Public Water Supplies: 96.9%Number of Group Water Schemes Monitored during 2003: 16Estimated Population Served by Group Water Schemes Monitored during 2003: 3,019 personsOverall Percentage Compliance in Group Water Schemes: 89.3%
Results of Microbiological Analysis:Number of Public Water Supplies Monitored Free of Faecal Coliforms: 47Number of Group Water Schemes Monitored Free of Faecal Coliforms: 9
Percentage of Samples Free of Faecal Coliforms in Public Water Supplies: 98.7%Percentage of Samples Free of Faecal Coliforms in Group Water Schemes: 82.0%
Assessment of the Monitoring Results for 2003
There were 53 public water supplies and 16 group water schemes monitored in Donegal CountyCouncil in 2003 collectively supplying water to a population of 120,583 people.
Overall compliance with the drinking water standards in public water supplies was below average at96.9%. Compliance with the faecal coliform standard in public water supplies was close to the nationalaverage in Donegal during 2003. There were 6 incidents of faecal coliform contamination of publicwater supplies during 2003. These were in the Ardagh, Cashel-Gleneely, Cranford, Falcarragh(Muckish Stream), Lifford (Old), Lough Mourne and Mountcharles Upper supplies. Overall, of the 53public water supplies in Donegal, 47 were fully compliant with the faecal coliform standard. All publicwater supplies in Donegal were fully compliant with the standards for odour, taste, nitrates andammonium. Compliance with the aluminium standard was poor in Donegal (66%) and wasproblematic in the Ballyshannon (16 of 17 samples analysed failed), Falcarragh (Muckish Stream) (6 of7 samples analysed failed), Gortahork-Falcarragh (10 of 11 samples analysed failed), Killybegs (6 of20 samples analysed failed) and Lettermacaward (5 of 11 samples analysed failed). These are the samesupplies that have been problematic in previous years and ensuring that these supplies are brought intocompliance should be a priority.
The overall compliance rate for group water schemes in Donegal County Council was below thenational average at 89.3%. A large number of the ‘private’ group water schemes in Donegal werecontaminated with faecal coliforms at one time during 2003. Compliance with the colour, iron andmanganese standards was also problematic in group water schemes in Donegal in 2003.
Review of the Period 2001-2003
The general microbiological quality of drinking water in public water supplies in Donegal CountyCouncil was satisfactory during the review period. However, compliance with the aluminium standardremained consistently low during the review period.
In spite of an improvement in the compliance rate with the faecal coliforms standard from 72% in 2001to 82% in 2003, the overall quality of drinking water in group water schemes was unsatisfactory duringthe review period.
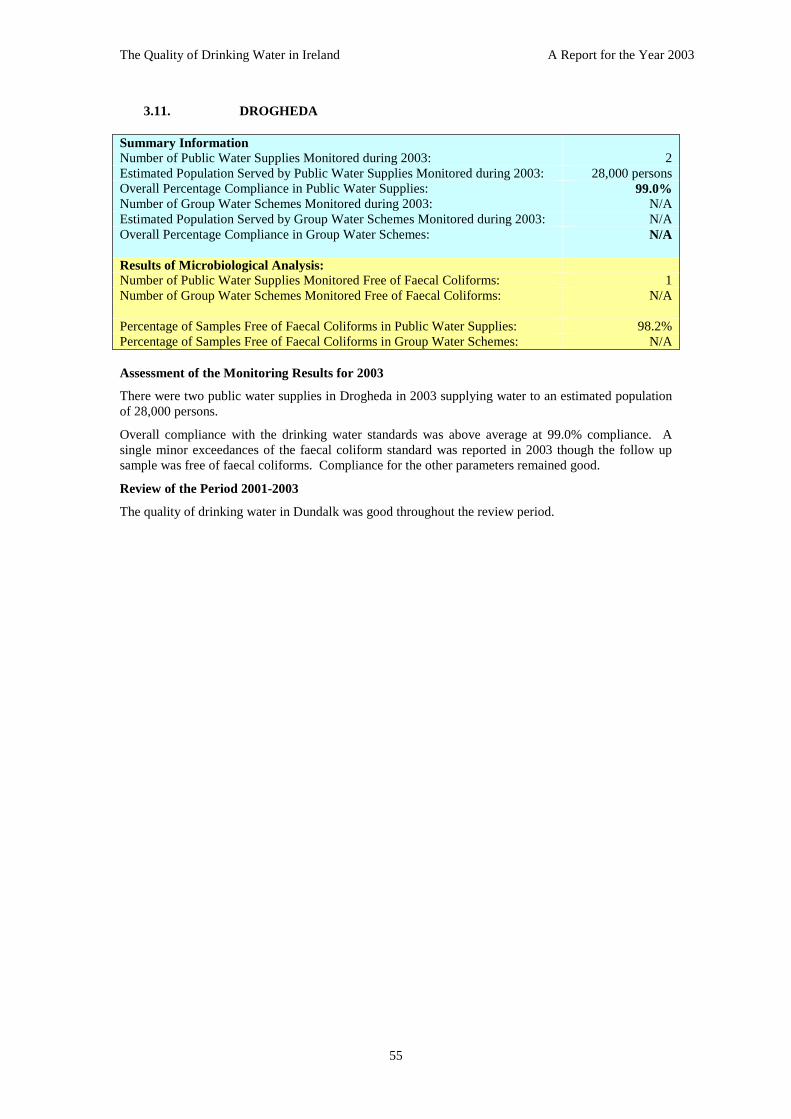
The Quality of Drinking Water in Ireland A Report for the Year 2003
55
3.11. DROGHEDA
Summary InformationNumber of Public Water Supplies Monitored during 2003: 2Estimated Population Served by Public Water Supplies Monitored during 2003: 28,000 personsOverall Percentage Compliance in Public Water Supplies: 99.0%Number of Group Water Schemes Monitored during 2003: N/AEstimated Population Served by Group Water Schemes Monitored during 2003: N/AOverall Percentage Compliance in Group Water Schemes: N/A
Results of Microbiological Analysis:Number of Public Water Supplies Monitored Free of Faecal Coliforms: 1Number of Group Water Schemes Monitored Free of Faecal Coliforms: N/A
Percentage of Samples Free of Faecal Coliforms in Public Water Supplies: 98.2%Percentage of Samples Free of Faecal Coliforms in Group Water Schemes: N/A
Assessment of the Monitoring Results for 2003
There were two public water supplies in Drogheda in 2003 supplying water to an estimated populationof 28,000 persons.
Overall compliance with the drinking water standards was above average at 99.0% compliance. Asingle minor exceedances of the faecal coliform standard was reported in 2003 though the follow upsample was free of faecal coliforms. Compliance for the other parameters remained good.
Review of the Period 2001-2003
The quality of drinking water in Dundalk was good throughout the review period.

The Quality of Drinking Water in Ireland A Report for the Year 2003
56
3.12. DUBLIN CITY
Summary InformationNumber of Public Water Supplies Monitored during 2003: See note∗
Estimated Population Served by Public Water Supplies Monitored during 2003: See noteOverall Percentage Compliance in Public Water Supplies: 98.8%Number of Group Water Schemes Monitored during 2003: N/AEstimated Population Served by Group Water Schemes Monitored during 2003: N/AOverall Percentage Compliance in Group Water Schemes: N/A
Results of Microbiological Analysis:Number of Public Water Supplies Monitored Free of Faecal Coliforms: 4Number of Group Water Schemes Monitored Free of Faecal Coliforms: N/A
Percentage of Samples Free of Faecal Coliforms in Public Water Supplies: 99.8%Percentage of Samples Free of Faecal Coliforms in Group Water Schemes: N/A
Assessment of the Monitoring Results for 2003
The drinking water supply for Dublin comes primarily from a mixture of four surface water sourcewhich as a whole supply water to approximately 1.3 million in the Greater Dublin Area.
Overall compliance with the drinking water standards in public water supplies was above average at98.8%. Compliance with the faecal coliform standard in public water supplies was good and above thenational average in Dublin City during 2003. Two samples (of 1192 samples analysed) did not complywith the faecal coliform standard in the Leixlip and Leixlip/Stillorgan supply zones. However, the rateof compliance with the total coliform standard was relatively low at 85%.
Review of the Period 2001-2003
The general quality of drinking water in public water supplies in Dublin City was satisfactory duringthe review period though a drop in compliance with the total coliform standard from 97% in 2001 to85% in 2003 was noted.
∗ The Greater Dublin Water Supply is supplied from raw water sources at Leixlip, Roundwood, Ballyboden and BallymoreEustace and supplies approximately 1.3 million persons within the Dublin City, Fingal, Dun Laoghaire-Rathdown, South Dublin,Wicklow, Kildare and Meath sanitary authorities.

The Quality of Drinking Water in Ireland A Report for the Year 2003
57
3.13. DUNDALK
Summary InformationNumber of Public Water Supplies Monitored during 2003: 1Estimated Population Served by Public Water Supplies Monitored during 2003: 30,000 personsOverall Percentage Compliance in Public Water Supplies: 99.2%Number of Group Water Schemes Monitored during 2003: 0Estimated Population Served by Group Water Schemes Monitored during 2003: N/AOverall Percentage Compliance in Group Water Schemes: N/A
Results of Microbiological Analysis:Number of Public Water Supplies Monitored Free of Faecal Coliforms: 0Number of Group Water Schemes Monitored Free of Faecal Coliforms: N/A
Percentage of Samples Free of Faecal Coliforms in Public Water Supplies: 98.7%Percentage of Samples Free of Faecal Coliforms in Group Water Schemes: N/A
Assessment of the Monitoring Results for 2003
There was one public water supply in Dundalk (Cavan Hill) in 2003 supplying water to an estimatedpopulation of 30,000 persons.
Overall compliance with the drinking water standards was above average at 99.2% compliance. Minorexceedances of the faecal coliform standard were reported in 2003 though it was reported that theseexceedances were due to contamination during the sampling procedure. Compliance for the otherparameters remained good.
Review of the Period 2001-2003
The quality of drinking water in Dundalk was good throughout the review period.

The Quality of Drinking Water in Ireland A Report for the Year 2003
58
3.14. DUN LAOGHAIRE-RATHDOWN
Summary InformationNumber of Public Water Supplies Monitored during 2003: See Dublin CityEstimated Population Served by Public Water Supplies Monitored during 2003: See Dublin CityOverall Percentage Compliance in Public Water Supplies: 99.1%Number of Group Water Schemes Monitored during 2003: N/AEstimated Population Served by Group Water Schemes Monitored during 2003: N/AOverall Percentage Compliance in Group Water Schemes: N/A
Results of Microbiological Analysis:Number of Public Water Supplies Monitored Free of Faecal Coliforms: 2Number of Group Water Schemes Monitored Free of Faecal Coliforms: N/A
Percentage of Samples Free of Faecal Coliforms in Public Water Supplies: 99.7%Percentage of Samples Free of Faecal Coliforms in Group Water Schemes: N/A
Assessment of the Monitoring Results for 2003
The drinking water supply for Dublin comes primarily from a mixture of four surface water sourcewhich as a whole supply water to approximately 1.3 million in the Greater Dublin Area. There are afurther three small supplies in Dun Laoghaire Rathdown that are operated by the sanitary authority.
Overall compliance with the drinking water standards in public water supplies was above average at99.1%. Compliance with the faecal coliform standard in public water supplies was high and above thenational average in Dun Laoghaire Rathdown during 2003 with just two samples in Ballyboden andKilternan detecting faecal coliforms both a which were at low levels and not found in follow upsamples. Compliance with all other parameters was satisfactory.
Review of the Period 2001-2003
The quality of drinking water in Dun Laoghaire Rathdown was good throughout the review period.

The Quality of Drinking Water in Ireland A Report for the Year 2003
59
3.15. ENNIS
Summary InformationNumber of Public Water Supplies Monitored during 2003: 1Estimated Population Served by Public Water Supplies Monitored during 2003: 23,000 personsOverall Percentage Compliance in Public Water Supplies: 96.2%Number of Group Water Schemes Monitored during 2003: N/AEstimated Population Served by Group Water Schemes Monitored during 2003: N/AOverall Percentage Compliance in Group Water Schemes: N/A
Results of Microbiological Analysis:Number of Public Water Supplies Monitored Free of Faecal Coliforms: 1Number of Group Water Schemes Monitored Free of Faecal Coliforms: N/A
Percentage of Samples Free of Faecal Coliforms in Public Water Supplies: 100%Percentage of Samples Free of Faecal Coliforms in Group Water Schemes: N/A
Assessment of the Monitoring Results for 2003
There was one public water monitored in Ennis in 2003 supplying water to a population of 23,000people.
Overall compliance with the drinking water standards in public water supplies was below average at96.2%. However, compliance with the faecal coliform standard in public water supplies was excellentwith 100% compliance in Ennis during 2003. The Ennis supply was also fully compliant with thestandards for ammonium, heavy metals, nitrates, nitrites and pH. The overall compliance rate wasbrought down by the significant number of fluoride (12 of 73 samples analysed).and iron (8 of 76samples analysed) exceedances.
Review of the Period 2001-2003
The microbiological quality of drinking water in public water supplies in Ennis was excellent duringthe review period. However, the level of compliance with the fluoride standard has remainedconsistently low throughout the review period at between 81 to 84%. Compliance with the colour andturbidity standards dipped during the review period although improvement was noted in 2003.

The Quality of Drinking Water in Ireland A Report for the Year 2003
60
3.16. FINGAL
Summary InformationNumber of Public Water Supplies Monitored during 2003: See Dublin CityEstimated Population Served by Public Water Supplies Monitored during 2003: See Dublin CityOverall Percentage Compliance in Public Water Supplies: 98.7%Number of Group Water Schemes Monitored during 2003: N/AEstimated Population Served by Group Water Schemes Monitored during 2003: N/AOverall Percentage Compliance in Group Water Schemes: N/A
Results of Microbiological Analysis:Number of Public Water Supplies Monitored Free of Faecal Coliforms: 4Number of Group Water Schemes Monitored Free of Faecal Coliforms: N/A
Percentage of Samples Free of Faecal Coliforms in Public Water Supplies: 100%Percentage of Samples Free of Faecal Coliforms in Group Water Schemes: N/A
Assessment of the Monitoring Results for 2003
The drinking water supply in Dublin comes primarily from a mixture of four surface water sourceswhich as a whole supply water to a population of approximately 1.3 million. The primary supply inFingal is the Leixlip supply though the supply has been supplemented by a groundwater source at Bogof the Ring.
Overall compliance with the drinking water standards in public water supplies was above average at98.7%. Compliance with the faecal coliform standard in public water supplies was excellent in Fingalduring 2003; faecal coliforms were not detected in any of the over 700 samples analysed. Compliancewith all other parameters was high though there was a relatively large number of odour and tasteexceedances (43 of 552 samples analysed) primarily due to chlorine.
Review of the Period 2001-2003
The general quality of drinking water in public water supplies in Fingal was good during the reviewperiod. In particular the microbiological quality was excellent.
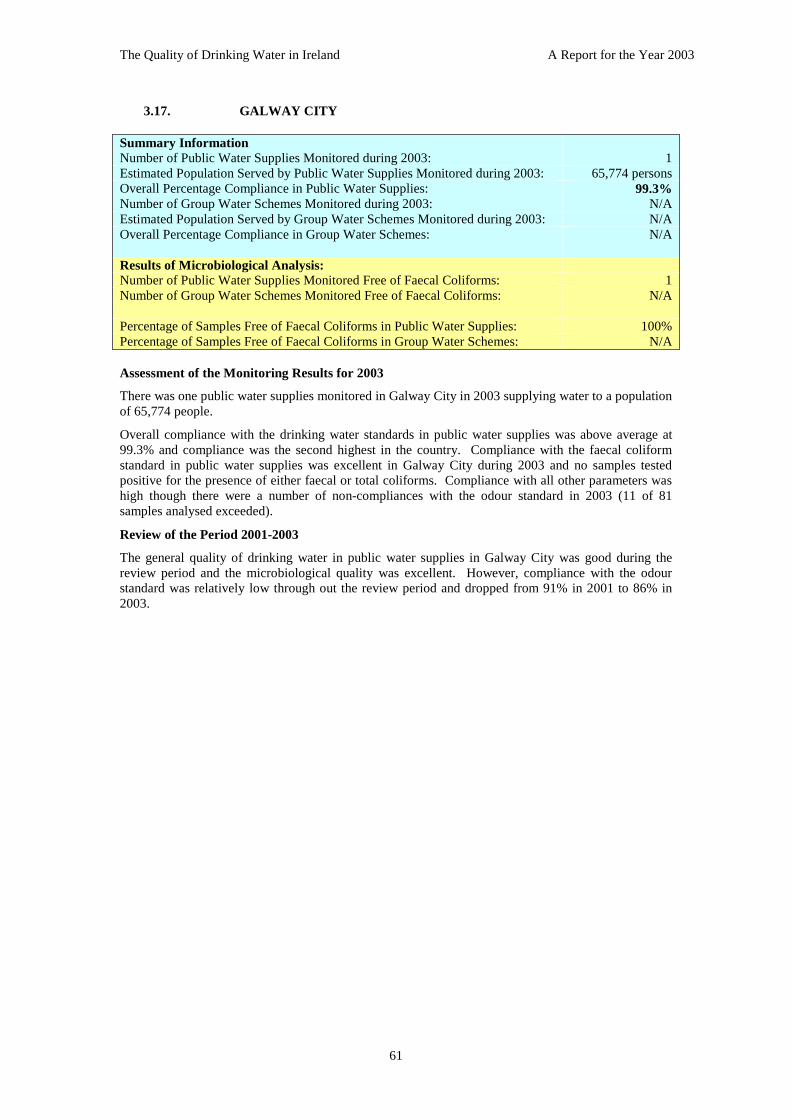
The Quality of Drinking Water in Ireland A Report for the Year 2003
61
3.17. GALWAY CITY
Summary InformationNumber of Public Water Supplies Monitored during 2003: 1Estimated Population Served by Public Water Supplies Monitored during 2003: 65,774 personsOverall Percentage Compliance in Public Water Supplies: 99.3%Number of Group Water Schemes Monitored during 2003: N/AEstimated Population Served by Group Water Schemes Monitored during 2003: N/AOverall Percentage Compliance in Group Water Schemes: N/A
Results of Microbiological Analysis:Number of Public Water Supplies Monitored Free of Faecal Coliforms: 1Number of Group Water Schemes Monitored Free of Faecal Coliforms: N/A
Percentage of Samples Free of Faecal Coliforms in Public Water Supplies: 100%Percentage of Samples Free of Faecal Coliforms in Group Water Schemes: N/A
Assessment of the Monitoring Results for 2003
There was one public water supplies monitored in Galway City in 2003 supplying water to a populationof 65,774 people.
Overall compliance with the drinking water standards in public water supplies was above average at99.3% and compliance was the second highest in the country. Compliance with the faecal coliformstandard in public water supplies was excellent in Galway City during 2003 and no samples testedpositive for the presence of either faecal or total coliforms. Compliance with all other parameters washigh though there were a number of non-compliances with the odour standard in 2003 (11 of 81samples analysed exceeded).
Review of the Period 2001-2003
The general quality of drinking water in public water supplies in Galway City was good during thereview period and the microbiological quality was excellent. However, compliance with the odourstandard was relatively low through out the review period and dropped from 91% in 2001 to 86% in2003.

The Quality of Drinking Water in Ireland A Report for the Year 2003
62
3.18. GALWAY (COUNTY)
Summary InformationNumber of Public Water Supplies Monitored during 2003: 44Estimated Population Served by Public Water Supplies Monitored during 2003: 84,185 personsOverall Percentage Compliance in Public Water Supplies: 96.2%Number of Group Water Schemes Monitored during 2003: 277Estimated Population Served by Group Water Schemes Monitored during 2003: 12,891 personsOverall Percentage Compliance in Group Water Schemes: 88.0%
Results of Microbiological Analysis:Number of Public Water Supplies Monitored Free of Faecal Coliforms: 33Number of Group Water Schemes Monitored Free of Faecal Coliforms: 218
Percentage of Samples Free of Faecal Coliforms in Public Water Supplies: 97.3%Percentage of Samples Free of Faecal Coliforms in Group Water Schemes: 79.6%
Assessment of the Monitoring Results for 2003
There were 44 public water supplies and 277 group water schemes monitored in Galway County in2003 collectively supplying water to a population of 97,076 people.
Overall compliance with the drinking water standards in public water supplies was below average at96.2%. Compliance with the faecal coliform standard in public water supplies was also slightly belowthe national average in Galway County during 2003. There were 13 incidents of faecal coliformcontamination of public water supplies during 2003. These were at Cleggan/Claggaduff, Craughwell(2 incidents), Dawros, Glenamaddy, Inishmore (2 incidents), Killimor, Kilconnell, Mountbellew,Portumna, Tuam and Tully-Tullycross. The incidents in Craughwell, Inishmore, Mountbellew andTully-Tullycross were serious (>20 cfu/100ml). Overall, of the 44 public water supplies in GalwayCounty, 33 were fully compliant with the faecal coliform standard. All public water supplies in GalwayCounty were fully compliant with the standards for nitrates, nitrites and ammonium. Monitoring foraluminium in Galway was insufficient in 2003 as just four samples were analysed. No samples wereanalysed from the Ballinasloe water supply which had a large number of exceedances in 2002 (8 of 9samples analysed).
The overall compliance rate for group water schemes in Galway County was below the nationalaverage at 88.0%. A total of 63 public and 214 ‘private’ group water schemes were monitored in 2003.The microbiological quality of the ‘public’ group water schemes was good with just 1 schemecontaminated with faecal coliforms during 2003 while of the 214 ‘private’ group water schemes 58were contaminated. Thus the very poor quality of the ‘private’ group water schemes brought theoverall compliance rate in group water schemes below the national average.
Review of the Period 2001-2003
The general quality of drinking water in public water supplies in Galway County was satisfactoryduring the review period though the large number of public water supplies that were contaminated withfaecal coliforms in 2003 is of concern. Compliance with the fluoride standard deteriorated in thereview period from 95% in 2001 to 87% in 2002, However compliance improved in 2003 to 96%.There has been a low number of samples analysed for aluminium in Galway in the past and wheremonitoring has been carried out it appears to indicate poor levels of compliance (compliance was nogreater than 50% throughout the period 2001-2003).
The overall quality of drinking water in group water schemes was unsatisfactory during the reviewperiod. A slight improvement in compliance with the faecal coliform standard 78% in 2001 to justunder 80% in 2003 was noted though further improvements must be made to improve the standard inthe poor quality ‘private’ group water schemes.

The Quality of Drinking Water in Ireland A Report for the Year 2003
63
3.19. KERRY
Summary InformationNumber of Public Water Supplies Monitored during 2003: 65Estimated Population Served by Public Water Supplies Monitored during 2003: 96,466 personsOverall Percentage Compliance in Public Water Supplies: 96.6%Number of Group Water Schemes Monitored during 2003: 143Estimated Population Served by Group Water Schemes Monitored during 2003: 14,935 personsOverall Percentage Compliance in Group Water Schemes: 92.8%
Results of Microbiological Analysis:Number of Public Water Supplies Monitored Free of Faecal Coliforms: 49Number of Group Water Schemes Monitored Free of Faecal Coliforms: 123
Percentage of Samples Free of Faecal Coliforms in Public Water Supplies: 97.2%Percentage of Samples Free of Faecal Coliforms in Group Water Schemes: 88.8%
Assessment of the Monitoring Results for 2003
There were 65 public water supplies and 143 group water schemes monitored in Kerry in 2003collectively supplying water to a population of 111,401 people.
Overall compliance with the drinking water standards in public water supplies was below average at96.6%. Compliance with the faecal coliform standard in public water supplies was also below thenational average in Kerry during 2003. There were 20 incidents of faecal coliform contamination in 16public water supplies during 2003. These were at Ballyvenoragh, Barraduff, Ballybunion,Caherboshina, Caherciveen, Caherdaniel (3 incidents), Cappagh West, Caragh Lake (2 incidents),Castlegregory, Duagh, Glenbeigh, Glenfahan (2 incidents), Lauragh, Listowel, Lixnaw and Waterville .Serious exceedances (>20 cfu/100ml) were reported in Ballybunion, Cappagh West, Castlegregory,Glenbeigh and Waterville. Overall, of the 65 public water supplies in Kerry, 49 were fully compliantwith the faecal coliform standard. All public water supplies in Kerry were fully compliant with thestandards for ammonium, nitrate and nitrite. Compliance was relatively low with the standards foraluminium (86%), fluoride (92%) and total coliforms (85%). There were a relatively large number ofaluminium exceedances in the Cappagh/Cloonfineela (6 of 15 samples analysed) and Listowel (8 of 26samples analysed) supplies though the latter supply is not currently in use.
The overall compliance rate for group water schemes in Kerry was slightly above the national averageat 92.8% as was compliance with the faecal coliform standard. Compliance in the 81 ‘public’ groupwater schemes (97%) was much higher than that of the ‘private’ group water schemes (73%) thoughcompliance with the total coliforms standard in both was poor at 70% for public and 44% for ‘private’group water schemes. Low pH and elevated levels of manganese were also common in the ‘private’group water schemes. One nitrate exceedance was reported in the Rath ‘private’ group water scheme;however, a new groundwater source is currently being used for this supply that complies with thenitrates standard.
Review of the Period 2001-2003
The general quality of drinking water in the majority of public water supplies in Kerry was satisfactoryduring the review period. However, it is a matter of concern that there continues to be a relatively highnumber of public water supplies contaminated with faecal material through out the review period.Percentage compliance with the aluminium standard has remained consistently low, a situation whichis most unsatisfactory. Compliance with the fluoride standard has dropped slightly during the reviewperiod from 96% in 2001 to 92% in 2003.
The overall quality of drinking water in group water schemes, particularly privately sourced ones waspoor during the review period. However, there has been a positive trend in compliance with thisstandard with compliance improving from 64% in 2001 to 89% in 2003.

The Quality of Drinking Water in Ireland A Report for the Year 2003
64
3.20. KILDARE
Summary InformationNumber of Public Water Supplies Monitored during 2003: 21Estimated Population Served by Public Water Supplies Monitored during 2003: 135,992 personsOverall Percentage Compliance in Public Water Supplies: 99.0%Number of Group Water Schemes Monitored during 2003: 11Estimated Population Served by Group Water Schemes Monitored during 2003: 2,240 personsOverall Percentage Compliance in Group Water Schemes: 98.1%
Results of Microbiological Analysis:Number of Public Water Supplies Monitored Free of Faecal Coliforms: 21Number of Group Water Schemes Monitored Free of Faecal Coliforms: 11
Percentage of Samples Free of Faecal Coliforms in Public Water Supplies: 100%Percentage of Samples Free of Faecal Coliforms in Group Water Schemes: 100%
Assessment of the Monitoring Results for 2003
There were 21 public water supplies and 11 group water schemes monitored in Kildare in 2003collectively supplying water to a population of 138,232 people.
Overall compliance with the drinking water standards in public water supplies was good and aboveaverage at 99.0%. Compliance with the faecal coliform standard in public water supplies was excellentduring 2003 with no samples analysed in any of the public water supplies testing positive for thepresence of faecal coliforms. All public water supplies in Kildare were also fully compliant with thestandards for ammonium, colour, fluoride, the heavy metals, nitrite, taste and pH. The sole issue wasthe elevated levels of nitrate in the Castlemitchell Housing and Kilmeade/Moatview supplies. Thelatter was replaced in 2003 while the former was due for replacement in September 2004.
The overall compliance rate for group water schemes in Kildare was above the national average at98.1%. Of particular note was the fact that all 11 group water schemes monitored were free of faecalcontamination during 2003 (one of only three counties to achieve this). The only exceedance of note inthe group water schemes was a nitrate exceedance in the Ballyroe/Leinster Lodge group water scheme.
Review of the Period 2001-2003
The general quality of drinking water in public water supplies in Kildare was good during the reviewperiod with the microbiological quality improving to excellent in 2003. The nitrate exceedances thathave occurred in some small public supplies in Kildare during the review period are being addressed.
The overall quality of drinking water in group water schemes was also good during the review periodwith no schemes breaching the faecal coliform standard in 2003. The microbiological quality ofdrinking water in Kildare was in general excellent and Kildare is the only county in Ireland where bothpublic water supplies and group water schemes were fully compliant with the standards for faecalcoliforms in 2003.

The Quality of Drinking Water in Ireland A Report for the Year 2003
65
3.21. KILKENNY
Summary InformationNumber of Public Water Supplies Monitored during 2003: 15Estimated Population Served by Public Water Supplies Monitored during 2003: 51,748 personsOverall Percentage Compliance in Public Water Supplies: 97.1%Number of Group Water Schemes Monitored during 2003: 26Estimated Population Served by Group Water Schemes Monitored during 2003: 3,463 personsOverall Percentage Compliance in Group Water Schemes: 94.7%
Results of Microbiological Analysis:Number of Public Water Supplies Monitored Free of Faecal Coliforms: 14Number of Group Water Schemes Monitored Free of Faecal Coliforms: 18
Percentage of Samples Free of Faecal Coliforms in Public Water Supplies: 98.7%Percentage of Samples Free of Faecal Coliforms in Group Water Schemes: 88.2%
Assessment of the Monitoring Results for 2003
There were 15 public water supplies and 26 group water schemes monitored in Kilkenny in 2003collectively supplying water to a population of 55,211 people.
Overall compliance with the drinking water standards in public water supplies was slightly belowaverage at 97.1%. Compliance with the faecal coliform standard in public water supplies was the sameas the national average during 2003. A number of moderate exceedances of the faecal coliformstandard were reported in the Mooncoin water supply during July 2003. Overall, of the 15 public watersupplies in Kilkenny, 14 were fully compliant with the faecal coliform standard. All public watersupplies in Kilkenny were fully compliant with the standards for ammonium, the heavy metals, nitrate,nitrite, odour and pH. Percentage compliance with the aluminium (81%) and fluoride (91%) standardswas relatively low in Kilkenny during 2003. The aluminium problem relates to poor compliance at theTroyswood supply. Intensive sampling during 2003 indicated that the water supplied failed to meet thestandard over 20% of the time (34 of 155 samples analysed failed). Non-compliances in theTroyswood supply have been ongoing for a number of years and must be addressed by the sanitaryauthority.
The overall compliance rate for group water schemes in Kilkenny was above the national average at94.7%. Although faecal coliform compliance was above average in 2003 over 30% of group waterschemes were contaminated during the year. Elevated levels of nitrates were also a problem inGalmoy, Kilree (Stonyford) and Windgap group water schemes
Review of the Period 2001-2003
The general quality of drinking water in public water supplies in Kilkenny was satisfactory during thereview period. There has been an improvement in the rate of compliance with the faecal coliformsstandard from 95% in 2001 to just under 99% in 2003. Compliance with the aluminium standardremains problematic in Troyswood though has improved somewhat in Mooncoin. Fluoride complianceremains consistently below average at 91% throughout the review period.
The overall quality of drinking water in group water schemes was unsatisfactory during the reviewperiod. The level of compliance with the faecal coliform standard has not improved between 2001 and2003 while the Galmoy, Kilree (Stonyford) and Windgap group water schemes exhibited nitrateexceedances in 2002 and 2003.

The Quality of Drinking Water in Ireland A Report for the Year 2003
66
3.22. LAOIS
Summary InformationNumber of Public Water Supplies Monitored during 2003: 20Estimated Population Served by Public Water Supplies Monitored during 2003: 57,476 personsOverall Percentage Compliance in Public Water Supplies: 99.2%Number of Group Water Schemes Monitored during 2003: 37Estimated Population Served by Group Water Schemes Monitored during 2003: 4,060 personsOverall Percentage Compliance in Group Water Schemes: 95.2%
Results of Microbiological Analysis:Number of Public Water Supplies Monitored Free of Faecal Coliforms: 20Number of Group Water Schemes Monitored Free of Faecal Coliforms: 32
Percentage of Samples Free of Faecal Coliforms in Public Water Supplies: 100%Percentage of Samples Free of Faecal Coliforms in Group Water Schemes: 91.5%
Assessment of the Monitoring Results for 2003
There were 20 public water supplies and 37 group water schemes monitored in Laois in 2003collectively supplying water to a population of 61,536 people.
Overall compliance with the drinking water standards in public water supplies was above average at99.2%. Compliance with the faecal coliform standard in public water supplies was excellent in Laoisduring 2003 and faecal coliforms were not detected in any of the public water supplies during the year.All public water supplies in Laois were also fully compliant with the standards for ammonium, nitrate,nitrite, odour, pH and turbidity. In general, compliance with the remaining parameters was high withisolate exceedances reported.
The overall compliance rate for group water schemes in Laois was above the national average at95.2%. Compliance with the faecal coliforms standard was also above average and exceedences wererestricted to a small number of schemes. One group water scheme, Clonard, reported high levels offluoride (2.8 mg/l) which were of concern.
Review of the Period 2001-2003
The general quality of drinking water in public water supplies in Laois was good during the reviewperiod and the microbiological quality was excellent with no exceedances of the faecal coliformstandard reported in 2002 or 2003 (just one sample in 2001 failed).
The overall quality of drinking water in group water schemes was satisfactory in the majority ofschemes during the review period, although a small number of schemes are persistently in breach of themicrobiological standards.

The Quality of Drinking Water in Ireland A Report for the Year 2003
67
3.23. LEITRIM
Summary InformationNumber of Public Water Supplies Monitored during 2003: 10Estimated Population Served by Public Water Supplies Monitored during 2003: 15,920 personsOverall Percentage Compliance in Public Water Supplies: 95.4%Number of Group Water Schemes Monitored during 2003: 167Estimated Population Served by Group Water Schemes Monitored during 2003: 16,396 personsOverall Percentage Compliance in Group Water Schemes: 90.3%
Results of Microbiological Analysis:Number of Public Water Supplies Monitored Free of Faecal Coliforms: 9Number of Group Water Schemes Monitored Free of Faecal Coliforms: 129
Percentage of Samples Free of Faecal Coliforms in Public Water Supplies: 99.6%Percentage of Samples Free of Faecal Coliforms in Group Water Schemes: 79.8%
Assessment of the Monitoring Results for 2003
There were 10 public water supplies and 167 group water schemes monitored in Leitrim in 2003collectively supplying water to a population of 32,316 people.
Overall compliance with the drinking water standards in public water supplies was below average at95.4%. Nonetheless, compliance with the faecal coliform standard in public water supplies was abovethe national average in Leitrim during 2003 with just one sample failing to meet the standard. Therewas one incident of faecal coliform contamination at the Dowra public water supply during 2003,although just one faecal coliform was detected with none detected in follow up sampling. Overall, ofthe 10 public water supplies in Leitrim, 9 were fully compliant with the faecal coliform standard. Allpublic water supplies in Leitrim were fully compliant with the standards for ammonium, the heavymetals, nitrate and nitrite. Compliance with the aluminium standard (at 61%) was poor in Leitrim in2003. The low rate of compliance was due to a large number of exceedances in the four plants wherealum is used as a coagulant namely Carrigallen (8 of 11 samples analysed), Dromahair (5 of 9 samplesanalysed), Drumkeeran (9 of 10 samples analysed) and South Leitrim (5 of 16 samples analysed).There were also a large number of exceedances of the odour standard (77% compliance) with all buttwo of the public water supplies in Leitrim having odour exceedances at least one during 2003.
The overall compliance rate for group water schemes in Leitrim was below the national average at90.3%. It is clear that the poor rate of faecal coliform compliance was due to the ‘private’ group waterschemes with 60% (29 of 48) exhibiting contamination during 2003 compared with 8% (9 of 119) forthe ‘public’ group water schemes. However, the ‘public’ group water schemes had a poor rate ofcompliance with the aluminium standard (69% compliance) although it is likely that this was due to thefailure of the parent public water supplies to meet the standards.
Review of the Period 2001-2003
The general microbiological quality of drinking water in public water supplies in Leitrim wassatisfactory during the review period with just one supply having quality problems (the Dowra supply).The level of compliance with the aluminium standard has remained consistently poor and unacceptablethroughout the review period and has only risen marginally from 56% in 2001 to 61% in 2003.
The overall quality of drinking water in group water schemes was poor during the review period. Therate of compliance for faecal coliforms remained consistently below average throughout the reviewperiod and the ‘private’ group water schemes were of particularly poor quality.

The Quality of Drinking Water in Ireland A Report for the Year 2003
68
3.24. LIMERICK (COUNTY)
Summary InformationNumber of Public Water Supplies Monitored during 2003: 59Estimated Population Served by Public Water Supplies Monitored during 2003: 67,763 personsOverall Percentage Compliance in Public Water Supplies: 98.2%Number of Group Water Schemes Monitored during 2003: 70Estimated Population Served by Group Water Schemes Monitored during 2003: 9,866 personsOverall Percentage Compliance in Group Water Schemes: 95.6%
Results of Microbiological Analysis:Number of Public Water Supplies Monitored Free of Faecal Coliforms: 55Number of Group Water Schemes Monitored Free of Faecal Coliforms: 63
Percentage of Samples Free of Faecal Coliforms in Public Water Supplies: 98.8%Percentage of Samples Free of Faecal Coliforms in Group Water Schemes: 91.6%
Assessment of the Monitoring Results for 2003
There were 59 public water supplies and 70 group water schemes monitored in Limerick County in2003 collectively supplying water to a population of 77,629 people.
Overall compliance with the drinking water standards in public water supplies was above average at98.2%. Compliance with the faecal coliform standard in public water supplies was also above thenational average in Limerick County during 2003. There were 7 incidents of faecal coliformcontamination of public water supplies during 2003. These were in the Doon, Leahys (2 incidents),Limerick City Environs and Pallasgreen (3 incidents) supplies. With the exception of the last incidentin Pallasgreen the incidents were all moderate in nature (<20 cfu/100ml). Overall, of the 59 publicwater supplies in Limerick County, 55 were fully compliant with the faecal coliform standard. Allpublic water supplies in Limerick County were fully compliant with the standards for nitrite, odour,taste and turbidity. Compliance with the fluoride standard was relatively low in Limerick Countyduring 2003 particularly so at the Abbeyfeale (11 of 40 samples exceeded) and Adare (13 of 19samples exceeded) schemes.
The overall compliance rate for group water schemes in Limerick County was above the nationalaverage at 95.6% due to an above average compliance rate with the faecal coliforms standard with 63of the 70 schemes free of contamination during 2003. The Newtown Clarina No2 supply also reportedelevated levels of nitrate during 2003.
Review of the Period 2001-2003
The general quality of drinking water in public water supplies in Limerick County was satisfactoryduring the review period. However, compliance with the faecal coliform standard has dropped from100% in 2001 to 98.8% in 2003. Conversely, compliance with the fluoride standard has improvedfrom 83% in 2001 to 91% in 2003 with further improvement required while compliance with thealuminium standard has also improved marginally from 92% to 95% over the same period.
During the review period there has been a consistent improvement in the faecal coliform compliancerate from 88% in 2001 to 92% in 2003 and the microbiological quality has been satisfactory in themajority of schemes monitored..

The Quality of Drinking Water in Ireland A Report for the Year 2003
69
3.25. LIMERICK CITY
Summary InformationNumber of Public Water Supplies Monitored during 2003: 1Estimated Population Served by Public Water Supplies Monitored during 2003: 56,000 personsOverall Percentage Compliance in Public Water Supplies: 99.2%Number of Group Water Schemes Monitored during 2003: 0Estimated Population Served by Group Water Schemes Monitored during 2003: N/AOverall Percentage Compliance in Group Water Schemes: N/A
Results of Microbiological Analysis:Number of Public Water Supplies Monitored Free of Faecal Coliforms: 1Number of Group Water Schemes Monitored Free of Faecal Coliforms: N/A
Percentage of Samples Free of Faecal Coliforms in Public Water Supplies: 100%Percentage of Samples Free of Faecal Coliforms in Group Water Schemes: N/A
Assessment of the Monitoring Results for 2003
There was one public water supply monitored in Limerick City in 2003 supplying water to a populationof approximately 56,000 persons.
Overall compliance with the drinking water standards in public water supplies was above average at99.2% compliance. Compliance with the faecal coliform standards was good with no breaches of thefaecal coliform standard during 2003.. As in previous years compliance with the aluminium standardwas relatively low (22 samples of 310 analysed exceeded) though there was a notable improvementsince the previous year.
Review of the Period 2001-2003
The general quality of drinking water in the Limerick City supply remained satisfactory during thereview period. However, compliance with the aluminium standard remained problematic though animprovement was noted in 2003 compared to 2002.
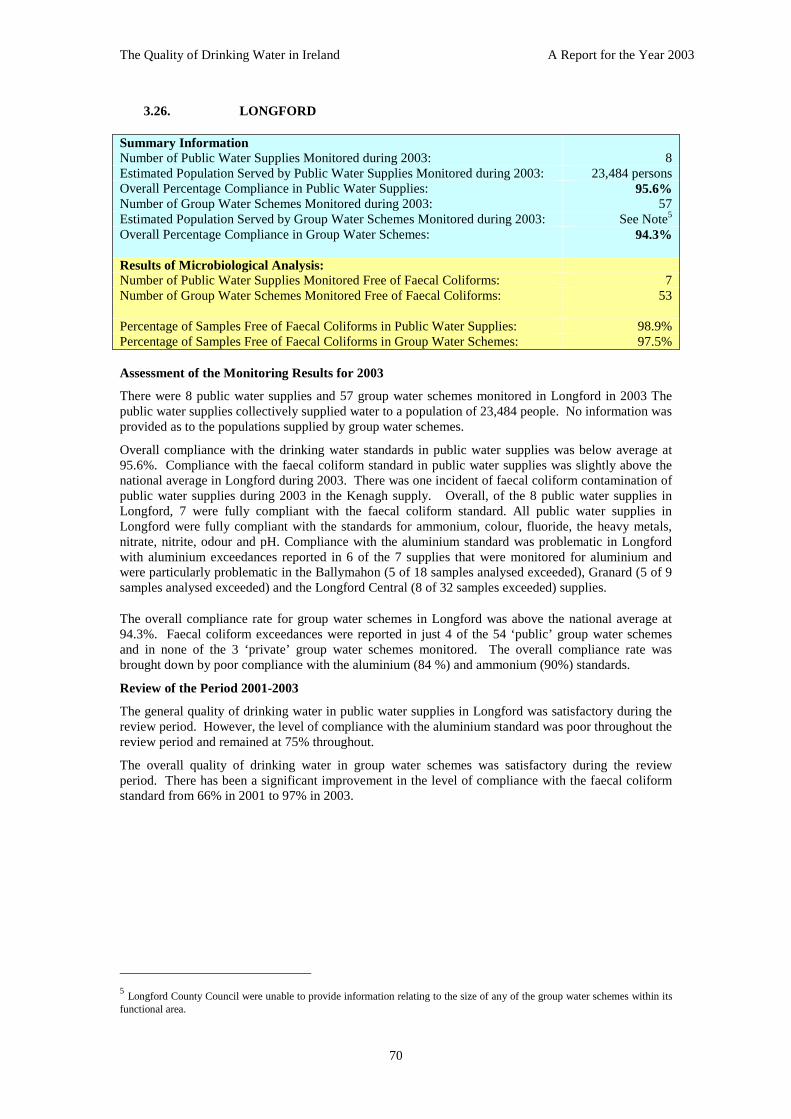
The Quality of Drinking Water in Ireland A Report for the Year 2003
70
3.26. LONGFORD
Summary InformationNumber of Public Water Supplies Monitored during 2003: 8Estimated Population Served by Public Water Supplies Monitored during 2003: 23,484 personsOverall Percentage Compliance in Public Water Supplies: 95.6%Number of Group Water Schemes Monitored during 2003: 57Estimated Population Served by Group Water Schemes Monitored during 2003: See Note5
Overall Percentage Compliance in Group Water Schemes: 94.3%
Results of Microbiological Analysis:Number of Public Water Supplies Monitored Free of Faecal Coliforms: 7Number of Group Water Schemes Monitored Free of Faecal Coliforms: 53
Percentage of Samples Free of Faecal Coliforms in Public Water Supplies: 98.9%Percentage of Samples Free of Faecal Coliforms in Group Water Schemes: 97.5%
Assessment of the Monitoring Results for 2003
There were 8 public water supplies and 57 group water schemes monitored in Longford in 2003 Thepublic water supplies collectively supplied water to a population of 23,484 people. No information wasprovided as to the populations supplied by group water schemes.
Overall compliance with the drinking water standards in public water supplies was below average at95.6%. Compliance with the faecal coliform standard in public water supplies was slightly above thenational average in Longford during 2003. There was one incident of faecal coliform contamination ofpublic water supplies during 2003 in the Kenagh supply. Overall, of the 8 public water supplies inLongford, 7 were fully compliant with the faecal coliform standard. All public water supplies inLongford were fully compliant with the standards for ammonium, colour, fluoride, the heavy metals,nitrate, nitrite, odour and pH. Compliance with the aluminium standard was problematic in Longfordwith aluminium exceedances reported in 6 of the 7 supplies that were monitored for aluminium andwere particularly problematic in the Ballymahon (5 of 18 samples analysed exceeded), Granard (5 of 9samples analysed exceeded) and the Longford Central (8 of 32 samples exceeded) supplies.
The overall compliance rate for group water schemes in Longford was above the national average at94.3%. Faecal coliform exceedances were reported in just 4 of the 54 ‘public’ group water schemesand in none of the 3 ‘private’ group water schemes monitored. The overall compliance rate wasbrought down by poor compliance with the aluminium (84 %) and ammonium (90%) standards.
Review of the Period 2001-2003
The general quality of drinking water in public water supplies in Longford was satisfactory during thereview period. However, the level of compliance with the aluminium standard was poor throughout thereview period and remained at 75% throughout.
The overall quality of drinking water in group water schemes was satisfactory during the reviewperiod. There has been a significant improvement in the level of compliance with the faecal coliformstandard from 66% in 2001 to 97% in 2003.
5Longford County Council were unable to provide information relating to the size of any of the group water schemes within its
functional area.

The Quality of Drinking Water in Ireland A Report for the Year 2003
71
3.27. LOUTH
Summary InformationNumber of Public Water Supplies Monitored during 2003: 15Estimated Population Served by Public Water Supplies Monitored during 2003: 22,515 personsOverall Percentage Compliance in Public Water Supplies: 97.3%Number of Group Water Schemes Monitored during 2003: 11Estimated Population Served by Group Water Schemes Monitored during 2003: 4,575 personsOverall Percentage Compliance in Group Water Schemes: 86.6%
Results of Microbiological Analysis:Number of Public Water Supplies Monitored Free of Faecal Coliforms: 13Number of Group Water Schemes Monitored Free of Faecal Coliforms: 5
Percentage of Samples Free of Faecal Coliforms in Public Water Supplies: 98.2%Percentage of Samples Free of Faecal Coliforms in Group Water Schemes: 88.2%
Assessment of the Monitoring Results for 2003
There were 15 public water supplies and 11 group water schemes monitored in Louth in 2003collectively supplying water to a population of 27,090 people.
Overall compliance with the drinking water standards in public water supplies was slightly belowaverage at 97.3%. Compliance with the faecal coliform standard in public water supplies was alsoslightly below the national average in Louth during 2003. There were 2 incidents of faecal coliformcontamination of public water supplies during 2003. These were in the Clogerhead and Dunbinsupplies. Both incidents were moderate exceedances (<20 cfu/100ml). Overall, of the 15 public watersupplies in Louth, 13 were fully compliant with the faecal coliform standard. All public water suppliesin Louth were fully compliant with the standards for ammonium, colour, the heavy metals, manganese,nitrate, nitrite and pH. The addition of alum was problematic at the Ardee treatment plant as the plantwas running over capacity and as a result a number of exceedances were reported (4 of 9 samplesanalysed).
The overall compliance rate for group water schemes in Louth was below the national average at86.6%. Over half of the group water schemes monitored were contaminated at some stage during2003. However, 4 of the 6 offending group water schemes have since had disinfection equipmentinstalled which should eliminate future exceedances. The nitrate exceedances in the Sheepgrangesupply continued in 2003 and this scheme was the subject of an application to the Agency for adeparture from the Regulations.
Review of the Period 2001-2003
The general quality of drinking water in public water supplies in Louth was satisfactory during thereview period. Compliance with the aluminium standard has improved during the review period from83% in 2001 to 91% in 2003 with further improvement required.
The overall quality of drinking water in group water schemes was poor during the review period. Alarge number of group water schemes were found to be contaminated throughout the review periodalthough compliance has improved from 81% in 2001 to 88% in 2003 and this is to be welcomed.

The Quality of Drinking Water in Ireland A Report for the Year 2003
72
3.28. MAYO
Summary InformationNumber of Public Water Supplies Monitored during 2003: 27Estimated Population Served by Public Water Supplies Monitored during 2003: 70,000 personsOverall Percentage Compliance in Public Water Supplies: 97.0%Number of Group Water Schemes Monitored during 2003: 331Estimated Population Served by Group Water Schemes Monitored during 2003: 53,673 personsOverall Percentage Compliance in Group Water Schemes: 89.8%
Results of Microbiological Analysis:Number of Public Water Supplies Monitored Free of Faecal Coliforms: 24Number of Group Water Schemes Monitored Free of Faecal Coliforms: 203
Percentage of Samples Free of Faecal Coliforms in Public Water Supplies: 97.1%Percentage of Samples Free of Faecal Coliforms in Group Water Schemes: 72.5%
Assessment of the Monitoring Results for 2003
There were 27 public water supplies and 331 group water schemes monitored in Mayo in 2003collectively supplying water to a population of 123,673 people.
Overall compliance with the drinking water standards in public water supplies was below average at97.0%. Compliance with the faecal coliform standard in public water supplies was also below thenational average in Mayo during 2003. There were 6 incidents of faecal coliform contamination ofpublic water supplies during 2003. These were in the Ballyhaunis (3 incidents), Kilkelly (2 incidents)and Kiltimagh supplies. Of particular concern was the first incident in the Kilkelly supply where thesupply was almost continually contaminated for a period of one month during 2003. Overall, of the 27public water supplies in Mayo, 24 were fully compliant with the faecal coliform standard. All publicwater supplies in Mayo were fully compliant with the standards for nitrates, nitrites and the heavymetals. Compliance with the aluminium standard was problematic in Mayo during 2003 and in spiteof a small number of samples being analysed a relatively high proportion of them failed (7 of 18samples exceeded). The sole sample analysed for aluminium in the Lough Mask (Claremorris),Newport and Shrule supplies exceeded the standard while both samples in the Louisburgh supplyexceeded the standard. In spite of the exceedances no additional sampling was undertaken.
Mayo County Council did not submit the complete set of monitoring results for group water schemes intime for inclusion in this report. Monitoring carried out for November and December 2003 under theRural Water National Monitoring Programme was not submitted to the Agency in time for inclusion inthe report despite numerous requests by the Agency to the Council. This situation is unacceptable andthe Council must review its data collection and reporting facilities to ensure that this situation is notrepeated in future years. As such the report for group water schemes in Mayo cannot be consideredcomplete but representative of the period January to October 2003.
The overall compliance rate for group water schemes in Mayo was below the national average at89.8%. The level of non-compliance in ‘private’ group water schemes in Mayo was most unacceptablewith 106 of the 150 ‘private’ group water schemes contaminated with faecal material at some stageduring 2003. Compliance with the total coliform standard in ‘private’ group water schemes was alsovery poor with a compliance rate of just 32%. Though the level of compliance with the faecal and totalcoliform standard in ‘public’ group water schemes was higher, compliance with the aluminiumstandard was a problem with a rate of compliance of just 84%.
Review of the Period 2001-2003
The general quality of drinking water in public water supplies in Mayo was satisfactory during thereview period with the exception of the schemes highlighted above. However, it is likely thatcompliance would be lower if sufficient sampling had been carried out for aluminium in 2003.
The overall quality of drinking water in group water schemes was poor during the review period.Though the overall faecal coliform compliance rate (public and ‘private’ group water schemescombined) improved over the review period from 56% in 2001 to 73% in 2003, the compliance rate forfaecal coliforms in ‘private’ group water schemes dropped from 61% in 2002 to 51% in 2003.

The Quality of Drinking Water in Ireland A Report for the Year 2003
73
3.29. MEATH
Summary InformationNumber of Public Water Supplies Monitored during 2003: 41Estimated Population Served by Public Water Supplies Monitored during 2003: 94,738 personsOverall Percentage Compliance in Public Water Supplies: 98.1%Number of Group Water Schemes Monitored during 2003: 5Estimated Population Served by Group Water Schemes Monitored during 2003: 1,359 personsOverall Percentage Compliance in Group Water Schemes: 96.7%
Results of Microbiological Analysis:Number of Public Water Supplies Monitored Free of Faecal Coliforms: 39Number of Group Water Schemes Monitored Free of Faecal Coliforms: 4
Percentage of Samples Free of Faecal Coliforms in Public Water Supplies: 99.1%Percentage of Samples Free of Faecal Coliforms in Group Water Schemes: 95.5%
Assessment of the Monitoring Results for 2003
There were 41 public water supplies and 5 group water schemes monitored in Meath in 2003collectively supplying water to a population of 96,097 people.
Overall compliance with the drinking water standards in public water supplies was above average at98.1%. Compliance with the faecal coliform standard in public water supplies was also above thenational average in Meath during 2003. There were 2 incidents of faecal coliform contamination ofpublic water supplies during 2003. These were in the Dunsany and East Meath (Bettystown/Laytown)supplies though both were moderate exceedances (<20 cfu/100ml) and were faecal coliforms were notdetected in follow up samples. The remaining public water supplies were fully compliant with thefaecal coliform standard. All public water supplies in Meath were fully compliant with the standardsfor colour, nitrates, nitrite, ammonium and the heavy metals. The majority of other exceedances werenot of major significant although a number of aluminium exceedances were reported in the Trim supply(4 of 15 samples analysed).
The overall compliance rate for group water schemes in Meath was above the national average at96.7%. Just one of the 5 ‘private’ group water schemes tested positive for faecal coliforms during 2003although that exceedances was moderate and was not repeated during the year.
Review of the Period 2001-2003
The general quality of drinking water in public water supplies in Meath was satisfactory during thereview period. Of note was the elimination of fluoride exceedances in Meath during 2003.Compliance with the fluoride standard improved from 89% in 2001 to 100% in 2003 while compliancewith the faecal coliform standard improved during the review period from 95% in 2001 to 99% in2003.
The overall quality of drinking water in the small number of group water schemes in Meath wassatisfactory during the review period.

The Quality of Drinking Water in Ireland A Report for the Year 2003
74
3.30. MONAGHAN
Summary InformationNumber of Public Water Supplies Monitored during 2003: 15Estimated Population Served by Public Water Supplies Monitored during 2003: 40,006 personsOverall Percentage Compliance in Public Water Supplies: 94.9%Number of Group Water Schemes Monitored during 2003: 15Estimated Population Served by Group Water Schemes Monitored during 2003: 19,639 personsOverall Percentage Compliance in Group Water Schemes: 88.9%
Results of Microbiological Analysis:Number of Public Water Supplies Monitored Free of Faecal Coliforms: 13Number of Group Water Schemes Monitored Free of Faecal Coliforms: 10
Percentage of Samples Free of Faecal Coliforms in Public Water Supplies: 97.8%Percentage of Samples Free of Faecal Coliforms in Group Water Schemes: 90.9%
Assessment of the Monitoring Results for 2003
There were 15 public water supplies and 15 group water schemes monitored in Monaghan in 2003collectively supplying water to a population of 59,645 people.
Overall compliance with the drinking water standards in public water supplies was below average at94.9% and was one of the lowest in the country. Compliance with the faecal coliform standard inpublic water supplies was also the national average in Monaghan during 2003. There were 3 incidentsof faecal coliform contamination of public water supplies during 2003. These were in theScotstown/Ballinode (2 incidents) and Smithborough supplies. However, all three incidents were dueto the detection of a single faecal coliform in a single sample (none were found in follow up samples).Overall, of the 15 public water supplies in Monaghan, 13 were fully compliant with the faecal coliformstandard. All public water supplies in Monaghan were fully compliant with the standards foraluminium, the heavy metals, nitrate and pH. The overall low level of compliance was due in part tolow levels of compliance with the iron (86%), manganese (78%) and total coliforms (86%) standards.
The overall compliance rate for group water schemes in Monaghan was below the national average at88.9% although compliance with the faecal coliform standard was above average at 91% compliance.The below average level of compliance was due to poor compliance with the colour (66%), iron (84%),manganese (69%) and total coliform standard (64%).
Review of the Period 2001-2003
The general quality of drinking water in the majority of public water supplies in Monaghan wassatisfactory during the review period, however, the high number of exceedences reported for a varietyof parameters ssuch as iron, managanese and total coliforms remains unsatisfactory..
The overall quality of drinking water in group water schemes was unsatisfactory during the reviewperiod though compliance with the faecal coliform standard did improved slightly over the reviewperiod from 87% in 2001 to 91% in 2003.

The Quality of Drinking Water in Ireland A Report for the Year 2003
75
3.31. NORTH TIPPERARY
Summary InformationNumber of Public Water Supplies Monitored during 2003: 22Estimated Population Served by Public Water Supplies Monitored during 2003: 43,819 personsOverall Percentage Compliance in Public Water Supplies: 97.5%Number of Group Water Schemes Monitored during 2003: 38Estimated Population Served by Group Water Schemes Monitored during 2003: 6,616 personsOverall Percentage Compliance in Group Water Schemes: 97.5%
Results of Microbiological Analysis:Number of Public Water Supplies Monitored Free of Faecal Coliforms: 20Number of Group Water Schemes Monitored Free of Faecal Coliforms: 31
Percentage of Samples Free of Faecal Coliforms in Public Water Supplies: 95.3%Percentage of Samples Free of Faecal Coliforms in Group Water Schemes: 95.0%
Assessment of the Monitoring Results for 2003
There were 22 public water supplies and 38 group water schemes monitored in North Tipperary in2003 collectively supplying water to a population of 50,435 people.
Overall compliance with the drinking water standards in public water supplies was close to the nationalaverage at 97.5%. Compliance with the faecal coliform standard in public water supplies was belowthe national average in North Tipperary during 2003. There were 2 incidents of faecal coliformcontamination of public water supplies during 2003. These were in the Ballingarry/Aglish andLittleton, both of which were serious (>20 cfu/100ml). Overall, of the 22 public water supplies inNorth Tipperary, 20 were fully compliant with the faecal coliform standard. All public water suppliesin North Tipperary were fully compliant with the standards for colour, pH, aluminium, nitrate, nitriteand the heavy metals.
The overall compliance rate for group water schemes in North Tipperary was above the nationalaverage at 97.5%. Although compliance with the faecal coliform standard based on the number ofsamples was above average nonetheless 7 of the 38 ‘private’ group water schemes were contaminatedwith faecal material during 2003. Compliance with the manganese standard was problematic in groupwater schemes in North Tipperary during 2003 (6 of 11 samples exceeded).
Review of the Period 2001-2003
The general quality of drinking water in public water supplies in North Tipperary was satisfactoryduring the review period. Although compliance with the fluoride standard has improved over thereview period from 91% in 2001 to 95% in 2003 it has dropped from 98% in 2002.
The overall quality of drinking water in group water schemes was satisfactory during the reviewperiod. There was a welcome improvement in the level of compliance with the faecal coliformstandard from 74% in 2001 to 95% in 2003.

The Quality of Drinking Water in Ireland A Report for the Year 2003
76
3.32. OFFALY
Summary InformationNumber of Public Water Supplies Monitored during 2003: 21Estimated Population Served by Public Water Supplies Monitored during 2003: 39,287 personsOverall Percentage Compliance in Public Water Supplies: 98.8%Number of Group Water Schemes Monitored during 2003: 20Estimated Population Served by Group Water Schemes Monitored during 2003: 14,094 personsOverall Percentage Compliance in Group Water Schemes: 93.0%
Results of Microbiological Analysis:Number of Public Water Supplies Monitored Free of Faecal Coliforms: 18Number of Group Water Schemes Monitored Free of Faecal Coliforms: 16
Percentage of Samples Free of Faecal Coliforms in Public Water Supplies: 99.1%Percentage of Samples Free of Faecal Coliforms in Group Water Schemes: 96.1%
Assessment of the Monitoring Results for 2003
There were 21 public water supplies and 20 group water schemes monitored in Offaly in 2003collectively supplying water to a population of 53,381 people.
Overall compliance with the drinking water standards in public water supplies was above average at98.8%. Compliance with the faecal coliform standard in public water supplies was close to the nationalaverage in Offaly during 2003. There were 3 incidents of faecal coliform contamination of publicwater supplies during 2003. These were in the Dunkerin, Mount Bolus and Tullamore public watersupplies. None of these incidents were serious. Overall, of the 21 public water supplies in Offaly, 18were fully compliant with the faecal coliform standard. All public water supplies in Offaly were fullycompliant with the standards for ammonium, colour, fluoride, the heavy metals, nitrate, nitrite,manganese, odour and pH. Compliance with all other parameters was high with the exception ofaluminium (89%). This was due to problems in complying with the aluminium standard at the Rhode(3 of 6 samples exceeded) and Tullamore (11 of 14 samples exceeded) supplies, the latter reportedlybeing due to the plant operating at approximately 30% above design capacity
The overall compliance rate for group water schemes in Offaly was above the national average at93.0%. Faecal coliform compliance was above average in group water schemes in Offaly during 2003.
Review of the Period 2001-2003
The general quality of drinking water in public water supplies in Offaly was satisfactory during thereview period. Faecal coliform compliance remained high and actually improved during the reviewperiod. However, compliance with the aluminium standard has dropped from 99% in 2001 to 88% in2003 primarily due to the operation of the Tullamore treatment plant above design capacity (althoughother supplies also experienced aluminium exceedances during 2003).
The overall quality of drinking water in group water schemes was satisfactory during the reviewperiod. Comprehensive monitoring of the 20 ‘private’ group water schemes indicated that the level ofcompliance was high and improved slightly from 90% in 2001 to 93% in 2003.

The Quality of Drinking Water in Ireland A Report for the Year 2003
77
3.33. ROSCOMMON
Summary InformationNumber of Public Water Supplies Monitored during 2003: 18Estimated Population Served by Public Water Supplies Monitored during 2003: 41,890 personsOverall Percentage Compliance in Public Water Supplies: 89.5%Number of Group Water Schemes Monitored during 2003: 182Estimated Population Served by Group Water Schemes Monitored during 2003: 18,793 personsOverall Percentage Compliance in Group Water Schemes: 92.5%
Results of Microbiological Analysis:Number of Public Water Supplies Monitored Free of Faecal Coliforms: 9Number of Group Water Schemes Monitored Free of Faecal Coliforms: 145
Percentage of Samples Free of Faecal Coliforms in Public Water Supplies: 97.2%Percentage of Samples Free of Faecal Coliforms in Group Water Schemes: 88.1%
Assessment of the Monitoring Results for 2003
There were 18 public water supplies and 182 group water schemes monitored in Roscommon in 2003collectively supplying water to a population of 60,683 people.
Overall compliance with the drinking water standards in public water supplies was below average at89.5% and was the lowest in the country during the year. Compliance with the faecal coliformstandard in public water supplies was also below the national average in Roscommon during 2003.Half of the public water supplies in Roscommon reported incidents of faecal contamination during2003. In total there were 10 incidents of faecal coliform contamination of public water supplies during2003 in the Arigna, Ballinagare, Ballinlough, Ballyfarnan, Boyle/Ardcarne, Grangemore, Keadue,Knockcroghery/Leacarrow (2 incidents) and Roscommon Central. All public water supplies inRoscommon were fully compliant with the standards for just two parameters pH and nitrates. Thelevel of compliance with the fluoride standard in Roscommon as reported was extremely low (57%)however, upon investigation it was indicated that the method of analysis failed to comply with theintercallibration samples (i.e. the test method was not accurate). Health board monitoring for fluorideindicates a higher level of compliance (89%) though still a significant number of exceedances werereported. Compliance with the colour (82%), odour (76%), taste (76%), iron (88%) and manganese(89%) was also poor in Roscommon contributing to the overall low level of compliance in the county.
The overall compliance rate for group water schemes in Roscommon was slightly above the nationalaverage at 92.5% as was compliance with the faecal coliform standard. However, it is clear that thelevel of compliance in ‘private’ group water schemes is far below that of the ‘public’ group waterschemes with 28 (of 56) private compared to 9 (of 126) ‘public’ group water schemes reportingcontamination with faecal coliforms during 2003.
Review of the Period 2001-2003
The general quality of drinking water in public water supplies in Roscommon has declined during thereview period. In spite of a slight improvement in the overall compliance rate with the faecal coliformstandard, an unacceptably high percentage of public water supplies were contaminated during 2003.Compliance with the fluoride standard (at 89% if the health board data is taken as more accurate) isstill unacceptably low and has not improved during the review period.
The overall quality of drinking water in group water schemes was unsatisfactory during the reviewperiod. Although the poor microbiological quality of these schemes can be attributed to the ‘private’group water schemes compliance rates in the ‘public’ group water schemes for parameters such ascolour, odour and taste are also low.

The Quality of Drinking Water in Ireland A Report for the Year 2003
78
3.34. SLIGO TOWN
Summary InformationNumber of Public Water Supplies Monitored during 2003: 3Estimated Population Served by Public Water Supplies Monitored during 2003: 19,500 personsOverall Percentage Compliance in Public Water Supplies: 97.8%Number of Group Water Schemes Monitored during 2003: N/AEstimated Population Served by Group Water Schemes Monitored during 2003: N/AOverall Percentage Compliance in Group Water Schemes: N/A
Results of Microbiological Analysis:Number of Public Water Supplies Monitored Free of Faecal Coliforms: 2Number of Group Water Schemes Monitored Free of Faecal Coliforms: N/A
Percentage of Samples Free of Faecal Coliforms in Public Water Supplies: 99.3%Percentage of Samples Free of Faecal Coliforms in Group Water Schemes: N/A
Assessment of the Monitoring Results for 2003
There were 3 public water supplies monitored in Sligo Town in 2003 collectively supplying water to apopulation of 19,500 people.
Overall compliance with the drinking water standards in public water supplies was close to the nationalaverage at 97.8%. Compliance with the faecal coliform standard in public water supplies was abovethe national average in Sligo Town during 2003 although 2 incidents were reported in the Kilsellaghsupply one of which was serious (>20 cfu/100ml. All three public water supplies in Sligo Town werefully compliant with the standards for turbidity, odour, nitrates, nitrite, ammonium, fluoride and theheavy metals. As previously noted no monitoring for aluminium in the Lough Gill (Foxes Den)supply was reported in spite of alum being used as a coagulant in the treatment process.
Review of the Period 2001-2003
The general quality of drinking water in public water supplies in Sligo Town was satisfactory duringthe review period. However, it remains unacceptable that no monitoring for aluminium in the LoughGill (Foxes Den) supply was reported during the review period.

The Quality of Drinking Water in Ireland A Report for the Year 2003
79
3.35. SLIGO COUNTY
Summary InformationNumber of Public Water Supplies Monitored during 2003: 8Estimated Population Served by Public Water Supplies Monitored during 2003: 29,620 personsOverall Percentage Compliance in Public Water Supplies: 96.1%Number of Group Water Schemes Monitored during 2003: 23Estimated Population Served by Group Water Schemes Monitored during 2003: 18,793 personsOverall Percentage Compliance in Group Water Schemes: 89.4%
Results of Microbiological Analysis:Number of Public Water Supplies Monitored Free of Faecal Coliforms: 6Number of Group Water Schemes Monitored Free of Faecal Coliforms: 12
Percentage of Samples Free of Faecal Coliforms in Public Water Supplies: 98.7%Percentage of Samples Free of Faecal Coliforms in Group Water Schemes: 75.8%
Assessment of the Monitoring Results for 2003
There were 8 public water supplies and 23 group water schemes monitored in Sligo County in 2003collectively supplying water to a population of 48,413 people.
Overall compliance with the drinking water standards in public water supplies was below average at96.1%. Compliance with the faecal coliform standard in public water supplies was the same as thenational average in Sligo County during 2003. There were 2 incidents of faecal coliformcontamination of public water supplies during 2003. These were in the Lough Gill (Cairns Hill) andLough Talt Regional water supplies. Both of these incidents were due to the detection of a singlefaecal coliform that was not detected in follow up sampling. Overall, of the 8 public water supplies inSligo County, 6 were fully compliant with the faecal coliform standard. All public water supplies inSligo County were fully compliant with the standards for turbidity, odour, nitrates, nitrites andammonium. Elevated levels of iron and manganese were problematic in some supplies in Sligo withcompliance at 89% and 88% respectively.
The overall compliance rate for group water schemes in Sligo County was below the national averageat 89.4%. Compliance with the faecal coliform standard was also poor and below the average. Thepoor rate of compliance was due to the ‘private’ group water schemes (all ‘public’ group waterschemes were fully compliant with the faecal coliform standard). Nine of the 11 ‘private’ group waterschemes in Sligo County were contaminated with faecal coliforms during 2003.
Review of the Period 2001-2003
The general quality of drinking water in public water supplies in Sligo County was satisfactory duringthe review period. Compliance with the faecal coliform standard was high throughout the reviewperiod.
The overall quality of drinking water in group water schemes was poor during the review period.Compliance in the ‘private’ group water schemes (no monitoring for ‘public’ group water schemes wasreported prior to 2003) has remained consistently poor and below 50%. It is unacceptable that 9 of the11 ‘private’ group water schemes in Sligo contained faecal material at some time during 2003.

The Quality of Drinking Water in Ireland A Report for the Year 2003
80
3.36. SOUTH DUBLIN
Summary InformationNumber of Public Water Supplies Monitored during 2003: See Dublin CityEstimated Population Served by Public Water Supplies Monitored during 2003: See Dublin CityOverall Percentage Compliance in Public Water Supplies: 99.3%Number of Group Water Schemes Monitored during 2003: 1Estimated Population Served by Group Water Schemes Monitored during 2003: 250Overall Percentage Compliance in Group Water Schemes: 97.4%
Results of Microbiological Analysis:Number of Public Water Supplies Monitored Free of Faecal Coliforms: AllNumber of Group Water Schemes Monitored Free of Faecal Coliforms: 0
Percentage of Samples Free of Faecal Coliforms in Public Water Supplies: 100%Percentage of Samples Free of Faecal Coliforms in Group Water Schemes: 95.4%
Assessment of the Monitoring Results for 2003
The drinking water supply in Dublin comes from a mixture of four surface water sources which as awhole supply water to a population of approximately 1.3 million people. There is also one small publicwater supply providing water to Brittas and one ‘private’ group water scheme in Crooksling.
Overall compliance with the drinking water standards in public water supplies was above average at99.3%. Compliance with the faecal coliform standard in public water supplies was excellent with noneof the 423 samples analysed testing positive for the presence of faecal coliforms during 2003.Compliance with all other parameters was high.
The quality of the Crooksling group water scheme was unsatisfactory as faecal coliforms were detectedtwice during 2003. Apart from this compliance with the remaining parameters was satisfactory.
Review of the Period 2001-2003
The general quality of drinking water in public water supplies in South Dublin was good during thereview period. Of particular note is the fact that not a single sample tested positive for faecal coliformsduring the review period and thus was of excellent microbiological quality. However, the quality ofdrinking water in the one group water scheme in South Dublin was unsatisfactory during the reviewperiod with faecal coliforms detected both in 2002 and 2003 in the supply (it was not tested in 2001).

The Quality of Drinking Water in Ireland A Report for the Year 2003
81
3.37. SOUTH TIPPERARY
Summary InformationNumber of Public Water Supplies Monitored during 2003: 24Estimated Population Served by Public Water Supplies Monitored during 2003: 53,888 personsOverall Percentage Compliance in Public Water Supplies: 98.7%Number of Group Water Schemes Monitored during 2003: 13Estimated Population Served by Group Water Schemes Monitored during 2003: 435 personsOverall Percentage Compliance in Group Water Schemes: 89.9%
Results of Microbiological Analysis:Number of Public Water Supplies Monitored Free of Faecal Coliforms: 22Number of Group Water Schemes Monitored Free of Faecal Coliforms: 9
Percentage of Samples Free of Faecal Coliforms in Public Water Supplies: 99.4%Percentage of Samples Free of Faecal Coliforms in Group Water Schemes: 75.0%
Assessment of the Monitoring Results for 2003
There were 24 public water supplies and 13 group water schemes monitored in South Tipperary in2003 collectively supplying water to a population of 54,323 people.
Overall compliance with the drinking water standards in public water supplies was above the average at98.7%. Compliance with the faecal coliform standard in public water supplies was also above thenational average in South Tipperary during 2003. There were 2 incidents of faecal coliformcontamination of public water supplies during 2003. These were in the Ardfinnan Regional andMullenbawn supplies, both of which were moderate incidents (<20 cfu/100ml). Overall, of the 24public water supplies in South Tipperary, 22 were fully compliant with the faecal coliform standard.All public water supplies in South Tipperary were fully compliant with the standards for odour, taste,nitrates, nitrites and ammonium. Compliance with the aluminium standard was poor in SouthTipperary during 2003 (77% compliance). There were exceedances of the aluminium standardreported in the Ardfinnan Regional (5 of 11 samples analysed), Dundrum Regional (3 of 12 samplesanalysed) and Galtee Regional (10 of 27 samples analysed) supplies.
The overall compliance rate for group water schemes in South Tipperary was below the nationalaverage at 89.9% with 4 of the 13 ‘private’ group water schemes contaminated at some stage during2003. Low pH was a problem with 5 of the 13 group water schemes failing to comply with thestandard.
Review of the Period 2001-2003
The general quality of drinking water in public water supplies in South Tipperary was satisfactoryduring the review period. Compliance with the faecal coliform standard has improved during thereview period from 97% in 2001 to over 99% in 2003. Aluminium compliance has improved duringthe review period from 60% in 2001 to 77% in 2003 but this level of compliance is still far fromacceptable.
The overall quality of drinking water in group water schemes was unsatisfactory during the reviewperiod. Though the level of compliance with the faecal coliform standard has improved from 56% in2001 to 75% in 2003 it is nonetheless unacceptable and in need of further improvement.

The Quality of Drinking Water in Ireland A Report for the Year 2003
82
3.38. WATERFORD CITY
Summary InformationNumber of Public Water Supplies Monitored during 2003: 1Estimated Population Served by Public Water Supplies Monitored during 2003: 50,000 personsOverall Percentage Compliance in Public Water Supplies: 99.1%Number of Group Water Schemes Monitored during 2003: N/AEstimated Population Served by Group Water Schemes Monitored during 2003: N/AOverall Percentage Compliance in Group Water Schemes: N/A
Results of Microbiological Analysis:Number of Public Water Supplies Monitored Free of Faecal Coliforms: 1Number of Group Water Schemes Monitored Free of Faecal Coliforms: N/A
Percentage of Samples Free of Faecal Coliforms in Public Water Supplies: 100%Percentage of Samples Free of Faecal Coliforms in Group Water Schemes: N/A
Assessment of the Monitoring Results for 2003
The drinking water supply in Waterford City serving a population of 50,000 was of good quality during2003 and compliance was above average at 99.1%. The microbial quality of the water was excellentwith no faecal coliforms detected in the supply during the year. The only other feature was a smallnumber of exceedances of the manganese standard (4 of 27 samples analysed).
Review of the Period 2001-2003
The general quality of drinking water in public water supplies in Waterford City was good during thereview period and microbiological quality remained excellent.

The Quality of Drinking Water in Ireland A Report for the Year 2003
83
3.39. WATERFORD COUNTY
Summary InformationNumber of Public Water Supplies Monitored during 2003: 91Estimated Population Served by Public Water Supplies Monitored during 2003: 42,328 personsOverall Percentage Compliance in Public Water Supplies: 96.7%Number of Group Water Schemes Monitored during 2003: 8Estimated Population Served by Group Water Schemes Monitored during 2003: 311 personsOverall Percentage Compliance in Group Water Schemes: 92.7%
Results of Microbiological Analysis:Number of Public Water Supplies Monitored Free of Faecal Coliforms: 79Number of Group Water Schemes Monitored Free of Faecal Coliforms: 8
Percentage of Samples Free of Faecal Coliforms in Public Water Supplies: 95.6%Percentage of Samples Free of Faecal Coliforms in Group Water Schemes: 100%
Assessment of the Monitoring Results for 2003
There were 91 public water supplies and 8 group water schemes monitored in Waterford County in2003 collectively supplying water to a population of 42,639 people.
Overall compliance with the drinking water standards in public water supplies was below average at96.7%. Compliance with the faecal coliform standard in public water supplies was also below thenational average in Waterford County during 2003. There were 15 incidents of faecal coliformcontamination of public water supplies during 2003. These were in the Ballyduff-Ballylemon,Ballynoe-Mellaray, Clonea Power, Clooneen/Dromore, Derrinurlar, Dungarvan Ballinamuck (2incidents), Kealfoun, Loskeran/Ballymacart (3 incidents), Ring/Helvick/Seaview, Shanacoole, Sheskinand Tallow Hill. Overall, of the 91 public water supplies in Waterford County, 79 were fullycompliant with the faecal coliform standard. All public water supplies in Waterford County were fullycompliant with the standards for aluminium, nitrites, ammonium, fluoride and the heavy metals. LowpH was a problem in some supplies (87% compliance) while elevated levels of nitrate in excess of thestandard were detected in the Adramone supply.
The overall compliance rate for group water schemes in Waterford County was above the nationalaverage at 92.7% and full compliance was achieved with the faecal coliform standard.
Review of the Period 2001-2003
The general quality of drinking water in public water supplies in Waterford County was satisfactoryduring the review period although the increased number of incidents of faecal contamination in publicwater supplies in Waterford County during 2003 is a cause for concern. However, overall compliancewith the faecal coliform standard has improved slightly from 93% in 2001 to 96% in 2003.
The overall quality of drinking water in group water schemes was satisfactory during the reviewperiod. The small number of group water schemes monitored (all of which were monitored just once)in 2002 and 2003 prevent a meaningful analysis of trends over the three year period.
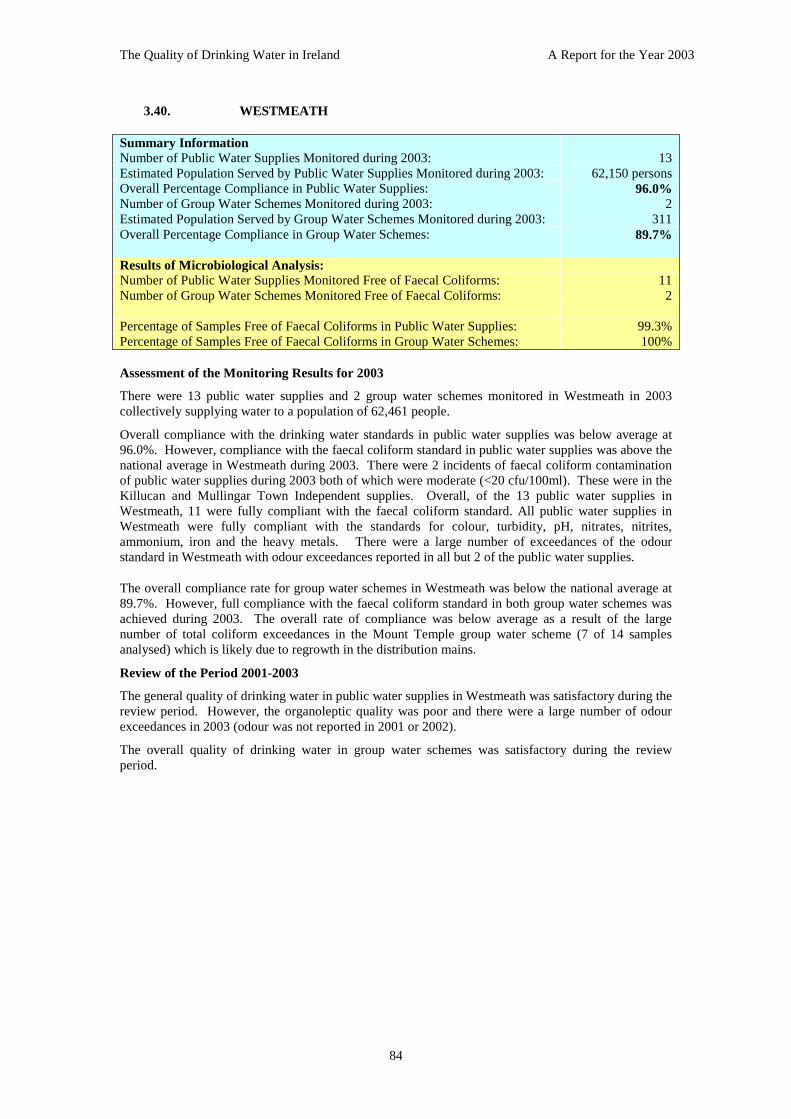
The Quality of Drinking Water in Ireland A Report for the Year 2003
84
3.40. WESTMEATH
Summary InformationNumber of Public Water Supplies Monitored during 2003: 13Estimated Population Served by Public Water Supplies Monitored during 2003: 62,150 personsOverall Percentage Compliance in Public Water Supplies: 96.0%Number of Group Water Schemes Monitored during 2003: 2Estimated Population Served by Group Water Schemes Monitored during 2003: 311Overall Percentage Compliance in Group Water Schemes: 89.7%
Results of Microbiological Analysis:Number of Public Water Supplies Monitored Free of Faecal Coliforms: 11Number of Group Water Schemes Monitored Free of Faecal Coliforms: 2
Percentage of Samples Free of Faecal Coliforms in Public Water Supplies: 99.3%Percentage of Samples Free of Faecal Coliforms in Group Water Schemes: 100%
Assessment of the Monitoring Results for 2003
There were 13 public water supplies and 2 group water schemes monitored in Westmeath in 2003collectively supplying water to a population of 62,461 people.
Overall compliance with the drinking water standards in public water supplies was below average at96.0%. However, compliance with the faecal coliform standard in public water supplies was above thenational average in Westmeath during 2003. There were 2 incidents of faecal coliform contaminationof public water supplies during 2003 both of which were moderate (<20 cfu/100ml). These were in theKillucan and Mullingar Town Independent supplies. Overall, of the 13 public water supplies inWestmeath, 11 were fully compliant with the faecal coliform standard. All public water supplies inWestmeath were fully compliant with the standards for colour, turbidity, pH, nitrates, nitrites,ammonium, iron and the heavy metals. There were a large number of exceedances of the odourstandard in Westmeath with odour exceedances reported in all but 2 of the public water supplies.
The overall compliance rate for group water schemes in Westmeath was below the national average at89.7%. However, full compliance with the faecal coliform standard in both group water schemes wasachieved during 2003. The overall rate of compliance was below average as a result of the largenumber of total coliform exceedances in the Mount Temple group water scheme (7 of 14 samplesanalysed) which is likely due to regrowth in the distribution mains.
Review of the Period 2001-2003
The general quality of drinking water in public water supplies in Westmeath was satisfactory during thereview period. However, the organoleptic quality was poor and there were a large number of odourexceedances in 2003 (odour was not reported in 2001 or 2002).
The overall quality of drinking water in group water schemes was satisfactory during the reviewperiod.

The Quality of Drinking Water in Ireland A Report for the Year 2003
85
3.41. WEXFORD
Summary InformationNumber of Public Water Supplies Monitored during 2003: 29Estimated Population Served by Public Water Supplies Monitored during 2003: 105,644 personsOverall Percentage Compliance in Public Water Supplies: 99.6%Number of Group Water Schemes Monitored during 2003: 9Estimated Population Served by Group Water Schemes Monitored during 2003: 3,645 personsOverall Percentage Compliance in Group Water Schemes: 85.6%
Results of Microbiological Analysis:Number of Public Water Supplies Monitored Free of Faecal Coliforms: 29Number of Group Water Schemes Monitored Free of Faecal Coliforms: 7
Percentage of Samples Free of Faecal Coliforms in Public Water Supplies: 100%Percentage of Samples Free of Faecal Coliforms in Group Water Schemes: 80.0%
Assessment of the Monitoring Results for 2003
There were 29 public water supplies and 9 group water schemes monitored in Wexford in 2003collectively supplying water to a population of 109,289 people.
Overall compliance with the drinking water standards in public water supplies was above average at99.6% and was the highest in the country in 2003. Full compliance with the faecal coliform standard inpublic water supplies was achieved in Wexford in 2003. All public water supplies in Wexford werealso fully compliant with the standards for turbidity, odour, taste, pH, aluminium, nitrates, nitrites,ammonium and manganese The remainder of the exceedances reported were isolated once offexceedances.
The overall compliance rate for group water schemes in Wexford was below the national average at85.6%. This was due to poor compliance with the total coliforms standard (40%), manganese (73%)and pH (75%) standards.
Review of the Period 2001-2003
The general quality of drinking water in public water supplies in Wexford was good during the reviewperiod. Microbiological compliance was excellent with full compliance with the faecal coliformstandard achieved for each of the past three years.
The overall quality of drinking water in group water schemes was unsatisfactory during the reviewperiod and there was a drop in the level of compliance with the faecal coliform standard from 91% in2001 to 80% in 2003.

The Quality of Drinking Water in Ireland A Report for the Year 2003
86
3.42. WICKLOW
Summary InformationNumber of Public Water Supplies Monitored during 2003: 44Estimated Population Served by Public Water Supplies Monitored during 2003: 82,983 personsOverall Percentage Compliance in Public Water Supplies: 96.2%Number of Group Water Schemes Monitored during 2003: 16Estimated Population Served by Group Water Schemes Monitored during 2003: 2,128 personsOverall Percentage Compliance in Group Water Schemes: 84.5%
Results of Microbiological Analysis:Number of Public Water Supplies Monitored Free of Faecal Coliforms: 38Number of Group Water Schemes Monitored Free of Faecal Coliforms: 3
Percentage of Samples Free of Faecal Coliforms in Public Water Supplies: 98.2%Percentage of Samples Free of Faecal Coliforms in Group Water Schemes: 56.9%
Assessment of the Monitoring Results for 2003
There were 44 public water supplies and 16 group water schemes monitored in Wicklow in 2003collectively supplying water to a population of 85,111 people.
Overall compliance with the drinking water standards in public water supplies was below average at96.2%. Compliance with the faecal coliform standard in public water supplies was also below thenational average in Wicklow during 2003. There were 7 incidents of faecal coliform contamination ofpublic water supplies during 2003. These were in the Coolboy/Coolfancy, Donard, Kirikee (Old),Knockannana, Knockanarrigan/Davidstown (2 incidents) and Windgates/Templecarrig supplies. Allbut the Donard incident were moderate (<20 cfu/100ml). Overall, of the 44 public water supplies inWicklow, 38 were fully compliant with the faecal coliform standard. All public water supplies inWicklow were fully compliant with the standards for nitrates, nitrites and ammonium. Compliancewith the aluminium standard remains problematic in Wicklow and a compliance rate of just 76% wasachieved in 2003. The low level of compliance was due to exceedances in the Arklow (8 of 36 samplesanalysed), Laragh/Annamoe (7 of 9 samples analysed) and Wicklow Regional (5 of 20 samplesanalysed) supplies. Exceedances were also reported in the Enniskerry supply (2 of 11 samplesanalysed) however the number and magnitude has been greatly reduced at this supply. Compliancewith the iron standard was also relatively low (85% compliance) particularly at the Wicklow Regionalsupply (6 of 7 samples analysed exceeded).
The overall compliance rate for group water schemes in Wicklow was the lowest in the country at84.5%. The primary reason for this is the large number of total and faecal coliform exceedances (40%and 57% compliance respectively) and in 2003 just 3 of the 16 group water schemes were free ofcontamination at all times. Compliance with the nitrate standard was also problematic with nitrateexceedances reported in 10 of the 16 group water schemes all of which were ‘private’ group waterschemes.
Review of the Period 2001-2003
The general quality of drinking water in the majority of public water supplies in Wicklow wassatisfactory during the review period. In spite of this satisfactory rating a number of supplies were notsatisfactory due to contamination with faecal coliforms. Compliance with the aluminium standard hasimproved during the review period from 55% in 2001 to 76% in 2003 due to remedial action taken atthe Enniskerry supply. The lessons learned in the investigation of this supply should be applied to theother supplies in Wicklow experiencing similar problems.
The overall quality of drinking water in group water schemes was poor during the review period.Compliance with the faecal coliform standard dropped from 90% in 2001 to 57% in 2003. Similarly,nitrate compliance dropped during the review period from being problematic in just one group waterscheme in 2001 to 10 schemes in 2003. These alarming drops in compliance must be reversed.

The Quality of Drinking Water in Ireland A Report for the Year 2003
87
4. EPA AUDITS
4.1. INTRODUCTION
Sanitary authorities are required by law to protect public health by providing pure and wholesomewater supplies. Water is abstracted from suitable sources by the sanitary authorities and subjected tothe treatment processes needed to make it fit for distribution and, ultimately, human consumption. Itsquality is monitored within the treatment works, along the distribution system and at the point ofeventual use - the consumer's tap. This vital monitoring function is discharged by the sanitaryauthorities themselves and by health board officials who act both in their own right - under publichealth legislation - and, often, on a contract basis for the sanitary authorities.
These arrangements apply in the case of all public water supplies from the small village borehole to thelarge regional water supply scheme. Private water supplies, including group schemes, have also nowcome within the supervisory function of the sanitary authorities who are formally responsible formonitoring all drinking water supplies under the European Communities (Quality of Water Intendedfor Human Consumption) Regulations, 1988. The Regulations have been superseded by the EuropeanCommunities (Drinking Water) Regulations, 2000 (S.I 439 of 2000) which came into effect on the 1st
January 2004.
The first EPA report on drinking water quality in Ireland examined some 7,500 samples taken during1989, and reported by sanitary authorities. Since then there has been a steady increase in the number ofsamples taken each year and in 2003 the number of samples reported was 26,987. The Agency isrequired under the EPA Acts (1992 & 2003) to verify the information transmitted to it by localauthorities for the purposes of the drinking water report and to assess whether local authorities areperforming their statutory environmental protection functions.
In 2001, the EPA first undertook the auditing of a limited number of sanitary authorities, focusing inparticular on the management of reported exceedances of the drinking water standards. These auditswere extended to other sanitary authorities in 2002, 2003 and 2004. The Agency intends to continuethe process of auditing sanitary authorities in future years and include the findings in the annualdrinking water report. This section of the report provides the background and the results of the recentseries of EPA audits.
Following the publishing of the Protection of the Environment Act in 2003 the EPA now hassignificant new powers open to it regarding the performance of statutory functions by local authorities.These powers were used by the Agency in the course of the audit programme in 2004.
4.2. AUDITS
In the period to September 2004, the EPA undertook 21 audits to determine the conformity of thesanitary authorities with the Drinking Water Regulations and good practices; and to assess theperformance of the sanitary authorities with regard to their statutory duties pertaining to drinking watertreatment. The criteria used in the audits were:
• The European Communities (Quality of Water Intended for Human Consumption)Regulations, 1988, S.I. No. 88 of 1988 and the European Communities (Drinking Water)Regulations, 2000, S.I. No. 439 of 2000;
• The recommendations specified in the Handbooks on Implementation for Sanitary Authoritiesin relation to the European Communities (Quality of Surface Water Intended for theAbstraction of Drinking Water) Regulations, 1989 and the European Communities (Quality ofWater Intended for Human Consumption) Regulations 1988 and the European Communities(Drinking Water) Regulations, 2000, S.I. No. 439 of 2000;
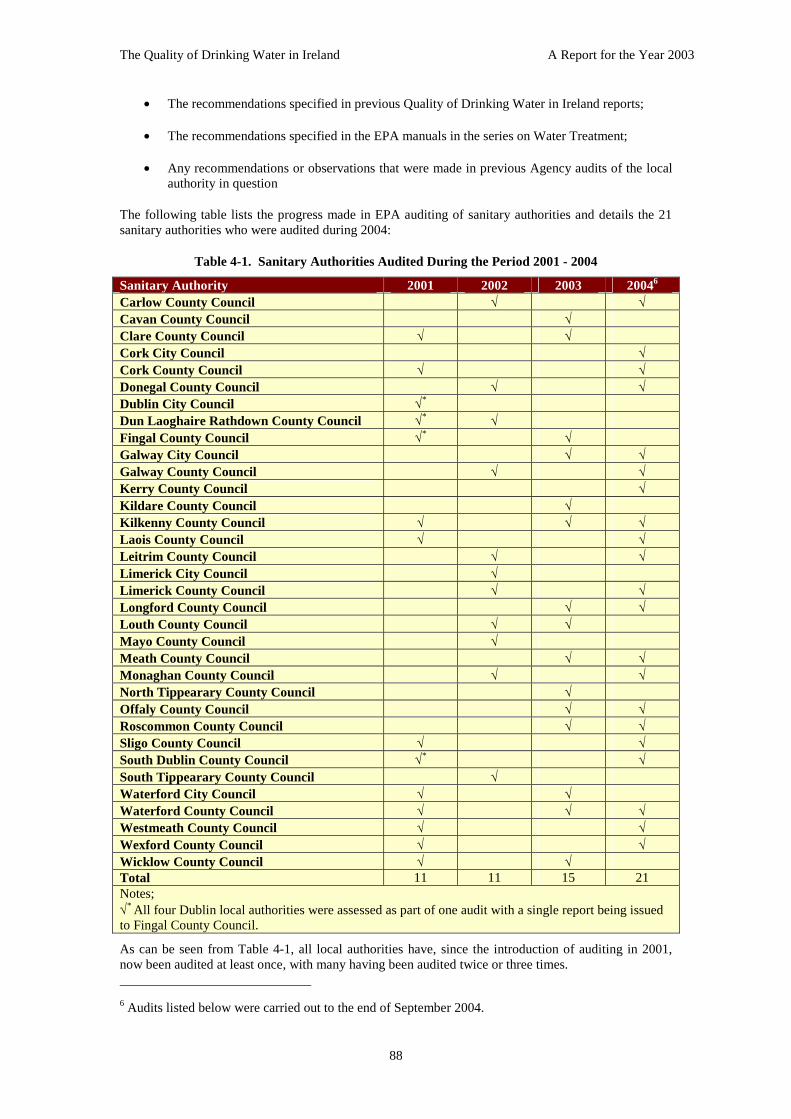
The Quality of Drinking Water in Ireland A Report for the Year 2003
88
• The recommendations specified in previous Quality of Drinking Water in Ireland reports;
• The recommendations specified in the EPA manuals in the series on Water Treatment;
• Any recommendations or observations that were made in previous Agency audits of the localauthority in question
The following table lists the progress made in EPA auditing of sanitary authorities and details the 21sanitary authorities who were audited during 2004:
Table 4-1. Sanitary Authorities Audited During the Period 2001 - 2004
Sanitary Authority 2001 2002 2003 20046
Carlow County Council √ √Cavan County Council √Clare County Council √ √Cork City Council √Cork County Council √ √Donegal County Council √ √Dublin City Council √*
Dun Laoghaire Rathdown County Council √* √Fingal County Council √* √Galway City Council √ √Galway County Council √ √Kerry County Council √Kildare County Council √Kilkenny County Council √ √ √Laois County Council √ √Leitrim County Council √ √Limerick City Council √Limerick County Council √ √Longford County Council √ √Louth County Council √ √Mayo County Council √Meath County Council √ √Monaghan County Council √ √North Tippearary County Council √Offaly County Council √ √Roscommon County Council √ √Sligo County Council √ √South Dublin County Council √* √South Tippearary County Council √Waterford City Council √ √Waterford County Council √ √ √Westmeath County Council √ √Wexford County Council √ √Wicklow County Council √ √Total 11 11 15 21Notes;√* All four Dublin local authorities were assessed as part of one audit with a single report being issuedto Fingal County Council.
As can be seen from Table 4-1, all local authorities have, since the introduction of auditing in 2001,now been audited at least once, with many having been audited twice or three times.
6 Audits listed below were carried out to the end of September 2004.
The Quality of Drinking Water in Ireland A Report for the Year 2003
89
The audit procedure consists of an opening meeting with senior management of the sanitary authority,a review of relevant documentation and a site inspection of a selected plant. At the opening meetingthe scope and objectives of the audit are reviewed and outlined. The site inspection is used to reviewthe general operation of a selected plant. A closing meeting is held in which the main findings of theAgency auditors are presented and discussed with senior management of the sanitary authority.Subsequent to the audit, a report is issued to each authority. This audit report sets out the observationsnoted during the audit and recommended actions to be taken by the authority concerned. These actionsform part of the criteria to be used in future audits.
The primary aspects examined in the audits can be classified under four main headings: list them!!!.The management and control system that is in place in the sanitary authority for the production ofdrinking water and the sampling and monitoring arrangements are assessed. The procedures that are inplace for dealing with exceedances of the drinking water standards are examined and a water treatmentplant that had been selected in advance is inspected. In addition, a particular emphasis was placed onthe management of wastewater sludges during audits completed in 2004.
The Agency noted that, of the 21 sanitary authorities audited in 2004, four sanitary authorities havedeveloped a documented management and control system meeting the recommendations of Chapter 9of the EPA Manual “Coagulation, Flocculation and Clarification”. Offaly, Waterford and DonegalCounty Councils, in addition to Galway City Council, are to be commended for putting the appropriatesystems in place. Many other sanitary authorities have a number of the required elements in place. Itwas noted that many of the cryptosporidium risk assessments that have been carried out indicate thatsupplies are at high or very high risk. Measures identified in the risk assessment as contributing to thehigh score should be assessed and measures to reduce the risk rating should be implemented. The finalpoint to be noted under Management & Control is that training of caretakers has improved and, ingeneral, plants are operated by very experienced personnel.
Regarding sampling and monitoring, a sampling manual needs to be developed in the majority ofsanitary authorities audited. While some sanitary authorities had a draft manual, there is a need toensure that all of the requirements of the new regulations (identification of supplies, location ofsampling points, procedures for sampling etc) are addressed when finalising the sampling manual. TheEPA Handbook should be consulted.
With regard to the development of documented procedures for dealing with exceedances of thedrinking water standards, the Agency noted an improvement amongst the sanitary authorities audited.In this regard the systems implemented by Donegal and Leitrim County Councils constitute the bestpractice noted in the audits carried out in 2004. Of the 21 sanitary authorities audited, documentedprocedures for dealing with exceedances of the microbiological standards were found in all but four ofthe sanitary authorities. These four sanitary authorities (Westmeath, Longford and South DublinCounty Councils and Cork City Council), whilst having some procedures in place, should formalisethese into a documented procedure. In addition, there is a general need for all sanitary authorities toensure that exceedances of the chemical and indicator parametric values are included within the remitof the procedures. Where an exceedance relates to a ‘private’ group water scheme, sanitary authoritiesneed to be aware of the requirement to advise the scheme operator to prepare an action programme torestore compliance.
With regards to operation of water treatment plants, the main issue found was that adequate measuresfor effective chlorination of water are not in place at a large number of treatment plants. In particular,no chlorine alarms were present on some supplies thus increasing the potential for undisinfected waterto enter the distribution mains. The storage of chemicals was often found to be inadequate withbunding absent on many occasions. In addition, a general lack of documented procedures for theoperation of plants was noted.
Regarding management of waterworks sludge, the Agency audits found that many treatment plantswere discharging sludge directly back to receiving waters. Other plants were found to be mixingwaterworks sludge with sewage sludge and landspreading it. The EPA issued 10 Statutory Notices inrespect of management of waterworks sludge during 2004. The following table lists the sanitaryauthorities who received statutory notices.

The Quality of Drinking Water in Ireland A Report for the Year 2003
90
Table 4-2. Statutory Notices Issued to Sanitary Authorities in 2004.
Sanitary Authority Name of Treatment Plant Reason for Statutory NoticeCork City Council Lee Road Waterworks Direct discharge of aluminium sludge to
the River LeeCork County Council Inniscarra Direct discharge of filter backwash
waters to the River Lee at InniscarraDonegal County Council Pollan Dam Unauthorised landspreading of waste
sludge from the Fullerton Pollan DamWater treatment plant
Kerry County Council Listowel
Dromin
Direct Discharge of aluminium sludge tothe River FealeUnauthorised storage of WasteAluminium Sludge at the DrominWaterworks
Kilkenny County Council Troyswood Direct discharge of aluminium sludge tothe River Nore
Leitrim County Council South Leitrim Regional Unauthorised landspreading of wastesludge from the South Leitrim Regionalwater treatment plant
Limerick County Council Newcastlewest Discharge of Aluminium Sludge to theRiver Deel
Longford County Council Lough Forbes Unauthorised disposal of waste sludgefrom the Lough Forbes Water treatmentplant.
Meath County Council Trim, Navan, Liscartonand Kilcarran
Unauthorised landspreading of wastealuminium sludge from the Trim, Navan,Liscarton and Kilcarran water treatmentplants
Westmeath County Council Athlone Direct discharge of aluminium sludge tothe River Shannon
Progress in relation to the notices has been varied and is summarised here. Kerry County Council havereported that the discharge from the Listowel water treatment plant to the River Feale ceased shortlyafter the audit identified this malpractice while Kilkenny County Council, in consultation with theAgency, have undertaken to ensure that the discharge to the River Nore from the Troyswood plant willcease by the 17th December 2004. The discharge from the Lough Forbes treatment plant has also ceasedand the sludge is currently being discharged into the wastewater treatment plant at Longford. Inrelation to the other treatment plants that were discharging sludge to receiving waters (i.e. Cork City,Limerick County and Westmeath) proposed timetables for the cessation of the discharge have beensubmitted and consultations are ongoing with regard to their implementation. Two of the sanitaryauthorities where water treatment sludge was being mixed with sewage sludge and landspread(Donegal and Leitrim) undertook to cease the practice on the day of the audit. This was subsequentlyconfirmed in correspondence following the audit. Sludge is currently being stored temporarily pendingthe indentification of a suitable location for disposal. Both Councils have undertaken to notify theAgency as soon as a suitable disposal location is found. In relation to the situation in Meath, anacceptable proposal has not been submitted to the Agency to date. Meath County Council havesubmitted long term plans that indicated that this practice would cease by 2006. However, the plansubmitted still proposed mixing water treatment sludge with sewage sludge and landspreading it. Anappropriate solution to the final destination of sludge stored at the Dromin water treatment works iscurrently being sought by Kerry County Council. The Department of Environment, Heritage and LocalGovernment has also commissioned consultants to prepare a report outlining the possible optionsavailable to local authorities in dealing with this waste.

The Quality of Drinking Water in Ireland A Report for the Year 2003
91
5. CURRENT ISSUES
5.1. INTRODUCTION
This section of the report attempts to address the major issues of interest to consumers with regard todrinking water in Ireland. Some of the issues and comments made have already been discussed inprevious drinking water reports. However, the EPA is conscious that some consumers may not haveread previous reports or indeed their drinking water supply may have changed and that therefore theseissues may well be of interest to them.
Current issues discussed below are:
• Responsibility for producing and monitoring drinking water;
• Chlorination;
• Fluoridation;
• Quality in rural water schemes; and
• Implementation of the 2000 Drinking Water Regulations.
A feature of all drinking water reports has been that, in commenting on the topics of greatest currentinterest, the EPA reminds the reader that any breach of the quality standards laid down in the 1988Drinking Water Regulations cannot be condoned.
5.2. RESPONSIBILITY FOR PRODUCING AND MONITORING DRINKINGWATER
Many consumers may not be aware that sanitary authorities (i.e., local authorities) are responsible forthe production, monitoring and distribution of their drinking water. A sanitary authority must take allreasonable steps to warn consumers where monitoring of drinking water indicates that there is anunacceptable risk to public health. In the case of a private water supply serving fewer than 50 persons,the authority must issue a notice on the person responsible for the supply advising that person of themeasures which should be taken for the improvement of the quality of the water. Irrespective of supplytype (i.e., public, group or private) the sanitary authority has responsibilities where drinking watersources such as rivers, lakes or groundwater are polluted. The Water Pollution Acts 1977-1990 conferconsiderable powers on local authorities to prevent pollution and also to prosecute offenders, wherepollution has occurred.
The EPA has the duty of preparing an annual report on the quality of drinking water in Ireland and tomake appropriate recommendations. This report is based on the monitoring returns submitted bysanitary authorities, whose function it is to monitor such waters.
5.3. CHLORINATION
Chlorine (or appropriate compounds of it) is undoubtedly the most important chemical used in watertreatment in Ireland today, and has been for a long time past. Although a highly poisonous gas in itspure form and a powerful oxidising agent, chlorine in very dilute solution is a most effective agent forthe disinfection of water. It is very efficient at destroying those bacteria which originate in human oranimal waste and which cause wholly undesirable and dangerous contamination of drinking water.
Among these micro-organisms are the specific types, termed “pathogenic” (or disease-causing), whichare responsible for a wide range of water-borne diseases such as polio, cholera, typhoid fever, hepatitis,salmonella and so on. The consequences of pathogenic contamination are usually most dramaticallyand cruelly demonstrated by the cholera epidemics which almost invariably follow natural disasters,especially in poorer, developing countries. While such diseases are not endemic in Ireland, nonetheless
The Quality of Drinking Water in Ireland A Report for the Year 2003
92
serious health problems - and mortality - can be caused by sewage - or slurry-contaminated drinkingwater. Disinfection is accordingly the single most important stage of water treatment.
There are various difficulties and problems associated with the use of chlorine. Because of its reactivitychlorine will interact with any dissolved organic matter in a water to be disinfected, notably the agentswhich cause natural colour. This chemical activity may result in the production of excessivetrihalomethanes and causes the consumption of some of the added chlorine leading to less chlorineremaining to carry out the required disinfection. The obvious action in such cases is to increase thechlorine dosage so as to cater for the so-called “chlorine demand” of the water (i.e., the amount ofchlorine absorbed by reactions with dissolved matter) and also to meet the requirements for effectivedisinfection. However, unless this is done with great care, the resultant post-reaction chlorine levelsmay either be too high (in which case the consumers will perceive the odour and/or taste of chlorine) ortoo low, in which case the disinfection may be incomplete. The lesser of these two “evils” is the former- it is safer for the consumer to receive water with slightly too much chlorine in it than the opposite. Ifa water still has chlorine in it as it reaches the consumer, then there will have been continuingprotective disinfection all the way along the mains from the treatment works to the consumer’s tap.
There are more efficient alternatives to chlorine, the primary processes being ozonation and ultra-violettreatment. These have the major benefit that they are effective in removing organisms unaffected byroutine chlorination. Ozonation consists of the treatment of water with ozone [O3] - a highly reactiveform of oxygen - which is electrically generated at the point of disinfection, while ultra-violet [UV]treatment consists of passing the water along a chamber through which a UV light of suitable intensityis shone. These more effective procedures have, however, one major deficiency as compared withchlorination - there is no residual protection against re-infection of the water (say, by seepage of acontaminant through a cracked main).
The use of chemical disinfectants such as chlorine in water treatment will typically result in theformation of by-products, some of which are potentially hazardous. The World Health Organisation(2000) advises that “ the risks to health from these by-products at the levels at which they occur indrinking water are extremely small in comparison with the risks associated with inadequatedisinfection. Thus, it is important that disinfection not be compromised in attempting to control suchby-products”.
In summary, where disinfection forms part of the preparation and/or distribution of water intended forhuman consumption, the EPA recommends that sanitary authorities should ensure that the efficiency ofthe disinfection process is verified and that any contamination from disinfection by-products is kept aslow as possible. Control strategies to reduce disinfection by-products should in the first instanceconcentrate on organic precursor removal using colour as a guide. Finally, it remains to reassure theconsumer that, despite the fact that chlorine itself is toxic, and contrary to occasional scare reportsabout the “hazards” of chlorine, there is no risk of chlorine toxicity from drinking water which hasbeen so disinfected. By the time a water could be regarded as directly hazardous from excess chlorine,it would taste and smell foul and be utterly repellent to the consumer.
5.4. FLUORIDATION
The basis for the use of fluoride in the treatment of major Irish public water supplies arises from theHealth (Fluoridation of Water Supplies) Act, 1960, which requires health authorities to fluoridatepublic water supplies so as to achieve a concentration range of 0.8 - 1.0 mg/l fluoride as F. The aim ofadding fluoride was to bring about a reduction in tooth decay (dental caries) in children, the lower limitof 0.8 mg/l being considered by expert opinion as the threshold below which no benefits could beachieved. Similarly, 1.0 mg/l was considered the upper limit of effectiveness. Reports at that periodsuggested that at concentrations from around 2 mg/l F upwards negative effects of increasing severityoccurred.
The 1980 (and indeed the 1998) Drinking Water Directive specified an upper limit of 1.5 mg/l fordrinking water, but in making the 1988 (and 2000) Regulations, the Minister for the Environment tookthe existing Irish legislation into account and set an upper limit of 1.0 mg/l F. Thus, the limit in Irelandis two-thirds of that permissible elsewhere in the EU.

The Quality of Drinking Water in Ireland A Report for the Year 2003
93
The type, form, quality and purity of fluoride to be added to Irish public piped water supplies is set outin the Health (Fluoridation of Water Supplies) Act, 1960. Under this Act the health authorities arrangefor the fluoridation of water supplied to the public by sanitary authorities. Though the Department ofthe Environment and Local Government sets the drinking water standards the Department hasconsistently relied upon the advice of the Department of Health and Children with regard to the limitimposed for fluoride.
In recognition of the public interest in fluoridation, the Minister for Health and Children set up a Forumon Fluoridation in May 2000. The membership of the Forum comprised representatives of a widespectrum of interests including academic, dental, public health, environmental protection and consumerrepresentatives. The terms of reference of the Forum were:
• to review the fluoridation of public piped water supplies and the programme of research beingundertaken on behalf of health boards in the area; and
• to report and to make recommendations to the Minister for Health and Children.
The findings of the Forum on Fluoridation were published in September 2002. The primaryconclusions in relation to the fluoridation of public water supplies in Ireland were:
• water fluoridation has been very effective in improving the oral health of the Irish population,especially of children but also of adults and the elderly;
• the best available and most reliable scientific evidence indicates that at the maximum permittedlevel of fluoride in drinking water at 1 part per million, human health is not adversely affected;
• dental fluorosis (a form of discoloration of the tooth enamel) is a well-recognised condition and anindicator of overall fluoride absorption, whether from natural sources, fluoridated water or fromthe inappropriate use of fluoride toothpaste at a young age. There is evidence that the prevalenceof dental fluorosis is increasing in Ireland.
The main recommendations in relation to policy aspects of water fluoridation were:
• the fluoridation of piped public water supplies should continue as a public health measure, subjectto the other recommendations contained in the Forum’s report;
• in light of the best available scientific evidence, the Fluoridation of Water Supplies Regulations,1965 should be amended to redefine the optimal level of fluoride in drinking water from thepresent level (0.8 to 1.0 ppm) to between 0.6 and 0.8 ppm, with a target value of 0.7 ppm;
• the amended Regulations should reflect advances in the technology of fluoride monitoring andtesting and also the most recent international specifications for the quality of the products used inthe fluoridation process;
• an Expert Body should be established to implement the recommendations of the forum and toadvise the Minister for Health and Children on an ongoing basis on all aspects of fluoride and itsdelivery methods as an established health technology.
Technical aspects of water fluoridation recommended were:
• guidelines/codes of practice and audit processes should be developed to support ongoing qualityassurance of all aspects of the water fluoridation process and should take account of both Irish andinternational research;
• external audit procedures of existing fluoridation plants should be put in place to monitor theperformance of fluoridation plants and should be part of the specification of new plants. Auditresults should be included in annual reports on water fluoridation produced by relevant fluoridemonitoring committees;

The Quality of Drinking Water in Ireland A Report for the Year 2003
94
• the standards and quality of each fluoridation plant should be assessed and decisions made as tothe appropriateness of the continued use of inefficient plants;
• fluoride monitoring, analytical and reporting procedures should be updated to reflect moderntechnologies and to facilitate the timely reporting of all drinking water fluoride levels. The resultsshould be made available in a format so that compliance with regulations can be monitored. Theseresults should be freely available for public scrutiny;
• raw water should be checked for fluoride levels before fluoridation takes place in compliance withthe current regulations;
• the Eastern Regional Health Authority, currently responsible for purchasing the fluoridatingproducts on behalf of the country’s health boards, should ensure compliance with the amendedregulations specifying the quality standards of the products used in the fluoridation process.
The report of the Forum on Fluoridation also contains several other recommendations in relation tofluoride toothpaste, the oral health care industry, infant formula, fluoride research, education,information and public participation, public health and professional practice. These recommendationsare considered outside the remit of an assessment of the quality of drinking water in Ireland and as suchwill not be discussed here. A full copy of the report is available to download from the website of theForum on Fluoridation (www.fluoridationforum.ie).
Following the publication of the Forum on Fluoridation report the Minister of Health and Childrenestablished the Expert Body on Fluorides and Health. This body held its inaugural meeting on the 29th
April 2004. The terms of reference of the body are:
• to oversee the implementation of the recommendations of the Forum on Fluoridation;
• to advise the Minister and evaluate ongoing research – including new emerging issues – on allaspects of fluoride, its delivery method as an established health technology, as required
• to report to the Minister on matters of concern at his/her request or on own initiative
The Agency participates in the Expert Body to provide advice and assistance with regards to theenvironmental and technical aspects of water fluoridation. Consideration of the relative public healthmerits of fluoridation of public water supplies is a matter for health and dental professionals.
5.5. QUALITY IN RURAL WATER SCHEMES
The main finding of previous reports on the Quality of Drinking Water in Ireland has been thesignificant difference in the quality of drinking water supplied by public water supplies compared tothat supplied by group water schemes. In terms of microbiological quality, the group water schemeshave lagged far behind the public water supplies. This point has been repeatedly highlighted sinceEPA reports first distinguished between the two types of supplies in “The Quality of Drinking Water:A Report for the Year 1993”.
Public water supplies are administered by sanitary authorities whereas group schemes are administeredand managed by the consumers of the supply. Group water schemes are further classified as either‘public’ group schemes or ‘private’ group schemes depending on the source of the water distributed totheir members. The former obtain their water from a public sanitary authority supply, the committeesundertaking distribution, while the latter distribute (with or without treatment) water which is obtainedfrom a private source. When submitting the returns for 2003 all sanitary authorities were requested toclearly distinguish between public and ‘private’ group water schemes. Thus, a comprehensivecomparative analysis of the quality of ‘public’ group water schemes compared to ‘private’ group waterschemes can be made for the first time in 2003.
Taking coliforms (both total and faecal) as the most informative indicator of the quality of group waterschemes, an analysis of the ‘private’ group schemes compared to the ‘public’ group schemes indicates

The Quality of Drinking Water in Ireland A Report for the Year 2003
95
that the problem of quality deficiency is primarily caused by the ‘private’ group schemes. Thisdifference is clearly illustrated in Table 5-1 and on Figure 5-1.
Table 5-1. Compliance with the Total and Faecal Coliform Standard in ‘Public’ and ‘Private’group Water Schemes in 2003.
No. of Samples No. of Exceedances % CompliancePUBLIC GWS
Total Coliforms 2,058 283 86.3Faecal Coliforms 2,058 81 96.1
PRIVATE GWSTotal Coliforms 3,172 1,436 54.7
Faecal Coliforms 3,164 794 74.9
0
20
40
60
80
100
Total Coliforms Faecal Coliforms
Per
cen
tag
eC
om
plia
nce
Public Private
Figure 5-1. Total and Faecal Coliform Compliance in ’Public’ and ‘Private’ group WaterSchemes in 2003.
The clear difference in the level of contamination of public and ‘private’ group water schemes is due tothe fact that the ‘public’ group water schemes in most cases receive high quality treated drinking waterfor distribution while the ‘private’ group water schemes source their own water and in many casedistribute the water with little or no treatment. The quality difference is more clearly illustrated whenthe results are analysed on a scheme by scheme basis. Of the 780 ‘public’ group water schemes testedfor faecal coliforms during 2003, 113 (14%) were found to be contaminated at least once while of the1,004 ‘private’ group water schemes, 366 (36%) were found to be similarly contaminated.
This quality deficiency in the ‘private’ group water schemes is well understood and there has been amajor drive to tackle the problem. The primary means of dealing with this problem has been theestablishment of Design Build Operate (DBO) bundles. Many of the schemes involved are small andthe most efficient means of investing in the improvement of these schemes has been to bundle togetherthese schemes into groups of schemes. This makes the upgrading of these schemes more attractive tocontractors and has been shown to reduce costs overall. The National Federation of Group WaterSchemes (NFGWS) reported that in 2003, 15 such bundles encompassing 217 group water schemeswhich account for 35,368 domestic connections (of the estimated 50,000 domestic connections servedby ‘private’ group water schemes nationally) have been established. The number of group waterschemes involved in the bundles has doubled while there has been an increase of 65% in the number ofdomestic connections covered by these bundles.
The EPA 2000 drinking water report welcomed the introduction of a Quality Assurance Scheme by theNational Federation of Group Water Schemes. The model adopted by the Federation is the HACCP

The Quality of Drinking Water in Ireland A Report for the Year 2003
96
(Hazard Analysis Critical Control Points) system which operates in the food industry. This systeminvolves setting minimum standards for the supply of drinking water. Where individual group schemesachieve certain minimum standards in the management of a drinking water supply they will achievecertification under the scheme. The model puts in place a system which is preventative and proactiveas opposed to one based on crisis management. Indeed this system should also provide confidence toconsumers that relevant legislation and national guidelines are being followed and that satisfactorydrinking water is being delivered.
Though the commitment of monies in the National Development Plan is to be welcomed the principleunderpinning the Water Framework Directive that the prevention of water pollution is better than cureshould be paramount. The current absence of a quality assurance scheme should not in itself be anexcuse for failing to take the requisite steps to reduce the risk of a drinking water supply being unsafe.To this end the following protocol should be established by those managing a group water scheme:
• all equipment and plant should be maintained in good working condition;
• raw water sources and storage containers should be inspected frequently for any source ofcontamination (e.g., animals and/or birds);
• disinfection equipment should be subjected to routine maintenance;
• a system should be developed for prompt notification to all consumers (including visitors) wheredrinking water standards have been exceeded;
• records of all servicing equipment and routine inspections should be maintained; and
• people engaged in the management and upkeep of equipment and plant should be properly trained.
5.6. IMPLEMENTATION OF THE 2000 DRINKING WATERREGULATIONS
As mentioned in chapter one of this report the European Communities (Drinking Water) Regulations,2000 came into effect in Ireland on the 1 January, 2004 in compliance with the requirements of the EUDrinking Water Directive (98/83/EC). The 2000 Regulations introduce radical changes to themonitoring and management of drinking waters, compared to that which prevailed under the 1988Regulations. The changes include the sample numbers, the parameters to be monitored, the samplingregime as well as the extent of coverage. To assist in the transition process, the Department ofEnvironment and Local Government has appointed consultants to work with all local authorities during2003 and 2004 towards the establishment of a Drinking Water National Monitoring Programme. Toensure that a programme that is in compliance with the Regulations is put in place, a survey of allrelevant drinking water supply systems in the country was undertaken in 2003. The consultants wererequired to quantify sampling and analysis requirements and existing laboratory capacity. The EPAwelcomes this initiative and in particular the holistic approach adopted. The consultants were alsoinvolved in the preparation of “Guidance on the Implementation of the European Communities(Drinking Water) Regulations: A Handbook on Implementation for Sanitary Authorities” published bythe EPA (EPA, 2004). Extensive guidance on the implementation of the 2000 Regulations is availablein this publication and should be used by those responsible for monitoring and distributing drinkingwater.
5.7. IMPROVED COMMUNICATION
The EPA has previously recommended that local authorities should post drinking water results to theirrespective websites on a monthly basis. This is necessary, as there is considerable interest on the partof the general public in drinking water monitoring results.

The Quality of Drinking Water in Ireland A Report for the Year 2003
97
6. CONCLUSIONS
This section of the report provides a series of conclusions based on the 26,987 samples taken and235,042 tests conducted by sanitary authorities in 2003. The conclusions are broadly divided intoobservations made on the overall quality of public water supplies (i.e., drinking water produced bylocal authorities), and group water schemes (i.e., water distributed by private individuals orcommittees). The separate conclusions for public and group water supplies should not be interpreted asmeaning that different standards apply or indeed should be tolerated. The smallest of supplies reportedon is of the greatest importance to those who are its consumers, and any risk to the latter is to beavoided just as much as would be the case if larger numbers of consumers were served. The broaddivision of supply type (PWS or GWS) made in previous EPA reports is intended to highlight thequality deficiencies observed in group water schemes. The quality deficiency in this sector has beenacknowledged by Government which has committed €644 million in the National Development Plan totackle this issue. The EPA will continue to make separate conclusions on public and group waterschemes until the quality deficiency in the group water scheme sector has been addressed.
The following are the conclusions of this report:
1. The overall quality of the majority of public water supplies remains satisfactory while the qualityof drinking water produced by group water schemes and in particular ‘private’ group waterschemes is unsatisfactory.
2. The quality deficiency in group water schemes is clearly due to the poor quality of the ‘private’group water schemes. A detailed assessment of the group water schemes sector indicates thatcompliance with the faecal coliform standard in ‘public’ group water schemes was 96.1% whilethe compliance rate in ‘private’ group water schemes was 74.9% in 2003. This means that sixtimes as many ‘private’ group water schemes were contaminated with faecal coliforms as ‘public’group water schemes.
3. There were 235,042 tests conducted on the 26,987 samples of drinking water in 2003. Of these9,214 tests failed to meet the standards giving an overall compliance rate with all 53 parameters of96.1% (an improvement from 95.9% in 2003). The overall rate of compliance in public watersupplies improved from 97.4% in 2002 to 97.7% in 2003 while the overall rate of compliance ingroup water schemes improved from 91.5% in 2002 to 91.8% in 2003.
4. Compliance with the faecal coliform standard improved from 94.2% in 2002 to 94.7% in 2003.Compliance in public water supplies improved from 98.4% in 2003 to 98.7% in 2003 whilecompliance in group water schemes improved from 80.9% in 2002 to 83.2% in 2003.
5. Drinking water supplied by sanitary authorities via public water supplies is safer to drink than thatof ‘public’ group water schemes, which in turn is safer to drink than that from ‘private’ groupwater schemes.
6. A scheme by scheme analysis indicates that 88.8% (788) of public water supplies (up from 84.6%)and 76.1% (1,358) of group water schemes (up from 74.1%) were free of faecal contaminationduring 2003. This means that 112 public water supplies and 426 group water schemes werecontaminated with faecal material at some stage during 2003, although the majority of theseexceedances were moderate in nature.
7. There were 34 (down from 45) serious incidents of faecal contamination (i.e. >20 cfu/100ml) in 33public water supplies in 2003. In 12 of these cases there was no evidence of investigation ofdrinking water within 7 days of the original exceedance.
8. There were 243 (down from 277) serious incidents of faecal contamination (i.e. >20 cfu/100ml) in154 group water schemes during 2003. This means that over 8% of group water schemesmonitored were seriously contaminated during the year.
9. Of the 15 core parameters, those with the lowest rate of compliance were total coliforms (86.6%),aluminium (92.8%), colour (93.3%), manganese (94.1%), iron (94.4%) and faecal coliforms(94.7%). Compliance was greater than 99% for nitrates, nitrites, ammonium and the heavy metals.
10. The overall rate of compliance with the aluminium standard has improved from 92.0% in 2002 to92.8% in 2003. As has been the case in the past the poor rate of compliance was due to a small

The Quality of Drinking Water in Ireland A Report for the Year 2003
98
number of offending plants. From an analysis of the results submitted to the Agency it is clear thatit is the same plants which are failing to meet the standards each year.
11. Compliance with the fluoride standard was unacceptably low in 2003. Fluoride compliance shouldbe close to 100% as fluoride is added to the final water at the treatment plant and thus levels in thefinal water are completely under the control of the plant operator.
12. There was a reduction in the number of supplies that reported exceedances of the nitrate standard.In 2003, 10 public water supplies (down from 14) and 20 group water schemes (the same as in2002) had elevated levels of nitrate. However, the increase in nitrate levels in the small number ofplants where exceedences occur is of concern. This needs to be addressed as a matter of urgency.
13. There was considerable delay in the return of monitoring results to the Agency in 2003. 24 of the41 sanitary authorities did not submit monitoring results by the deadline of the 2nd April 2004. Inparticular, two sanitary authorities were particularly late. Kilkenny County Council did not make areturn until the 30th June while Mayo County Council made a partial return by this time. Theremaining data was not submitted by Mayo County Council in time for inclusion in this report.
14. With regard to the development of documented procedures for dealing with exceedances of thedrinking water standards, the Agency noted an improvement amongst the sanitary authoritiesaudited. In this regard the systems implemented by Donegal and Leitrim County Councilsconstitute the best practice noted in the audits carried out in 2004.

The Quality of Drinking Water in Ireland A Report for the Year 2003
99
7. RECOMMENDATIONS
In this section specific recommendations are made in relation to the operation of drinking water plants,monitoring and reporting, and management of results. These recommendations are a result of both theanalysis of the monitoring returns for 2003 and of EPA audits conducted during 2004. Some of theserecommendations have been included in previous drinking water reports. However, it is considerednecessary to repeat them as they constitute best practice for dealing with deficiencies in drinking watersupplies and for reporting the quality of such supplies.
7.1. MANAGEMENT OF DRINKING WATER
1. The recent EPA publication “Guidelines on the Implementation of the European Communities(Drinking Water), 2000 Regulations: A Handbook on Implementation for Sanitary Authorities”should be examined in detail by each sanitary authority and should be used as a template for themanagement of drinking water in that sanitary authority.
2. A documented management systems approach should be adopted to the management and operationof drinking water treatment plants to ensure that treatment objectives are achieved.
The management system should address (as a minimum):
• organisation and responsibilities of personnel involved in the production of drinking water;
• quantification of the environmental effects of the treatment plant;
• operational control of the treatment plant;
• documentation and maintenance records of the treatment plant;
• audits of the plant;
• preventative maintenance;
• routine servicing;
• emergency response;
• equipment replacement; and
• monitoring programme and frequency of analysis.
3. Group water schemes should obtain certification under the Hazard Analysis Critical Control Points(HACCP) system adopted by the National Federation of Group Water Schemes. Where the qualitymodel adopted by the Federation of Group Water Schemes is not in place, those responsible forgroup water schemes should prepare a protocol in order to reduce the risk of an unsafe drinkingwater supply. Further information on what should be included in such a protocol is contained insection 5.6 of this report.
4. Suppliers of drinking water should ensure that the efficiency of the disinfection process is verifiedand that any contamination from disinfection by-products (e.g., trihalomethanes) is kept to aminimum. Sanitary authorities should also ensure that all treatment plants that disinfect the waterwith chlorine are monitored continuously and that this monitoring is linked to an alarm to ensurethat in the event that the chlorination fails or is insufficient the relevant personel are notifiedimmediately so that corrective action can be taken.
5. Plants which consistently produce drinking water that is in breach of the standards specified in theRegulations, should be clearly identified by the responsible authority and a corrective actionprogramme developed to bring the supply into compliance. This is particularly relevant in the

The Quality of Drinking Water in Ireland A Report for the Year 2003
100
case of aluminium. Supplies that have consistent exceedances of the aluminium standard shouldbe examined by the sanitary authority as a matter of priority. Aluminium sulphate is used as acoagulant and, as such, levels of aluminium in the treated water are entirely within the control ofthe plant operator. Corrective action programmes should be put in place to ensure that the supplyis brought into compliance with the Regulations. In the case of aluminium, the sanitary authorityshould examine the raw water storage capacity, the pH during coagulation, the mains scouringprogramme in place and the design capacity of the plant.
6. All sanitary authorities should have a protocol in place for dealing with exceedances of thedrinking water standards. Such a protocol should ensure that appropriate steps are taken to remedyan exceedance as soon as possible.
7. Supplies where nitrate exceedances are reported should be investigated by the responsibleauthority. Source protection measures should be put in place where possible to remove possiblesources of contamination immediately. Where such measures are impractical or are not successfulin reducing the levels of nitrate in the supply to ensure compliance with the standard, an alternativesource of water for the supply should be sought or an appropriate treatment system should beconstructed.
8. Design Build and Design Build and Operate contracts are becoming increasingly popular in thewater industry. Such contracts should require the development of an environmental managementsystem to operate a drinking water plant and include provision for the sanitary authority to auditsuch systems. This approach will facilitate the sanitary authority in determining on an on-goingbasis if best practice is being implemented in the production of drinking water.
9. Sanitary authorities should prepare a training plan to ensure that all personnel involved in theproduction of drinking water should receive on-going training. In particular, training in theprotection of drinking water supplies against contamination should be prioritised.
7.2. SAMPLING, MONITORING AND REPORTING
1. Each sanitary authority should develop a sampling manual as described in Section 4.8 in the“European Communities (Drinking Water) Regulations: A Handbook on Implementation forSanitary Authorities”.
2. Each laboratory at which samples are analysed must have a system of analytical quality controlthat is subject from time to time to checking by a person who is not under the control of thelaboratory and who has been approved by the Agency for that purpose. Laboratories that areaccredited through ILAB or UKAS and are participating satisfactorily in the accreditation processare considered by the Agency to have such a system in place.
3. A sampling programme should be developed each year that is consistent with the requirements ofthe Regulations. A documented procedure should be in place for the sampling of drinking water.The sampling programme should include a list of the supplies to be monitored, the number ofsamples to be analysed for each supply, the frequency of sampling and the sample locations.
4. Exceedances of the standards in the drinking water Regulations should be investigated and follow-up samples should be taken as soon as is practicable following the original non-compliant sample(the incident). Sampling should continue until the supply has been returned to compliance with thedrinking water standards. An incident report should be prepared for each exceedance of thedrinking water standards. This report should contain details of the parameter exceeded, date,follow-up samples, corrective action taken and when the supply returned to compliance. Whenreporting monitoring results to the EPA, sanitary authorities should clearly distinguish betweenroutine sampling and sampling following an incident.
5. A risk assessment should be carried out by each sanitary authority to determine the vulnerability ofpublic water supplies to Cryptosporidium, commencing with the larger water treatment plants, toidentify plants which are in need of upgrading. Monitoring for Cryptosporidium should be

The Quality of Drinking Water in Ireland A Report for the Year 2003
101
initiated on a more widespread basis with particular attention focussing on surface water suppliesthat have no treatment except disinfection.
6. The Agency recommends that sanitary authorities carry out an assessment on their groundwatersupplies to determine where compliance with the new arsenic standard is likely to be problematic.
7. The Agency recommends that sanitary authorities conduct an audit of the use of lead piping intheir functional areas to determine the likely risk of exceedances of the new lead standardoccurring.
8. In relation to the new pH standard, the Agency recommends that sanitary authorities investigatethe implications of the new standard for water supplies in their functional area. Lime pHcorrection may be required in some treatment plants that use coagulation because of the lowerlevels of pH.
9. All treatment plants should as a minimum have continuous chlorine residual monitors on the finalwater and such monitors should be alarmed to ensure that either a sudden increase in chlorinedemand or a failure of the chlorine dosing system is immediately detected. The aim of such alarmsis to ensure that corrective action is initiated as quickly as possible to prevent undisinfected waterentering the distribution mains. Consideration should also be given to the installation of automaticshut-offs where such incidents occur.
7.3. MANAGEMENT OF WATER TREATMENT SLUDGES
1. All sanitary authorities should review current methods of handling and disposal of water treatmentsludges to ensure that current practice is not in contravention of the Waste Management Act, 1996.
2. The discharge of water treatment sludge to receiving water, where practised, should ceaseimmediately. The disposal of sludge is a licensable activity under the Waste Management Act,1996.
3. The mixing of water treatment sludges with sewage sludge for subsequent spreading on land is notpermitted under the Waste Management (Use of Sewage Sludge in Agriculture) Regulations, 1998.Such practices should cease immediately as this practice does not constitute recovery.
7.4. COMMUNICATION
1. In accordance with Section 58 of the EPA Act, 1992 sanitary authorities must submit the results ofmonitoring carried out in accordance with the relevant drinking water legislation to the Agency insuch a manner and at such times as required by the Agency. In accordance with this section of theEPA Act, the Agency has prepared a template for the submission of returns which must be usedand must be submitted to the Agency by the 28th February each year. In future years, failure tosubmit the results in time may result in their exclusion from the annual report.
2. Sanitary authorities should review existing data collection and reporting mechanisms to ensure thatthe data is submitted as and when requested by the Agency.
3. Drinking water results should be made more accessible to members of the public by the sanitaryauthority. In this regard the Agency recommends that sanitary authorities post the results of theirmonitoring on their websites on a regular (e.g. monthly) basis.

The Quality of Drinking Water in Ireland A Report for the Year 2003
102
7.5. INFRASTRUCTURE AND PLANNING
1. The large number of small group water schemes in Ireland, and to a lesser extent, small publicsupplies, is a significant barrier to improving the quality of drinking water. Large numbers ofsmall supplies result in operational and management difficulties for those responsible for theproduction and supply of drinking water, as each individual supply requires management,maintenance and monitoring. Consideration should therefore be given to rationalising watersupply in parts of Ireland with large numbers of small supplies with a view to reducing the overallnumber of supplies and increasing their average size.
2. Successive EPA reports on the quality of drinking water in Ireland provide clear evidence thatwater supplied by sanitary authorities is safer to drink than water supplied by privately operatedgroup schemes. Where persistent problems with group schemes exist, serious consideration shouldbe given to having these group schemes brought under the control of sanitary authorities.
7.6. EUROPEAN COMMUNITIES (DRINKING WATER) REGULATIONS2000
1. The sanitary authority should ensure that all supplies serving greater than 50 persons (or supplying>10m3/day) are identified and that a monitoring programme is developed for each supply thatmeets at least the minimum monitoring requirements of the Regulations. The monitoringprogramme should specify the number of samples, the parameters to be sampled, the samplefrequency and the sample locations.
2. Sanitary authorities should also identify all supplies serving less than 50 persons (or supplying<10m3/day) that supply water as part of a public or commercial activity. Further guidance on theidentification of such supplies and the development of a monitoring programme for them can befound in the recent EPA guidelines (EPA, 2003).
3. The sanitary authority should ensure that all monitoring for the purposes of complying with theRegulations must be “water supplied from a distribution network, at the point, within a premises oran establishment, at which it emerges from the tap or taps that are normally used for the provisionof water for human consumption”. Certain parameters must be monitored at the treatment plant(nitrite and turbidity) while others may be monitored at the treatment plant only if there is likely tobe no change in the concentration of the parameter in the distribution network. Further guidanceon such parameters can be found in the EPA Handbook (EPA, 2004).
4. Sanitary authorities must ensure that any exceedance of the parametric values specified in the 2000Regulations is immediately investigated so as to identify the cause of the failure. The appropriatecorrective action should subsequently be taken in accordance with Article 9 of the 2000Regulations.
5. The sanitary authority should examine Table B of the Schedule of the Regulations (the ChemicalParameters) to determine whether it will be necessary to apply to the Agency for a departure fromthe Regulations for any such parameter. Should an application be received by the Agency, theAgency will consider such an application and at its discretion decide to grant or refuse thedeparture. Should a departure be granted it will be for a period not exceeding 3 years.
7.7. ENFORCEMENT OF THE DRINKING WATER REGULATIONS
1. Sanitary authorities should develop an enforcement plan for dealing with non-compliances withinthe group water scheme sector. The sanitary authority should ensure that the enforcement of thestandards is carried out in accordance with Article 9 of the Regulations and that powers ofprosecution available under Article 14 are used where necessary.

The Quality of Drinking Water in Ireland A Report for the Year 2003
103
Suggested Further Reading
Bouchier et al. (1998). Cryptosporidium in Water Supplies: Third Report of the Group of Experts.Department of Environment, Transport and the Regions.
Council Directive 98/83/EC of 3 November 1998 on the Quality of Water Intended for HumanConsumption.
Council Directive 80/778/EEC of 30 August 1980 on the Quality of Water Intended for HumanConsumption.
Department of the Environmental and Local Government. (1998). Protection of Water Supplies:Guidelines for Local Authorities on minimising the risk of Cryptosporidium in water supplies. CircularL7/98.
Department of Health and Children (2002). Forum on Fluoridation 2002.
Environmental Protection Agency (2004). European Communities (Drinking Water) Regulations 2000(S.I. No. 439 of 2000): A Handbook on Implementation for Sanitary Authorities. EPA, Ireland.
Environmental Protection Agency (2001). Parameters of Water Quality: Interpretations andStandards. EPA, Ireland.
Environmental Protection Agency Act, 1992 (No. 7 of 1992)
Environmental Research Unit (1990). European Communities (Quality of Water Intended for HumanConsumption) Regulations, 1988 – A Handbook on Implementation for Sanitary Authorities.
European Communities (Drinking Water) Regulations, 2000 (SI No. 439 of 2000)
European Communities (Quality of Surface Water Intended for the Abstraction of Drinking Water)Regulations, 1989 (SI No. 294 of 1989)
European Communities (Quality of Water Intended for Human Consumption) (Amendment)Regulations, 2003 (SI No. 259 of 2003)
European Communities (Quality of Water Intended for Human Consumption) (Amendment)Regulations, 2000 (SI No. 177 of 2000)
European Communities (Quality of Water Intended for Human Consumption) Regulations, 1988 (SINo. 81 of 1988)
Health (Fluoridation of Water Supplies) Act, 1960 (No. 46 of 1960)
Hrudey, S.E. and Hrudey, E.J. (2004). Safe Drinking Water: Lessons from Recent Outbreaks inAffluent Nations. IWA Publishing, London.
National Academy of Sciences (2001). Arsenic in Drinking Water: 2001 Update.
National Disease Surveillance Centre (2002). Draft Report on Waterborne CryptosporidiosisSubcommittee of the Scientific Advisory Committee. National Disease Surveillance Centre.
National Federation of Group Water Schemes Co-Op Society Ltd. (2004). Annual Report 2003.
National Standards Association of Ireland (1992). I.S. 432:1992 Bottled Water.
Stephens, A. (2001). A Survey of Dangerous Substances in Freshwaters 1999-2000. EPA

The Quality of Drinking Water in Ireland A Report for the Year 2003
104
World Health Organisation (2003). Draft Guidelines for Drinking Water Quality. (3rd Ed).
World Health Organisation (2003). Right to Water.
World Health Organisation (2000). Disinfectants and Disinfection Byproducts: IPSC EnvironmentalHealth Criteria 216.
World Health Organisation (1993). Guidelines for Drinking Water Quality. (2nd Ed).

The Quality of Drinking Water in Ireland A Report for the Year 2003
105
USER COMMENT FORM
NOTE: Completed comments to be forwarded to: The Office of Environmental Enforcement,Environmental Protection Agency, P.O. Box 3000, Johnstown Castle Estate, Wexford.
Document Title: The Quality of Drinking Water in Ireland: A Report for the Year 2003 with aReview of the Period 2001 to 2003
CONTENTS:_______________________________________________________________________
__________________________________________________________________________________
STYLE:___________________________________________________________________________
__________________________________________________________________________________
INFORMATION:___________________________________________________________________
__________________________________________________________________________________
SUGGESTIONS FOR FUTURE EDITIONS:_____________________________________________
__________________________________________________________________________________
__________________________________________________________________________________
__________________________________________________________________________________
__________________________________________________________________________________
__________________________________________________________________________________
__________________________________________________________________________________
NAME _______________________________________
ORGANISATION _______________________________________
ADDRESS _______________________________________
_______________________________________
DATE .................................................... PHONE ..........................……FAX.....................................