the racial wealth divide in new orleans - prosperity … racial wealth divide in new orleans...
TRANSCRIPT

The Racial Wealth Divide in New
Orleans
Optimized for Screen Readers

Contents Directors Letter ..................................................................................................................................... 4
The Racial Wealth Divide in New Orleans ....................................................................................... 5
Infographic Highlights .................................................................................................................... 7
Population ..................................................................................................................................... 7
Median Property Value ............................................................................................................... 7
Unemployment Rate .................................................................................................................... 7
Income Poverty Rate .................................................................................................................... 7
Population Change Among People of Color in New Orleans Neighborhoods, 2000 to 2010 ... 7
Racial Wealth Divide in New Orleans Infographics ....................................................................... 8
Households of Color in Liquid Asset Poverty ............................................................................. 8
Population ......................................................................................................................................... 8
Liquid Asset Poverty by Race ........................................................................................................ 8
Median Household Income ............................................................................................................ 9
Households with Zero Net Worth ................................................................................................. 9
Homeownership Rate ...................................................................................................................... 9
Cost-Burdened Renters ................................................................................................................... 9
Bachelor’s Degree or Higher ........................................................................................................... 9
Unemployment Rate ........................................................................................................................ 9
Business Ownership ...................................................................................................................... 10
Businesses Without Paid Employees ........................................................................................... 10
Average Business Value ................................................................................................................ 10
Data Tables .......................................................................................................................................... 10
Building High Impact Nonprofits of Color .................................................................................... 10
New Orleans, LA: Building High Impact Nonprofits of Color Project .................................. 11
Ashé Cultural Arts Center ........................................................................................................ 11
Jericho Road Episcopal Housing Initiative ............................................................................. 11
MQVN Community Development Corporation.................................................................... 12
Puentes New Orleans, Inc. ........................................................................................................ 12
VAYLA New Orleans ................................................................................................................ 13
Building High Impact Nonprofits Project Partners ....................................................................... 13
CFED ................................................................................................................................................ 13

Racial Wealth Divide Initiative (RWDI) at CFED ...................................................................... 13
JPMorgan Chase & Co. .................................................................................................................. 14
The Center for Public & Nonprofit Leadership ......................................................................... 14

Directors Letter
Dear Reader,
The Racial wealth divide is broad and deep in thousands of communities across the United States. The
issue of wealth inequality has a multitier of ramifications for communities and families.
In New Orleans, the racial wealth divide is as unique as the people. Much of the divide is due to
systemic racism and prejudice, perpetuated by federal policy and privatized prejudice and predation.
The Racial Wealth Divide Initiative at CFED developed this profile to better understand how racial
economic inequality affects New Orleans. This profile is also one of the first steps taken under the
Building High Impact Nonprofits of Color project, funded by JPMorgan Chase & Co. This project aims
to advance best practices and strengthen resources for nonprofits of color.
How do I use this profile?
The following profile presents data on the economic inequalities within New Orleans. These statistics
may seem overwhelming, however we believe with more information about the challenges of racial
economic inequality, there is a greater opportunity to identify best practices and policies that can
address the racial wealth divide.
How does New Orleans compare to the rest of the nation?
People of color in New Orleans—Black, Asian and Latino populations— generally struggle more than
their peers nationwide, yet New Orleans’ White population often has better economic outcomes than
the White population nationwide. The White population’s income is $5,377 higher in New Orleans than
it is nationwide, while the Black population’s income is $10,194 lower. Similarly, the Asian and Latino
populations’ incomes are lower in New Orleans than they are nationwide (by $28,521 and $1,169,
respectively). The Black unemployment rate is 2.1% higher than the national rate. Lastly, New Orleans’
White population has a 2.3% lower rate of liquid asset poverty than the nationwide White population,
while the Black population’s rate is 6.1% higher than the national average.
What’s next?
CFED’s Racial Wealth Divide Initiative will be working in New Orleans to build the capacity of
nonprofits of color so that they are better positioned in their field to further their impact in the
communities that need them most. We believe that in order to address the significant financial
insecurity facing families and communities of color, we must strengthen the local organizations of color
that are on the frontlines addressing these communities needs and concerns and providing greater
economic opportunity.
Sincerely,
Dedrick Asante-Muhammad
Director, Racial Wealth Divide Initiative, CFED

The Racial Wealth Divide in New Orleans
Economic inequality has expanded in recent decades, shutting the windows of opportunity
for millions of Americans. In urban centers we see this growing inequality in gentrification
and concentrated poverty in communities of color, which have far-reaching consequences.
Perhaps nowhere has the impact of such inequality been as visible as in New Orleans,
Louisiana, where tens of thousands of people were displaced from the city when homes were
destroyed and jobs disappeared in the wake of Hurricane Katrina and the ensuing floods.
Ten years after the storm, the effects of Hurricane Katrina are still being felt in New Orleans.
Many displaced households — particularly African-American households — never returned
to the city. Even as the white population has almost fully recovered, recent Census estimates
suggest that there are now almost 100,000 fewer African Americans living in New Orleans
than in 2000. African Americans now comprise 59% of the city’s population, compared to
67% in 2000. Meanwhile, the white, Latino and Asian American populations have all
increased as a share of the city’s total population: today, 31% of the New Orleans population
is white (up from 27% in 2000), 5% is Latino (up from 3%) and 3% is Asian American (up
from 2%).
In the years since, much of the city has been rebuilt. Neighborhoods have been repopulated,
the school system has been overhauled, and airports, hospitals and the tourist economy have
been restored. Yet, racial economic inequality in New Orleans continues, and the African
American population has been largely left behind. The data show vast disparities in
outcomes between white households and those of color, a result of an unequal recovery and
an enduring legacy of racial inequality.
African American households in New Orleans lag across multiple measures of financial
security. Median income among African American households is only $25,806, compared to
$64,377 for white households, and there are six times as many African American households
living in income poverty than white households. Moreover, African American workers are
three times more likely to be unemployed than white workers (15.3% and 5.1%, respectively),
and a full 71% of African- American households are liquid asset poor, meaning they lack the
savings necessary to live above the poverty level for just three months if they lose a job, face a
medical crisis or suffer another income disruption.
Additionally, homeownership—historically the greatest source of wealth for middle-income
Americans—remains out of reach for the majority of New Orleans’ households of color: only
43% of African American households and 33% of Latino households own their homes,
compared to 54% of white or Asian households. Also, although Asian American households
have roughly the same rate of homeownership as white households, there is a major gap in
property values.
The median value of an Asian American-owned home is $150,000, the same as that of the
average African American-owned home, and only half the value of the average white-owned

home. Asian American homeowners are also the most likely (62%) to be cost-burdened; half
of African American and Latino homeowners, and just 34% of whites, face similar straits.
At the bottom of the page are two logos from left to right they read: CFED, expanding
economic opportunity and JPMorgan Chase and Co.

Infographic Highlights There are four graphics on the right side of The Racial Wealth Divide in New Orleans
text. They are described from top to bottom:
Population A circle is divided up into five unequal sections representing the following: Blacks
constitute 59% of the New Orleans’s population, Latino’s constitute 5% of the
population, whites constitute 31% of the population, Asians constitute 3% and other
constitutes 2% of the population.
Median Property Value The average Asian and African American home is worth half the value of the average
white-owned home.
Unemployment Rate There is only text that reads: The unemployment rate of households of color is New
Orleans is three times more than the rate for white households.
Income Poverty Rate There is only text that reads: Families of color in New Orleans are six times more
likely to live in poverty than white families.
Population Change Among People of Color in New Orleans Neighborhoods, 2000 to 2010
The aforementioned data make clear that no single solution will adequately cover the gap for
all racial or ethnic groups, nor are all households of color confronted with identical obstacles
on the path to financial security. The Racial Wealth Divide Initiative at CFED understands
that redressing the disparity in economic outcomes requires an inclusive approach that
addresses not only the disparities themselves, but also their root causes. Through work
funded by JPMorgan Chase, the Racial Wealth Divide Initiative has launched a project to
build the capacity of organizations of color working in economically marginalized
communities.
A map of New Orleans divided up into neighborhoods and color-coded according to either
increases or decreases in the nonwhite population is displayed. The darker colors represent
relative increases in nonwhite populations.
The neighborhoods shaded in the darkest are: Lake Catherine (the furthest west
neighborhood), Old Aurora, Tall Timbers, Lake Terrace, half of St. Anthony, Filmore,
Lakeshore, West End, Lakeview, Lakewood, and French Quarter. They experienced a 15.9-
17.37% increase in nonwhite populations. The neighborhoods shaded in the second darkest
are: Village De Lest, Viavant, Little Woods, Read Boulevard East, West Lake Forest, Plum
Orchard, Gentilly Woods, Gentilly Terrace, Desire Area, half of St. Anthony, Holy Cross,
Behrman, Tulane, Hollygrove, Audubon, and New Aurora. They experienced a 0.1-15.8%
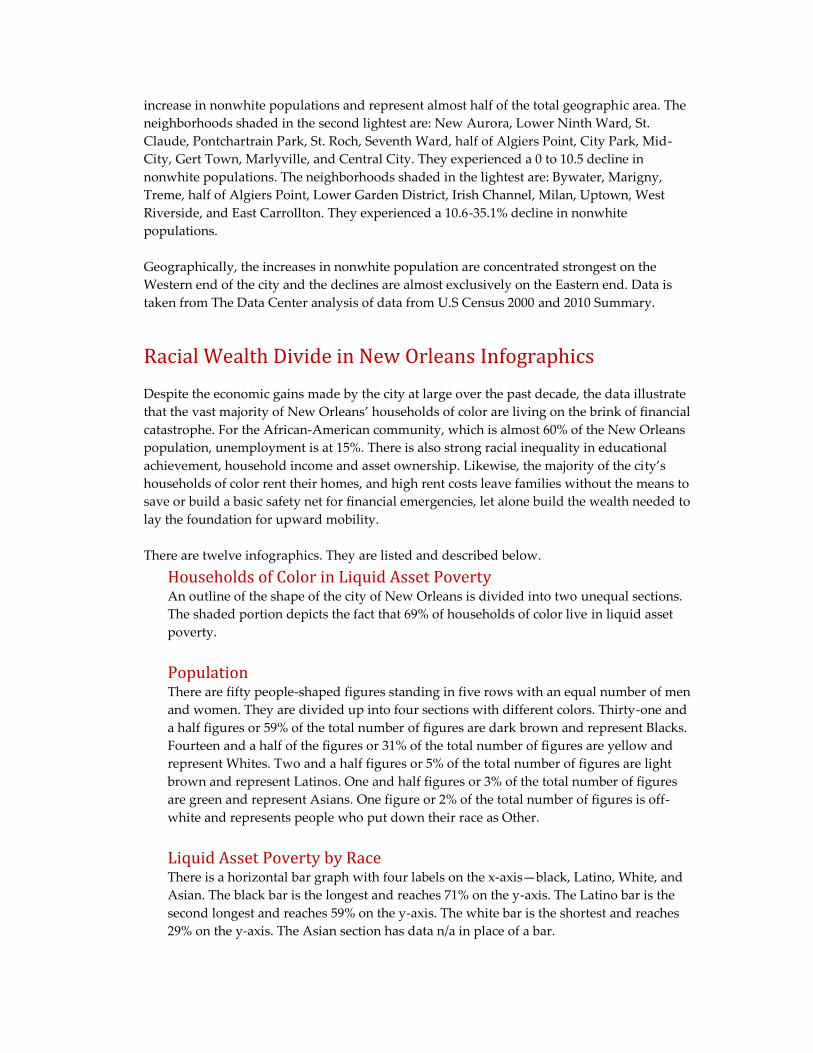
increase in nonwhite populations and represent almost half of the total geographic area. The
neighborhoods shaded in the second lightest are: New Aurora, Lower Ninth Ward, St.
Claude, Pontchartrain Park, St. Roch, Seventh Ward, half of Algiers Point, City Park, Mid-
City, Gert Town, Marlyville, and Central City. They experienced a 0 to 10.5 decline in
nonwhite populations. The neighborhoods shaded in the lightest are: Bywater, Marigny,
Treme, half of Algiers Point, Lower Garden District, Irish Channel, Milan, Uptown, West
Riverside, and East Carrollton. They experienced a 10.6-35.1% decline in nonwhite
populations.
Geographically, the increases in nonwhite population are concentrated strongest on the
Western end of the city and the declines are almost exclusively on the Eastern end. Data is
taken from The Data Center analysis of data from U.S Census 2000 and 2010 Summary.
Racial Wealth Divide in New Orleans Infographics
Despite the economic gains made by the city at large over the past decade, the data illustrate
that the vast majority of New Orleans’ households of color are living on the brink of financial
catastrophe. For the African-American community, which is almost 60% of the New Orleans
population, unemployment is at 15%. There is also strong racial inequality in educational
achievement, household income and asset ownership. Likewise, the majority of the city’s
households of color rent their homes, and high rent costs leave families without the means to
save or build a basic safety net for financial emergencies, let alone build the wealth needed to
lay the foundation for upward mobility.
There are twelve infographics. They are listed and described below.
Households of Color in Liquid Asset Poverty An outline of the shape of the city of New Orleans is divided into two unequal sections.
The shaded portion depicts the fact that 69% of households of color live in liquid asset
poverty.
Population There are fifty people-shaped figures standing in five rows with an equal number of men
and women. They are divided up into four sections with different colors. Thirty-one and
a half figures or 59% of the total number of figures are dark brown and represent Blacks.
Fourteen and a half of the figures or 31% of the total number of figures are yellow and
represent Whites. Two and a half figures or 5% of the total number of figures are light
brown and represent Latinos. One and half figures or 3% of the total number of figures
are green and represent Asians. One figure or 2% of the total number of figures is off-
white and represents people who put down their race as Other.
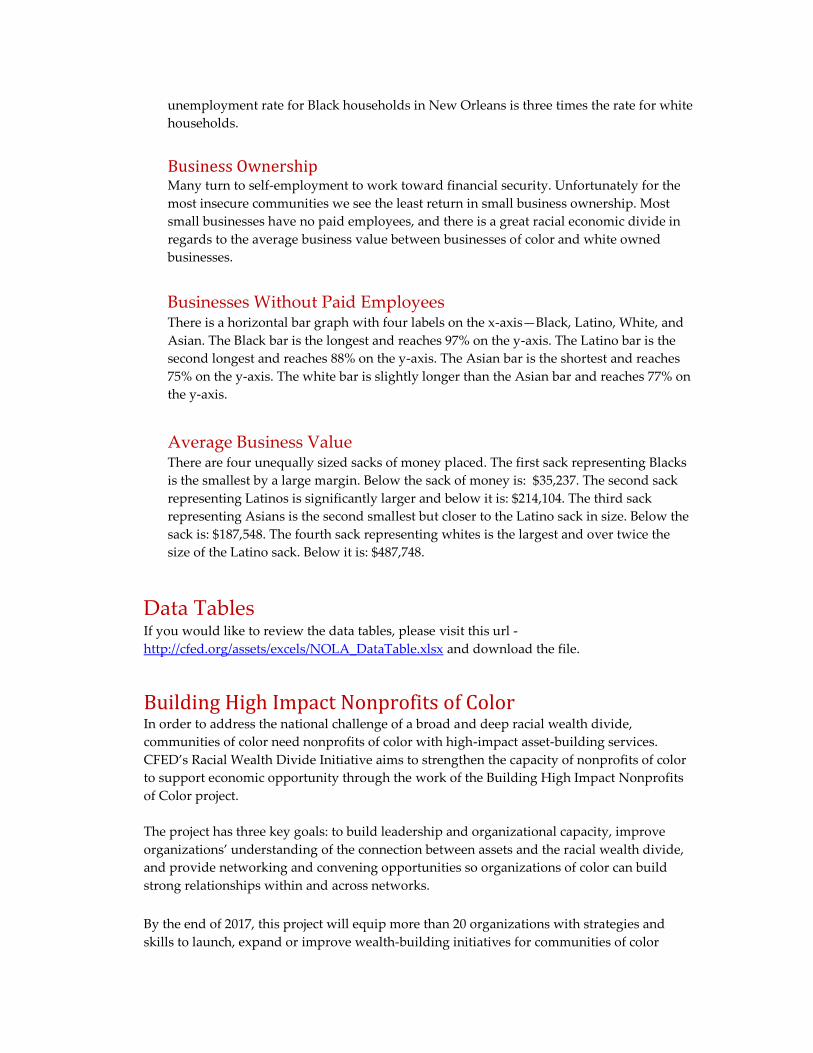
Liquid Asset Poverty by Race There is a horizontal bar graph with four labels on the x-axis—black, Latino, White, and
Asian. The black bar is the longest and reaches 71% on the y-axis. The Latino bar is the
second longest and reaches 59% on the y-axis. The white bar is the shortest and reaches
29% on the y-axis. The Asian section has data n/a in place of a bar.

Median Household Income There are four unequal stacks of money placed in ascending order, left to right. The one
on the far left is the shortest and labeled with black and $25,806. To the right is the
second shortest stack. It is labeled with Latino and $40,831. The third to the right is
labeled with Asian and $44,479. The one on the furthest right is the tallest. It is labeled
with white and $64,377.
Households with Zero Net Worth There is a single circle made up of three rings of different colors representing three
different populations. The innermost ring is yellow and represents whites. There is a
bolded portion of the ring that forms 16% of the rings. The middle ring is brown and
represents Latinos. The bolded portion forms 27% of the ring. The outermost ring is dark
red and represents Blacks. The bolded portion forms 33% of the ring. Data is n/a for
Asians
Homeownership Rate There are four houses labelled Black, Latino, Asian and White. Each house is partially
shaded a darker color and no house is shaded in the same amount. The red house
represents Blacks and 43% of it is shaded in darker. The brown house represents Latinos
and 34% of it is shaded in darker. The green house represents Asians and 54% of it is
shaded in darker. The yellow house represents whites and 54% of it is shaded in darker.
Cost-Burdened Renters A vertical bar graph with Black, Latino, white, and Asian on the x-axis. The Black bar is
the highest and reaches 69% on the y-axis. The Latino bar is the second lowest and
reaches 50% on the y-axis. The Asian bar is slightly taller and reaches 58% on the y-axis.
The white bar is the lowest and reaches 46% on the y-axis.
Bachelor’s Degree or Higher There are four squares of different sizes and colors labelled Black, Latino, white, and
Asian. The dark red square represents Blacks and at 16%, it is the smallest. Directly to the
right is the brown square representing Latinos. At 33%, it is the second smallest. The
square directly below it is yellow and represents whites. At 62%, it is almost twice as
large as the brown square. The square to the left is green and represents Asians. At 39%,
it is about the same size as the brown/Latino square. The text below the infographic
reads: only sixteen percent of black adults in New Orleans finish a Bachelor's degree or
higher compared to sixty-two percent of white adults.
Unemployment Rate There are four thermometers of different sizes and colors labelled black, Latino, Asian,
and white. The dark red thermometer represents Blacks and at 15% is the largest. The
brown thermometer represents Latinos. At 6%, it is less than half the size of the dark red
thermometer. The green thermometer representing Asians and the yellow thermometer
representing whites are exactly the same size at 5%. The text at the bottom reads: the
unemployment rate for Black households in New Orleans is three times the rate for white
households.
Business Ownership Many turn to self-employment to work toward financial security. Unfortunately for the
most insecure communities we see the least return in small business ownership. Most
small businesses have no paid employees, and there is a great racial economic divide in
regards to the average business value between businesses of color and white owned
businesses.
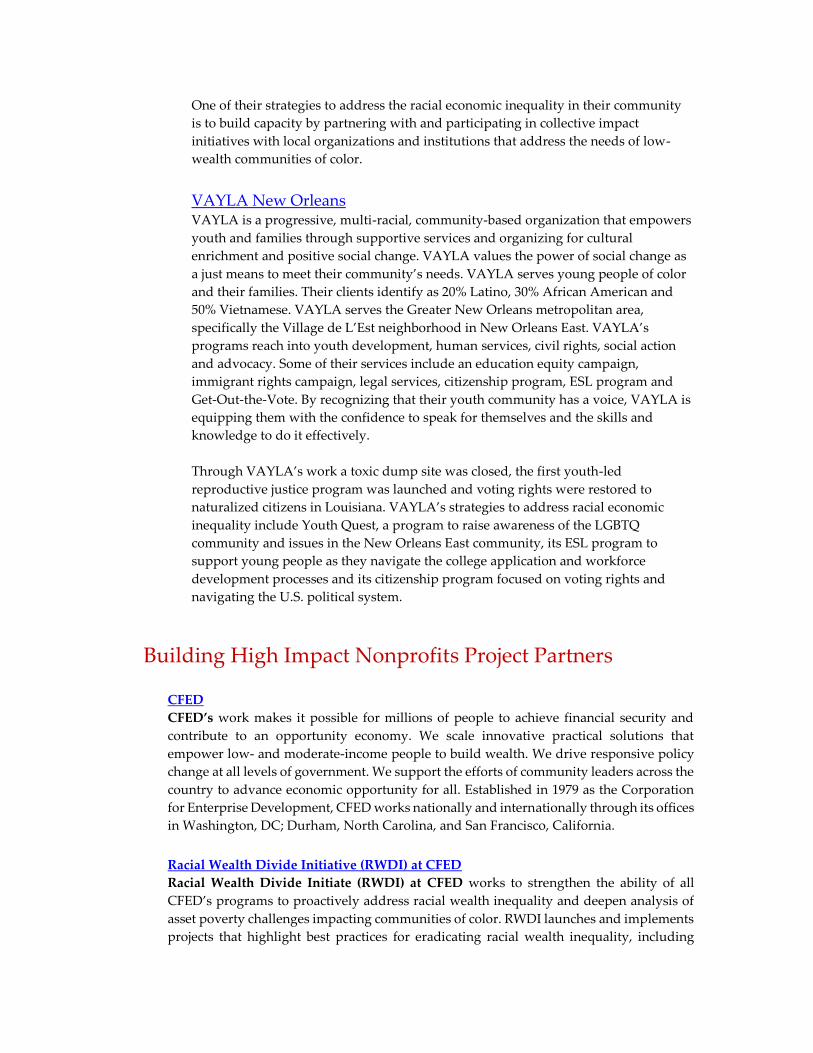
Businesses Without Paid Employees There is a horizontal bar graph with four labels on the x-axis—Black, Latino, White, and
Asian. The Black bar is the longest and reaches 97% on the y-axis. The Latino bar is the
second longest and reaches 88% on the y-axis. The Asian bar is the shortest and reaches
75% on the y-axis. The white bar is slightly longer than the Asian bar and reaches 77% on
the y-axis.
Average Business Value There are four unequally sized sacks of money placed. The first sack representing Blacks
is the smallest by a large margin. Below the sack of money is: $35,237. The second sack
representing Latinos is significantly larger and below it is: $214,104. The third sack
representing Asians is the second smallest but closer to the Latino sack in size. Below the
sack is: $187,548. The fourth sack representing whites is the largest and over twice the
size of the Latino sack. Below it is: $487,748.
Data Tables If you would like to review the data tables, please visit this url -
http://cfed.org/assets/excels/NOLA_DataTable.xlsx and download the file.
Building High Impact Nonprofits of Color In order to address the national challenge of a broad and deep racial wealth divide,
communities of color need nonprofits of color with high-impact asset-building services.
CFED’s Racial Wealth Divide Initiative aims to strengthen the capacity of nonprofits of color
to support economic opportunity through the work of the Building High Impact Nonprofits
of Color project.
The project has three key goals: to build leadership and organizational capacity, improve
organizations’ understanding of the connection between assets and the racial wealth divide,
and provide networking and convening opportunities so organizations of color can build
strong relationships within and across networks.
By the end of 2017, this project will equip more than 20 organizations with strategies and
skills to launch, expand or improve wealth-building initiatives for communities of color

across the country. CFED’s Racial Wealth Divide Initiative will continue partnering with
organizations to support their growth and development, share CFED resources and analysis
and continue learning about best practices for addressing racial economic inequality at the
local level.
Below are the five nonprofit organizations of color that the Racial Wealth Divide Initiative is
working with in New Orleans, LA. Each of these organizations is working within their
respective communities to help bridge the racial wealth divide and promote financial literacy
and capability in their communities. Despite the widening of the racial wealth gap, these
organizations and others like them are developing, piloting, managing and replicating
primer programs and best practices to address the inequalities in New Orleans and the
nation.
New Orleans, LA: Building High Impact Nonprofits of Color Project
Ashé Cultural Arts Center The mission of Ashé Cultural Arts Center (Ashé CAC) is to use art and culture to
support human, community and economic development. Serving the Central City
neighborhood of New Orleans, Ashé CAC sees more than 25,000 visitors each year.
Through art and culture Ashé CAC fosters equitable community and human
development by producing and presenting works that demonstrate the positive
contributions people of African descent make to their communities. Furthering this
vision, Ashé CAC acquired 33 units of affordable housing in a gentrifying inner-city
community and now lease these units to artists, culture bearers and community
activists.
In addition to providing affordable housing, Ashé CAC leases a 10,650 square foot
performance and exhibition space that has been named Ashé Power House, where
they host some of their 800 annual events. Ashé CAC’s strategies to address racial
economic inequality include distributing information on asset building to artists and
culture bearers, repopulating the Central City neighborhood with its former
residents and new like-minded neighbors post-Hurricane Katrina, demonstrating the
positive contributions of people of African descent make to their communities and
advocating and articulating the conjugation of equity in an ever-changing
community.
Jericho Road Episcopal Housing Initiative Jericho Road Episcopal Housing Initiative is a neighborhood-based nonprofit
developer that provides families with healthy and energy-efficient affordable
housing opportunities. Jericho Road primarily serves low-income African American
women. Its geographic service area is the Central City community, in particular it
serves three Faubourgs (or sub-neighborhoods): Faubourg Delassize, Faubourg
Livaudais and Faubourg Lafayette. In addition to serving as a developer of
affordable housing, Jericho Road also manages vacant land, remedies brownfields
including the South Saratoga Incinerator Site – a polluted city block owned by the
City of New Orleans situated in the heart of a low-income African American

neighborhood and unites stakeholders, advocates and development practitioners to
increase the economic sustainability of Central City through its Central Circle.
Jericho Road’s work has led to the investment of over $11 million in community and
affordable housing development, the reduction of blighted and vacant properties,
facilitated more than 11,000 resident engagement hours and formed three
neighborhood associations. Jericho Road’s strategies to address racial economic
inequality include community development through relationship building and by
supporting resident-to-resident collaboration, equitable housing development with a
commitment to energy efficiency, universal design concepts and architectural
integrity and vacant land management.
MQVN Community Development Corporation MQVN Community Development Corporation (MQVN CDC) is dedicated to
preserving and promoting their unique diversity and improving the quality of life of
residents in the Greater New Orleans area, beginning in New Orleans East. MQVN
CDC’s main constituency identifies as low-income, Asian American, African
American, Latino and/or immigrant/refugee. MQVN CDC serves Village de L’Est, a
community which is approximately 45% African American, 45% Vietnamese, 8%
Latino and 2% White.
MQVN provides multilingual services and culturally-nuanced services for
community members in healthcare, business development, job creation, and social
services. MQVN CDC provided social services through over 13,500 visits since
Hurricane Katrina, assisted businesses in receiving over $12.5M in grants and loans,
successfully closed a landfill, developed the VEGGI Farmers’ Cooperative which
incubated 16 growers and enrolled over 600 community members in health care
coverage. MQVN’s strategies to address racial economic inequality are economic
development through business development and job creation, and programs and
projects based on improving the quality of life for community members, young and
old.
Puentes New Orleans, Inc. Puentes New Orleans’ (Puentes) mission is to build assets and create access for and
with Latinos of the Greater New Orleans metropolitan area through education,
economic asset building and policy advocacy. Puentes serves low- to moderate-
income Latino families in the New Orleans metropolitan area, primarily in Orleans
and Jefferson Parishes. Puentes programs are designed to target members of the
community who are primarily Latinos, immigrants, refugees, youth, and women. Its
programs address arts & culture, youth development, civil rights, social action &
advocacy, community improvement, small business development, credit counseling
and first time homebuyer education.
Puentes is the only organization in its area to provide this type of programming in
Spanish and culturally relevant to Latinos. Puentes has helped 11 low- to moderate-
income families purchase homes and provided over 800 community members with
free health screenings and assistance in enrolling in an affordable health care plan.
One of their strategies to address the racial economic inequality in their community
is to build capacity by partnering with and participating in collective impact
initiatives with local organizations and institutions that address the needs of low-
wealth communities of color.
VAYLA New Orleans VAYLA is a progressive, multi-racial, community-based organization that empowers
youth and families through supportive services and organizing for cultural
enrichment and positive social change. VAYLA values the power of social change as
a just means to meet their community’s needs. VAYLA serves young people of color
and their families. Their clients identify as 20% Latino, 30% African American and
50% Vietnamese. VAYLA serves the Greater New Orleans metropolitan area,
specifically the Village de L’Est neighborhood in New Orleans East. VAYLA’s
programs reach into youth development, human services, civil rights, social action
and advocacy. Some of their services include an education equity campaign,
immigrant rights campaign, legal services, citizenship program, ESL program and
Get-Out-the-Vote. By recognizing that their youth community has a voice, VAYLA is
equipping them with the confidence to speak for themselves and the skills and
knowledge to do it effectively.
Through VAYLA’s work a toxic dump site was closed, the first youth-led
reproductive justice program was launched and voting rights were restored to
naturalized citizens in Louisiana. VAYLA’s strategies to address racial economic
inequality include Youth Quest, a program to raise awareness of the LGBTQ
community and issues in the New Orleans East community, its ESL program to
support young people as they navigate the college application and workforce
development processes and its citizenship program focused on voting rights and
navigating the U.S. political system.
Building High Impact Nonprofits Project Partners
CFED
CFED’s work makes it possible for millions of people to achieve financial security and
contribute to an opportunity economy. We scale innovative practical solutions that
empower low- and moderate-income people to build wealth. We drive responsive policy
change at all levels of government. We support the efforts of community leaders across the
country to advance economic opportunity for all. Established in 1979 as the Corporation
for Enterprise Development, CFED works nationally and internationally through its offices
in Washington, DC; Durham, North Carolina, and San Francisco, California.
Racial Wealth Divide Initiative (RWDI) at CFED
Racial Wealth Divide Initiate (RWDI) at CFED works to strengthen the ability of all
CFED’s programs to proactively address racial wealth inequality and deepen analysis of
asset poverty challenges impacting communities of color. RWDI launches and implements
projects that highlight best practices for eradicating racial wealth inequality, including

collaborating with local and regional organizations. RWDI supports the efforts of CFED
and its partners to drive policy solutions that reduce racial economic inequality at the
national, state and local levels.
JPMorgan Chase & Co.
JPMorgan Chase & Co. is a leading global financial services firm with assets of $2.4 trillion
and operations worldwide. The firm is a leader in investment banking, financial services
for consumers and small businesses, commercial banking, financial transaction processing
and asset management. A component of the Dow Jones Industrial Average, JPMorgan
Chase & Co. serves millions of consumers in the United States and many of the world’s
most prominent corporate, institutional and government clients under its J.P. Morgan and
Chase brands. The firm uses its global resources, expertise, insights and scale to address
some of the most urgent challenges facing communities around the world, including the
need for increased economic opportunity.
The Center for Public & Nonprofit Leadership The Center for Public & Nonprofit Leadership at Georgetown University’s McCourt
School of Public Policy is a leading education, research and training center dedicated to
the development of public, nonprofit and philanthropic leadership. Our programs for
students, practitioners and policymakers increase their capacity to work across
organizations, communities and sectors to address public needs, tackle public problems
and, above all, promote the public good.
Follow-us on social media!
Website: cfed.org/rwd
Podcast: soundcloud.com/rwdpodcast
Facebook: facebook.com/racialwealthdivide/