the raman study of amphiboles
TRANSCRIPT

ANALELE ŞTIINŢIFICE ALE UNIVERSITĂŢII „AL. I. CUZA” IAŞI
Geologie. Tomul LVI, nr. 1, 2010
THE RAMAN STUDY OF AMPHIBOLES
ANDREI IONUŢ APOPEI1, NICOLAE BUZGAR
1
1 “Al. I. Cuza” University of Iaşi, Department of Geology, 20A Carol I Blv., 700505 Iaşi,
Romania
Abstract
Raman spectroscopy is a simple, powerful and fast method to identify and distinguish
between different minerals from the amphibole group of the inosilicate class. We analyzed
samples of grunerite, actinolite, nephrite, Cr – actinolite (smaragdite), uralite (var. of
actinolite), tremolite, pargasite, glaucophane and riebeckite in order to determine their
Raman spectra and their fingerprint. The structure of these amphiboles belongs to the space
group C2/m. Also, through this work we intend to show types of linkages between Si and
bridging O (Ob) or non-bridging O (Onb), and complex vibrations that occur in all
amphibole spectra, corresponding to the symmetric stretching modes (νs) of the Si-Ob-Si
bridges or O-Si-O linkages and to the asymmetric stretching modes (νas) of the Si-Ob-Si
bridges and O-Si-O linkages. The most distinct Raman peak detected in this Raman study
of amphiboles is around 660-675 cm-1
, which is assigned to the ν1/νs (symmetric stretching
vibrations) of the Si-Ob-Si bridges. Some spectra present two very weak peaks at ~2330
cm-1
and ~2437 cm-1
, respectively, due to the substitution of K or Na with H3O+ (K, Na ↔
H3O+) and NH4
+ (K, Na ↔ NH4
+); these spectral bands were identified at potassium micas.
Keywords: amphiboles, Raman spectra, double chain silicates, Si4O11 vibrations,
smaragdite, uralite.
Raman modes in amphiboles
For double chain silicates (amphiboles), the assignment process is very complicated,
because of the major differences regarding the assignment of the peaks/vibrations
encountered in the works of various authors; this is due to the very complex structure of the
amphibole minerals.
1 e-mail: [email protected]

Andrei Ionuț Apopei, Nicolae Buzgar
58
In general, the Raman bands in amphibole spectra are classified into three main types,
as follows:
- vibrations modes from the interactions between the cation and oxygen (M-O);
- vibrations of Si4O11∞ ribbons, also called internal vibrations;
- vibrations of the hydroxyl molecule (OH-)
A correct assignment of the spectral bands is very difficult in the 210-625 cm-1
spectral
region, where the vibrational modes of the cations are active; also, Fornero et al. (2008)
have tentative assignments of the bending (deformation) modes of the SiO4 tetrahedra in
this spectral region. According to Nakamoto (2009), ν2 (SiO4) and ν4 (SiO4) are bending
modes and they exhibit at the following values: ν2 – 340 cm-1
and ν4 – 527 cm-1
. This
tentative assignment is uncertain for several reasons, one of them being the large number of
vibrational units and interlinking of the SiO4 tetrahedra. The possibility that some bands
may be mixed and appear as a result of overlapping modes is taken into account.
According to Bard et al. (1997), Kloprogge et al. (2001), Shurvell et al. (2001),
Rinaudo et al. (2004) and Petry et al. (2006), the bands situated below 625 cm-1
may be
ascribed to the bending (deformation) modes of the double chain silicate and vibrations
involving cations in the various M sites.
Kloprogge et al. (2001) assign some spectral bands in this region (below 625 cm-1
;
more precisely around 302, 534, 587 and 612 cm-1
) to the OH- group (OH
- libration/rotation
and OH- translation); Rinaudo et al. (2004) ascribe the bands between 200-300 cm
-1 to the
O-H-O group (where O are the apical oxygen of the SiO4 tetrahedra and H is the hydrogen
of the OH group). This assignment is based on the fact that in the Raman spectra of
minerals containing OH- in the tetrahedral rings (phyllosilicates, in particular) the
vibrations mentioned above are present (Rinaudo et al., 2004). Shurvell et al. (2001) and
Huang (2003) ascribe the bands between 200 and 300 cm-1
to lattice vibration. Makreski et
al. (2006) are more specific and assign the bands between 300-420 cm-1
to T(M-OH) –
where T represents the translational mode; M = Mg or Fe, and the 420-610 cm-1
spectral
region to the deformation (bending) mode of the Si-O-Si or δ(Si-O-Si).
The 625-1130 cm-1
spectral region (internal vibrations) is easy to understand. The types
of bonds that are involved in the internal vibration of the ribbons are illustrated in
figure 1. In this figure, the double chains of silica tetrahedrons (SiO4; T1 in the center and
T2 on the side) are aligned along the c-axis, and the a-axis is perpendicular to the
layer.
We took into account the state of bridging oxygen (Ob) or non-bridging oxygen (Onb) if
it is basal or apical. However, without taking into account the spatial orientation of each
identity unit ( ), there are four tetrahedra which have two Si-Ob-Si, four O-Si-O
(Obasal/nb-Si-Ob, Obasal/nb-Si-Oapical/nb, Ob-Si-Oapical/nb and Ob-Si-Ob) and two Si-O (Si-Obasal/nb
and Si-Oapical/nb) types of bonds. There are two bridges of Si-Ob-Si, because one of them is
between T1-T2 and the other between T1-T1; these bridges are highlighted in green in
figure 1. The Obasal/nb-Si-Ob linkage is highlighted in purple, Obasal/nb-Si-Oapical/nb in orange,
Ob-Si-Oapical/nb in cyan and Ob-Si-Ob in yellow. The last two groups: Si-Obasal/nb is
highlighted in black and Si-Oapical/nb in blue.

The Raman study of amphiboles
59
Fig. 1 Graphical representation of the types of bonds (represented by different colors) that are
involved in the internal vibration of the amphiboles
This kind of interpretation assumes that bond types (a total of eight) can vibrate both
symmetrically and asymmetrically (νs and νas). Therefore, theoretically, from the
group 16 bands are expected to appear in the Raman spectra. These 16 bands are in good
agreement with the number suggested by Kieffer (1980) and Andrut et al. (2000); however,
these authors offer other assignments of these 16 bands (depending on the type of the
bands/bridges/links between Si and Ob/nb).
According to Kloprogge et al. (2001) and Rinaudo et al. (2004), four Si-Ob-Si and four
O-Si-O antisymmetric (or asymmetric) stretching vibrations (νas) can be observed in
amphiboles within the 950-1130 cm-1
range. Moreover, the vibrations between 1000-1130
cm-1
are ascribed to the asymmetric stretching vibrations (νas) of the Si-Ob-Si bridges. Then,
vibrations between 950-1000 cm-1
are assigned to the νas of O-Si-O linkages. According to

Andrei Ionuț Apopei, Nicolae Buzgar
60
the same authors, the bands in the 750-950 cm-1
region may be ascribed to the symmetric
stretching modes (νs) of the O-Si-O linkages. The Raman bands in the 650-750 cm-1
spectral region are assigned to the symmetrical stretching vibration (νs) of the Si-Ob-Si
bridges. We respect these assignments (νs < νas - in terms of frequency), given that in many
papers dealing with the Raman study of amphiboles (Kieffer, 1980; Kloprogge et al., 2001;
Rinaudo et al., 2004; Rinaudo et al., 2005; Makreski et al., 2006; Petry et al., 2006; Fornero
et al., 2008) this is a basic rule. Apart from this, Nakamoto (2009) confirms this assignment
of the asymmetric vibrations in the upper spectral region and of the symmetric vibrations
below the asymmetric ones, ν3 > ν1 and ν4 > ν2 (MO42-
type compounds) where ν1 and ν2 are
symmetric and ν3 and ν4 are asymmetric.
For our samples of amphiboles, the Raman spectra show one peak (in most cases, this
band is very sharp) with a very high intensity; according to Kloprogge et al. (2001);
Rinaudo et al. (2004) and Fornero et al. (2008), this peak is assigned to the ν1 (A1g) –
symmetrical stretching vibration of the Si-Ob-Si bridges (between 650-750 cm-1
).
Finally, the vibrational assignment of the OH- group is an exception regarding the
difficulty of the assignment of spectral bands.
According to some authors, the peaks of the spectral region ranging from 200-625 cm-1
may be assigned to the OH- libration and translation. After other authors, the hydroxyl
stretching region is between 3600-3700 cm-1
(Huang, 2003; Kloprogge et al., 2001 and Su
et al., 2009). Unfortunately, this region is not found in our spectral domain (210-3400
cm-1
). This is a disadvantage, as bands from the OH- stretching region indicate a correlation
between chemical and cation compositions (Su et al., 2009) or help us investigate the
spectra obtained on two or more samples from the same series of amphiboles; for example,
in the case of tremolite samples, Huang (2003) makes a correlation between Fe2+
and the
number of bands in the region of the OH- stretching modes – if the Fe
2+ content increases,
the Raman vibration mode shifts from one to three. Also, Jovanovski et al. (2009) make a
similar correlation: depending on the presence and/or absence of Fe2+
in M1 and M3 sites,
the number of bands (OH- region) could range from one in tremolite up to four in ferro-
actinolite samples. The existence of a center of inversion in all monoclinic amphiboles (the
C2/m space group) precludes the coincidence of the OH- stretching vibrations in the IR and
Raman spectra of amphiboles.
According to Kloprogge et al. (2001), the exact band positions (for Raman and IR
spectra of holmquistite) are at slightly different frequencies (~2-3 cm-1
), and this is
important because, thus, correlations between Raman and IR spectra can be made.
In order to render what is written above easier to understand, we suggest a schematic
representation for all vibration assignment in all the Raman spectra of amphiboles (figs. 2
and 3).
As can be seen from figure 3, one band appears at 2325-2330 cm-1
(this band appears in
a few samples of amphibole in the present paper, namely actinolite [2-1], pargasite [3-1; 3-
2] and riebeckite [4-2]), and one band at ~2437 cm-1
(in the [4-2] riebeckite sample). The
appearance of these bands is due to the substitution of K or Na with H3O+ (K, Na ↔ H3O
+)
and K or Na with NH4+ (K, Na ↔ NH4
+); these spectral bands were also identified at
potassium micas. Petry et al. (2006) assign the band at 2330 cm-1
to N2. Koltashev et al.

The Raman study of amphiboles
61
(2009) also assign this band (~2330 cm-1
) to the fundamental vibration of molecular
nitrogen N2.
Fig. 2 Schematic representation for characteristic frequencies of amphibole minerals between 200-
1200 cm-1 wavenumbers
Fig. 3 Schematic representation for characteristic frequencies of amphibole minerals between 2200-
3800 cm-1 wavenumbers
Analytical procedure and samples
The Raman spectra were obtained at room temperature with a Horiba Jobin-Yvon
RPA-HE 532 Raman Spectrograph with multichannel air cooled (-70°C) CCD detector,
using a wavenumber doubled frequency Nd-Yag laser (532 nm and 100 mW nominal
power).
The spectral resolution was 3 cm-1
, and the spectral range – between 210 and 3400
cm-1
. The Raman system includes a “Superhead” optic fibre Raman probe for non-contact
measurements, with an Olympus 50X LWD visible objective, NA = 0.50; WD = 10.6 mm.
The data acquisition was performed in 1 - 100 s (in most cases, an acquisition time
interval of 30-40 seconds was sufficient for identification), 20 – 100 aq, at a laser
magnification of 90 – 100% pw, in order to improve the signal-to-noise ratio. Spectra
manipulation consists in a basic data treatment, such as baseline adjustment and peak fitting
(Lorentz function); however, in order to ensure a better interpretation, some spectra are
raw.

Andrei Ionuț Apopei, Nicolae Buzgar
62
Tab. 1 Classification, sample no., origin and ideal chemical formula of the samples used in the present
study
aNumber of the sample used in the present study (figures); bSample number from the „Grigore
Cobălcescu” Mineralogy and Petrography Museum.
The samples used in the study are listed in table 1. In most cases, qualitative
identification of the amphibole species can be done easily on the basis of their characteristic
Raman modes. In recent years, however, most papers on the Raman study of amphiboles
contain chemical analyses. These additional analyses are very important for the Raman
spectroscopic study of solid solution series of the amphibole classification. Nevertheless,
Raman spectroscopy is a powerful tool for mineral characterization. The structure of these
amphiboles belongs to the C2/m space group. In the present paper, we describe the Raman
No.a Mineral Sample
no.b Origin Ideal chemistry
Mg-Fe-Mn-Li Amphiboles
A. Cummingtonite – Grunerite series
1-1 Grunerite 5848 Schneeberg, Tirol, Austria □Fe2+7Si8O22(OH)2
Calcic Amphiboles
B. Tremolite – Ferro-actinolite series
2-1 Actinolite 5834 St. Gothard, Switzerland
Ca2(Mg,Fe2+)5Si8O22(OH)2
2-2 Actinolite 5835 Tirol, Austria
2-3 Actinolite 5836 Zemmtal, Tirol, Austria
2-4 Nephrite 2098 Jordanów, Poland
2-5 Nephrite 5844 China
2-6 Smaragdite 5852 Răsinari, Romania
2-7 Uralite 5841 Brosso, Piedmont, Italy
2-8 Tremolite 5825 Campolongo, Switzerland □Ca2Mg5Si8O22(OH)2
2-9 Tremolite 5865 Voşlobeni, Romania
C. Pargasite – Hastingsite series
3-1 Pargasite 5851 Edenville, New York, USA NaCa2(Mg4Al)(Si6Al2)O22(OH)2
3-2 Pargasite 3985 Czech Republic
Sodic Amphiboles
D. Glaucophane – Riebeckite series
4-1 Glaucophane 1623 Sesia, West Alps, Italy □Na2(Mg3Al2)Si8O22(OH)2
4-2 Riebeckite 5807 Iacobdeal, Dobrogea □Na2(Fe2+3Fe3+
2)Si8O22(OH)2

The Raman study of amphiboles
63
spectra obtained from 14 amphibole samples and prove that Raman spectroscopy can be
used for the identification of the amphibole minerals without chemical analysis being
performed prior to Raman study. These samples belong to the collection of the “Grigore
Cobălcescu” Mineralogy and Petrography Museum of the “Alexandru Ioan Cuza”
University of Iasi.
Results and discussion
Given the fact that the samples were analyzed without having their chemical analysis,
some spectra of this work are compared with reference Raman spectra (from the RRUFF
website project; Downs, 2006), performed on the samples that were confirmed by X-ray
diffraction and chemical analysis.
All spectra are between 210 and 1200 cm-1
, given the fact that, with some exceptions,
there are no spectral lines beyond this limit (1200 cm-1
). These exceptions are included
above principal spectral lines (see figs. 5, 7, 8 and 10b). Also, some spectral
intervals/regions are enlarged/compressed ( sign/ sign) over these spectral lines (at the
top of figures – not all, however) for a better understanding/investigation of the low/high-
intensity peaks.
A. Cumingtonite – Grunerite series
1.1 Grunerite
Prior to any discussions about the Raman spectra of the grunerite samples, it should be
noted that in some papers the term grunerite is replaced with amosite (the commercial name
for grunerite).
A comparison between the Raman spectra of the grunerite sample (1-1) and two
reference samples of grunerite from the RRUFF project (R070186 and R060062) is
illustrated in figure 4.
For each grunerite spectrum, the peaks are listed in table 2 with all assignments. These
spectra are very similar – the ν1 (A1g) symmetric stretching (νs) of the Si-Ob-Si bridge is
shown in all spectra (fig. 4) around 660 cm-1
, more exactly at 665 cm-1
for the grunerite
samples of this work and at 663 cm-1
and 661 cm-1
, respectively, for reference spectra
(R070186 and R060062). In the 745-790 cm-1
spectral region, three bands are shown in the
grunerite sample, with the main band at 761 cm-1
(the other two peaks are located at 747
cm-1
and 785 cm-1
, respectively). These bands are assigned to the symmetric stretching (νs)
of the O-Si-O linkage. Also, the 909 cm-1
spectral band is assigned to the νs of the O-Si-O
linkage (all of these bands assigned to the νs of the O-Si-O linkage have a low intensity).
The bands situated in the upper region of the 950 cm-1
wavenumber (950-1200 cm-1
)
are assigned to antisymmetric (or asymmetric) stretching vibration (νas). More specifically,
the band at 971 cm-1
may be assigned to the νas of the O-Si-O linkage. We consider that the
peak at 999 cm-1
is part of the 1027 cm-1
vibration (due to the fact that, in the reference
spectra of Bard et al. (1997) and Rinaudo et al. (2004), this peak is slightly overlapped), which, together with the peak at 1098 cm
-1, is assigned to νas Si-Ob-Si bridges. The
overlapping of the 999 cm-1
peak can be seen even in figure 4 (in the case of R060062).

Andrei Ionuț Apopei, Nicolae Buzgar
64
Fig. 4 Raman spectra of the grunerite sample (1-1), in comparison with grunerite reference (R070186
and R060062) spectra from RRUFF project

The Raman study of amphiboles
65
Tab. 2 Wavenumbers and assignments for the Raman spectra of the grunerite sample (1-1) in the 210-
1200 cm-1 spectral region
Present study (cm-1) Reference (cm-1)
Tentative
assignment Sample no. Downs (2006)
Rinaudo et al.
(2004)
5848 (1-1) R070186 amosite fibres
- - 155, 182 ?
242, 289 242, 288, 316 252, 289, 307 lattice mode
315 ? Fe2+-O
363 352, 369 348, 368 Fe2+-O
415 410 400, 423
533, 566 512, 531, 564 507, 528 deformation modes of Si4O11
665 663 659 νs of the Si-Ob-Si (ν1)
747, 761,
785
750, 764,
779, 788 -
νs of the O-Si-O
909 907 904
971 970 968 νas of the O-Si-O
999, 1027 999, 1024 1020 νas of the Si-Ob-Si
1098 1099 1093
? – questionable interpretation; νs – symmetric stretching; νas – asymmetric stretching.
Below 625 cm-1
, the wavenumber exhibits three main bands and other bands that can
be considered part of the main bands. As we have discussed in the Raman modes of
amphiboles part and according to Rinaudo et al. (2004), the bands between 210-300 cm-1
are assigned to the O-H-O groups or, if we respect the assignments of Shurvell et al. (2001)
and Huang (2003), this region may be ascribed to lattice vibration – both are questionable,
but the second assignment is more plausible. Therefore, the peaks at 242 cm-1
and 289 cm-1
belong to the O-H-O group or the lattice mode. Not the same thing can be said about the
peak at 315 cm-1
(despite the first impression), because it is more of a part of M-O
vibrations. However, this assignment (of the 315 cm-1
peak) remains controversial if we
look at the spectra compared with the 1-1 grunerite sample; another reason is the very low
intensity.
If we take a look at the ideal chemical formula of grunerite (□Fe2+
7Si8O22(OH)2), just
Fe2+
is involved in the external vibrations (M2+
-O); consequently, the bands situated at 363
cm-1
and 415 cm-1
may be ascribed to the Fe2+
-O vibration mode.
The spectrum of grunerite also presents two bands at 533 cm-1
and 566 cm-1
,
respectively, which may be assigned to the deformation mode of the silicate chain.
According to Kloprogge et al. (2001), the libration and translation modes of OH- lie in the
same spectral region, are probably overlapped or the very low intensity peak at 566 cm-1
may be assigned to the librational or translational mode of the OH- group – this assignment
is, however, uncertain.

Andrei Ionuț Apopei, Nicolae Buzgar
66
B. Tremolite – Ferro-actinolite series
2.1 Actinolite
Actinolite is a solid solution composition between the endmembers of the following
series: tremolite and ferro-actinolite. According to Jovanovski et al. (2009), solutions with
more than 90 Mg are called tremolite, between 90-50% - actinolite, and less than 50% -
ferro-actinolite. We will discuss the Raman spectra of these minerals separately.
The Raman spectra of these samples are shown in figure 5. All of these spectra are very
similar, with small differences in the case of very low intensity peaks. In the 650-1200 cm-1
spectral region (the region of internal vibrations), five intense bands appear significantly at
670, 745, 928, 1027 and 1056 cm-1
for the 2-1 sample; 670, 744, 929, 1027 and 1059 cm-1
for 2-2, and 670, 744, 928, 1027, 1059 cm-1
for the 2-3 actinolite sample. In the case of the
928 cm-1
peak (for 2-2 samples this peak exhibits at 929 cm-1
), one or two overlapped bands
with a very low intensity appear. These peaks (891, 956 cm-1
; 892, 949 cm-1
and 946 cm-1
,
respectively – see fig. 5) are part of O-Si-O symmetric stretching vibrations (νs). As
discussed in the case of grunerite, the bands at 1027, 1056 cm-1
(2-1); 1027, 1059 cm-1
(2-2)
and 1027, 1059 cm-1
(2-3), respectively, may be ascribed to the antisymmetric stretching
vibrations (νas) of the Si-Ob-Si bridges; the bands at 744-745 cm-1
are debatable, given the
fact that 750 cm-1
is the limit of νs O-Si-O and νs Si-Ob-Si vibrations. The most intense
bands, which appear at 670 cm-1
(in all samples), are ascribed to the ν1 (Ag) symmetric
stretching modes (νs) of the Si-Ob-Si bridges.
In the 210-650 cm-1
region, the assignments of the M-O vibrations is problematic; three
bands appear in the 300-450 cm-1
spectral region (for 2-1: 369, 389 and 413 cm-1
; 2-2: 369,
392 and 415 cm-1
, and 369, 392 and 415 cm-1
for 2-3), where we would expect to see
vibrations produced by Ca, Mg and/or Fe2+
cations [Ca2(Mg,Fe2+
)5Si8O22(OH)2 – ideal
chemistry for actinolite]. Nevertheless, the bands between 210-300 cm-1
are assigned to
lattice modes (for 2-1: 221, 247 and 292 cm-1
, for 2-2: 226, 247, 294 cm-1
, and 222 and 292
cm-1
for 2-3).
The following bands: 479, 523 and 573 cm-1
(for 2-1); 482, 522 and 577 cm-1
(2-2), and
484, 522 and 581 cm-1
(2-3) correspond to the deformation modes of Si4O11, with the
observation that in this region there should be a librational and translational vibration of the
OH- group (probably 573, 577 and 581 cm
-1 bands; see fig. 5).
The Raman spectrum of the sample of actinolite (2-1) shows one peak at 2327 cm-1
;
this band may be assigned to the H3O+ vibration. This is due to a substitution between H3O
+
and a cation from the M sites.
2.2 Nephrite, Cr – actinolite (smaragdite) and uralite (var. of actinolite)
Figure 6 shows the Raman spectra of two samples of nephrite minerals, one sample of
smaragdite and, finally, one of uralite (with a spectrum of quartz, see further discussion).
All these samples are varieties of actinolite; in general, discussions regarding the vibrations
and assignments of samples of these varieties are the same with discussions regarding
actinolite.

The Raman study of amphiboles
67
Fig. 5 Raman spectra of three samples of actinolite 2-1, 2-2, 2-3
Andrei Ionuț Apopei, Nicolae Buzgar
68
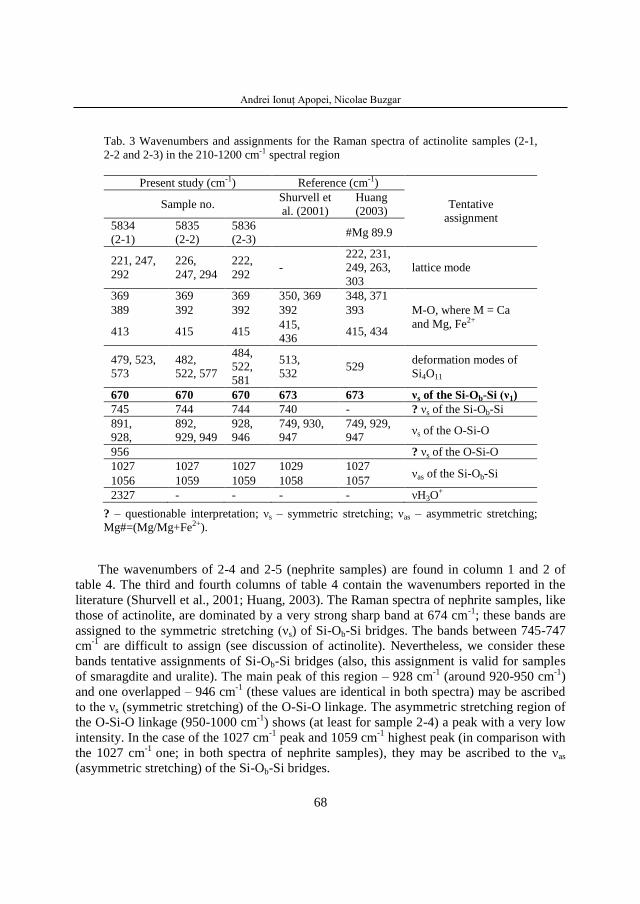
Tab. 3 Wavenumbers and assignments for the Raman spectra of actinolite samples (2-1,
2-2 and 2-3) in the 210-1200 cm-1 spectral region
Present study (cm-1) Reference (cm-1)
Tentative
assignment
Sample no. Shurvell et
al. (2001)
Huang
(2003)
5834
(2-1)
5835
(2-2)
5836
(2-3) #Mg 89.9
221, 247,
292
226,
247, 294
222,
292 -
222, 231,
249, 263,
303
lattice mode
369 369 369 350, 369 348, 371
M-O, where M = Ca
and Mg, Fe2+
389 392 392 392 393
413 415 415 415,
436 415, 434
479, 523,
573
482,
522, 577
484,
522,
581
513,
532 529
deformation modes of
Si4O11
670 670 670 673 673 νs of the Si-Ob-Si (ν1)
745 744 744 740 - ? νs of the Si-Ob-Si
891,
928,
892,
929, 949
928,
946
749, 930,
947
749, 929,
947 νs of the O-Si-O
956 ? νs of the O-Si-O
1027 1027 1027 1029 1027 νas of the Si-Ob-Si
1056 1059 1059 1058 1057
2327 - - - - νH3O+
? – questionable interpretation; νs – symmetric stretching; νas – asymmetric stretching;
Mg#=(Mg/Mg+Fe2+).
The wavenumbers of 2-4 and 2-5 (nephrite samples) are found in column 1 and 2 of
table 4. The third and fourth columns of table 4 contain the wavenumbers reported in the
literature (Shurvell et al., 2001; Huang, 2003). The Raman spectra of nephrite samples, like
those of actinolite, are dominated by a very strong sharp band at 674 cm-1
; these bands are
assigned to the symmetric stretching (νs) of Si-Ob-Si bridges. The bands between 745-747
cm-1
are difficult to assign (see discussion of actinolite). Nevertheless, we consider these
bands tentative assignments of Si-Ob-Si bridges (also, this assignment is valid for samples
of smaragdite and uralite). The main peak of this region – 928 cm-1
(around 920-950 cm-1
)
and one overlapped – 946 cm-1
(these values are identical in both spectra) may be ascribed
to the νs (symmetric stretching) of the O-Si-O linkage. The asymmetric stretching region of
the O-Si-O linkage (950-1000 cm-1
) shows (at least for sample 2-4) a peak with a very low
intensity. In the case of the 1027 cm-1
peak and 1059 cm-1
highest peak (in comparison with
the 1027 cm-1
one; in both spectra of nephrite samples), they may be ascribed to the νas
(asymmetric stretching) of the Si-Ob-Si bridges.
The Raman study of amphiboles
69
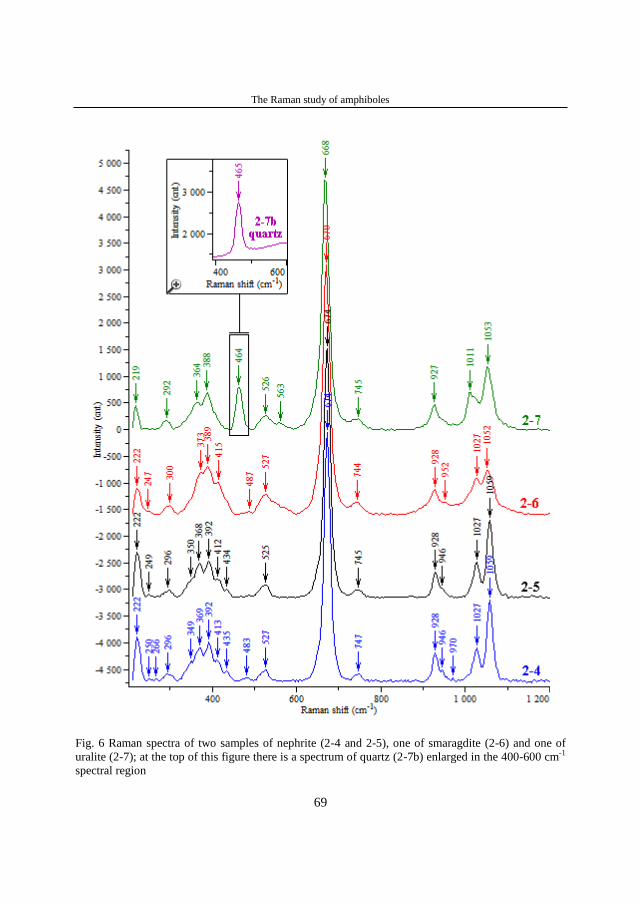
Fig. 6 Raman spectra of two samples of nephrite (2-4 and 2-5), one of smaragdite (2-6) and one of
uralite (2-7); at the top of this figure there is a spectrum of quartz (2-7b) enlarged in the 400-600 cm-1
spectral region

Andrei Ionuț Apopei, Nicolae Buzgar
70
Tab. 4 Wavenumbers and assignments for the Raman spectra of nephrite samples (2-4 and 2-5) in the
210-1200 cm-1 spectral region
Present study (cm-1) Reference (cm-1)
Tentative
assignment
Sample no. Shurvell et
al. (2001) Huang (2003)
2098
(2-4)
5844
(2-5)
#Mg 90
222, 250, 266,
296
222, 249,
296
225, 232,
249, 301
222, 230, 248,
286, 301 lattice mode
349 350 351 350
M-O, where M = Ca and Mg,
Fe2+
369 368 370 368
392 392 393 392
413 412 415 414
435 434 436 435
483, 527 525 516, 529 528 deformation modes of Si4O11
674 674 673 653, 673 νs of the Si-Ob-Si (ν1)
747 745 747 738, 748 ? νs of the Si-Ob-Si
928, 946 928, 946 868, 931,
947
929, 946 νs of the O-Si-O
970 - - - ? νas of the O-Si-O
1027, 1059 1027,
1059
1029, 1059 1028, 1057 νas of the Si-Ob-Si
- - 1114 -
- - 1140 -
? – questionable interpretation; νs – symmetric stretching; νas – asymmetric stretching;
Mg#=(Mg/Mg+Fe2+).
In the external vibration region, a group of five peaks (for 2-4: 349, 369, 392, 413, 435
cm-1
and for 2-5: 350, 368, 392, 412, 434 cm-1
) centred on a band at 392 cm-1
(in both
spectra of nephrite samples) are shown in the spectral domain assigned to M-O vibration.
Shurvell et al. (2001) state that these Raman bands are characteristic for nephrite, in
comparison with the jadeite mineral. The peaks between 210-300 cm-1
may be ascribed to
lattice modes. For 2-4, two bands, namely at 483 cm-1
(low intensity) and 527 cm-1
,
respectively, may be assigned to the deformation mode of the Si4O11 group. In another
sample of nephrite (2-5), only one peak appears, at 525 cm-1
, which is assigned to the same
deformation mode of the Si4O11 group.
The Raman spectrum of smaragdite (2-6) is slightly different from those recorded on
samples of actinolite (the same thing may be said about the Raman spectrum of the uralite
sample, but this will be discussed separately). The wavenumbers and assignments of
smaragdite and uralite samples (quartz included) are found in table 5 in comparison with
(2-2) actinolite, in order to emphasize small differences between them.

The Raman study of amphiboles
71
The intense band (ν1) of the smaragdite spectrum corresponds to the symmetric
stretching of Si-Ob-Si bridges at 670 cm-1
. The differences mentioned above consist in two
regions with slightly moved peaks, as follows: in the region of asymmetric stretching of Si-
Ob-Si (1000-1130 cm-1
), two peaks appear (1027 cm-1
and 1052 cm-1
), the second peak
being slightly shifted to the left in comparison with 2-2 (see figs. 5 and 6); the second
difference lies in the region of M-O vibrations, where the highest intensity peak is located
at 389 cm-1
. The other peaks are very similar to peaks observed in actinolite samples (see
table 5 for the assignments of all peaks).
The Raman spectrum of uralite is a special case, as one band at 464 cm-1
is from quartz.
It should be noted that the sample of uralite contains some crystals of quartz, this being the
reason of the presence of the 464 cm-1
band. The spectrum of the quartz sample is labelled
with 2-7b. As smaragdite spectrum, small differences appear in two regions, namely around
1010 cm-1
and in M-O region (see table 5). It should be pointed out that no Raman data
have been found in the literature for these minerals species (smaragdite and uralite).
In the case of nephrite samples, in Shurvell et al. (2001) there are two bands in the
spectrum of nephrite, at 1114 cm-1
and 1140 cm-1
, respectively, which are assigned to OH-
bending modes. In our samples (2-4 and 2-5), however, these bands do not appear (see fig.
6).
Tab. 5 Wavenumbers and assignments for the Raman spectra of smaragdite (2-6) and uralite
(2-7) samples, compared with an actinolite sample (2-2) in the 210-1200 cm-1 spectral region
Present study (cm-1)
Tentative
assignment
Sample no.
5852
(2-6)
5841
(2-7)
5835
(2-2)
222, 247, 300 219, 292 226, 247, 294 lattice mode
373 364 369
M-O, where M = Ca and Mg, Fe2+ 389 388 392
415 - 415
- 464 - from quartz
487, 527 526 482, 522, 577 deformation modes of Si4O11
670 668 670 νs of the Si-Ob-Si (ν1)
744 745 744 ? νs of the Si-Ob-Si
928, 952 927 892, 929, 949 νs of the O-Si-O
1027 1011 1027 νas of the Si-Ob-Si
1052 1053 1059
? – questionable interpretation; νs – symmetric stretching; νas – asymmetric stretching.
2.3 Tremolite
The vibrational assignments of the peaks are given in table 6, while the Raman spectra
for the tremolite samples are shown in figure 7. Above the tremolite spectra there is the
calcite spectrum (2-8b) obtained from the 2-8 sample. Both spectra of tremolite show the ν1

Andrei Ionuț Apopei, Nicolae Buzgar
72
symmetric stretching of the CO3 group at 1083 cm-1
; also, the 711 cm-1
peak is assigned to
the ν4 bending mode of the CO3 group (Buzgar and Apopei, 2009). The ν4 bending mode of
the CO3 group is present only in the 2-9 spectrum of the tremolite sample (with a very low
intensity). According to Buzgar et al. (2009), the 285 cm-1
band may be ascribed to the
vibration (translational vibration) between cation and oxygen (M-O) of the CO3 group
[T(Ca, CO3)]; this peak (285 cm-1
) is present in the same spectrum of tremolite (2-9) with
the v4 bending mode of the CO3 group. These characteristic bands of calcite (CaCO3) are
normal because our tremolite is associated with calcite (in carbonate rocks).
Tab. 6 Wavenumbers and assignments for the Raman spectra of tremolite samples (2-8 and 2-9) in the
210-1200 cm-1 spectral region and values of the calcite spectrum (2-8b) obtained from the 2-8 sample
Present study (cm-1) Reference (cm-1)
Tentative
assignment
Sample no. Huang
(2003)
Shurvell et al.
(2001)
5825
(2-8)
5865
(2-9)
#Mg 93.8
225, 252,
290
226, 250 221, 230,
250, 288
304 lattice mode
- 285 - - T(Ca, CO3) (calcite inclusions)
351 349 332, 343 352
M-O, where M = Ca and Mg
372 369 368 374
394 394 393 395
415 415 415 417
438 438 434 437
483, 528 484, 525 523 516, 530 deformation modes of Si4O11
- 583 - - ? HO- libration/translation
674 674 653, 672 656, 675 νs of the Si-Ob-Si (ν1)
- 711 - - ν4 bending mode of the CO3
group (calcite inclusions)
746 747 739, 749 747 ? νs of the Si-Ob-Si
928, 949 928, 945 929, 945 932, 947 νs of the O-Si-O
1028,
1060
1027,
1059
1027,
1057 1031, 1061 νas of the Si-Ob-Si
1087 1083 - - ν1 symmetric stretching of the
CO3 group (calcite inclusions)
- - - 1112
? – questionable interpretation; νs – symmetric stretching; νas – asymmetric stretching;
Mg#=(Mg/Mg+Fe2+).
The discussion regarding the 1112 cm-1
peak, which appears in the reference spectrum
of tremolite samples (Shurvell et al., 2001), is similar to that of nephrite samples. In the
spectrum of Shurvell et al. (2001), however, this peak (extremely weak intensity) appears
and is assigned to the OH- bending modes.

The Raman study of amphiboles
73
Fig. 7 Raman spectra of two samples of tremolite (2-8 and 2-9) and calcite (2-8b)

Andrei Ionuț Apopei, Nicolae Buzgar
74
Both spectra of tremolite samples contain a very strong band at 674 cm-1
, which lies in
the same spectral region as the symmetric stretching (νs) of the Si-Ob-Si bridges. The 746
cm-1
(2-8) and 747 cm-1
(2-9) bands are debatable (see previous discussions); nevertheless,
we assign these bands to the νs of the Si-Ob-Si bridges. In the region between 900 and 1100
cm-1
, two symmetric stretching modes of the O-Si-O linkage and two asymmetric stretching
vibration modes of the Si-Ob-Si bridges are exhibited.
The lower wavenumber region (<600 cm-1
) is characteristic for the deformation mode
of the silicate network with OH- libration/translation (in most cases - overlapped) modes
(in the case of the 2-9 sample of tremolite, the 583 cm-1
band is probably a vibration of the
OH- libration/translation mode), metal-oxygen modes (300-450 cm
-1) and lattice modes
(210-300 cm-1
).
Bearing in mind the Raman spectra of actinolite samples (fig. 5) and the Raman spectra
of tremolite, it is very important to note the differences between these members of this
series. Without chemical analysis, the OH- spectral region and/or IR spectra of these
minerals, it is very difficult to differentiate between members of a series. Nevertheless,
some differences between tremolite and actinolite spectra could be observed. As has been
discussed above, the presence of CaCO3 in tremolite spectra may be one reason for the
difference between actinolite and tremolite spectra. Another explanation for the similarity
between the spectra of actinolite and tremolite lies in the fact that the #Mg content of both
minerals is somewhere up to of 90%.
C. Pargasite – Hastingsite series
3.1 Pargasite
A comparison between the Raman spectra of the pargasite samples (3-1, 3-2 and 3-2)
and one reference sample of pargasite from the RRUFF project (R060632) is illustrated in
figure 8. As has been discussed in the Analytical procedure section, some spectra are raw
for a better interpretation, and these particular spectra are some of them. Also, the Raman
spectra of these samples were very difficult to obtain. Table 7 summarizes the entire
discussion about the assignments of the peaks.
The νs (ν1) of the Si-Ob-Si lies at 663, 667, 663 and 665 cm-1
(for 3-1; 3-2; 3-2 and
R060632, respectively). In our spectra, a very broad band exhibits at 758-766 cm-1
, while in
the case of R060632 two bands appear at 750 and 801 cm-1
. If we look carefully at the
highest peak (assigned to ν1), on the right it exhibits a one shoulder band (around 692-695
cm-1
), which appears in all spectra of pargasite and may be due to 2Al in the T site. The
high intensity of the band at ~760 cm-1
can also be explained by 2Al in the T site or the
orientation of the laser beam on the pargasite samples.
The interpretation of the spectra in the 850-1200 cm-1
is generally based on the bands
dominantly arising from the vibrations of symmetric stretching and asymmetric stretching
(Si4O11), as follows: the bands between 885 and 928 cm-1
may be ascribed to the symmetric
stretching (νs) of the O-Si-O linkage; the peaks observed in the 950-1000 cm-1
region are
attributed to the asymmetric stretching (νas) of the O-Si-O linkage. The highest-frequency
bands, observed in 1000-1100 cm-1
spectral region, may be ascribed to the asymmetric
stretching vibration of the Si-Ob-Si bridges.

The Raman study of amphiboles
75
All three spectra of pargasite samples (3-1 and 3-2; 3-2) present one peak at ~2330
cm-1
, which may be assigned to H3O+ vibrations; the appearance of this band is due to the
substitution of K or Na with H3O+ (K, Na ↔ H3O
+).
Fig. 8 Raman spectra of two samples of pargasite (3-1 and 3-2; 3-2) and reference (R060632)
spectra from RRUFF project
A. Glaucophane – Riebeckite series
4.1 Glaucophane
A comparison between the Raman spectra of glaucophane samples (three recorded
spectra at different parameters) and one reference spectrum from the RRUFF project is

Andrei Ionuț Apopei, Nicolae Buzgar
76
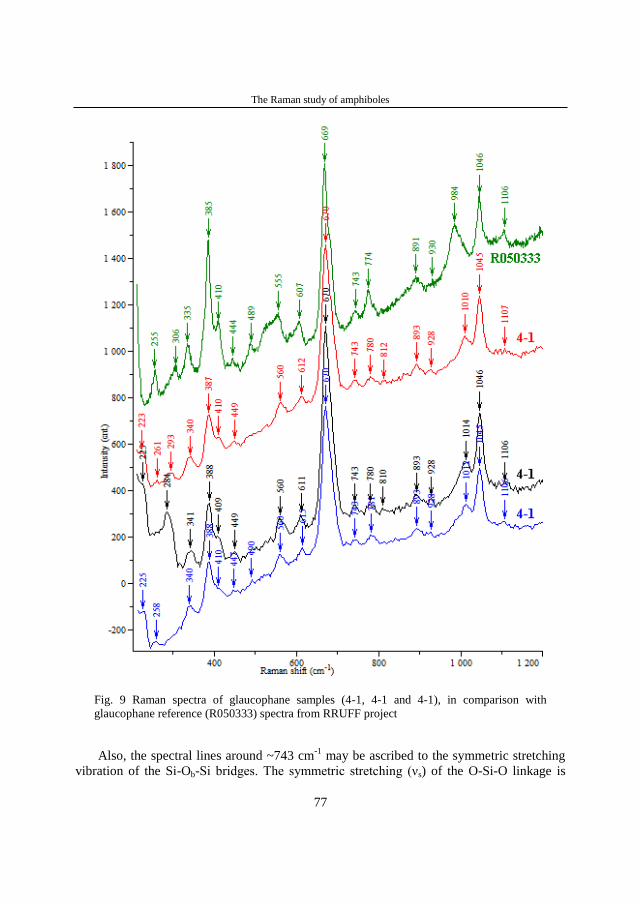
illustrated in figure 9. The minor discrepancies concern the shifted peaks in our spectra at:
1011 cm-1
, 1014 cm-1
and 1010 cm-1
, respectively (for 4-1, 4-1 and 4-1), while in the
glaucophane reference spectrum the band exhibits at 984 cm-1
. The interpretation of the
spectra in the 200-650 cm-1
region is generally based on the bands dominantly arising from
the vibrations of the M-O (cation-oxygen; between 300 and 450 cm-1
) and bending
vibrations of the main Si4O11 structural unit (between 450 and 615 cm-1
).
Tab. 7 Wavenumbers and assignments for the Raman spectra of pargasite samples (3-1; 3-2
and 3-2) in the 210-1200 cm-1 spectral region
Present study (cm-1) Reference (cm-1)
Tentative
assignment
Sample no. Huang
(2003)
Downs
(2006)
5851
(3-1)
3985
(3-2)
3985
(3-2)
#Mg
38.5 R060632
226, 292 226 226,
286 200, 271 229, 276 lattice mode
322 327 326 - 324
M-O, where M = Ca and
Mg
371 358 362 364 385
415 415 414,
423
420 430
475, 514,
536, 547,
581
474,
510,
540,
581
475,
510,
532,
566
549 519, 548 deformation modes of
Si4O11
663 667 663 669 665 νs of the Si-Ob-Si (ν1)
758 766 762 719, 772 750 ? νs of the Si-Ob-Si
885, 910,
924
889,
903,
914,
928
888 920 907 νs of the O-Si-O
956, 971 971 968 995 - νas of the O-Si-O
1009,
1045,
1095
1013,
1041 1009
1020,
1094 1017 νas of the Si-Ob-Si
2327 2330 2330 - - νH3O+
? – questionable interpretation; νs – symmetric stretching; νas – asymmetric stretching;
Mg#=(Mg/Mg+Fe2+).
The dominant peak (385-388 cm-1
) of the lower spectral region is characteristic to
glaucophane Raman spectra; if we look carefully, this band has a shoulder peak at 409-410
cm-1
(in our spectra and in reference R050333). The bands below 300 cm-1
may be assigned
to the lattice mode. The highest-frequency peak, observed in the Raman spectra of
glaucophane samples at 670 cm-1
, also present in the reference spectra at 669 cm-1
, is
attributed to the symmetric stretching (ν1) of the Si-Ob-Si bridges.
The Raman study of amphiboles
77
Fig. 9 Raman spectra of glaucophane samples (4-1, 4-1 and 4-1), in comparison with
glaucophane reference (R050333) spectra from RRUFF project
Also, the spectral lines around ~743 cm-1
may be ascribed to the symmetric stretching
vibration of the Si-Ob-Si bridges. The symmetric stretching (νs) of the O-Si-O linkage is

Andrei Ionuț Apopei, Nicolae Buzgar
78
represented by the bands between 774 cm-1
and 895 cm-1
. As is visible in figure 9, one band
exhibits in all spectra around ~928 cm-1
, and may be assigned to the asymmetric stretching
vibration of the O-Si-O group. The bands at 985 and 984 cm-1
are shifted with ~30 cm-1
, in
comparison with our spectra; the assignment of these bands remains questionable because
they are probably the νas of the Si-Ob-Si, although the peak value is in the νas region of the
O-Si-O linkage. The wavenumbers between 1000 and 1110 cm-1
are assigned to the νas
(asymmetric stretching) of the Si-Ob-Si bridges. The 1100 region of the 4-1 spectra presents
a very low signal-to-noise ratio.
Tab. 8 Wavenumbers and assignments for the Raman spectra of glaucophane samples
(4-1; 4-1 and 4-1) in the 210-1200 cm-1 spectral region
Present study (cm-1) Reference (cm-1)
Tentative
assignment
Sample no. Huang
(2003)
Downs
(2006)
1623
(4-1)
1623
(4-1)
1623
(4-1) #Mg 52 R050333
225, 258 225,
284
223,
261,
293
209,
227, 254
255
lattice mode
340 341 340 336 306, 335
M-O 388, 410 388,
409
387,
410
386, 405 385, 410
447 449 449 445 444
490, 560,
615
560,
611
560,
612
520,
558, 609
489, 555,
607
deformation modes of
Si4O11
670 670 670 668 669 νs of the Si-Ob-Si (ν1)
743 743 743 682, 740 743 νs of the Si-Ob-Si
781, 893 780,
810,
893
780,
812,
893
776,
789, 895
774, 891
νs of the O-Si-O
928 928 928 930 νas of the O-Si-O
- - - 985 984 ?
1011,
1045,
1106
1014,
1046,
1106
1010,
1045,
1107
1008,
1045,
1104
1046,
1106 νas of the Si-Ob-Si
? – questionable interpretation; νs – symmetric stretching; νas – asymmetric stretching;
Mg#=(Mg/Mg+Fe2+).
4.2 Riebeckite
Given the fact that these spectra are very complex and that their quality is not very
good (low signal-to-noise ratio), we divided the spectra (figs. 10a and 10b) into two major
regions: 210-480 cm-1
and 480-1200 cm-1
. Apart from this, these spectra were difficult to
obtain due to high fluorescence. Riebeckite has a variety called crocidolite that is

The Raman study of amphiboles
79
asbestiform in habit, while riebeckite is a non-fibrous sample. According to Bard et al.
(1997), a comparison between the spectra of fibrous (crocidolite) and non-fibrous
(riebeckite) samples shows no evident change in the 200-1200 cm-1
spectral region; only
the OH- stretching region presents differences in the number of peaks, but our spectral
domain is limited to 3400 cm-1
.
Fig. 10a Raman spectra (between 210-480 cm-1) of riebeckite samples (4-2, 4-2 and
4-2), in comparison with riebeckite reference (R060028) spectra from RRUFF project
Figure 10a shows in the upper part a compressed spectral region from the same
frequency range (210-480 cm-1
). In this compressed spectra, we can understand the
vibrations ascribed to lattice modes, M-O and some of the Si4O11 deformation modes more
easily. These spectra that were compressed are important in understanding the similar bands
between all spectra presented in figure 10a, and in clearing any doubt regarding what bands
are caused by a low signal-to-noise ratio.
The bands between 213 and 298 cm-1
(with some peaks shifted or some bands absent)
may be assigned to lattice vibrations. In the reference spectrum (R060028), one band

Andrei Ionuț Apopei, Nicolae Buzgar
80
appears at 329 cm-1
, while in our spectra (4-2, 4-2 and 4-2) this spectral line does not
appear. In the 350-480 cm-1
spectral region, some peaks appear at different frequencies;
however, these bands cannot be compared because the low signal-to-noise ratio influences
the interpretation of these peaks.
Fig. 10b Raman spectra (between 480-1200 cm-1) of riebeckite samples (4-2, 4-2 and 4-2), in
comparison with riebeckite reference (R060028) spectra from RRUFF project
The assignment of the bands in the 480-1200 cm-1
region follows the previous
assignment of the peaks. The assignment of the spectral lines is summarized in table 9.
The bands between 503 and 615 cm-1
may be ascribed to Si4O11 deformation modes.
These peaks (~537 and ~576 cm-1
doublet peaks), at these values, are a factor in the
discrimination between a riebeckite/crocidolite sample and other samples discussed above.
The reference spectrum presents a band at 615 cm-1
; in our spectra, this peak may
appear, but the low signal-to-noise ratio of this region (605-625 cm-1
) and the very low
intensity of this peak prevents us from developing a discussion on this spectral band. The ν1
symmetric stretching (νs) of the Si-Ob-Si bridge is shown in all spectra (fig. 10b) around

The Raman study of amphiboles
81
665 cm-1
, more exactly at 665 cm-1
for the riebeckite samples of this work and at 663 cm-1
for the reference spectrum (R060028). As has been discussed above, the spectral bands
located at 967 cm-1
in all spectra (fig. 10b) may be ascribed to the symmetric stretching (νs)
of the O-Si-O group. The νas (asymmetric stretching) vibrations of the same group (O-Si-O)
lie at 967 cm-1
(for all spectra).
Tab. 9 Wavenumbers and assignments for the Raman spectra of riebeckite samples (4-2;
4-2 and 4-2) in the 210-1200 cm-1 spectral region
Present study (cm-1) Reference (cm-1)
Tentative
assignment
Sample no. Downs (2006)
5807
(4-2)
5807
(4-2)
5807
(4-2) R060028
246, 269,
284
245,
270,
285
219,
243,
268,
285
213, 243, 271,
287, 293, 298 lattice mode
- - - 329
M-O
359 362 362 358
404 411,
443
435 429
474 472 461,
475
472
537, 574 503,
540,
576
539,
576
537, 576, ?615 deformation modes of
Si4O11
665 665 665 663 νs of the Si-Ob-Si (ν1)
881 878 881 882 νs of the O-Si-O
967 967 967 967 νas of the O-Si-O
1042,
1082
1041,
1080
1042,
1076,
1087
1042, 1083
νas of the Si-Ob-Si
2330 2330 - - νH3O+
2433 - - - νNH4+
? – questionable interpretation; νs – symmetric stretching; νas – asymmetric
stretching; Mg#=(Mg/Mg+Fe2+).
The following bands: 1042 and 1082 cm-1
(for 4-2); 1041 and 1080 cm-1
(4-2); 1042,
1076 and 1087 cm-1
(4-2); 1042 and 1083 cm-1
(R060028) correspond to the asymmetric
stretching (νas) vibration modes of the Si-Ob-Si groups.
The Raman spectrum of the riebeckite samples (4-2 and 4-2) shows one peak at
2330 cm-1
and one band at 2433 cm-1
(in the case of the 4-2 spectrum); the first band (2330
cm-1
) may be assigned to H3O+ vibration, and the second (2433 cm
-1) – to NH4
+. This is due
to a substitution of cations from the M sites by H3O+ or NH4
+.

Andrei Ionuț Apopei, Nicolae Buzgar
82
Conclusions
The comparison of our spectra and those from the literature proved that they are in
good agreement.
The results discussed above illustrate the ability of Raman spectroscopy to discriminate
among amphiboles without IR spectroscopy, OH- spectral region or chemical analysis for
amphibole samples. However, due to high fluorescence, low signal-to-noise ratio and
impurities, there are some uncertainties. Further studies on minerals and their fibrous form,
that are lacking in this work, are needed to make a more correct and complete
discrimination between members of some amphibole series.
Some spectra display a considerable diversity of spectral bands involving substitutions
of cations in the M sites by H3O+ and NH4
+ and the presence of calcite and quartz
inclusions.
Raman data for actinolite varieties – uralite and smaragdite samples, have not, to the
best of our knowledge, been published yet.
It should be noted that some spectra show questionable interpretations for reasons such
as: substitutions, impurities, high fluorescence, laser focus or acquisition time.
The characteristic bands for each mineral can be shifted for the same reasons listed
above (especially substitutions, e.g. Si ↔ Al in T sites).
Acknowledgements
This work was supported by CNCSIS – UEFISCSU, project number PNII – IDEI code
2119/2008.
References
Andrut, M., Gottschalk, M., Melzer, S., Najorka, J. 2000. Lattice vibrational modes in synthetic tremolite-Sr-
tremolite and tremolite-richterite solid solutions. Phys. Chem. Minerals, 27, 301-309. Bard, T., Yarwood, J., Tylee, B. 1997. Asbestos fiber identification by Raman microspectroscopy. J. Raman
Spectrosc., 28, 803-809.
Buzgar, N., Apopei, A. I. 2009. The Raman study of certain carbonates. Anal. Şt. Univ. „Al. I. Cuza” Iaşi, Geologie, LV/2, 98-112.
Buzgar, N., Apopei, A. I., Buzatu, A. 2009. Romanian Database of Raman Spectroscopy (http://rdrs.uaic.ro).
Downs, R. T. 2006. The RRUFF Project: an integrated study of the chemistry, crystallography, Raman and infrared spectroscopy of minerals. Program and Abstracts of the 19th General Meeting of the International
Mineralogical Association in Kobe, Japan. O03-13.
Fornero, E., Allegrina, M., Rinaudo, C., Mazziotti-Tagliani, S., Gianfagna, A. 2008. Micro-Raman spectroscopy applied on oriented crystals of fluoro-edenite amphibole. Periodico di Mineralogia, 77, 2, 5-14.
Huang, E. 2003. Raman Spectroscopic Study of Amphiboles. PhD thesis in Chinese.
Jovanovski, G., Makreski, P., Kaitner, B., Boev, B. 2009. Silicate Minerals from Macedonia. Complementary Use of Vibrational Spectroscopy and X-ray Powder Diffraction for Identification and Detection Purposes.
Croatica chemica acta, 82 (2), 363-386.
Kieffer, S. W. 1980. Thermodynamics and Lattice Vibrations of Minerals: Application to Chain and Sheet Silicates and Orthosilicate. Reviews of Geophysics and Space Physics, 18, 4, 862-886.

The Raman study of amphiboles
83
Kloprogge, J. T., Visser, D., Ruan, H., Frost, R. L. 2001. Infrared and Raman spectroscopy of holmquistite, Li2(Mg,Fe2+)3(Al,Fe3+)2(Si,Al)8O22(OH)2. Journal of Materials Science Letters, 20, 1497-1499.
Koltashev, V. V., Kryukova, E. B., Plotnichenko, V. G., Kadik, A. A. 2009. Use of IR and Raman spectroscopy
for studying the forms of dissolution of H, N and O volatiles in glasses - melting products of the early earth’s mantle. Vestnik Otdelenia nauk o Zemle RAN, 27, 1.
Makreski, P., Jovanovski, G., Gajović, A. 2006. Minerals from Macedonia: XVII. Vibrational spectra of some
common appearing amphiboles. Vibrational Spectroscopy, 40, 98-109. Nakamoto, K. 2009. Infrared and Raman Spectra of Inorganic and Coordination Compounds. Part A: Theory and
Applications in Inorganic Chemistry. (Sixth edition). John Wiley and Sons, New Jersey.
Petry, R., Mastalerz, R., Zahn, S., Mayerhöfer, TG., Völksch, G., Viereck-Götte, L., Kreher-Hartmann, B., Holz,
L., Lankers, M., Popp J. 2006. Asbestos Mineral Analysis by UV Raman and Energy-Dispersive X-ray
Spectroscopy. Physical Chemistry, 7, 414-420.
Rinaudo, C., Belluso, E., Gastaldi, D. 2004. Assessment of the use of Raman spectroscopy for the determination of amphibole asbestos. Mineralogical Magazine 68 (3): 443-453.
Rinaudo, C., Gastaldi, D., Belluso, E., Capella, S. 2005. Application of Raman Spectroscopy on asbestos fibre
identification. N. Jb. Miner. Abh., 182/1, 31-36. Shurvell, H. F., Rintoul, L., Fredericks, P. M. 2001. Infrared and Raman spectra of jade and jade minerals. Internet
Journal of Vibrational Spectroscopy, (www.ijvs.com) 5, 5, 4.
Su, W., Zhang, M., Redfern, S. A. T., Gao, J., Klemd, R. 2009. OH in zoned amphiboles of eclogite from the western Tianshan, NW-China. International Journal of Earth Sciences, 98, 1299-1309.
Wang, A., Dhamelincourt, P., Turrell, G. 1988a. Raman Microspectroscopic Study of the Cation Distribution in
Amphibole. Appl. Spectrosc., 42, 1441-1450.
Received: April, 2010
Revised: May, 2010
Accepted: May, 2010