the range of concentrations of free acetone in the plasma ... · free acetone in plasma and breath...
TRANSCRIPT

The Range o f Concentrations of Free Acetone in the Plasma and Breath o f Diabetics and Some Observations on its Plasma/Breath RatioMorton F. Mason1, and Don Hutson2
Until comparatively recent times, little certain quantitative information has been available concerning the concentration of free acetone in the blood, plasma or serum of normal subjects or patients with ketosis. This is in part due to the very small amounts o f acetone normally present and to the spurious formation of acetone by decarboxylation of acetoacetic acid in various volumetric and photometric methodologies (6).
Breath-acetone concentrations were first reliably established in 1952 by a procedure employing mass spectrometry devised by Henderson, Karger and Wrenshall (5). The range of quantities found has since been confirmed by other techniques, e.g. measurement of infrared absorbance at 8.25 microns using long light-path cells (10) and various gas chromatographic methods (1, 2, 8, 9, 11, 12, 13). There are few data on the plasma (or serum)/breath ratio for acetone. The value most frequently quoted — 330 — appears to be based upon measurements by Widmark (14, 15) and Haggard, Greenberg and Turner (3) dealing with breath and whole blood at body temperature.
The purpose of the present study is to confirm the range of concentrations of acetone in the plasma (or serum) of normal subjects and in subjects with ketosis and to obtain values of the plasma-breath ratio of acetone at various temperatures, including 34.5°C. Such data, eventually, should permit estimation of the degree and frequency of concentrations of acetone in the breath of ambulatory subjects that might cause significantly false high values to be obtained for ethanol by use of breath-testing instruments employing oxidative reactions or infrared absorbance rather than gas chromatography.
METHODAcetone concentrations in plasma (and breath in some instances) were determined by use of the Diet Monitor, a gas chromatograph (GC) modified for use in diet control by Cal-Detect, Inc. (7). It is designed so that exhaled breath delivered into it has its temperature increased after which a 2ml volume is measured and passed into a GC column (Carbowax on Chromosorb P). A digital readout of a peak height is provided
1 Department o f Pathology and Institute o f Forensic Sciences, University of Texas Southwestern Medical School, Dallas, Texas, U.S.A.2Cal-Detect, Inc., 101 Nevin Avenue, Richmond, California, U.S.A.
533

534 M. F. Mason and D. Hutson
during an isolated portion of the subsequent time sequence which includes the retention time of acetone. Alternatively, a smaller sample (greater than 15 ml) may be injected into an auxiliary port of which 2 ml is taken for analysis. In any event, the relation of digital reading to the amount of acetone in the sample must be established by analysis o f some type of reference specimen, e.g. argon or some other gas containing a known percentage of acetone. A more direct procedure which we used consisted of introducing 3.0 pd of aqueous reference acetone solution into a slightly warmed 100 ml dry glass syringe. After adjustment of the volume to 100 ml, mixing was achieved by several passes into a second dry glass syringe, essentially as described by Harger and Turrell (4), followed by injection of a portion of the sample now at 25°C, into the auxiliary port of the instrument.
The arrangement employed is shown in Figure 1. Several readings for each of the reference solutions were obtained.
Figure 1 Device for preparing reference acetone vapor. The base o f the Ringstand Acts as a stop at the 100 ml Mark.
Plasma (or serum) acetone determinations were made by transferring 1 to 5 ml of plasma or serum into a 50 ml plastic disposable syringe. After adjustment of the space to a volume of 40 - 60 ml the tip was closed with a plug made from Tygon tubing. After shaking for about three minutes, the syringe was placed in a water bath, usually at 34.5°C, with occasional release of pressure so that headspace equilibrium was obtained. Most of the headspace was then injected directly from the syringe into the auxiliary port of the Diet Monitor with the sample being taken from the terminal portion. The digital reading was recorded. Reference plasma (or serum) specimens containing known amounts of added acetone were similarly analyzed. The digital readings (corrected for any blank) were used to calculate the concentrations of acetone in vapors from ‘unknowns’ and the free acetone present in the plasmas or sera. The plasma/breath ratio was calculated from the values for acetone in the reference plasmas in their headspace vapors for the temperature chosen.
Free Acetone in Plasma and Breath 535
Blood was drawn into 5 ml Vacutainer tubes from three groups of subjects. The first comprised subjects free from known metabolic disease having blood sugar concentrations within the normal range. The second consisted of ambulatory subjects reporting to the Diabetic Out-Patient Clinic of Parkland Memorial Hospital most of whom had considerably elevated blood sugars and a few having abnormal amounts of ketone in their urines. The third group were non-ambulatory hospitalized patients, having plasma sugar values in excess of 300 mg/100 ml. Most were in the fasting state.
A fourth group comprising subjects brought to the emergency room with severe acidosis, ketonuria, marked hyperglycemia and impending or frank exhibition of diabetic coma will be reported later.
It was found that dilute aqueous standards of acetone ranging from 0.1 to 10 g/liter were stable for at least two weeks at room temperature (25°C). Plasma or serum specimens stored in the refrigerator at +2 — 4°C were also similarly stable. Multiple (at least 3) headspace determinations could be made on a single 5 ml specimen of plasma at concentrations above 1.0 mg/100 ml without significant decline in the headspace vapor concentration.
The detection limit of the instrument is less than 0.1 jug/100 ml in the vapor sample analyzed. Any change in the digital reading per unit mass of acetone due to change in functioning of the column was checked by determining the reading obtained on a standard argon-acetone gas mixture contained in a small tank at 500 — 1000 psi or by analysis of the head-space of a reference plasma standard. The retention time of acetone was checked with a stopwatch each day. Any change requires recalibration of the digital reading.
Data bearing on precision of the headspace measurements are shown in Table I. The precision of measurement of the reference gas mixture is very much better. Calculation indicates that the average of duplicate or triplicate headspace measurements provides a sufficiently accurate estimate of the acetone for the present purposes.
TABLE I Standard Deviation and Coefficient o f Variationo f Measurements Obtained by the Syringe Headspace Technique
ACQUEOUS REFERENCE STANDARDS S.D. C.V.15.76 mg/100 m l .................................................................. 0.25 1.67.88 mg/100 m l .................................................................. 0.14 1.93.94 mg/100 m l .................................................................. 0.036 0.992 .3 6 m g /1 0 0 m l.................................................................. 0.06 2.47
BLOOD BANK PLASMA REFERENCE STANDARDS15.76 m g/100 ml (added a ce to n e )..................................... 0.29 2.67.88 mg/100 ml (added ace to n e)..................................... 0.44 2.74.73 mg/100 ml (added a ce to n e )..................................... 0.145 3.60.79 m g/100 ml (added ace to n e )..................................... 0.078 8.7
RESULTSPlasmas from 50 subjects believed to be free from metabolic disease contained free acetone ranging from none detectable in three instances to 0.28 mg/100 ml in the case

536 M. F. Mason and D. Hutson
of one subject. Forty-six were in the range of a trace, 0.02 - 0.04 (digital reading), to0.15 mg/100 ml with most of the values being less than 0.1 mg/100 ml. Subjects certain o f being a few hours postprandial gave the lowest figures. A plasma acetone of 1.0 mg/100 ml would cause the appearance of about 3 ng of acetone in deep lung air at 34.5°C. These values are in agreement with the findings of several investigators (2, 5,8-13).
The findings were further confirmed by a small series o f breath tests on normal subjects using the Diet-Monitor and the results obtained essentially agreed with those found previously with this instrument by Hutson (7).
Table II shows the results of 55 determinations on ambulatory subjects from the Diabetic Out-Patient Clinic with their corresponding plasma sugars and, in most instances, the qualitative ketone test of their urines using the “Multistix” procedure3. These data for acetone are summarized in Table IV. The two patients having plasma acetone concentrations in excess of 5 m g/100 ml were quite ill and were brought to their clinic appointment by others.TABLE II Acetone and Plasma Sugar Concentrations in the Plasmas o f
Ambulatory Diabetic SubjectsSubject’s
ChartNumber
Fasting Urine Plasma Plasma Ketone Acetone Sugar (quaL) m g/100 ml
m g/100 mla
Subject’sChart
NumberFasting Plasma Sugar
m g/100 mla
UrineKetone*5(qual.)
Plasma Acetone
m g/100 ml
182945 _ Neg 0.39 062478 249 Neg 0.10153910 — Neg 0.08 294342 379 Neg 0.38024042 — Neg 0.31 315281 126 Neg 0.15104833 - Neg 0.05 376754 185 Neg 0.80
- - Neg Neg 135705 335 Neg 0.66— — — 0.16 055421 188 Neg 0.11
412280 184 Neg 0.15 175759 320 Neg 0.37273076 354 Neg 0.32 290495 500 Small amount 5.7076006 193 Neg 0.08 354354 — Neg 1.1479423 — Small amount 0.10 061739 263 Neg 0.31429482 383 Neg 0.93 268172 130 Neg 0.09228910 — Neg 0.18 310236 174 Neg 0.12321865 161 Small amount 0.19 198673 167 Neg 0.76057180 425 — 0.26 040689 241 Neg 0.15059266 437 Neg 2.1 056141 268 Neg 0.59052644 185 Neg 0.29 035759 207 Neg 0.17338106 140 Neg 0.17 172018 310 - 0.15099289 250 Neg 0.50 254991 167 — 0.09206944 384 Neg 0.26 120774 305 — 0.18444006 207 Neg 0.10 233878 130 - 0.14417284 149 Neg 0.15 445138 149 Neg 0.09462431 173 Neg 0.11 157667 142 Neg 0.32322771 369 Neg 0.21 286846 361 Neg 0.15306109 294 Neg 0.25 308086 185 Neg 0.41063198 320 Neg 0.19 091798 143 Neg 0.06309679 312 Moderate amount 8.1 179917 203 Neg 0.23015775 208 Neg 0.13 249638 250 Neg 0.21403627 390 Neg 0.42aSMA 1260
Multistix” (Ames Division o f Miles Laboratories, Elkhart, Indiana)
3 Ames Division o f Miles Laboratories, Elkhart, Indiana.

Free Acetone in Plasma and Breath 537
TABLE III Plasma Acetone Concentrations o f Hospitalized Subjects with Plasma Sugar Values in Excess o f 300 mg/100 ml
Subject’schart
numberPlasma Sugar
mg/100 mlaPlasma Acetone
mg/100 mlSubject’s
chartnumber
Plasma Sugar
mg/100 mlaPlasma
Acetone m g/100 ml
374792 334 0.15 01784 372 0.39304884 312 0.67 351291 396 0.10311698 304 1.2 455116 400 2.5447502 355 0.07 305261 715 0.47460925 312 0.48 192328 388 0.13455116 388 0.43 482757 540 0.65438740 352 0.26 483601 336 (1 hour) 0.13455116 780 6.1 483601 386(2 hours) 0.06474935 396 0.55 483601 510(3 hours) 0.05311698 390 0.68 159949 362 1.0379403 382 0.31 „ 414063 374 0.09394905 390 0.88 478930 350 0.20141320 372 0.16aTechnicon AutoAnalyzer (ferricyanide reagent)
TABLE IV Distribution o f Subjects over the Various Plasma Acetone LevelsMg/100 ml 0-.1 .11-.5 .51-1 1.01-2 2.01-5 >5Ambulatorydiabetics3 11 36 4 1 1 2Hospitalizedpatients1* 5 11 6 1 1 1
aN = 55b\vith plasma sugar values in excess o f 300 mg/100 ml; N = 25
Tables III and IV show the results obtained on a series of hospitalized patients whose plasma sugar concentrations in the fasting state were found to be in excess of 300 mg/100 ml. Most were diabetics already receiving treatment.
These data, which will be greatly expanded, indicate that it is unlikely that a diabetic driving a motor vehicle will be found to have a plasma acetone greater than 5 m g/100 ml. The significance of the data in respect to breath analysis relates to the value of the plasma/breath ratio for acetone.
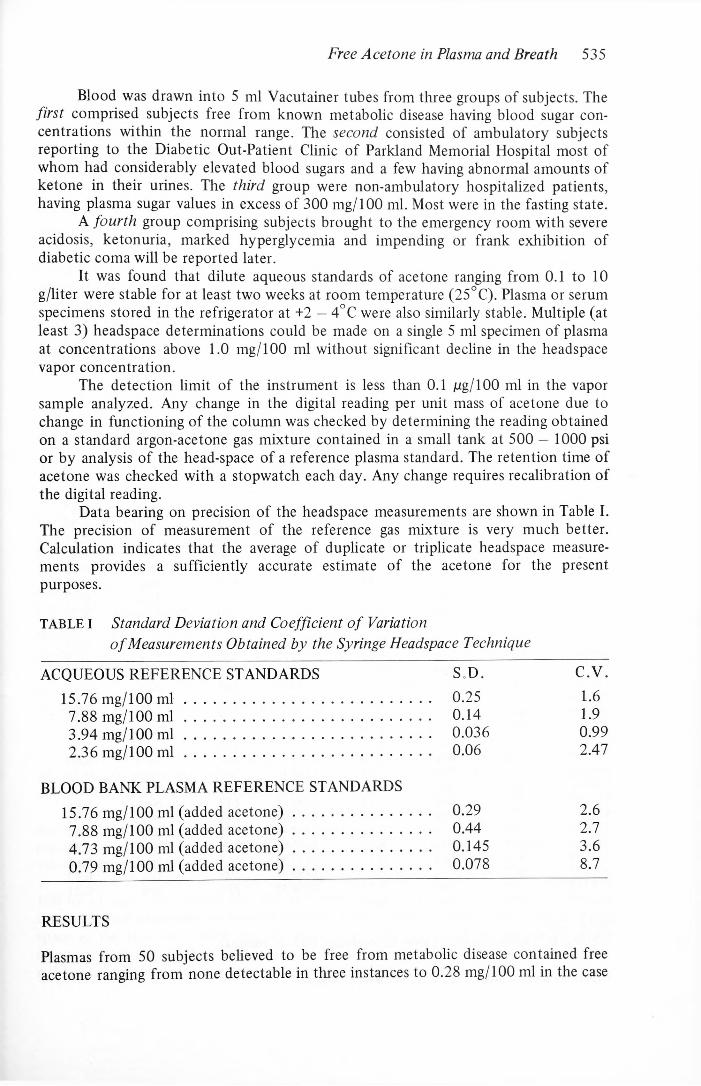
Figure 2 shows the relationship between digital reading and mg of acetone per 100 ml of vapor introduced into the instrument. The data employed include a correction of 1.0 ml estimated by a water calibration procedure as being largely due to dead space in the three-way valve and the head of the second syringe during mixing. The intercept near zero of the slopes from any two points suggests that the random error is not large. Each point is the average of at least five determinations.
538 M. F. Mason and D. Hutson
p g ACETONE/100 m l OF VAPOR ( 2 5 ° C) Figure 2 Digital reading vs Micrograms o f A ceton e/100 m l (25° C)
The temperature coefficient of the instrumental digital reading in the neighborhood of 34.5°C was found to be close to 3.5% of vapor concentration per degree.
For a small series of blood bank plasma reference standards the calculated values of the plasma breath ratios were 310, 305, 303, 316, 303, 316 at 34.5° with an average of 309.
Only a few ratios for ordinary plasmas have been determined. The values obtained were somewhat higher (347, 340, 345). As the value for plasma at 34.5°C calculated from whole blood at 37.5°C assuming a ratio of 330 is 329, it is presumed that the lower value for blood bank plasma is the consequence of the effect of additives on vapor pressure.
The values obtained however are sufficient to use in arriving at opinions regarding the concentration of plasma acetone which may interfere with various breath alcohol analyses.
SUMMARYBy use of headspace analysis employing the “Diet Monitor,” the normal range of plasma acetone concentrations in subjects free from metabolic disease has been confirmed. In 55 ambulatory diabetic subjects only two were found to have plasma acetone concentrations in excess of 5 m g/100 ml. In 25 specimens from hospitalized subjects having plasma sugar concentrations in excess of 300 m g/100 ml only one had an acetone concentration greater than 5.0 m g/100 ml. Preliminary estimates of the plasma/breath ratio for acetone on blood bank plasma gave an average value of 309 at 34.5°C. The value for normal plasma appears to be a little larger. The temperature coefficient for the vapor concentration of acetone in plasma in the neighborhood of 34.5°C is about 3.5% per degree of temperature change.

Free Acetone in Plasma and Breath 539
REFERENCES1. Brechner, V. L. and Bethune, R.W.M., Determination o f Acetone Concentration in Arterial
Blood by Vapor Phase Chromatography o f Alveolar Gas, Diabetes 14, 663 (1965).2. Freund, G., The Calorie Deficiency Hypothesis of Ketogenesis Tested in Man, Metabolism: Clinical and Experimental 14, 985 (1965).3. Haggard, H. W., Greenberg, L. A. and Turner, J. M. Journal Industrial Hygiene and Toxcology 26, 133 (1944).4. Harger, R. N. and Turrell, E. S. Use o f Dry Syringes for Preparing Specific Gas Mixtures, for Analysis o f Certain Gases and as Dry Gas Meters, Journal of Forensic Science 10, 239(1965).5. Henderson, J. J., Karger, B. A. and Wrenshall, G. A. Acetone in Breath, Diabetes 1, 188 (1952).6. Henry, R. J., Clinical Chemistry: Principles and Technics, Hoeber Medical Division, Harper and Row, New York, New York, 1964.7. Hutson, D., Brochure A. CalDetect Inc., 101 W. Nevin Ave., Richmond, Calif. 94801.8. Levey, S., Balchum, O. J. Medrano, V. and Jung, R. Studies of Metabolic Products in Expired Air II, Acetone. Journal of Laboratory and Clinical Medicine 63, 574 (1964).9. Rooth, G. and Ostenson, S. Acetone in Alveolar Air and the Control o f Diabetes, Lancet 2,
1102(1966).10. Stewart, R. D. and Boettner, E. A. Rapid Infrared Determination o f Acetone in Blood and
Exhaled Air of Diabetic Patients, Nature (London) 191, 1008 (1961).11. Stewart, R. D. and Boettner, E. A. Expired-Air Acetone in Diabetes Mellitus, New England Journal of Medicine 270, 1035 (1964).12. Sulway, M. J. and Malins, J. M. Acetone in Diabetic Ketoacidosis, Lancet 2, 736 (1970).13. Tassopoulos, C. N., Barnett D. and Fraser, T. R. Breath-Acetone and Blood Sugar Measure
ments in Diabetes, Lancet 2, 1282 (1969).14. Widmark, E.M.P. Studies on the Acetone Concentration in Blood, Urine and Alveolar Air.
III. The Elimination o f Acetone Through the Lungs, Biochemistry Journal 14, 379 (1920).15. Widmark, E.M.P. Studies on the Concentration o f Indifferent Narcotics in Blood and Tissue, Acta Medica Scandinavica 52, 84 (1920).
