the reality gap (2017) - biffa · reality gap (2017) report purpose: 1. ... •based on specific...
TRANSCRIPT
The Reality Gap (2017) Analyst Briefing - 18th October 2017
Agenda
Introductions
Key messages
The Reality Gap – market analysis
Conclusions
Biffa – looking to the future
Q&A session
2
Introductions
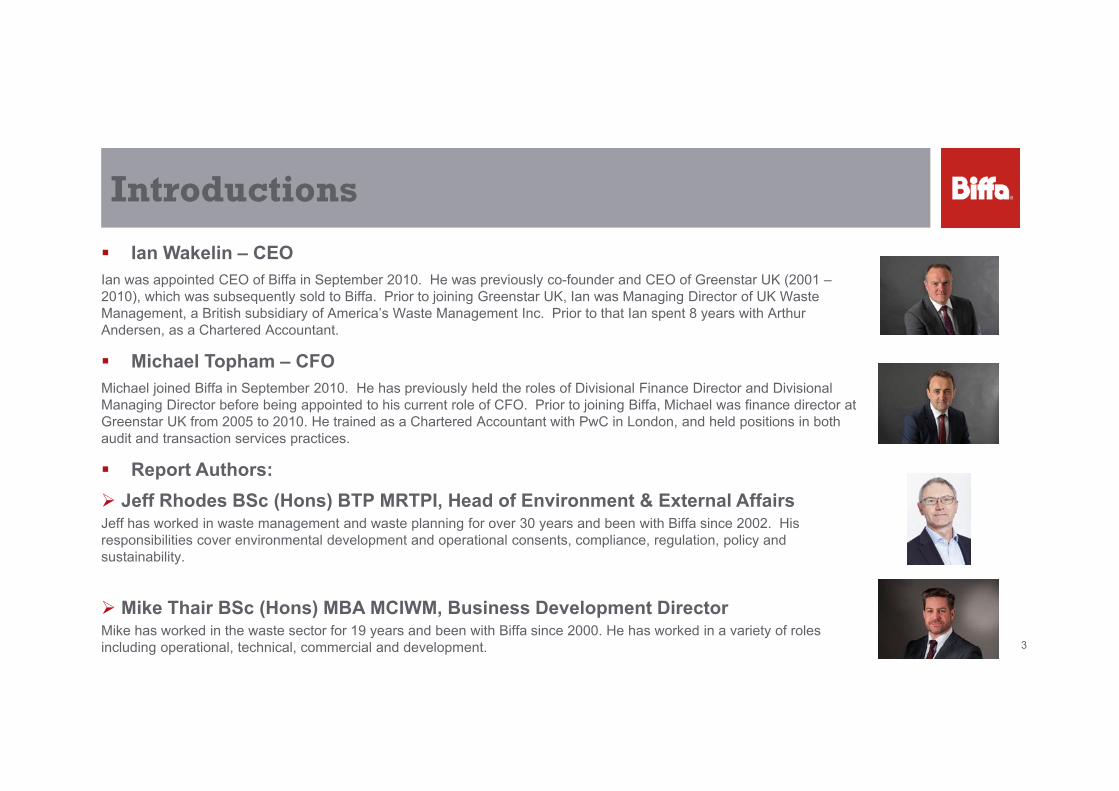
Ian Wakelin – CEOIan was appointed CEO of Biffa in September 2010. He was previously co-founder and CEO of Greenstar UK (2001 –2010), which was subsequently sold to Biffa. Prior to joining Greenstar UK, Ian was Managing Director of UK Waste Management, a British subsidiary of America’s Waste Management Inc. Prior to that Ian spent 8 years with Arthur Andersen, as a Chartered Accountant.
Michael Topham – CFOMichael joined Biffa in September 2010. He has previously held the roles of Divisional Finance Director and Divisional Managing Director before being appointed to his current role of CFO. Prior to joining Biffa, Michael was finance director atGreenstar UK from 2005 to 2010. He trained as a Chartered Accountant with PwC in London, and held positions in both audit and transaction services practices.
Report Authors: Jeff Rhodes BSc (Hons) BTP MRTPI, Head of Environment & External AffairsJeff has worked in waste management and waste planning for over 30 years and been with Biffa since 2002. His responsibilities cover environmental development and operational consents, compliance, regulation, policy and sustainability.
Mike Thair BSc (Hons) MBA MCIWM, Business Development DirectorMike has worked in the waste sector for 19 years and been with Biffa since 2000. He has worked in a variety of roles including operational, technical, commercial and development. 3
Reality Gap (2017) Report
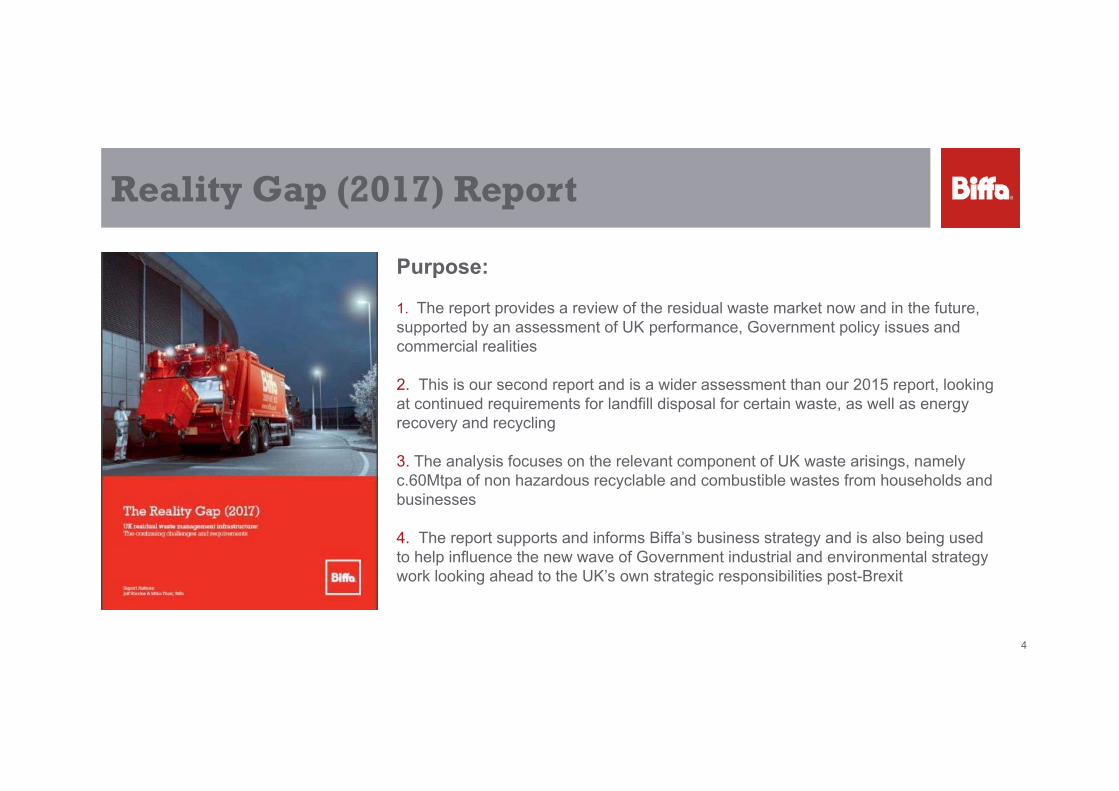
Purpose:
1. The report provides a review of the residual waste market now and in the future, supported by an assessment of UK performance, Government policy issues and commercial realities
2. This is our second report and is a wider assessment than our 2015 report, looking at continued requirements for landfill disposal for certain waste, as well as energy recovery and recycling
3. The analysis focuses on the relevant component of UK waste arisings, namely c.60Mtpa of non hazardous recyclable and combustible wastes from households and businesses
4. The report supports and informs Biffa’s business strategy and is also being used to help influence the new wave of Government industrial and environmental strategy work looking ahead to the UK’s own strategic responsibilities post-Brexit
4
Reality Gap (2017) – Key Findings
1.The UK produced 209Mt of waste in 2016. Over half of this is construction and demolition waste. Our analysis focuses on c. 60Mtpa of non hazardous recyclable and combustible waste produced by households and businesses
2.The UK has seen substantial growth in recycling over the last decade but this has now slowed and will only grow marginally without substantial intervention (environmental and/or fiscal policy)
3.There is a persistent and substantial shortfall in UK Energy From Waste (“EfW”) capacity (6Mt by 2030)
4.Landfill has a fundamental and continuing role to play in waste policy, with more waste than capacity by 2030
5.The need for new infrastructure represents an investment opportunity of >£4bn1 over the next 10 years
51Management Assessment
Market Analysis
Mike Thair
Waste production
Recycling
Infrastructure
Treatment gap
Landfill capacity
2030
6
Waste Production – Forecasting Methodology
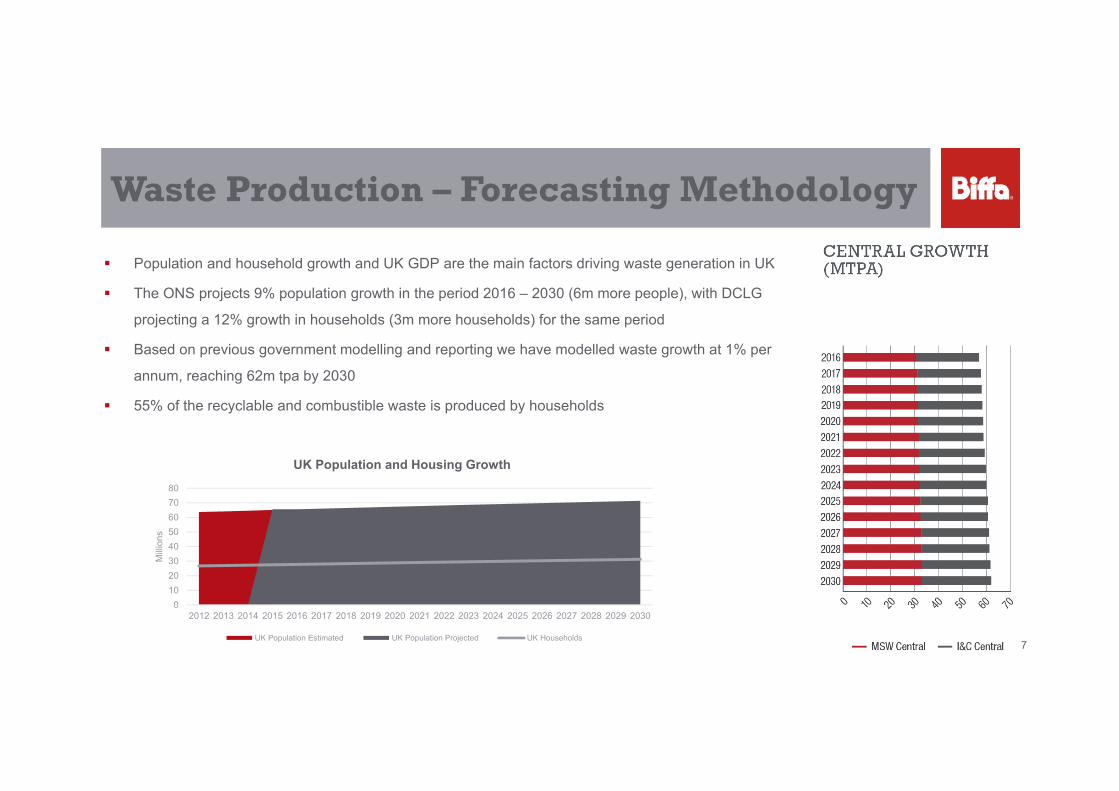
Population and household growth and UK GDP are the main factors driving waste generation in UK
The ONS projects 9% population growth in the period 2016 – 2030 (6m more people), with DCLG
projecting a 12% growth in households (3m more households) for the same period
Based on previous government modelling and reporting we have modelled waste growth at 1% per
annum, reaching 62m tpa by 2030
55% of the recyclable and combustible waste is produced by households
01020304050607080
2012 2013 2014 2015 2016 2017 2018 2019 2020 2021 2022 2023 2024 2025 2026 2027 2028 2029 2030
Milli
ons
UK Population and Housing Growth
UK Population Estimated UK Population Projected UK Households7
UK’s Recycling Performance
MSW (Household) Recycling
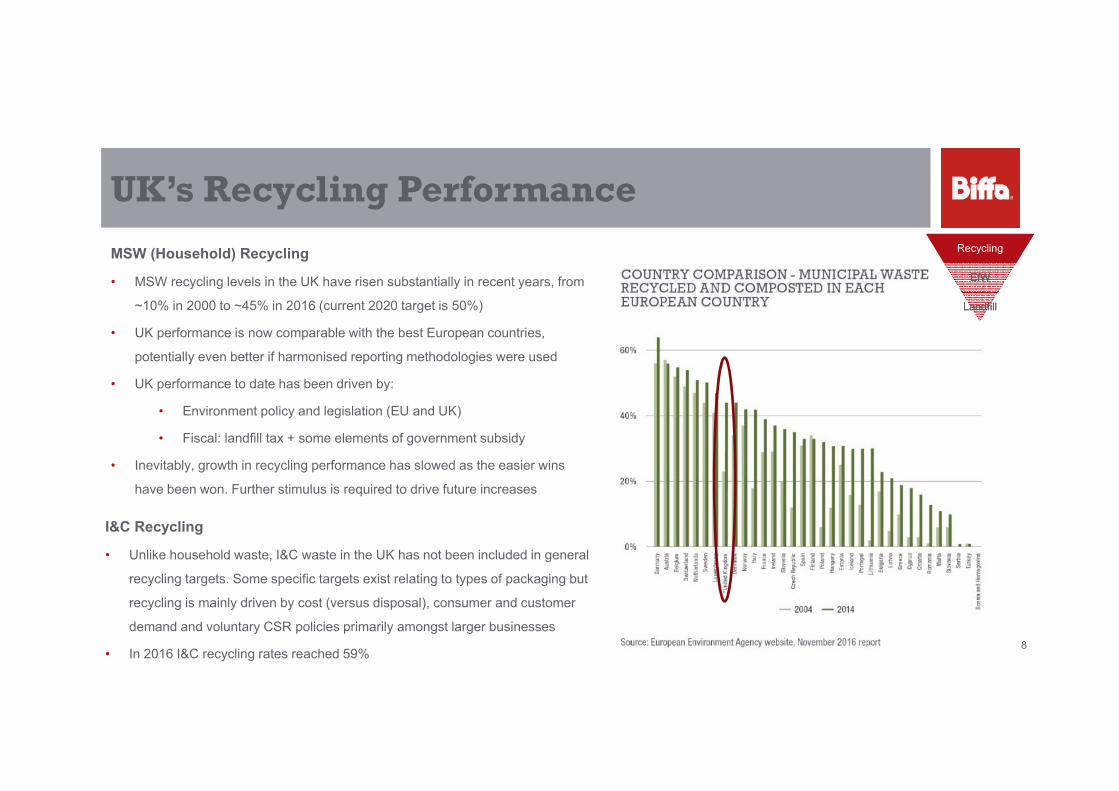
• MSW recycling levels in the UK have risen substantially in recent years, from
~10% in 2000 to ~45% in 2016 (current 2020 target is 50%)
• UK performance is now comparable with the best European countries,
potentially even better if harmonised reporting methodologies were used
• UK performance to date has been driven by:
• Environment policy and legislation (EU and UK)
• Fiscal: landfill tax + some elements of government subsidy
• Inevitably, growth in recycling performance has slowed as the easier wins
have been won. Further stimulus is required to drive future increases
I&C Recycling
• Unlike household waste, I&C waste in the UK has not been included in general
recycling targets. Some specific targets exist relating to types of packaging but
recycling is mainly driven by cost (versus disposal), consumer and customer
demand and voluntary CSR policies primarily amongst larger businesses
• In 2016 I&C recycling rates reached 59%8
RecyclingRecycling
EfWEfW
LandfillLandfill
Recycling Projections
MSW (Household) Recycling
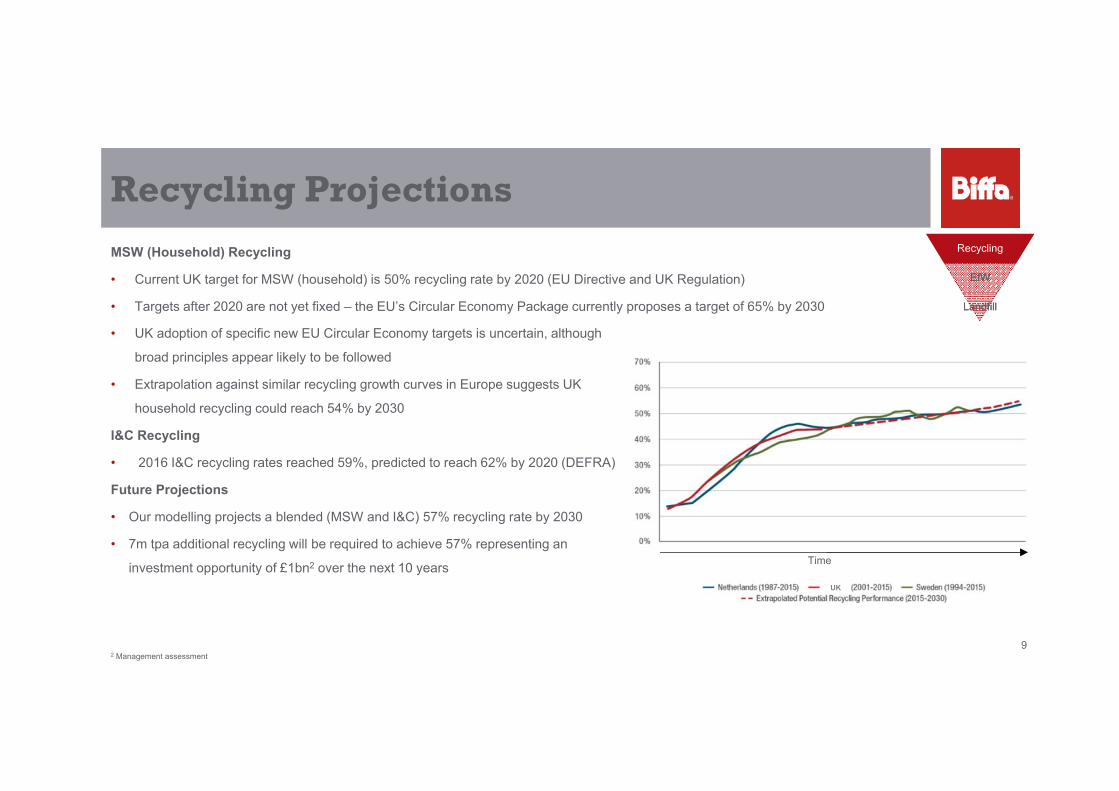
• Current UK target for MSW (household) is 50% recycling rate by 2020 (EU Directive and UK Regulation)
• Targets after 2020 are not yet fixed – the EU’s Circular Economy Package currently proposes a target of 65% by 2030
• UK adoption of specific new EU Circular Economy targets is uncertain, although
broad principles appear likely to be followed
• Extrapolation against similar recycling growth curves in Europe suggests UK
household recycling could reach 54% by 2030
I&C Recycling
• 2016 I&C recycling rates reached 59%, predicted to reach 62% by 2020 (DEFRA)
Future Projections
• Our modelling projects a blended (MSW and I&C) 57% recycling rate by 2030
• 7m tpa additional recycling will be required to achieve 57% representing an
investment opportunity of £1bn2 over the next 10 years
RecyclingRecycling
EfWEfW
LandfillLandfill
Time
2 Management assessment9
UK
Energy from Waste (EfW)
Analysis
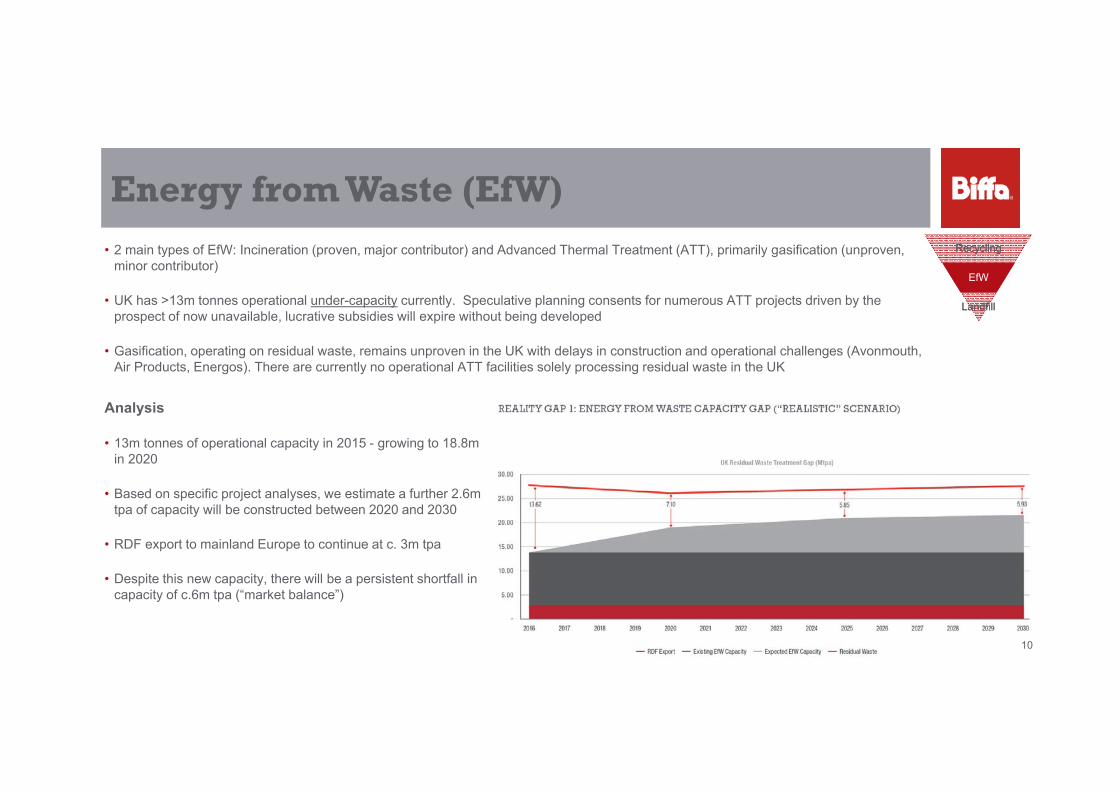
• 13m tonnes of operational capacity in 2015 - growing to 18.8m in 2020
• Based on specific project analyses, we estimate a further 2.6m tpa of capacity will be constructed between 2020 and 2030
• RDF export to mainland Europe to continue at c. 3m tpa
• Despite this new capacity, there will be a persistent shortfall in capacity of c.6m tpa (“market balance”)
• 2 main types of EfW: Incineration (proven, major contributor) and Advanced Thermal Treatment (ATT), primarily gasification (unproven, minor contributor)
• UK has >13m tonnes operational under-capacity currently. Speculative planning consents for numerous ATT projects driven by the prospect of now unavailable, lucrative subsidies will expire without being developed
• Gasification, operating on residual waste, remains unproven in the UK with delays in construction and operational challenges (Avonmouth, Air Products, Energos). There are currently no operational ATT facilities solely processing residual waste in the UK
RecyclingRecycling
EfWEfW
LandfillLandfill
10
Future EfW
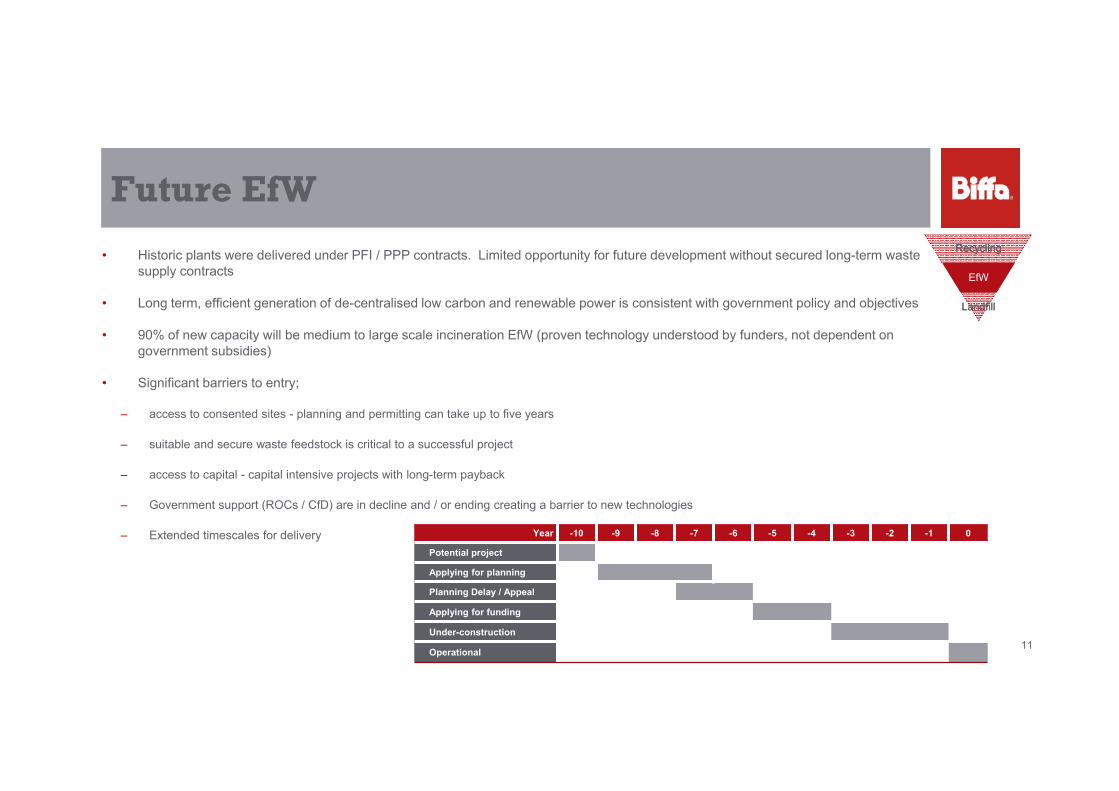
• Historic plants were delivered under PFI / PPP contracts. Limited opportunity for future development without secured long-term waste supply contracts
• Long term, efficient generation of de-centralised low carbon and renewable power is consistent with government policy and objectives
• 90% of new capacity will be medium to large scale incineration EfW (proven technology understood by funders, not dependent on government subsidies)
• Significant barriers to entry;
– access to consented sites - planning and permitting can take up to five years
– suitable and secure waste feedstock is critical to a successful project
– access to capital - capital intensive projects with long-term payback
– Government support (ROCs / CfD) are in decline and / or ending creating a barrier to new technologies
– Extended timescales for delivery Year -10 -9 -8 -7 -6 -5 -4 -3 -2 -1 0
Potential project
Applying for planning
Planning Delay / Appeal
Applying for funding
Under-construction
Operational
RecyclingRecycling
EfWEfW
LandfillLandfill
11
Landfill Capacity
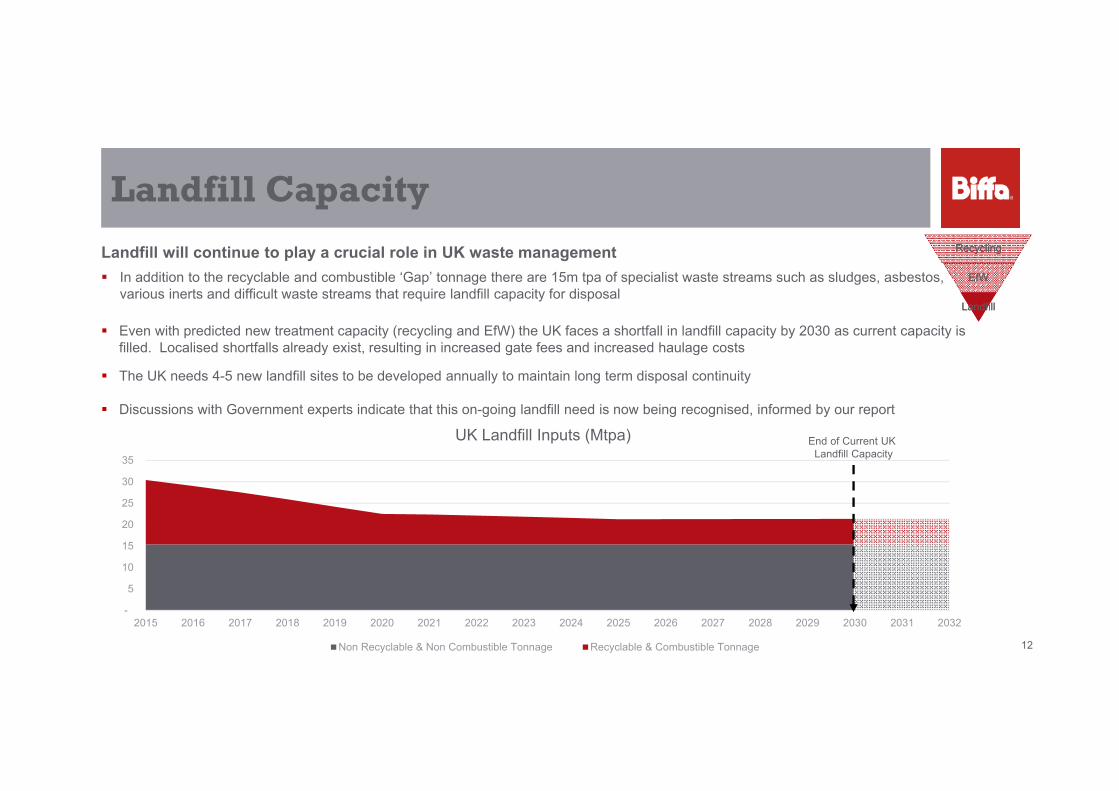
Landfill will continue to play a crucial role in UK waste management In addition to the recyclable and combustible ‘Gap’ tonnage there are 15m tpa of specialist waste streams such as sludges, asbestos,
various inerts and difficult waste streams that require landfill capacity for disposal
Even with predicted new treatment capacity (recycling and EfW) the UK faces a shortfall in landfill capacity by 2030 as current capacity is filled. Localised shortfalls already exist, resulting in increased gate fees and increased haulage costs
The UK needs 4-5 new landfill sites to be developed annually to maintain long term disposal continuity
Discussions with Government experts indicate that this on-going landfill need is now being recognised, informed by our report
-
5
10
15
20
25
30
35
2015 2016 2017 2018 2019 2020 2021 2022 2023 2024 2025 2026 2027 2028 2029 2030 2031 2032
UK Landfill Inputs (Mtpa)
Non Recyclable & Non Combustible Tonnage Recyclable & Combustible Tonnage
End of Current UK Landfill Capacity
RecyclingRecycling
EfWEfW
LandfillLandfill
12
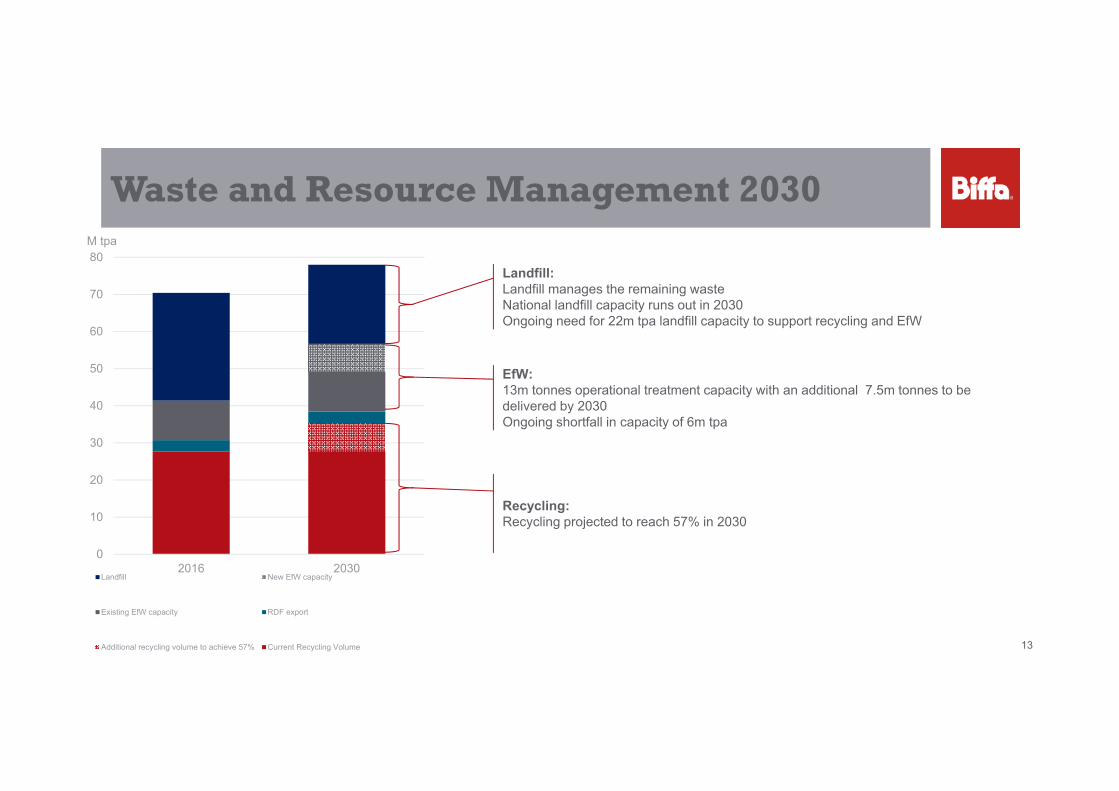
0
10
20
30
40
50
60
70
80
2016 2030
M tpa
Landfill New EfW capacity
Existing EfW capacity RDF export
Additional recycling volume to achieve 57% Current Recycling Volume
Waste and Resource Management 2030
Landfill:Landfill manages the remaining wasteNational landfill capacity runs out in 2030Ongoing need for 22m tpa landfill capacity to support recycling and EfW
EfW:13m tonnes operational treatment capacity with an additional 7.5m tonnes to be delivered by 2030Ongoing shortfall in capacity of 6m tpa
Recycling:Recycling projected to reach 57% in 2030
13
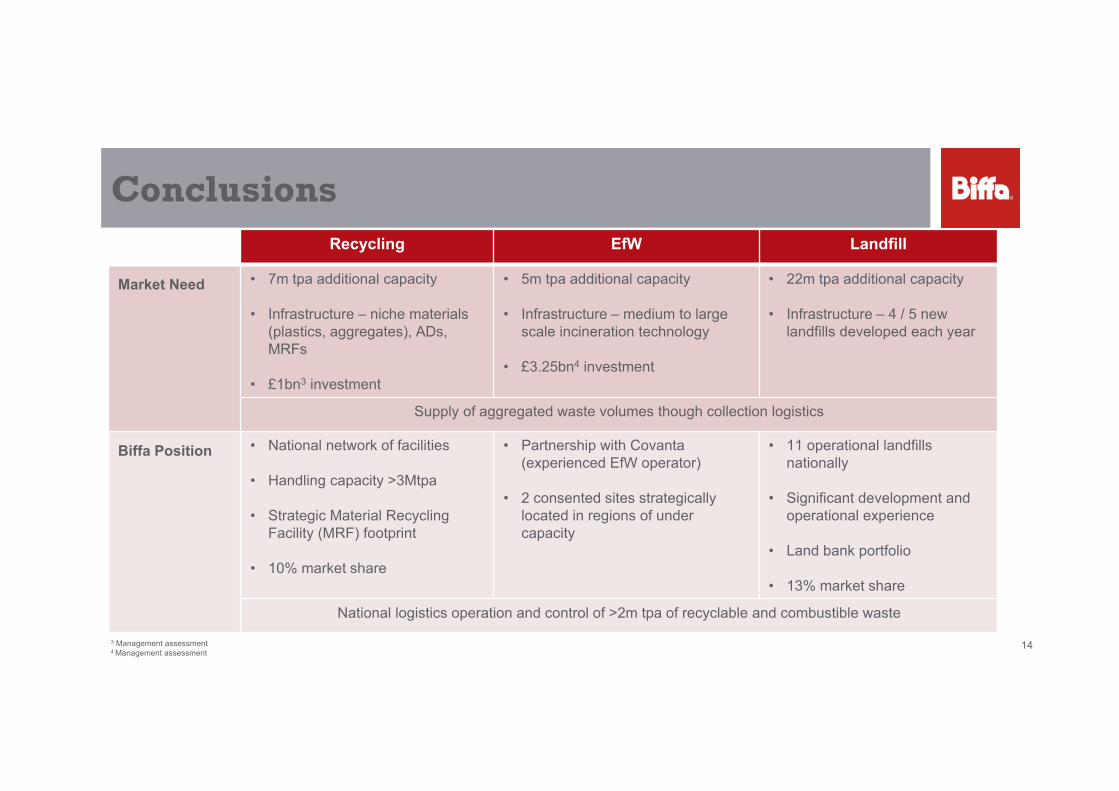
ConclusionsRecycling EfW Landfill
Market Need • 7m tpa additional capacity
• Infrastructure – niche materials (plastics, aggregates), ADs, MRFs
• £1bn3 investment
• 5m tpa additional capacity
• Infrastructure – medium to large scale incineration technology
• £3.25bn4 investment
• 22m tpa additional capacity
• Infrastructure – 4 / 5 new landfills developed each year
Supply of aggregated waste volumes though collection logistics
Biffa Position • National network of facilities
• Handling capacity >3Mtpa
• Strategic Material Recycling Facility (MRF) footprint
• 10% market share
• Partnership with Covanta (experienced EfW operator)
• 2 consented sites strategically located in regions of under capacity
• 11 operational landfills nationally
• Significant development and operational experience
• Land bank portfolio
• 13% market share
National logistics operation and control of >2m tpa of recyclable and combustible waste
143 Management assessment4 Management assessment
www.biffa.co.ukwww.biffa.co.uk 15
Q&A