the recent development and performance of ethical ... · 2westminster business school, university...
TRANSCRIPT
WestminsterResearchhttp://www.westminster.ac.uk/westminsterresearch
The recent development and performance of ethical investments
Gillet, Philippe and Salaber-Ayton, Julie
This is an Accepted Manuscript of a book chapter published by Routledge in the
Routledge Handbook of Social and Sustainable Finance on 7th July 2016. Further
details are available online: https://www.routledge.com/Routledge-Handbook-of-Social-
and-Sustainab...
The WestminsterResearch online digital archive at the University of Westminster aims to make the
research output of the University available to a wider audience. Copyright and Moral Rights remain
with the authors and/or copyright owners.
Whilst further distribution of specific materials from within this archive is forbidden, you may freely
distribute the URL of WestminsterResearch: ((http://westminsterresearch.wmin.ac.uk/).
In case of abuse or copyright appearing without permission e-mail [email protected]
1
THE RECENT DEVELOPMENT AND PERFORMANCE OF ETHICAL
INVESTMENTS
Philippe Gillet1 and Julie Salaber-Ayton2
1RITM, Paris-Sud University, Paris, France
2Westminster Business School, University of Westminster, London, United Kingdom
Abstract
In this chapter, we assess the recent development and performance of ethical investments
around the world. Ethical investments include both socially responsible investments (following
Environmental, Social and Governance criteria) and faith-based investments (following
religious principles). After presenting the development of each type of funds in a historical
context, we analyse their ethical screening process, highlighting similarities and differences
across funds and regions. This leads us to investigate their characteristics in terms of return
and risk, and finally evaluate their historical performance using various risk-adjusted
performance measures on a small sample of US funds. Hence we are able to not only compare
the performance of each fund with each other and with traditional investments, but also assess
their relative resilience to the 2007-08 financial crisis.
Introduction
The development of faith-based funds and socially responsible funds challenges modern
portfolio theory as some investors move away from the risk-return paradigm by constraining
their portfolios to “ethical” investments. This type of investment attempts to balance the regard
for morality of a firm’s activities and the regard for return on investment. Such ethical investors
will shun companies whose behaviours they condemn, or focus on companies that represent
values in which they believe. Hence, in addition to maximizing return and/or minimizing risk,
they integrate non-pecuniary preferences in their investment decisions (Gillet 2009). Ethical
investments include a wide range of mutual funds, unit trusts and equity indices that can be
classified into socially responsible investment (following so-called Environmental, Social and
Governance criteria) and faith-based investment (following for instance Christian or Islamic
principles). Socially responsible and Islamic funds have grown considerably in the last 20
years, both in volume and value (Hoepner et al. 2011, Renneboog et al. 2012). On one side, the
characteristics and performance of socially responsible funds and indices has been subject to
2
many empirical studies which offer conflicting evidence (Leite and Cortez 2014, Renneboog
et al. 2008). On the other side, the Islamic financial system survived the 2007-08 financial
crisis, and several reasons might explain the resistance of Islamic funds, e.g. the fact that they
comply with Islamic moral and ethical standards or that they exclude equities from the
traditional financial sector (Jouini and Pastré 2009).
Since ethical funds differ from traditional funds in terms of diversification and systematic risk,
it is important to assess their risk-adjusted long-term performance relative to other forms of
investments. This chapter proposes to investigate the recent development and performance of
ethical investment funds around the world by answering the following questions: What exactly
are these extra-financial criteria? Are they similar across all types of ethical investments? Are
they similar across regions and countries? Have they evolved over time? What is the impact of
such constraint on investment risk and return? Do ethical funds represent a good investment
opportunity in times of crisis?
Background
Ethical investment has largely evolved from its premises back in the 17th century, when the
Quakers refused to profit from the weapons and slaves trade as they settled in North America.
The founder of Methodism John Wesley stated that people should not engage in sinful trade or
profit from exploiting others. Later, the Methodist Church in the UK avoided investing in sinful
companies, e.g. companies involved in alcohol, tobacco and gambling, when they began
investing in the stock market in 1920s. The first ever ethical (faith-based) investment fund was
the Pionner Fund (then Fidelity Mutual Trust) launched in 1928.1
Islamic funds appeared in South-East Asia in the 1960s. The world’s first Islamic fund,
Lembaga Tabung Haji (Pilgrims Fund Board), was created in 1963 by the Malaysian
government to help Muslims save for their pilgrimage to Mecca. Since then, many Islamic
funds have been launched in Muslim countries as well as several European countries such as
the UK, Switzerland, France and the Netherlands. Based on the teachings of the Koran and its
interpretations, these funds avoid investing in companies involved in pork production,
pornography, gambling, as well as in interest-based financial institutions.
1 It is now the third oldest mutual fund in the United States.
3
In the 1970s, ethical funds in the United States started to refocus their strategy by integrating
Environmental, Social and Governance (ESG) screening criteria. Indeed a series of social
campaigns (e.g. anti-war and anti-racist movements) have made investors concerned about the
social consequences of their investments. The first modern socially responsible mutual fund,
the Pax World Fund, was founded in 1971 in the USA. Created for investors opposed to the
Vietnam War, the fund avoided investing in weapons contractors. The same year,
representatives from 270 Protestant denominations joined together to form the Interfaith Center
on Corporate Responsibility (ICCR) in order to challenge the role of banks and companies in
Apartheid South Africa. Nowadays, the ICCR aims at influencing corporate decision-making
on environmental and social issues. Similar organisations have been created in Europe such as
the Association Ethique et Investissement (1983) in France and the Ecumenical Council for
Corporate Responsibility (1989) in the UK.
Socially responsible funds have then largely surpassed faith-based funds; both in volume and
value (see next section for current market size of ethical funds). Although their number and
assets are constantly growing, they still represent a niche relative to the total assets under
management. Among faith-based investment funds, Islamic funds have seen a rapid
development in the last 15 years, especially since the 2007-08 financial crisis.
Besides Islamic funds, we find other investment funds following specific religious
denominations such as Lutheran (Lutheran Brotherhood Funds), Presbyterian (New Covenant
Funds), Mennonite (MMA – Mennonite Mutual Aid – Praxis Funds, Meritas), Catholic (Ave
Maria Mutual Funds, Catholic Values, Aquinas Funds), Conservative Christian (Timothy Plan,
Noah Fund), and Jewish (Jewish Community Investment Fund).
Many stock exchanges and index companies also provide ethical indices. KLD launched the
Domini 400 Social Index (now MSCI KLD 400 Social Index) in 1990 and the Catholic Values
400 index (now MSCI USA Catholic Values Index) in 1998. In 1999, Dow Jones created the
Dow Jones Islamic Market Index, and Kuala Lumpur stock exchange introduced the KLSE
Shariah index in Malaysia. Nowadays, all big index companies provide families of socially
responsible funds (e.g. STOXX Europe Sustain 40), Islamic funds (e.g. S&P500 Shariah,
STOXX Europe Islamic) and Christian funds (STOXX Europe Christian).
4
Current market for ethical funds
We provide in this section statistics on the evolution of the ethical investment industry in terms
of number of funds and assets under management. Comprehensive data is available only for
the two main categories of ethical funds: socially responsible and Islamic funds. Moreover,
these statistics are not easy to collect and to compare because of the large variety of sources
and methods used to define and measure these markets.
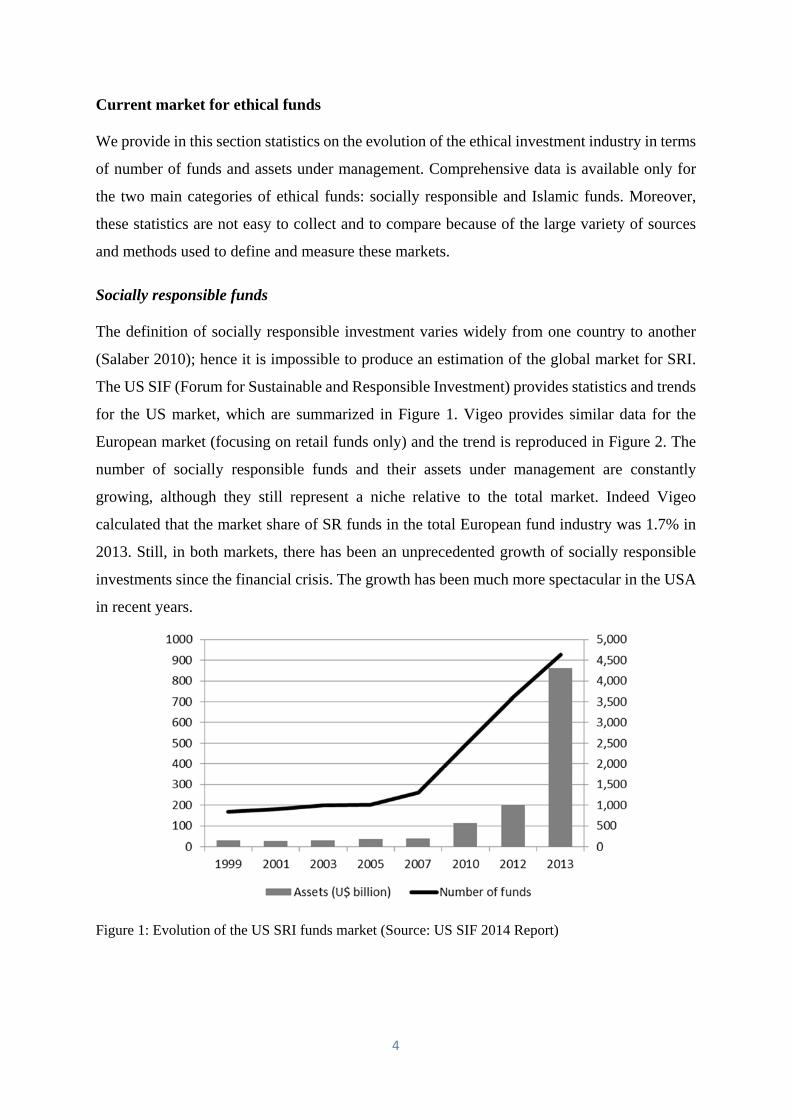
Socially responsible funds
The definition of socially responsible investment varies widely from one country to another
(Salaber 2010); hence it is impossible to produce an estimation of the global market for SRI.
The US SIF (Forum for Sustainable and Responsible Investment) provides statistics and trends
for the US market, which are summarized in Figure 1. Vigeo provides similar data for the
European market (focusing on retail funds only) and the trend is reproduced in Figure 2. The
number of socially responsible funds and their assets under management are constantly
growing, although they still represent a niche relative to the total market. Indeed Vigeo
calculated that the market share of SR funds in the total European fund industry was 1.7% in
2013. Still, in both markets, there has been an unprecedented growth of socially responsible
investments since the financial crisis. The growth has been much more spectacular in the USA
in recent years.
Figure 1: Evolution of the US SRI funds market (Source: US SIF 2014 Report)
5
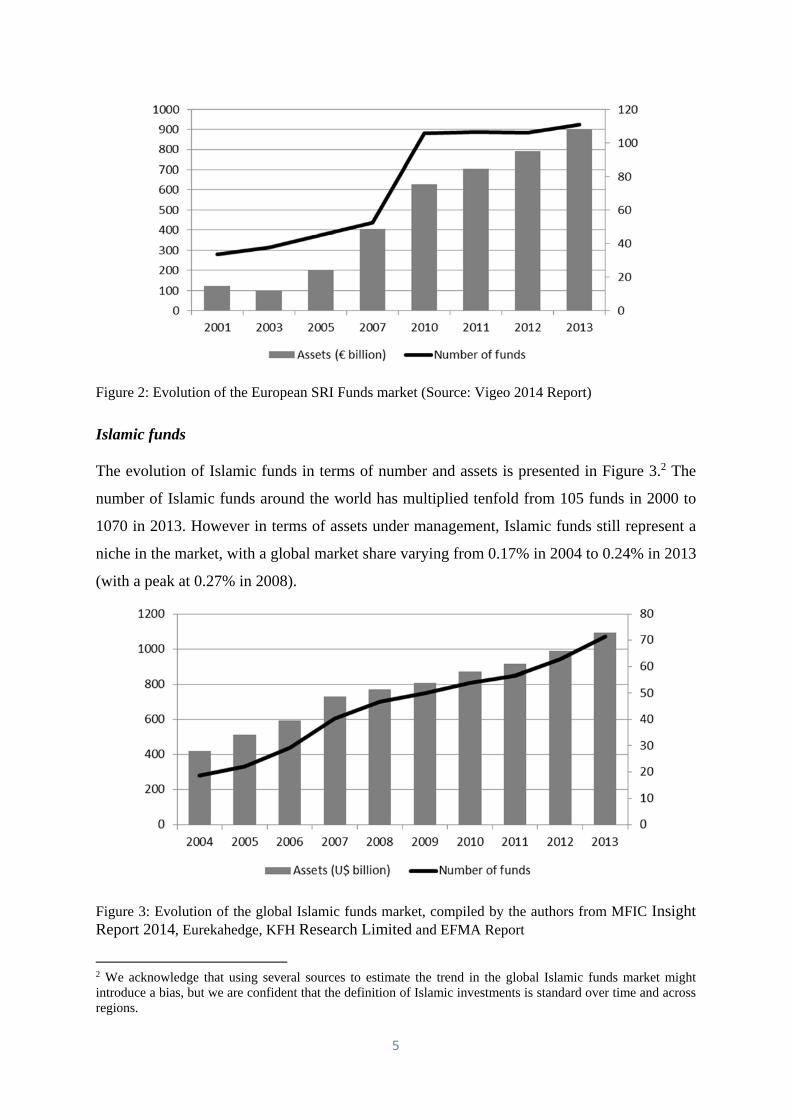
Figure 2: Evolution of the European SRI Funds market (Source: Vigeo 2014 Report)
Islamic funds
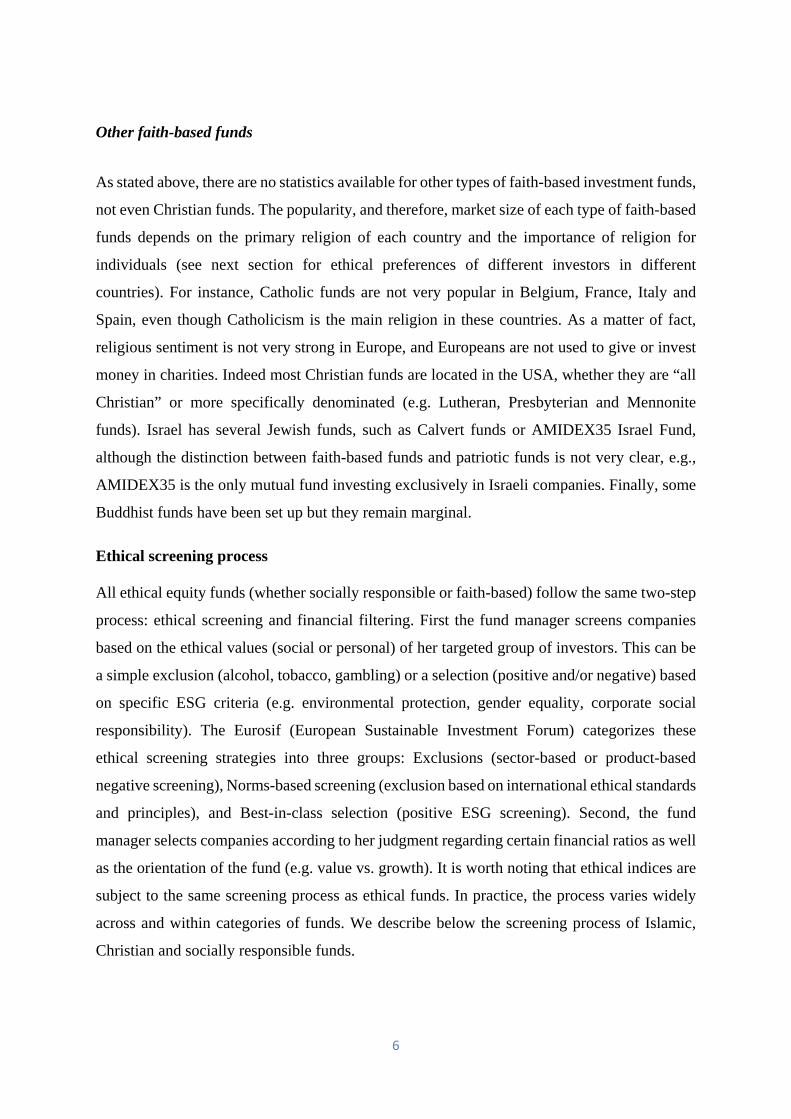
The evolution of Islamic funds in terms of number and assets is presented in Figure 3.2 The
number of Islamic funds around the world has multiplied tenfold from 105 funds in 2000 to
1070 in 2013. However in terms of assets under management, Islamic funds still represent a
niche in the market, with a global market share varying from 0.17% in 2004 to 0.24% in 2013
(with a peak at 0.27% in 2008).
Figure 3: Evolution of the global Islamic funds market, compiled by the authors from MFIC Insight Report 2014, Eurekahedge, KFH Research Limited and EFMA Report
2 We acknowledge that using several sources to estimate the trend in the global Islamic funds market might introduce a bias, but we are confident that the definition of Islamic investments is standard over time and across regions.
6
Other faith-based funds
As stated above, there are no statistics available for other types of faith-based investment funds,
not even Christian funds. The popularity, and therefore, market size of each type of faith-based
funds depends on the primary religion of each country and the importance of religion for
individuals (see next section for ethical preferences of different investors in different
countries). For instance, Catholic funds are not very popular in Belgium, France, Italy and
Spain, even though Catholicism is the main religion in these countries. As a matter of fact,
religious sentiment is not very strong in Europe, and Europeans are not used to give or invest
money in charities. Indeed most Christian funds are located in the USA, whether they are “all
Christian” or more specifically denominated (e.g. Lutheran, Presbyterian and Mennonite
funds). Israel has several Jewish funds, such as Calvert funds or AMIDEX35 Israel Fund,
although the distinction between faith-based funds and patriotic funds is not very clear, e.g.,
AMIDEX35 is the only mutual fund investing exclusively in Israeli companies. Finally, some
Buddhist funds have been set up but they remain marginal.
Ethical screening process
All ethical equity funds (whether socially responsible or faith-based) follow the same two-step
process: ethical screening and financial filtering. First the fund manager screens companies
based on the ethical values (social or personal) of her targeted group of investors. This can be
a simple exclusion (alcohol, tobacco, gambling) or a selection (positive and/or negative) based
on specific ESG criteria (e.g. environmental protection, gender equality, corporate social
responsibility). The Eurosif (European Sustainable Investment Forum) categorizes these
ethical screening strategies into three groups: Exclusions (sector-based or product-based
negative screening), Norms-based screening (exclusion based on international ethical standards
and principles), and Best-in-class selection (positive ESG screening). Second, the fund
manager selects companies according to her judgment regarding certain financial ratios as well
as the orientation of the fund (e.g. value vs. growth). It is worth noting that ethical indices are
subject to the same screening process as ethical funds. In practice, the process varies widely
across and within categories of funds. We describe below the screening process of Islamic,
Christian and socially responsible funds.

7
Figure 4: Ethical screening process of Islamic funds (Source: authors)
As shown in Figure 4, the ethical screening of Islamic funds is quite complex and is usually
supervised by an independent Shariah Board which controls the compliance of the fund to
Islamic law.3 Islamic or Shariah law prohibits sinful activities (Haram), interest earnings or
usury (Riba), speculation and gambling (Maisir), and uncertainty (Gharar). However Islamic
scholars agree that it is very difficult to find companies that are completely Shariah compliant,
and hence have developed general cumulative tolerance criteria to govern Shariah compliant
equity investments.4 These screening criteria are applied at the product level and at the financial
structure level. First, fund managers exclude all financial institutions operating on interest
(conventional banks and insurance companies), as well as all companies deriving more than
5% of their revenues from the manufacturing, selling or offering alcohol, tobacco, gambling,
pornography, weapons, pork products, non-halal food and beverages. Second, the manager
eliminates stocks of companies that depend heavily on interest-based debt financing (debt to
assets ratio > 33% or debt to equity ratio > 33%). Third, companies whose cash and cash
3 Shariah Boards exist at the country level (e.g. the Shariah Advisory Councils in Hong Kong and Malaysia) or at the investment company level (e.g. the Dow Jones Islamic Market Shariah Supervisory Board). 4 Thresholds for financial ratios might differ from one Sharia Board to another and we present here the most commonly used thresholds.

8
equivalents divided by their total assets exceeds 50% are prohibited. Fourth, companies whose
interest-bearing cash and short-term investments divided by their market capitalisation exceeds
30% will not be considered as Shariah compliant. Finally, it is suggested that the proportion of
interest income in the dividend paid to shareholders must be given in charity. Similarly, the
portion of non-compliant revenues (up to 5%) has to be purified.
Other faith-based funds have less screening criteria than Islamic funds. In the case of Christian
funds, the investment process is not as sophisticated or standardised. By analysing many fund
prospectuses, we have identified two main categories of Christian screening. The first one,
illustrated in Figure 5, is a simple exclusion of companies whose products and/or policies are
counter to Biblical principles such as: respecting the human person, promoting the family,
respecting work and the worker, pursuing peace and caring for the poor. For instance, the Ave
Maria Catholic Values Fund states that the screening process would in general avoid two
categories of companies: those involved in the practice of abortion and those whose policies
are judged to be anti-family (e.g. companies that distribute pornographic material). Another
Fund Family, Timothy Plan, explicitly excludes stocks of companies involved in the production
or distribution of alcohol, tobacco, and gambling, or involved in abortion and pornography.
Sometimes a Christian Advisory Board, equivalent to the Sharia Board, helps fund managers
in their investment decisions by setting the criteria for screening out companies based on
religious principles. For instance, the MSCI USA Catholic Values Index follows the United
States Conference of Catholic Bishops’ Socially Responsible Investment Guidelines, excluding
companies involved in abortion, contraceptives, stem cells and adult entertainment. The Ave
Maria fund family has its own Catholic Advisory Board which is “loyal to the Magisterium of
the Roman Catholic Church”.
9
Figure 5: Ethical screening process of Christian funds – simple screening (Source: authors)
Hence the ethical screening criteria are not standardised and the allowance depends on the
existence and rigour of compliance boards. As a shortcut, some fund managers select
companies from existing faith-based indices. For example, the Liga Pax Cattolico Union Fund
invests exclusively in shares of companies that are listed in the Ethical Index Global Return,
combining both Christian values and ESG criteria.
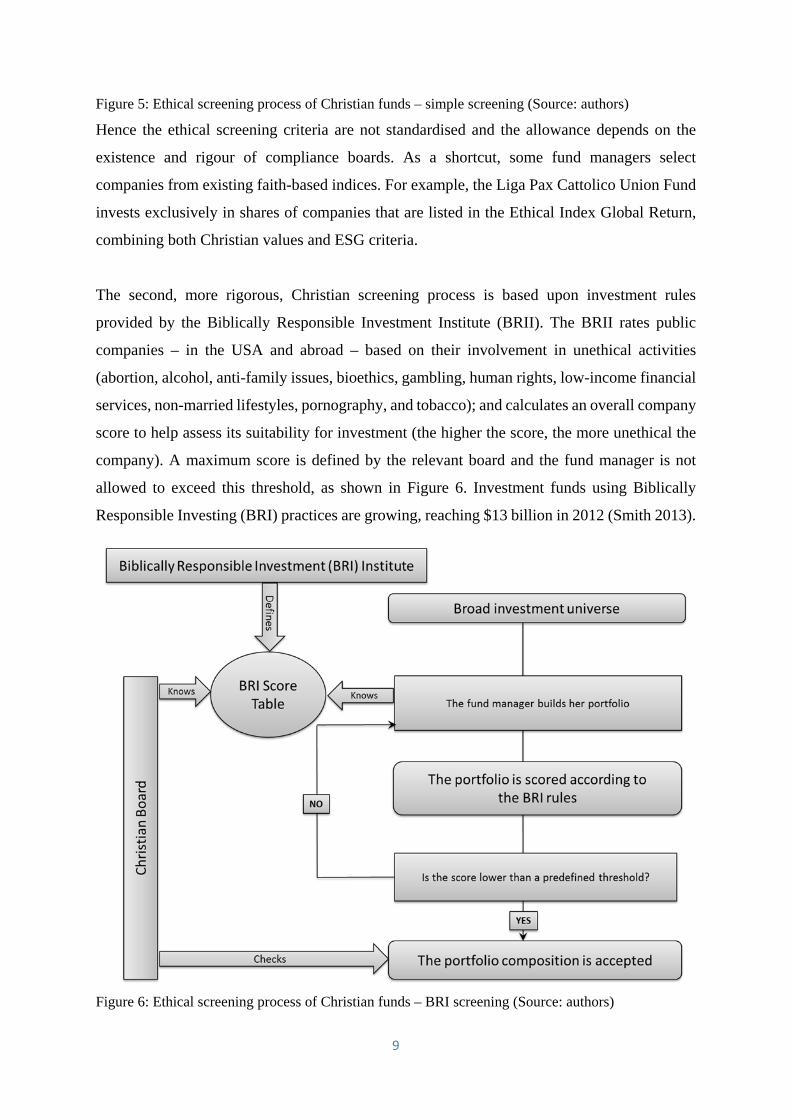
The second, more rigorous, Christian screening process is based upon investment rules
provided by the Biblically Responsible Investment Institute (BRII). The BRII rates public
companies – in the USA and abroad – based on their involvement in unethical activities
(abortion, alcohol, anti-family issues, bioethics, gambling, human rights, low-income financial
services, non-married lifestyles, pornography, and tobacco); and calculates an overall company
score to help assess its suitability for investment (the higher the score, the more unethical the
company). A maximum score is defined by the relevant board and the fund manager is not
allowed to exceed this threshold, as shown in Figure 6. Investment funds using Biblically
Responsible Investing (BRI) practices are growing, reaching $13 billion in 2012 (Smith 2013).
Figure 6: Ethical screening process of Christian funds – BRI screening (Source: authors)
10
Socially responsible funds around the world use a variety of investment criteria that represent
the values of particular groups of populations (Salaber 2010). For instance, socially responsible
funds in the USA favour product-based exclusions of alcohol, tobacco, weapons and gambling
companies (SIF 2007), whereas funds in Belgium, France and Switzerland follow a combined
approach of positive screening (best-in-class) and norms-based screening (Eurosif 2008,
Eurosif 2012). Even within Europe there is no consensus on a unified definition of socially
responsible (or sustainable) investment. For instance, the exclusion of alcohol companies from
ethical funds is popular in Denmark, Spain and Sweden but not in Austria, France and
Germany. Similarly, nuclear power plants are excluded from most socially responsible funds
in Austria, Germany and Spain but are not automatically screened out in other European
countries. Such product-based exclusions are more popular in Continental Europe than in the
UK where they are mostly used by Church, charity and private investors (Eurosif 2012).
Finally, norms-based exclusions, especially related to human rights and environmental issues,
are very popular in Nordic countries. International norms include, among others, the UN Global
Compact, OECD Guidelines for multinational enterprises, and ILO Conventions.
Table 1 summarizes all ethical screening criteria used by various types of funds. There are
different levels of screening: X corresponds to total exclusion (by all funds in the category); P
represents partial exclusion, i.e., by some funds in the category; R indicates threshold-based
restriction; and I corresponds to positive screening (inclusion) such as best-in-class approach.
NA means that the fund category doesn’t screen this particular criterion. This table was created
from various sources, including Ghoul and Karam (2007), Renneboog et al. (2012), the Pew
Research Center, the Eurosif and the France and United States Conferences of Catholic
Bishops. Between 2008 and 2013, 84 countries around the world have ratified the Dublin
Convention on Cluster Munitions which prohibits the use, production, transfer and stockpiling
of cluster munitions. Among them, Australia, Japan, and most European countries are States
Parties, but not the USA. This has an important implication for screening strategies as ethical
fund managers in these countries now systematically exclude companies that produce, sell or
distribute cluster bombs. Hence, the negative screening of controversial weapons recently
became the most common screening strategy used by European ethical funds.

11
Screening criteria Socially
responsible funds
Christian funds
Conservative Christian
funds
Islamic funds
Jewish funds
Hindu funds
Buddhist funds
Product-based exclusions Alcohol P P P X NA NA NA
Tobacco X X X X NA P P
Gambling X X X X X P P
Pornography X X X X X P P
Weapons P P P X X X X
Nuclear P P P NA NA NA NA
Animal testing P NA NA NA NA X X
Violence NA NA NA NA NA X X
Stem cells NA P X NA NA NA NA
Abortion / nonmarital NA P X NA NA NA NA
Non-kosher products NA NA NA NA X NA NA
Pork-related products NA NA NA X X NA NA
Conventional banking and insurance NA NA NA X NA NA NA
Interest-based products NA NA P R NA NA NA
Financial ratios
Leverage ratio NA NA NA R NA NA NA
Liquidity ratio NA NA NA R NA NA NA
Interest income NA NA NA R NA NA NA
ESG screening (positive/negative)
Environmental/ecological standards I/X I/X I/X NA NA NA NA
Business practices I/X I/X I/X NA NA NA NA
Human rights I/X I/X I/X NA NA NA NA
Labour relations and diversity I/X I/X I/X NA NA NA NA
Community I I I NA NA NA NA
Corporate governance I/X I/X I/X NA NA NA NA
Businesses open on Shabbat NA NA NA NA X NA NA
Table 1: Screening criteria used by different ethical funds around the world (Source: authors)
Apart from this particular exclusion, only two industries (gambling and pornography) are
negatively screened by all categories of funds. Next is the tobacco industry, negatively screened
by almost all categories. It’s worth noting that Christian funds and socially responsible funds
have very similar screening criteria due to the fact that socially responsible funds originated
from Christian funds. Moreover, even though Islamic funds have universal rules in terms of
ethical screening, other categories of funds have their own investment processes which can
differ widely across funds. More particularly, positive screening is very subjective and often
fund managers will orientate their investments in accordance with the personal values of their
targeted customers.

12
Characteristics of ethical funds
By definition, integrating non-financial criteria in the investment decision, that is restraining
the investment universe, implies under-diversification. All categories of funds employ some
kind of negative screening of particular sectors (e.g. tobacco, gambling, pornography and
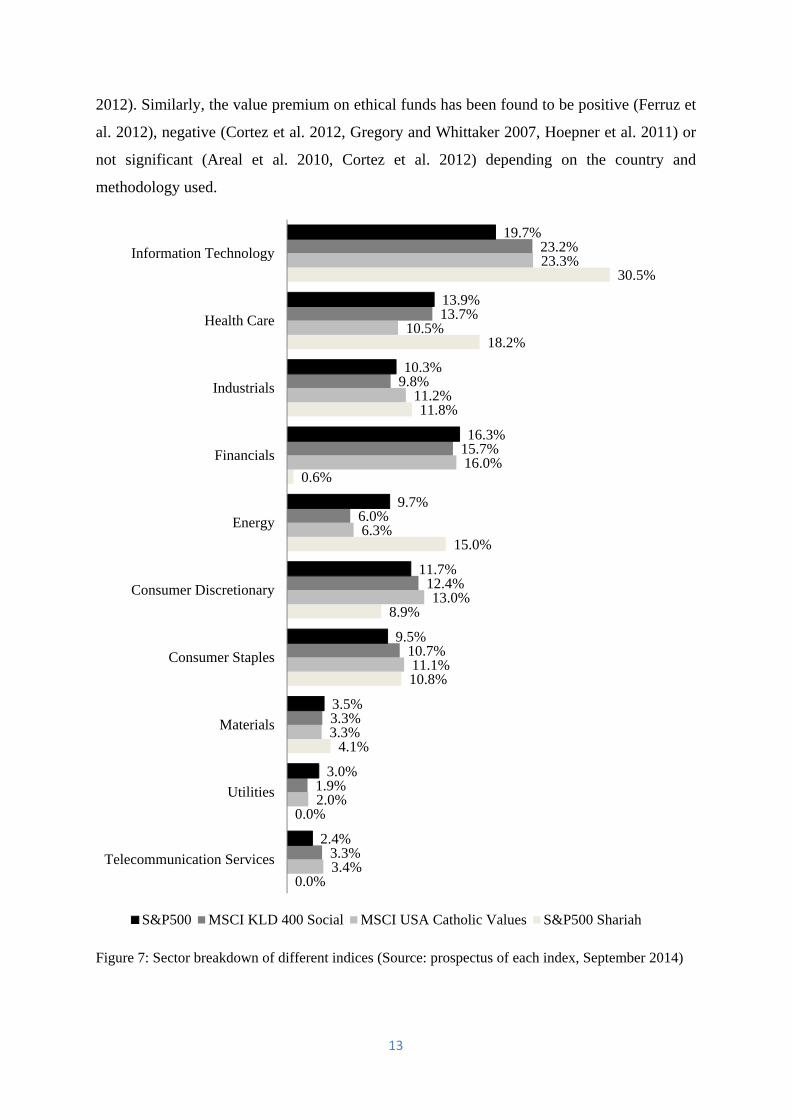
defence), which means that they are under-represented in these sectors. Figure 7 shows the
sector breakdown of four indices: a conventional index, a socially responsible index, a Catholic
index, and an Islamic index. The strongest industrial bias is acknowledged by Islamic funds
which completely discard the (traditional) financial sector because of interest-based activities,
and consequently overweight low-levered industries such as IT, healthcare and energy
(Hussein and Omran 2005). Indeed, it is argued that Islamic funds have survived the recent
crisis precisely because they shun financial institutions (Jouini and Pastré 2009). Catholic funds
and indices also show some level of industrial bias, the most obvious being the
underrepresentation of healthcare companies. Indeed most Catholic funds do not invest in firms
involved in the production of abortion or contraceptives. Recently, both socially responsible
and Catholic funds/indices have discarded energy companies because of concerns toward
nuclear energy. However, due to the subjective nature of their screening process, socially
responsible funds and indices don’t exhibit the same level of under-diversification. Although
some socially responsible funds have a higher exposure to IT and telecommunication sectors
(Benson et al. 2006, Statman 2006), the portfolio allocation of US socially responsible and
conventional funds does not significantly differs (Benson et al. 2006, Hawken 2004).
Regarding the market risk of ethical funds, extant literature finds that, on average, they exhibit
betas close to one (Boasson et al. 2006, Ferruz et al. 2012, Girard and Hassan 2008, Liston and
Soydemir 2010, Nofsinger and Varma 2014). In some countries, betas are lower than one for
Islamic funds (Hayat and Kraeussl 2011, Hoepner et al. 2011, Walkshäusl and Lobe 2012) and
socially responsible funds (Cortez et al. 2012, Leite and Cortez 2014). Regarding the exposure
of ethical funds to size and value, extant literature offers conflicting results. Some studies report
a significant small-cap bias for socially responsible funds (Areal et al. 2010, Bauer et al. 2006,
Cortez et al. 2012, Gregory et al. 1997, Gregory and Whittaker 2007) and faith-based funds
(Areal et al. 2010, Girard and Hassan 2008, Hoepner et al. 2011, Liston and Soydemir 2010).
Other studies find that ethical funds mostly invest in large companies (Bauer et al. 2005,
Nofsinger and Varma 2014, Renneboog et al. 2008, Schroder 2004, Walkshäusl and Lobe
13
2012). Similarly, the value premium on ethical funds has been found to be positive (Ferruz et
al. 2012), negative (Cortez et al. 2012, Gregory and Whittaker 2007, Hoepner et al. 2011) or
not significant (Areal et al. 2010, Cortez et al. 2012) depending on the country and
methodology used.
Figure 7: Sector breakdown of different indices (Source: prospectus of each index, September 2014)
0.0%
0.0%
4.1%
10.8%
8.9%
15.0%
0.6%
11.8%
18.2%
30.5%
3.4%
2.0%
3.3%
11.1%
13.0%
6.3%
16.0%
11.2%
10.5%
23.3%
3.3%
1.9%
3.3%
10.7%
12.4%
6.0%
15.7%
9.8%
13.7%
23.2%
2.4%
3.0%
3.5%
9.5%
11.7%
9.7%
16.3%
10.3%
13.9%
19.7%
Telecommunication Services
Utilities
Materials
Consumer Staples
Consumer Discretionary
Energy
Financials
Industrials
Health Care
Information Technology
S&P500 MSCI KLD 400 Social MSCI USA Catholic Values S&P500 Shariah

14
Hayat and Kraeussl (2011) emphasize other risks specific to Islamic funds that could impact
their performance: risk of changes in Islamic law, high exposure to companies that might be
sub-optimally leveraged, and companies with low working capital.
Performance of different ethical funds
There are two competing hypotheses regarding the performance of ethical funds relative to
conventional funds. According to modern portfolio theory, under-diversification should imply
under-performance (for a given level of risk). According the corporate social responsibility and
stakeholder theory, the ethical screening process generates value-relevant information and
helps select securities that are better performing than average. Renneboog et al. (2008) test
these two hypotheses over a sample of 440 ethical funds (both socially responsible and faith-
based) across 17 countries between 1991 and 2003. Even though ethical funds seem to earn
negative risk-adjusted returns (four-factor alphas) in some countries; they perform the same as
conventional funds in most countries (e.g. Australia, the USA, Canada, the UK, Germany and
Malaysia). Other pre-crisis studies concentrate on one type of ethical funds in individual
countries and find similar results. Overall ethical funds perform similarly or slightly worse
than traditional funds, whether they are socially responsible (Bauer et al. 2007, Bauer et al.
2006, Girard et al. 2007, Gregory and Whittaker 2007, Statman 2000) or Islamic funds
(BinMahfouz and Hassan 2012, Mansor and Bhatti 2011). Abdullah et al. (2007) analyse the
risk-adjusted performance of Malaysian funds over 1992-2001 and find that Islamic funds
outperformed (underperformed) conventional funds during bear (bull) markets. On the
contrary, it seems that Islamic indices outperform in bull markets and underperform in bear
markets (Hussein 2004, Hussein 2007, Hussein and Omran 2005).
More and more studies compare the performance of socially responsible, faith-based and
conventional investments. Overall, the risk-adjusted performance is similar across all types of
funds (Abdelsalam et al. 2014, Adams and Ahmed 2012). Results for equity indices in the USA
are conflicting: Beer et al. (2011) show that the Islamic index (DJIM) outperforms the socially
responsible index (KLD Domini 400 Social) which outperforms the conventional index (S&P
500); whereas Albaity and Ahmad (2011) do not find any significant difference across indices.
More recent results, including the post-crisis period, provide similar evidence. The
performance of ethical funds is not statistically different (or slightly lower) than the
performance of conventional funds, both for socially responsible (Leite and Cortez 2014) and
15
faith-based funds (Adams and Ahmed 2012, Ferruz et al. 2012). Within faith-based funds,
Adams and Ahmed (2012) report that Islamic funds significantly outperformed Christian funds
over 1998-2009. Hoepner et al. (2011) study the performance of 265 Islamic funds around the
world over the period 1990-2009. Using a conditional 12-factor model (4 risk factors across 3
geographical levels), they find that Islamic funds located in Muslim countries (GCC) perform
slightly better than their conventional benchmarks, whereas Islamic funds located in non-
Muslim countries (e.g. Germany, the UK and the USA) significantly underperform their
benchmarks (no significant difference was found in Malaysia). Finally, Nofsinger and Varma
(2014) investigate the performance of US ethical funds during crisis and non-crisis periods
over 2000-2011. On average, ethical funds outperform conventional funds during crisis periods
(2000-2002 and 2007-2009) but underperform during non-crisis periods. These findings are
driven by the performance of socially responsible funds (using ESG criteria), as faith-based
funds do not exhibit any significant out- or underperformance over crisis and non-crisis years.
Based on existing literature and conflicting evidence across countries and types of funds, we
conduct a performance analysis on a sample of ethical funds and indices to assess their
behaviour before and after the financial crisis. Since it is very difficult to collect extensive data
on international funds, and for comparison purposes, we focus on the performance of US funds
and indices denominated in US dollar. We collected from DataStream daily stock market data
for five ethical funds and indices, including four faith-based and one socially responsible. We
also collected data for the S&P500 Composite Index which is used as benchmark. Our sample
period runs from January 2003 to July 2014 and includes the whole period of financial crisis
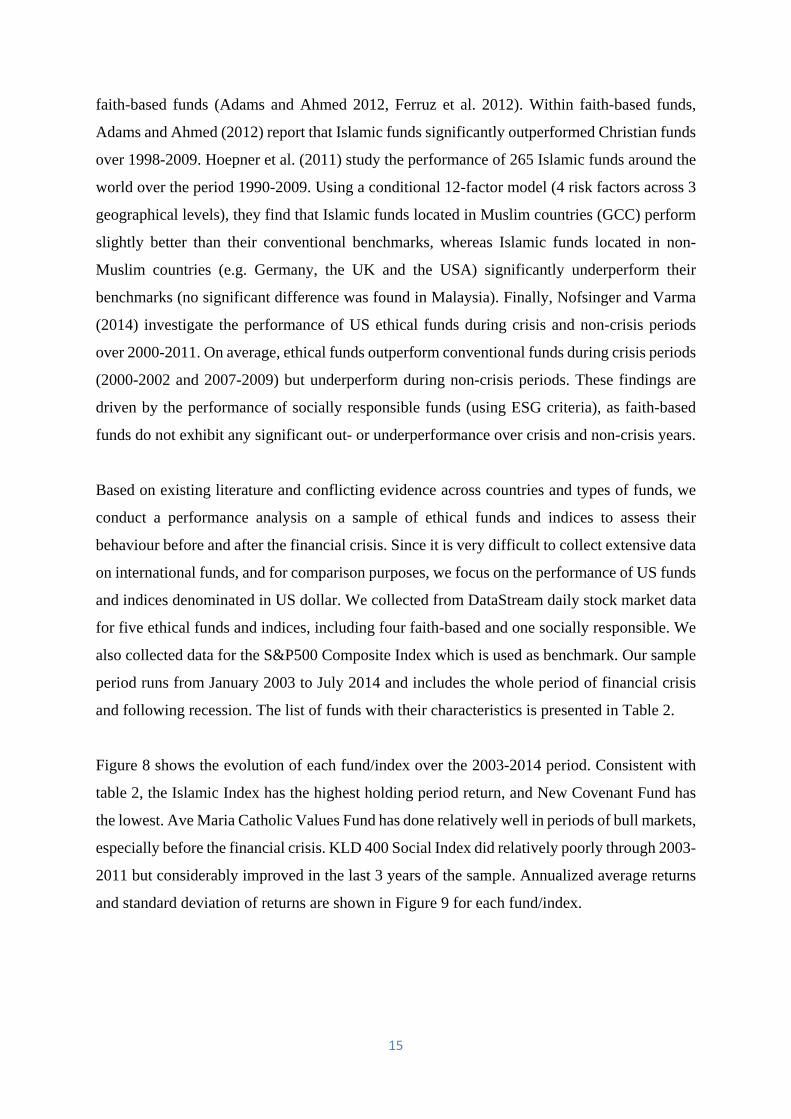
and following recession. The list of funds with their characteristics is presented in Table 2.
Figure 8 shows the evolution of each fund/index over the 2003-2014 period. Consistent with
table 2, the Islamic Index has the highest holding period return, and New Covenant Fund has
the lowest. Ave Maria Catholic Values Fund has done relatively well in periods of bull markets,
especially before the financial crisis. KLD 400 Social Index did relatively poorly through 2003-
2011 but considerably improved in the last 3 years of the sample. Annualized average returns
and standard deviation of returns are shown in Figure 9 for each fund/index.
16
Ave Maria Catholic
Values Fund
New Covenant Growth
DJ Islamic US
DJ Islamic World
Developed
KLD 400 Social
S&P 500
Inception date 19/07/2001 28/06/2000 01/01/1996 01/01/1996 30/04/1990 31/12/1963 Currency U$ U$ U$ U$ U$ U$ Type Fund Fund Index Index Index Index Focus country USA USA USA World USA USA
Characteristics Catholic Presbyterian
Church Islamic Islamic
Socially Responsible
General
Number of observations 2995 2995 2995 2995 2995 2995 Total holding period return
180% 145% 200% 193% 172% 178%
Average daily return 0.0425% 0.0368% 0.0437% 0.0412% 0.0408% 0.0417% Average annual return 10.70% 9.27% 11.01% 10.39% 10.29% 10.50% Daily standard dev. 1.269% 1.163% 1.184% 1.047% 1.218% 1.228% Annualized standard dev.
20.14% 18.47% 18.79% 16.62% 19.33% 19.50%
Skewness -0.2315 -0.1688 0.0844 -0.2341 0.0046 -0.0714 Kurtosis 7.9395 10.2112 11.9587 10.6398 10.5444 11.6410 Shapiro-Wilk Test 0.9055 0.8934 0.8935 0.8976 0.8868 0.8775 Jarque-Bera test 6996.57 11912.00 16173.28 12633.66 12464.83 15111.67 Normality Rejected Rejected Rejected Rejected Rejected Rejected Risk-free rate benchmark
5-Year US bond yield
5-Year US bond yield
5-Year US bond yield
5-Year US bond yield
5-Year US bond yield
5-Year US bond yield
Table 2: Sample description and characteristics (authors’ calculations)
Figure 8: Daily price indices, 2003-2014 (100 = January 2003), Source: DataStream
75
100
125
150
175
200
225
250
275
300
Jan-
03A
pr-0
3A
ug-0
3D
ec-0
3A
pr-0
4Ju
l-04
Nov
-04
Mar
-05
Jul-
05O
ct-0
5F
eb-0
6Ju
n-06
Oct
-06
Feb
-07
May
-07
Sep
-07
Jan-
08M
ay-0
8A
ug-0
8D
ec-0
8A
pr-0
9A
ug-0
9D
ec-0
9M
ar-1
0Ju
l-10
Nov
-10
Mar
-11
Jun-
11O
ct-1
1F
eb-1
2Ju
n-12
Sep
-12
Jan-
13M
ay-1
3S
ep-1
3Ja
n-14
Apr
-14
AVE MARIA NEW COVENANT S&P 500 DJ ISLAMIC WORLD DEV KLD 400 SOCIAL
17
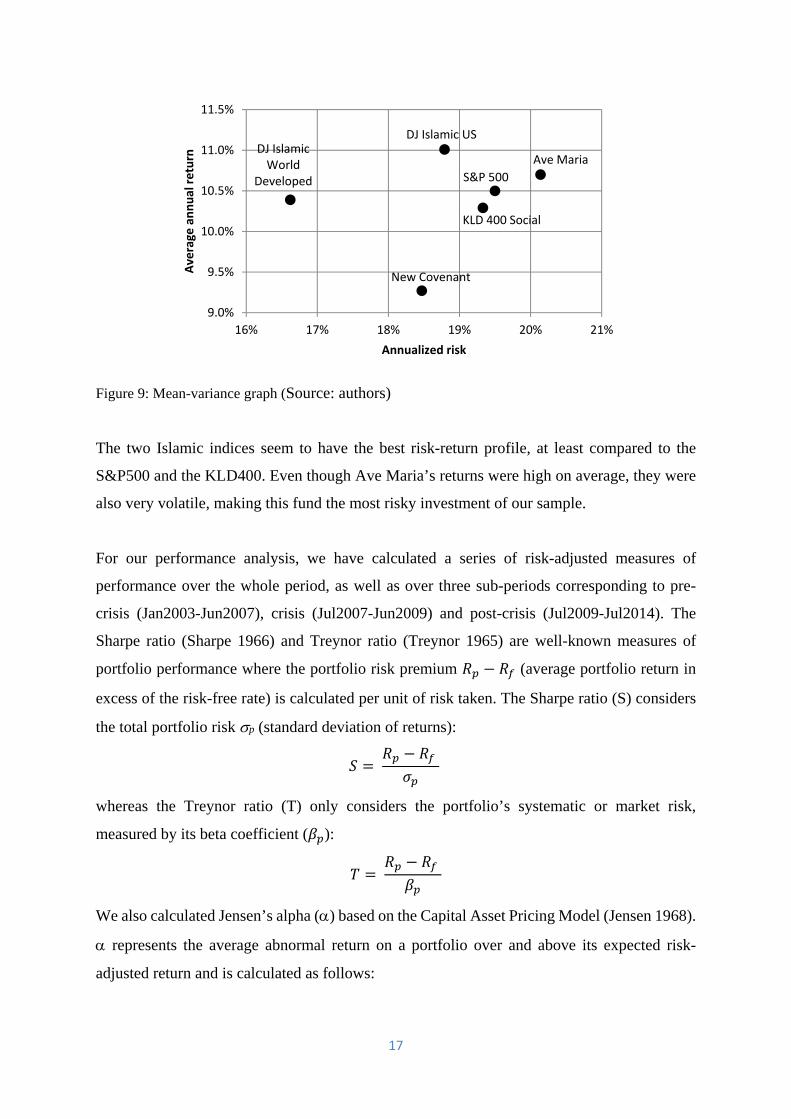
Figure 9: Mean-variance graph (Source: authors)
The two Islamic indices seem to have the best risk-return profile, at least compared to the
S&P500 and the KLD400. Even though Ave Maria’s returns were high on average, they were
also very volatile, making this fund the most risky investment of our sample.
For our performance analysis, we have calculated a series of risk-adjusted measures of
performance over the whole period, as well as over three sub-periods corresponding to pre-
crisis (Jan2003-Jun2007), crisis (Jul2007-Jun2009) and post-crisis (Jul2009-Jul2014). The
Sharpe ratio (Sharpe 1966) and Treynor ratio (Treynor 1965) are well-known measures of
portfolio performance where the portfolio risk premium (average portfolio return in
excess of the risk-free rate) is calculated per unit of risk taken. The Sharpe ratio (S) considers
the total portfolio risk p (standard deviation of returns):
whereas the Treynor ratio (T) only considers the portfolio’s systematic or market risk,
measured by its beta coefficient ( ):
We also calculated Jensen’s alpha () based on the Capital Asset Pricing Model (Jensen 1968).
represents the average abnormal return on a portfolio over and above its expected risk-
adjusted return and is calculated as follows:
Ave Maria
New Covenant
DJ Islamic USDJ Islamic World
Developed
KLD 400 Social
S&P 500
9.0%
9.5%
10.0%
10.5%
11.0%
11.5%
16% 17% 18% 19% 20% 21%
Average
annual return
Annualized risk
18
.
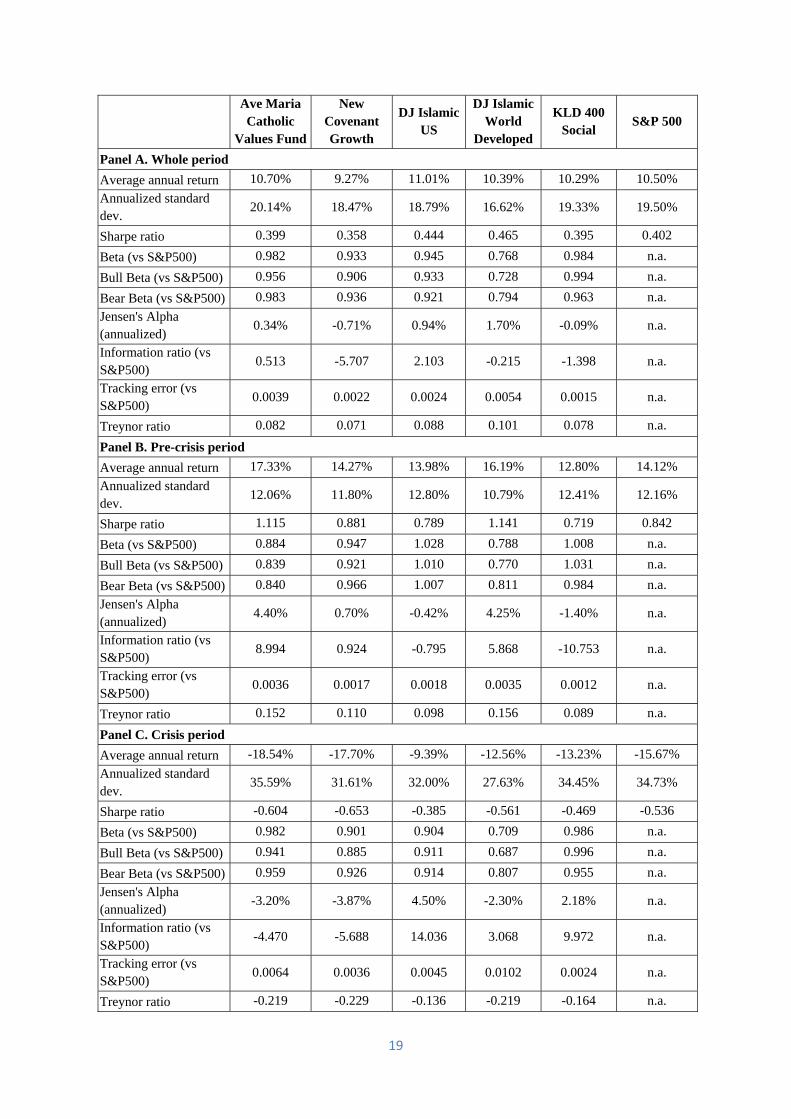
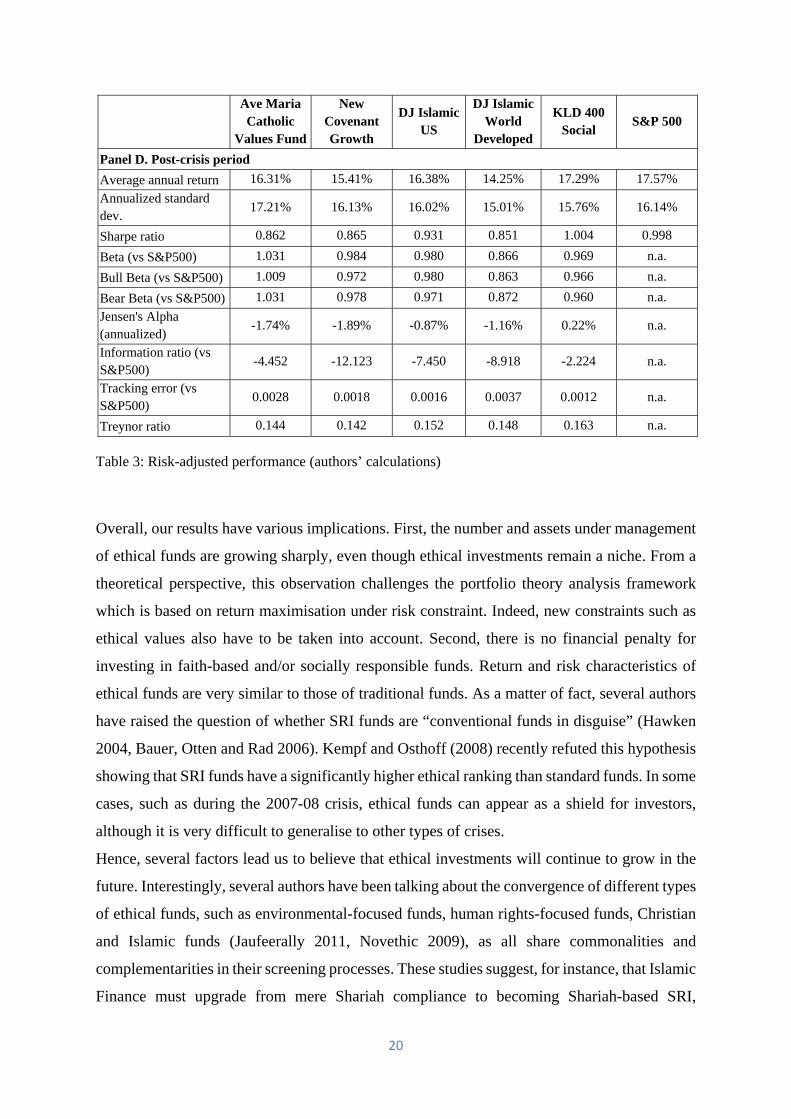
Results are presented in Table 3. Over the whole period, the Islamic indices have the best risk-
adjusted performance measured by the Sharpe and Treynor ratios, as well as Jensen’s alpha.
New Covenant Growth Fund is still doing poorly on a risk-adjusted basis. During the crisis
period, all funds/indices lost 10-20% of their value, and all earned a negative Sharpe ratio and
Treynor ratio. Still, it seems that the DJ Islamic US Index and the KLD 400 Social Index did
better than other investments on a risk-adjusted basis (they earned positive alphas). This
outperformance during the crisis extended to the post-crisis period, when the KLD 400 earned
the best risk-adjusted performance. In terms of alpha, although most funds/indices performed
worst during the crisis than before/after the crisis, the DJ Islamic US Index and the KLD 400
Social Index actually performed better during the crisis. Gillet and Salaber (2015) provide a
comprehensive performance analysis of various ethical funds over the 2007-08 financial crisis.
Conclusion
Although still a niche, ethical investment developed rapidly in the last 15 years, even more so
since the 2007-08 financial crisis. Ethical investment vehicles include both socially responsible
and faith-based (mainly Islamic and Christian) funds and indices. All these ethical funds and
indices adopt different screening processes depending on the type of fund and its country of
origin. We have tried in this chapter to present the wide variety of ethical funds and their
screening criteria, in order to understand their performance over the recent financial crisis and
beyond. Using a sample of US funds and indices over the period 2003-2014, and various risk-
adjusted measures of performance, we show that, overall, and more specifically during the
crisis, Islamic and socially responsible indices have slightly outperformed conventional and
Catholic funds/indices. This outperformance may be driven by the fact that they limit their
investments in some sectors, such as the financial sector which has been mostly hit by the
recent crisis. Hence, the under-diversification of ethical funds has played in their favour for the
last 15 years.
19
Ave Maria Catholic
Values Fund
New Covenant Growth
DJ Islamic US
DJ Islamic World
Developed
KLD 400 Social
S&P 500
Panel A. Whole period Average annual return 10.70% 9.27% 11.01% 10.39% 10.29% 10.50%
Annualized standard dev.
20.14% 18.47% 18.79% 16.62% 19.33% 19.50%
Sharpe ratio 0.399 0.358 0.444 0.465 0.395 0.402
Beta (vs S&P500) 0.982 0.933 0.945 0.768 0.984 n.a.
Bull Beta (vs S&P500) 0.956 0.906 0.933 0.728 0.994 n.a.
Bear Beta (vs S&P500) 0.983 0.936 0.921 0.794 0.963 n.a.
Jensen's Alpha (annualized)
0.34% -0.71% 0.94% 1.70% -0.09% n.a.
Information ratio (vs S&P500)
0.513 -5.707 2.103 -0.215 -1.398 n.a.
Tracking error (vs S&P500)
0.0039 0.0022 0.0024 0.0054 0.0015 n.a.
Treynor ratio 0.082 0.071 0.088 0.101 0.078 n.a.
Panel B. Pre-crisis period Average annual return 17.33% 14.27% 13.98% 16.19% 12.80% 14.12%
Annualized standard dev.
12.06% 11.80% 12.80% 10.79% 12.41% 12.16%
Sharpe ratio 1.115 0.881 0.789 1.141 0.719 0.842
Beta (vs S&P500) 0.884 0.947 1.028 0.788 1.008 n.a.
Bull Beta (vs S&P500) 0.839 0.921 1.010 0.770 1.031 n.a.
Bear Beta (vs S&P500) 0.840 0.966 1.007 0.811 0.984 n.a.
Jensen's Alpha (annualized)
4.40% 0.70% -0.42% 4.25% -1.40% n.a.
Information ratio (vs S&P500)
8.994 0.924 -0.795 5.868 -10.753 n.a.
Tracking error (vs S&P500)
0.0036 0.0017 0.0018 0.0035 0.0012 n.a.
Treynor ratio 0.152 0.110 0.098 0.156 0.089 n.a.
Panel C. Crisis period Average annual return -18.54% -17.70% -9.39% -12.56% -13.23% -15.67%
Annualized standard dev.
35.59% 31.61% 32.00% 27.63% 34.45% 34.73%
Sharpe ratio -0.604 -0.653 -0.385 -0.561 -0.469 -0.536
Beta (vs S&P500) 0.982 0.901 0.904 0.709 0.986 n.a.
Bull Beta (vs S&P500) 0.941 0.885 0.911 0.687 0.996 n.a.
Bear Beta (vs S&P500) 0.959 0.926 0.914 0.807 0.955 n.a.
Jensen's Alpha (annualized)
-3.20% -3.87% 4.50% -2.30% 2.18% n.a.
Information ratio (vs S&P500)
-4.470 -5.688 14.036 3.068 9.972 n.a.
Tracking error (vs S&P500)
0.0064 0.0036 0.0045 0.0102 0.0024 n.a.
Treynor ratio -0.219 -0.229 -0.136 -0.219 -0.164 n.a.
20
Ave Maria Catholic
Values Fund
New Covenant Growth
DJ Islamic US
DJ Islamic World
Developed
KLD 400 Social
S&P 500
Panel D. Post-crisis period Average annual return 16.31% 15.41% 16.38% 14.25% 17.29% 17.57%
Annualized standard dev.
17.21% 16.13% 16.02% 15.01% 15.76% 16.14%
Sharpe ratio 0.862 0.865 0.931 0.851 1.004 0.998
Beta (vs S&P500) 1.031 0.984 0.980 0.866 0.969 n.a.
Bull Beta (vs S&P500) 1.009 0.972 0.980 0.863 0.966 n.a.
Bear Beta (vs S&P500) 1.031 0.978 0.971 0.872 0.960 n.a.
Jensen's Alpha (annualized)
-1.74% -1.89% -0.87% -1.16% 0.22% n.a.
Information ratio (vs S&P500)
-4.452 -12.123 -7.450 -8.918 -2.224 n.a.
Tracking error (vs S&P500)
0.0028 0.0018 0.0016 0.0037 0.0012 n.a.
Treynor ratio 0.144 0.142 0.152 0.148 0.163 n.a.
Table 3: Risk-adjusted performance (authors’ calculations)
Overall, our results have various implications. First, the number and assets under management
of ethical funds are growing sharply, even though ethical investments remain a niche. From a
theoretical perspective, this observation challenges the portfolio theory analysis framework
which is based on return maximisation under risk constraint. Indeed, new constraints such as
ethical values also have to be taken into account. Second, there is no financial penalty for
investing in faith-based and/or socially responsible funds. Return and risk characteristics of
ethical funds are very similar to those of traditional funds. As a matter of fact, several authors
have raised the question of whether SRI funds are “conventional funds in disguise” (Hawken
2004, Bauer, Otten and Rad 2006). Kempf and Osthoff (2008) recently refuted this hypothesis
showing that SRI funds have a significantly higher ethical ranking than standard funds. In some
cases, such as during the 2007-08 crisis, ethical funds can appear as a shield for investors,
although it is very difficult to generalise to other types of crises.
Hence, several factors lead us to believe that ethical investments will continue to grow in the
future. Interestingly, several authors have been talking about the convergence of different types
of ethical funds, such as environmental-focused funds, human rights-focused funds, Christian
and Islamic funds (Jaufeerally 2011, Novethic 2009), as all share commonalities and
complementarities in their screening processes. These studies suggest, for instance, that Islamic
Finance must upgrade from mere Shariah compliance to becoming Shariah-based SRI,
21
integrating for instance best-in-class screening approaches. Similarly, authors have suggested
that SRI screening methodology could be improved in order to truly make a difference, i.e.,
influence and encourage companies to improve their ethical, social, and environmental
performance (De Colle and York 2009). Overall, although there are still controversies on the
true purpose of ethical investments, good news is investors can make a difference while making
money, and the range and diversity of investment funds offered to ethical investors keep
increasing around the world.
22
References
Abdelsalam, O., Duygun, M., Matallín-Sáez, J. C. and Tortosa-Ausina, E. (2014) 'Do ethics imply persistence? The case of Islamic and socially responsible funds'. Journal of Banking & Finance, 40, 182-194.
Abdullah, F., Hassan, T. and Mohamad, S. (2007) 'Investigation of performance of Malaysian Islamic unit trust funds: Comparison with conventional unit trust funds'. Managerial Finance, 33, 142-153.
Adams, J. C. and Ahmed, P. (2012) 'The Performance of Faith-Based Funds'. The Journal of Investing, 22, 83-92.
Albaity, M. and Ahmad, R. (2011) 'Return performance and leverage effect in Islamic and socially responsible stock indices evidence from Dow Jones (DJ) and Financial Times Stock Exchange (FTSE)'. African Journal of Business Management, 5, 6927-6939.
Areal, N., Cortez, M. C. and Silva, F. (2010) 'Investing in Mutual Funds: Does it Pay to be a Sinner or a Saint in Times of Crisis?'. University of Minho,(September 13, 2010).
Bauer, R., Derwall, J. and Otten, R. (2007) 'The Ethical Mutual Fund Performance Debate: New Evidence from Canada'. Journal of Business Ethics, 70, 111-124.
Bauer, R., Koedijk, K. and Otten, R. (2005) 'International Evidence on Ethical Mutual Fund Performance and Investment Style'. Journal of Banking and Finance, 29, 1751-1767.
Bauer, R., Otten, R. and Rad, A. T. (2006) 'Ethical Investing in Australia: Is There a Financial Penalty?'. Pacific-Basin Finance Journal, 14, 33-48.
Beer, F. M., Estes, J. P. and Munte, H. J. (2011) 'The performance of the faith and ethical investment products: an empirical investigation of the last decade'. The Journal of the Academy of Business and Economics.
Benson, K. L., Brailsford, T. J. and Humphrey, J. E. (2006) 'Do Socially Responsible Fund Managers Really Invest Differently?'. Journal of Business Ethics, 65, 337-357.
BinMahfouz, S. and Hassan, M. K. (2012) 'A comparative study between the investment characteristics of Islamic and conventional equity mutual funds in Saudi Arabia'. The Journal of Investing, 21, 128-143.
Boasson, E., Boasson, V. and Cheng, J. (2006) 'Investment principles and strategies of faith-based funds'. Managerial Finance, 32, 837-845.
Cortez, M. C., Silva, F. and Areal, N. (2012) 'Socially responsible investing in the global market: the performance of US and European funds'. International Journal of Finance & Economics, 17, 254-271.
Eurosif 2008. European SRI Study. In: FORUM, E. S. A. R. I. (ed.). Oxford University Press. Eurosif 2012. European SRI Study. Oxford University Press. Ferruz, L., Muñoz, F. and Vargas, M. (2012) 'Managerial Abilities: Evidence from Religious
Mutual Fund Managers'. Journal of Business Ethics, 105, 503-517. Ghoul, W. and Karam, P. (2007) 'MRI and SRI Mutual Funds: A Comparison of Christian,
Islamic (Morally Responsible Investing), and Socially Responsible Investing (SRI) Mutual Funds'. The Journal of Investing, 16, 96-102.
Gillet, P. (2009) 'La mesure de performance des fonds éthiques et vicieux' in: BERNARD PRAS (ed.) Management, enjeux de demain (Paris: Vuibert).
Gillet, P. and Salaber, J. 2015. Are Ethical Funds More Resistant to Crisis than Conventional funds? Working Paper: University of Westminster.
Girard, E. C. and Hassan, M. K. (2008) 'Is There a Cost to Faith-Based Investing: Evidence from FTSE Islamic Indices'. The Journal of Investing, 17, 112-121.
Girard, E. C., Rahman, H. and Stone, B. A. (2007) 'Socially responsible investments: Goody-two-shoes or bad to the bone?'. The Journal of Investing, 16, 96-110.
23
Gregory, A., Matatko, J. and Luther, R. (1997) 'Ethical Unit Trust Financial Performance: Small Company Effects and Fund Size Effects'. Journal of Business Finance & Accounting, 24, 705-725.
Gregory, A. and Whittaker, J. (2007) 'Performance and performance persistence of ‘ethical’unit trusts in the UK'. Journal of Business Finance & Accounting, 34, 1327-1344.
Hawken, P. 2004. Socially Responsible Investing: How the SRI Industry has Failed to Respond to People who Want to Invest with Conscience and what can be Done to Change it. In: INSTITUTE, N. C. (ed.).
Hayat, R. and Kraeussl, R. (2011) 'Risk and return characteristics of Islamic equity funds'. Emerging Markets Review, 12, 189-203.
Hoepner, A. G. F., Rammal, H. G. and Rezec, M. (2011) 'Islamic mutual funds’ financial performance and international investment style: evidence from 20 countries'. The European Journal of Finance, 17, 829-850.
Hussein, K. (2004) 'Ethical investment: empirical evidence from FTSE Islamic index'. Islamic Economic Studies, 12, 21-40.
Hussein, K. Islamic investment: evidence from Dow Jones and FTSE indices. Islamic Economics and Finance, 2007. 387.
Hussein, K. and Omran, M. (2005) 'Ethical Investment Revisited: Evidence from Dow Jones Islamic Indexes'. The Journal of Investing, 14, 105-126.
Jaufeerally, R. Z. (2011) 'Islamic Banking and Responsible Investment: Is a Fusion Possible?' in: VANDEKERCKHOVE, W., LEYS, J., ALM, K., SCHOLTENS, B., SIGNORI, S. & SCHAFER, H. (eds) Responsible Investment in Times of Turmoil. Springer).
Jensen, M. C. (1968) 'The performance of mutual funds in the period 1945–1964'. The Journal of Finance, 23, 389-416.
Jouini, E. and Pastré, O. (2009) La Finance Islamique - Une solution à la crise? (Paris: Economica).
Leite, P. and Cortez, M. C. (2014) 'Style and performance of international socially responsible funds in Europe'. Research in International Business and Finance, 30, 248-267.
Liston, D. P. and Soydemir, G. (2010) 'Faith-based and sin portfolios: An empirical inquiry into norm-neglect vs norm-conforming investor behavior'. Managerial Finance, 36, 876-885.
Mansor, F. and Bhatti, M. I. (2011) 'Risk and return analysis on performance of the Islamic mutual funds: evidence from Malaysia'. Global Economy and Finance Journal, 4, 19-31.
Nofsinger, J. and Varma, A. (2014) 'Socially responsible funds and market crises'. Journal of Banking & Finance, in press.
Novethic 2009. Finance Islamique et ISR : Convergence Possible ? Novethic working paper. Renneboog, L., Ter Horst, J. and Zhang, C. (2008) 'The Price of Ethics and Stakeholder
Governance: Performance of Socially Responsible Mutual Funds'. Journal of Corporate Finance, 14, 302-322.
Renneboog, L., Ter Horst, J. and Zhang, C. (2012) 'Money-Flows of Socially Responsible Investment Funds around the World' in: BAKER, H. K. & NOFSINGER, J. R. (eds) Socially Responsible Finance and Investing: Financial Institutions, Corporations, Investors, and Activists. Wiley).
Salaber, J. (2010) Ethique et Toc: Promesses et Performances de l’Investissement Socialement Responsable: Editions Universitaires Européennes).
Schroder, M. (2004) 'The Performance of Socially Responsible Investments: Investment Funds and Indices'. Financial Markets and Portfolio Management, 18, 122-142.
Sharpe, W. F. (1966) 'Mutual fund performance'. Journal of business, 39, 119-138.
24
SIF 2007. Report on Socially Responsible Investing Trends in the United States. In: FORUM, S. I. (ed.) www.socialinvest.org.
Smith, W. C. 2013. Investing your values. World Magazine, 15 June 2013. Statman, M. (2000) 'Socially Responsible Mutual Funds'. Financial Analysts Journal, 56, 30-
39. Statman, M. (2006) 'Socially responsible indexes: composition, performance and tracking
error'. Journal of Portfolio Management, 32, 100-109. Treynor, J. L. (1965) 'How to rate management of investment funds'. Harvard business review,
43, 63-75. Walkshäusl, C. and Lobe, S. (2012) 'Islamic investing'. Review of Financial Economics, 21,
53-62.