the recreational value of forests in a transition economy anna bartczak, tomasz Żylicz...
Post on 22-Dec-2015
212 views
TRANSCRIPT

The recreational value of forests in a transition economy
Anna Bartczak, Tomasz Ż[email protected], [email protected]

Popular perception (FAO/UNECE 2005)
Annual forest visitation patterns[benefits in Euro per person]
Region
West Europe East Europe
Number of visits 6.5 2.5Benefit from a single visit 1.00 0.25
Total benefits 6.50 0.63

This perception is blatantly inaccurate!
Both:
the number of visits,
benefits derived from a single visit
seem to be much higher in Poland

General information on forests and forestry in Poland
The forest area: 9.2 million hectares = 28.4% of the Polish territory (the average share of forest area in Europe is 31.1%)
The average age of the forest stand is 60 years
67% of forest stands are coniferous forest types
Forest ownership: 82.5% State-owned forests. Almost all of these are managed by the State Forest Enterprise (SFE)

Description of conducted surveys
Characteristics:Surveys
1 2
PlaceOn-site in 10 selected forests
In respondents’ homes
Time October 2005 November 2005
Sample N=1002 N=1005
Method of interviews Face-to-face Face-to-face
InterviewersProfessional polling agency
Professional polling agency
Aim of surveyWTP/NCS per visit in a forest site
Total annual number of visits to forest sites in Poland

Location of selected sites

Description of the forest sites
No Name of the siteConservation
regimeOwnership Location
Sample size
1 Bialowieza Forest National Park Treasury NE 101
2 Barbarka (Torun) None SFE NW 100
3 Kampinoski (Warsaw) National Park Treasury C 100
4 Swierklaniec None SFE SW 101
5 Zielona Gora None SFE SW 100
6 Piatkowski (Poznan) None Municipal W 100
7 Krzeszowice None SFE SE 100
8 Kudypy None SFE NE 100
9 Kozienice None SFE C 100
10 Tucholskie Forest „Promotional” SFE NW 100
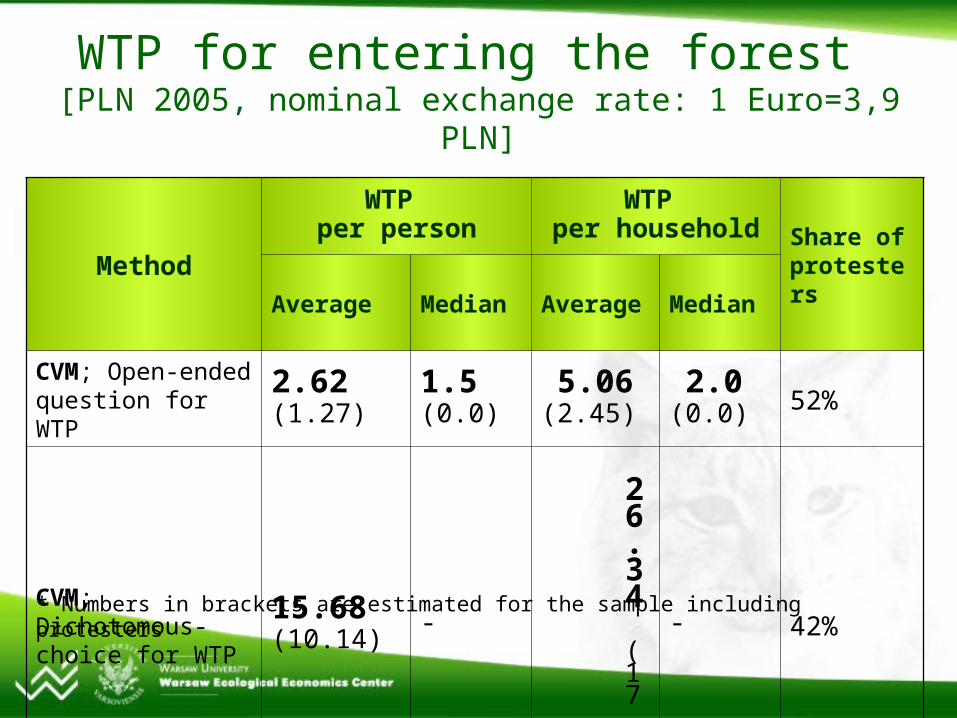
WTP for entering the forest [PLN 2005, nominal exchange rate: 1 Euro=3,9 PLN]
Method
WTP per person
WTP per household Share of
protestersAverage Median Average Median
CVM; Open-ended question for WTP
2.62 (1.27)
1.5(0.0)
5.06 (2.45)
2.0 (0.0) 52%
CVM; Dichotomous-choice for WTP
15.68 (10.14)
- 26.34 (17.34)
- 42%
TCM; Average NCS
(log-log function)20.54 - 35.42 - -
* Numbers in brackets are estimated for the sample including protesters

Other results
Survey 1 2 SFE*
Frequency of recreational visits
Average=56Median=12
Average=41Median=17
-
Share of recreational visits in the total number of visits 91% 85% -
The average length of a recreational visit 2 hours -
Share of population visiting forests
- 85% 82%
* The survey conducted by the State Forest Enterprise (SFE) in 2003.

Explanation of the results achieved (a hypothesis)
The relationship between the income level and the demand for forest recreation is not a monotonic one (even though richer people may reveal a higher WTP for a single visit to a forest, they go there less frequently) Consequently, the per capita value of the forest in a less developed country may turn out to be higher than in a more developed one
But:
No international data to verify this hypothesis

Weaker hypotheses verified on Polish data only
An existence of an inverted U- (or V-) shaped relationship between the annual value of recreational function of forests and the income level
Respondents from cities visit the forest less frequently than those from the rural areas.

Models
Annual demand per visitor defined as:
D = iBiXi
Model 1:
Demand = ln ((TC x (annual number of visits))
Model 2:
Demand = (Open-Ended WTP) x (annual number of visits)

Impact of the extreme income groups on the demand for visits (TC) – model 1
Variables (X) Coefficient (B) Standard error Number of
observationsSignificance
level
Constant 4.123 0.255 714 0.000
Forest2 1.191 0.331 78 0.000
Forest3 1.197 0.328 87 0.000
Forest4 0.979 0.339 69 0.004
Forest5 2.296 0.322 88 0.000
Forest6 1.339 0.335 74 0.000
Forest7 0.908 0.340 69 0.008
Forest8 -0.857 0.347 63 0.014
Forest9 1.477 0.344 65 0.000
Forest10 1.218 0.381 86 0.001
Rural 0.595 0.247 152 0.016
Lowest income 0.541 0.177 156 0.002
Highest income -0.981 0.391 26 0.012
R2=0.185

Impact of the extreme income groups on the demand for visits (CV-OE) – model 2
Variables (X) Coefficient (B) Standard error Number of
observationsSignificance
level
Constant -7.021 32.487 212 0.829
Forest2 132.033 51.483 21 0.011
Forest3 48.813 46.542 29 0.295
Forest4 -4.442 56.475 22 0.937
Forest5 127.283 48.633 25 0.010
Forest6 91.975 53.968 16 0.090
Forest7 49.258 66.310 9 0.458
Forest8 35.563 43.881 34 0.419
Forest9 142.681 49.087 23 0.004
Forest10 78.903 60.533 23 0.194
Rural 130.432 44.614 37 0.004
Lowest income 12.704 31.599 42 0.688
Highest income 21.713 75.701 6 0.775
R2=0.148

Key results
The value of a single trip in Poland, whether solicited in a CV survey or computed from TC – is closer to 1 EUR (which is typical of Western Europe) than to 0.25 EUR (attributed to Eastern Europe).
The annual number of visits is much higher than estimated for Western Europe (6.5) and even more than the one assumed for Eastern Europe (2.5) by the authors of the international forestry report UNECE/FAO, 2005
The rural population (which in Poland makes up 38% of the total) reveals a larger demand for forest visits than the urban one.
The lowest income group may reveal (depending on the model applied) a larger demand for the same amenity than the highest one.

Alternative explanations(directions for further research)
Overestimation of demand for forest recreation,
Geographical variations in the demand for forest recreation:• Social and historical circumstances => habits
and customs,• Availability of forest recreation resulting from
urbanisation patterns,• Quality of forest ecosystems,
The demand for forest recreation may depend on the availability of public forest areas.