the regional distribution of cap & trade auction funds
TRANSCRIPT

1107 9th Street, Suite 501, Sacramento CA 95814 916-538-6091
The Regional Distribution of Cap & Trade Auction Funds
March 17, 2015

About Andrew Chang & Company, LLC:
Based in Sacramento, California, Andrew Chang & Company provides fiscal, economic,
policy and management consulting services to Fortune 1000 companies, government
agencies, trade associations and non-profits throughout California and the nation. We
work closely with our clients to develop deep understandings of our clients’ unique
needs and situations. Our team of highly experienced consultants brings together best-
in-class research, advanced analytics and unique insights to produce practical solutions
and tangible results.

The Regional Distribution of Cap & Trade Auction Funds 1
The Regional Distribution of Cap & Trade Auction Funds Table of Contents
Section Page
Key Findings 2
1. Background 3
2. Results 6
3. Fair Share 15
4. Methodology 23
5. Conclusion 37
Appendix 1: Distributions 39
Appendix 2: Fair Share Estimates 48
Appendix 3: Program Estimates 49
Appendix 4: Literature Review – Revenue Estimates 51
Appendix 5: CalEnviroScreen 52

The Regional Distribution of Cap & Trade Auction Funds 2
The Regional Distribution of Cap & Trade Auction Funds
(Key Findings)
Cap-and-Trade auctions will conservatively generate approximately $16 billion
for state programs through 2020, leveling off at $2.7 - $2.8 billion starting in
2015/16. To date, all current vintage allowances offered at auction have been
sold, averaging ten percent over the reserve price
Approximately $6 billion of forecasted Cap-and-Trade revenues through 2020 are
not programmed for specific programs currently
Future budgets will need to account for 40% of program spending that is not
continuously allocated and approximately $1 billion in surplus from 2014/15 and
prior budget years
Cap-and-Trade revenues are primarily being spent in the southern Central
Valley, the San Francisco Bay Area and Southern California. Though there are
clear guidelines for geographically allocating 25% of the Cap-and-Trade
revenues, clear guidelines have not been established to geographically allocate
the remaining 75%. This report outlines three potential principles for allocating
the remaining funds geographically
− Depending on the methodology for geographically allocating funds utilized,
Los Angeles County appears receives $80 - $128 million less than its fair
share
− Conversely, the southern Central Valley, especially Fresno and Madera
Counties, is receiving more than its fair share, depending on the selected
methodology. Fresno receives a surplus of $94 - $111 million and Madera
receives $104 - $107 million. This is primarily due to short term spending
on High Speed Rail. High Speed Rail spending are expected to move over
time as sections of the system are completed
− Southern California, Contra Costa and the Sacramento area generally
appear to be underfunded and Bay Area counties, other than Contra
Costa, appear to operate at a surplus

The Regional Distribution of Cap & Trade Auction Funds 3
The Regional Distribution of Cap & Trade Auction Funds
1. Background
The State of California is approaching its 9th year of implementing Assembly Bill (AB)
32. The landmark initiative was signed into law in 2006 and created a first-in-the-nation
Cap-and-Trade program, under which many emitters of greenhouse gases (GHGs) are
required to purchase credits through quarterly auctions. The number of credits offered
for sale is reduced each year to force emissions reductions using market mechanisms.
In addition to resulting in lower emissions, Cap-and-Trade auctions have generated
$2.8 billion to date. The significant revenues generated through the auctions are being
allocated to programs for the first time in the 2014-15 budget, including Public and
Independent Utilities as well as 20 programs distributed across 12 departments. In
dispersing these funds, the programs are guided by Senate Bill (SB) 535 (DeLeon). SB
535 requires that at least 25% of these Cap-and-Trade funds be invested for the benefit
of the State's most disadvantaged communities. In addition, at least 10% of those funds
must be for projects located within the communities themselves. Further, the Brown
Administration has indicated that it views the requirements established by SB 535 as
minimum standards and that disadvantaged communities will likely receive more of
those funds.
Most state government programs receiving Cap-and-Trade revenue funds are
dispersing them through competitive processes. Currently, only a very small portion of
the program funds have been distributed and most remain in the early planning or
procurement stages. Inasmuch, there is currently significant uncertainty as to which
exact communities will receive funds through Cap-and-Trade. In order to inform the
decision making process, policymakers have requested preliminary estimates on how
current policy favors the geographic distribution of Cap-and-Trade revenues.
Andrew Chang & Company, a Sacramento based economic and management
consulting firm, has been retained to assess how current policy favors geographic
distribution of Cap-and-Trade funds. While we acknowledge that it is extremely early in
the process and significant uncertainty exists, we have undertaken a rigorous process
to ensure this report best reflects current policy.
Approach
We completed this engagement through a four phase approach. This approach
incorporated standard research and analytic methodologies and focused heavily on
engaging programmatic experts at ARB and each of the funded agencies. Figure 1.1
provides an overview of this approach.

The Regional Distribution of Cap & Trade Auction Funds 4
Figure 1.1
Approach Overview
This approach is designed to identify how much funding is likely to be generated, what
programs are likely to receive funding and which regions of the state are favored or
disfavored by current policy. While uncertainty exists as to auction settlement prices,
future budgetary choices and specific spending, this document is intended to provide
policy makers with information to support their participation in the process. In designing
the report for this purpose, we have: used very conservative future revenue estimates,
which are most appropriate for budgeting purposes; chosen to make no assumptions
about future budgetary decisions; and focused on the inherent governing dynamics for
each program.
Acknowledgements
In developing this report, we have discussed the programs and our methodology with a
number of individuals.
− Air Resources Board Cynthia Marvin, Division Chief Shelby Livingston, Branch Chief Jennifer Gress, Legislative Director
− High Speed Rail Authority Jason Kimbrough, Deputy Director Boris Lipkin, Deputy Director
− CalTrans Jila Priebe, Office Chief
− Department of Food and Agriculture Carla Sanchez, Special Assistant to the Secretary, Climate Change
− Department of Community Services Development Leisa Maestretti, Acting Deputy Director
− California Energy Commission Marcia Smith, Manager, Local Assistance and Financing

The Regional Distribution of Cap & Trade Auction Funds 5
− Strategic Growth Council Allison Joe, Deputy Director
− Department of Water Resources Joe Yun, Program Manager Craig Cross, Project Manager
− California Department of Fish and Wildlife Helen Birss, Branch Chief
− Legislative Analyst’s Office Ross Brown, Principal Fiscal & Policy Analyst
Though we are grateful for their guidance, insight and feedback on the development of
this report, their participation does not imply endorsement or concurrence on our
methodologies or findings of this report. We would like to thank these individuals for
providing substantive comments on the analysis.

The Regional Distribution of Cap & Trade Auction Funds 6
2. Results
In this chapter we provide the results of our analysis. This includes an estimate of the
revenue that is likely to be generated through Cap-and-Trade auctions through 2020, an
estimate of the programmatic distribution of these funds and an estimate of the
geographic distribution for the 2014-15 budget year.
Revenue Estimates
We have developed revenue estimates for AB 32 Cap-and-Trade auctions. These
auctions build off of the results of the nine auctions completed to date. Figure 2.1 shows
how the great majority of allowances offered for auction have been sold. All current
vintage allowances have been sold. A large number of future vintage allowances went
unsold in the initial auction but only a small number have gone unsold since. These
unsold allowances will be offered again in future auctions.
Figure 2.1
Auction Allowances Sold
Auction settlement prices have varied from one auction to the next. Current vintage
allowances have always sold for more than the reserve price but have varied from
$10.09 to $14.00 per ton. Future vintage allowances have remained more stable and
have generally remained very close to the reserve price. Figure 2.2 provides settlement
prices of each auction to date.

The Regional Distribution of Cap & Trade Auction Funds 7
Figure 2.2
Auction Settlement Price
We estimate that the AB 32 auctions will generate $16.0 billion through 2020. This
includes approximately $1.1 billion generated through the nine auctions to date, as well
as an estimated $15.0 billion over future auctions. Annual revenue is likely to increase
significantly through 2015/16, once the cap is fully in effect, and level off moving forward
as a tightening cap is largely balanced by increasing allowance prices. Figure 2.3 shows
the estimated revenue by budget year. As described in more detail below, this should
be considered an extremely conservative estimate. The solid blue line, Current Law –
Extended, represents our baseline. This assumes that ARB proceeds as currently
planned but that the auction and associated sale of future vintage allowances continues
past 2020. The blue dashed line, Current Law, assumes current policy prevails and the
auction is not extended, resulting in a significant drop-off in the last few years. The solid
gray line, Price Floor – Extended, assumes that allowances are sold at the price floor
and the auction is extended past 2020. The dashed gray line, Price Floor, assumes
allowances are sold at the price floor but the auction is not extended.

The Regional Distribution of Cap & Trade Auction Funds 8
Figure 2.3
State Auction Revenues (by budget year)
Conservative Estimate
Approximately $700 million in state funds was generated in 2012/13 and 2013/14
budget years. We estimate an additional $1.6 billion will be generated in the 2014/15
budget year. This includes $100 million in August, 2014 and $140 million in the
November, 2014 auctions as well as an additional $1.4 billion in the remaining two
auctions. This significant increase is due to the fact that ARB plans to auction
significantly more current vintage allowances in these auctions. We estimate the
amount available in future years will increase significantly as the cap broadens to cover
more areas and fewer credits are allocated freely.1
This should be considered a very conservative estimate. It is possible, and many
believe quite likely, that auction settlement prices will grow rapidly as the cap tightens.2
While this methodology likely underestimates the costs to California businesses, it
represents a reasonable basis for budgeting given the substantial potential harms of
overestimating revenue.
To develop this estimate, we start with the number of allowances that ARB has stated
that it plans to make available for purchase at each auction.3 We then estimate unique
1 California Air Resources Board (2013) Estimate of State-Auctioned Allowances by Fiscal Year.
Retrieved from: http://www.arb.ca.gov/cc/capandtrade/stateauction.pdf 2 Legislative Analyst’s Office (2012) The 2012–13 Budget: Cap–and–Trade Auction Revenues. Retrieved
from: http://www.lao.ca.gov/analysis/2012/resources/cap-and-trade-auction-revenues-021612.aspx 3 California Air Resources Board (2013) Estimate of State-Auctioned Allowances by Fiscal Year.
Retrieved from: http://www.arb.ca.gov/cc/capandtrade/stateauction.pdf

The Regional Distribution of Cap & Trade Auction Funds 9
settlement prices for both the current and future vintage allowances. We base this
estimate on the auction results to date. We calculate the ratio between reserve and
settlement prices for each auction to date to find the average for both current and future
vintages. This showed that current vintage allowances have averaged ten percent
above the reserve price and future vintage allowances have averaged one percent
above the reserve price. We calculate the reserve price using the formula described in
policy, which is an increase of five percent plus inflation each year. We use Department
of Finance estimates for 2015-20174 and assume two percent inflation thereafter.
Program Spending Estimates
In Figure 2.4, we detail estimates of program spending to date. The largest share is
directed to utilities. AB 32 allocates credits for free to electrical distribution utilities to
protect rate payers from sudden increases in the electricity bills (Sections 95870(d),
95890 and 95892). The Public Utilities Commission (PUC) has directed the utilities to
return 85% of the revenue generated by these to rate payers. The remaining 15% may
be directed towards investments in GHG reductions.
To date, nearly two-thirds of the credits auctioned have been consigned by the state’s
utilities, primarily the large Investor Owned Utilities (IOU), with the smaller Public
Owned Utilities (POU) receiving about 10%. The State of California has generated $1.1
billion to date, mostly from the sales of future vintage credits, which are not consigned.
4 California Department of Finance (2014) Consumer Price Index (CPI) Forecast. Retrieved from:
http://www.dof.ca.gov/html/fs_data/LatestEconData/FS_Forecasts.htm

The Regional Distribution of Cap & Trade Auction Funds 10
Figure 2.4
Auction Revenues by Recipient, To Date
We estimate utilities will receive an average of 34% of the state auction revenues, while
state programs will receive 66%. This portion could change if ARB decided to allocate
fewer or more allowances freely.
Among state programs, current law establishes continuous appropriation for four
programs: High Speed Rail (25%); Affordable Housing & Sustainable Communities
(20%); Transit & Intercity Rail Capital Program (10%); and Low Carbon Transit
Operations (five percent), which combine for 60% of the state’s share of auction
revenues. The remaining 40% is to be allocated annually to programs, which may or
may not include programs funded in the 2014-15 budget year. This breakdown is
detailed in figure 2.5.

The Regional Distribution of Cap & Trade Auction Funds 11
Figure 2.5
Future Allocation of State Funds
(Current Law - Extended)
Unallocated Funds
Our analysis suggests that the AB 32 auctions have collected significant funding that
as-yet remains unallocated. The auctions have or will generate $2.3 billion in 2014-15
and prior budget years. This analysis assumes that all credits are sold at the minimum
reserve price in the two remaining 2014-15 auctions.
Of the $2.3 billion, the state allocated $70 million towards programs in the 2013-14
budget and loaned an additional $400 million to the General Fund. Additionally, the
state allocated $830 million towards program in the 2014-15 and anticipates repayment
of $100 million from the prior year’s loan.5 This totals $1.2 billion in spending and
outstanding loans. As a result, approximately $1.1 billion appears to remain unallocated
to date. While a certain amount of budgetary prudence is in order, given that a large
portion of the remaining funds has not yet been realized, the auctions have proven a
reliable and stable source of funding to date.
Additionally, the Legislative Analyst’s Office (LAO) notes that the Governor’s 2014-15
Proposed Budget will likely generate a substantial surplus. The budget calls for $1
billion in spending, however the LAO estimates that the auctions will generate over $2.3
billion in revenue. They write, “Based on our preliminary analysis of different factors
(such as the outcomes of prior auctions), it is likely that the state will sell most or all of
5 California Air Resources Board (2014) Greenhouse Gas Reduction Fund Programs. Retrieved from:
http://www.arb.ca.gov/cc/capandtrade/auctionproceeds/summaryproceedsappropriations.pdf

The Regional Distribution of Cap & Trade Auction Funds 12
the allowances offered for sale in 2015-16. Therefore, state auction revenue will likely
be significantly higher than what is assumed in the budget.”6 As the Legislature
considers the 2015-16 Budget, there is likely over $2 billion in additional auction funds
that could be programmed.
Geographic Distribution Estimates
Our estimates show the potential distribution of State of California funds derived from
the Cap-and-Trade auctions. The programs receiving funding generally remain in early
stages of development, so there is significant uncertainty in these estimates. It should
be noted that these estimates should be read to show that policy, as currently written,
favors this estimated distribution. As the funding is distributed there will be variation
due to:
The relative quality of applications programs receive;
Local governments, service providers and/or industries’ relative preparation to
make use of these funds;
A relatively small number of planned awards for many programs; and
Random chance and other unpredictable elements.
Figure 2.6 displays our assessment of the uncertainty of funding distribution. The
largest share has geographic certainty. We know with high confidence where these
funds are likely to be spent. This group primarily consists of IOU and POU funding, as
well as the very small amount of funding that has already been distributed. The second
largest group is program certainty. We know which programs these funds are directed
to but there remains significant uncertainty as to where, geographically, they will spend
the funds. The third group includes future funds that have not yet been allocated to
programs. We have not identified any basis for estimating their distribution.
6 Legislative Analyst’s Office (2015) The 2015-16 Budget: Overview of the Governor’s Budget. Retrieved
from: http://www.lao.ca.gov/reports/2015/budget/overview/budget-overview-2015.pdf

The Regional Distribution of Cap & Trade Auction Funds 13
Figure 2.6
Uncertainty of Funding Distribution
(Including future funds)
Because of the high degree of certainty and well established standard for distribution of
the IOU and POU funds and the excessive degree of uncertainty for future state
programs, our estimates focus on funds allocated in the 2014-15 budget year.
Our estimates indicate that the largest shares of funds are likely to be spent in Southern
California, the southern Central Valley and the San Francisco Bay Area. In the next
chapter we discuss context in which policy makers could consider this data to assess
whether this distribution is fair or otherwise appropriate. Figure 2.7 shows the
distribution graphically. For detailed figures, see Appendix 3.

The Regional Distribution of Cap & Trade Auction Funds 14
Figure 2.7
Estimate of Funding Distribution

The Regional Distribution of Cap & Trade Auction Funds 15
3. Fair Share
In this chapter, we provide context to help policy makers consider the estimates of the
distribution of funds. Current law does not provide guidance as to how much money
should be spent in the various communities in the state. Generally, the policies are
geographically agnostic, focusing primarily on the efficiency of reductions to be
achieved as well as SB 535 requirements to direct benefits to disadvantaged
communities, “shovel readiness” and other co-benefits that may be achieved.
The extent to which the guidelines designed for each program are appropriate or
effective in meeting the goals of AB 32 is beyond the scope of this report. Moreover, this
report is not meant to assess any individual program, only to provide context for the
geographic distribution of funds around the state.
We developed three models by which “fairness” could be estimated. In all case, we
assume that 25% should be distributed based on the disadvantaged population within
each community. The three models then take different approaches to estimating a fair
distribution of the remaining 75%.
The first model is population based and assumes funds should be distributed evenly per
capita. The second is reductions based – focusing on the potential for reductions in
each community. The third is payor based – focusing on the amount entities within each
community likely paid towards the fund.
In the balance of this chapter, we describe the data used to estimate each model,
provide a graphic representation of the fair share distribution of funds generated by
each model and a graphic representation of the gap between estimated spending and
each county’s fair share. For specific figures in each county, please see Appendix 3.
SB 535
SB 535 was authored by Senator Kevin de Leon and signed into law by Governor Jerry
Brown in 2012. SB 535 is based on the idea that “AB 32 requires that public and private
investment be directed toward the most disadvantaged communities in California to
provide an opportunity for small businesses, schools, affordable housing associations,
and other community institutions to participate in and benefit from statewide efforts to
reduce GHG emissions,”7 but that it does not define or create a mechanism for
implementing this principle.
7 De Leon, K. (2012) SB-535 California Global Warming Solutions Act of 2006: Greenhouse Gas
Reduction Fund

The Regional Distribution of Cap & Trade Auction Funds 16
It is the purpose of SB 535 to provide guidance in the distribution of Cap-and-Trade
funds to ensure that environmentally disadvantaged communities receive the benefits a
significant share of auction revenue. 25% of funds are required to benefit disadvantaged
communities, with a minimum of 10% being spent directly in those communities. To
implement this, it directs CalEPA to identify communities that are:
a. “Areas disproportionately affected by environmental pollution and other hazards
that can lead to negative public health effects, exposure or environmental
degradation.
b. “Areas with concentrations of people that are of low income, high unemployment,
low levels of homeownership, high rent burden, sensitive populations, or low
levels of educational attainment.”8
To operationalize this, ARB has chosen the CalEnviroScreen tool to identify
disadvantaged communities. CalEnviroScreen is a methodology that combines the
pollution burden faced by a community with population characteristics that result in
increased vulnerability to pollutants.
Pollution burdens include:
Ozone concentrations
PM2.5 concentrations
Diesel PM emissions
Pesticide use
Drinking water contaminants
Toxic releases from facilities
Traffic density
Cleanup sites
Groundwater threats
Hazardous waste
Impaired water bodies
Solid waste sites and facilities
Population characteristics include:
Children and elderly
Low birth-weight births
Asthma emergency department visits
Educational attainment
Linguistic isolation
8 De Leon, K. (2012) SB-535 California Global Warming Solutions Act of 2006: Greenhouse Gas
Reduction Fund

The Regional Distribution of Cap & Trade Auction Funds 17
Poverty
Unemployment
These factors are combined to create a score for each census tract. The 25% of census
tracts with the highest scores are considered disadvantaged for purposes of SB 535.
For purpose of our Fair Share estimates, we operationalize this by calculating the share
of the overall population living in CalEnviroScore top 25% census tracts in each county.
The distribution is shown in figure 3.1.
Figure 3.1
Disadvantage Population Distribution
SB 535 requires that 25% of funds be spent to benefit these communities, while only
10% is required to be within the communities themselves. Our analysis is focused on
counties. As such, we assume that funds that benefit a given community may be spent
in a nearby community but that they will generally be spent within the same county.
Population Based Model
The Population Base Model is based on the concept that the most fair distribution is one
that is equal per capita, that each community should receive funding based on how
many people reside in it. This approach treats all communities equally but in doing so
does not advance any other policy goals.

The Regional Distribution of Cap & Trade Auction Funds 18
Figure 3.2
Fair Share Map: Population Based Model
The distribution in this model closely mirrors the population distribution of the state of
California. The largest share falls in coastal Southern California. The San Francisco Bay
Area also receives a large share. SB 535 causes a somewhat larger share to fall in Los
Angeles and inland counties.
Figure 3.3
Spending Gap Map: Population Based Model

The Regional Distribution of Cap & Trade Auction Funds 19
There are significant gaps between the population based model and the estimated
distribution. While Southern California is expected to receive a large portion of the
funding, we estimate it will receive far less than the model would indicate it should. Los
Angeles has the largest gap ($95 million) while its neighbors range from $10 million
(Ventura) to $29 million (Orange). Sacramento ($17 million) and San Joaquin ($10
million) Counties are also moderately underfunded.
By contrast, we estimate the southern Central Valley will receive a significantly larger
share of funding. Fresno and Madera counties are particularly over funded, with a gap
of $94 million and $104 million respectively. This is primarily due to short term spending
while constructing the initial segment of the High Speed Rail. As the project continues,
spending will migrate towards Los Angeles and the Bay Area.
Butte County ($9 million) is also considered overfunded due to the spending on
improvements at the Oroville Dam in the small county.
Reductions Based Model
The Reductions Based Model is based on the concept that the most efficient distribution
is one that focuses on the potential for reducing emissions. This approach focuses on
the policy goal of maximizing GHG reductions. We use ARB’s dataset on covered
emissions as a proxy for potential reductions. This does not include mobile sources,
which we believe is appropriate because they have not been covered by the cap to
date.
Figure 3.4
Fair Share Map: Reductions Based Model

The Regional Distribution of Cap & Trade Auction Funds 20
The distribution in this model is less widespread than the population based model.
Potential reductions are concentrated in a small number of counties, including Los
Angeles, Contra Costa, Kern, San Bernardino and San Francisco. Sacramento, Orange
and San Diego Counties also have a moderate amount of potential reductions.
Figure 3.5
Spending Gap Map: Reductions Based Model
As one would expect, given the more concentrated distribution estimated by this model,
larger gaps result. Contra Costa ($131 million), Los Angeles ($128 million), Kern ($44
million) and San Francisco ($28 million) Counties are the most underfunded. These
counties have relatively large shares of potential reductions while normal to low shares
of estimated funding.
Fresno ($107 million) and Madera ($107 million) are again the most overfunded, with
Alameda ($28 million) and Tulare ($23 million) also falling in the top group.
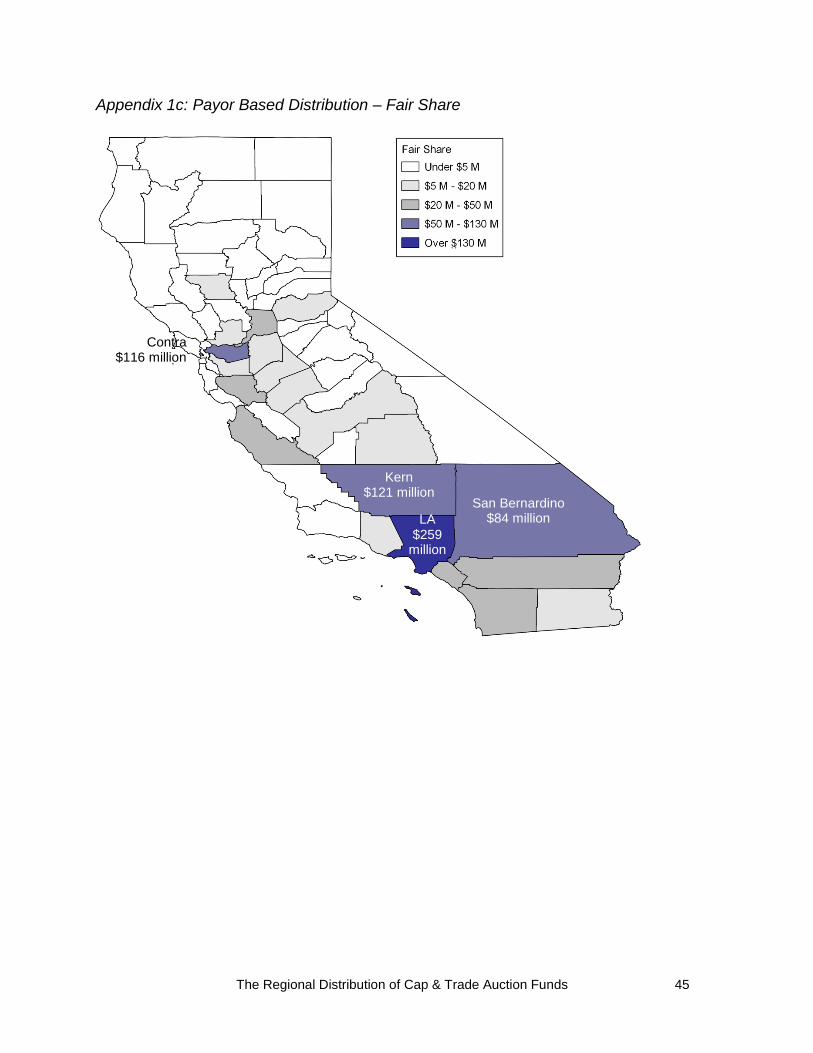
Payor Based Model
The Payor Based Model is based on the concept that the fairest distribution is one that
returns funds to the areas in which they were generated. This approach focuses on the
nexus between fee generation and spending. Since ARB has indicated that they will not
release data on entities purchasing auction credits, we use data on corporate emissions
as a proxy. We consider this most appropriate because transportation emissions have
not been under the cap to date and because utility emissions are effectively cost neutral
because of the credits that are given to them to protect against rate increases.

The Regional Distribution of Cap & Trade Auction Funds 21
Figure 3.6
Fair Share Map: Payor Based Model
The payor based model is fairly similar to the reductions based model. Estimated
auction spending is concentrated in Los Angeles, Kern, Contra Costa and San
Bernardino Counties. The most significant difference is San Francisco County, which is
estimated as being a relatively small payor but a relatively large potential reducer. This
is primarily due to the large amount of PG&E natural gas emissions ARB attributes to
San Francisco, which is captured in the potential reductions but not the payor model.

The Regional Distribution of Cap & Trade Auction Funds 22
Figure 3.7
Spending Gap Map: Population Based Model
With the exception of San Francisco, gaps are similar to the Reductions Based model.
Contra Costa ($97 million), Kern ($92 million), Los Angeles ($80 million) and San
Bernardino ($51 million) are again the most underfunded. Fresno ($110 million), Madera
($106 million), Alameda ($24 million) and Tulare ($21 million) are again the most
overfunded, this time joined by San Francisco ($22 million).

The Regional Distribution of Cap & Trade Auction Funds 23
4. Methodology
In order to estimate the distribution of spending for AB 32 auction funds overall, we
developed estimates for each of the programs. There is a significant amount of
uncertainty in this process because most of the programs remain in very early stages;
some do not yet even have guidelines. We developed a targeted methodology to
estimate the distribution for each of the programs.
We wish to draw the reader’s attention to two important factors to consider. First, in
most cases the methodology could be most accurately described as estimating the
potential distribution rather than the actual distribution. The potential distribution will be
broader than the actual dispersion of the funding. This is because most programs have
been allocated a relatively small amount of money relative to the size of the projects
they will fund. Due to these funding levels, they will only be able to fund a small number
of the very deserving projects that apply for funding. As a result, the areas that actually
receive funding will receive more funds than our estimates suggest while other areas
that potentially could have received funding will not receive any under that program.
This policy choice is based on the goal of maximizing impact. This is often best
achieved by concentrating funding in a smaller number of projects to ensure their
effectiveness. This methodology is appropriate for the goal of this report, which is to
estimate spending overall rather than for each specific program. There will likely be
more uncertainty with each program than with the overall estimate.
The second factor is the timing of this report. The great majority of funding under the
State’s AB 32 auction funded programs has yet to be spent. Much of it will be distributed
through competitive processes. While we can accurately assess the potential for a given
community (for example, if a community does not have an existing or restorable
wetland, it will not be able to successfully compete for funds related to wetlands
restorations) we cannot predict which projects will produce the most competitive
applications. In some cases the process and criteria for distribution of funds has been
determined. In many cases it has not. Despite the uncertainty, it is critical that this report
be produced at this point to facilitate policy makers’ participation in the process by
helping them understand which communities are favored by current policy.
Below we outline the methodology for each program, the data sources used and the
basis for this methodology. The methodologies for each program were developed by
first thoroughly reviewing any guidance documents that exist to date. As noted above,
the status of these guidance documents vary significantly by program, ranging from
finalized to not yet drafted. From this we developed a basic understanding of each
program and the data available from which to develop estimates. We then developed a
preliminary methodology for each program. We used this as the basis for further

The Regional Distribution of Cap & Trade Auction Funds 24
discussion with program staff. These discussions led to wholesale revision, nuanced
refinements and/or validation of the original model. The final methodology for each
program is detailed below.
Department of Community Services and Development
Low-Income Weatherization Program (LIWP): $75 million
LIWP expands the current program providing weatherization upgrades and solar
installations to low income communities with one significant shift. In the existing
program, funds are distributed based on low income population, energy costs and
regional climate. The AB 32 funded portion of the program will be limited to
disadvantaged communities as defined by CalEnviroScreen.
There is a requirement that 100% of funds be directed to benefit disadvantaged
communities.
There are two key aspects to estimating the distribution of funds: estimating need in
each county based on energy costs and weather; and directing funds solely to
disadvantaged communities.
In order to estimate local need for funds, we take guidance from the program’s previous
experience. To do this, we calculated the funds per capita each county received in
previous years. To combine this with the second component, we then multiplied the
previous per capita amount by the each county’s disadvantaged population. We then
used each county’s share of the resulting calculation to estimate the share of total
funding each should county should receive.
California Department of Community Services & Development (2012) Statewide
Weatherized Homes Breakout
CalEnviroScreen v2.0. 10/14

The Regional Distribution of Cap & Trade Auction Funds 25
California Department of Transportation
Low Carbon Transit Operations Program: $25 million
Funds are available to support transit operations to reduce GHG emissions and
improve mobility. This includes:
New/expanded bus, rail services or expanded intermodal transit facilities
Service or facility improvements, e.g. equipment, fueling and maintenance
Statute stipulates that funds are distributed, in part, based on existing transit and, in
part, based on population. The State Controller’s Office (SCO) has provided estimates
of eligibility for this funding.
We use the distribution calculated by the SCO as the basis for our estimate. In most
cases, the SCO assigns funds to a specific agency within a specific county. In these
cases, we simply use the distribution provided.
In a small number of cases, the SCO assigned funds to a multi-county body. In these
cases, we add two additional steps to estimate the distribution of funds within those
counties. The first step only applies in a single case – various Bay Area transit
agencies that are grouped together. For other cases we begin at step two:
1. We estimate funds will be divided between agencies based on farebox revenues
so that larger agencies receive more money and small agencies receive less
2. For agencies that cross county borders, we distribute between counties:
a. For rail agencies, we estimate funds will be distributed based on the
distribution of tracks within each county
b. For other agencies, we estimate funds will be distributed evenly between
counties
Expansion, enhancement and improvement of existing rail systems, including
new rail cars and locomotives, to increase ridership and service levels and
improve reliability
Improved connectivity of existing and future rail systems
Increased integration of rail and transit services, including integrated ticketing
Bus transit investments that increase ridership and reduce GHG emissions

The Regional Distribution of Cap & Trade Auction Funds 26
Strategic Growth Council9
Affordable Housing and Sustainable Communities (AHSC) Program: $120 million
AHSC is designed to reduce GHG emissions by improving mobility options and
increasing infill developments. It will fund two project types:
Transit Oriented Development Project Areas (TOD)
Integrated Connectivity Projects (ICP)
Additionally, there is a requirement that 50% of funds be directed to benefit
disadvantaged communities.
Based on the requirement that projects must include a qualifying transit line, we
assume that funds will be distributed based on the amount of existing transit in each
county. We estimate that 50% of funds will be distributed in this manner. Our proxy for
existing transit is data on farebox revenue.
Based on the disadvantaged requirement, we estimate that 50% of revenues will match
the CalEnviroScreen Top 25% distribution.
National Transit Database (2012) RY 2012 Database
CalEnviroScreen v2.0. 10/14
9 SGC staff expressed reservations about the methodology employed herein. Unfortunately, despite
numerous outreach attempts we were unable to discuss their concerns or receive any constructive feedback.

The Regional Distribution of Cap & Trade Auction Funds 27
Sustainable Agriculture Land Conservation(SALC) Program: $5 million
SALC is designed to make strategic investments to protect agricultural land. Protecting
these areas from development as urban or rural residential development.
Our methodology is based on identifying the amount of agricultural land that is at risk of
development. We estimate agricultural land at risk of development by multiplying the
portion of each county that is urbanized by its agricultural acreage. This combines the
two critical factors of the existence of agricultural land with the presence of residentially
developed areas in the county that can threaten it. Although the data used is “Urban”,
the data does not reflect the common usage of the term (a dense, central city) but
instead includes any area that with residential development, including suburbs and rural
towns.
Census (2010) Census Urban and Rural Classification and Urban Area Criteria
Farm Service Agency (2014) FSA Crop Acreage Data Reported to FSA

The Regional Distribution of Cap & Trade Auction Funds 28
Air Resources Board
Clean Vehicle Rebate Project (CVRP): $111 million
CVRP is designed to promote the purchase of battery electric, plug-in hybrid electric
and fuel cell vehicles. Rebates are available on an ongoing basis for eligible vehicles
within California.
This is an ongoing program. We assume the distribution will match the distribution in
previous years.
Center for Sustainable Energy (2014) CARB CVRP, Rebate Statistics. Updated
12/15/14
Hybrid and Zero-Emission Truck and Bus Voucher Incentive Project (HVIP): $10 million
HVIP provides vouchers to help California fleets purchase hybrid and zero-emission
trucks and buses. Rebates are available on an ongoing basis for eligible vehicles within
California.
This is an ongoing program. We assume the distribution will match the distribution in
previous years.
California Air Resources Board (2015) All redeemed vouchers with ARB funding
(inception through December 31, 2014) by Manufacturer and County
Pilot and Freight Demonstration Projects: $79 million
ARB has established several pilot projects to support the development of light-duty,
heavy-duty and advanced technologies. The programs are currently in workgroup
stage. Guidelines have not yet been developed.
There is a requirement that 100% of funds be directed to benefit disadvantaged
communities.
Based on the disadvantaged requirement, we estimate that 100% of revenues will
match the CalEnviroScreen Top 25% distribution.
Office of Environmental Health Hazard Assessment (2014) CalEnviroScreen
v2.0. 10/14

The Regional Distribution of Cap & Trade Auction Funds 29
California Energy Commission
Energy Efficiency in Public Buildings: $20 million
Loans will be made available to state agencies to improve state owned buildings to
generate energy savings that leads to reduced GHG emissions and saves sufficient
money to be used to repay the loans. Loans will be made based on a first come
application process.
Since funds are directed to state owned buildings our methodology assumes funding
will be distributed based on the square footage of state owned buildings. We
considered an alternate methodology that incorporated knowledge from specific
agencies that indicated where they may apply; however, we decided this may be less
reliable as these agencies may not win and it would be impossible to identify all
potential applicants.
Department of General Services (2014) Statewide Property Inventory. Received
11/24/14

The Regional Distribution of Cap & Trade Auction Funds 30
California State Transportation Agency10
Transit and Intercity Rail Capital Program: $25 million
The Transit and Intercity Rail Capital Program is designed to fund capital and
operational improvements of existing transit with the goals of reducing emissions,
expanding use, enhancing integration and improving safety. This includes:
Expansion, enhancement and improvement of existing rail systems, including
new rail cars and locomotives to increase ridership and service levels and
improve reliability
Improved connectivity of existing and future rail systems
Increased integration of rail and transit services, including integrated ticketing
Bus transit investments that increase ridership and reduce GHG emissions
Additionally, there is a requirement that 25% of funds be directed to benefit
disadvantaged communities.
Based on the requirement that funds be used to support and expend existing transit,
we assume that funds will be distributed, in part, consistent with the amount of existing
transit in each county. Our proxy for existing transit is data on farebox revenue.
Based on the disadvantaged requirement, we estimate that 50% of revenues will
match the CalEnviroScreen Top 25% distribution.
National Transit Database (2012) RY 2012 Database
CalEnviroScreen v2.0. 10/14
10
CalTrans staff expressed reservation with this methodology; however staff declined to provide additional detail or suggest alternatives.

The Regional Distribution of Cap & Trade Auction Funds 31
California Department of Food and Agriculture
Agricultural Energy and Operational Efficiency: $12 million
Grants to fund dairy digester development at livestock facilities. Livestock manure
produces GHG emissions. These gasses can be captured and processed to produce
fuel for electrical energy generation and transportation. Funding would be directed to
facilities that use the lagoon-based handling methods, which are primarily located in the
San Joaquin Valley.
Our methodology assumes funds will be limited to the San Joaquin Valley, based on
the advice of ARB and CDFA staff. Within this region, we estimate that it will be
distributed relative to each county’s share of cattle.
California Department of Food and Agriculture (2012) California Milk Production,
by County
Limited to San Joaquin Valley based on advice of ARB & CDFA staff
State Water Efficiency and Enhancement Program (SWEEP): $10 million
SWEEP provides competitive grant funding for financial assistance to agricultural
operations to implement water conservation measures that result in increased water
efficiency and reduced greenhouse gas emissions.
We assume the funds will be distributed relative to each county’s share of agricultural
water withdrawals.
United States Geological Survey (2010) Water Use Data for California

The Regional Distribution of Cap & Trade Auction Funds 32
Department of Water Resources (DWR)
Water-Energy Grant Program: $19 million
Provides funds to implement water efficiency programs or projects that reduce
greenhouse gas emissions and reduce water and energy use. In the competitive
process, applications are ranked based on Water Saved, Energy Saved and presence
in a disadvantaged community. Conversations with DWR staff indicate that there are far
more applicants than available resources. As such, it is likely that all or nearly all of the
funds will be awarded to projects in the top tier, which must be in disadvantaged
communities.
Based on the likelihood that all funds will be awarded to top tier applicants, we assume
funds will be distributed within disadvantaged communities.
Within these communities, we estimate distribution by multiplying county disadvantaged
population by county per capita water usage.
U.S. Geological Survey (2010) Water Use in the United States
Office of Environmental Health Hazard Assessment (2014) CalEnviroScreen
v2.0. 10/14
DWR staff indicated it is likely most or all funds may be directed to DA
communities based on the large number of applicants
Water-Energy Efficiency, Efficient hydro energy turbines: $11 million
More efficient turbines were installed at the Oroville dam.
We assume funds were distributed at the location of the installation.
Information provided by Air Resources Board staff

The Regional Distribution of Cap & Trade Auction Funds 33
Department of Fish and Wildlife
Wetlands and Watershed Restoration: $25 million
Funds projects that reduce GHGs and provide co-benefits such as enhancing fish and
wildlife habitat, protecting and improving water quality and quantity and helping
California adapt to climate change. Applications are based on efficacy of reducing GHG
and other co-benefits, verifiability of the reductions and qualifications of the proposer.
Our methodology assumes that these projects will most likely occur in areas where
existing projects have been proposed. This does not necessarily mean that the
proposed projects in the dataset will be funded but rather that the location of these
projects is representative of the potential for such projects. As such, we assume the
funds will be distributed relative to each county’s share of existing wetland project
proposals.
California Wetlands Monitoring Workgroup (CWMW) "Wetland Projects."
EcoAtlas

The Regional Distribution of Cap & Trade Auction Funds 34
Department of Forestry and Fire Protection (CalFire)
Forest Health Restoration and Reforestation: $24 million
Several grant programs are aimed at fire prevention and other aspects of strengthening
forests.
Limited data exists. Our initial methodology was to distribute funds based on qualified
projects; however CalFire indicated that they were unable to provide the data due to
limitations in the procurement process. The alternate methodology we implemented
was to assume funds will be distributed based on the distribution of forested areas. We
use CalFire’s Fire Hazard data as proxy for forested areas.
CalFire (2007) California Fire Hazard Severity Zone Map Update Project
Urban and Community Forestry Program GGRF Grants: $18 million
This category covers five grant programs, which include: urban tree planting; urban
forest management; urban biomass utilization; urban reclamation; and other forward
thinking projects.
There is a requirement that 100% of funds be directed to benefit disadvantaged
communities.
Limited directly relevant data exists. Our initial methodology was to distribute funds
based on qualified projects; however CalFire indicated that they were unable to provide
the data due to limitations in the procurement process. The alternate methodology we
implemented was to assume funds will be distributed based on the disadvantaged
requirements. We estimate that 100% of revenues will match the CalEnviroScreen Top
25% distribution.
Office of Environmental Health Hazard Assessment (2014) CalEnviroScreen
v2.0. 10/14
The Regional Distribution of Cap & Trade Auction Funds 35
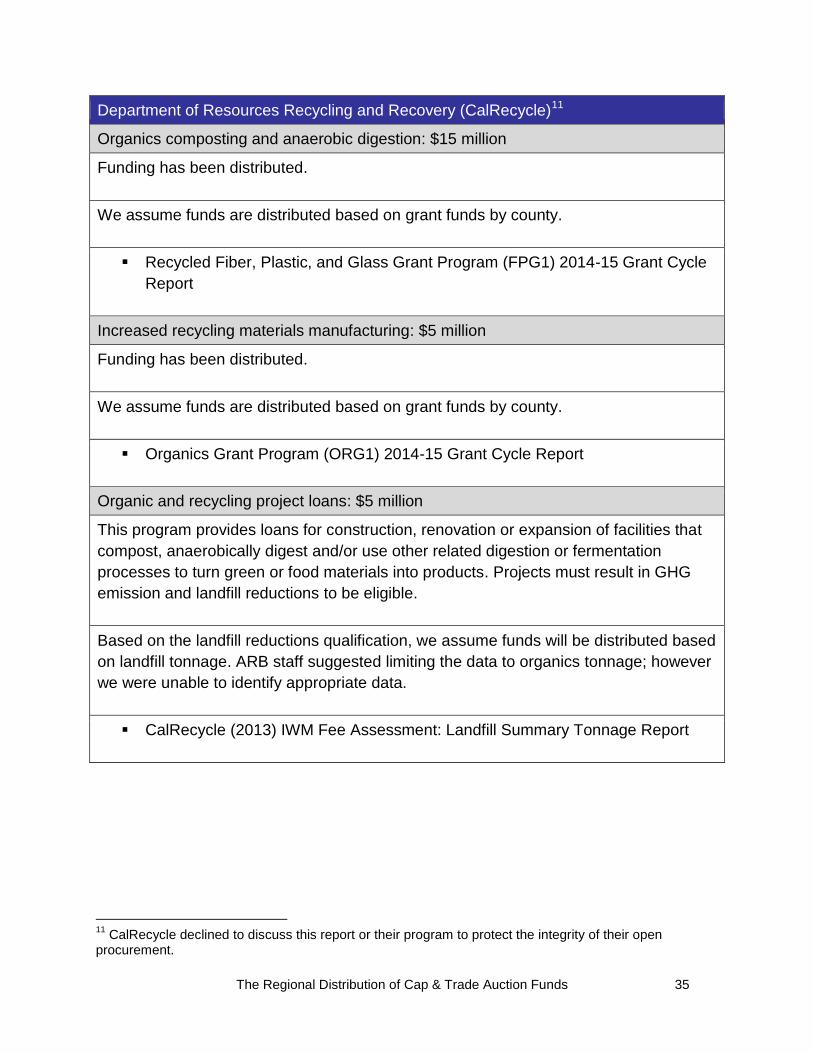
Department of Resources Recycling and Recovery (CalRecycle)11
Organics composting and anaerobic digestion: $15 million
Funding has been distributed.
We assume funds are distributed based on grant funds by county.
Recycled Fiber, Plastic, and Glass Grant Program (FPG1) 2014-15 Grant Cycle
Report
Increased recycling materials manufacturing: $5 million
Funding has been distributed.
We assume funds are distributed based on grant funds by county.
Organics Grant Program (ORG1) 2014-15 Grant Cycle Report
Organic and recycling project loans: $5 million
This program provides loans for construction, renovation or expansion of facilities that
compost, anaerobically digest and/or use other related digestion or fermentation
processes to turn green or food materials into products. Projects must result in GHG
emission and landfill reductions to be eligible.
Based on the landfill reductions qualification, we assume funds will be distributed based
on landfill tonnage. ARB staff suggested limiting the data to organics tonnage; however
we were unable to identify appropriate data.
CalRecycle (2013) IWM Fee Assessment: Landfill Summary Tonnage Report
11
CalRecycle declined to discuss this report or their program to protect the integrity of their open procurement.

The Regional Distribution of Cap & Trade Auction Funds 36
High Speed Rail Authority
High Speed Rail: $250 million
These funds are supporting construction of California’s High Speed Rail project.
Construction is currently underway. The initial segment is being constructed in Fresno
and Madera Counties. Subsequent Phase 1 segments are in the planning stages and
run from Los Angeles to San Francisco.
Based on guidance of HSRA staff, we assumed funds will be distributed as followed:
$191.4 million for construction, divided evenly between Fresno and Madera Counties
$58.6 million for planning and development, divided evenly between counties covered
by Phase 1
HSRA staff

The Regional Distribution of Cap & Trade Auction Funds 37
5. Conclusion
While significant uncertainty exists in every aspect of these estimates, it is likely that AB
32 Cap-and-Trade auctions will generate at least $16 billion for state programs through
2020 and could generate substantially more. While there are a number of reasonable
ways to consider how funds might be distributed fairly across the state, it appears that
current policy favors the southern Central Valley and several Bay Area counties but
disfavors several other counties, including Los Angeles County. As policy makers weigh
their options moving forward, these estimates may be helpful in shaping the discussion.
In addition, policy makers may wish to consider the implications of a significant surplus
in the enacted 2014-15 budget and the proposed 2015-16 budget.

The Regional Distribution of Cap & Trade Auction Funds 38
Appendix
‒ Appendix 1: Distributions
‒ Appendix 2: Fair Share Estimates
‒ Appendix 3: Program Estimates
‒ Appendix 4: Literature Review – Revenue Estimates
‒ Appendix 5: CalEnviroScreen

The Regional Distribution of Cap & Trade Auction Funds 39
Appendix 1: Distributions
Appendix 1a: Population Based Distribution – Fair Share
LA $273
million
San Bernardino $55 million
Orange $65 million
San Diego $56 million

The Regional Distribution of Cap & Trade Auction Funds 40
Appendix 1a: Population Based Distribution – Spending Gap
LA - $95 million
San Bernardino - $23 million
Riverside, - $24 million
San Diego - $25 million
Orange - $29 million
Sacramento - $17 million
Ventura - $10 million
San Francisco + $10 million
Madera + $104 million
Fresno + $94
million
San Joaquin - $10 million
Merced + $10 million
Tulare + $16
million
Kings + $6 million
Butte + $9 million

The Regional Distribution of Cap & Trade Auction Funds 41
Appendix 1a: Population Based Distribution – Spending Gap per capita
Trinity + $18
Butte + $41
Madera + $706
Fresno + $104 Merced
+ $41
Tulare + $37
Kings + $45
Sierra + $31
Modoc + $42

The Regional Distribution of Cap & Trade Auction Funds 42
Appendix 1b: Reductions Based Distribution – Fair Share
LA $307
million
San Bernardino $51 million
Kern $72 million
Contra Costa $150 million

The Regional Distribution of Cap & Trade Auction Funds 43
Appendix 1b: Reductions Based Distribution – Spending Gap
LA - $128 million
Kern - $44 million
Contra Costa - $131 million
San Francisco - $28 million
Madera + $107 million
Fresno + $107 million
Tulare + $23 million
Alameda + $28 million

The Regional Distribution of Cap & Trade Auction Funds 44
Appendix 1b: Reductions Based Distribution – Spending Gap per capita
Kern - $54
Contra Costa - $128
San Francisco - $36
Madera + $721
Fresno + $118
Tulare + $56
Alameda + $19
Merced + $55 San Mateo
+ $21
The Regional Distribution of Cap & Trade Auction Funds 45
Appendix 1c: Payor Based Distribution – Fair Share
LA $259
million
San Bernardino $84 million
Kern $121 million
Contra $116 million

The Regional Distribution of Cap & Trade Auction Funds 46
Appendix 1c: Payor Based Distribution – Spending Gap
Kern - $92 million
Contra Costa - $97 million San Francisco
+ $22 million
Madera + $106 million
Fresno + $111 million
Alameda + $24 million
LA - $80 million
San Bernardino - $51 million
Tulare + $22
million

The Regional Distribution of Cap & Trade Auction Funds 47
Appendix 1c: Payor Based Distribution – Spending Gap per capita
Kern - $113
Madera + $718
Fresno + $121
San Bernardino - $26
Tulare + $48
San Francisco + $28
Alameda + $17
Contra Costa - $95

The Regional Distribution of Cap & Trade Auction Funds 48
Appendix 2: Fair Share Estimates
County Payor Share Reductions
Share Population
Share
County Payor Share Reductions
Share Population
Share
Alameda $8.4 M $5 M $29.1 M
Orange $22.2 M $28.7 M $64.7 M
Alpine ** ** **
Placer $1.7 M $4.9 M $6 M
Amador ** ** $0.7 M
Plumas ** ** $0.4 M
Butte $0.5 M $0.3 M $4.2 M
Riverside $23.8 M $18.4 M $49.6 M
Calaveras ** ** $0.8 M
Sacramento $20.2 M $25.9 M $29.3 M
Colusa $6.6 M $3 M $0.4 M
San Benito ** ** $1 M
Contra Costa $115.8 M $149.6 M $21 M
San
Bernardino $84.2 M $50.8 M $55.4 M
Del Norte ** ** $0.5 M
San Diego $30.3 M $32.1 M $56.3 M
El Dorado $7.9 M $0.3 M $3.2 M
San Francisco $2.4 M $52.7 M $14.2 M
Fresno $14.5 M $17.4 M $30.6 M
San Joaquin $14.8 M $8.7 M $18.8 M
Glenn ** $0.1 M $0.5 M
San Luis
Obispo $2 M $0.9 M $4.7 M
Humboldt $1.1 M $0.4 M $2.4 M
San Mateo $1.7 M $1.1 M $12.8 M
Imperial $5.9 M $6.4 M $4.6 M
Santa Barbara $3.4 M $1.6 M $7.6 M
Inyo $0.1 M ** $0.3 M
Santa Clara $23.8 M $14.3 M $33.3 M
Kern $120.6 M $72.3 M $24.3 M
Santa Cruz $0.4 M $0.2 M $4.7 M
Kings $3.8 M $9.6 M $4.1 M
Shasta $3.3 M $1.5 M $3.1 M
Lake ** ** $1.1 M
Sierra ** ** **
Lassen ** ** $0.6 M
Siskiyou ** ** $0.8 M
Los Angeles $258.5 M $306.5 M $273.3 M
Solano $16.9 M $8.1 M $7.5 M
Madera $3 M $2.5 M $4.7 M
Sonoma $0.9 M ** $8.4 M
Marin $0.7 M ** $4.4 M
Stanislaus $13.9 M $13.2 M $14.6 M
Mariposa ** ** $0.3 M
Sutter $3.4 M ** $1.7 M
Mendocino $0.1 M ** $1.6 M
Tehama $0.6 M $0.2 M $1.2 M
Merced $6.2 M $5.4 M $8.8 M
Trinity ** ** $0.2 M
Modoc $0.2 M $0.1 M $0.2 M
Tulare $9.2 M $7.2 M $14 M
Mono ** ** $0.2 M
Tuolumne ** ** $1 M
Monterey $20.7 M $8.7 M $8 M
Ventura $9.3 M $3.9 M $15.1 M
Napa $0.3 M ** $2.4 M
Yolo $1.2 M $3 M $3.9 M
Nevada ** $0.1 M $1.7 M
Yuba $1.4 M $0.8 M $1.5 M
** Indicates less than $100,000

The Regional Distribution of Cap & Trade Auction Funds 49
Appendix 3: Program Estimates, part 1
County HSRA CVRP HVIP ARB Pilots SGC 1 SGC 2 CSD CalFire1 CalFire2 CalSTA
Alameda ** $9.3 M ** $1 M $9.1 M ** ** ** ** $1.9 M
Alpine ** ** ** ** ** ** ** ** ** **
Amador ** ** ** ** ** ** ** ** ** **
Butte ** ** ** ** ** ** ** ** ** **
Calaveras ** ** ** ** ** ** ** ** ** **
Colusa ** ** ** ** ** ** ** ** ** **
Contra Costa ** $4.3 M ** $1 M $5.8 M ** $1.4 M ** ** $1.2 M
Del Norte ** ** ** ** ** ** ** ** ** **
El Dorado ** ** ** ** ** ** ** ** ** **
Fresno $101.6 M ** ** $5.3 M $4.4 M ** ** $1.2 M ** **
Glenn ** ** ** ** ** ** ** ** ** **
Humboldt ** ** ** ** ** ** ** ** $1.5 M **
Imperial ** ** ** ** ** ** $2.9 M ** ** **
Inyo ** ** ** ** ** ** ** ** ** **
Kern $5.9 M ** ** $3.6 M $2.9 M ** $7.3 M ** ** **
Kings $5.9 M ** ** ** ** ** ** ** ** **
Lake ** ** ** ** ** ** ** ** ** **
Lassen ** ** ** ** ** ** ** ** ** **
Los Angeles $5.9 M $28.4 M $2.5 M $36.6 M $45.8 M ** $22.4 M $8.3 M ** $9.5 M
Madera $101.6 M ** ** ** ** ** $3.7 M ** ** **
Marin ** $1.9 M ** ** $1.1 M ** ** ** ** **
Mariposa ** ** ** ** ** ** ** ** ** **
Mendocino ** ** ** ** ** ** ** ** $1.7 M **
Merced $5.9 M ** ** $1.6 M $1.3 M ** $4.4 M ** ** **
Modoc ** ** ** ** ** ** ** ** ** **
Mono ** ** ** ** ** ** ** ** ** **
Monterey ** ** ** ** ** ** ** ** $1.1 M **
Napa ** ** ** ** ** ** ** ** ** **
Nevada ** ** ** ** ** ** ** ** ** **
Orange ** $12.4 M $1 M $4.4 M $6 M ** $3.1 M $1 M ** $1.3 M
Placer ** ** ** ** ** ** ** ** ** **
Plumas ** ** ** ** ** ** ** ** ** **
Riverside ** $2.5 M ** $4.4 M $4.1 M ** $5.2 M $1 M $1.2 M **
Sacramento ** $2.3 M ** $1.7 M $2.4 M ** $1.1 M ** ** **
San Benito ** ** ** ** ** ** ** ** ** **
S. Bernardino ** $1.9 M ** $7.3 M $6.4 M ** $7.9 M $1.7 M ** $1.3 M
San Diego ** $10 M ** ** $5.2 M ** ** ** $1 M $1.1 M
S. Francisco $5.9 M $2.6 M ** ** $9.7 M ** ** ** ** $2 M
San Joaquin ** ** ** $2.5 M $2.1 M ** ** ** ** **
SL Obispo ** ** ** ** ** ** ** ** $1.3 M **
San Mateo $5.9 M $4.8 M ** ** $2.7 M ** ** ** ** **
S. Barbara ** ** ** ** ** ** ** ** ** **
Santa Clara $5.9 M $17.6 M ** ** $2.9 M ** ** ** ** **
Santa Cruz ** $1.1 M ** ** ** ** ** ** ** **
Shasta ** ** ** ** ** ** ** ** $1.3 M **
Sierra ** ** ** ** ** ** ** ** ** **
Siskiyou ** ** ** ** ** ** ** ** $1.2 M **
Solano ** ** ** ** ** ** ** ** ** **
Sonoma ** $1.8 M ** ** ** ** ** ** ** **
Stanislaus ** ** ** $2 M $1.7 M ** ** ** ** **
Sutter ** ** ** ** ** ** ** ** ** **
Tehama ** ** ** ** ** ** ** ** ** **
Trinity ** ** ** ** ** ** ** ** ** **
Tulare $5.9 M ** ** $2.3 M $1.8 M ** $10.2 M ** ** **
Tuolumne ** ** ** ** ** ** ** ** ** **
Ventura ** $2.2 M ** ** ** ** ** ** ** **
Yolo ** ** ** ** ** ** ** ** ** **
Yuba ** ** ** ** ** ** $1.4 M ** ** **
** Indicates less than $100,000

The Regional Distribution of Cap & Trade Auction Funds 50
Appendix 3: Program Estimates, part 2
County CalTrans DFW CalRec 1 CalRec 2 CEC CDFA 1 CDFA 2 DWR 1 DWR 2 Total
Alameda $2.2 M $1.1 M $3 M ** $1.1 M ** ** ** ** $32 M
Alpine ** ** ** ** ** ** ** ** ** **
Amador ** ** ** ** ** ** ** ** ** **
Butte ** ** ** ** ** ** ** ** $11 M $13.2 M
Calaveras ** ** ** ** ** ** ** ** ** **
Colusa ** ** ** ** ** ** ** ** ** **
Contra Costa $1.4 M $2.1 M ** ** ** ** ** ** ** $18 M
Del Norte ** ** ** ** ** ** ** ** ** **
El Dorado ** ** ** ** ** ** ** ** ** $2 M
Fresno ** ** $3 M ** ** ** $1.1 M $3.2 M ** $125.2 M
Glenn ** ** ** ** ** ** ** ** ** **
Humboldt ** ** ** ** ** ** ** ** ** $2 M
Imperial ** ** ** ** ** ** ** ** ** $5.9 M
Inyo ** ** ** ** ** ** ** ** ** **
Kern ** ** ** ** ** $1.2 M ** $1.8 M ** $28.4 M
Kings ** ** ** ** ** $1.3 M ** ** ** $10.6 M
Lake ** ** ** ** ** ** ** ** ** **
Lassen ** ** ** ** ** ** ** ** ** **
Los Angeles $7.1 M ** $4 M ** $3.9 M ** ** $2.3 M ** $178.8 M
Madera ** ** ** ** ** ** ** ** ** $109.1 M
Marin ** $1.6 M ** ** ** ** ** ** ** $5.5 M
Mariposa ** ** ** ** ** ** ** ** ** **
Mendocino ** ** ** ** ** ** ** ** ** $1.9 M
Merced ** ** ** ** ** $2.4 M ** $1.8 M ** $19.2 M
Modoc ** ** ** ** ** ** ** ** ** **
Mono ** ** ** ** ** ** ** ** ** **
Monterey ** ** ** ** ** ** ** ** ** $3.9 M
Napa ** $1.2 M ** ** ** ** ** ** ** $2.2 M
Nevada ** ** ** ** ** ** ** ** ** **
Orange $1.3 M ** $2.9 M ** ** ** ** ** ** $35.6 M
Placer ** ** ** ** ** ** ** ** ** $1.7 M
Plumas ** ** ** ** ** ** ** ** ** **
Riverside ** ** $3 M ** ** ** ** ** ** $25.6 M
Sacramento ** ** ** ** $2.2 M ** ** ** ** $12 M
San Benito ** ** ** ** ** ** ** ** ** **
S. Bernardino ** ** $2.6 M ** ** ** ** ** ** $33 M
San Diego $1.6 M $7 M ** ** $1.6 M ** ** ** ** $30.8 M
S. Francisco $2.2 M ** ** ** ** ** ** ** ** $23.4 M
San Joaquin ** ** ** ** ** ** ** $1.3 M ** $9 M
SL Obispo ** ** ** ** ** ** ** ** ** $2.9 M
San Mateo $1.1 M ** ** ** ** ** ** ** ** $15.9 M
S. Barbara ** ** ** ** ** ** ** ** ** $3 M
Santa Clara $1.4 M $1.6 M ** ** ** ** ** ** ** $33.4 M
Santa Cruz ** ** ** ** ** ** ** ** ** $2.4 M
Shasta ** ** ** ** ** ** ** ** ** $1.8 M
Sierra ** ** ** ** ** ** ** ** ** **
Siskiyou ** ** ** ** ** ** ** ** ** $1.4 M
Solano ** $4.4 M ** ** ** ** ** ** ** $6.9 M
Sonoma ** $3.7 M ** ** ** ** ** ** ** $7.1 M
Stanislaus ** ** ** ** ** $1.6 M ** $1.3 M ** $10 M
Sutter ** ** ** ** ** ** ** ** ** **
Tehama ** ** ** ** ** ** ** ** ** $1.6 M
Trinity ** ** ** ** ** ** ** ** ** **
Tulare ** ** ** ** ** $3.9 M $1.1 M $2.7 M ** $30 M
Tuolumne ** ** ** ** ** ** ** ** ** **
Ventura ** ** ** ** ** ** ** ** ** $4.8 M
Yolo ** ** ** ** ** ** ** ** ** $2.6 M
Yuba ** ** ** ** ** ** ** ** ** $2.1 M
** Indicates less than $100,000

The Regional Distribution of Cap & Trade Auction Funds 51
Appendix 4: Literature Review – Revenue Estimates
Source Estimate Notes
Legislative Analyst’s Office (2014) The 2014-15 Budget: Cap-and-Trade Auction Revenue Expenditure Plan
$15 Billion total through
2020
"The ARB has adopted regulations to keep auction prices within a certain range by setting a minimum and maximum price for allowances sold at auctions—from $10 per ton of emissions to $40 per ton of emissions. Under ARB’s current auction schedule, over the life of the program, roughly half of all allowances will be allocated at auctions, with the remainder allocated for free. We note, however, that ARB is currently considering a change to increase the amount of allowances allocated for free to 60%.
"California’s cap-and-trade program is expected to raise billions of dollars in auction revenues from 2012 through 2020. The actual amount of revenue that will be raised is difficult to predict, particularly because of the uncertainty about future allowance prices. Using ARB’s floor and ceiling prices for allowances, and assuming that ARB provides 60% of all allowance for free, the total cap-and-trade revenues from all auctions through 2020 could range from $12 billion to $45 billion. Several economists who have evaluated California’s cap-and-trade program have estimated that, over the life of the program, average allowance price may be in the $15 to $20 range. If this were to occur, total revenue for the program through 2020 could be roughly $15 billion. To the extent that ARB does not increase the percentage of free allowances, the above revenue estimates would be higher."
Horowitz, C., et al (2012) Spending California’s Cap-and-Trade Auction Revenue: Understanding the Sinclair Paint Risk Spectrum
Close to zero initially, $3 Billion per year from
2015 – 2020 (Implies $18 Billion total)
"The Governor’s office and the Legislative Analyst’s Office have both recently estimated auction proceeds. The Governor’s budget estimates that the revenue generated in 2012–2013 from cap-and-trade auctions will be approximately $1 billion. LAO put the range of revenue at between $1 and $3 billion for fiscal year 2012–2013.31 For fiscal year 2015–2016, its range is much broader, between $2 and $14 billion. Neither set of figures clearly distinguishes between consignment revenue and other allowance auction revenue.
"Assuming a $15 auction settlement price, CARB would raise $590 million in the advance allowance auction in 2012, and $570 million in 2013. As noted above, auctioning remainder allowances not allocated to industry in 2013 could raise an additional unknown amount, likely not very large. Remainder allowance revenue may be close to zero for 2013 and 2014. Because remainder allowances are projected to increase by approximately 200 million in 2015, revenue from remainder allowances could easily exceed $3 billion in 2015, again assuming a $15 auction settlement price."

The Regional Distribution of Cap & Trade Auction Funds 52
Appendix 5: CalEnviroScreen
CalEnviroScreen is a screening methodology that can be used to help identify
California communities that are disproportionately burdened by multiple sources
of pollution
CalEPA has used the tool to designate California communities as disadvantaged
pursuant to Senate Bill 535
Areas disproportionately affected by environmental pollution and other
hazards that can lead to negative public health effects, exposure or
environmental degradation

The Regional Distribution of Cap & Trade Auction Funds 53
Areas with concentrations of people that are of low income, high
unemployment, low levels of home ownership, high rent burden, sensitive
populations or low levels of educational attainment
The tool was updated in October 2014 to include additional data along the US-
Mexico border