the registered nurse population · the. registered nurse population. findings from the 2008...
TRANSCRIPT
TheRegistered Nurse Population
Findings from the 2008 National Sample Survey of Registered Nurses
September 2010 U.S. Department of Health and Human Services Health Resources and Services Administration

The Registered Nurse Population
Findings from the 2008 National Sample Survey of Registered Nurses
September 2010
U.S. Department of Health and Human Services Health Resources and Services Administration

Preface
The U.S. Department of Health and Human Services (HHS), Health Resources and Services Administration (HRSA), is the principal Federal agency responsible for the evaluation and development of the nursing workforce in the United States. HRSA’s Bureau of Health Professions (BHPr) works to appraise and improve the U.S. nursing workforce with the goal of ensuring there are enough qualified nurses to meet the Nation’s health needs. To do this, BHPr reviews the supply, composition, and distribution of nurses on the national and State levels. To that end, BHPr commissioned the National Sample Survey of Registered Nurses (NSSRN).
This publication is the report of the ninth NSSRN representing data collected about registered nurses (RNs) holding active nursing licenses as of March 2008. As with previous iterations of the NSSRN, this report is available to all primary stakeholders involved in health care planning and evaluation as well as the public. The 2008 NSSRN public use files and code book are available to researchers and analysts and can be accessed at http://bhpr.hrsa.gov/healthworkforce/rnsurvey/ default.htm.
The 2008 NSSRN was developed for the U.S. Department of Health and Human Services, Health Resources and Services Administration under contract with Westat. The study was overseen by BHPr and funded through the Division of Nursing.
The first national survey was conducted in 1977; HRSA has conducted this national survey every 4 years since 1980. Data from these periodic surveys provide the basis for evaluating trends and projection of the future supply of nursing resources at the national and State levels. The NSSRN is the cornerstone of nursing workforce data. It is the principal data source used for disseminating information to the Federal Government, researchers, and the public on the nursing workforce. It provides essential information for performing supply-demand projections of nursing requirements and foreseen shortages. Periodic monitoring of the number and characteristics of the registered nurse population is vital to effectively maintain an up-to-date picture of the RN population and to assess the future availability of this critical resource. For example, previous surveys were integral in identifying the shortages of RNs that occurred at the end of the 1980s and then reappeared around 2000.
The NSSRN is the Nation’s most extensive and comprehensive source of statistical data on all individuals in the United States that hold active RN licenses, whether they are currently practicing
iii

Preface
iv
nursing or not. The survey assesses the number of RNs; their educational background; employment setting, position, and specialty areas; job satisfaction; and salaries. In addition, the survey also identifies the geographic distribution of nurses throughout the United States, as well as the personal composition of the U.S. nursing workforce in terms of gender, racial/ethnic background, age, and family structure.
Table of Contents
Chapter Page
Preface .................................................................................................................. iii
Executive Summary ............................................................................................ xxvii
Introduction ........................................................................................................ xxxvii
1 Survey Methods .................................................................................................. 1-1
1.1 Summary ................................................................................................. 1-1 1.2 2008 Questionnaire ............................................................................... 1-3 1.3 Sample Design ....................................................................................... 1-4 1.4 Data Collection Methods ..................................................................... 1-5 1.5 Sample Performance ............................................................................. 1-6 1.6 Imputation ............................................................................................. 1-7 1.7 Sample Weighting ................................................................................. 1-9
1.7.1 Overview of the Weighting Process .................................. 1-9 1.7.2 Implications of Weighting for NSSRN Data
Users ....................................................................................... 1-9
2 Education and Licensing of Registered Nurses ............................................. 2-1
2.1 Introduction ........................................................................................... 2-1 2.2 Initial Nursing Education .................................................................... 2-1 2.3 Age at Graduation ................................................................................. 2-2 2.4 Sources of Financing ............................................................................ 2-3 2.5 Education and Experience Prior to Initial Nursing
Education ............................................................................................... 2-5 2.6 Nursing Licensure ................................................................................. 2-6 2.7 Degrees Obtained After Initial Nursing Education ......................... 2-7 2.8 Currently Enrolled Students ................................................................ 2-11 2.9 Emergency Preparedness ..................................................................... 2-12 2.10 Certifications .......................................................................................... 2-13
3 The Employment of Registered Nurses .......................................................... 3-1
3.1 Introduction ........................................................................................... 3-1 3.2 Nursing Workforce Size ....................................................................... 3-1 3.3 Employment and Age........................................................................... 3-3 3.4 Employment and Education ............................................................... 3-5 3.5 Employment Settings ........................................................................... 3-7
v
Contents (continued)
Chapter Page
vi
3.5.1 Employment Setting Trends ............................................... 3-11 3.5.2 Employment Settings and Age ........................................... 3-11 3.5.3 Employment Settings and Education ................................ 3-13
3.6 Job Titles ................................................................................................ 3-14
3.6.1 Job Titles and Employment Settings ................................. 3-15 3.6.2 Job Titles and Experience ................................................... 3-16 3.6.3 Job Titles and Education ..................................................... 3-16
3.7 Secondary Nursing Jobs ....................................................................... 3-17 3.8 Supply of Registered Nurses ............................................................... 3-19
3.8.1 Hours and Weeks Worked and Age Group ..................... 3-24 3.8.2 Hours and Weeks Worked and Highest
Education ............................................................................... 3-24 3.8.3 On-Call Work ........................................................................ 3-25 3.8.4 Overtime Work ..................................................................... 3-25 3.8.5 Hours Worked and Employment Setting ......................... 3-26 3.8.6 Hours Worked and Job Title .............................................. 3-28
3.9 Employment Settings and Level of Care ........................................... 3-29
3.9.1 Education and Areas of Clinical Specialty ........................ 3-31
3.10 Composition of Nursing Work ........................................................... 3-33
3.10.1 Composition of Work and Job Title .................................. 3-34 3.10.2 Composition of Work and Education ............................... 3-34
3.11 Temporary and Travel Work ............................................................... 3-36 3.12 Crossing State Lines and Compact States ......................................... 3-37 3.13 Unionization in Principal Nursing Positions .................................... 3-37 3.14 Earnings of Registered Nurses ............................................................ 3-38
3.14.1 Earnings and Job Titles ....................................................... 3-40 3.14.2 Earnings and Employment Setting .................................... 3-41 3.14.3 Earnings From Secondary Jobs .......................................... 3-41 3.14.4 Earnings and Experience ..................................................... 3-42 3.14.5 Earnings and Education ...................................................... 3-42
3.15 Job Satisfaction ...................................................................................... 3-43
3.15.1 Job Satisfaction and Employment Setting ........................ 3-45 3.15.2 Job Satisfaction and Job Titles ............................................ 3-45
Contents (continued)
Chapter Page
vii
3.15.3 Job Satisfaction and Age ...................................................... 3-48 3.15.4 Job Satisfaction and Education .......................................... 3-48
3.16 Job Changes of Registered Nurses ..................................................... 3-51 3.17 Plans for Future Employment ............................................................ 3-53 3.18 Non-Nursing Jobs ................................................................................. 3-54
4 Nurse Faculty ...................................................................................................... 4-1
4.1 Introduction ........................................................................................... 4-1 4.2 Number of Nurses Working in Faculty Roles .................................. 4-2 4.3 Faculty and Age ..................................................................................... 4-3 4.4 Faculty and Education .......................................................................... 4-4 4.5 Faculty and Hours of Work ................................................................. 4-5 4.6 Faculty Earnings and Satisfaction ....................................................... 4-6
5 Advanced Practice Registered Nurses ............................................................. 5-1
5.1 Introduction ........................................................................................... 5-1 5.2 Nurse Practitioners ............................................................................... 5-1
5.2.1 Number of Nurse Practitioners .......................................... 5-3 5.2.2 Nurse Practitioners and Education .................................... 5-5 5.2.3 Nurse Practitioners and Employment ............................... 5-7 5.2.4 Nurse Practitioner Earnings and Job Satisfaction ........... 5-10
5.3 Nurse Midwives ..................................................................................... 5-13
5.3.1 Number of Nurse Midwives ............................................... 5-14 5.3.2 Nurse Midwives and Education ......................................... 5-15 5.3.3 Nurse Midwives and Employment .................................... 5-17 5.3.4 Nurse Midwife Earnings and Job Satisfaction ................. 5-19
5.4 Nurse Anesthetists ................................................................................ 5-20
5.4.1 Number of Nurse Anesthetists........................................... 5-21 5.4.2 Nurse Anesthetists and Education ..................................... 5-22 5.4.3 Nurse Anesthetists and Employment ................................ 5-24 5.4.4 Nurse Anesthetist Earnings and Job Satisfaction ............ 5-25
5.5 Clinical Nurse Specialists ..................................................................... 5-26
5.5.1 Number of Clinical Nurse Specialists ................................ 5-26 5.5.2 Clinical Nurse Specialists and Education .......................... 5-27 5.5.3 Clinical Nurse Specialists and Employment ..................... 5-30
Contents (continued)
Chapter Page
viii
5.5.4 Clinical Nurse Specialist Earnings and Job Satisfaction ............................................................................. 5-32
6 Nurses Who Do Not Work in Nursing .......................................................... 6-1
6.1 Introduction ........................................................................................... 6-1 6.2 Demographics of Nurses Not Working in Nursing ........................ 6-1
6.2.1 Nurses Not Working in Nursing and Age ........................ 6-1 6.2.2 Presence of Children ............................................................ 6-2
6.3 Length of Time Away From Nursing Work ..................................... 6-3 6.4 Reasons for Not Working in Nursing ................................................ 6-4 6.5 Plans Regarding Nursing Work .......................................................... 6-6
7 Demographics of the Registered Nurse Workforce ...................................... 7-1
7.1 Introduction ........................................................................................... 7-1 7.2 Registered Nurses and Age .................................................................. 7-1 7.3 Registered Nurses and Gender ........................................................... 7-2 7.4 Registered Nurses and Race and Ethnicity ....................................... 7-5 7.5 Registered Nurses and Language Competency ................................ 7-11 7.6 Registered Nurses and Marital Status and Dependents .................. 7-11 7.7 Registered Nurses and Household Income ...................................... 7-12 7.8 Geography, Nurse Demographics, and Employment ..................... 7-13
8 Internationally Educated Nurses (IENs) ........................................................ 8-1
8.1 Introduction ........................................................................................... 8-1 8.2 IEN Licensure and National Origin .................................................. 8-1 8.3 IEN Demographic Characteristics ..................................................... 8-3 8.4 IEN Employment ................................................................................. 8-5
9 Recent Registered Nurse Graduates ................................................................ 9-1
9.1 Introduction ........................................................................................... 9-1 9.2 Demographic Characteristics of Recent Registered Nurse
Graduates ............................................................................................... 9-1 9.3 Recent Registered Nurse Graduates and Education ........................ 9-2 9.4 Recent Registered Nurse Graduates and Diversity .......................... 9-7 9.5 Family Situation of Recent Nurse Graduates ................................... 9-8 9.6 Recent Registered Nurse Graduates and Employment ................... 9-8 9.7 Recent Registered Nurse Graduates and Job Changes .................... 9-11
Contents (continued)
Chapter Page
ix
9.8 Recent Registered Nurse Graduates and Secondary Nursing Jobs .......................................................................................... 9-13
9.9 Recent Registered Nurse Graduates and Earnings .......................... 9-14
10 Registered Nurses Nearing Retirement ........................................................... 10-1
10.1 Introduction ........................................................................................... 10-1 10.2 Demographic Characteristics of Registered Nurses
Nearing Retirement .............................................................................. 10-1 10.3 Employment Characteristics of Older Registered Nurses .............. 10-2
10.3.1 Employment Positions and Settings .................................. 10-3 10.3.2 Hours Worked by Older Registered Nurses ..................... 10-5 10.3.3 Secondary Nursing Employment ....................................... 10-5 10.3.4 Earnings of Older Registered Nurses ................................ 10-6
10.4 Job Changes and Intentions Regarding Nursing Work ................... 10-6 10.5 Older Registered Nurses Not Working in Nursing ......................... 10-8
Appendixes
A Data Tables .......................................................................................................... A-1
B Survey Methodology .......................................................................................... B-1
B.1 Sampling ................................................................................................. B-1
B.1.1 Sample Selection ................................................................... B-1 B.1.2 Final Sample Allocation ....................................................... B-3
B.2 Sample Performance ............................................................................. B-3
B.2.1 Vermont Sample Performance ........................................... B-11
B.3 Imputation ............................................................................................. B-13
B.3.1 Imputation Methods ............................................................ B-14 B.3.2 Procedures ............................................................................. B-15 B.3.3 Results and Implications on Variance Estimates ............. B-16
B.4 Weighting and Estimation ................................................................... B-17
B.4.1 Sample Weighting ................................................................. B-18 B.4.2 Estimation, Variance Estimation, and Sampling
and Nonsampling Errors ..................................................... B-24
Contents (continued)
Appendixes Page
x
B.5 Nonresponse Bias Analysis ................................................................. B-29
B.5.1 Underrepresentation of Racial and Ethnic Minorities ............................................................................... B-29
B.5.2 Underrepresentation of Younger Nurses .......................... B-30 B.5.3 Comparative Analyses .......................................................... B-31
References ............................................................................................................ B-41
C NSSRN Questionnaire ....................................................................................... C-1
Tables
1-1 Summary of 2008 NSSRN sample performance ........................................... 1-7
2-1 Degrees prior to initial nursing education, by survey year, 2000-2008 ...................................................................................................................... 2-5
2-2 Education and health occupation experience prior to initial nursing education, by initial nursing education .............................................. 2-6
2-3 Highest nursing degree, by employment status .............................................. 2-7
2-4 Master’s and doctorate degrees as highest nursing or nursing-related education preparation, 2000-2008 ....................................................... 2-9
2-5 Average years between completion of initial and highest nursing degrees .................................................................................................................. 2-11
2-6 Enrollment in nursing and nursing-related education programs ................. 2-12
2-7 Registered nurse certifications .......................................................................... 2-13
3-1 Employment in hospital units, by type of hospital ........................................ 3-10
3-2 Employment settings, by age group ................................................................. 3-13
3-3 Job titles of registered nurses ............................................................................ 3-15
3-4 Job titles, by experience in nursing ................................................................. 3-16
3-5 Job titles, by highest nursing or nursing-related education .......................... 3-17
Contents (continued)
Tables Page
xi
3-6 Employment arrangements in secondary nursing positions ........................ 3-19
3-7 Employment settings of secondary nursing positions .................................. 3-19
3-8 Average hours and weeks worked in secondary nursing positions ............. 3-23
3-9 Average hours per year worked in all nursing jobs, by number of nursing jobs ......................................................................................................... 3-23
3-10 Average hours worked per year in all nursing positions, by age group ..................................................................................................................... 3-24
3-11 Average hours worked per year in all nursing positions, by highest nursing and nursing-related education ............................................... 3-24
3-12 Average hours on standby or worked from on-call per week in the principal nursing position ........................................................................... 3-25
3-13 Average hours per week in principal nursing position, by full-time/part-time status and employment setting .............................................. 3-27
3-14 Average hours per week in principal nursing position, by full-time/part-time status and job title ................................................................... 3-28
3-15 Levels of care in nursing work for hospital and nonhospital settings .................................................................................................................. 3-29
3-16 Primary patient age group cared for in principal nursing position, for hospital and nonhospital settings ............................................................... 3-30
3-17 Primary clinical specialty in principal nursing position for hospital and nonhospital settings .................................................................................... 3-31
3-18 Primary clinical specialty in principal nursing position, by highest nursing and nursing-related education ............................................................. 3-32
3-19 Average percent time spent on various activities, by highest nursing or nursing-related education ............................................................... 3-35
3-20 Employment by temporary employment services (TES), for primary and secondary nursing positions, by principal nursing position in a hospital .......................................................................................... 3-36
3-21 Employment settings of secondary employment through a nontravel temporary employment service ....................................................... 3-36
Contents (continued)
Tables Page
xii
3-22 Licensure in a Compact State, by where registered nurses live and work ...................................................................................................................... 3-37
3-23 Unionization, by employment setting .............................................................. 3-38
3-24 Average annual earnings from all nursing positions, by total number of hours worked per year in all nursing positions ........................... 3-39
3-25 Average annual earnings, by job title of principal nursing position, for registered nurses working full-time ........................................... 3-40
3-26 Average annual earnings, by employment setting of principal nursing position, for registered nurses working full-time ............................. 3-41
3-27 Average annual earnings for registered nurses working full-time in their principal nursing position, by years since initial nursing education .............................................................................................................. 3-42
3-28 Average annual earnings of registered nurses working full-time in their principal nursing position, by highest nursing or nursing-related education and job title ........................................................................... 3-43
3-29 Employment status in 2008, compared with status in 2007 ......................... 3-52
3-30 Employment changes among registered nurses employed in nursing in both 2007 and 2008 ......................................................................... 3-53
3-31 Employment in non-nursing occupations, by nursing employment status .............................................................................................. 3-57
4-1 Registered nurses employed as faculty in their principal nursing position, by type of nursing education program ............................................ 4-2
4-2 Registered nurses employed as faculty in their secondary nursing position(s), by job title of principal nursing position .................................... 4-2
4-3 Months worked per year and hours worked per week, by registered nurses who are faculty in their principal nursing position ................................................................................................................. 4-6
4-4 Average annual earnings of registered nurses who work full-time as faculty in their principal nursing position ................................................... 4-7
5-1 Certification and State Board recognition of nurse practitioners employed in nursing, and whether certification or recognition is required for their job .......................................................................................... 5-6
Contents (continued)
Tables Page
xiii
5-2 Primary clinical specialties of employed nurse practitioners with job title of nurse practitioner ............................................................................ 5-9
5-3 Employed nurse practitioners whose primary level of care is ambulatory or primary care, by job title .......................................................... 5-9
5-4 Certification and State Board recognition of nurse midwives employed in nursing, and whether certification or recognition is required for their job .......................................................................................... 5-17
5-5 Clinical specialties of registered nurses prepared as nurse midwives, for selected job titles in the hospital setting ................................. 5-19
5-6 Certification and State Board recognition of nurse anesthetists employed in nursing, and whether certification or recognition is required for their job .......................................................................................... 5-23
5-7 Certification and State Board recognition of clinical nurse specialists employed in nursing, and whether certification or recognition is required for their job ................................................................. 5-29
6-1 Intentions of nurses who are not working in nursing, overall, and by marital status .................................................................................................. 6-6
7-1 Median age of registered nurses ....................................................................... 7-2
7-2 Gender of employed registered nurses, by year of initial registered nurse license ........................................................................................................ 7-3
7-3 Highest education of registered nurses working in nursing, by gender ................................................................................................................... 7-3
7-4 Employment settings, by gender ...................................................................... 7-4
7-5 Median current age and age at licensure of registered nurses working in nursing, by race/ethnicity .............................................................. 7-8
7-6 Initial nursing education of registered nurses employed in nursing, by race/ethnicity .................................................................................. 7-8
7-7 Highest education of registered nurses employed in nursing, by race/ethnicity....................................................................................................... 7-9
7-8 Advanced practice preparation of registered nurses, by race/ethnicity....................................................................................................... 7-9
Contents (continued)
Tables Page
xiv
7-9 Employment setting of registered nurses, by race/ethnicity ........................ 7-10
7-10 Job titles of registered nurses, by race/ethnicity ............................................ 7-10
7-11 Marital status and presence of children or adult dependents at home ..................................................................................................................... 7-11
7-12 Employment of registered nurses, by presence of children or adult dependants in the home ........................................................................... 7-12
7-13 Annual household income of registered nurses, by employment status of the nurse ............................................................................................... 7-12
8-1 Internationally educated nurses in the United States .................................... 8-2
8-2 Years between initial nursing education and first U.S. licensure ................. 8-3
8-3 Median current age and age at licensure of registered nurses employed in nursing, by international education status ................................ 8-3
8-4 Men among U.S. and internationally educated employed nurses, by year of licensure ............................................................................................. 8-4
8-5 Registered nurses working in nursing with at least a bachelor’s degree, by location of education ....................................................................... 8-4
8-6 Registered nurses working full-time, by location of education and year of licensure .................................................................................................. 8-5
8-7 Average hours worked per year and per week in principal nursing position, by full-time and part-time status and location of education .............................................................................................................. 8-5
8-8 Number and percent of nurses employed in a hospital setting for their principal nursing position, by location of initial education and year of licensure ........................................................................................... 8-6
8-9 Registered nurses employed in ambulatory care and academic education, by location of initial education ...................................................... 8-7
8-10 Registered nurses employed as staff nurses, by location of initial education and year of licensure ........................................................................ 8-7
8-11 Employment intentions, by location of initial education .............................. 8-7
Contents (continued)
Tables Page
xv
9-1 Estimated population of registered nurses, by graduation cohort .............. 9-2
9-2 Initial education of registered nurses, by graduation cohort ........................ 9-2
9-3 Location of initial education of nurses, by graduation cohort ..................... 9-3
9-4 Initial nursing education, by graduation cohort and location of education .............................................................................................................. 9-3
9-5 Average age at graduation and age distribution at graduation, by graduation cohort ............................................................................................... 9-3
9-6 Registered nurses with postsecondary education degrees before starting initial nursing education program ...................................................... 9-4
9-7 Fields of study for registered nurses who had postsecondary degrees before initial nursing education, by graduation cohort ................... 9-4
9-8 Employment in a health occupation, by registered nurses before initial nursing education, by graduation cohort .............................................. 9-5
9-9 Sources of financing for initial nursing education, by graduation cohort ................................................................................................................... 9-6
9-10 Highest level of nursing or nursing-related education for recent registered nurse graduates, by initial nursing education (2001–2004) ..................................................................................................................... 9-6
9-11 Gender of registered nurses, by graduation cohort ....................................... 9-7
9-12 Racial/ethnic composition of registered nurse population, by graduation cohort ............................................................................................... 9-7
9-13 Marital status and presence of children, by graduation cohort .................... 9-8
9-14 Employment of registered nurses, by graduation cohort ............................. 9-9
9-15 Employment of new registered nurse graduates, by presence of children ................................................................................................................. 9-9
9-16 Employment setting of principal nursing position, by graduation cohort, 2008 and 2004 ....................................................................................... 9-9
9-17 Job titles of registered nurses, by graduation cohort ..................................... 9-10
Contents (continued)
Tables Page
xvi
9-18 Average hours worked per year and per week by registered nurses, by full-time/part-time status and graduation cohort ....................... 9-10
9-19 Satisfaction with principal nursing position, by graduation cohort ............. 9-11
9-20 Intentions regarding nursing employment, by graduation cohort ............... 9-11
9-21 Job changes between March 2007 and March 2008, for registered nurses employed in 2008, by graduation cohort ............................................ 9-12
9-22 Reasons for job changes, by graduation cohort ............................................. 9-12
9-23 Employment setting changes for registered nurses who graduated 2001–2008 ............................................................................................................ 9-13
9-24 Secondary nursing positions, by graduation cohort ...................................... 9-13
9-25 Average earnings from principal nursing position, and from all nursing positions, by graduation cohort .......................................................... 9-14
10-1 Demographic and educational characteristics of registered nurses, by age .................................................................................................................... 10-2
10-2 Employment settings of registered nurses in their principal nursing position, by age group .......................................................................... 10-4
10-3 Job titles of registered nurses in their principal nursing position, by age group ........................................................................................................ 10-4
10-4 Job satisfaction, by principal employment setting ......................................... 10-5
10-5 Average hours worked per week for registered nurses in their principal nursing position, by age ..................................................................... 10-5
10-6 Percent of employed registered nurses with secondary nursing positions, by age .................................................................................................. 10-6
10-7 Average earnings from primary nursing employment, by age ..................... 10-6
10-8 Registered nurses employed in nursing in 2007 who changed position or employer, by age ............................................................................. 10-7
10-9 Reasons for job changes, by age group ........................................................... 10-7
10-10 Intentions to change employers or leave the nursing profession, by age group ........................................................................................................ 10-8
Contents (continued)
Tables Page
xvii
10-11 Length of time since last employed in nursing, for registered nurses not employed in nursing in 2008, by age group ................................. 10-8
10-12 Reasons for not working in nursing, by age group ........................................ 10-9
10-13 Percent of registered nurses not employed in nursing who work in non-nursing positions, by age group ........................................................... 10-9
Appendix A Tables
1 Gender, racial/ethnic background, and age group, by employment status: 2008 ................................................................................... A-1
2 Year of graduation from initial nursing education and the average age at graduation, by type of initial nurse education: 2008 ........................... A-2
3 Financial resources used for tuition and fees for initial nursing education, by type of initial nursing education: 2008 .................................... A-3
4 Characteristics of registered nurses with a degree before entering initial nursing education, by type of initial nursing education: 2008 ...................................................................................................................... A-4
5 Health occupations prior to initial nursing education, by type of initial nursing education: 2008 .......................................................................... A-5
6 Registered nurses who were ever licensed as practical/vocational nurse, by type of initial nursing education: 2008 ............................................ A-6
7 State of location of registered nurses as of March 2008 and State of graduation, by type of initial nursing education and number of years since graduation: 2008 .............................................................................. A-7
8 Highest nursing or nursing-related education, by initial nursing education: 2008 ................................................................................................... A-8
9 Primary focus of post-nursing master’s and doctorate degrees: 2008 ...................................................................................................................... A-9
10 Current enrollment in nursing or nursing-related education programs, by employment status and student status: 2008 .......................... A-10
11 National nursing certifications for registered nurses: 2008 .......................... A-11
12 Employment setting in principal nursing position: 2008 .............................. A-12
Contents (continued)
Appendix A Tables Page
xviii
13 Employment setting in principal nursing position, by age group: 2008 ...................................................................................................................... A-14
14 Employment setting in principal nursing position, by highest nursing or nursing-related education: 2008 .................................................... A-15
15 Job title in principal nursing position: 2008 .................................................... A-16
16 Job title in principal nursing position, by hospital and nonhospital setting: 2008 ......................................................................................................... A-17
17 Employment setting in principal nursing position, by selected job titles: 2008 ............................................................................................................ A-18
18 Job title in principal nursing position, by highest nursing or nursing-related education: 2008 ........................................................................ A-19
19 Employment status and average total earnings for registered nurses with one and more than one nursing position: 2008 ........................ A-20
20 Average annual hours worked and employment setting in principal nursing position: 2008 ....................................................................... A-21
21 Average hours per week and employment setting for registered nurses working full-time in their principal nursing position: 2008 ............. A-22
22 Average hours per week and employment setting for registered nurses working part-time in their principal nursing position: 2008 ............ A-23
23 Level of care by type of clinical specialty in principal nursing position: 2008 ...................................................................................................... A-24
24 Clinical specialty by patient population in principal nursing position for registered nurses who provide patient care: 2008 .................... A-25
25 Level of care by clinical specialty in principal nursing position for registered nurses who provide patient care in hospital settings: 2008 ...................................................................................................................... A-26
26 Clinical specialty by patient population in principal nursing position for registered nurses who provide patient care in hospital settings: 2008 ....................................................................................................... A-27
27 Percent of time in each functional area during usual work week in principal nursing position: 2008 ....................................................................... A-28
Contents (continued)
Appendix A Tables Page
xix
28 Average percent of time in each functional area during usual work week in principal nursing position, by highest nursing or nursing-related education: 2008 ........................................................................ A-29
29 Employment setting in principal nursing position, by employment relationship: 2008......................................................................... A-30
30 Average annual earnings for registered nurses working full-time in their principal nursing position, by job title: 2008 ..................................... A-31
31 Average annual earnings for registered nurses working full-time in their principal nursing position, by employment setting: 2008 ............... A-32
32 Average annual earnings for registered nurses working full-time in their principal nursing position, by job title and highest nursing or nursing-related education: 2008 ................................................................... A-33
33 Job satisfaction, by employment setting in principal nursing position: 2008 ...................................................................................................... A-34
34 Job satisfaction, by job title in principal nursing position: 2008 .................. A-35
35 Job satisfaction of registered nurses employed in nursing, by age group: 2008 .......................................................................................................... A-36
36 Job satisfaction of registered nurses employed in nursing, by highest nursing or nursing-related education: 2008 ....................................... A-37
37 Employment status in 2007, by employment status in 2008: 2008 ............. A-38
38 Employment setting in 2007, by employment setting in 2008: 2008 ...................................................................................................................... A-39
39 Reasons for employer or position change among registered nurses employed in nursing in 2007 and 2008: 2008 ..................................... A-40
40 Reasons for registered nurses to have occupation other than nursing: 2008 ....................................................................................................... A-41
41 Type of employment of registered nurses who are in non-nursing occupations and not employed in nursing: 2008 ........................................... A-42
42 Detailed type of employment of registered nurses who are in non-nursing occupations and not employed in nursing: 2008 ..................... A-43
Contents (continued)
Appendix A Tables Page
xx
43 Job title of registered nurses who are in non-nursing occupations and not employed in nursing: 2008 .................................................................. A-44
44 Advanced practice registered nurses, by employment status: 2008............. A-45
45 Advanced practice registered nurses and job title, by national certification and State Board recognition: 2008 ............................................. A-46
46 Advanced practice study focus: 2008 ............................................................... A-47
47 Certifications in advanced practice registered nursing: 2008 ....................... A-48
48 Age distribution of registered nurses not employed in nursing, by length of time not working in nursing: 2008 .................................................. A-49
49 Age and presence of children, by employment status in principal nursing position: 2008 ........................................................................................ A-50
50 Resident State in 2007 and 2008, by age group: 2008 ................................... A-51
51 Registered nurses not employed in nursing and length of time since last worked as a nurse, by whether or not registered nurse was seeking nursing position or had other occupation outside of nursing: 2008 ....................................................................................................... A-52
52 Registered nurses not employed in nursing and actively seeking nursing employment, by type of employment sought and number of months looking: 2008 .................................................................................... A-53
53 Age and caring for adults at home or others elsewhere, by employment status in principal nursing position: 2008 ................................ A-54
54 Marital status and presence of children, by employment status in principal nursing position: 2008 ....................................................................... A-55
55 Marital status and caring for adults at home or others elsewhere, by employment status in principal nursing position: 2008 ........................... A-56
56 Household income and marital status, by employment status in principal nursing position: 2008 ....................................................................... A-57
57 Registered nurses in each State and geographic area, by activity status: 2008 .......................................................................................................... A-58
58 State and geographic area of registered nurses, by employment status in principal nursing position: 2008 ........................................................ A-60
Contents (continued)
Appendix A Tables Page
xxi
59 Employment setting of principal nursing position, by geographic area: 2008 ............................................................................................................. A-62
60 Average annual earnings for registered nurses working full-time as staff nurses in their principal nursing position, by geographical area: 2008 ............................................................................................................. A-63
61 Registered nurses employed in nursing in each State and geographic area, by highest nursing or nursing-related education: 2008 ...................................................................................................................... A-64
62 Age distribution and average age of registered nurses, by geographic area for all registered nurses and registered nurses employed in nursing: 2008 ................................................................................ A-66
63 Racial/ethnic background of registered nurses, by geographic area: 2008 ............................................................................................................. A-67
64 Geographic location of registered nurses, by employment status: 2008 ...................................................................................................................... A-68
65 Predominant countries where internationally educated nurses received initial nursing education, by employment status: 2008 .................. A-69
66 Predominant States employing internationally educated nurses (IENs): 2008 ........................................................................................................ A-70
67 Employment setting of internationally educated nurses (IENs), by selected job titles: 2008 ................................................................................. A-71
Appendix B Tables
B1-1 Sample information for States where the strata were based only on Alaska, Hawaii, and New Mexico (sorted by frame size) ........................ B-4
B1-2 Sample information for States where strata were based only on Alaska, Hawaii, and New Mexico (sorted alphabetically) ............................. B-5
B1-3 Sampling States where strata are based on RNs licensed in neighboring States as well .................................................................................. B-6
B2-1 Response rates, unweighted and weighted by State and for the United States as a whole .................................................................................... B-12
Contents (continued)
Appendix B Tables Page
xxii
B3-1 Distribution of imputation rates ....................................................................... B-17
B4-1 Standard errors for select estimates ................................................................. B-27
B5-1 Evaluating potential for reduction in bias: Comparing final 2008 estimates with 2008 estimates using a weight that does not account for differential response rates by age ................................................ B-34
B5-2 Comparing 2008 NSSRN and 2008 American Community Survey (ACS) estimates on racial/ethnic background, and age group ..................... B-38
Figures
1-1 The nursing workforce of the United States, 1980-2008 .............................. xxxviii
2-1 Distribution of registered nurses according to initial nursing education, 1980-2008 ......................................................................................... 2-2
2-2 Average age at graduation from initial nursing education, by type of program ........................................................................................................... 2-3
2-3 Sources of financing for initial education for all U.S. registered nurses .................................................................................................................... 2-4
2-4 Highest nursing or nursing-related education preparation, 1980-2008 ...................................................................................................................... 2-8
2-5 Highest education of registered nurses, by initial nursing education .............................................................................................................. 2-10
3-1 The nursing population and workforce in the United States, 1980-2008............................................................................................................. 3-2
3-2 Employment status of registered nurses ......................................................... 3-3
3-3 Age distribution of the registered nurse population, 1980-2008 ................. 3-4
3-4 Employment of registered nurses, by age group ............................................ 3-5
3-5 Employment rates, by initial nursing education ............................................. 3-6
3-6 Employment rates, by highest nursing or nursing-related education .............................................................................................................. 3-7
3-7 Employment settings of registered nurses ...................................................... 3-9
Contents (continued)
Figures Page
xxiii
3-8 Types of hospitals in which registered nurses employed in hospital settings work ......................................................................................... 3-10
3-9 Employment settings of registered nurses, 1980-2008 ................................. 3-12
3-10 Employment settings, by highest nursing or nursing-related education .............................................................................................................. 3-14
3-11 Registered nurses holding multiple positions, by primary employment status .............................................................................................. 3-18
3-12 Months worked per year in principal nursing position ................................. 3-21
3-13 Hours worked per year in all nursing positions ............................................. 3-22
3-14 Hours worked per week in principal nursing position .................................. 3-23
3-15 Time spent by registered nurses in various activities .................................... 3-33
3-16 Time spent by registered nurses in various activities, by job title ................ 3-35
3-17 Actual and inflation-adjusted “real” average earnings for full-time registered nurses in their principal nursing position ...................................... 3-39
3-18 Job satisfaction of registered nurses ................................................................ 3-44
3-19 Job satisfaction, by employment setting of principal nursing position ................................................................................................................. 3-46
3-20 Job satisfaction, by job title in principal nursing position ............................ 3-47
3-21 Job satisfaction of registered nurses employed in nursing, by age .............. 3-49
3-22 Job satisfaction of registered nurses employed in nursing, by highest nursing or nursing-related education ................................................. 3-50
3-23 Comparison of employment status of registered nurse population in 2007 and 2008 ................................................................................................. 3-52
3-24 Intentions to stay in nursing over the next 3 years, by age group ............... 3-54
3-25 Non-nursing positions among registered nurses not employed in nursing, by years since last worked in nursing ................................................ 3-56
3-26 Employment settings of registered nurses employed outside of nursing .................................................................................................................. 3-57
Contents (continued)
Figures Page
xxiv
3-27 Job titles of registered nurses employed outside of nursing ......................... 3-58
4-1 Age distribution of registered nurses who work as faculty........................... 4-3
4-2 Highest education of registered nurses who work as faculty ....................... 4-4
4-3 Highest education of registered nurses who work as faculty in their principal position, by type of program in which they work ................ 4-5
4-4 Satisfaction of registered nurses who work as faculty in their principal nursing position .................................................................................. 4-7
5-1 Registered nurses prepared for advanced practice, 2004-2008 .................... 5-2
5-2 Registered nurses prepared in advanced practice nursing ............................ 5-4
5-3 Age distribution of registered nurses prepared as nurse practitioners ......................................................................................................... 5-5
5-4 Nurse practitioner preparation, by highest nursing or nursing-related degree ....................................................................................................... 5-6
5-5 Hours worked per week by employed nurse practitioners in their principal nursing position .................................................................................. 5-7
5-6 Job titles of nurse practitioners ......................................................................... 5-8
5-7 Employment settings in which nurse practitioners work ............................. 5-11
5-8 Percent of nurse practitioners whose primary level of care is ambulatory or primary care, by employment setting ..................................... 5-12
5-9 Nurse practitioner satisfaction with principal position ................................. 5-13
5-10 Age distribution of registered nurses prepared as nurse midwives ............. 5-15
5-11 Nurse midwife preparation, by highest nursing or nursing-related degree ................................................................................................................... 5-16
5-12 Hours worked per week by employed nurse midwives in their principal nursing position .................................................................................. 5-17
5-13 Job titles of nurse midwives .............................................................................. 5-18
5-14 Employment settings in which nurse midwives work ................................... 5-19
Contents (continued)
Figures Page
xxv
5-15 Nurse midwife satisfaction with principal position ....................................... 5-20
5-16 Age distribution of registered nurses prepared as nurse anesthetists ........................................................................................................... 5-22
5-17 Nurse anesthetist preparation, by highest nursing or nursing-related degree ....................................................................................................... 5-23
5-18 Hours worked per week by employed nurse anesthetists in their principal nursing position .................................................................................. 5-24
5-19 Nurse anesthetists satisfaction with principal position ................................. 5-25
5-20 Age distribution of registered nurses prepared as clinical nurse specialists .............................................................................................................. 5-28
5-21 Clinical nurse specialist preparation, by highest nursing or nursing-related degree ........................................................................................ 5-29
5-22 Hours worked per week by employed clinical nurse specialists in their principal nursing position ......................................................................... 5-30
5-23 Job titles of employed nurses prepared as clinical nurse specialists ............ 5-31
5-24 Job titles of employed nurses dual-prepared as clinical nurse specialists and nurse practitioners .................................................................... 5-32
5-25 Employment settings in which clinical nurse specialists work ..................... 5-33
5-26 Clinical nurse specialist satisfaction with principal position ......................... 5-34
6-1 Age distribution of nurses who are not working in nursing ......................... 6-2
6-2 Percentage of nurses not working in nursing, by age and presence of children ............................................................................................................ 6-3
6-3 Length of time since nonworking nurses last worked in nursing, by age .................................................................................................................... 6-4
6-4 Reasons nurses are not working in nursing, by age group ........................... 6-5
6-5 Percent of registered nurses seeking nursing employment, by number of years since last worked in nursing and age .................................. 6-7
7-1 Percent of registered nurses working in nursing, by age cohort, 1988-2008............................................................................................................. 7-2
Contents (continued)
Figures Page
xxvi
7-2 Percent of men employed in nursing, by job title .......................................... 7-4
7-3 Percent of registered nurses who are White or non-White .......................... 7-5
7-4 Racial/ethnic distribution, by year of graduation from initial nursing education ................................................................................................ 7-6
7-5 Distribution of registered nurses and the U.S. population, by racial/ethnic background ................................................................................... 7-7
7-6 Distribution of employment settings, by geographic region ........................ 7-13
7-7 Median earnings for staff and management/administration registered nurses, by geographic region ........................................................... 7-14
7-8 Percent of employed registered nurses with a bachelor’s degree and higher, by region .......................................................................................... 7-15
7-9 Percent of employed registered nurses in racial/ethnic minority groups, by geographic region ............................................................................ 7-16
8-1 Countries of origin of internationally educated nurses in the United States ........................................................................................................ 8-2
8-2 Secondary nursing positions held by IENs working full-time in their principal nursing position ......................................................................... 8-6
10-1 Percent of employed registered nurses working full-time and part-time, by age group ...................................................................................... 10-3
For citation please use: U.S. Department of Health and Human Services, Health Resources and Services Administration (2010). The Registered Nurse Population: Findings from the 2008 National Sample Survey of Registered Nurses.
For an electronic copy of the report and further information: http://bhpr.hrsa.gov/healthworkforce/rnsurvey
Executive Summary
Purpose of the National Sample Survey of Registered Nurses
The National Sample Survey of Registered Nurses (NSSRN), which has been conducted since 1977, is the largest survey of registered nurses (RNs) in the United States. Nurses with active RN licenses are asked to report on their education, employment, intentions regarding nursing work, and demographics. These data are used by policymakers and numerous stakeholders, both domestic and international, to assess the status of and trends in the U.S. nursing workforce.
The Size of the Registered Nurse Workforce
There were an estimated 3,063,162 licensed registered nurses living in the United States, as of March 2008. This is an increase of 5.3 percent from March 2004, representing a net growth of 153,806 RNs. An estimated 444,668 RNs received their first U.S. license from 2004 through 2008, and thus approximately 291,000 RNs allowed their U.S. licenses to lapse, possibly indicating that the substantial retirements that have been anticipated may have begun.
Initial Education of Registered Nurses
The most commonly reported initial nursing education of RNs in the United States is the Associate Degree in Nursing (ADN), representing 45.4 percent of nurses. Bachelor’s or graduate degrees were received by 34.2 percent of RNs, and 20.4 percent received their initial education in hospital-based diploma programs. The average age of RNs who graduated from their initial nursing education program is rising. More than 21 percent of RNs earned an academic degree prior to their initial nursing degree. Nearly two-thirds of RNs reported working in a health occupation prior to their initial nursing education.
xxvii
Executive Summary
Highest Education Preparation of Registered Nurses
After initial licensure, RNs can obtain additional academic degrees in nursing or nursing-related fields. In 2008, half of the RN population had a bachelor’s or higher degree in nursing or a nursing-related field, while the other half’s highest education level was a diploma or an ADN.
Employment of Registered Nurses
In 2008, an estimated 2,596,399 RNs were employed in nursing, representing 84.8 percent of licensed RNs. This was the highest rate of nursing employment since the NSSRN commenced in 1977. There also has been the first increase in full-time employment since 1996, rising from 58.4 percent of RNs in 2004 to 63.2 percent in 2008. Among nurses under 50 years old, 90 percent or more are employed in nursing positions; this percentage drops to less than half of RNs over age 65.
Hospitals remain the most common employment setting for RNs in the United States, increasing from 57.4 percent in 2004 to 62.2 percent of employed RNs in 2008. The increase in this percentage is the first increase since 1984. While nearly 90 percent of RNs under 25 years old work in hospitals, less than 53 percent of RNs age 55 and older work in hospitals.
Fewer than half of nurses with master’s degrees work in hospitals; more than 18 percent are in ambulatory care settings and nearly 12 percent are in academic education.
The most common job title of RNs in the United States is “staff nurse,” or its equivalent (66.3 percent). Between 2004 and 2008, the proportion of staff RNs increased by 2.2 percent. Just under 20 percent of RNs with graduate degrees are staff RNs, compared with 72.8 percent of those without a graduate degree. The next most common job title in 2008 included management and administration titles (12.5 percent).
Many registered nurses hold more than one job in nursing. Overall, about 12 percent of RNs who have a full-time primary nursing position and 14 percent of those with part-time primary positions have additional nursing positions.
More than half of RNs work at least 40 hours per week in their principal nursing position, and another 24.2 percent work 32 to 39 hours per week. A total of 19.1 percent of RNs report that they
xxviii
Executive Summary
worked on-call or could have been called to work (on “standby”) during a typical work week in their principal nursing positions. Among RNs employed in nursing positions, 27.5 percent report that they worked overtime averaging 7.5 hours per week and received pay for such work.
Earnings and Satisfaction of Registered Nurses
Average annual earnings for RNs employed full-time in 2008 were $66,973, rising 15.9 percent since the 2004 average of $57,785. When annual earnings are adjusted for inflation to 1980 dollars, earnings in 2008 increased only 1.7 percent from average inflation-adjusted 2004 earnings. The highest earnings were reported by nurse anesthetists (NAs), who averaged $135,776 per year. Staff nurses earned $61,706 per year, on average. Registered nurses with graduate degrees earned an average of at least $20,000 more than did RNs with other levels of education.
In 2008, 29.3 percent of RNs reported that they were extremely satisfied and a further 51.8 percent reported being moderately satisfied with their principal nursing position. This compares with 2004 rates of satisfaction of 27.5 percent and 50.5 percent, respectively. Only 11.1 percent were dissatisfied in 2008, as compared with 13.8 percent in 2004. The highest rates of being moderately or extremely satisfied were reported by registered nurses working in academic education programs (86.6 percent), while the lowest rate of being either moderately or extremely satisfied was reported by nurses in nursing homes/extended care (74.5 percent).
Job Changes and Future Employment Plans
Nearly 80 percent of RNs were employed in nursing in both 2007 and 2008, while 12.3 percent were not employed in nursing in either year. Nearly 3 percent were employed in nursing in 2007, but not in 2008, and conversely, 2.4 percent returned to employment in 2008. Of those who were employed in 2007 but not in 2008, 27.3 percent (24,430) reported that they stopped working due to retirement. Among nurses who worked full-time in 2007, 11.6 percent changed to a different employer by 2008. Another 6.5 percent of these RNs worked with the same employer, but held a different position. More than 73 percent of RNs reported that they changed positions or employers due at least in part to workplace issues, such as lack of good management or inadequate staffing. Personal career reasons, such as interest in another position or improved pay or benefits, were a factor in job
xxix
Executive Summary
changes for 37.5 percent of nurses. Nearly 30 percent of nurses changed jobs at least in part due to personal family reasons.
The percentage of employed RNs who intended to leave nursing within 3 years is quite small, at 3 percent or fewer, among nurses under 55 years old. Among RNs 55 and older who worked in nursing in 2008, 12.5 percent intended to leave the nursing profession within 3 years and another 8.9 percent intended to leave their current nursing jobs and were unsure if they will remain in nursing afterward.
Nurse Faculty
There were an estimated 31,056 RNs working as faculty in their principal nursing position in 2008. The majority (60 percent) of these worked in programs that provide education at the Bachelor’s of Science in Nursing (BSN) level or a higher level. Another 38.3 percent worked in ADN education programs. An additional 34,666 RNs worked in academic education settings as a secondary nursing position.
In 2008, more than 40 percent of RNs who worked as faculty in their principal nursing position were between the ages of 50 and 59, and more than 19 percent of RNs whose principal position is as faculty were 60 years or older. Nursing faculty received somewhat lower annual earnings than RNs in general from their principal full-time nursing position. Earnings from principal nursing positions for RNs who work full-time averaged $66,973 in 2008, while earnings for faculty RNs were $63,985 on average. Nearly 90 percent of faculty reported that they are moderately or extremely satisfied with their position, as compared with 81.1 percent of all working RNs. The satisfaction of faculty is similar to that of nurses with graduate degrees, of whom 87.3 percent were moderately or extremely satisfied.
Nurse Practitioners
In 2008, an estimated 158,348 nurses had preparation as nurse practitioners (NPs). NPs represent the largest group of advanced practiced registered nurses (APRNs). About 35 percent of NPs were under 45 years old. Nearly 85 percent of NPs reported that they held a master’s degree and 3.9 percent reported holding a doctorate degree. Of all NPs, 10.3 percent also were prepared as clinical
xxx
Executive Summary
nurse specialists (CNSs). More than 93 percent of NPs employed in nursing reported having either national certification or State Board recognition.
Most NPs were employed in nursing (89.2 percent), and 69.6 percent of these NPs had a principal position job title of NP. Virtually all NPs who reported NP as their job title had national certification or State Board recognition. Some NPs (11.4 percent) reported that their job title was staff nurse or an equivalent; others worked in instruction or had a management or administration title. More than 38 percent of NPs were employed in hospital settings, including primary care clinics located in or owned by a hospital. Another 35.3 percent worked in ambulatory care settings outside hospitals.
Nurses prepared as NPs in 2008 earned an average of $73,776 per year in their principal nursing position. More than 87 percent of NPs were moderately or extremely satisfied with their principal position.
Nurse Midwives
Nurse midwives (NMs) were the smallest of the APRN groups, with an estimated 18,492 nurses prepared as NMs. More than 54 percent were 50 years or older, and half (50.3 percent) reported having a graduate degree. More than 91 percent of NMs employed in nursing had national certification or recognition from their State Board of Nursing.
The majority (84.3 percent) of NMs were employed in nursing positions in 2008, but only 41.7 percent of employed NMs reported a job title of nurse midwife. All of these NMs also had State Board recognition or national certification in this field. The majority (57.9 percent) of NMs worked in hospital settings, and 25.1 percent worked in ambulatory care.
Nurses prepared as NMs earned an average of $69,222 per year. They had a high level of satisfaction with their principal nursing position, with 86.2 percent being moderately or extremely satisfied.
xxxi
Executive Summary
Nurse Anesthetists
NAs were the third largest group of APRNs, with an estimated 34,821 nurses prepared as anesthetists in 2008. NAs were also the youngest group of APRNs: nearly 40 percent were under 45 years old. Nearly 40 percent of NAs were men. In 2008, 65.4 percent of NAs held a master’s or doctorate degree as their highest nursing or nursing-related degree, and almost all had national certification or State Board recognition (99.3 percent).
In 2008, 31,868 NAs were employed in nursing positions (91.5 percent). Registered nurses prepared as NAs earned an average of $135,776 per year, making them the highest-paid APRN group. They were the most satisfied of the APRN groups, with 93.5 percent reporting moderate or extreme satisfaction with their principal position.
Clinical Nurse Specialists
In 2008, there were an estimated 59,242 nurses prepared as CNSs. CNSs were the second largest group of APRNs. There was a marked decline of 18.3 percent in the number of CNSs between 2004 and 2008. CNSs were older than other APRNs in 2008, with 63.6 percent over 50 years old. The vast majority of CNSs (92.8 percent) reported at least a master’s degree as their highest preparation, with 7.2 percent completing a doctorate degree for their CNS preparation. More than 50 percent had national certification or recognition from their State Board of Nursing. CNSs had the lowest rate of employment in nursing of all the advanced specialties, with 84 percent working in nursing. Only 18.8 percent of CNSs reported their job title as clinical nurse specialist. Other common job titles among nurses prepared as CNSs are instruction (21.1 percent), and management or administration (17.8 percent). Nearly half of nurses prepared as CNSs worked in hospitals (49.4 percent).
Some nurses prepared as CNSs also had preparation in other advanced specialties. More than 27 percent of CNSs also had preparation as NPs. Among such dual-prepared RNs the most common job title was nurse practitioner (54.8 percent).
Nurses prepared as CNSs in 2008 earned an average of $74,918 per year in their principal nursing position. CNSs were very satisfied with their principal positions, with 91 percent being moderately or extremely satisfied.
xxxii
Executive Summary
Nurses Who Do Not Work in Nursing
An estimated 466,564 RNs were not employed in nursing in 2008. Nearly one-third of RNs who were not working in nursing were 65 years of age or older; almost half were 60 years of age or older. The decision to work in nursing is more closely tied to age of registered nurses’ children than presence of them; RNs whose children were all under age 6 were less likely to work in nursing than were RNs whose children were all at least 6 years old.
Overall, about half of RNs who were not working in nursing in 2008 have been out of nursing work for 4 or fewer years. Among nurses who were under 50 years old, 57.5 percent have been out of nursing for less than 4 years. Reasons for not working in nursing are often associated with life stages, such as the need to care for children or retirement. However, 41 percent of RNs under 50 years old reported that they were not working in nursing due to workplace problems such as burnout, stressful work environment, and poor management. This is of concern. Among nurses 50 years and older, personal and family reasons (41.5 percent), workplace reasons (35.5 percent), and personal career factors (32.4 percent) also were important. Among RNs under 50 years old who were not working in nursing, only about 15 percent did not intend to return to nursing work.
Demographics and Diversity
For the first time in the past three decades, the aging of the nursing workforce slowed. In 1988, half of the working population of RNs was less than 38 years of age, but in 2004 that figure rose to 46 years and remained steady at 46 years of age in 2008. This slowdown in the aging trend resulted from an increase in employed RNs less than 30 years of age—the first increase seen in this age group since the inaugural NSSRN in 1977.
Men comprised a growing percent of the RNs in 2008, making up 6.2 percent of employed RNs who were licensed before 2000 and 9.6 percent of those licensed in 2000 or more recently. The employment profile of men who work in nursing differs from that of women. More men reported principal employment in a hospital and work as NAs.
Significant gains in racial/ethnic minority representation among RNs have been made over time. The population of RNs from minority racial/ethnic groups increased from 333,368 in 2000 to 513,860 in 2008, with the growth occurring primarily among recently graduated RNs. However, the
xxxiii
Executive Summary
racial and ethnic distribution of the RN population is substantially different from that of the U.S. population. Approximately 65 percent of the U.S. population is White, non-Hispanic, while 83.2 percent of RNs are White, non-Hispanic.
Internationally Educated Nurses
Internationally educated nurses (IENs) are RNs whose initial nursing education took place outside of the United States or in the U.S. territories (formerly termed foreign-trained or foreign-educated nurses). They represent a larger percentage of the U.S. nursing workforce in recent years, comprising 5.1 percent of RNs licensed before 2004, compared with 8.1 percent since then. The Philippines continued to dominate as the source country of the IEN workforce (50 percent), followed by Canada at nearly 12 percent. India supplied 9.6 percent and the United Kingdom provided 6 percent, with the contributions from India accelerating and surpassing those from the United Kingdom among recent licensees. Approximately one-quarter of IENs lived in California in 2008, with New York, Florida, and Texas each home to 10 to 12 percent of IENs.
Most IENs (88.3 percent) were employed in nursing in 2008, a somewhat higher percentage than RNs in general (84.8 percent). IENs were more likely than their U.S.-educated counterparts to work full-time. A greater percentage (17.2 percent) of internationally educated RNs hold secondary nursing positions than do RNs in general. Approximately three-quarters of IENs licensed since 2004 are employed in hospital settings. Most IENs licensed since 2004 (94.1 percent) have staff nurse job titles.
Recent Nurse Graduates
In this report, recent graduates are defined as those RNs who completed their initial nursing education after 2000 (from 2001 to 2008). The most recent graduates are those who completed their initial nursing education after 2004 (2005 to 2008). Recent graduates comprised nearly 20 percent of all RNs in the United States in 2008 and about 23 percent of employed RNs.
About 39 percent of recent graduates entered the profession with a BSN; only 3 percent had a diploma nursing education. RNs who graduated before 2001 completed their nursing programs at an average age of 26.7 years, while the average age of the recent graduates was a little over 30 years.
xxxiv
Executive Summary
RNs among the most recent graduate cohort were more likely than RNs who graduated in any previous cohort to have received a postsecondary degree prior to entering nursing; 31.7 percent of graduates from 2001 to 2004 had a prior postsecondary degree, compared with 37.1 percent of graduates from 2005 to 2008.
More than 10 percent of RNs who completed their initial nursing education between 2001 and 2004 later completed additional degrees. Bachelor’s degrees were completed by nearly 10 percent of graduates from diploma or ADN programs; master’s or doctorates were completed by more than 10 percent of BSN graduates and almost 2 percent of diploma or ADN graduates.
The vast majority of recent graduates were employed in nursing positions in 2008 (94.5 percent of 2001–2004 graduates and 96.6 percent of 2005–2008 graduates), and 83.8 percent of the most recent graduates worked full-time.
Hospitals employed more than 83 percent of the most recent graduates and more than 75 percent of RNs who graduated in 2001 to 2004. The most common job title held by all working RNs was staff nurse or an equivalent title, with 92.2 percent of the most recent graduates and 80.7 percent of graduates from 2001 to 2004 having this title.
Recent graduates were less satisfied with their principal nursing positions than were RNs who graduated before 2001.
In addition, recent graduates change jobs somewhat more frequently than RNs who graduated prior to 2001. Of all employed RNs, 14.9 percent of graduates from 2001 to 2004 had changed employers for their principal nursing position in the previous year and 7.5 percent had changed positions but were with the same employer. Among the 2005 to 2008 graduates, the percentages for job changing were similar. The reasons for job changes varied, but those cited most frequently were related to working conditions. Recent graduates were more likely to report that they changed jobs for career reasons than were pre-2001 graduates. Recent graduates also were more likely than pre-2001 graduates to report that personal or family reasons drove their job change.
Nearly 40 percent of recent graduates planned to leave their current jobs within 3 years, compared with 27.1 percent of pre-2001 graduates. Nonetheless, the vast majority of recent graduates intended to remain in the nursing profession, with only 3.3 percent of those who intended to leave their current job stating that they did not plan to stay in nursing.
xxxv
Executive Summary
xxxvi
Average earnings from all nursing positions for the most recent graduates were $52,994. The total nursing earnings of the most recent graduates were lower on average than the average total earnings of RNs who graduated from 2001 to 2004 ($57,489) and lower than the average total earnings for RNs graduating before 2001 ($62,903).
Nurses Nearing Retirement
Older RNs over age 50 comprised 44.7 percent of the total RN population in 2008, compared with 33 percent in 2000. The percentage of older RNs working in nursing in 2008 declines steadily from 87.5 percent for those 50–54 years of age to 33.3 percent for those aged 75 and older. RNs aged 50–54 in 2008 who were employed full-time worked an average of 43.7 hours per week, slightly more than the average for full-time nurses under age 50. Beginning at age 60, the hours worked by part-time nurses declines steadily with age. Older RNs are also less likely than younger RNs to have secondary positions in nursing.
While a smaller percentage of older nurses worked in hospital positions in 2008, higher percentages are employed in nursing homes/extended care, academic education programs, and home health settings. The majority of RNs in 2008 remained employed with the same employer, and older RNs were more likely to be in the same position and with the same employer year to year when compared with younger nurses. Registered nurses 50 to 59 years old were less likely to report an intention to leave their current nursing position within 3 years than were RNs under 50 years old. As RNs grow older, and especially for RNs older than age 60, retirement becomes an increasingly dominant reason for employment changes.
xxxvii
Introduction
Conducted since 1977, the National Sample Survey of Registered Nurses (NSSRN) is the largest survey of the Registered Nurses (RNs) workforce in the United States. A sample of nurses with active RN licenses from every State are asked to report on their education, employment, intentions regarding nursing work, and demographics. The resulting data are used by policymakers and numerous stakeholders, both domestic and international, to assess status and trends in the U.S. nursing workforce. The data are also used to evaluate the responsiveness of the workforce to Federal and State programs seeking to ensure workforce capacity for providing essential health care services and identifying areas for further research. These data illustrate education and skills of the RN workforce, portray the diversity of RNs, illustrate the U.S. employment of internationally educated nurses, depict the factors that affect RNs’ decisions to work in the nursing profession, and support efforts to forecast the future supply of and demand for RNs. After the first survey was conducted in 1977, the NSSRN has been conducted every 4 years since 1980. This report provides findings from the survey conducted in 2008.
The Registered Nurse Workforce in the United States
There were an estimated 3,063,162 licensed RNs living in the United States, as of March 2008 (Figure 1-1 and Appendix A, Table 1).1 This is an increase of 5.3 percent from March 2004, representing a net growth of 153,806 RNs.2 Based on data from the results of the 2008 survey, an estimated 444,668 RNs received their first U.S. license from 2004 through 2008, and thus approximately 291,000 RNs had a lapsed RN license during this time period. These data indicate that the long anticipated and substantial retirements from the nursing field may have begun. Thus, even as new graduates enter the field, overall nursing workforce growth may be affected by RNs leaving the profession.
1 The standard error for the estimate of the total number of RNs licensed and living in the United States is 4,045.8. The 95 percent confidence interval
has a lower limit of 3,055,232 and an upper limit of 3,071,092. Please see Chapter 1 and Appendix B for more details on weighting and estimation.
2 There were an additional estimated 11,903 internationally educated RNs holding active U.S. licenses who were not living in the United States as of March 2008. RNs living outside of the Unites States are not included in the analyses of the U.S. nursing workforce for the purposes of this report.
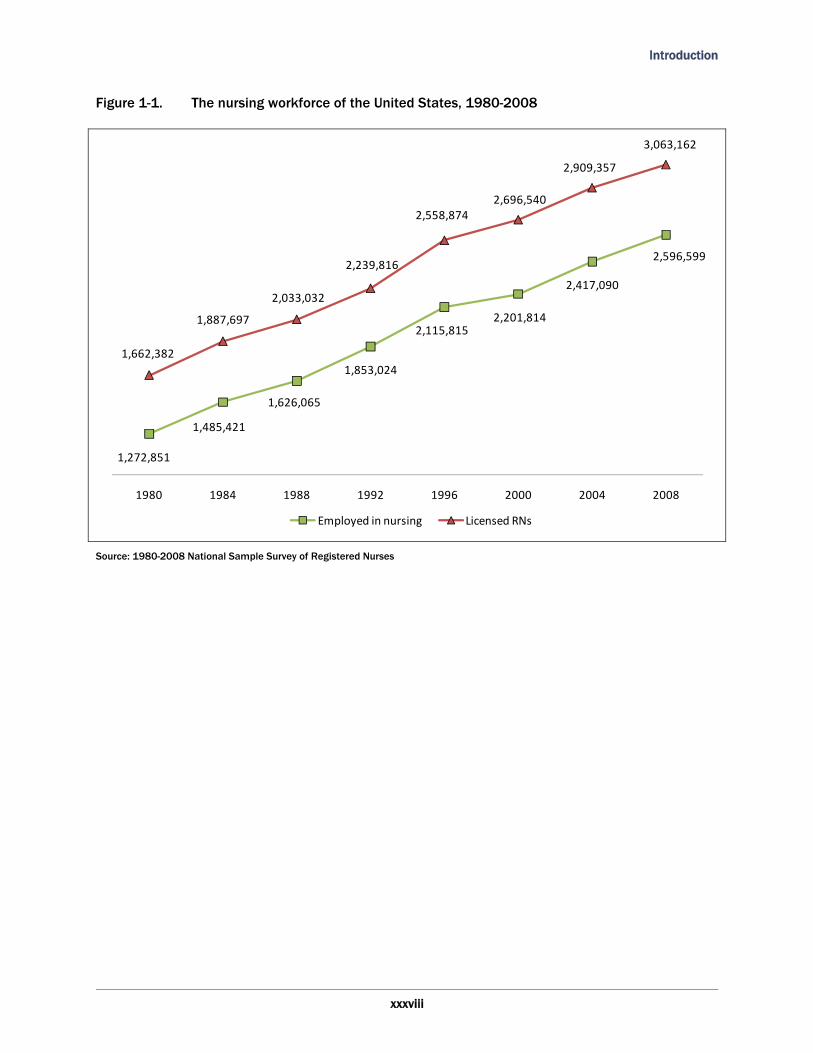
Introduction
Figure 1-1. The nursing workforce of the United States, 1980-2008
xxxviii
1,272,851
1,485,421
1,626,065
1,853,024
2,115,8152,201,814
2,417,090
2,596,599
1,662,382
1,887,697
2,033,032
2,239,816
2,558,8742,696,540
2,909,357
3,063,162
1980 1984 1988 1992 1996 2000 2004 2008
Employed in nursing Licensed RNs
Source: 1980-2008 National Sample Survey of Registered Nurses
1-1
Survey Methods 11.1 Summary
The 2008 National Sample Survey of Registered Nurses (NSSRN) was based on a randomly selected sample of individual RNs from each State’s listing of licensed RNs. The sampling rate differed by State. Sampling for all previous administrations of NSSRN was based on a randomly selected sample of alphabetic clusters of names in each State using a “nested alpha segment design.” When nested alpha-segment design was used for the first administration of the NSSRN in 1977, available data sources for identifying eligible RN listings could be on paper listings, index cards, electronic files, or other media. The alpha-segment design provided an innovative way of determining an RN’s probability of selection for the survey, in spite of the data source limitations, especially for those RNs licensed in multiple States, without having to identify a given RN on all the lists on which that individual appeared.
Technological advances in computer hardware and software since earlier NSSRN surveys have made identifying multiple appearances of the same RN on different lists feasible. The sample design for the 2008 NSSRN takes advantage of such technological advances. In so doing, the precision of the national estimates has improved. The 2008 NSSRN included a sample of 55,151 RN records. From this sample, 33,549 surveys were completed, yielding an unweighted response rate1 of 62.41 percent.
Data were collected between July 2008 and March 2009 using mailed paper surveys, electronic surveys on the World Wide Web (the Web), and direct telephone interviews. Each survey was carefully reviewed for missing or inaccurate data. When critical data were found to be missing, incomplete, or insufficient, professional telephone interviewers called the respondent to ask about the data item(s) in question. When complete data could not be obtained from the sampled RN, appropriate statistical imputation methods were used to reduce nonresponse error. The 2008 NSSRN imputation protocol used regression modeling to generate likely responses for missing values for individual questions within completed cases. Imputation of this type had not been
1 The American Association for Public Opinion Research Response Rate #3 calculation was used; it is defined as the number of completed surveys divided by the number of returned surveys (complete plus partial) plus an estimate of the number of eligible cases among those who did not respond and whose eligibility could not be ascertained.
Survey Methods 1
1-2
undertaken for any previous administration of the NSSRN but is a powerful statistical method using defined protocols.
The establishment of sample weights for the participating RNs was the final step in preparing the data for analysis and reporting. The weighting process for the 2008 NSSRN had several steps, which included identifying the initial probability of selection for each sampled record; adjusting for survey nonresponse; and accounting for multiple chances of selection for RNs who appeared on the listings of more than one State. In addition, a weight calibration procedure known as “raking” was employed to achieve consistency between the counts appearing on each State listing and the estimates of the number of RNs currently licensed in each State, based on the survey weight assignments. Weighted responses were then used to calculate national estimates.
Also different from prior NSSRN survey analyses, the nonresponse adjustment procedure used for the 2008 NSSRN used weighting to adjust for differences in rates of response to the survey by different age groups. Response rates by age group varied; generally older RNs participated at a higher rate than younger RNs. Without a weighted adjustment for age group response rates, older RNs would be overrepresented in population estimates, leading to a disproportionately large effect on survey estimates associated with age. Thus, adjusting sample weights to reflect age group participation rate served to reduce the potential for bias in some NSSRN estimates.
This chapter provides an overview of the survey methods used in the 2008 NSSRN process. Appendix B provides a more detailed description of the sample allocation, sample performance, imputation, weighing methods, and comparisons with previous survey sampling and weighting techniques. NSSRN data users who are interested in comparing the 2008 NSSRN findings with findings from previous NSSRN administrations should pay particular attention to the discussions of imputation and weighting here and in Appendix B.
The data reported in tables in the body of the report may differ slightly from data in the correspondingly cited appendix. This may be due to several factors such as the rounding of aggregate data or the context of the discussion where there is some difference in the population of interest.
Survey Methods 1
1-3
1.2 2008 Questionnaire
The content and structure of the 2008 questionnaire were very similar to the questionnaire used for the 2004 NSSRN administration. A copy of the 2008 questionnaire is included in Appendix C. The following were key questionnaire topics:
Eligibility for the survey;
Education, including initial nursing education, upgrade education post licensure, and education preparation for advanced practice nursing;
Principal nursing employment, including geographic location, employment setting, job title, hours worked, level of care, patient population, clinical specialty, earnings, and job/employment intentions;
Secondary employment, including employment settings, hours worked, and earnings;
Nurses not working in nursing, including their intention to return to nursing and reasons for not working in nursing;
Employment outside nursing, including area/field of work, hours worked, and earnings;
Prior nursing employment, including reasons for job change, geographic location of prior employment, and prior employment setting;
General information about the responding RN, including job satisfaction, geographic location of current residence and residence 1 year ago, race and ethnicity, language fluency, number of dependents in the household, and household earnings; and
Licensing and certification information.
Some revisions to the 2008 questionnaire addressed new or emerging topics of interest and improved data quality. Additionally, some questions were converted from “check one” to “check all that apply” to better capture the richness and breadth of information about RNs. Of particular note are the survey additions or revisions in the following areas:
Employment setting (questions 23 and 57);
Job title (question 24);
Level of care (question 29a);
Patient population served by the RN (question 29b);
Clinical specialty (question 29c);
Survey Methods 1
1-4
Hours worked per week in their principal nursing position (question 27) and in any secondary nursing positions (question 36); and
Distribution of time across job functions (question 28).
1.3 Sample Design
From the inception of the NSSRN in 1977 through the 2004 administration, the sample of RNs was identified using a nested cluster design in which RNs were clustered alphabetically by last name: This last name cluster design is referred to as the “alpha-segment design.” Although the alpha-segment design produced good estimates of the nursing workforce over the years, it has some shortcomings. First, because RNs of the same racial/ethnic background may have similar alphabetically clustered names, the alpha-segment design may have resulted in larger than desired variation for some estimates, such as racial and ethnic composition of the RN workforce. Second, constructing an alpha-segment frame and implementing the sample design were tedious and time-consuming tasks. Third, sorting to achieve implicit stratification was not feasible. Lastly, the alpha-segment design made adjustments for differential nonresponse a bit more cumbersome.
The 2008 NSSRN sample design is based on independent systematic random samples selected from State-based strata, with equal probability of selection within each stratum. An equal probability systematic random sample can be thought of as randomly selecting a record from the beginning of a list with probability 1/n and then every nth record after that until all records on the list have had a chance of being selected. This kind of design was not feasible in 1976, but technological advances and the advent of electronic recordkeeping have largely eliminated the barriers. The 2008 NSSRN sample design was straightforward to implement and eliminated the clustering that could contribute undesirable variability to survey estimates, particularly for survey results associated with race/ethnicity.
The sample design was developed to address a number of issues:
A given RN may be licensed in more than one State.
Unduplication was carried out to eliminate additional records for a single nurse, such as a record associated with advanced practice nursing when an RN already had a basic RN license record. Therefore, for the purposes of sampling, an individual RN in a given State is associated with exactly one RN license.
Survey Methods 1
1-5
Some States (22 at the time of the 2008 administration) participate in what is known as the Nurse Licensure Compact, which affects who may appear on a given State’s listing of licensed RNs. An RN licensed in one Compact State would not have a license in other Compact States, but could work as an RN in any of the Compact States.
Some areas of the country experience significant interstate commuting of RNs, with RNs who live in one State working in another, nearby State or participate as a travel nurse for a short period of time.
Each State (and the District of Columbia) maintains a list of RNs actively licensed in that State. These State lists were used to draw a probability sample of RNs for the NSSRN from among those RNs who were licensed as of the end of 2007/early 2008. RNs appearing in the listings of licensed RNs for more than one State had multiple chances of selection for the 2008 NSSRN. To avoid duplication, multi-State strata were formed for several groups of States where interstate commuting was expected to be fairly sizeable. Probability matching was used to form such strata so that only a single record for those RNs appears in the listing for the multi-State stratum.
After these adjustments, a sample of 55,151 licensed RNs was drawn for the 2008 NSSRN. This sample size was expected to yield sufficient completed surveys to support stable State, regional, and national estimates. Data were collected on the RN population who were actively licensed as of March 10, 2008. Appendix B provides a detailed description of the sample strata, determination of the probabilities of selection, and allocation of the 55,151 RNs across the 50 States and the District of Columbia.
1.4 Data Collection Methods
The 2008 NSSRN employed a multimode approach to data collection. Data were collected from July 2008 through March 2009. Using contact information contained in State licensing records, sampled RNs were first notified of the study via a letter mailed through the U.S. Postal Service (USPS). The letter invited RNs to complete a survey via the Web. Shortly after the Web invitation was sent, paper surveys were also sent via USPS. Finally, RNs who did not respond were contacted by telephone and expedited mail. The different steps of data collection were as follows:
First Contact. A survey notification letter was sent via USPS to all RNs in the sample. The first contact mailing included a description of the study and instructions for logging on and completing the survey via the Web. No paper questionnaire was included in this first contact mailing.
Survey Methods 1
1-6
Second Contact. Two weeks after the first contact mailing, a paper questionnaire was sent via USPS to all RNs who had not completed their survey via the Web. The second contact mailing included a description of the study, a second invitation to complete the survey via the Web, and Web log-on instructions. A paper questionnaire and a postage-paid return envelope for the questionnaire were included to increase response from those RNs without Web access or who preferred paper questionnaires.
Third Contact. Approximately 3 weeks after the second contact mailing, post cards were sent to all sampled RNs reminding them to complete their survey either on paper or on the Web. A note of thanks was also included on the post card for RNs who had already completed their surveys.
Fourth Contact. A second copy of the paper questionnaire was sent to nonrespondents 3 weeks after the third contact. The fourth contact mailing was sent only to nonrespondents and included a letter requesting completion of the survey, Web log-on instructions, a paper questionnaire, and a postage-paid return envelope for the questionnaire.
Fifth Contact. After 3 weeks had passed following the fourth contact, nonresponding RNs were contacted. RNs who failed to respond after the first four contact attempts were split into two groups for follow-up. RNs whose telephone numbers were available from licensing lists were contacted for follow-up by professional telephone interviewers. Services that provide matching and telephone number searches were also used to find a telephone number for a telephone follow-up with nonresponding RNs. If the telephone number search was unsuccessful, RNs who did not respond were sent a final package via FedEx that included a letter requesting completion of the survey, Web log-on instructions, a paper questionnaire, and a postage-paid return envelope for the questionnaire.
When a survey was received that contained responses to all questions deemed necessary to meet the requirement for a completed survey, the survey was noted as “complete” and the survey data were added into the database of 2008 NSSRN complete surveys. Data collection for the 2008 NSSRN ended on March 31, 2009.
1.5 Sample Performance
Response rates are often used to help assess the quality or unbiasedness of survey results. The 2008 NSSRN unweighted response rate was 62.412 percent with a weighted response rate of 61.48 percent.
2 The American Association for Public Opinion Research Response Rate #3 calculation was used. It is defined as the number of completed surveys
divided by the number of returned surveys (complete plus partial) plus an estimate of the number of eligible cases among those who did not respond and whose eligibility could not be ascertained.
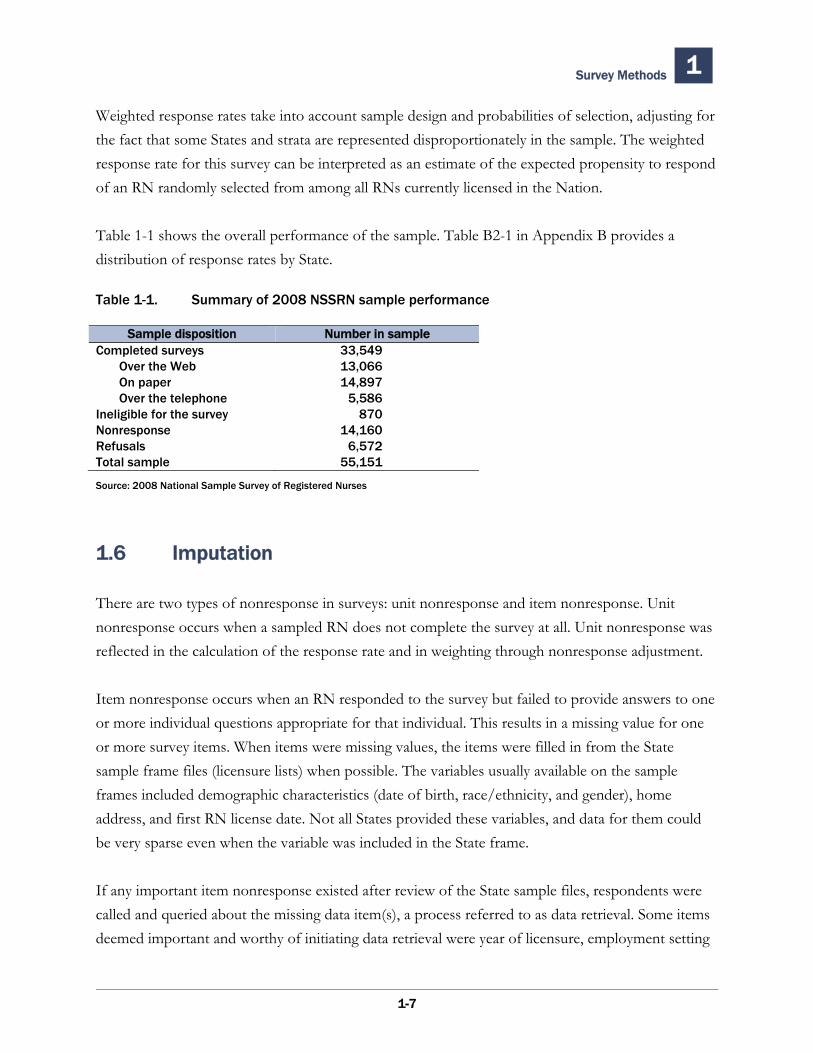
Survey Methods 1
1-7
Weighted response rates take into account sample design and probabilities of selection, adjusting for the fact that some States and strata are represented disproportionately in the sample. The weighted response rate for this survey can be interpreted as an estimate of the expected propensity to respond of an RN randomly selected from among all RNs currently licensed in the Nation.
Table 1-1 shows the overall performance of the sample. Table B2-1 in Appendix B provides a distribution of response rates by State.
Table 1-1. Summary of 2008 NSSRN sample performance
Sample disposition Number in sampleCompleted surveys 33,549 Over the Web 13,066 On paper 14,897 Over the telephone 5,586Ineligible for the survey 870Nonresponse 14,160Refusals 6,572Total sample 55,151
Source: 2008 National Sample Survey of Registered Nurses
1.6 Imputation
There are two types of nonresponse in surveys: unit nonresponse and item nonresponse. Unit nonresponse occurs when a sampled RN does not complete the survey at all. Unit nonresponse was reflected in the calculation of the response rate and in weighting through nonresponse adjustment.
Item nonresponse occurs when an RN responded to the survey but failed to provide answers to one or more individual questions appropriate for that individual. This results in a missing value for one or more survey items. When items were missing values, the items were filled in from the State sample frame files (licensure lists) when possible. The variables usually available on the sample frames included demographic characteristics (date of birth, race/ethnicity, and gender), home address, and first RN license date. Not all States provided these variables, and data for them could be very sparse even when the variable was included in the State frame.
If any important item nonresponse existed after review of the State sample files, respondents were called and queried about the missing data item(s), a process referred to as data retrieval. Some items deemed important and worthy of initiating data retrieval were year of licensure, employment setting
Survey Methods 1
1-8
for principal nursing position, job title, number of hours worked, and other data elements central to the analysis of the 2008 NSSRN data. As a last resort, when item nonresponse persisted after review of the sample frame file and data retrieval, statistical imputation was used to assign values for missing data.
The 2008 NSSRN imputation protocol relied on regression modeling to generate likely responses where there were missing values for individual questions within completed cases. Imputation statistical procedures identify a value that not only would probably be appropriate for the respondent but would also be in keeping with the distribution of values for that variable. For example, the survey items “Nurse’s year of graduation from initial nursing education” and “Year of first licensure” are highly correlated. If the year of licensure is missing from an RN’s record but not the year of graduation, the missing year of licensure value can be imputed using regression modeling. The year of licensure is the dependent variable in this case, and the year of graduation is the independent (or predictor) variable. The regression model is established using respondent cases in which both the year of licensure and year of graduation are known.
There is a component of variation associated with the generation of imputed values that is generally not reflected in survey estimates of variance. As a result, imputation can result in an understatement of the variance in survey estimates. The degree to which estimates of variability have been understated is generally considered negligible if the imputation rate is low (less than 10 percent). However, if the imputation rate is more than 20 percent, the degree of underestimation may be nontrivial.
Eighty percent of the imputed variables for the 2008 NSSRN have imputation rates below 10 percent, 19 percent are borderline (imputation rate of 10-19 percent), and three variables (1 percent of all survey variables) have an imputation rate greater than 20 percent.3 The three variables are question 11B—total number of hours provided for emergency preparedness training in the past year (imputation rate: 46 percent); question 13D_A—year of receiving an (upgrade) Associate Degree in Nursing (ADN) (imputation rate: 36 percent); and question 41—years until planned return to paid work in nursing (imputation rate: 21 percent). When working with these three variables, NSSRN data users should be aware of the potential underestimation of the variance and bias in the point estimates.
3 Imputation rates were computed as the ratio of the number of imputed cases of that variable to the total number of applicable cases in the data set.
Survey Methods 1
1-9
Further information on imputed variables and data file flags for imputed variables are included in the 2008 NSSRN codebook.
1.7 Sample Weighting
1.7.1 Overview of the Weighting Process
Data weighting was one of the final steps in preparing the data for analysis and reporting. The 2008 NSSRN weighting process consisted of several steps, as follows:
Determination of the initially assigned weights at the sampled license level;
Adjustment for survey nonresponse by age group (for strata where age was available);
Assignment of factors to account for multiple opportunities for selection (determined as part of the matching effort to determine the number of sample frames on which an RN appeared);
Establishing an initial weight at the RN level; and
Calibration of the RN level weights (via raking) to achieve consistency with State and national totals.
A detailed discussion of each of these steps in the weighting processes is found in Appendix B. The remainder of this overview discussion focuses on some key issues related to sample weighting for the 2008 NSSRN.
1.7.2 Implications of Weighting for NSSRN Data Users
Sampling error can cause sample estimates to differ from true population parameter values. Sampling error is the consequence of not measuring every unit in the population. It can be reduced with larger sample sizes, with efficiently designed sampling strategies, or with a combination of both.
In the 2008 NSSRN, both strategies were employed. For example, higher sampling rates were used for smaller States to permit more accurate State-level estimation for these States. However, this served to reduce the precision associated with national estimates compared with what would have
Survey Methods 1
1-10
been achieved with a simple random sample of the same size but with no variation by State in sampling rates. The factor by which the variance is reduced is known as a “design effect.”
In the 2008 NSSRN, sampling rates also varied between strata within a State for RNs who were either:
Residents of Alaska, New Mexico, or Hawaii but were on another State’s listing of RNs with currently active licenses; or
Members of the groups of States for which the design used multi-State strata.
Replicate weights were computed for use in estimating the variability of 2008 NSSRN estimates. Users of the 2008 NSSRN data as well as past NSSRN data are encouraged to use these weights to assess the precision of sample estimates as well as to compare estimates either within the 2008 NSSRN database or between estimates from various years.
Another important difference in the weighting methods for 2008 was the adjustment of differential nonresponse by age group. Earlier administrations of the NSSRN may have underestimated the representation of younger RNs due to undercoverage on State sampling frames. In the 2000 and 2004 NSSRN administrations, poststratification of the weights of the youngest RNs (those under the age of 26) was done to adjust the weights. However, this group represented only a small portion of licensed RNs, and the overall impact of this procedure did not address any issues that may have existed for other age categories.
While undercoverage of newly licensed RNs may still be an issue, another source of bias associated with younger RNs is that response propensities by age showed that younger RNs responded at lower rates than older RNs in the 2008 NSSRN.
In administrations prior to the 2008 NSSRN, the weight adjustment processes were global in nature. Generally speaking, poststratification was used to achieve consistency between responding RNs associated with a given State of licensure and the corresponding control total, licensed RNs in the State (who were currently active). The control total took into account RNs who were also licensed in what were characterized as “higher priority” States. Thus, if older RNs had higher response rates in a State, as they often did, they would be represented at a disproportionately high rate among the population of currently active RNs licensed in the State. This is a potential source of bias for survey estimates that are correlated with age. In addition to the general age distribution of the RN
Survey Methods 1
1-11
population, other variables that could be affected include those related to education and employment.
In summary, the 2008 NSSRN final weighting processes included a poststratification adjustment of eligible and ineligible respondents by age group to corresponding age group totals for each State frame where age was provided by the State licensing Boards (44 of 51 State Boards).
Assessing the Impact of Accounting for Differential Nonresponse by Age
To assess the extent to which survey estimates may have changed after accounting for differential nonresponse by age group, a separate set of weights was developed using a global approach to nonresponse adjustment. That is, a poststratification of all responding eligible and ineligible RNs to a single State control total for each State was undertaken. This approach thus served to simulate the approach to nonresponse adjustment used in past NSSRN administrations. This weight is referred to here as the “surrogate” weight.
A series of statistics were run to compare the estimate based on the final weight to the estimate based on the surrogate weight. Looking at some key data elements from the 2008 NSSRN, the comparison of the final weight to the surrogate weight suggests that including a weight adjustment reflecting differential response propensities by age had an important impact on the 2008 NSSRN survey estimate. Estimates where sizeable effect is in evidence are: initial nursing education, RNs with a bachelor’s degree; RNs employed in nursing; white, non-Hispanic RNs; RNs employed in a hospital setting; and most of the age group and graduation year categories.
These findings regarding the effects of nonresponse adjustment by age group should be taken into account when comparing estimates from the 2008 NSSRN to those from previous NSSRN administrations. Differences between the 2008 NSSRN estimates and those from prior years for estimates correlated with age may be due to an improvement in the weighting process rather than a significant change in the RN population over time.
Appendix B provides a more detailed discussion of the weighting process and nonresponse adjustment by age.

Survey Methods 1
1-12
This page deliberately blank.
2.1 Introduction
RNs are prepared in several types of education programs. The most frequent initial education program is the Associate Degree in Nursing (ADN), with 45.4 percent of U.S. RNs prepared in ADN programs (Figure 2-1). Some RNs pursue their initial registered nurse education after completing postsecondary education in other fields or working in another occupation. After completing an approved initial education program, a registered nurse candidate takes the National Council Licensure Examination (NCLEX), which is created and administered by the National Council of State Boards of Nursing (NCSBN), in order to receive a State license. RNs subsequently can pursue additional nursing education, including graduate-level degrees and education in Advanced Practice fields such as nurse practitioner or nurse anesthetist. Some RNs seek higher degrees in non-nursing fields (such as education and business) that are related to their nursing career.
2.2 Initial Nursing Education
Initial RN education occurs through a variety of routes. ADN programs generally require 2 years of nursing coursework after completion of prerequisites that include basic science. Bachelor’s degree programs typically span 4 years of full-time education. Diploma programs, which are traditionally based in hospitals and last 3 years, were once the most common form of nursing education in the United States. The number of these programs has steadily declined since the 1970s and many now offer an Associate of Science Degree (AS) through local community colleges. A small number of RNs qualify for their licenses based on military training or other licensing credentials. There are a few initial RN education programs that confer a master’s degree or a doctorate but most are specifically designed for students who have obtained a bachelor’s or higher degree in another field prior to pursuing nursing education.
The most commonly reported route for initial nursing education of RNs in the United States is the ADN program (Figure 2-1).
Education and Licensing of Registered Nurses 2
2-1
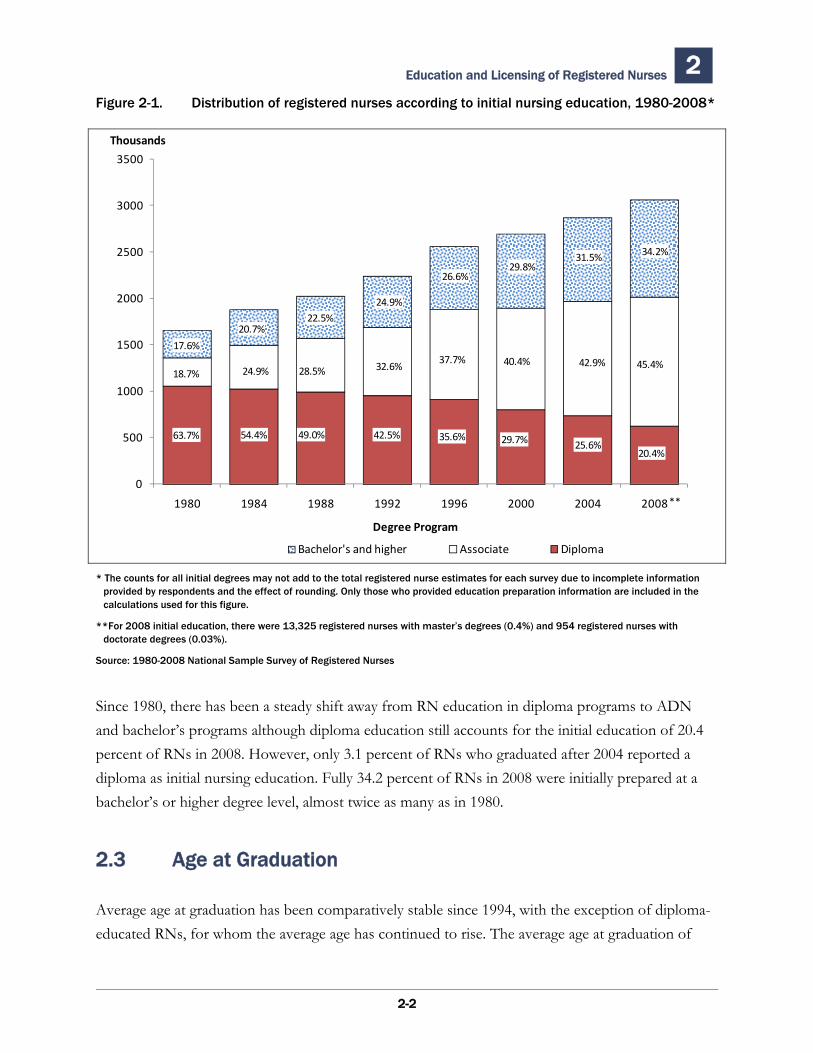
Education and Licensing of Registered Nurses 2 Figure 2-1. Distribution of registered nurses according to initial nursing education, 1980-2008*
0
500
1000
1500
2000
2500
3000
3500
1980 1984 1988 1992 1996 2000 2004 2008
Thousands
Degree Program
Bachelor's and higher Associate Diploma
**
63.7% 54.4% 42.5%49.0% 29.7%20.4%
35.6%25.6%
18.7% 28.5%24.9% 32.6% 40.4% 45.4%37.7% 42.9%
20.7%
17.6%
22.5%24.9%
26.6%29.8%
31.5% 34.2%
* The counts for all initial degrees may not add to the total registered nurse estimates for each survey due to incomplete information provided by respondents and the effect of rounding. Only those who provided education preparation information are included in the calculations used for this figure.
**For 2008 initial education, there were 13,325 registered nurses with master’s degrees (0.4%) and 954 registered nurses with doctorate degrees (0.03%).
Source: 1980-2008 National Sample Survey of Registered Nurses
Since 1980, there has been a steady shift away from RN education in diploma programs to ADN and bachelor’s programs although diploma education still accounts for the initial education of 20.4 percent of RNs in 2008. However, only 3.1 percent of RNs who graduated after 2004 reported a diploma as initial nursing education. Fully 34.2 percent of RNs in 2008 were initially prepared at a bachelor’s or higher degree level, almost twice as many as in 1980.
2.3 Age at Graduation
Average age at graduation has been comparatively stable since 1994, with the exception of diploma-educated RNs, for whom the average age has continued to rise. The average age at graduation of
2-2
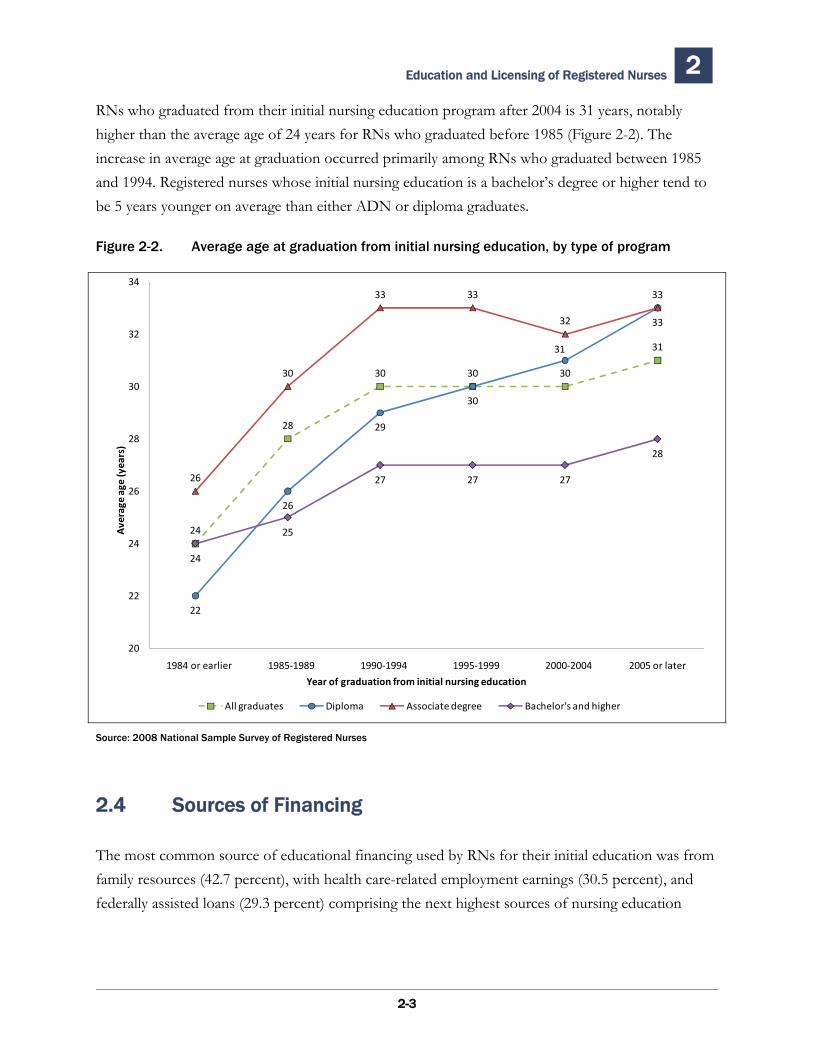
Education and Licensing of Registered Nurses 2
RNs who graduated from their initial nursing education program after 2004 is 31 years, notably higher than the average age of 24 years for RNs who graduated before 1985 (Figure 2-2). The increase in average age at graduation occurred primarily among RNs who graduated between 1985 and 1994. Registered nurses whose initial nursing education is a bachelor’s degree or higher tend to be 5 years younger on average than either ADN or diploma graduates.
Figure 2-2. Average age at graduation from initial nursing education, by type of program
24
28
30 30 30
31
22
26
29
30
31
33
26
30
33 33
32
33
24
25
27 27 27
28
20
22
24
26
28
30
32
34
1984 or earlier 1985‐1989 1990‐1994 1995‐1999 2000‐2004 2005 or later
All graduates Diploma Associate degree Bachelor's and higher
Average
age (years)
Year of graduation from initial nursing education
Source: 2008 National Sample Survey of Registered Nurses
2.4 Sources of Financing
The most common source of educational financing used by RNs for their initial education was from family resources (42.7 percent), with health care-related employment earnings (30.5 percent), and federally assisted loans (29.3 percent) comprising the next highest sources of nursing education
2-3
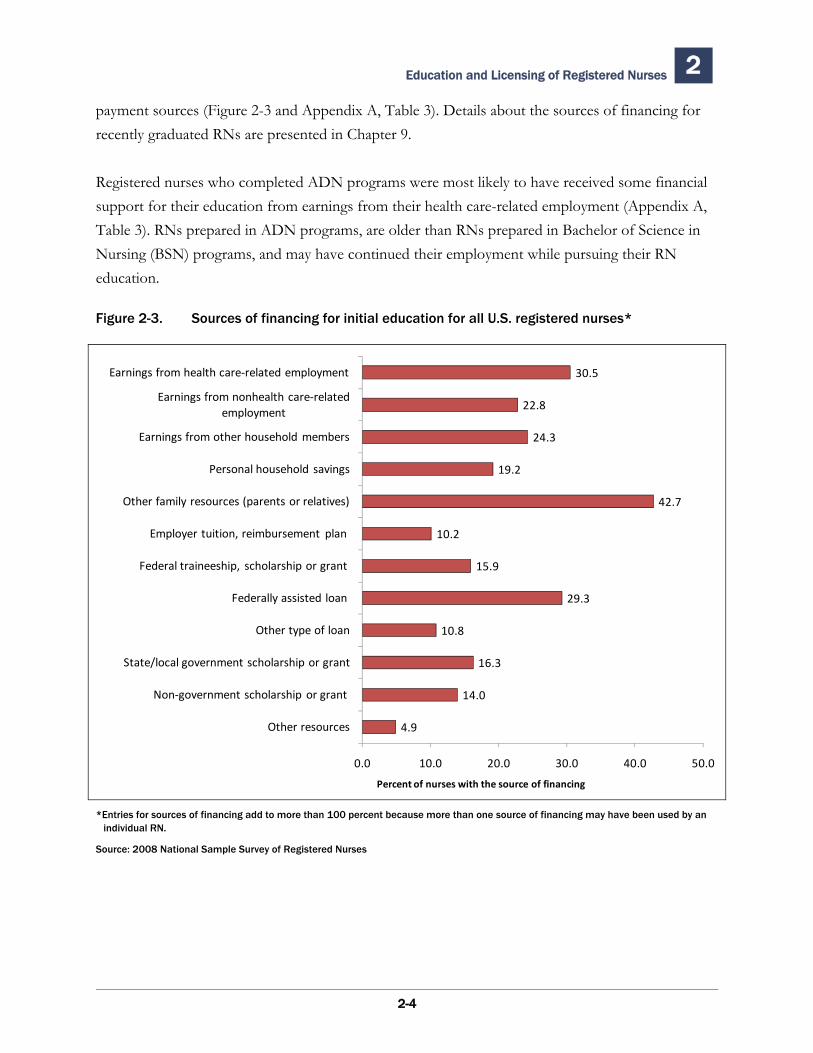
Education and Licensing of Registered Nurses 2
payment sources (Figure 2-3 and Appendix A, Table 3). Details about the sources of financing for recently graduated RNs are presented in Chapter 9.
Registered nurses who completed ADN programs were most likely to have received some financial support for their education from earnings from their health care-related employment (Appendix A, Table 3). RNs prepared in ADN programs, are older than RNs prepared in Bachelor of Science in Nursing (BSN) programs, and may have continued their employment while pursuing their RN education.
Figure 2-3. Sources of financing for initial education for all U.S. registered nurses*
4.9
14.0
16.3
10.8
29.3
15.9
10.2
42.7
19.2
24.3
22.8
30.5
0.0 10.0 20.0 30.0 40.0 50.0
Other resources
Non‐government scholarship or grant
State/local government scholarship or grant
Other type of loan
Federally assisted loan
Federal traineeship, scholarship or grant
Employer tuition, reimbursement plan
Other family resources (parents or relatives)
Personal household savings
Earnings from other household members
Earnings from nonhealth care‐related employment
Earnings from health care‐related employment
Percent of nurses with the source of financing
*Entries for sources of financing add to more than 100 percent because more than one source of financing may have been used by an individual RN.
Source: 2008 National Sample Survey of Registered Nurses
2-4
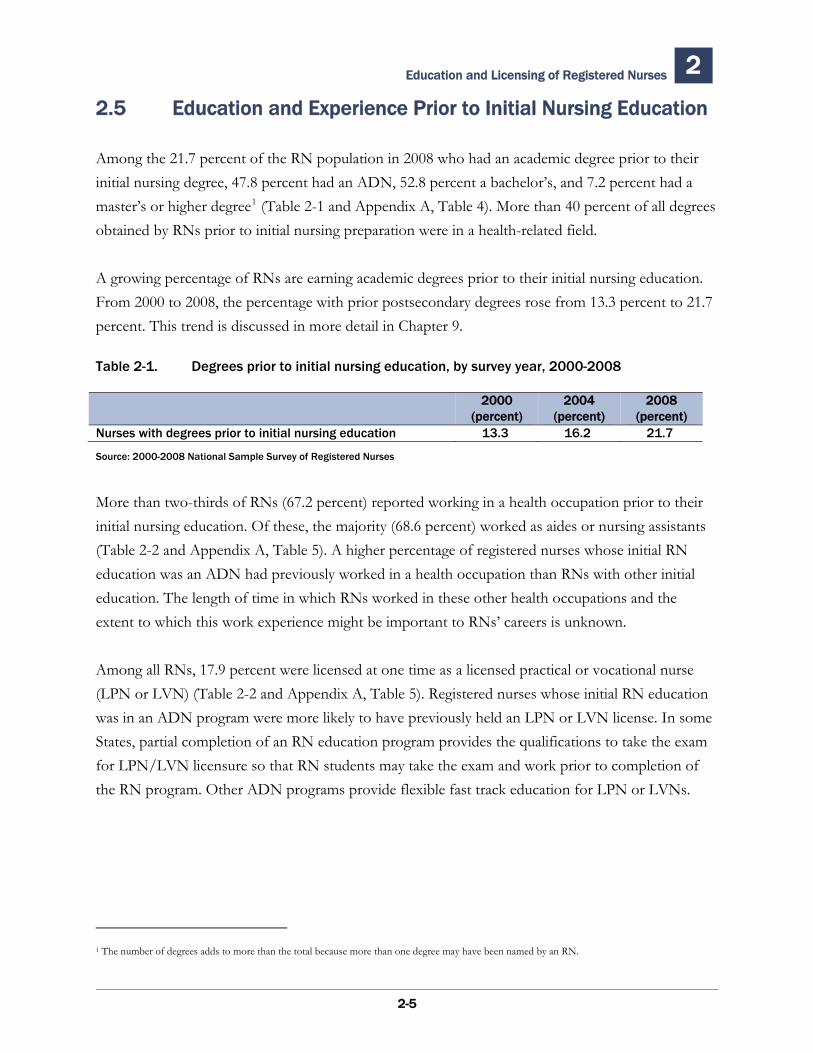
Education and Licensing of Registered Nurses 2
2-5
2.5 Education and Experience Prior to Initial Nursing Education
Among the 21.7 percent of the RN population in 2008 who had an academic degree prior to their initial nursing degree, 47.8 percent had an ADN, 52.8 percent a bachelor’s, and 7.2 percent had a master’s or higher degree1 (Table 2-1 and Appendix A, Table 4). More than 40 percent of all degrees obtained by RNs prior to initial nursing preparation were in a health-related field.
A growing percentage of RNs are earning academic degrees prior to their initial nursing education. From 2000 to 2008, the percentage with prior postsecondary degrees rose from 13.3 percent to 21.7 percent. This trend is discussed in more detail in Chapter 9.
Table 2-1. Degrees prior to initial nursing education, by survey year, 2000-2008
2000(percent)
2004 (percent)
2008(percent)
Nurses with degrees prior to initial nursing education 13.3 16.2 21.7
Source: 2000-2008 National Sample Survey of Registered Nurses
More than two-thirds of RNs (67.2 percent) reported working in a health occupation prior to their initial nursing education. Of these, the majority (68.6 percent) worked as aides or nursing assistants (Table 2-2 and Appendix A, Table 5). A higher percentage of registered nurses whose initial RN education was an ADN had previously worked in a health occupation than RNs with other initial education. The length of time in which RNs worked in these other health occupations and the extent to which this work experience might be important to RNs’ careers is unknown.
Among all RNs, 17.9 percent were licensed at one time as a licensed practical or vocational nurse (LPN or LVN) (Table 2-2 and Appendix A, Table 5). Registered nurses whose initial RN education was in an ADN program were more likely to have previously held an LPN or LVN license. In some States, partial completion of an RN education program provides the qualifications to take the exam for LPN/LVN licensure so that RN students may take the exam and work prior to completion of the RN program. Other ADN programs provide flexible fast track education for LPN or LVNs.
1 The number of degrees adds to more than the total because more than one degree may have been named by an RN.
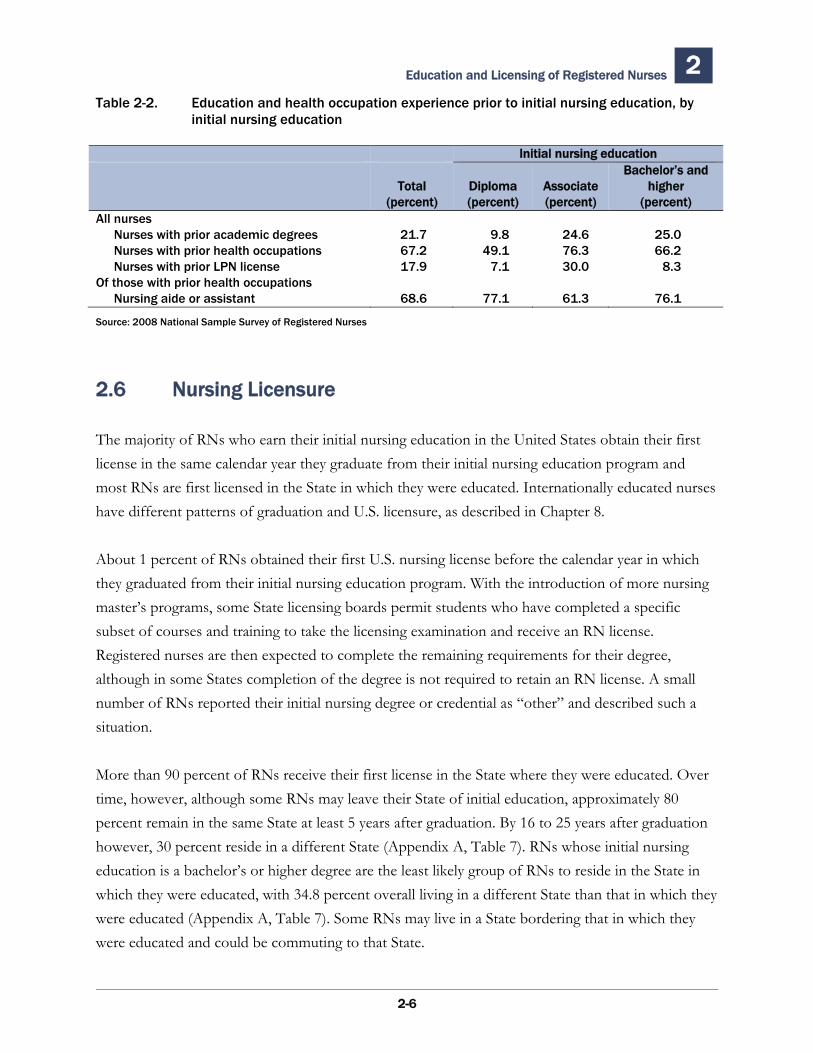
Education and Licensing of Registered Nurses 2 Table 2-2. Education and health occupation experience prior to initial nursing education, by
initial nursing education
Initial nursing education
Total Diploma Associate
Bachelor’s and higher
(percent) (percent) (percent) (percent) All nurses
Nurses with prior academic degrees 21.7 9.8 24.6 25.0Nurses with prior health occupations 67.2 49.1 76.3 66.2Nurses with prior LPN license 17.9 7.1 30.0 8.3
Of those with prior health occupations Nursing aide or assistant 68.6 77.1 61.3 76.1
Source: 2008 National Sample Survey of Registered Nurses
2.6 Nursing Licensure
The majority of RNs who earn their initial nursing education in the United States obtain their first license in the same calendar year they graduate from their initial nursing education program and most RNs are first licensed in the State in which they were educated. Internationally educated nurses have different patterns of graduation and U.S. licensure, as described in Chapter 8.
About 1 percent of RNs obtained their first U.S. nursing license before the calendar year in which they graduated from their initial nursing education program. With the introduction of more nursing master’s programs, some State licensing boards permit students who have completed a specific subset of courses and training to take the licensing examination and receive an RN license. Registered nurses are then expected to complete the remaining requirements for their degree, although in some States completion of the degree is not required to retain an RN license. A small number of RNs reported their initial nursing degree or credential as “other” and described such a situation.
More than 90 percent of RNs receive their first license in the State where they were educated. Over time, however, although some RNs may leave their State of initial education, approximately 80 percent remain in the same State at least 5 years after graduation. By 16 to 25 years after graduation however, 30 percent reside in a different State (Appendix A, Table 7). RNs whose initial nursing education is a bachelor’s or higher degree are the least likely group of RNs to reside in the State in which they were educated, with 34.8 percent overall living in a different State than that in which they were educated (Appendix A, Table 7). Some RNs may live in a State bordering that in which they were educated and could be commuting to that State.
2-6
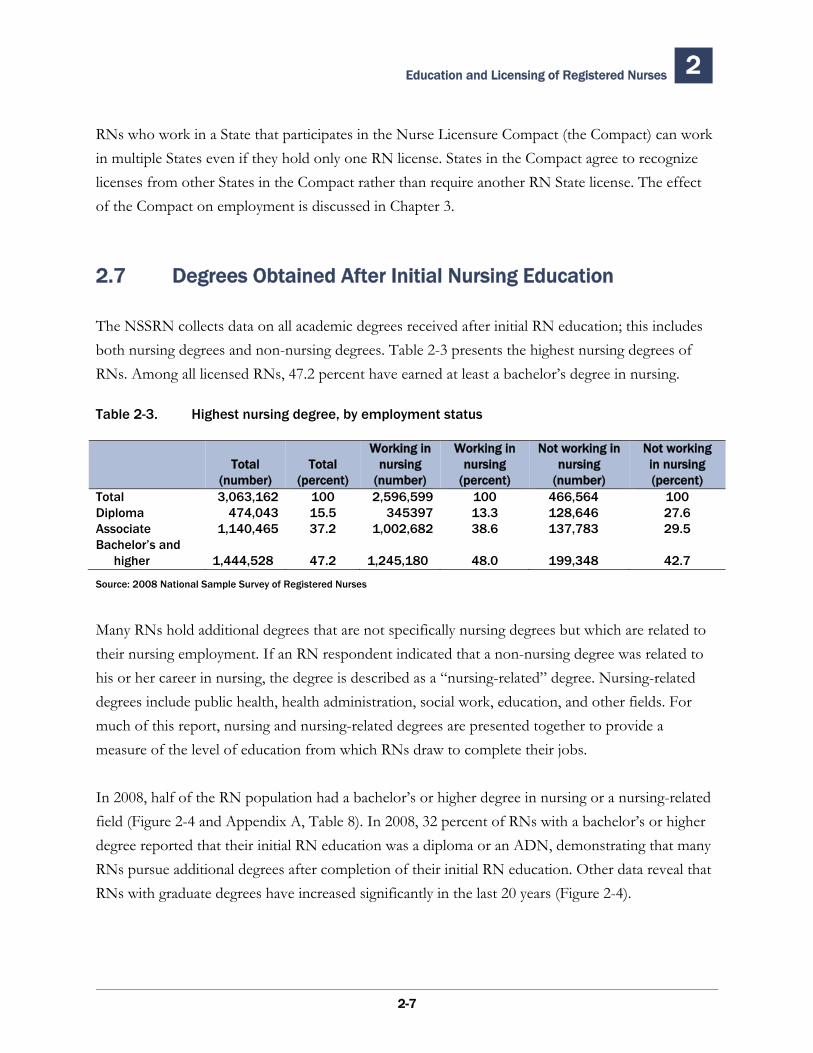
Education and Licensing of Registered Nurses 2
RNs who work in a State that participates in the Nurse Licensure Compact (the Compact) can work in multiple States even if they hold only one RN license. States in the Compact agree to recognize licenses from other States in the Compact rather than require another RN State license. The effect of the Compact on employment is discussed in Chapter 3.
2.7 Degrees Obtained After Initial Nursing Education
The NSSRN collects data on all academic degrees received after initial RN education; this includes both nursing degrees and non-nursing degrees. Table 2-3 presents the highest nursing degrees of RNs. Among all licensed RNs, 47.2 percent have earned at least a bachelor’s degree in nursing.
Table 2-3. Highest nursing degree, by employment status
Working in Working in Not working in Not working Total Total nursing nursing nursing in nursing
(number) (percent) (number) (percent) (number) (percent) Total 3,063,162 100 2,596,599 100 466,564 100Diploma 474,043 15.5 345397 13.3 128,646 27.6Associate 1,140,465 37.2 1,002,682 38.6 137,783 29.5Bachelor’s and
higher 1,444,528 47.2 1,245,180 48.0 199,348 42.7
Source: 2008 National Sample Survey of Registered Nurses
Many RNs hold additional degrees that are not specifically nursing degrees but which are related to their nursing employment. If an RN respondent indicated that a non-nursing degree was related to his or her career in nursing, the degree is described as a “nursing-related” degree. Nursing-related degrees include public health, health administration, social work, education, and other fields. For much of this report, nursing and nursing-related degrees are presented together to provide a measure of the level of education from which RNs draw to complete their jobs.
In 2008, half of the RN population had a bachelor’s or higher degree in nursing or a nursing-related field (Figure 2-4 and Appendix A, Table 8). In 2008, 32 percent of RNs with a bachelor’s or higher degree reported that their initial RN education was a diploma or an ADN, demonstrating that many RNs pursue additional degrees after completion of their initial RN education. Other data reveal that RNs with graduate degrees have increased significantly in the last 20 years (Figure 2-4).
2-7
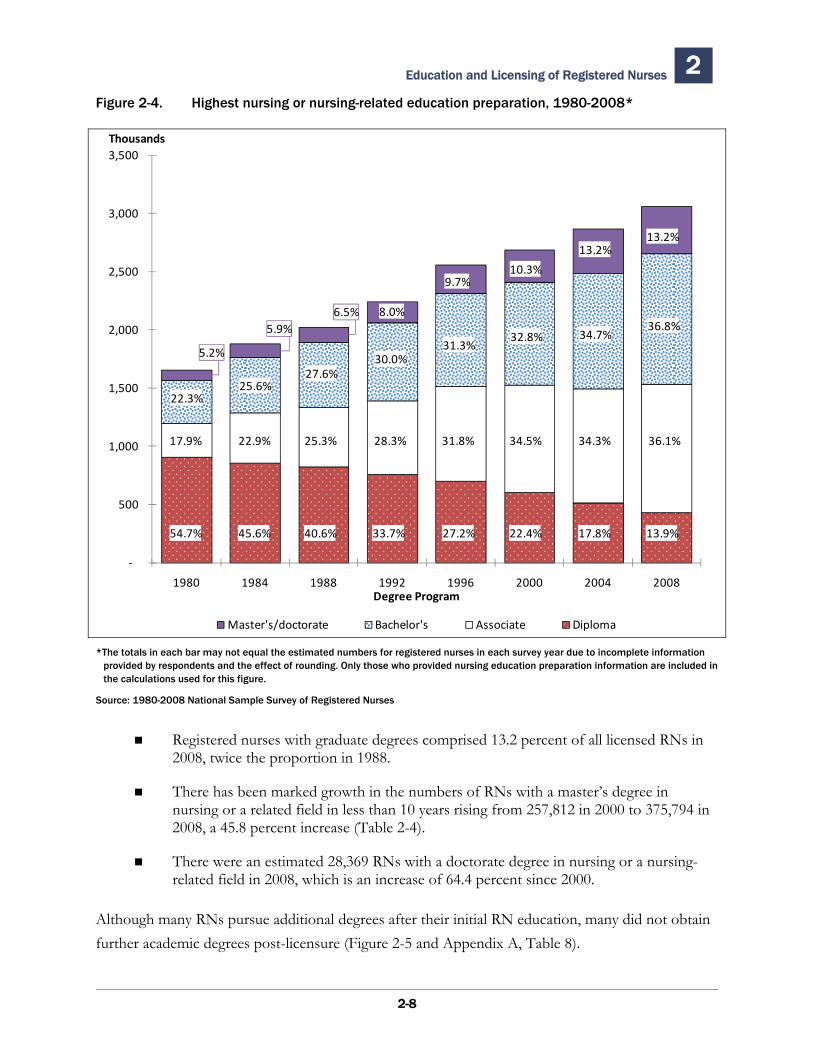
Education and Licensing of Registered Nurses 2 Figure 2-4. Highest nursing or nursing-related education preparation, 1980-2008*
‐
500
1,000
1,500
2,000
2,500
3,000
3,500
1980 1984 1988 1992 1996 2000 2004 2008
Thousands
Degree Program
Master's/doctorate Bachelor's Associate Diploma
54.7% 45.6% 40.6% 33.7% 27.2% 22.4% 17.8% 13.9%
17.9% 22.9% 25.3% 28.3% 31.8% 34.5% 34.3% 36.1%
22.3%25.6%
27.6%30.0%
31.3%32.8% 34.7%
36.8%
13.2%13.2%
10.3%9.7%
8.0%
5.2%
5.9%6.5%
*The totals in each bar may not equal the estimated numbers for registered nurses in each survey year due to incomplete information provided by respondents and the effect of rounding. Only those who provided nursing education preparation information are included in the calculations used for this figure.
Source: 1980-2008 National Sample Survey of Registered Nurses
Registered nurses with graduate degrees comprised 13.2 percent of all licensed RNs in 2008, twice the proportion in 1988.
There has been marked growth in the numbers of RNs with a master’s degree in nursing or a related field in less than 10 years rising from 257,812 in 2000 to 375,794 in 2008, a 45.8 percent increase (Table 2-4).
There were an estimated 28,369 RNs with a doctorate degree in nursing or a nursing-related field in 2008, which is an increase of 64.4 percent since 2000.
Although many RNs pursue additional degrees after their initial RN education, many did not obtain further academic degrees post-licensure (Figure 2-5 and Appendix A, Table 8).
2-8
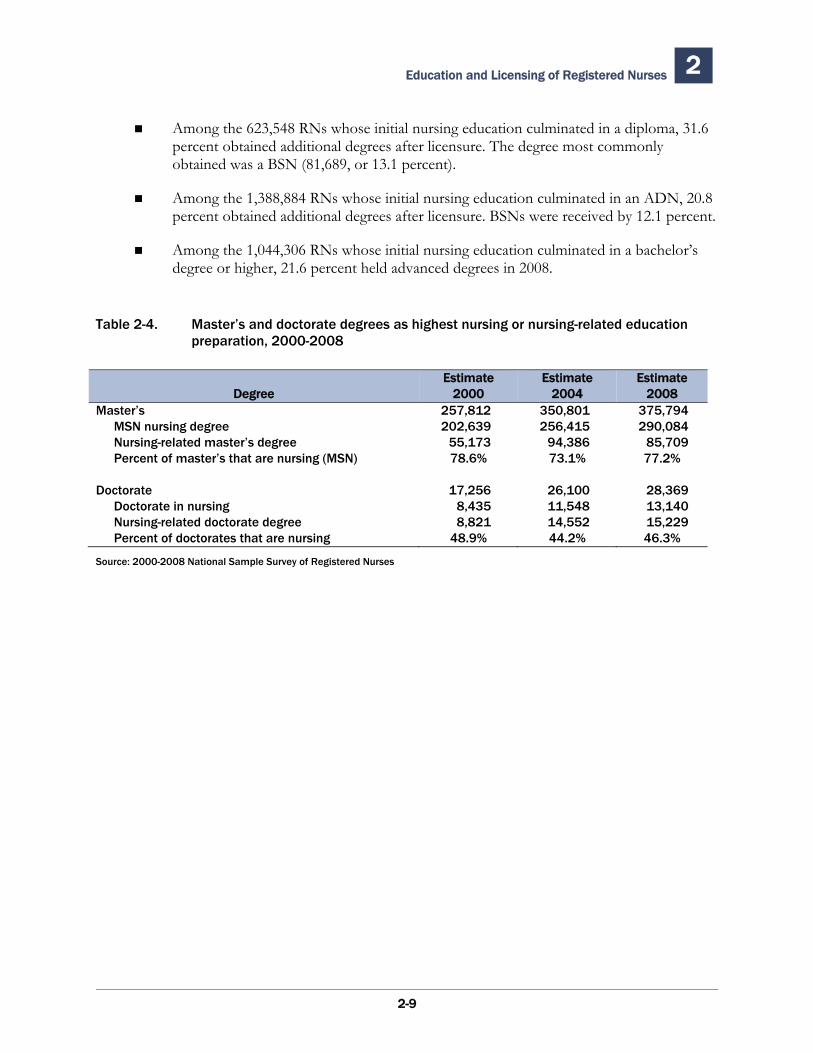
Education and Licensing of Registered Nurses 2
Among the 623,548 RNs whose initial nursing education culminated in a diploma, 31.6 percent obtained additional degrees after licensure. The degree most commonly obtained was a BSN (81,689, or 13.1 percent).
Among the 1,388,884 RNs whose initial nursing education culminated in an ADN, 20.8 percent obtained additional degrees after licensure. BSNs were received by 12.1 percent.
Among the 1,044,306 RNs whose initial nursing education culminated in a bachelor’s degree or higher, 21.6 percent held advanced degrees in 2008.
Table 2-4. Master’s and doctorate degrees as highest nursing or nursing-related education preparation, 2000-2008
Estimate Estimate EstimateDegree 2000 2004 2008
Master’s 257,812 350,801 375,794MSN nursing degree 202,639 256,415 290,084Nursing-related master’s degree 55,173 94,386 85,709Percent of master’s that are nursing (MSN) 78.6% 73.1% 77.2%
Doctorate 17,256 26,100 28,369Doctorate in nursing 8,435 11,548 13,140Nursing-related doctorate degree 8,821 14,552 15,229Percent of doctorates that are nursing 48.9% 44.2% 46.3%
Source: 2000-2008 National Sample Survey of Registered Nurses
2-9
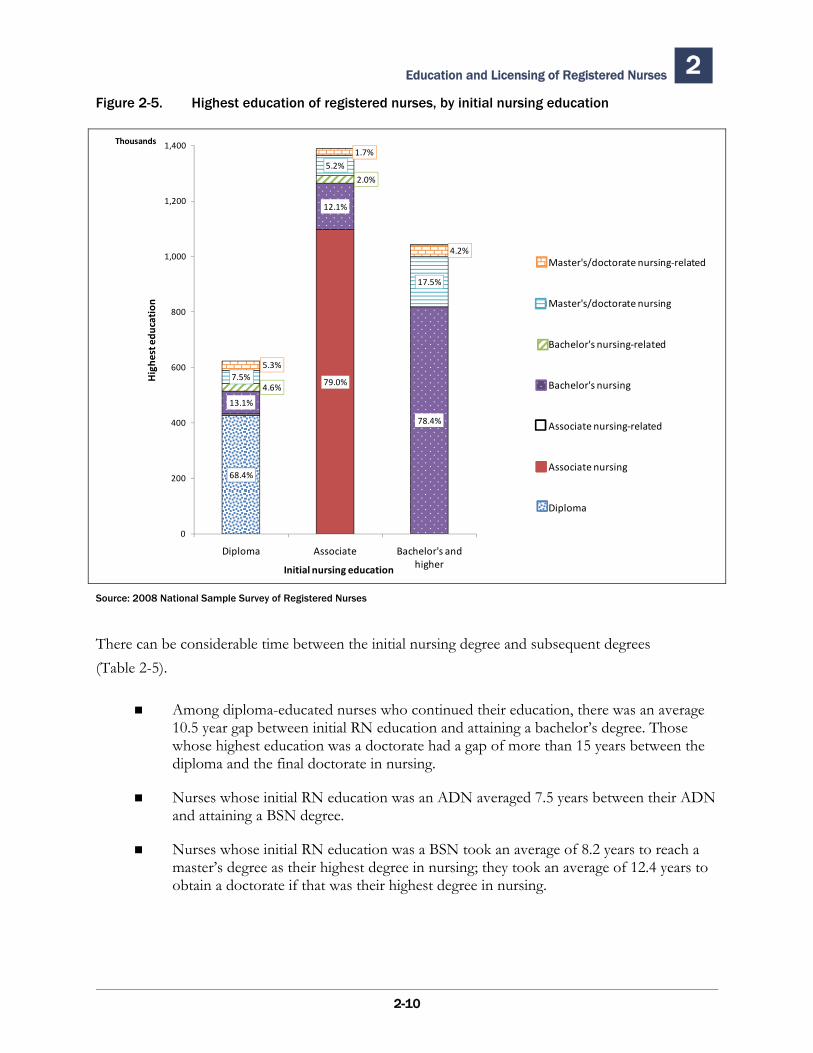
Education and Licensing of Registered Nurses 2 Figure 2-5. Highest education of registered nurses, by initial nursing education
68.4%
79.0%
13.1%
12.1%
78.4%
4.6%
2.0%
7.5%
5.2%
17.5%
5.3%
1.7%
4.2%
0
200
400
600
800
1,000
1,200
1,400
Diploma Associate Bachelor's and higher
Highe
st edu
cation
Thousands
Master's/doctorate nursing‐related
Master's/doctorate nursing
Bachelor's nursing‐related
Bachelor's nursing
Associate nursing‐related
Associate nursing
Diploma
Initial nursing education
Source: 2008 National Sample Survey of Registered Nurses
There can be considerable time between the initial nursing degree and subsequent degrees (Table 2-5).
Among diploma-educated nurses who continued their education, there was an average 10.5 year gap between initial RN education and attaining a bachelor’s degree. Those whose highest education was a doctorate had a gap of more than 15 years between the diploma and the final doctorate in nursing.
Nurses whose initial RN education was an ADN averaged 7.5 years between their ADN and attaining a BSN degree.
Nurses whose initial RN education was a BSN took an average of 8.2 years to reach a master’s degree as their highest degree in nursing; they took an average of 12.4 years to obtain a doctorate if that was their highest degree in nursing.
2-10
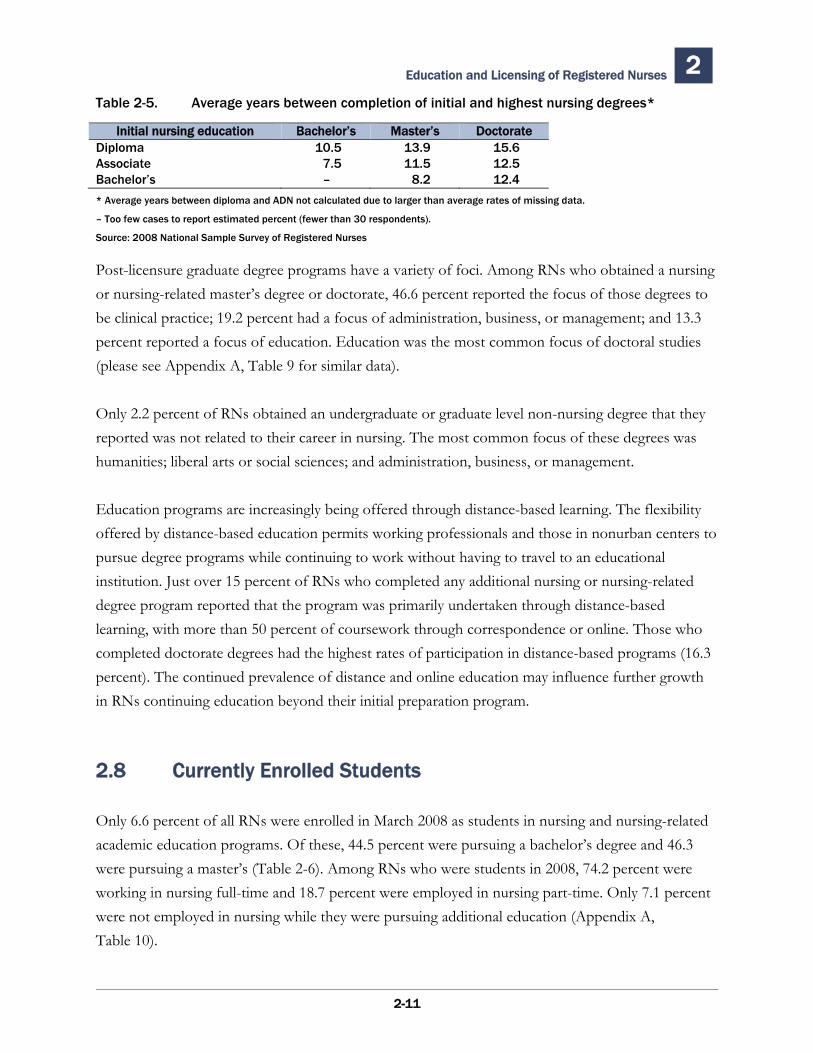
Education and Licensing of Registered Nurses 2 Table 2-5. Average years between completion of initial and highest nursing degrees*
Initial nursing education Bachelor’s Master’s DoctorateDiploma 10.5 13.9 15.6Associate 7.5 11.5 12.5Bachelor’s – 8.2 12.4
* Average years between diploma and ADN not calculated due to larger than average rates of missing data.
– Too few cases to report estimated percent (fewer than 30 respondents).
Source: 2008 National Sample Survey of Registered Nurses
Post-licensure graduate degree programs have a variety of foci. Among RNs who obtained a nursing or nursing-related master’s degree or doctorate, 46.6 percent reported the focus of those degrees to be clinical practice; 19.2 percent had a focus of administration, business, or management; and 13.3 percent reported a focus of education. Education was the most common focus of doctoral studies (please see Appendix A, Table 9 for similar data).
Only 2.2 percent of RNs obtained an undergraduate or graduate level non-nursing degree that they reported was not related to their career in nursing. The most common focus of these degrees was humanities; liberal arts or social sciences; and administration, business, or management.
Education programs are increasingly being offered through distance-based learning. The flexibility offered by distance-based education permits working professionals and those in nonurban centers to pursue degree programs while continuing to work without having to travel to an educational institution. Just over 15 percent of RNs who completed any additional nursing or nursing-related degree program reported that the program was primarily undertaken through distance-based learning, with more than 50 percent of coursework through correspondence or online. Those who completed doctorate degrees had the highest rates of participation in distance-based programs (16.3 percent). The continued prevalence of distance and online education may influence further growth in RNs continuing education beyond their initial preparation program.
2.8 Currently Enrolled Students
Only 6.6 percent of all RNs were enrolled in March 2008 as students in nursing and nursing-related academic education programs. Of these, 44.5 percent were pursuing a bachelor’s degree and 46.3 were pursuing a master’s (Table 2-6). Among RNs who were students in 2008, 74.2 percent were working in nursing full-time and 18.7 percent were employed in nursing part-time. Only 7.1 percent were not employed in nursing while they were pursuing additional education (Appendix A, Table 10).
2-11
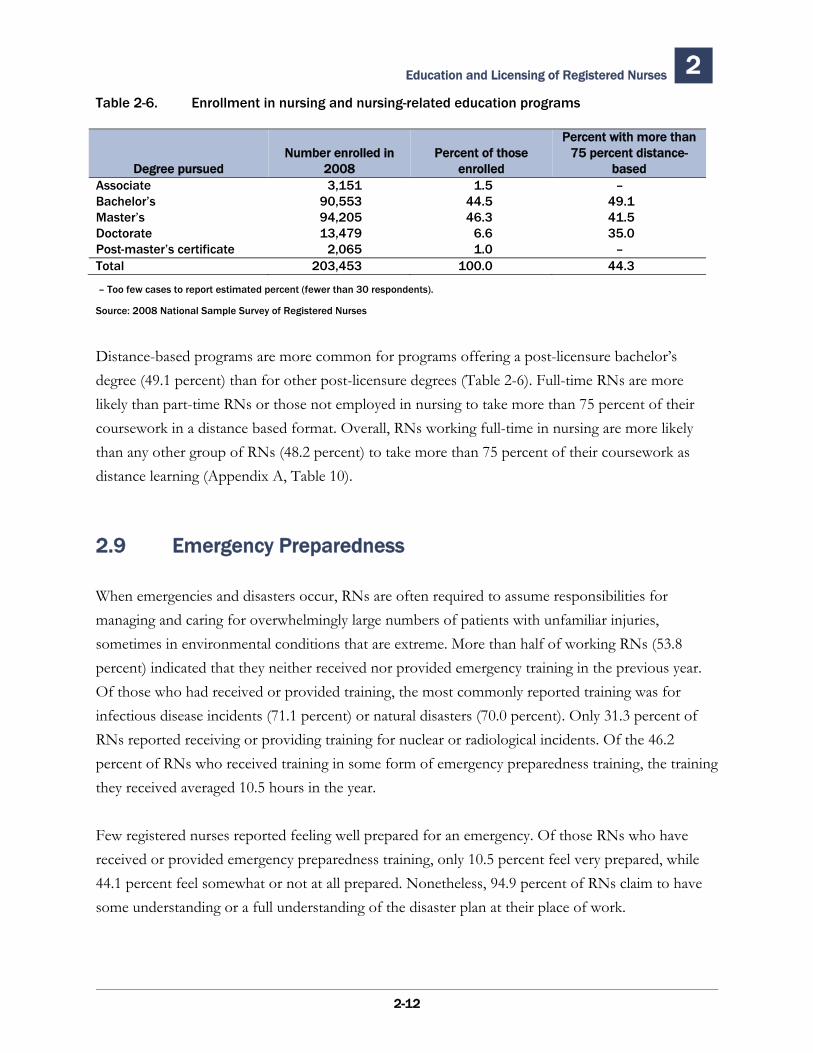
Education and Licensing of Registered Nurses 2 Table 2-6. Enrollment in nursing and nursing-related education programs
Percent with more than Number enrolled in Percent of those 75 percent distance-
Degree pursued 2008 enrolled based Associate 3,151 1.5 – Bachelor’s 90,553 44.5 49.1 Master’s 94,205 46.3 41.5 Doctorate 13,479 6.6 35.0 Post-master’s certificate 2,065 1.0 – Total 203,453 100.0 44.3
– Too few cases to report estimated percent (fewer than 30 respondents).
Source: 2008 National Sample Survey of Registered Nurses
Distance-based programs are more common for programs offering a post-licensure bachelor’s degree (49.1 percent) than for other post-licensure degrees (Table 2-6). Full-time RNs are more likely than part-time RNs or those not employed in nursing to take more than 75 percent of their coursework in a distance based format. Overall, RNs working full-time in nursing are more likely than any other group of RNs (48.2 percent) to take more than 75 percent of their coursework as distance learning (Appendix A, Table 10).
2.9 Emergency Preparedness
When emergencies and disasters occur, RNs are often required to assume responsibilities for managing and caring for overwhelmingly large numbers of patients with unfamiliar injuries, sometimes in environmental conditions that are extreme. More than half of working RNs (53.8 percent) indicated that they neither received nor provided emergency training in the previous year. Of those who had received or provided training, the most commonly reported training was for infectious disease incidents (71.1 percent) or natural disasters (70.0 percent). Only 31.3 percent of RNs reported receiving or providing training for nuclear or radiological incidents. Of the 46.2 percent of RNs who received training in some form of emergency preparedness training, the training they received averaged 10.5 hours in the year.
Few registered nurses reported feeling well prepared for an emergency. Of those RNs who have received or provided emergency preparedness training, only 10.5 percent feel very prepared, while 44.1 percent feel somewhat or not at all prepared. Nonetheless, 94.9 percent of RNs claim to have some understanding or a full understanding of the disaster plan at their place of work.
2-12
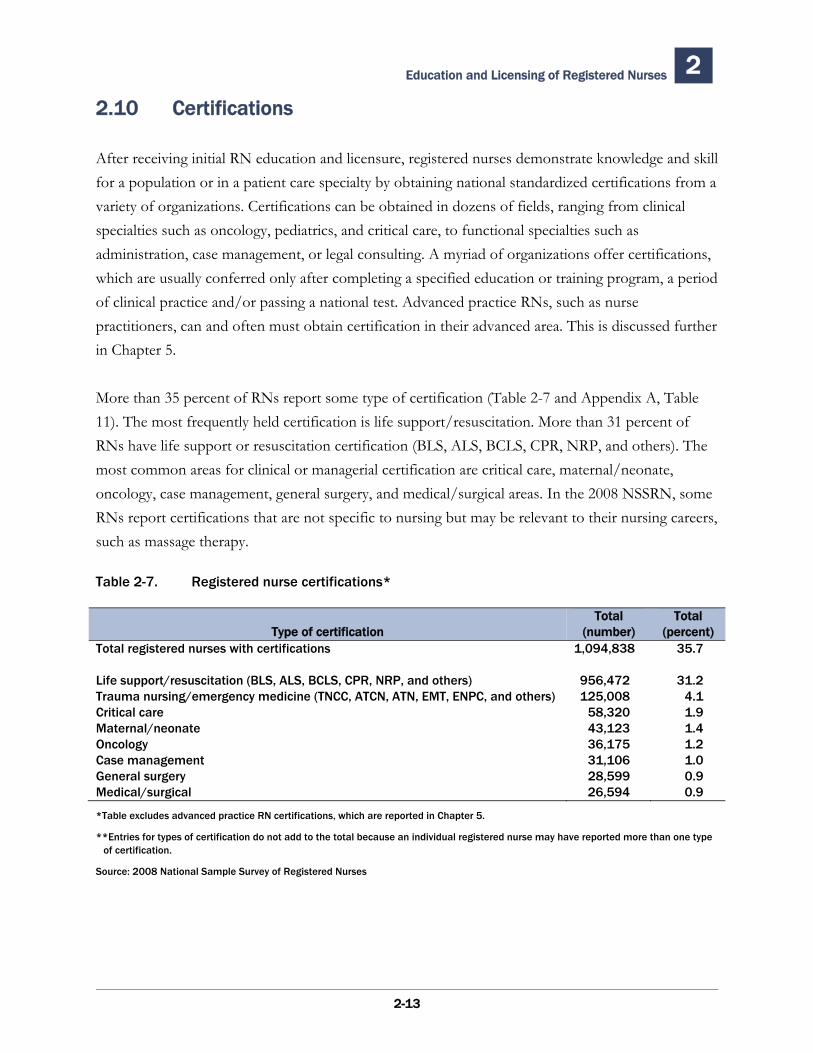
Education and Licensing of Registered Nurses 2
2.10 Certifications
After receiving initial RN education and licensure, registered nurses demonstrate knowledge and skill for a population or in a patient care specialty by obtaining national standardized certifications from a variety of organizations. Certifications can be obtained in dozens of fields, ranging from clinical specialties such as oncology, pediatrics, and critical care, to functional specialties such as administration, case management, or legal consulting. A myriad of organizations offer certifications, which are usually conferred only after completing a specified education or training program, a period of clinical practice and/or passing a national test. Advanced practice RNs, such as nurse practitioners, can and often must obtain certification in their advanced area. This is discussed further in Chapter 5.
More than 35 percent of RNs report some type of certification (Table 2-7 and Appendix A, Table 11). The most frequently held certification is life support/resuscitation. More than 31 percent of RNs have life support or resuscitation certification (BLS, ALS, BCLS, CPR, NRP, and others). The most common areas for clinical or managerial certification are critical care, maternal/neonate, oncology, case management, general surgery, and medical/surgical areas. In the 2008 NSSRN, some RNs report certifications that are not specific to nursing but may be relevant to their nursing careers, such as massage therapy.
Table 2-7. Registered nurse certifications*
Total TotalType of certification (number) (percent)
Total registered nurses with certifications 1,094,838 35.7
Life support/resuscitation (BLS, ALS, BCLS, CPR, NRP, and others) 956,472 31.2Trauma nursing/emergency medicine (TNCC, ATCN, ATN, EMT, ENPC, and others) 125,008 4.1Critical care 58,320 1.9Maternal/neonate 43,123 1.4Oncology 36,175 1.2Case management 31,106 1.0General surgery 28,599 0.9Medical/surgical 26,594 0.9
*Table excludes advanced practice RN certifications, which are reported in Chapter 5.
**Entries for types of certification do not add to the total because an individual registered nurse may have reported more than one type of certification.
Source: 2008 National Sample Survey of Registered Nurses
2-13

Education and Licensing of Registered Nurses 2
2-14
This page deliberately blank.
3The Employment of Registered Nurses
3.1 Introduction
The RN workforce consists of nurses who have valid, active RN licenses and are employed in a nursing position. The vast majority of RNs are employed in nursing. Their attachment to the labor market is high, and in general RNs are satisfied with their work. Although RNs work in a variety of settings and roles, more than half are employed in hospitals and 66.3 percent are in staff nurse roles.
3.2 Nursing Workforce Size
In 2008, an estimated 3,063,162 RNs were in the United States (Figure 3-1 and Appendix A, Table 1), and 84.8 percent of them were employed in nursing positions (2,596,599). This was the highest rate of nursing employment since the NSSRN commenced in 1977 (Figure 3-2). Full-time employment has also increased, rising from 58.4 percent of RNs in 2004 to 63.2 percent in 2008. This is the first increase in the percentage of RNs working full-time since 1996.
The number of employed RNs per 100,000 population is a ratio used to measure whether the RN workforce is growing more or less rapidly than the U.S. population as a whole. In 2008, there were an estimated 854 employed RNs per 100,000 population, an increase from 825 per 100,000 population in 2004 (Appendix A, Table 57). This measure varies widely among the States. The lowest numbers of employed RNs per 100,000 population were in Utah (598), Nevada (618), and California (638), while the largest numbers were in the District of Columbia (1,868), South Dakota (1,333), and North Dakota (1,273).
3-1
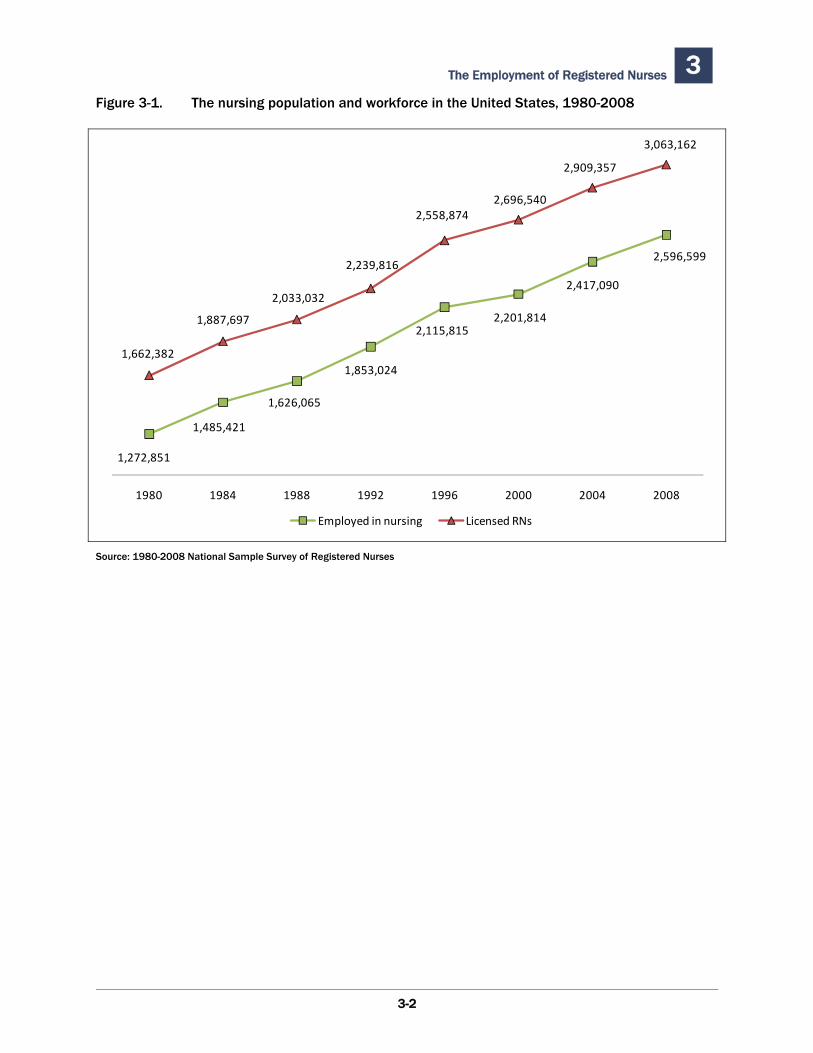
The Employment of Registered Nurses 3 Figure 3-1. The nursing population and workforce in the United States, 1980-2008
1,272,851
1,485,421
1,626,065
1,853,024
2,115,8152,201,814
2,417,090
2,596,599
1,662,382
1,887,697
2,033,032
2,239,816
2,558,8742,696,540
2,909,357
3,063,162
1980 1984 1988 1992 1996 2000 2004 2008
Employed in nursing Licensed RNs
Source: 1980-2008 National Sample Survey of Registered Nurses
3-2
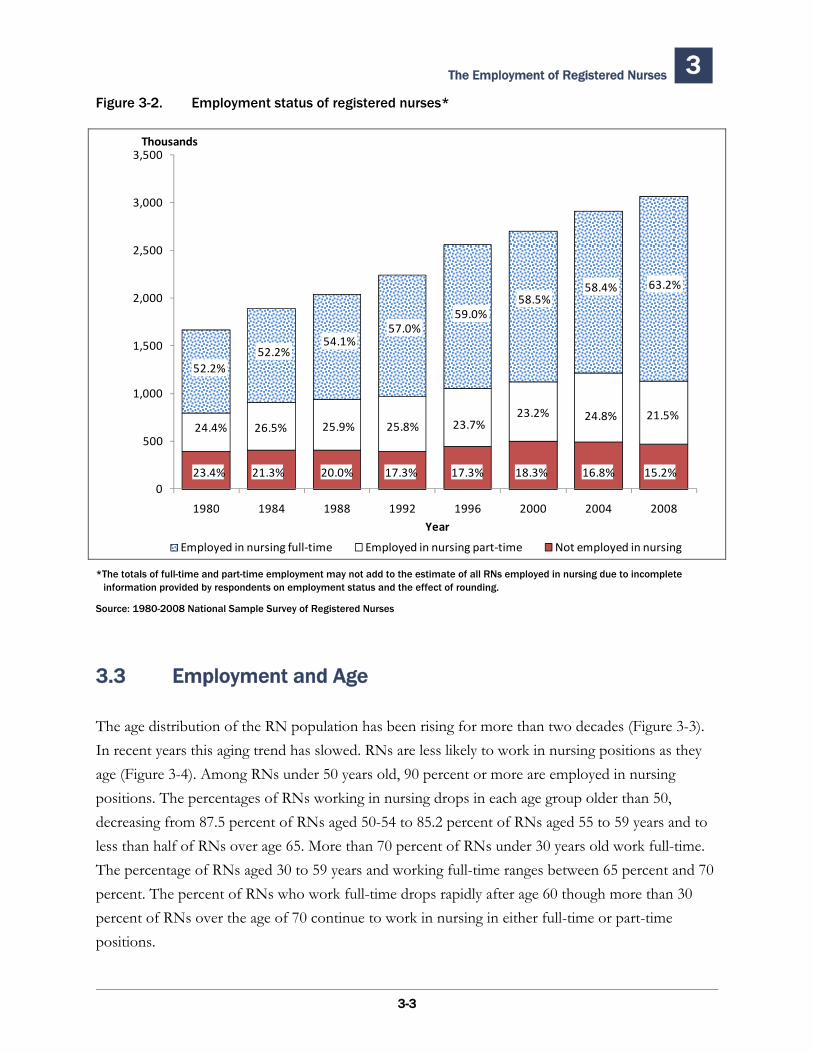
The Employment of Registered Nurses 3 Figure 3-2. Employment status of registered nurses*
0
500
1,000
1,500
2,000
2,500
3,000
3,500
1980 1984 1988 1992 1996 2000 2004 2008
Employed in nursing full‐time Employed in nursing part‐time Not employed in nursing
Year
Thousands
23.4%
24.4%
52.2%52.2%
26.5%
21.3%
54.1%
25.9%
20.0%
57.0%
25.8%
17.3%
59.0%
23.7%
17.3%
58.5%
23.2%
18.3%
58.4%
24.8%
16.8%
63.2%
21.5%
15.2%
*The totals of full-time and part-time employment may not add to the estimate of all RNs employed in nursing due to incomplete information provided by respondents on employment status and the effect of rounding.
Source: 1980-2008 National Sample Survey of Registered Nurses
3.3 Employment and Age
The age distribution of the RN population has been rising for more than two decades (Figure 3-3). In recent years this aging trend has slowed. RNs are less likely to work in nursing positions as they age (Figure 3-4). Among RNs under 50 years old, 90 percent or more are employed in nursing positions. The percentages of RNs working in nursing drops in each age group older than 50, decreasing from 87.5 percent of RNs aged 50-54 to 85.2 percent of RNs aged 55 to 59 years and to less than half of RNs over age 65. More than 70 percent of RNs under 30 years old work full-time. The percentage of RNs aged 30 to 59 years and working full-time ranges between 65 percent and 70 percent. The percent of RNs who work full-time drops rapidly after age 60 though more than 30 percent of RNs over the age of 70 continue to work in nursing in either full-time or part-time positions.
3-3
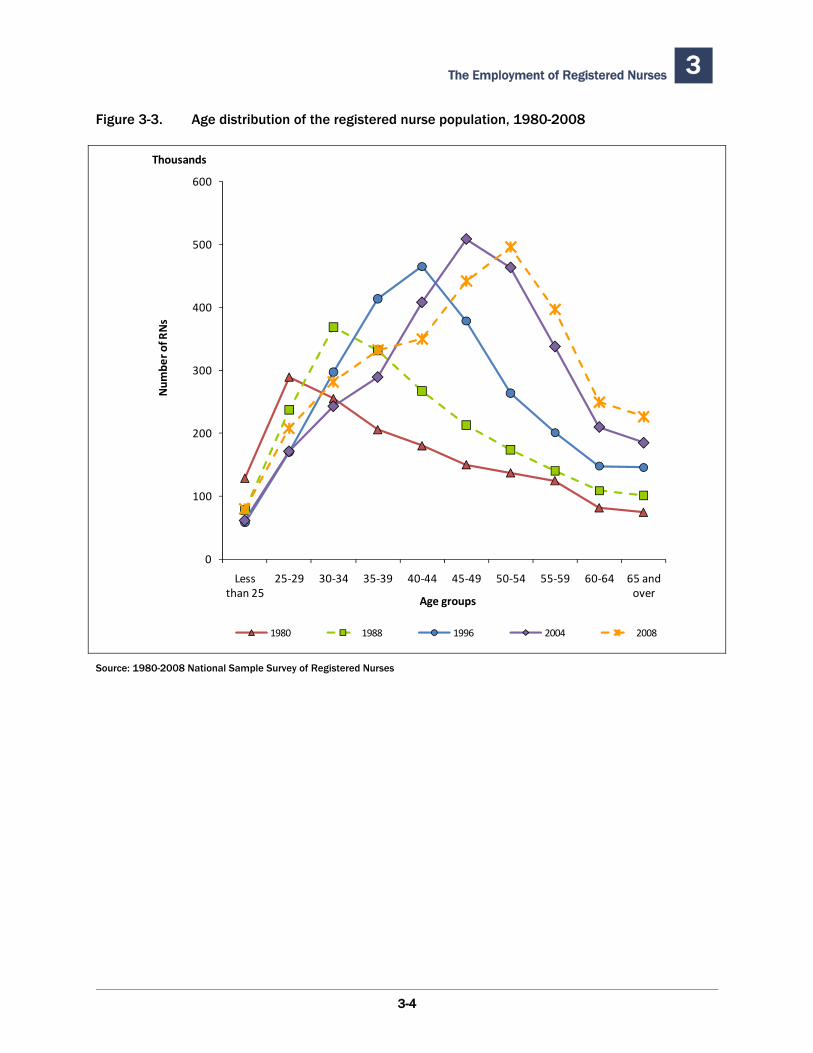
The Employment of Registered Nurses 3
Figure 3-3. Age distribution of the registered nurse population, 1980-2008
0
100
200
300
400
500
600
Less than 25
25‐29 30‐34 35‐39 40‐44 45‐49 50‐54 55‐59 60‐64 65 and over
Num
ber o
f RNs
Age groups
1980 1988 1996 2004 2008
Thousands
Source: 1980-2008 National Sample Survey of Registered Nurses
3-4
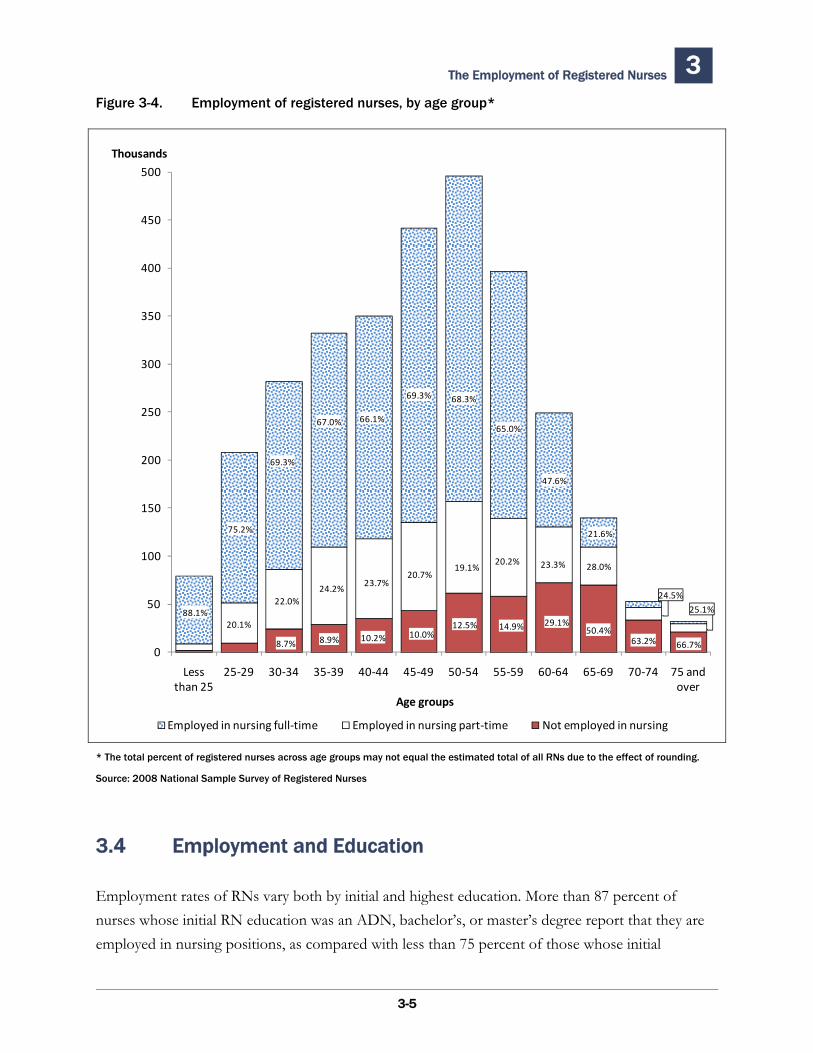
The Employment of Registered Nurses 3 Figure 3-4. Employment of registered nurses, by age group*
0
50
100
150
200
250
300
350
400
450
500
Less than 25
25‐29 30‐34 35‐39 40‐44 45‐49 50‐54 55‐59 60‐64 65‐69 70‐74 75 and over
Employed in nursing full‐time Employed in nursing part‐time Not employed in nursing
Age groups
Thousands
67.0%
88.1%
66.1%
68.3%
65.0%
69.3%
47.6%
20.1%
24.2%
20.7%
22.0%
23.7%
19.1% 23.3%
8.9%
28.0%20.2%
21.6%
63.2%10.2%12.5% 29.1%
10.0%14.9% 50.4%
66.7%
69.3%
75.2%
8.7%
24.5%
25.1%
* The total percent of registered nurses across age groups may not equal the estimated total of all RNs due to the effect of rounding.
Source: 2008 National Sample Survey of Registered Nurses
3.4 Employment and Education
Employment rates of RNs vary both by initial and highest education. More than 87 percent of nurses whose initial RN education was an ADN, bachelor’s, or master’s degree report that they are employed in nursing positions, as compared with less than 75 percent of those whose initial
3-5
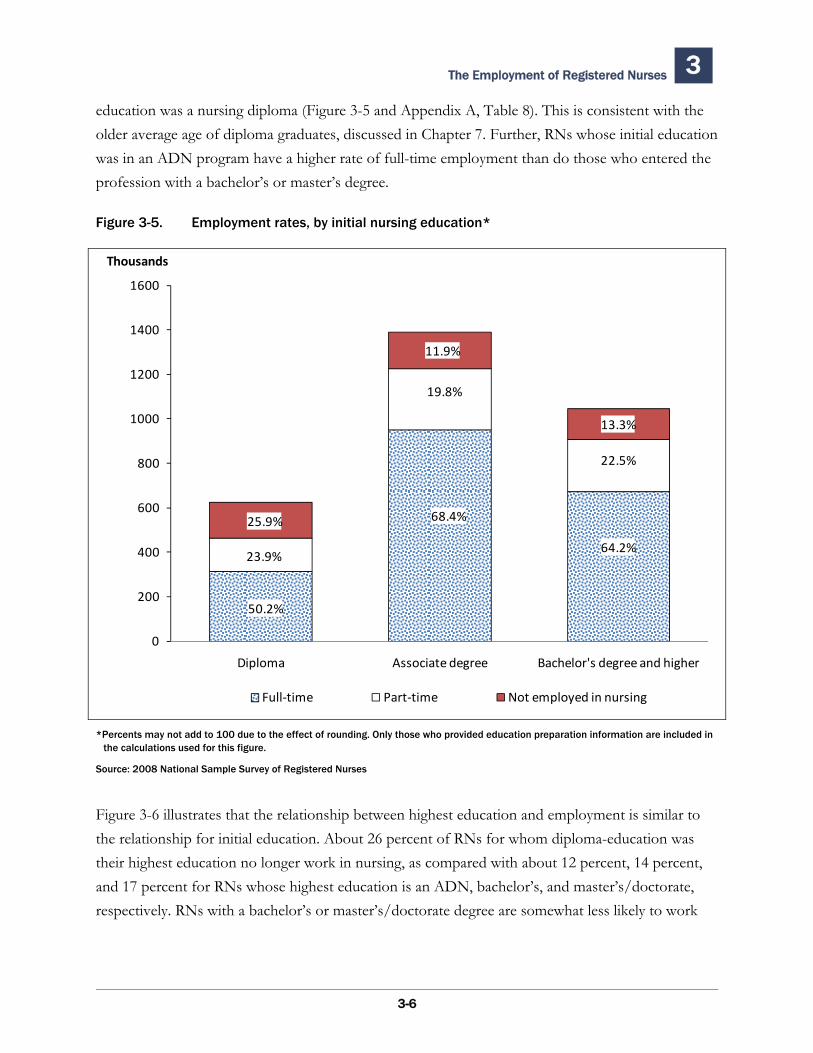
The Employment of Registered Nurses 3
education was a nursing diploma (Figure 3-5 and Appendix A, Table 8). This is consistent with the older average age of diploma graduates, discussed in Chapter 7. Further, RNs whose initial education was in an ADN program have a higher rate of full-time employment than do those who entered the profession with a bachelor’s or master’s degree.
Figure 3-5. Employment rates, by initial nursing education*
0
200
400
600
800
1000
1200
1400
1600
Diploma Associate degree Bachelor's degree and higher
Thousands
Full‐time Part‐time Not employed in nursing
25.9%
11.9%
13.3%
19.8%
22.5%
64.2%
68.4%
23.9%
50.2%
*Percents may not add to 100 due to the effect of rounding. Only those who provided education preparation information are included in the calculations used for this figure.
Source: 2008 National Sample Survey of Registered Nurses
Figure 3-6 illustrates that the relationship between highest education and employment is similar to the relationship for initial education. About 26 percent of RNs for whom diploma-education was their highest education no longer work in nursing, as compared with about 12 percent, 14 percent, and 17 percent for RNs whose highest education is an ADN, bachelor’s, and master’s/doctorate, respectively. RNs with a bachelor’s or master’s/doctorate degree are somewhat less likely to work
3-6
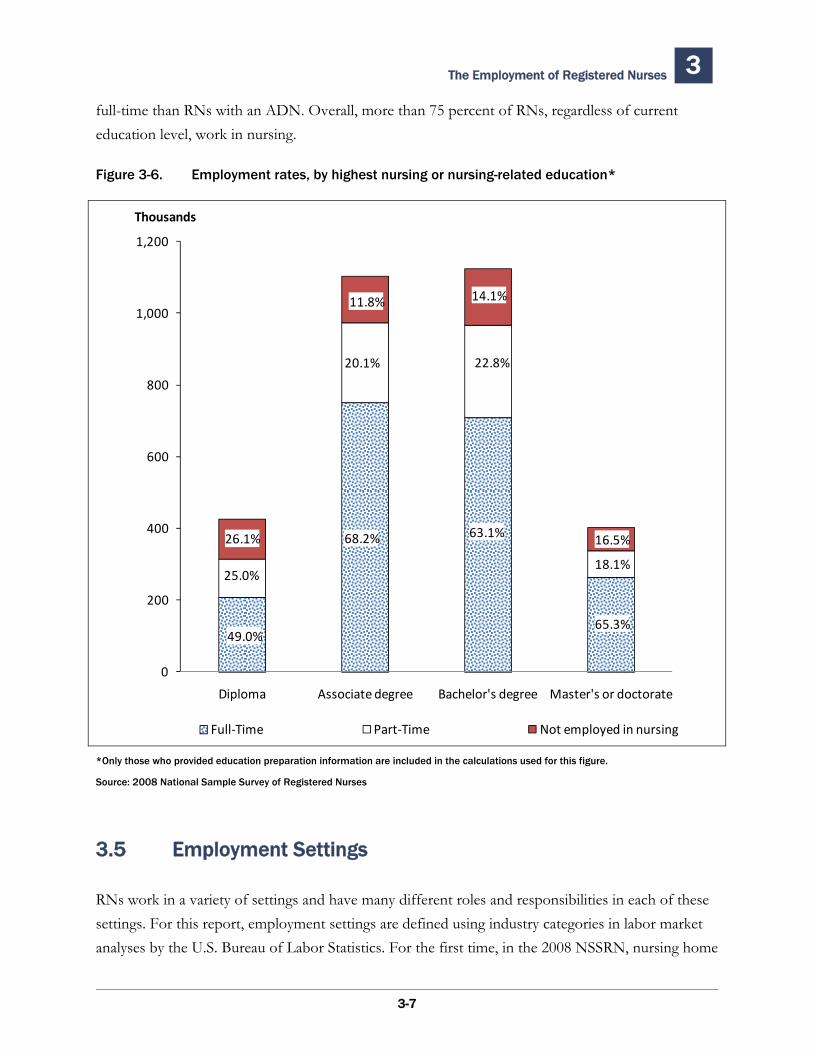
The Employment of Registered Nurses 3
full-time than RNs with an ADN. Overall, more than 75 percent of RNs, regardless of current education level, work in nursing.
Figure 3-6. Employment rates, by highest nursing or nursing-related education*
0
200
400
600
800
1,000
1,200
Diploma Associate degree Bachelor's degree Master's or doctorate
Thousands
Full‐Time Part‐Time Not employed in nursing
14.1%11.8%
22.8%20.1%
63.1%68.2% 16.5%26.1%
18.1%25.0%
65.3%49.0%
*Only those who provided education preparation information are included in the calculations used for this figure.
Source: 2008 National Sample Survey of Registered Nurses
3.5 Employment Settings
RNs work in a variety of settings and have many different roles and responsibilities in each of these settings. For this report, employment settings are defined using industry categories in labor market analyses by the U.S. Bureau of Labor Statistics. For the first time, in the 2008 NSSRN, nursing home
3-7
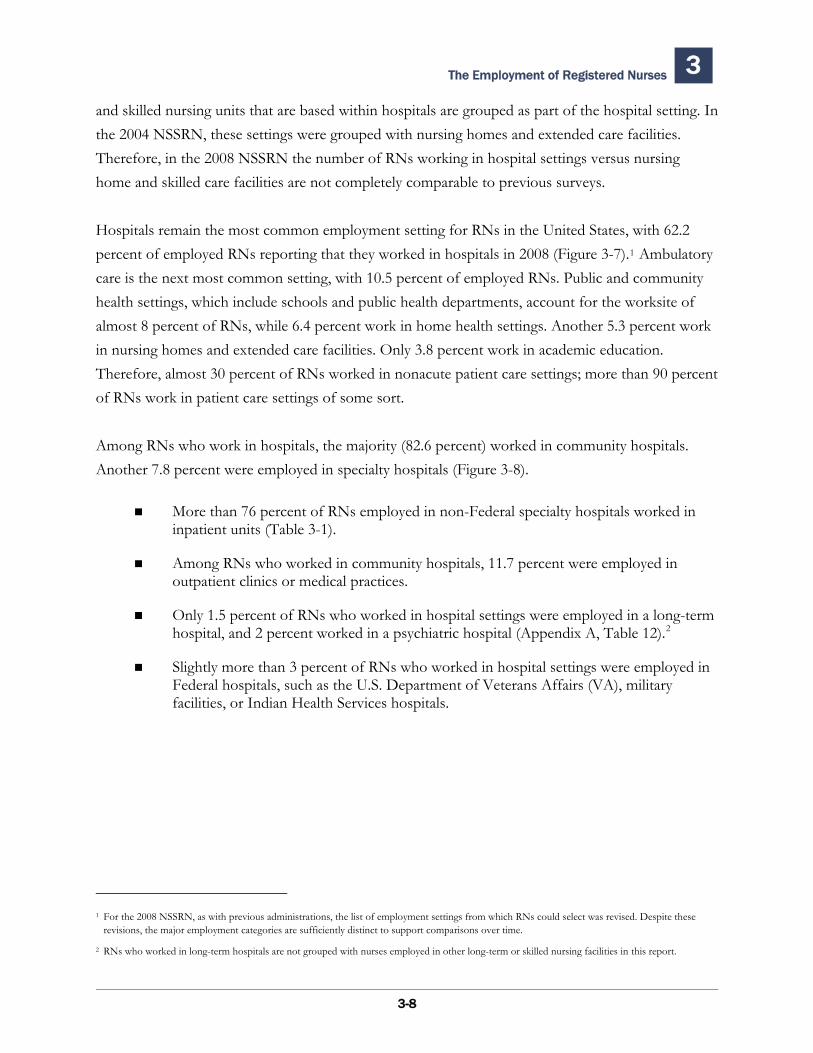
The Employment of Registered Nurses 3
3-8
and skilled nursing units that are based within hospitals are grouped as part of the hospital setting. In the 2004 NSSRN, these settings were grouped with nursing homes and extended care facilities. Therefore, in the 2008 NSSRN the number of RNs working in hospital settings versus nursing home and skilled care facilities are not completely comparable to previous surveys.
Hospitals remain the most common employment setting for RNs in the United States, with 62.2 percent of employed RNs reporting that they worked in hospitals in 2008 (Figure 3-7).1 Ambulatory care is the next most common setting, with 10.5 percent of employed RNs. Public and community health settings, which include schools and public health departments, account for the worksite of almost 8 percent of RNs, while 6.4 percent work in home health settings. Another 5.3 percent work in nursing homes and extended care facilities. Only 3.8 percent work in academic education. Therefore, almost 30 percent of RNs worked in nonacute patient care settings; more than 90 percent of RNs work in patient care settings of some sort.
Among RNs who work in hospitals, the majority (82.6 percent) worked in community hospitals. Another 7.8 percent were employed in specialty hospitals (Figure 3-8).
More than 76 percent of RNs employed in non-Federal specialty hospitals worked in inpatient units (Table 3-1).
Among RNs who worked in community hospitals, 11.7 percent were employed in outpatient clinics or medical practices.
Only 1.5 percent of RNs who worked in hospital settings were employed in a long-term hospital, and 2 percent worked in a psychiatric hospital (Appendix A, Table 12).2
Slightly more than 3 percent of RNs who worked in hospital settings were employed in Federal hospitals, such as the U.S. Department of Veterans Affairs (VA), military facilities, or Indian Health Services hospitals.
1 For the 2008 NSSRN, as with previous administrations, the list of employment settings from which RNs could select was revised. Despite these
revisions, the major employment categories are sufficiently distinct to support comparisons over time.
2 RNs who worked in long-term hospitals are not grouped with nurses employed in other long-term or skilled nursing facilities in this report.
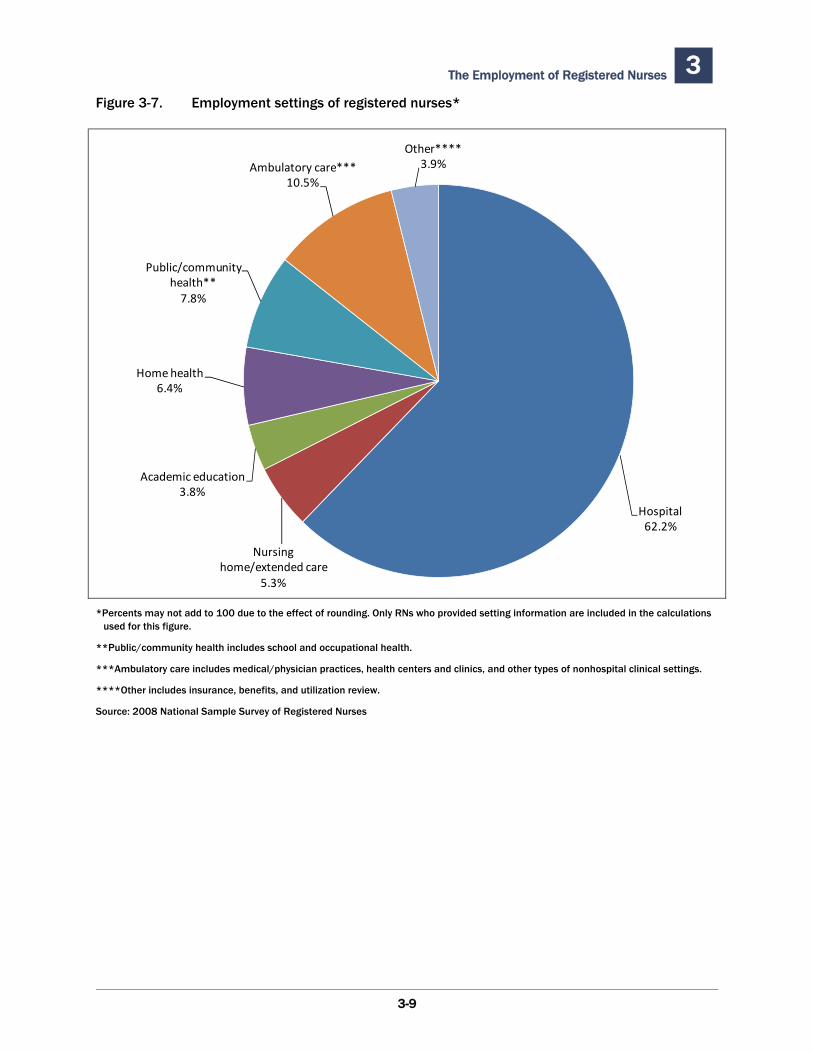
The Employment of Registered Nurses 3 Figure 3-7. Employment settings of registered nurses*
Hospital62.2%
Nursing home/extended care
5.3%
Academic education3.8%
Home health6.4%
Public/community health**7.8%
Ambulatory care***10.5%
Other****3.9%
*Percents may not add to 100 due to the effect of rounding. Only RNs who provided setting information are included in the calculations used for this figure.
**Public/community health includes school and occupational health.
***Ambulatory care includes medical/physician practices, health centers and clinics, and other types of nonhospital clinical settings.
****Other includes insurance, benefits, and utilization review.
Source: 2008 National Sample Survey of Registered Nurses
3-9
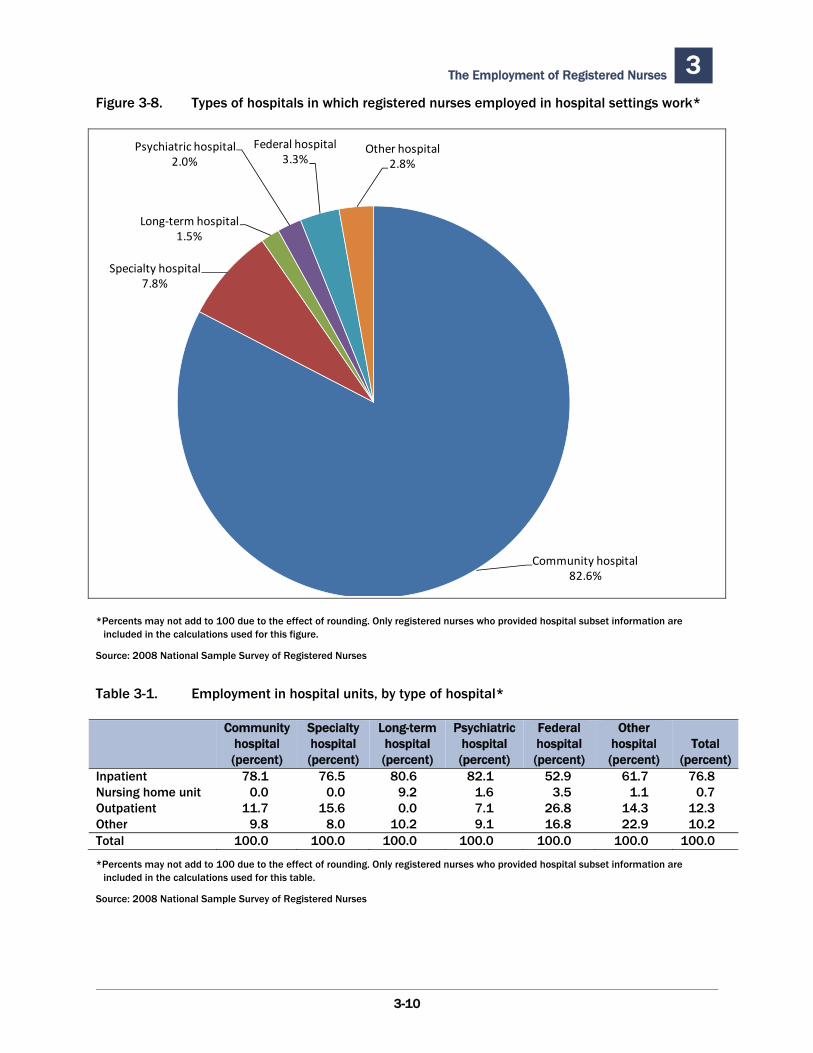
The Employment of Registered Nurses 3 Figure 3-8. Types of hospitals in which registered nurses employed in hospital settings work*
Community hospital82.6%
Specialty hospital7.8%
Long‐term hospital1.5%
Psychiatric hospital2.0%
Federal hospital3.3%
Other hospital2.8%
*Percents may not add to 100 due to the effect of rounding. Only registered nurses who provided hospital subset information are included in the calculations used for this figure.
Source: 2008 National Sample Survey of Registered Nurses
Table 3-1. Employment in hospital units, by type of hospital*
Community Specialty Long-term Psychiatric Federal Other hospital hospital hospital hospital hospital hospital Total (percent) (percent) (percent) (percent) (percent) (percent) (percent)
Inpatient 78.1 76.5 80.6 82.1 52.9 61.7 76.8Nursing home unit 0.0 0.0 9.2 1.6 3.5 1.1 0.7Outpatient 11.7 15.6 0.0 7.1 26.8 14.3 12.3Other 9.8 8.0 10.2 9.1 16.8 22.9 10.2Total 100.0 100.0 100.0 100.0 100.0 100.0 100.0
*Percents may not add to 100 due to the effect of rounding. Only registered nurses who provided hospital subset information are included in the calculations used for this table.
Source: 2008 National Sample Survey of Registered Nurses
3-10
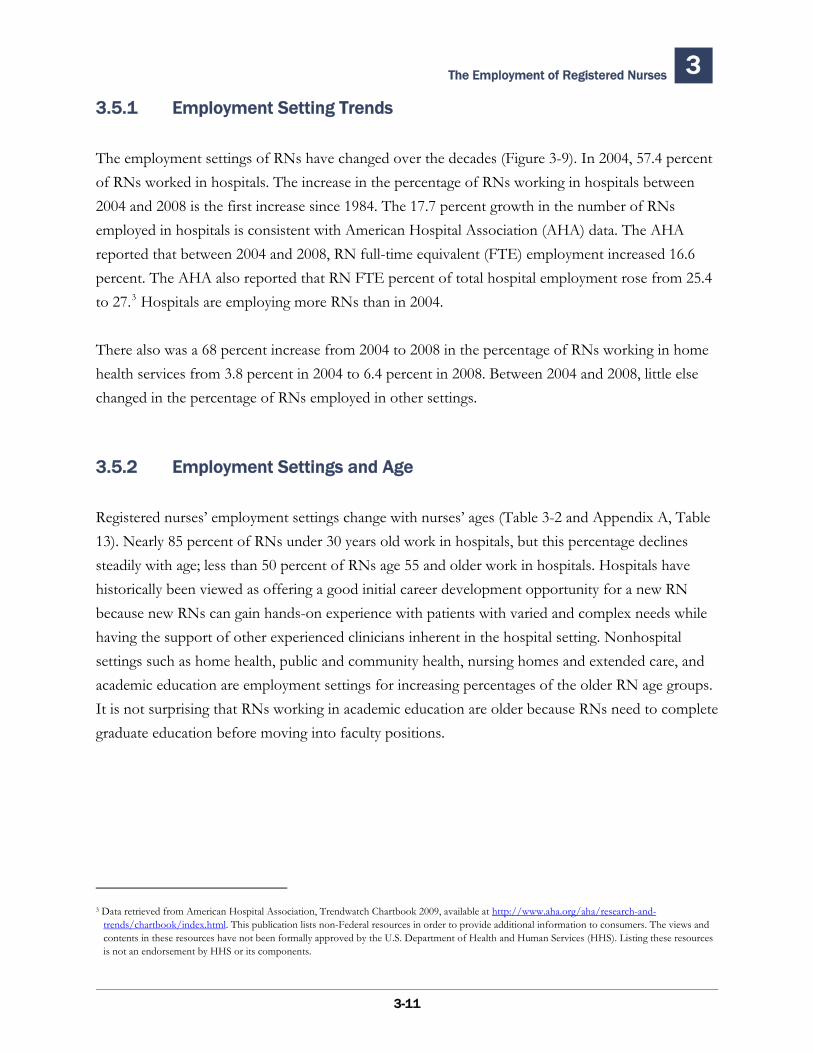
The Employment of Registered Nurses 3
3-11
3.5.1 Employment Setting Trends
The employment settings of RNs have changed over the decades (Figure 3-9). In 2004, 57.4 percent of RNs worked in hospitals. The increase in the percentage of RNs working in hospitals between 2004 and 2008 is the first increase since 1984. The 17.7 percent growth in the number of RNs employed in hospitals is consistent with American Hospital Association (AHA) data. The AHA reported that between 2004 and 2008, RN full-time equivalent (FTE) employment increased 16.6 percent. The AHA also reported that RN FTE percent of total hospital employment rose from 25.4 to 27.3 Hospitals are employing more RNs than in 2004.
There also was a 68 percent increase from 2004 to 2008 in the percentage of RNs working in home health services from 3.8 percent in 2004 to 6.4 percent in 2008. Between 2004 and 2008, little else changed in the percentage of RNs employed in other settings.
3.5.2 Employment Settings and Age
Registered nurses’ employment settings change with nurses’ ages (Table 3-2 and Appendix A, Table 13). Nearly 85 percent of RNs under 30 years old work in hospitals, but this percentage declines steadily with age; less than 50 percent of RNs age 55 and older work in hospitals. Hospitals have historically been viewed as offering a good initial career development opportunity for a new RN because new RNs can gain hands-on experience with patients with varied and complex needs while having the support of other experienced clinicians inherent in the hospital setting. Nonhospital settings such as home health, public and community health, nursing homes and extended care, and academic education are employment settings for increasing percentages of the older RN age groups. It is not surprising that RNs working in academic education are older because RNs need to complete graduate education before moving into faculty positions.
3 Data retrieved from American Hospital Association, Trendwatch Chartbook 2009, available at http://www.aha.org/aha/research-and-
trends/chartbook/index.html. This publication lists non-Federal resources in order to provide additional information to consumers. The views and contents in these resources have not been formally approved by the U.S. Department of Health and Human Services (HHS). Listing these resources is not an endorsement by HHS or its components.
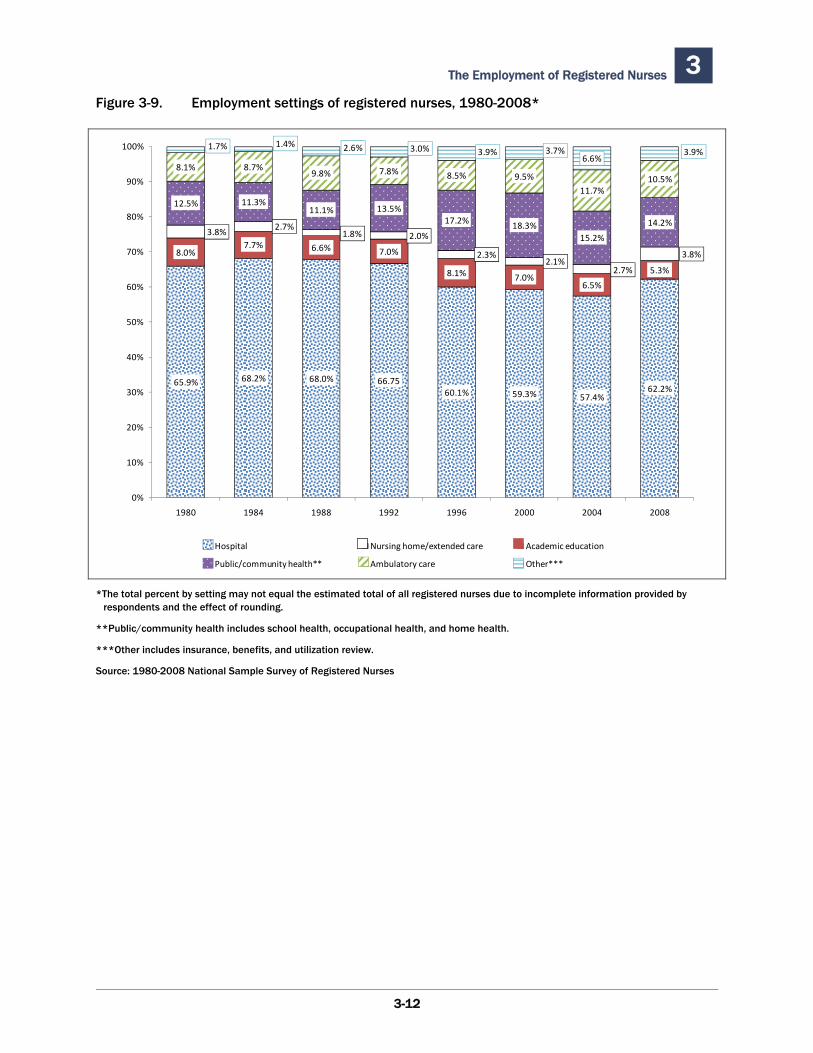
The Employment of Registered Nurses 3 Figure 3-9. Employment settings of registered nurses, 1980-2008*
65.9% 68.2% 68.0% 66.7560.1% 59.3% 57.4%
62.2%
8.0%7.7% 6.6% 7.0%
8.1% 7.0%6.5%
5.3%
3.8% 2.7%1.8% 2.0%
2.3%2.1%
2.7%
3.8%
12.5% 11.3%11.1% 13.5%
17.2% 18.3%15.2%
14.2%
8.1% 8.7%9.8% 7.8% 8.5% 9.5%
11.7%10.5%
1.7% 1.4% 2.6% 3.0% 3.9% 3.7%6.6%
3.9%
0%
10%
20%
30%
40%
50%
60%
70%
80%
90%
100%
1980 1984 1988 1992 1996 2000 2004 2008
Hospital Nursing home/extended care Academic education
Public/community health** Ambulatory care Other***
*The total percent by setting may not equal the estimated total of all registered nurses due to incomplete information provided by respondents and the effect of rounding.
**Public/community health includes school health, occupational health, and home health.
***Other includes insurance, benefits, and utilization review.
Source: 1980-2008 National Sample Survey of Registered Nurses
3-12
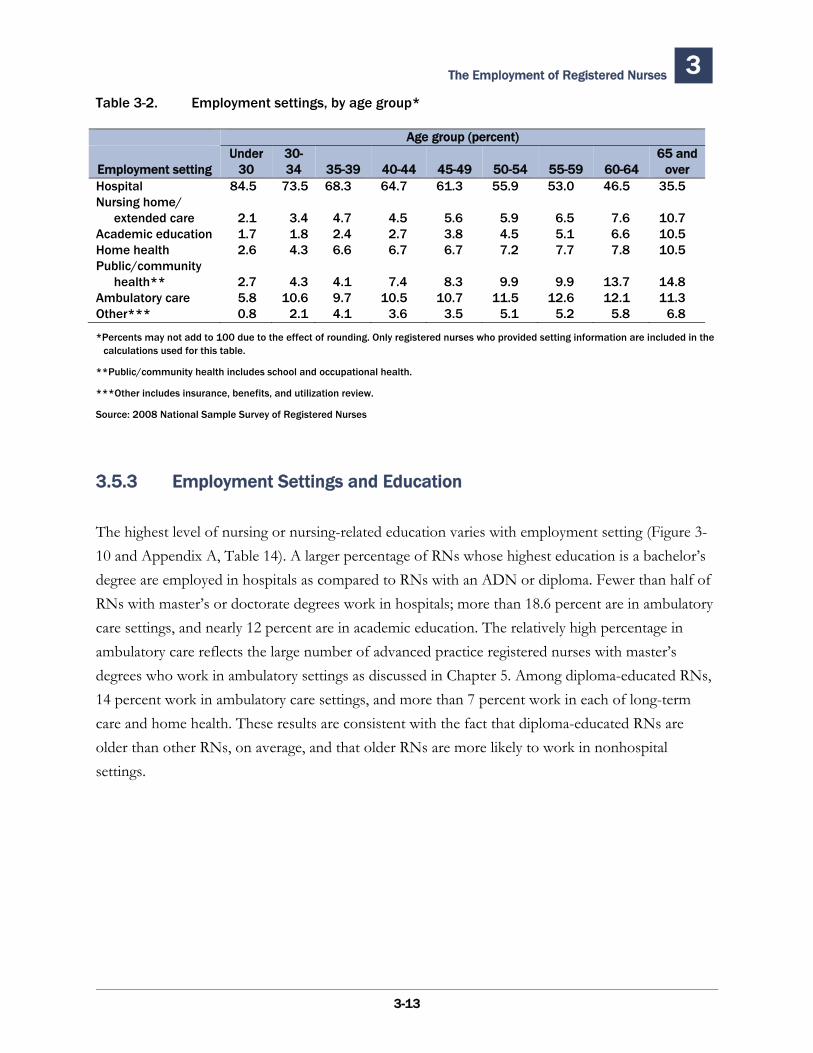
The Employment of Registered Nurses 3 Table 3-2. Employment settings, by age group*
Age group (percent)Under 30- 65 and
Employment setting 30 34 35-39 40-44 45-49 50-54 55-59 60-64 over Hospital 84.5 73.5 68.3 64.7 61.3 55.9 53.0 46.5 35.5Nursing home/
extended care 2.1 3.4 4.7 4.5 5.6 5.9 6.5 7.6 10.7 Academic education 1.7 1.8 2.4 2.7 3.8 4.5 5.1 6.6 10.5Home health 2.6 4.3 6.6 6.7 6.7 7.2 7.7 7.8 10.5Public/community
health** 2.7 4.3 4.1 7.4 8.3 9.9 9.9 13.7 14.8 Ambulatory care 5.8 10.6 9.7 10.5 10.7 11.5 12.6 12.1 11.3Other*** 0.8 2.1 4.1 3.6 3.5 5.1 5.2 5.8 6.8
*Percents may not add to 100 due to the effect of rounding. Only registered nurses who provided setting information are included in the calculations used for this table.
**Public/community health includes school and occupational health.
***Other includes insurance, benefits, and utilization review.
Source: 2008 National Sample Survey of Registered Nurses
3.5.3 Employment Settings and Education
The highest level of nursing or nursing-related education varies with employment setting (Figure 3-10 and Appendix A, Table 14). A larger percentage of RNs whose highest education is a bachelor’s degree are employed in hospitals as compared to RNs with an ADN or diploma. Fewer than half of RNs with master’s or doctorate degrees work in hospitals; more than 18.6 percent are in ambulatory care settings, and nearly 12 percent are in academic education. The relatively high percentage in ambulatory care reflects the large number of advanced practice registered nurses with master’s degrees who work in ambulatory settings as discussed in Chapter 5. Among diploma-educated RNs, 14 percent work in ambulatory care settings, and more than 7 percent work in each of long-term care and home health. These results are consistent with the fact that diploma-educated RNs are older than other RNs, on average, and that older RNs are more likely to work in nonhospital settings.
3-13
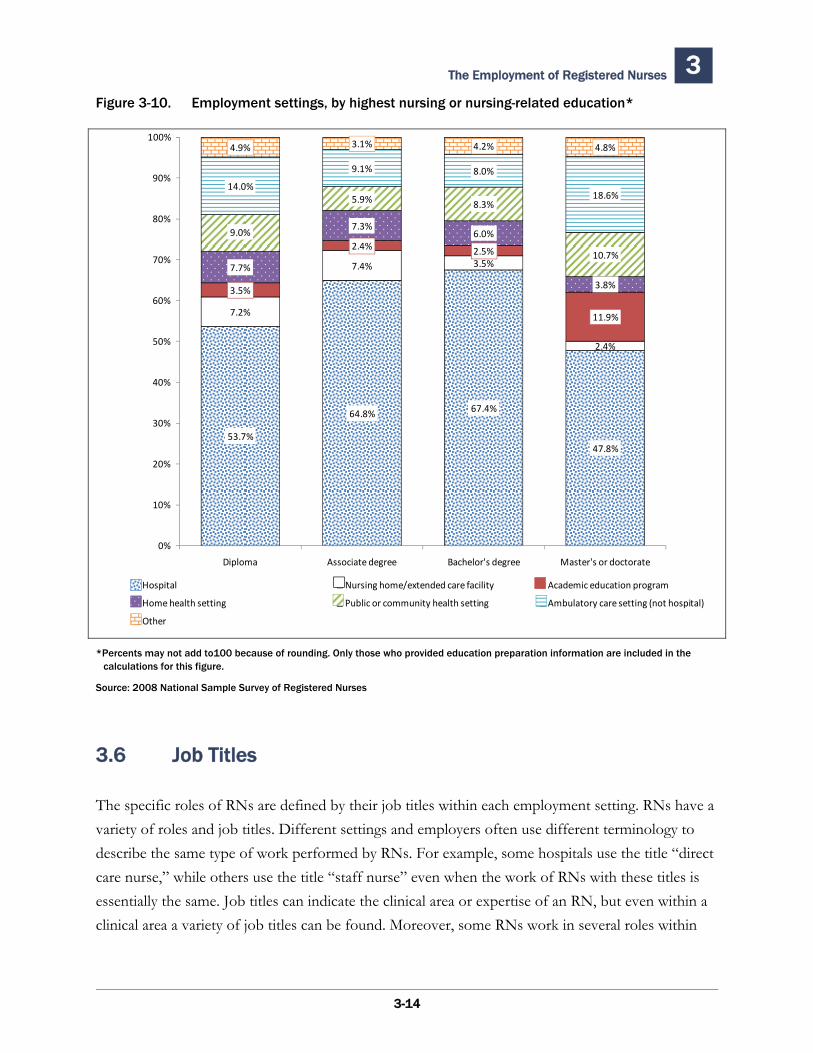
The Employment of Registered Nurses 3 Figure 3-10. Employment settings, by highest nursing or nursing-related education*
53.7%
64.8% 67.4%
47.8%
7.2%
7.4% 3.5%
2.4%
3.5%
2.4% 2.5%
11.9%
7.7%
7.3%6.0%
3.8%
9.0%
5.9% 8.3%
10.7%
14.0%
9.1% 8.0%
18.6%
4.9% 3.1% 4.2% 4.8%
0%
10%
20%
30%
40%
50%
60%
70%
80%
90%
100%
Diploma Associate degree Bachelor's degree Master's or doctorate
Hospital Nursing home/extended care facility Academic education program
Home health setting Public or community health setting Ambulatory care setting (not hospital)
Other
*Percents may not add to100 because of rounding. Only those who provided education preparation information are included in the calculations for this figure.
Source: 2008 National Sample Survey of Registered Nurses
3.6 Job Titles
The specific roles of RNs are defined by their job titles within each employment setting. RNs have a variety of roles and job titles. Different settings and employers often use different terminology to describe the same type of work performed by RNs. For example, some hospitals use the title “direct care nurse,” while others use the title “staff nurse” even when the work of RNs with these titles is essentially the same. Job titles can indicate the clinical area or expertise of an RN, but even within a clinical area a variety of job titles can be found. Moreover, some RNs work in several roles within
3-14
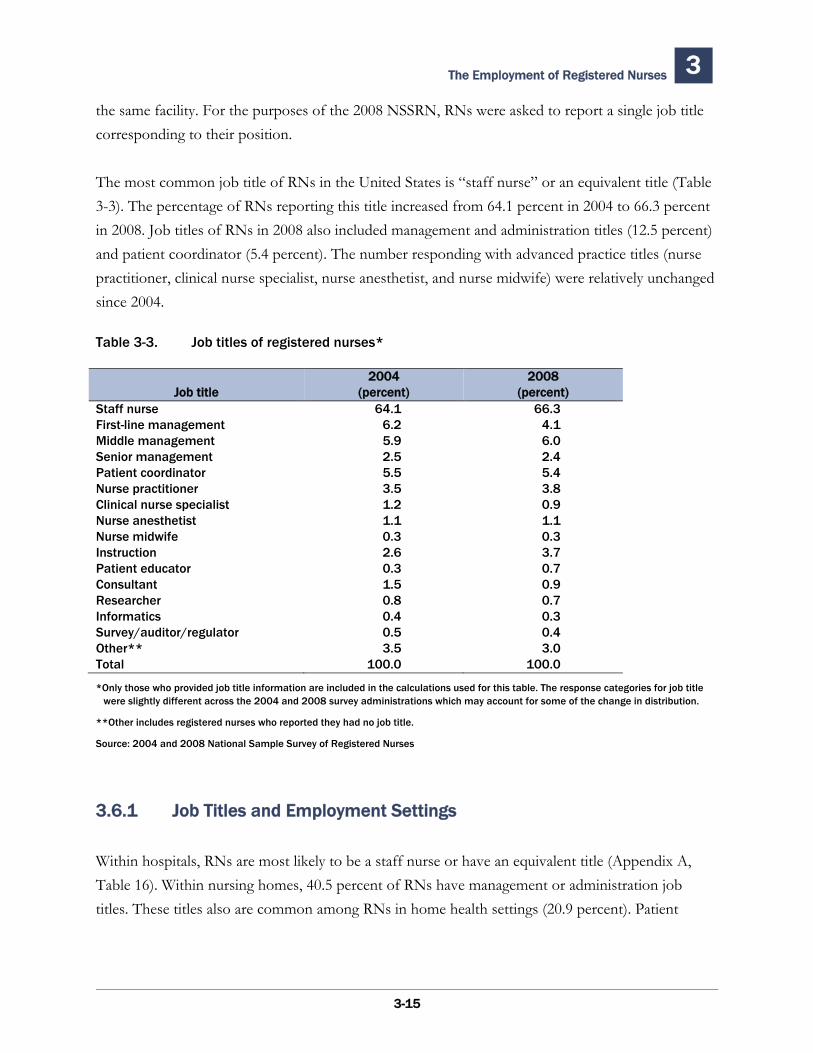
The Employment of Registered Nurses 3
the same facility. For the purposes of the 2008 NSSRN, RNs were asked to report a single job title corresponding to their position.
The most common job title of RNs in the United States is “staff nurse” or an equivalent title (Table 3-3). The percentage of RNs reporting this title increased from 64.1 percent in 2004 to 66.3 percent in 2008. Job titles of RNs in 2008 also included management and administration titles (12.5 percent) and patient coordinator (5.4 percent). The number responding with advanced practice titles (nurse practitioner, clinical nurse specialist, nurse anesthetist, and nurse midwife) were relatively unchanged since 2004.
Table 3-3. Job titles of registered nurses*
2004 2008Job title (percent) (percent)
Staff nurse 64.1 66.3First-line management 6.2 4.1Middle management 5.9 6.0Senior management 2.5 2.4Patient coordinator 5.5 5.4Nurse practitioner 3.5 3.8Clinical nurse specialist 1.2 0.9Nurse anesthetist 1.1 1.1Nurse midwife 0.3 0.3Instruction 2.6 3.7Patient educator 0.3 0.7Consultant 1.5 0.9Researcher 0.8 0.7Informatics 0.4 0.3Survey/auditor/regulator 0.5 0.4Other** 3.5 3.0Total 100.0 100.0
*Only those who provided job title information are included in the calculations used for this table. The response categories for job title were slightly different across the 2004 and 2008 survey administrations which may account for some of the change in distribution.
**Other includes registered nurses who reported they had no job title.
Source: 2004 and 2008 National Sample Survey of Registered Nurses
3.6.1 Job Titles and Employment Settings
Within hospitals, RNs are most likely to be a staff nurse or have an equivalent title (Appendix A, Table 16). Within nursing homes, 40.5 percent of RNs have management or administration job titles. These titles also are common among RNs in home health settings (20.9 percent). Patient
3-15
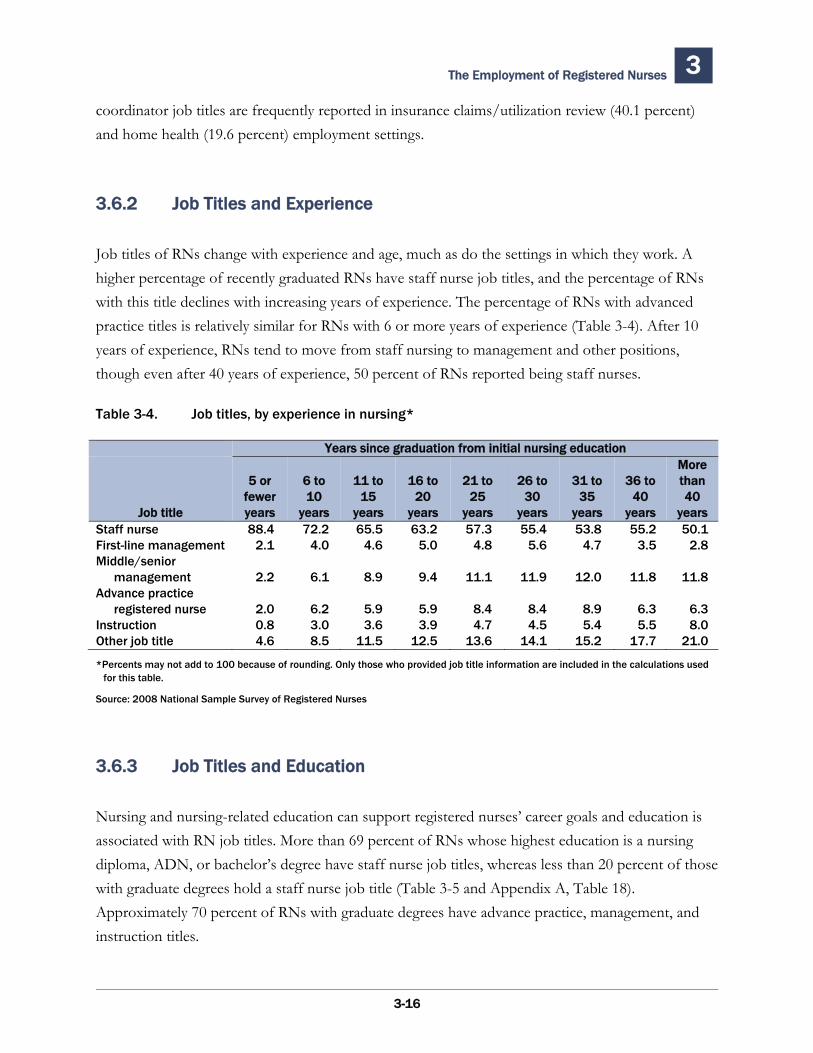
The Employment of Registered Nurses 3
coordinator job titles are frequently reported in insurance claims/utilization review (40.1 percent) and home health (19.6 percent) employment settings.
3.6.2 Job Titles and Experience
Job titles of RNs change with experience and age, much as do the settings in which they work. A higher percentage of recently graduated RNs have staff nurse job titles, and the percentage of RNs with this title declines with increasing years of experience. The percentage of RNs with advanced practice titles is relatively similar for RNs with 6 or more years of experience (Table 3-4). After 10 years of experience, RNs tend to move from staff nursing to management and other positions, though even after 40 years of experience, 50 percent of RNs reported being staff nurses.
Table 3-4. Job titles, by experience in nursing*
Years since graduation from initial nursing education More
5 or 6 to 11 to 16 to 21 to 26 to 31 to 36 to than fewer 10 15 20 25 30 35 40 40
Job title years years years years years years years years years Staff nurse 88.4 72.2 65.5 63.2 57.3 55.4 53.8 55.2 50.1First-line management 2.1 4.0 4.6 5.0 4.8 5.6 4.7 3.5 2.8Middle/senior
management 2.2 6.1 8.9 9.4 11.1 11.9 12.0 11.8 11.8Advance practice
registered nurse 2.0 6.2 5.9 5.9 8.4 8.4 8.9 6.3 6.3Instruction 0.8 3.0 3.6 3.9 4.7 4.5 5.4 5.5 8.0Other job title 4.6 8.5 11.5 12.5 13.6 14.1 15.2 17.7 21.0
*Percents may not add to 100 because of rounding. Only those who provided job title information are included in the calculations used for this table.
Source: 2008 National Sample Survey of Registered Nurses
3.6.3 Job Titles and Education
Nursing and nursing-related education can support registered nurses’ career goals and education is associated with RN job titles. More than 69 percent of RNs whose highest education is a nursing diploma, ADN, or bachelor’s degree have staff nurse job titles, whereas less than 20 percent of those with graduate degrees hold a staff nurse job title (Table 3-5 and Appendix A, Table 18). Approximately 70 percent of RNs with graduate degrees have advance practice, management, and instruction titles.
3-16
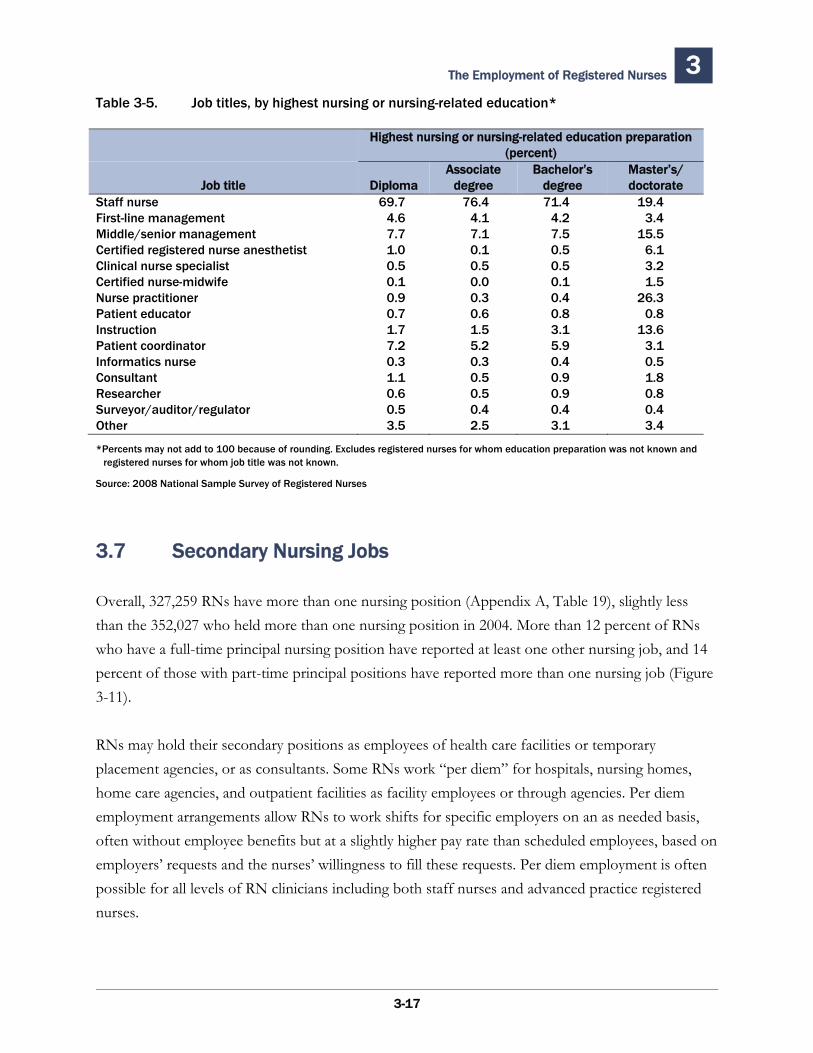
The Employment of Registered Nurses 3 Table 3-5. Job titles, by highest nursing or nursing-related education*
Highest nursing or nursing-related education preparation (percent)
Job title Diploma Associate
degree Bachelor’s
degree Master’s/doctorate
Staff nurse First-line management Middle/senior management Certified registered nurse anesthetist Clinical nurse specialist Certified nurse-midwife Nurse practitioner Patient educator Instruction Patient coordinator Informatics nurse Consultant Researcher Surveyor/auditor/regulator Other
69.74.67.71.00.50.10.90.71.77.20.31.10.60.53.5
76.44.17.10.10.50.00.30.61.55.20.30.50.50.42.5
71.44.27.50.50.50.10.40.83.15.90.40.90.90.43.1
19.43.4
15.56.13.21.5
26.30.8
13.63.10.51.80.80.43.4
*Percents may not add to 100 because of rounding. Excludes registered nurses for whom education preparation was not known and registered nurses for whom job title was not known.
Source: 2008 National Sample Survey of Registered Nurses
3.7 Secondary Nursing Jobs
Overall, 327,259 RNs have more than one nursing position (Appendix A, Table 19), slightly less than the 352,027 who held more than one nursing position in 2004. More than 12 percent of RNs who have a full-time principal nursing position have reported at least one other nursing job, and 14 percent of those with part-time principal positions have reported more than one nursing job (Figure 3-11).
RNs may hold their secondary positions as employees of health care facilities or temporary placement agencies, or as consultants. Some RNs work “per diem” for hospitals, nursing homes, home care agencies, and outpatient facilities as facility employees or through agencies. Per diem employment arrangements allow RNs to work shifts for specific employers on an as needed basis, often without employee benefits but at a slightly higher pay rate than scheduled employees, based on employers’ requests and the nurses’ willingness to fill these requests. Per diem employment is often possible for all levels of RN clinicians including both staff nurses and advanced practice registered nurses.
3-17
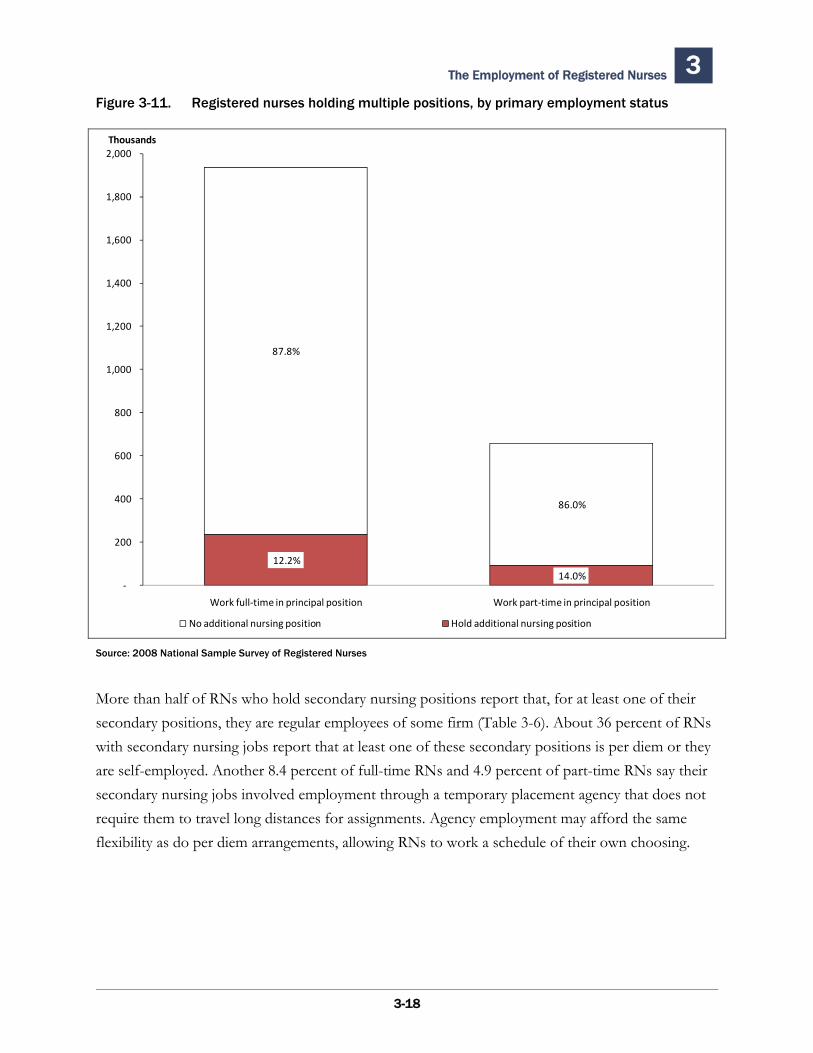
The Employment of Registered Nurses 3 Figure 3-11. Registered nurses holding multiple positions, by primary employment status
12.2% 14.0%
87.8%
86.0%
‐
200
400
600
800
1,000
1,200
1,400
1,600
1,800
2,000
Work full‐time in principal position Work part‐time in principal position
Thousands
No additional nursing position Hold additional nursing position
Source: 2008 National Sample Survey of Registered Nurses
More than half of RNs who hold secondary nursing positions report that, for at least one of their secondary positions, they are regular employees of some firm (Table 3-6). About 36 percent of RNs with secondary nursing jobs report that at least one of these secondary positions is per diem or they are self-employed. Another 8.4 percent of full-time RNs and 4.9 percent of part-time RNs say their secondary nursing jobs involved employment through a temporary placement agency that does not require them to travel long distances for assignments. Agency employment may afford the same flexibility as do per diem arrangements, allowing RNs to work a schedule of their own choosing.
3-18
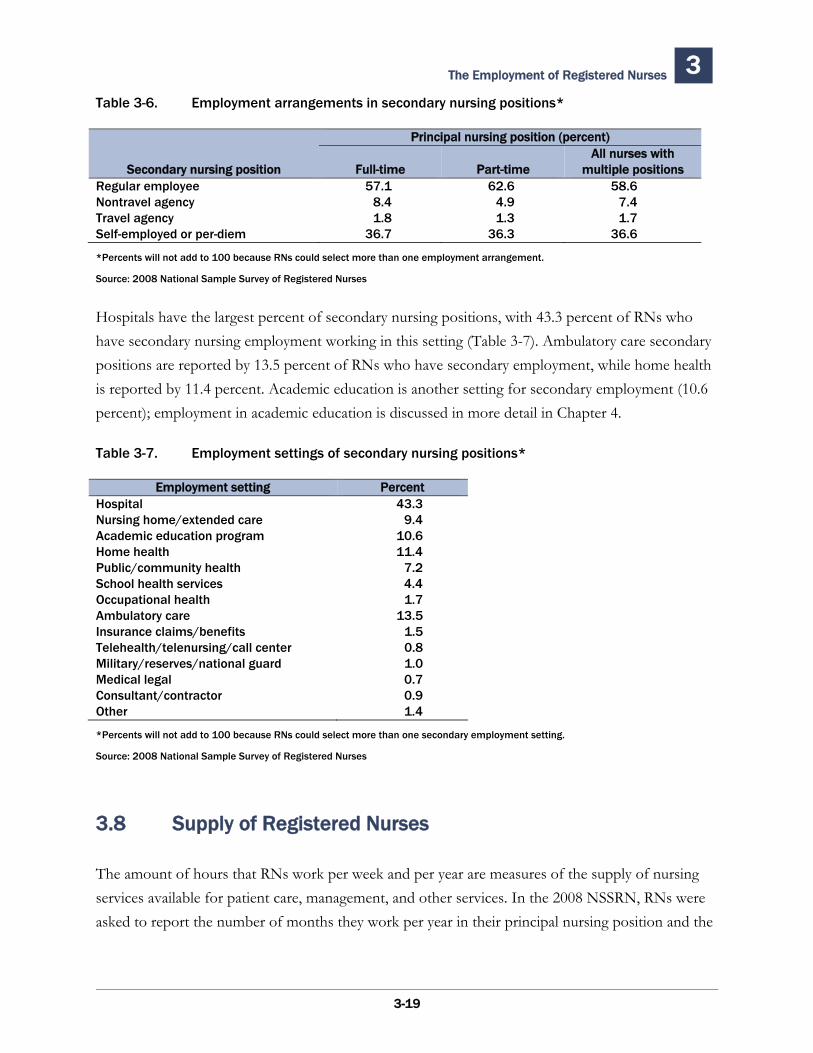
The Employment of Registered Nurses 3 Table 3-6. Employment arrangements in secondary nursing positions*
Principal nursing position (percent)
Full-time Part-time All nurses with
multiple positions Regular employee 57.1 62.6 58.6 Nontravel agency 8.4 4.9 7.4 Travel agency 1.8 1.3 1.7 Self-employed or per-diem 36.7 36.3 36.6
Secondary nursing position
*Percents will not add to 100 because RNs could select more than one employment arrangement.
Source: 2008 National Sample Survey of Registered Nurses
Hospitals have the largest percent of secondary nursing positions, with 43.3 percent of RNs who have secondary nursing employment working in this setting (Table 3-7). Ambulatory care secondary positions are reported by 13.5 percent of RNs who have secondary employment, while home health is reported by 11.4 percent. Academic education is another setting for secondary employment (10.6 percent); employment in academic education is discussed in more detail in Chapter 4.
Table 3-7. Employment settings of secondary nursing positions*
Employment setting PercentHospital 43.3Nursing home/extended care 9.4Academic education program 10.6Home health 11.4Public/community health 7.2School health services 4.4Occupational health 1.7Ambulatory care 13.5Insurance claims/benefits 1.5Telehealth/telenursing/call center 0.8Military/reserves/national guard 1.0Medical legal 0.7Consultant/contractor 0.9Other 1.4
*Percents will not add to 100 because RNs could select more than one secondary employment setting.
Source: 2008 National Sample Survey of Registered Nurses
3.8 Supply of Registered Nurses
The amount of hours that RNs work per week and per year are measures of the supply of nursing services available for patient care, management, and other services. In the 2008 NSSRN, RNs were asked to report the number of months they work per year in their principal nursing position and the
3-19
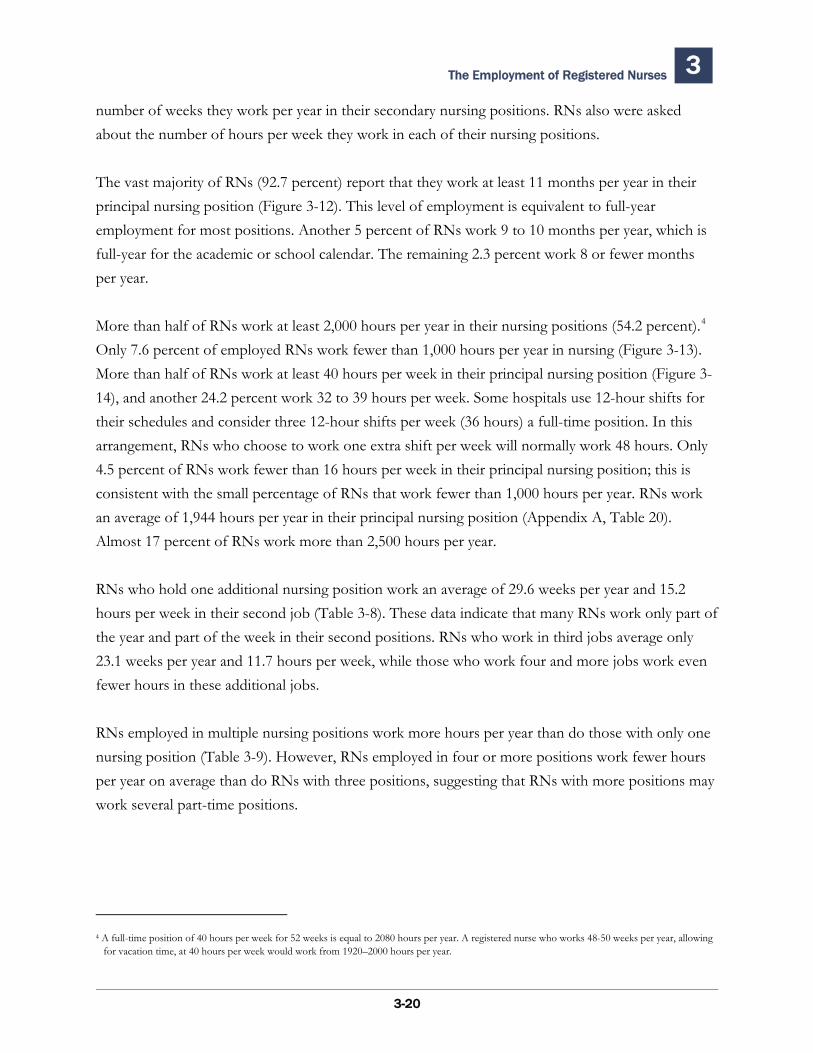
The Employment of Registered Nurses 3
3-20
number of weeks they work per year in their secondary nursing positions. RNs also were asked about the number of hours per week they work in each of their nursing positions.
The vast majority of RNs (92.7 percent) report that they work at least 11 months per year in their principal nursing position (Figure 3-12). This level of employment is equivalent to full-year employment for most positions. Another 5 percent of RNs work 9 to 10 months per year, which is full-year for the academic or school calendar. The remaining 2.3 percent work 8 or fewer months per year.
More than half of RNs work at least 2,000 hours per year in their nursing positions (54.2 percent).4 Only 7.6 percent of employed RNs work fewer than 1,000 hours per year in nursing (Figure 3-13). More than half of RNs work at least 40 hours per week in their principal nursing position (Figure 3-14), and another 24.2 percent work 32 to 39 hours per week. Some hospitals use 12-hour shifts for their schedules and consider three 12-hour shifts per week (36 hours) a full-time position. In this arrangement, RNs who choose to work one extra shift per week will normally work 48 hours. Only 4.5 percent of RNs work fewer than 16 hours per week in their principal nursing position; this is consistent with the small percentage of RNs that work fewer than 1,000 hours per year. RNs work an average of 1,944 hours per year in their principal nursing position (Appendix A, Table 20). Almost 17 percent of RNs work more than 2,500 hours per year.
RNs who hold one additional nursing position work an average of 29.6 weeks per year and 15.2 hours per week in their second job (Table 3-8). These data indicate that many RNs work only part of the year and part of the week in their second positions. RNs who work in third jobs average only 23.1 weeks per year and 11.7 hours per week, while those who work four and more jobs work even fewer hours in these additional jobs.
RNs employed in multiple nursing positions work more hours per year than do those with only one nursing position (Table 3-9). However, RNs employed in four or more positions work fewer hours per year on average than do RNs with three positions, suggesting that RNs with more positions may work several part-time positions.
4 A full-time position of 40 hours per week for 52 weeks is equal to 2080 hours per year. A registered nurse who works 48-50 weeks per year, allowing
for vacation time, at 40 hours per week would work from 1920–2000 hours per year.
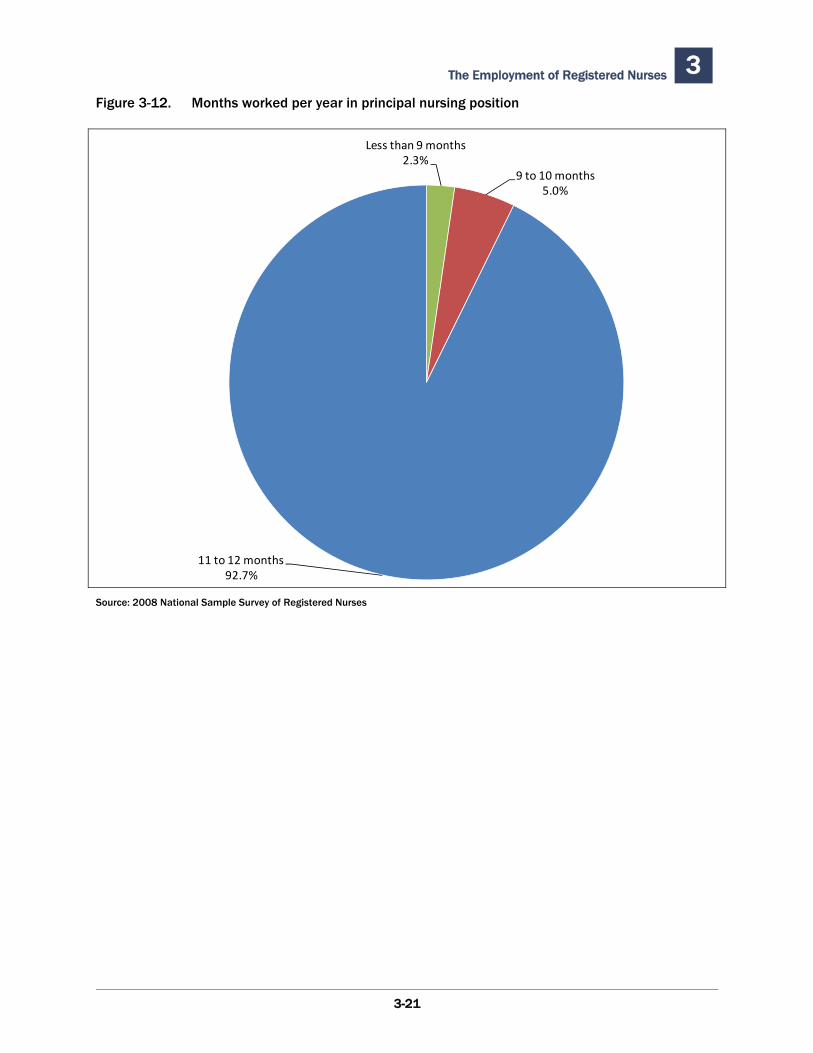
The Employment of Registered Nurses 3 Figure 3-12. Months worked per year in principal nursing position
Source: 2008 National Sample Survey of Registered Nurses
Less than 9 months2.3%
9 to 10 months5.0%
11 to 12 months92.7%
3-21
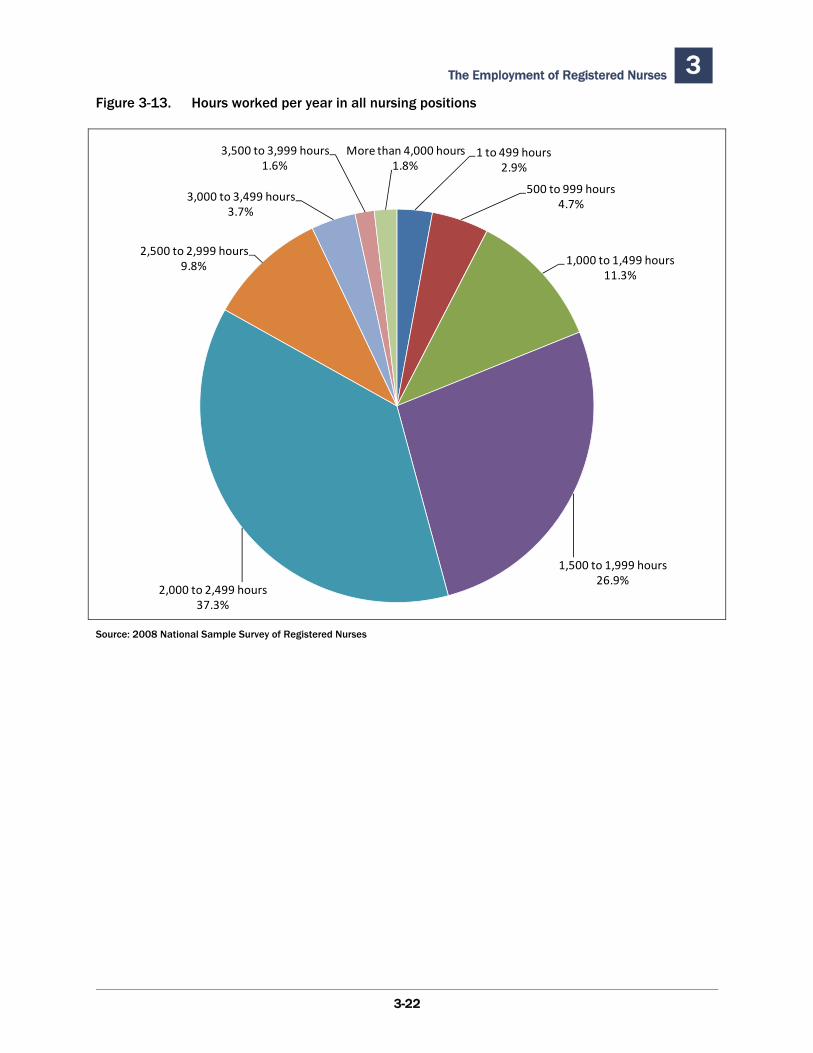
The Employment of Registered Nurses 3 Figure 3-13. Hours worked per year in all nursing positions
1 to 499 hours2.9%
500 to 999 hours4.7%
1,000 to 1,499 hours11.3%
1,500 to 1,999 hours26.9%
2,000 to 2,499 hours37.3%
2,500 to 2,999 hours9.8%
3,000 to 3,499 hours3.7%
3,500 to 3,999 hours1.6%
More than 4,000 hours1.8%
Source: 2008 National Sample Survey of Registered Nurses
3-22
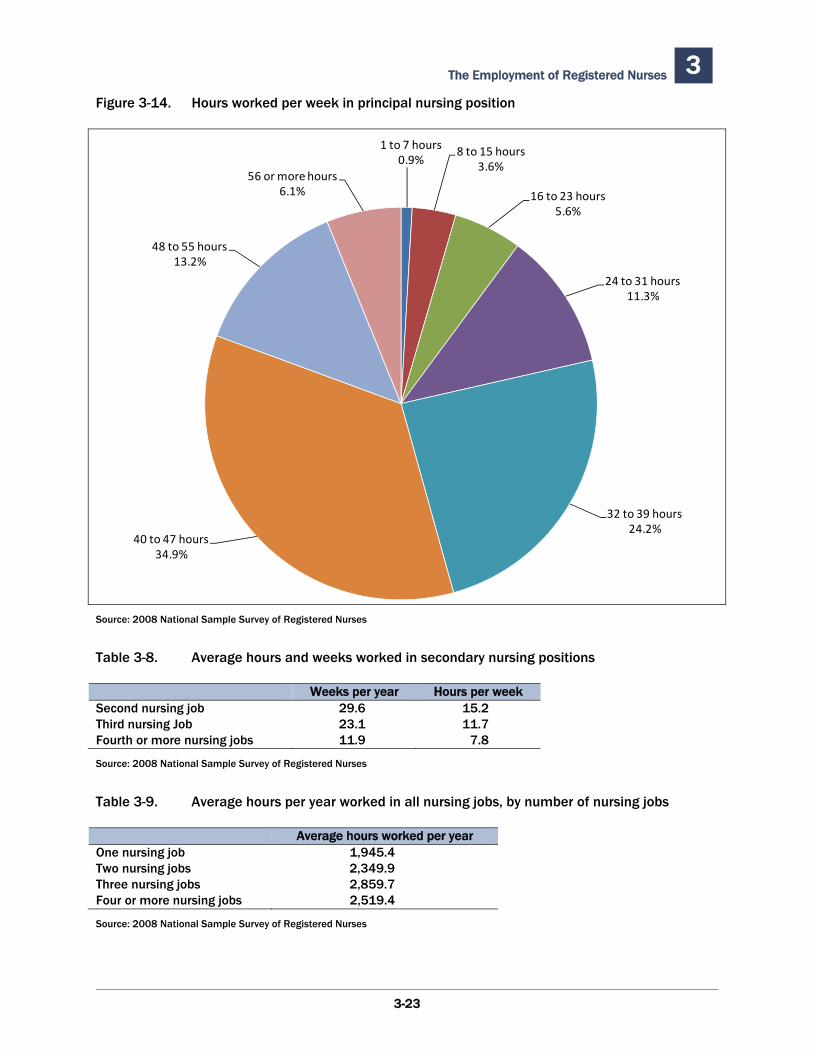
The Employment of Registered Nurses 3 Figure 3-14. Hours worked per week in principal nursing position
Source: 2008 National Sample Survey of Registered Nurses
1 to 7 hours0.9%
8 to 15 hours3.6%
16 to 23 hours5.6%
24 to 31 hours11.3%
32 to 39 hours24.2%
40 to 47 hours34.9%
48 to 55 hours13.2%
56 or more hours6.1%
Table 3-8. Average hours and weeks worked in secondary nursing positions
Weeks per year Hours per weekSecond nursing job 29.6 15.2Third nursing Job 23.1 11.7Fourth or more nursing jobs 11.9 7.8
Source: 2008 National Sample Survey of Registered Nurses
Table 3-9. Average hours per year worked in all nursing jobs, by number of nursing jobs
Average hours worked per yearOne nursing job 1,945.4Two nursing jobs 2,349.9Three nursing jobs 2,859.7Four or more nursing jobs 2,519.4
Source: 2008 National Sample Survey of Registered Nurses
3-23
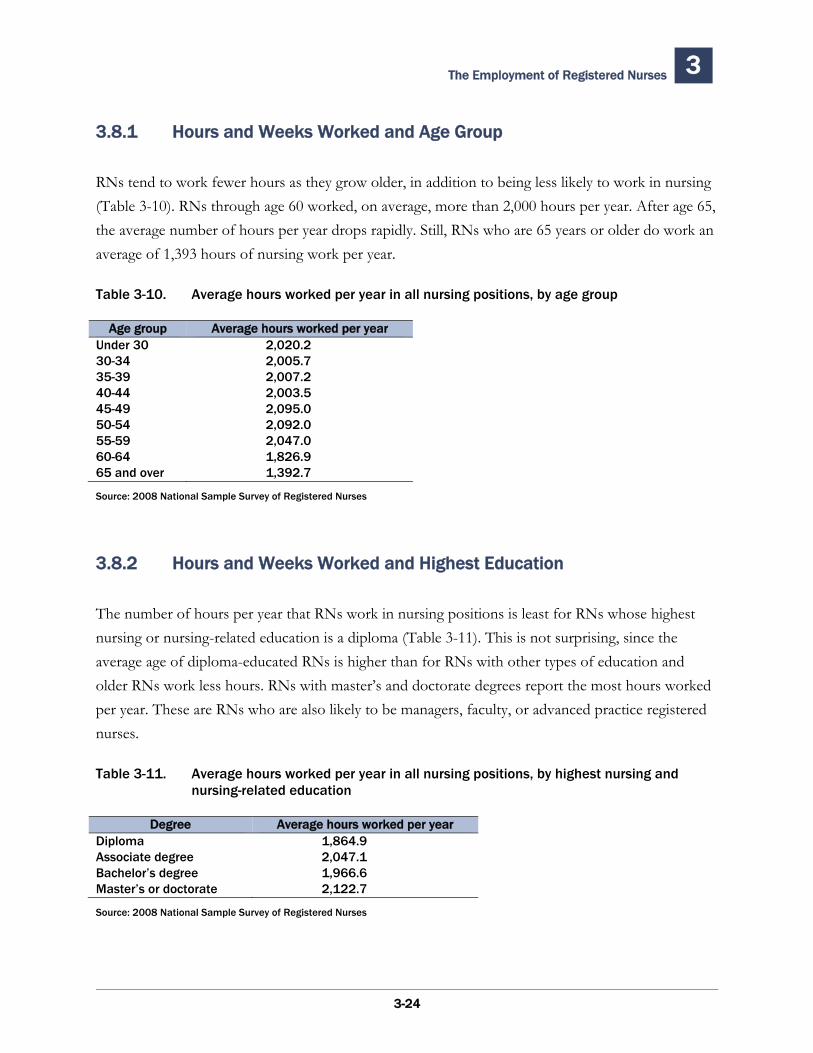
The Employment of Registered Nurses 3
3.8.1 Hours and Weeks Worked and Age Group
RNs tend to work fewer hours as they grow older, in addition to being less likely to work in nursing (Table 3-10). RNs through age 60 worked, on average, more than 2,000 hours per year. After age 65, the average number of hours per year drops rapidly. Still, RNs who are 65 years or older do work an average of 1,393 hours of nursing work per year.
Table 3-10. Average hours worked per year in all nursing positions, by age group
Age group Average hours worked per yearUnder 30 2,020.2 30-34 2,005.7 35-39 2,007.2 40-44 2,003.5 45-49 2,095.0 50-54 2,092.0 55-59 2,047.0 60-64 1,826.9 65 and over 1,392.7
Source: 2008 National Sample Survey of Registered Nurses
3.8.2 Hours and Weeks Worked and Highest Education
The number of hours per year that RNs work in nursing positions is least for RNs whose highest nursing or nursing-related education is a diploma (Table 3-11). This is not surprising, since the average age of diploma-educated RNs is higher than for RNs with other types of education and older RNs work less hours. RNs with master’s and doctorate degrees report the most hours worked per year. These are RNs who are also likely to be managers, faculty, or advanced practice registered nurses.
Table 3-11. Average hours worked per year in all nursing positions, by highest nursing and nursing-related education
Degree Average hours worked per yearDiploma 1,864.9Associate degree 2,047.1Bachelor’s degree 1,966.6Master’s or doctorate 2,122.7
Source: 2008 National Sample Survey of Registered Nurses
3-24

The Employment of Registered Nurses 3
3.8.3 On-Call Work
Some RNs work in an “on-call” arrangement for at least some of their total hours. In this type of arrangement, an RN is not physically present at an employer’s facility (or at a patient’s home in the case of hospice or home care services) but is available to be on-call to work during a prescheduled time. For example, a surgical nurse or nurse anesthetist might be on-call to assist in a surgery between 8 p.m. and 6 a.m. or a nurse midwife may be on-call for deliveries at night or on weekends. Often advanced practice primary care nurses take telephone calls for patient care issues after normal hours. RNs can be paid additionally for these on-call hours usually at a lower rate than is paid for regular work. However, if the RN is called in to work, the RN is paid the normal hourly rate often with an added premium for working after normal scheduled hours. Sometimes, if an RN works in a salaried position, the RN may be on-call but may not receive additional hourly standby pay.
In their principal nursing positions, 19.1 percent of RNs report that they worked on-call or were on standby in a typical work week. Most RNs who reported any on-call activity indicated that they were on standby or worked 20 or fewer hours in a typical week (Table 3-12). RNs who had any on-call activity indicated that they were called to work an average of 12.5 hours per week. They were on standby without being called to work an average of 23.1 hours per week. An average of 14 percent of on-call hours were paid at a standby rate.
Table 3-12. Average hours on standby or worked from on-call per week in the principal nursing position
Hours Percent0 hours 80.9 1 to 20 hours 12.2 21 to 40 hours 3.8 41 to 60 hours 1.4 61 or more hours 1.6 Total 100.0
Source: 2008 National Sample Survey of Registered Nurses
3.8.4 Overtime Work
Typically, RNs paid on an hourly wage basis may be paid for overtime work beyond 40 hours a week and may be compensated at a premium rate. Salaried RNs normally do not receive additional payment for overtime work but may sometimes take paid extra time off later to compensate for working extra hours. While overtime work is ideally a match between an employer’s need for
3-25
The Employment of Registered Nurses 3
additional effort and the nurse’s willingness to provide additional hours, sometimes RNs are required to work overtime (“mandatory overtime”). Mandatory overtime may sometimes be voluntarily accepted as part of the employment arrangement, rather than being totally involuntary. Moreover, in States or facilities where RNs are unionized, overtime may be subject to union contract.
The majority of RNs do not work overtime. Among RNs employed full-time in nursing positions, 27.5 percent report that they worked overtime and received pay for such work (Appendix A, Table 21). Mandatory overtime was reported by 7 percent of RNs. RNs work an average of 7.5 overtime hours per week and averaged 6.6 hours per week of mandatory overtime.
3.8.5 Hours Worked and Employment Setting
The number of hours RNs work per week and per year varies across employment settings (Table 3-13 and Appendix A, Tables 20, 21, and 22).
RNs whose principal nursing position is in a school health setting reported the fewest hours per year, with an average of 1,443 hours per year; this low work rate is likely related to their work schedules being based on an academic calendar and the holidays, vacation periods, and other time off related to the school calendar. They also reported the fewest hours worked per week, averaging 39 hours for full-time RNs.
The greatest number of average hours RNs worked per year in their principal nursing position (2,107 hours) was in nursing homes and extended care facilities.
Among RNs working full-time, the greatest number of hours per week was reported by RNs whose principal position was in a nursing home (45.8), followed by those in home health (45.3).
For RNs working part-time, the greatest number of hours per week was reported by RNs whose principal position was in a hospital (25.2), followed by home health (24.4).
The average number of hours worked per week in principal nursing positions was more than 40 for full-time RNs in all settings, except those in school health.
3-26
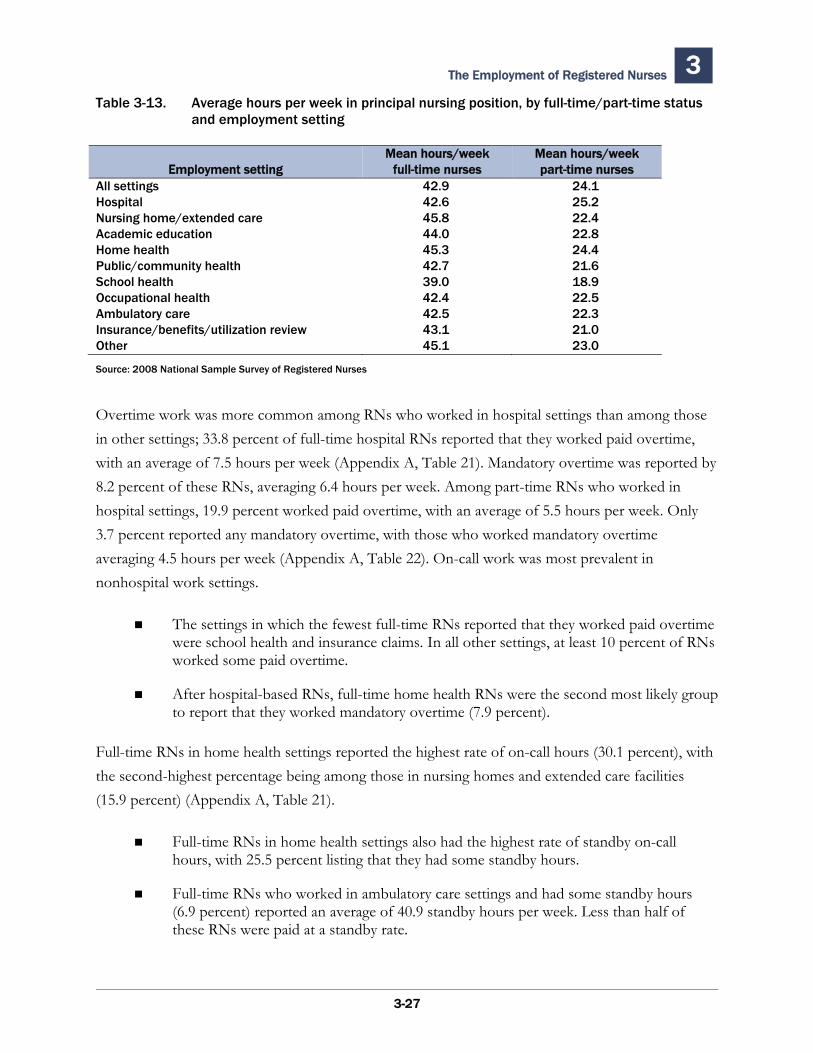
The Employment of Registered Nurses 3 Table 3-13. Average hours per week in principal nursing position, by full-time/part-time status
and employment setting
Mean hours/week Mean hours/week Employment setting full-time nurses part-time nurses
All settings 42.9 24.1 Hospital 42.6 25.2 Nursing home/extended care 45.8 22.4 Academic education 44.0 22.8 Home health 45.3 24.4 Public/community health 42.7 21.6 School health 39.0 18.9 Occupational health 42.4 22.5 Ambulatory care 42.5 22.3 Insurance/benefits/utilization review 43.1 21.0 Other 45.1 23.0
Source: 2008 National Sample Survey of Registered Nurses
Overtime work was more common among RNs who worked in hospital settings than among those in other settings; 33.8 percent of full-time hospital RNs reported that they worked paid overtime, with an average of 7.5 hours per week (Appendix A, Table 21). Mandatory overtime was reported by 8.2 percent of these RNs, averaging 6.4 hours per week. Among part-time RNs who worked in hospital settings, 19.9 percent worked paid overtime, with an average of 5.5 hours per week. Only 3.7 percent reported any mandatory overtime, with those who worked mandatory overtime averaging 4.5 hours per week (Appendix A, Table 22). On-call work was most prevalent in nonhospital work settings.
The settings in which the fewest full-time RNs reported that they worked paid overtime were school health and insurance claims. In all other settings, at least 10 percent of RNs worked some paid overtime.
After hospital-based RNs, full-time home health RNs were the second most likely group to report that they worked mandatory overtime (7.9 percent).
Full-time RNs in home health settings reported the highest rate of on-call hours (30.1 percent), with the second-highest percentage being among those in nursing homes and extended care facilities (15.9 percent) (Appendix A, Table 21).
Full-time RNs in home health settings also had the highest rate of standby on-call hours, with 25.5 percent listing that they had some standby hours.
Full-time RNs who worked in ambulatory care settings and had some standby hours (6.9 percent) reported an average of 40.9 standby hours per week. Less than half of these RNs were paid at a standby rate.
3-27
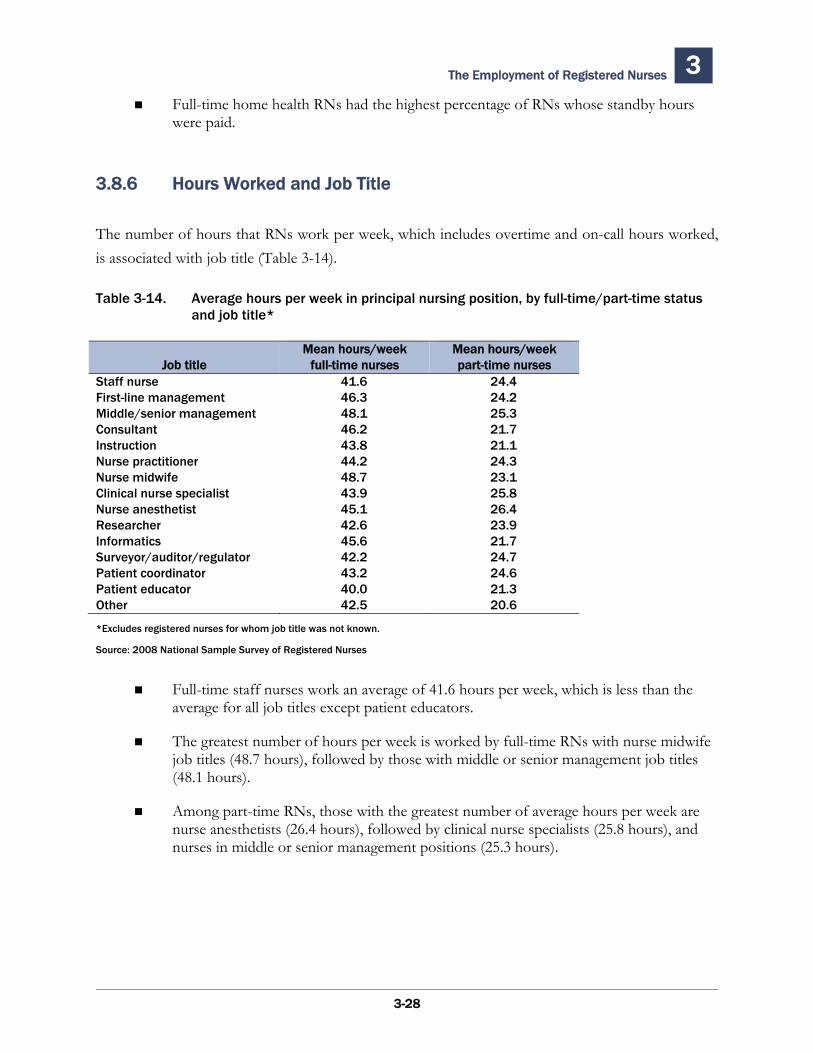
The Employment of Registered Nurses 3
Full-time home health RNs had the highest percentage of RNs whose standby hours were paid.
3.8.6 Hours Worked and Job Title
The number of hours that RNs work per week, which includes overtime and on-call hours worked, is associated with job title (Table 3-14).
Table 3-14. Average hours per week in principal nursing position, by full-time/part-time status and job title*
Mean hours/week Mean hours/weekJob title full-time nurses part-time nurses
Staff nurse 41.6 24.4First-line management 46.3 24.2Middle/senior management 48.1 25.3Consultant 46.2 21.7Instruction 43.8 21.1Nurse practitioner 44.2 24.3Nurse midwife 48.7 23.1Clinical nurse specialist 43.9 25.8Nurse anesthetist 45.1 26.4Researcher 42.6 23.9Informatics 45.6 21.7Surveyor/auditor/regulator 42.2 24.7Patient coordinator 43.2 24.6Patient educator 40.0 21.3Other 42.5 20.6
*Excludes registered nurses for whom job title was not known.
Source: 2008 National Sample Survey of Registered Nurses
Full-time staff nurses work an average of 41.6 hours per week, which is less than the average for all job titles except patient educators.
The greatest number of hours per week is worked by full-time RNs with nurse midwife job titles (48.7 hours), followed by those with middle or senior management job titles (48.1 hours).
Among part-time RNs, those with the greatest number of average hours per week are nurse anesthetists (26.4 hours), followed by clinical nurse specialists (25.8 hours), and nurses in middle or senior management positions (25.3 hours).
3-28
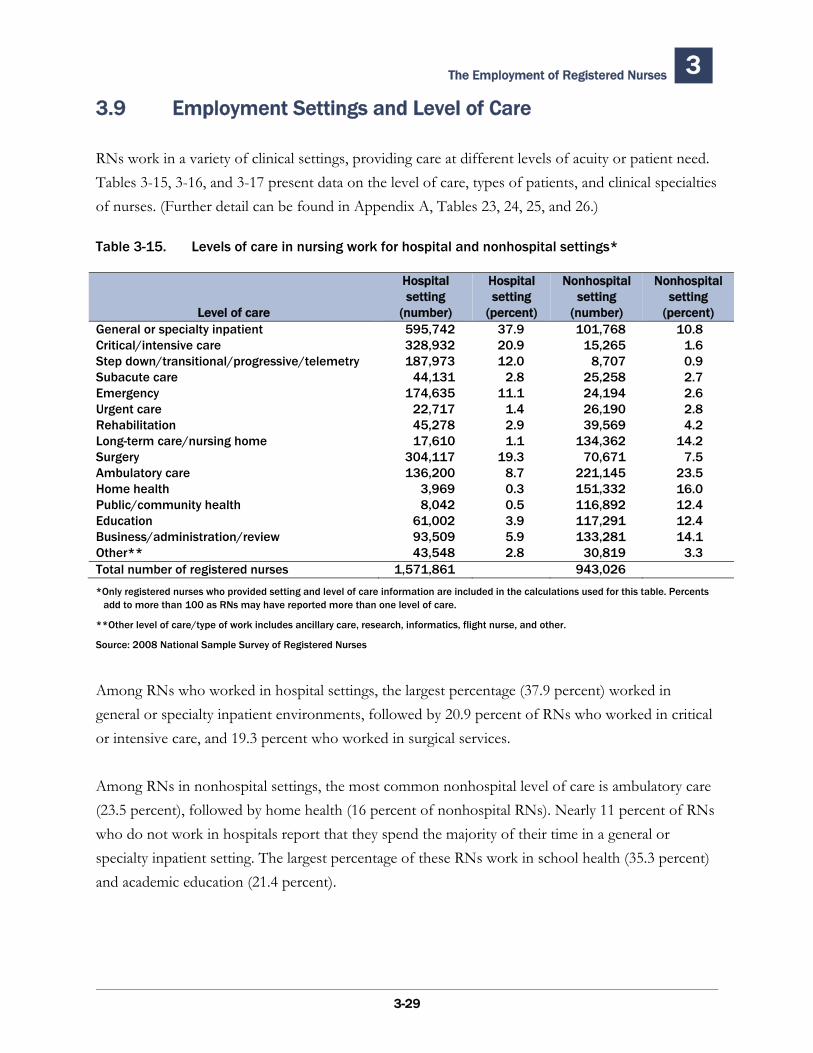
The Employment of Registered Nurses 3
3.9 Employment Settings and Level of Care
RNs work in a variety of clinical settings, providing care at different levels of acuity or patient need. Tables 3-15, 3-16, and 3-17 present data on the level of care, types of patients, and clinical specialties of nurses. (Further detail can be found in Appendix A, Tables 23, 24, 25, and 26.)
Table 3-15. Levels of care in nursing work for hospital and nonhospital settings*
Level of care
Hospital setting
(number)
Hospital setting
(percent)
Nonhospital setting
(number)
Nonhospital setting
(percent) General or specialty inpatient Critical/intensive care Step down/transitional/progressive/telemetrySubacute care Emergency Urgent care Rehabilitation Long-term care/nursing home Surgery Ambulatory care Home health Public/community health Education Business/administration/review Other**
595,742328,932187,973
44,131174,635
22,71745,27817,610
304,117136,200
3,9698,042
61,00293,50943,548
37.920.912.0
2.811.1
1.42.91.1
19.38.70.30.53.95.92.8
101,768 15,265
8,707 25,258 24,194 26,190 39,569
134,362 70,671
221,145 151,332 116,892 117,291 133,281
30,819
10.81.60.92.72.62.84.2
14.27.5
23.516.012.412.414.1
3.3Total number of registered nurses 1,571,861 943,026
*Only registered nurses who provided setting and level of care information are included in the calculations used for this table. Percents add to more than 100 as RNs may have reported more than one level of care.
**Other level of care/type of work includes ancillary care, research, informatics, flight nurse, and other.
Source: 2008 National Sample Survey of Registered Nurses
Among RNs who worked in hospital settings, the largest percentage (37.9 percent) worked in general or specialty inpatient environments, followed by 20.9 percent of RNs who worked in critical or intensive care, and 19.3 percent who worked in surgical services.
Among RNs in nonhospital settings, the most common nonhospital level of care is ambulatory care (23.5 percent), followed by home health (16 percent of nonhospital RNs). Nearly 11 percent of RNs who do not work in hospitals report that they spend the majority of their time in a general or specialty inpatient setting. The largest percentage of these RNs work in school health (35.3 percent) and academic education (21.4 percent).
3-29
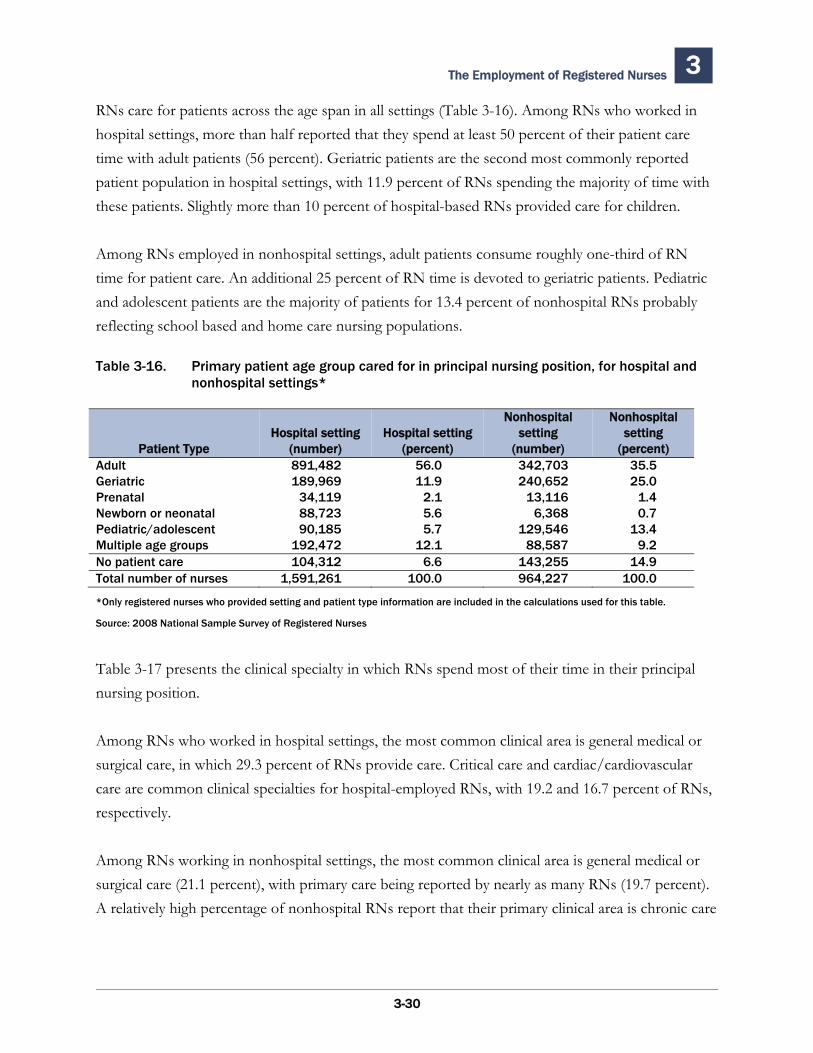
The Employment of Registered Nurses 3
RNs care for patients across the age span in all settings (Table 3-16). Among RNs who worked in hospital settings, more than half reported that they spend at least 50 percent of their patient care time with adult patients (56 percent). Geriatric patients are the second most commonly reported patient population in hospital settings, with 11.9 percent of RNs spending the majority of time with these patients. Slightly more than 10 percent of hospital-based RNs provided care for children.
Among RNs employed in nonhospital settings, adult patients consume roughly one-third of RN time for patient care. An additional 25 percent of RN time is devoted to geriatric patients. Pediatric and adolescent patients are the majority of patients for 13.4 percent of nonhospital RNs probably reflecting school based and home care nursing populations.
Table 3-16. Primary patient age group cared for in principal nursing position, for hospital and nonhospital settings*
Nonhospital Nonhospital Hospital setting Hospital setting setting setting
Patient Type (number) (percent) (number) (percent) Adult 891,482 56.0 342,703 35.5Geriatric 189,969 11.9 240,652 25.0Prenatal 34,119 2.1 13,116 1.4Newborn or neonatal 88,723 5.6 6,368 0.7Pediatric/adolescent 90,185 5.7 129,546 13.4Multiple age groups 192,472 12.1 88,587 9.2No patient care 104,312 6.6 143,255 14.9Total number of nurses 1,591,261 100.0 964,227 100.0
*Only registered nurses who provided setting and patient type information are included in the calculations used for this table.
Source: 2008 National Sample Survey of Registered Nurses
Table 3-17 presents the clinical specialty in which RNs spend most of their time in their principal nursing position.
Among RNs who worked in hospital settings, the most common clinical area is general medical or surgical care, in which 29.3 percent of RNs provide care. Critical care and cardiac/cardiovascular care are common clinical specialties for hospital-employed RNs, with 19.2 and 16.7 percent of RNs, respectively.
Among RNs working in nonhospital settings, the most common clinical area is general medical or surgical care (21.1 percent), with primary care being reported by nearly as many RNs (19.7 percent). A relatively high percentage of nonhospital RNs report that their primary clinical area is chronic care
3-30
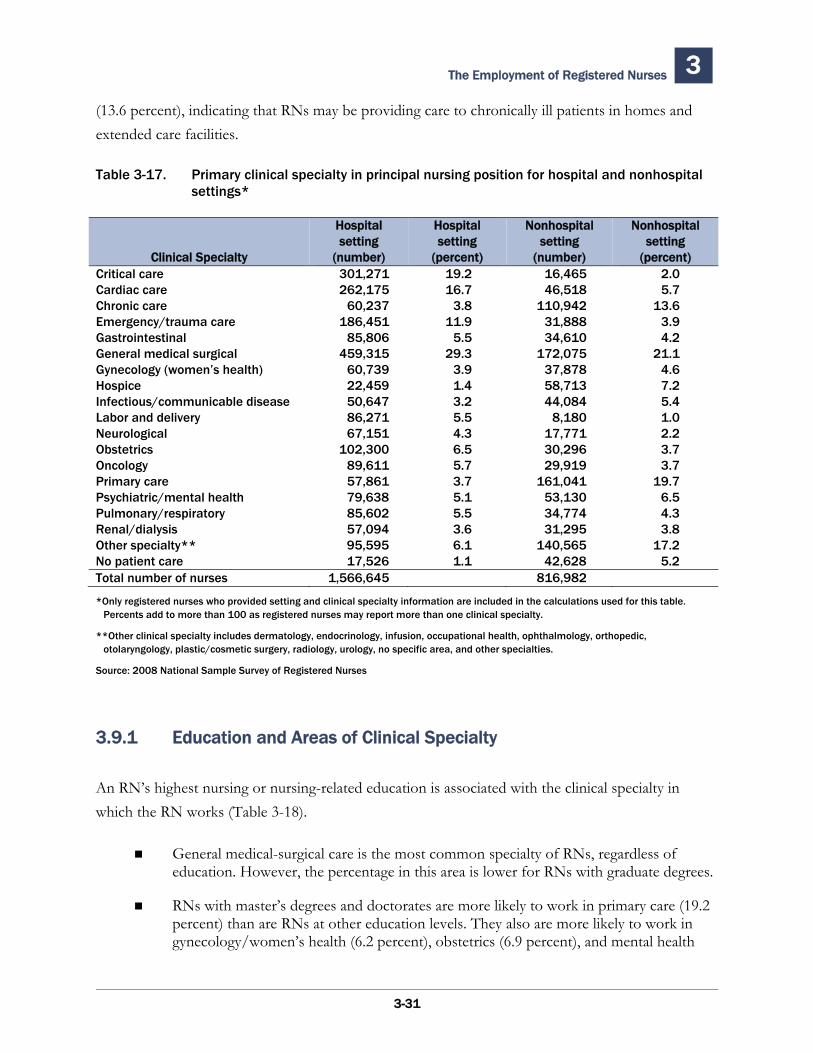
The Employment of Registered Nurses 3
(13.6 percent), indicating that RNs may be providing care to chronically ill patients in homes and extended care facilities.
Table 3-17. Primary clinical specialty in principal nursing position for hospital and nonhospital settings*
Clinical Specialty
Hospital setting
(number)
Hospital setting
(percent)
Nonhospital setting
(number)
Nonhospital setting
(percent) Critical care Cardiac care Chronic care Emergency/trauma care Gastrointestinal General medical surgical Gynecology (women’s health) Hospice Infectious/communicable disease Labor and delivery Neurological Obstetrics Oncology Primary care Psychiatric/mental healthPulmonary/respiratory Renal/dialysis Other specialty** No patient care
301,271262,175
60,237186,451
85,806459,315
60,73922,45950,64786,27167,151
102,30089,61157,86179,63885,60257,09495,59517,526
19.216.7
3.811.9
5.529.3
3.91.43.25.54.36.55.73.75.15.53.66.11.1
16,465 46,518
110,942 31,888 34,610
172,075 37,878 58,713 44,084
8,180 17,771 30,296 29,919
161,041 53,130 34,774 31,295
140,565 42,628
2.05.7
13.63.94.2
21.14.67.25.41.02.23.73.7
19.76.54.33.8
17.25.2
Total number of nurses 1,566,645 816,982
*Only registered nurses who provided setting and clinical specialty information are included in the calculations used for this table. Percents add to more than 100 as registered nurses may report more than one clinical specialty.
**Other clinical specialty includes dermatology, endocrinology, infusion, occupational health, ophthalmology, orthopedic, otolaryngology, plastic/cosmetic surgery, radiology, urology, no specific area, and other specialties.
Source: 2008 National Sample Survey of Registered Nurses
3.9.1 Education and Areas of Clinical Specialty
An RN’s highest nursing or nursing-related education is associated with the clinical specialty in which the RN works (Table 3-18).
General medical-surgical care is the most common specialty of RNs, regardless of education. However, the percentage in this area is lower for RNs with graduate degrees.
RNs with master’s degrees and doctorates are more likely to work in primary care (19.2 percent) than are RNs at other education levels. They also are more likely to work in gynecology/women’s health (6.2 percent), obstetrics (6.9 percent), and mental health
3-31
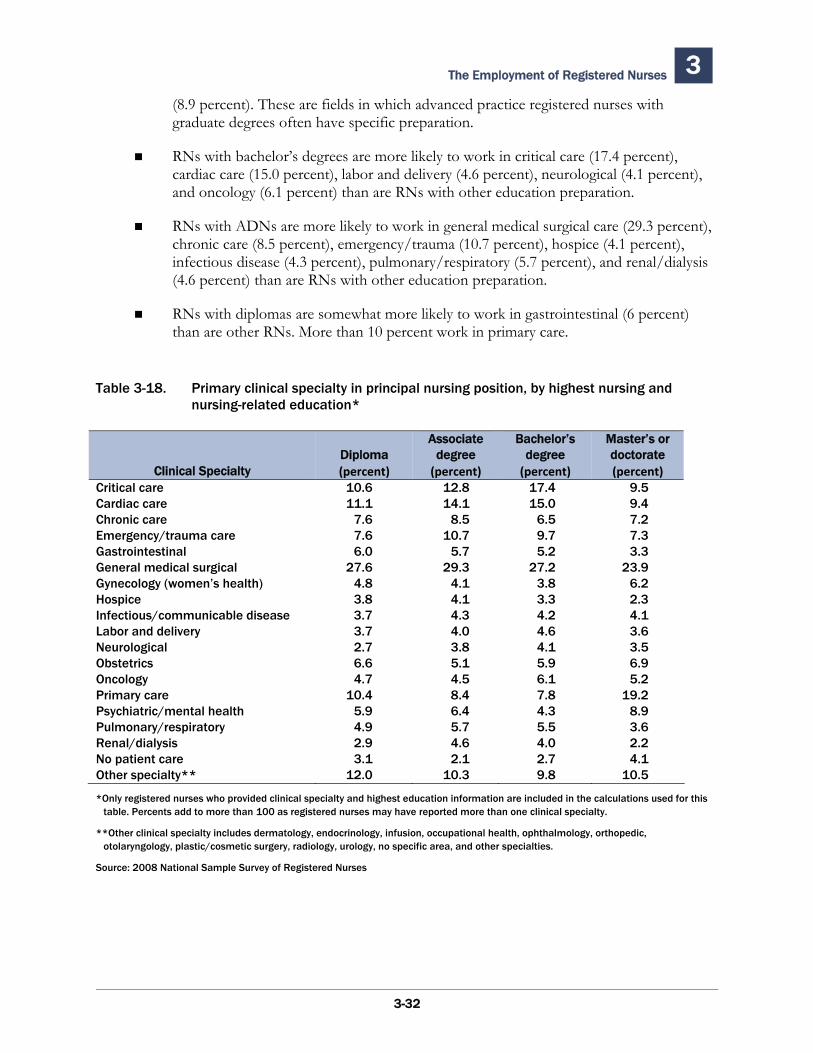
The Employment of Registered Nurses 3
(8.9 percent). These are fields in which advanced practice registered nurses with graduate degrees often have specific preparation.
RNs with bachelor’s degrees are more likely to work in critical care (17.4 percent), cardiac care (15.0 percent), labor and delivery (4.6 percent), neurological (4.1 percent), and oncology (6.1 percent) than are RNs with other education preparation.
RNs with ADNs are more likely to work in general medical surgical care (29.3 percent), chronic care (8.5 percent), emergency/trauma (10.7 percent), hospice (4.1 percent), infectious disease (4.3 percent), pulmonary/respiratory (5.7 percent), and renal/dialysis (4.6 percent) than are RNs with other education preparation.
RNs with diplomas are somewhat more likely to work in gastrointestinal (6 percent) than are other RNs. More than 10 percent work in primary care.
Table 3-18. Primary clinical specialty in principal nursing position, by highest nursing and nursing-related education*
Associate Bachelor’s Master’s or Diploma degree degree doctorate
Clinical Specialty (percent) (percent) (percent) (percent)Critical care 10.6 12.8 17.4 9.5 Cardiac care 11.1 14.1 15.0 9.4 Chronic care 7.6 8.5 6.5 7.2 Emergency/trauma care 7.6 10.7 9.7 7.3 Gastrointestinal 6.0 5.7 5.2 3.3 General medical surgical 27.6 29.3 27.2 23.9 Gynecology (women’s health) 4.8 4.1 3.8 6.2 Hospice 3.8 4.1 3.3 2.3 Infectious/communicable disease 3.7 4.3 4.2 4.1 Labor and delivery 3.7 4.0 4.6 3.6 Neurological 2.7 3.8 4.1 3.5 Obstetrics 6.6 5.1 5.9 6.9 Oncology 4.7 4.5 6.1 5.2 Primary care 10.4 8.4 7.8 19.2 Psychiatric/mental health 5.9 6.4 4.3 8.9 Pulmonary/respiratory 4.9 5.7 5.5 3.6 Renal/dialysis 2.9 4.6 4.0 2.2 No patient care 3.1 2.1 2.7 4.1 Other specialty** 12.0 10.3 9.8 10.5
*Only registered nurses who provided clinical specialty and highest education information are included in the calculations used for this table. Percents add to more than 100 as registered nurses may have reported more than one clinical specialty.
**Other clinical specialty includes dermatology, endocrinology, infusion, occupational health, ophthalmology, orthopedic, otolaryngology, plastic/cosmetic surgery, radiology, urology, no specific area, and other specialties.
Source: 2008 National Sample Survey of Registered Nurses
3-32
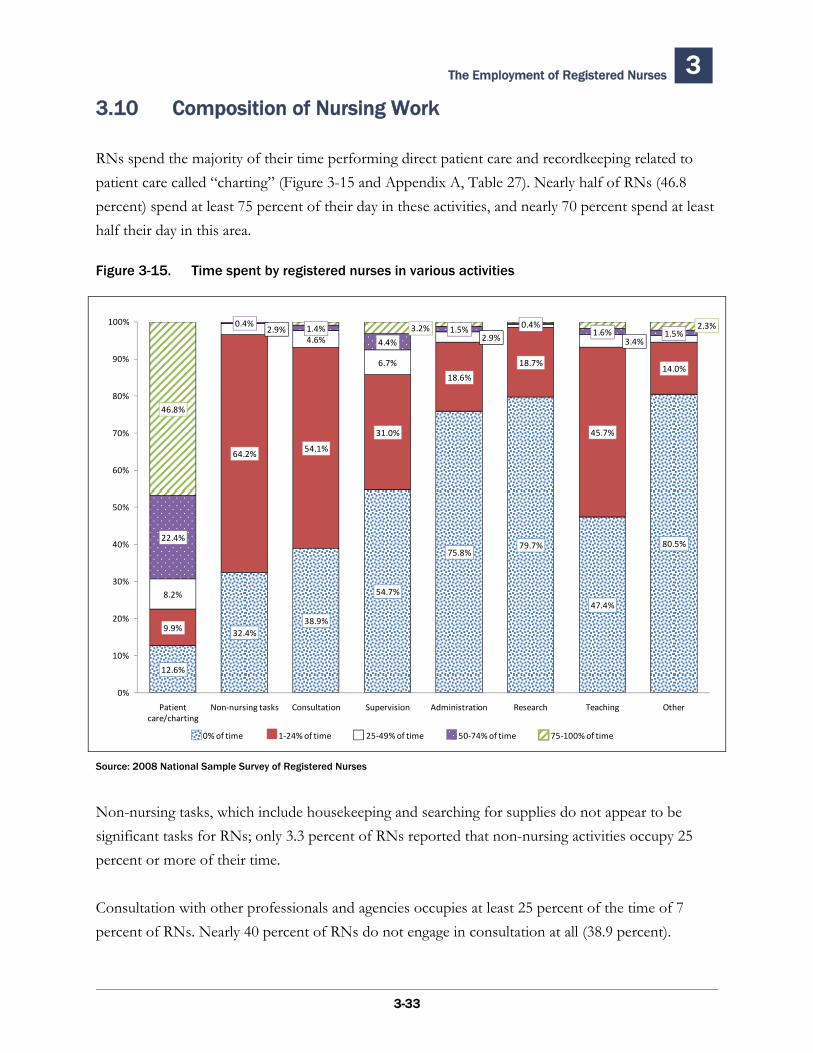
The Employment of Registered Nurses 3
3.10 Composition of Nursing Work
RNs spend the majority of their time performing direct patient care and recordkeeping related to patient care called “charting” (Figure 3-15 and Appendix A, Table 27). Nearly half of RNs (46.8 percent) spend at least 75 percent of their day in these activities, and nearly 70 percent spend at least half their day in this area.
Figure 3-15. Time spent by registered nurses in various activities
12.6%
32.4%38.9%
54.7%
75.8%79.7%
47.4%
80.5%
9.9%
64.2%54.1%
31.0%
18.6%
18.7%
45.7%
14.0%
8.2%
2.9%4.6%
6.7%
2.9% 3.4%
22.4%
0.4% 1.4%
4.4%1.5% 0.4%
1.6% 1.5%
46.8%
3.2% 2.3%
0%
10%
20%
30%
40%
50%
60%
70%
80%
90%
100%
Patient care/charting
Non‐nursing tasks Consultation Supervision Administration Research Teaching Other
0% of time 1‐24% of time 25‐49% of time 50‐74% of time 75‐100% of time
Source: 2008 National Sample Survey of Registered Nurses
Non-nursing tasks, which include housekeeping and searching for supplies do not appear to be significant tasks for RNs; only 3.3 percent of RNs reported that non-nursing activities occupy 25 percent or more of their time.
Consultation with other professionals and agencies occupies at least 25 percent of the time of 7 percent of RNs. Nearly 40 percent of RNs do not engage in consultation at all (38.9 percent).
3-33
The Employment of Registered Nurses 3
Teaching, precepting, or orienting students or new hires occupies at least some work time of 52.6 percent of RNs. Only 6.9 percent of RNs say they spend at least 25 percent of their time in teaching-related activities.
3.10.1 Composition of Work and Job Title
The activities of RNs vary by job title (Figure 3-16).
Staff nurses spend an average of 71.8 percent of their time performing patient care and keeping patient care records. Non-nursing tasks occupy an average of 7.6 percent of staff nurse time.
RNs in first-line management positions spend an average of 45 percent of their time supervising others and 25.3 percent of their time providing patient care and charting.
Middle and senior managers spend an average of 38.3 percent of their time in supervision, 25 percent performing administrative responsibilities, and 11.5 percent providing patient care and charting. An average of 9.9 percent of their time is spent consulting with other providers or agencies.
Nurse practitioners spend an average of 79.7 percent of their time providing patient care and charting patient care information.
3.10.2 Composition of Work and Education
The highest nursing or nursing-related education of RNs is associated with the activities performed by RNs (Table 3-19 and Appendix A, Table 28). While RNs with graduate degrees spend less time doing patient care and charting on average than do other RNs, this is probably associated with the fact that RNs who are managers and educators would have less patient care activities than staff nurses. Only nurse practitioners, nurse midwives, and nurse anesthetists would have patient contact similar to staff nurses (Table 3-5).
3-34
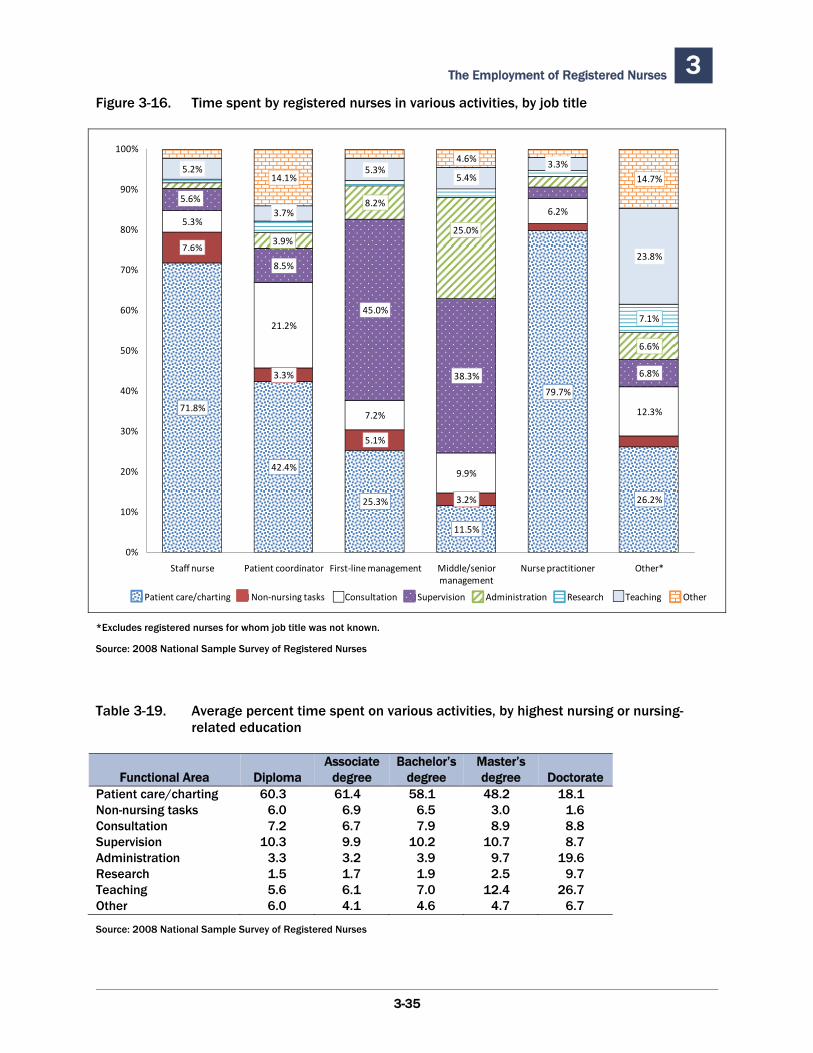
The Employment of Registered Nurses 3 Figure 3-16. Time spent by registered nurses in various activities, by job title
71.8%
42.4%
25.3%
11.5%
79.7%
26.2%
7.6%
3.3%
5.1%
3.2%
5.3%
21.2%
7.2%
9.9%
6.2%
12.3%
5.6%
8.5%
45.0%
38.3% 6.8%
3.9%
8.2%
25.0%
6.6%
7.1%
5.2%
3.7%
5.3%5.4%
3.3%
23.8%
14.1%
4.6%
14.7%
0%
10%
20%
30%
40%
50%
60%
70%
80%
90%
100%
Staff nurse Patient coordinator First‐line management Middle/senior management
Nurse practitioner Other*
Patient care/charting Non‐nursing tasks Consultation Supervision Administration Research Teaching Other
*Excludes registered nurses for whom job title was not known.
Source: 2008 National Sample Survey of Registered Nurses
Table 3-19. Average percent time spent on various activities, by highest nursing or nursing-related education
Associate Bachelor’s Master’s Functional Area Diploma degree degree degree Doctorate
Patient care/charting 60.3 61.4 58.1 48.2 18.1 Non-nursing tasks 6.0 6.9 6.5 3.0 1.6 Consultation 7.2 6.7 7.9 8.9 8.8 Supervision 10.3 9.9 10.2 10.7 8.7 Administration 3.3 3.2 3.9 9.7 19.6 Research 1.5 1.7 1.9 2.5 9.7 Teaching 5.6 6.1 7.0 12.4 26.7 Other 6.0 4.1 4.6 4.7 6.7
Source: 2008 National Sample Survey of Registered Nurses
3-35
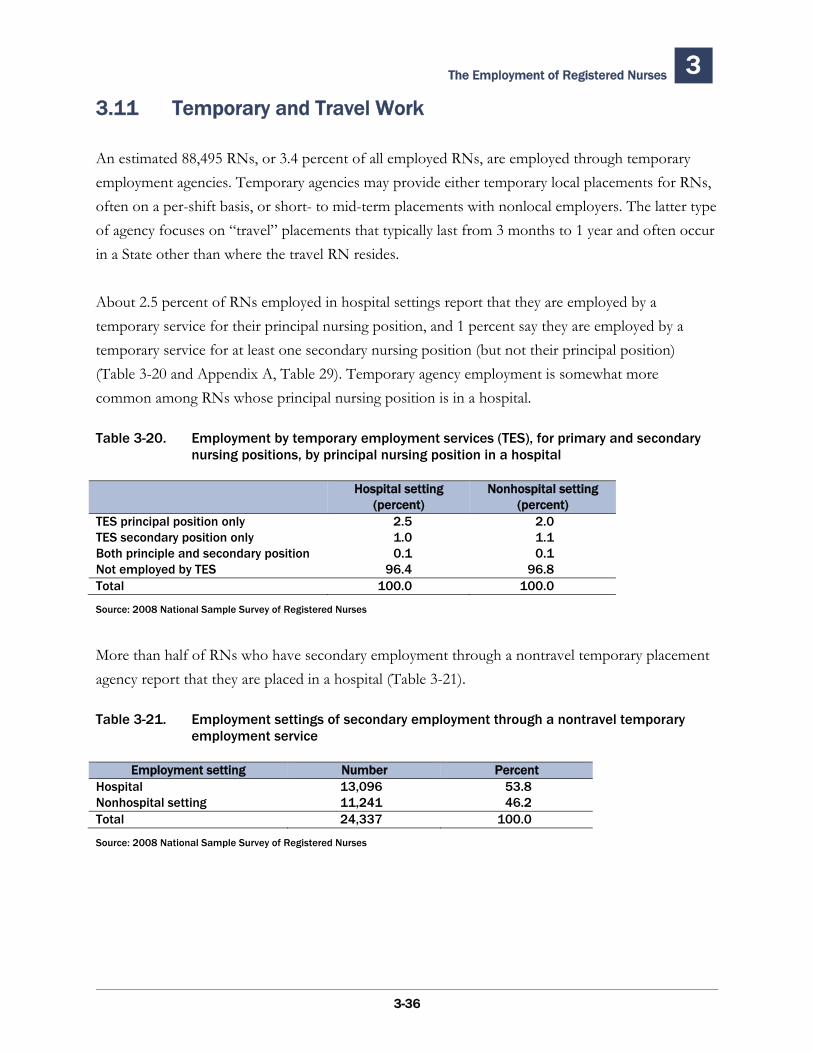
The Employment of Registered Nurses 3
3.11 Temporary and Travel Work
An estimated 88,495 RNs, or 3.4 percent of all employed RNs, are employed through temporary employment agencies. Temporary agencies may provide either temporary local placements for RNs, often on a per-shift basis, or short- to mid-term placements with nonlocal employers. The latter type of agency focuses on “travel” placements that typically last from 3 months to 1 year and often occur in a State other than where the travel RN resides.
About 2.5 percent of RNs employed in hospital settings report that they are employed by a temporary service for their principal nursing position, and 1 percent say they are employed by a temporary service for at least one secondary nursing position (but not their principal position) (Table 3-20 and Appendix A, Table 29). Temporary agency employment is somewhat more common among RNs whose principal nursing position is in a hospital.
Table 3-20. Employment by temporary employment services (TES), for primary and secondary nursing positions, by principal nursing position in a hospital
Hospital setting Nonhospital setting (percent) (percent)
TES principal position only 2.5 2.0TES secondary position only 1.0 1.1Both principle and secondary position 0.1 0.1Not employed by TES 96.4 96.8Total 100.0 100.0
Source: 2008 National Sample Survey of Registered Nurses
More than half of RNs who have secondary employment through a nontravel temporary placement agency report that they are placed in a hospital (Table 3-21).
Table 3-21. Employment settings of secondary employment through a nontravel temporary employment service
Employment setting Number PercentHospital 13,096 53.8Nonhospital setting 11,241 46.2Total 24,337 100.0
Source: 2008 National Sample Survey of Registered Nurses
3-36
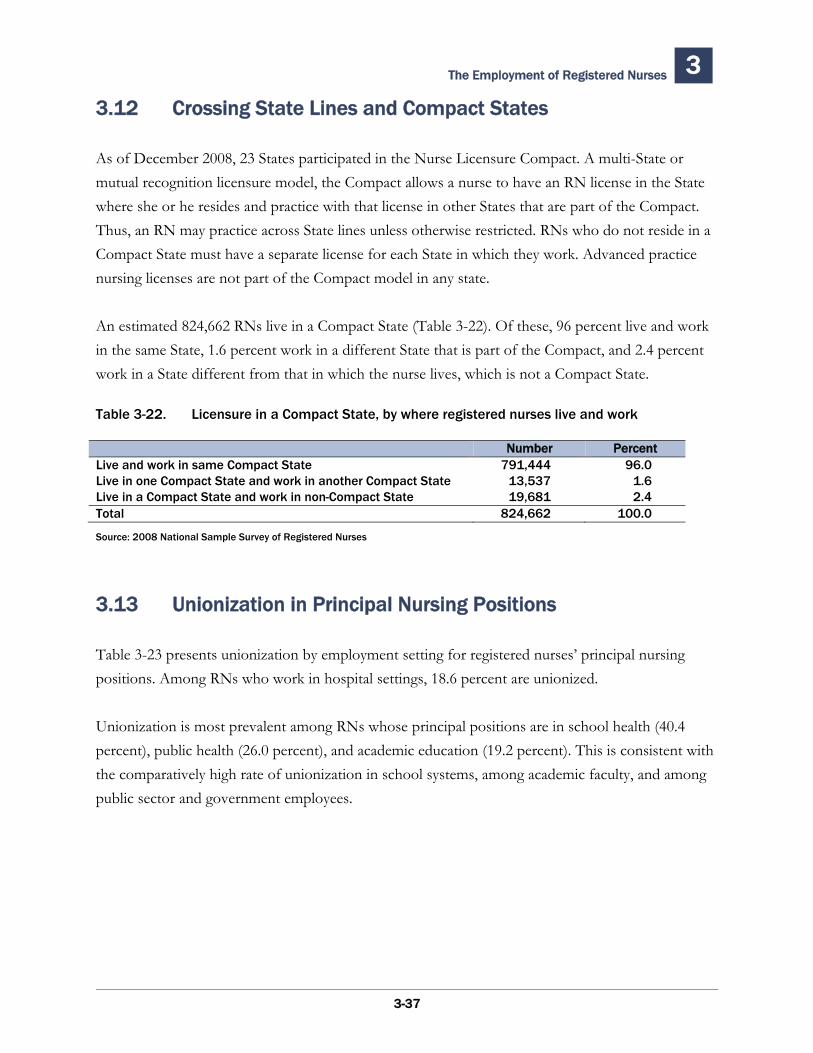
The Employment of Registered Nurses 3
3.12 Crossing State Lines and Compact States
As of December 2008, 23 States participated in the Nurse Licensure Compact. A multi-State or mutual recognition licensure model, the Compact allows a nurse to have an RN license in the State where she or he resides and practice with that license in other States that are part of the Compact. Thus, an RN may practice across State lines unless otherwise restricted. RNs who do not reside in a Compact State must have a separate license for each State in which they work. Advanced practice nursing licenses are not part of the Compact model in any state.
An estimated 824,662 RNs live in a Compact State (Table 3-22). Of these, 96 percent live and work in the same State, 1.6 percent work in a different State that is part of the Compact, and 2.4 percent work in a State different from that in which the nurse lives, which is not a Compact State.
Table 3-22. Licensure in a Compact State, by where registered nurses live and work
Number PercentLive and work in same Compact State 791,444 96.0 Live in one Compact State and work in another Compact State 13,537 1.6 Live in a Compact State and work in non-Compact State 19,681 2.4 Total 824,662 100.0
Source: 2008 National Sample Survey of Registered Nurses
3.13 Unionization in Principal Nursing Positions
Table 3-23 presents unionization by employment setting for registered nurses’ principal nursing positions. Among RNs who work in hospital settings, 18.6 percent are unionized.
Unionization is most prevalent among RNs whose principal positions are in school health (40.4 percent), public health (26.0 percent), and academic education (19.2 percent). This is consistent with the comparatively high rate of unionization in school systems, among academic faculty, and among public sector and government employees.
3-37
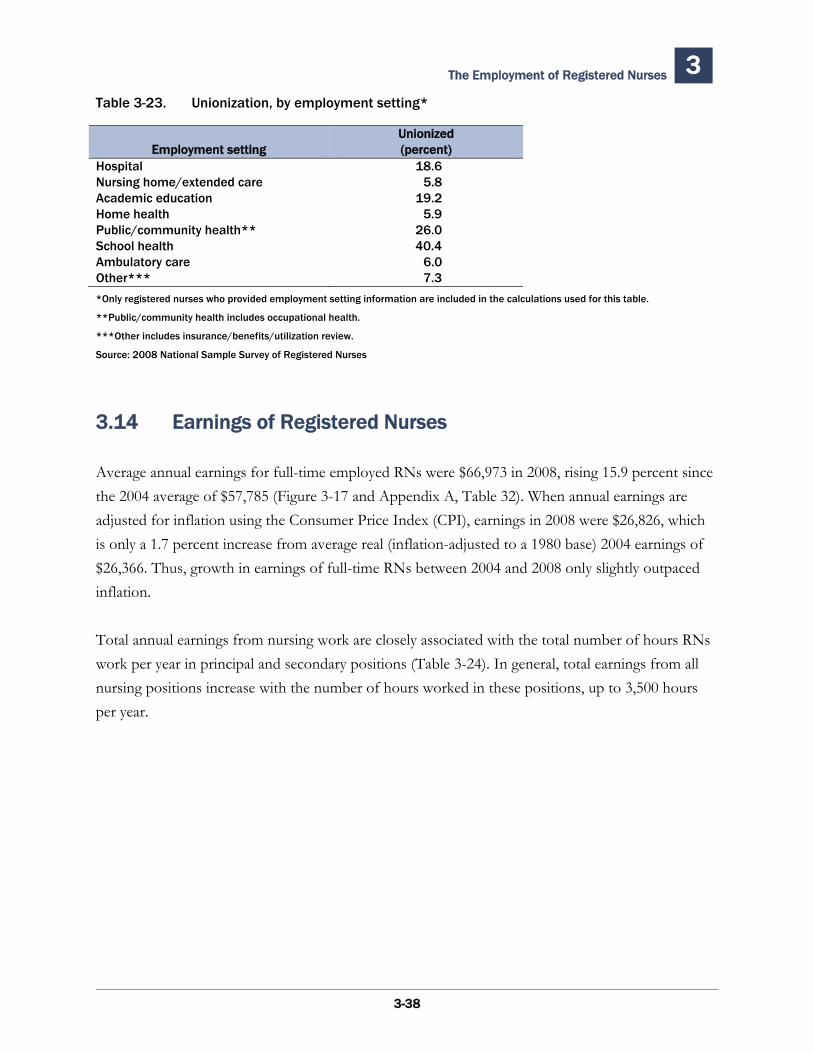
The Employment of Registered Nurses 3 Table 3-23. Unionization, by employment setting*
UnionizedEmployment setting (percent)
Hospital 18.6Nursing home/extended care 5.8Academic education 19.2Home health 5.9Public/community health** 26.0School health 40.4Ambulatory care 6.0Other*** 7.3
*Only registered nurses who provided employment setting information are included in the calculations used for this table.
**Public/community health includes occupational health.
***Other includes insurance/benefits/utilization review.
Source: 2008 National Sample Survey of Registered Nurses
3.14 Earnings of Registered Nurses
Average annual earnings for full-time employed RNs were $66,973 in 2008, rising 15.9 percent since the 2004 average of $57,785 (Figure 3-17 and Appendix A, Table 32). When annual earnings are adjusted for inflation using the Consumer Price Index (CPI), earnings in 2008 were $26,826, which is only a 1.7 percent increase from average real (inflation-adjusted to a 1980 base) 2004 earnings of $26,366. Thus, growth in earnings of full-time RNs between 2004 and 2008 only slightly outpaced inflation.
Total annual earnings from nursing work are closely associated with the total number of hours RNs work per year in principal and secondary positions (Table 3-24). In general, total earnings from all nursing positions increase with the number of hours worked in these positions, up to 3,500 hours per year.
3-38
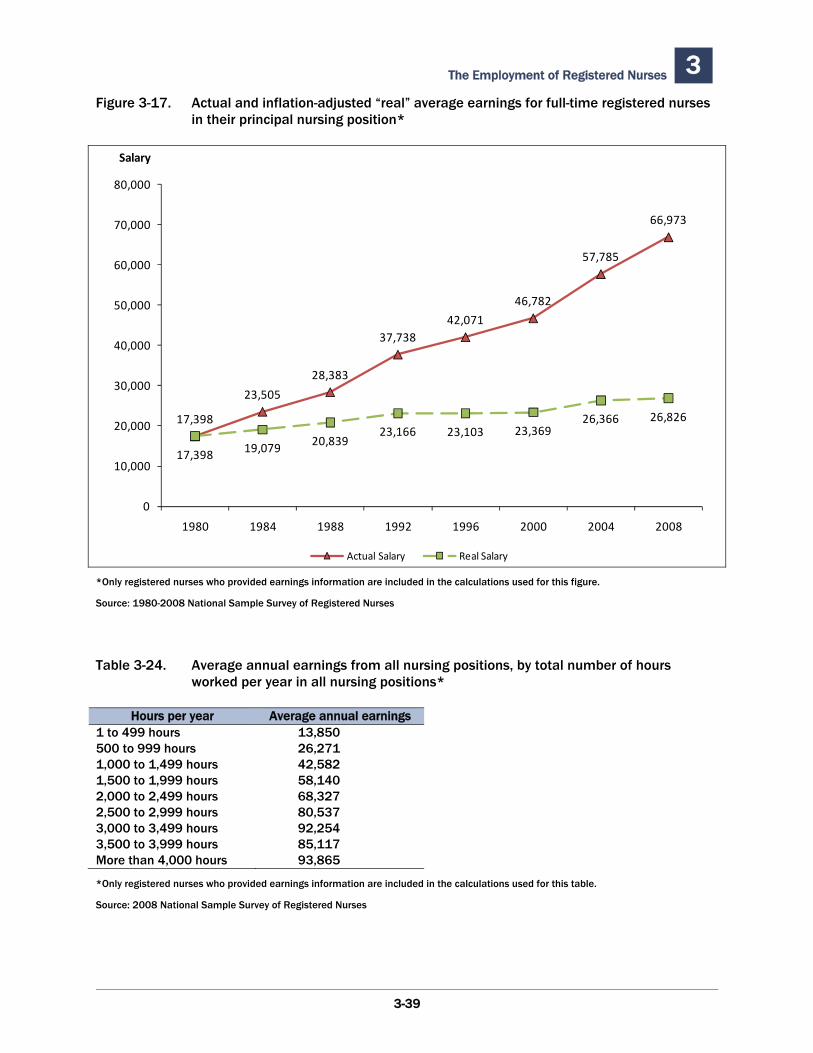
The Employment of Registered Nurses 3 Figure 3-17. Actual and inflation-adjusted “real” average earnings for full-time registered nurses
in their principal nursing position*
17,398
23,505
28,383
37,73842,071
46,782
57,785
66,973
17,398 19,079 20,83923,166 23,103 23,369
26,366 26,826
0
10,000
20,000
30,000
40,000
50,000
60,000
70,000
80,000
1980 1984 1988 1992 1996 2000 2004 2008
Salary
Actual Salary Real Salary
*Only registered nurses who provided earnings information are included in the calculations used for this figure.
Source: 1980-2008 National Sample Survey of Registered Nurses
Table 3-24. Average annual earnings from all nursing positions, by total number of hours worked per year in all nursing positions*
Hours per year Average annual earnings1 to 499 hours 13,850500 to 999 hours 26,2711,000 to 1,499 hours 42,5821,500 to 1,999 hours 58,1402,000 to 2,499 hours 68,3272,500 to 2,999 hours 80,5373,000 to 3,499 hours 92,2543,500 to 3,999 hours 85,117More than 4,000 hours 93,865
*Only registered nurses who provided earnings information are included in the calculations used for this table.
Source: 2008 National Sample Survey of Registered Nurses
3-39
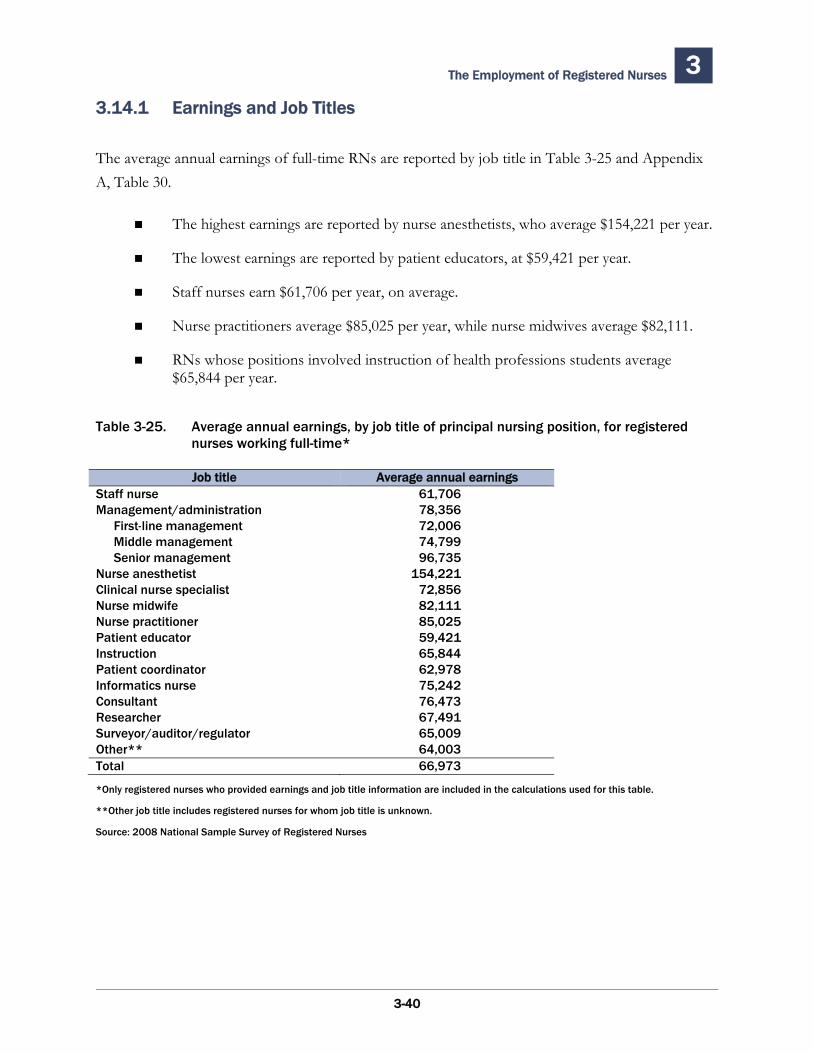
The Employment of Registered Nurses 3
3.14.1 Earnings and Job Titles
The average annual earnings of full-time RNs are reported by job title in Table 3-25 and Appendix A, Table 30.
The highest earnings are reported by nurse anesthetists, who average $154,221 per year.
The lowest earnings are reported by patient educators, at $59,421 per year.
Staff nurses earn $61,706 per year, on average.
Nurse practitioners average $85,025 per year, while nurse midwives average $82,111.
RNs whose positions involved instruction of health professions students average $65,844 per year.
Table 3-25. Average annual earnings, by job title of principal nursing position, for registered nurses working full-time*
Job title Average annual earningsStaff nurse Management/administration
First-line management Middle management Senior management
Nurse anesthetist Clinical nurse specialist Nurse midwife Nurse practitioner Patient educator Instruction Patient coordinator Informatics nurse Consultant Researcher Surveyor/auditor/regulator Other**
61,70678,35672,00674,79996,735
154,22172,85682,11185,02559,42165,84462,97875,24276,47367,49165,00964,003
Total 66,973
*Only registered nurses who provided earnings and job title information are included in the calculations used for this table.
**Other job title includes registered nurses for whom job title is unknown.
Source: 2008 National Sample Survey of Registered Nurses
3-40
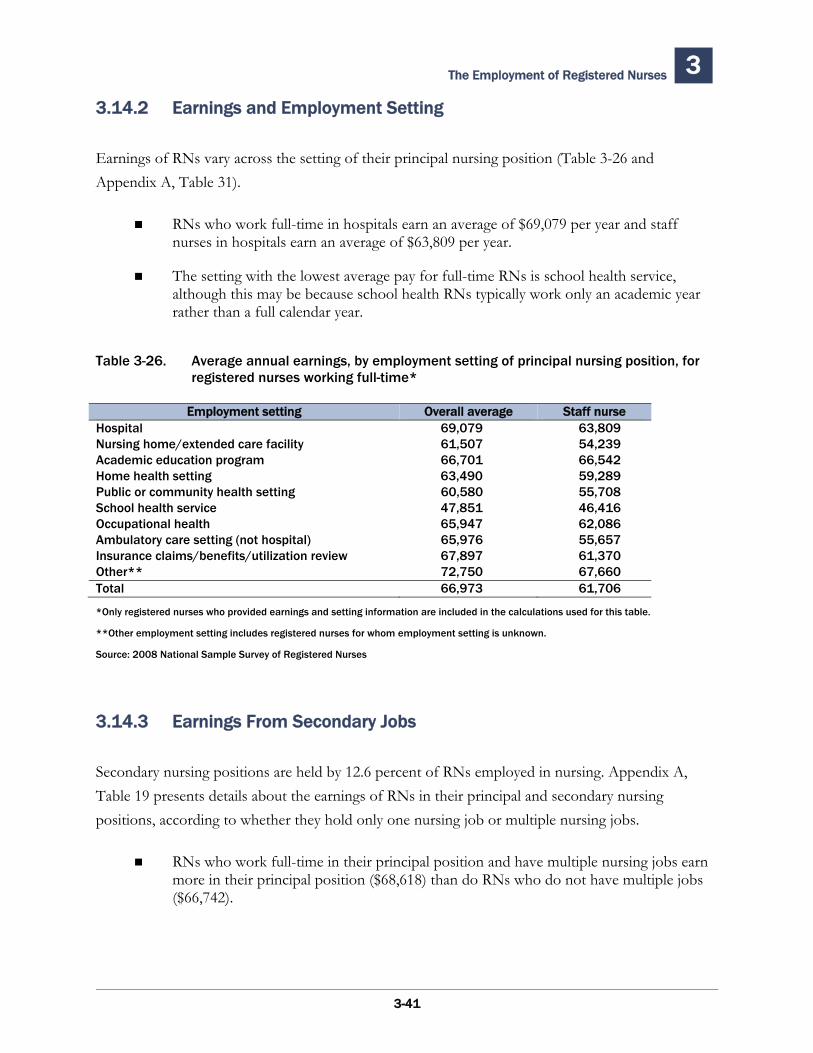
The Employment of Registered Nurses 3
3.14.2 Earnings and Employment Setting
Earnings of RNs vary across the setting of their principal nursing position (Table 3-26 and Appendix A, Table 31).
RNs who work full-time in hospitals earn an average of $69,079 per year and staff nurses in hospitals earn an average of $63,809 per year.
The setting with the lowest average pay for full-time RNs is school health service, although this may be because school health RNs typically work only an academic year rather than a full calendar year.
Table 3-26. Average annual earnings, by employment setting of principal nursing position, for registered nurses working full-time*
Employment setting Overall average Staff nurse Hospital 69,079 63,809 Nursing home/extended care facility 61,507 54,239 Academic education program 66,701 66,542 Home health setting 63,490 59,289 Public or community health setting 60,580 55,708 School health service 47,851 46,416 Occupational health 65,947 62,086 Ambulatory care setting (not hospital) 65,976 55,657 Insurance claims/benefits/utilization review 67,897 61,370 Other** 72,750 67,660 Total 66,973 61,706
*Only registered nurses who provided earnings and setting information are included in the calculations used for this table.
**Other employment setting includes registered nurses for whom employment setting is unknown.
Source: 2008 National Sample Survey of Registered Nurses
3.14.3 Earnings From Secondary Jobs
Secondary nursing positions are held by 12.6 percent of RNs employed in nursing. Appendix A, Table 19 presents details about the earnings of RNs in their principal and secondary nursing positions, according to whether they hold only one nursing job or multiple nursing jobs.
RNs who work full-time in their principal position and have multiple nursing jobs earn more in their principal position ($68,618) than do RNs who do not have multiple jobs ($66,742).
3-41
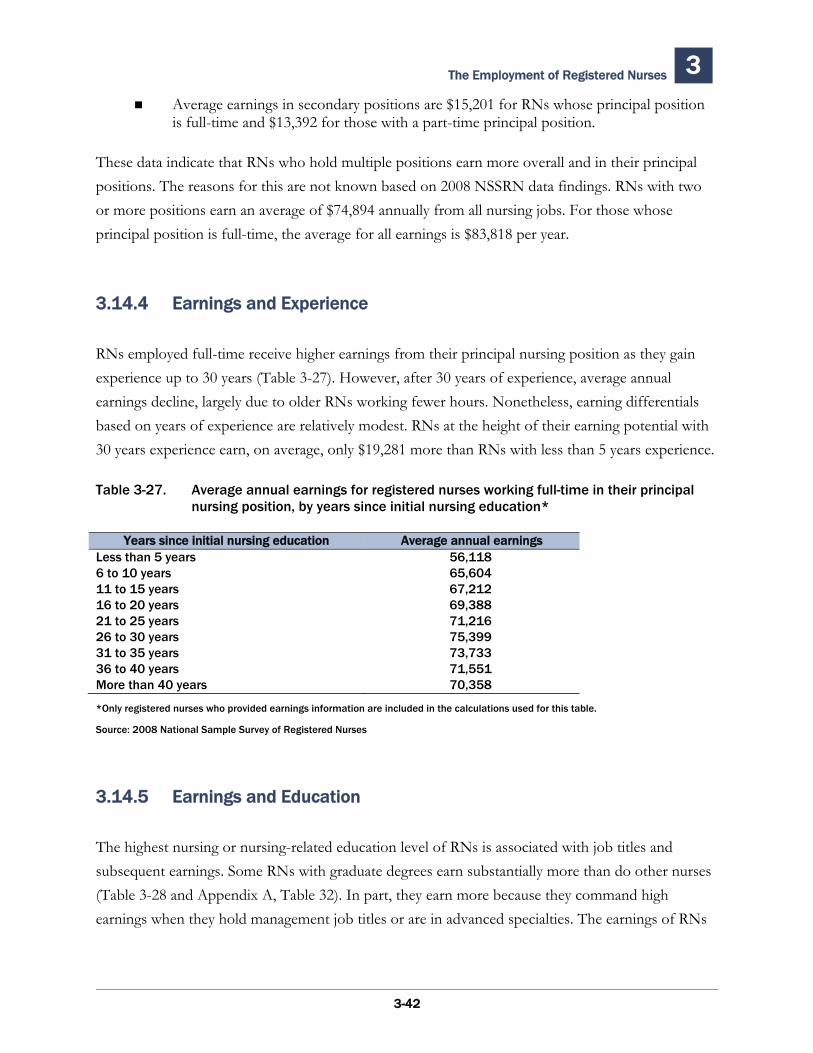
The Employment of Registered Nurses 3
Average earnings in secondary positions are $15,201 for RNs whose principal position is full-time and $13,392 for those with a part-time principal position.
These data indicate that RNs who hold multiple positions earn more overall and in their principal positions. The reasons for this are not known based on 2008 NSSRN data findings. RNs with two or more positions earn an average of $74,894 annually from all nursing jobs. For those whose principal position is full-time, the average for all earnings is $83,818 per year.
3.14.4 Earnings and Experience
RNs employed full-time receive higher earnings from their principal nursing position as they gain experience up to 30 years (Table 3-27). However, after 30 years of experience, average annual earnings decline, largely due to older RNs working fewer hours. Nonetheless, earning differentials based on years of experience are relatively modest. RNs at the height of their earning potential with 30 years experience earn, on average, only $19,281 more than RNs with less than 5 years experience.
Table 3-27. Average annual earnings for registered nurses working full-time in their principal nursing position, by years since initial nursing education*
Years since initial nursing education Average annual earningsLess than 5 years 56,1186 to 10 years 65,60411 to 15 years 67,21216 to 20 years 69,38821 to 25 years 71,21626 to 30 years 75,39931 to 35 years 73,73336 to 40 years 71,551More than 40 years 70,358
*Only registered nurses who provided earnings information are included in the calculations used for this table.
Source: 2008 National Sample Survey of Registered Nurses
3.14.5 Earnings and Education
The highest nursing or nursing-related education level of RNs is associated with job titles and subsequent earnings. Some RNs with graduate degrees earn substantially more than do other nurses (Table 3-28 and Appendix A, Table 32). In part, they earn more because they command high earnings when they hold management job titles or are in advanced specialties. The earnings of RNs
3-42
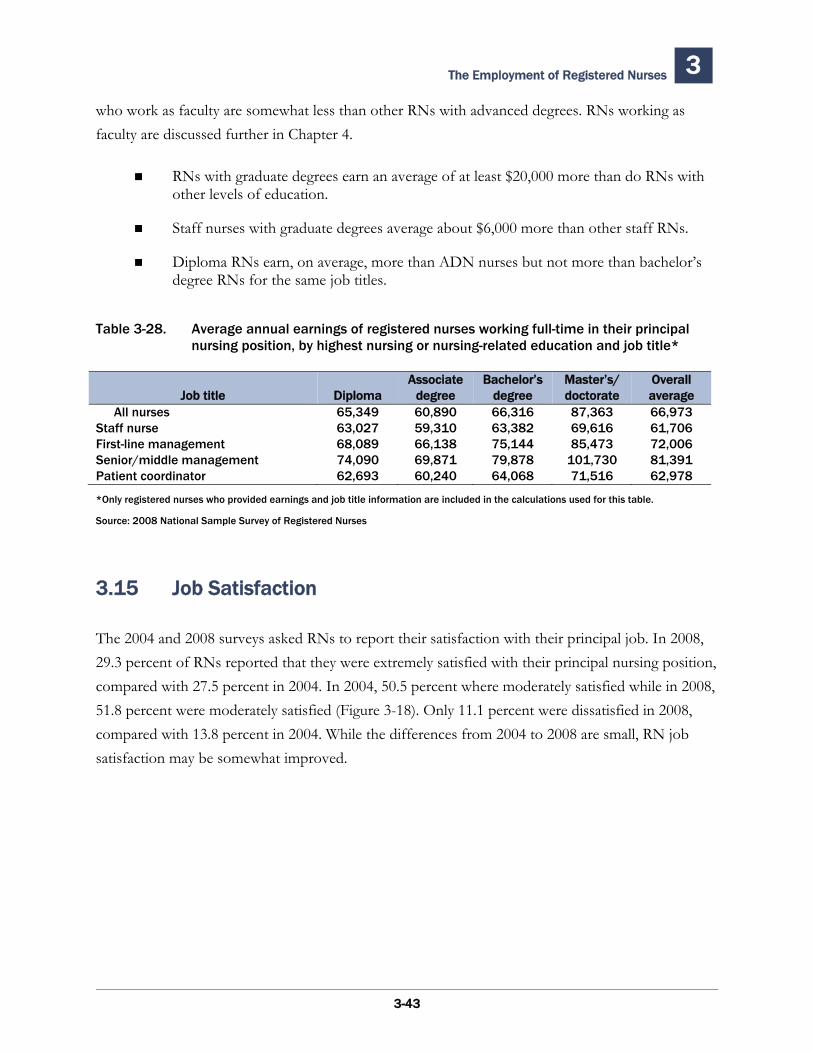
The Employment of Registered Nurses 3
who work as faculty are somewhat less than other RNs with advanced degrees. RNs working as faculty are discussed further in Chapter 4.
RNs with graduate degrees earn an average of at least $20,000 more than do RNs with other levels of education.
Staff nurses with graduate degrees average about $6,000 more than other staff RNs.
Diploma RNs earn, on average, more than ADN nurses but not more than bachelor’s degree RNs for the same job titles.
Table 3-28. Average annual earnings of registered nurses working full-time in their principal nursing position, by highest nursing or nursing-related education and job title*
Job title Diploma Associate
degree Bachelor’s
degree Master’s/ doctorate
Overall average
All nurses 65,349 60,890 66,316 87,363 66,973Staff nurse 63,027 59,310 63,382 69,616 61,706First-line management 68,089 66,138 75,144 85,473 72,006Senior/middle management 74,090 69,871 79,878 101,730 81,391Patient coordinator 62,693 60,240 64,068 71,516 62,978
*Only registered nurses who provided earnings and job title information are included in the calculations used for this table.
Source: 2008 National Sample Survey of Registered Nurses
3.15 Job Satisfaction
The 2004 and 2008 surveys asked RNs to report their satisfaction with their principal job. In 2008, 29.3 percent of RNs reported that they were extremely satisfied with their principal nursing position, compared with 27.5 percent in 2004. In 2004, 50.5 percent where moderately satisfied while in 2008, 51.8 percent were moderately satisfied (Figure 3-18). Only 11.1 percent were dissatisfied in 2008, compared with 13.8 percent in 2004. While the differences from 2004 to 2008 are small, RN job satisfaction may be somewhat improved.
3-43
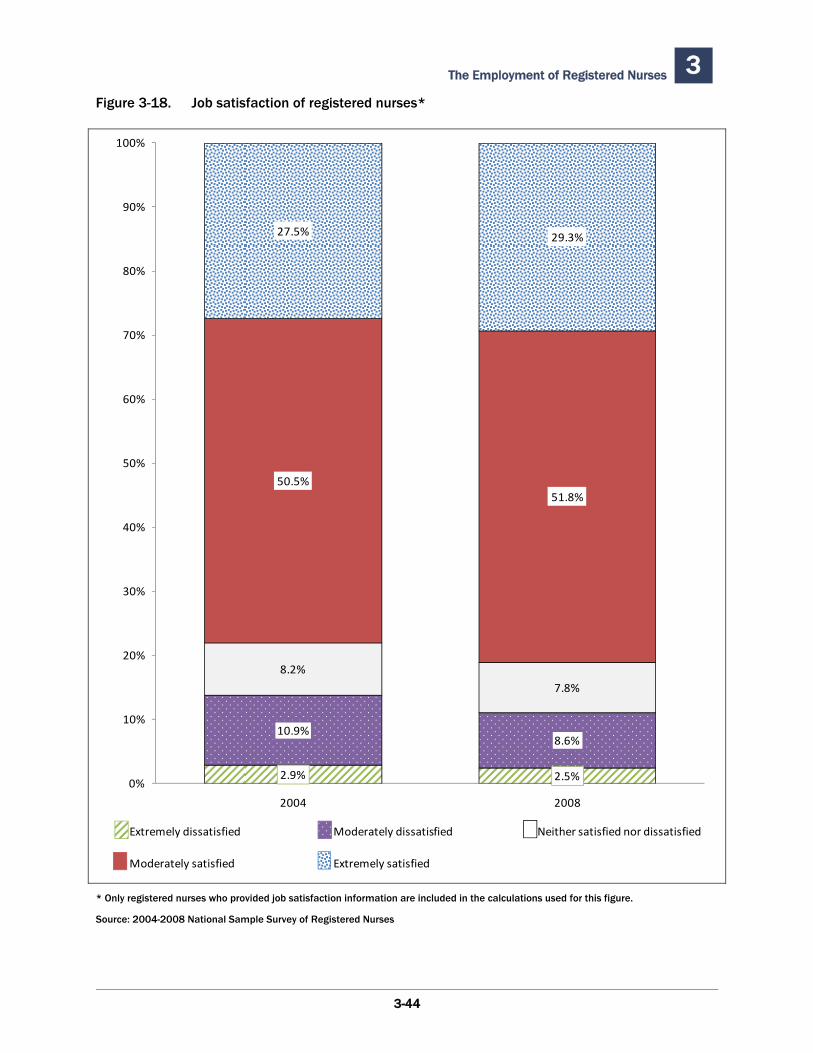
The Employment of Registered Nurses 3 Figure 3-18. Job satisfaction of registered nurses*
2.9% 2.5%
10.9%8.6%
8.2%
7.8%
50.5%51.8%
27.5% 29.3%
0%
10%
20%
30%
40%
50%
60%
70%
80%
90%
100%
2004 2008
Extremely dissatisfied Moderately dissatisfied Neither satisfied nor dissatisfied
Moderately satisfied Extremely satisfied
* Only registered nurses who provided job satisfaction information are included in the calculations used for this figure.
Source: 2004-2008 National Sample Survey of Registered Nurses
3-44
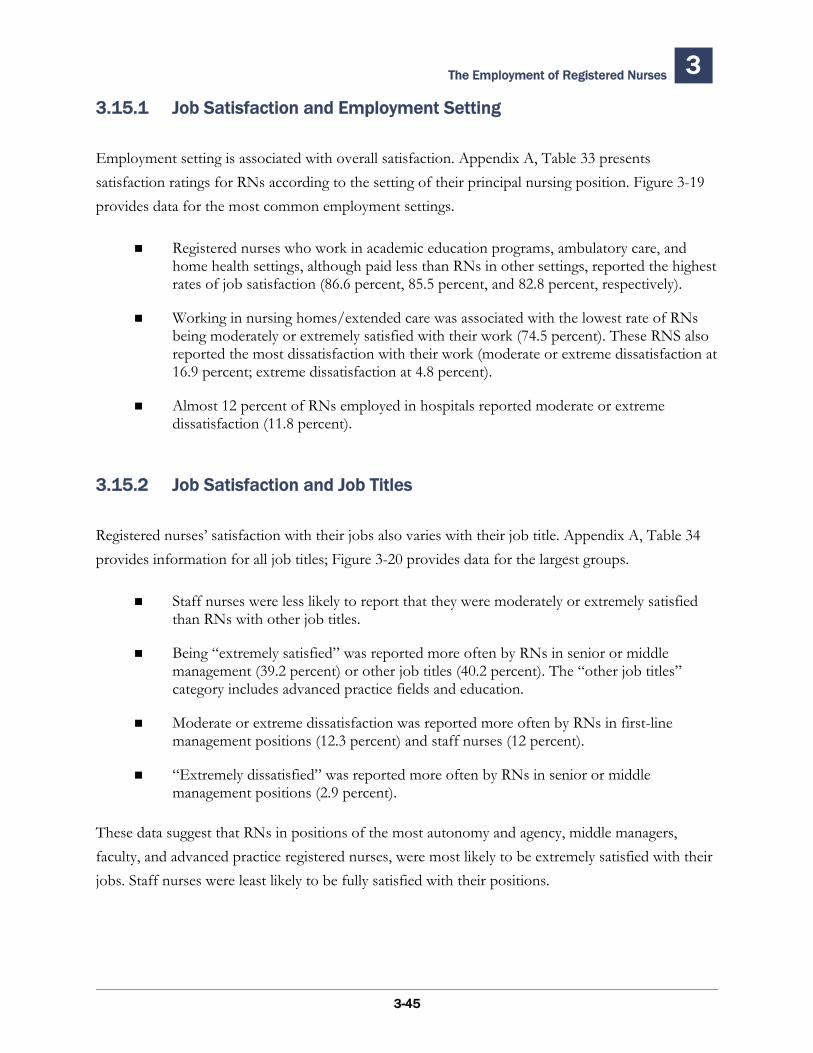
The Employment of Registered Nurses 3
3.15.1 Job Satisfaction and Employment Setting
Employment setting is associated with overall satisfaction. Appendix A, Table 33 presents satisfaction ratings for RNs according to the setting of their principal nursing position. Figure 3-19 provides data for the most common employment settings.
Registered nurses who work in academic education programs, ambulatory care, and home health settings, although paid less than RNs in other settings, reported the highest rates of job satisfaction (86.6 percent, 85.5 percent, and 82.8 percent, respectively).
Working in nursing homes/extended care was associated with the lowest rate of RNs being moderately or extremely satisfied with their work (74.5 percent). These RNS also reported the most dissatisfaction with their work (moderate or extreme dissatisfaction at 16.9 percent; extreme dissatisfaction at 4.8 percent).
Almost 12 percent of RNs employed in hospitals reported moderate or extreme dissatisfaction (11.8 percent).
3.15.2 Job Satisfaction and Job Titles
Registered nurses’ satisfaction with their jobs also varies with their job title. Appendix A, Table 34 provides information for all job titles; Figure 3-20 provides data for the largest groups.
Staff nurses were less likely to report that they were moderately or extremely satisfied than RNs with other job titles.
Being “extremely satisfied” was reported more often by RNs in senior or middle management (39.2 percent) or other job titles (40.2 percent). The “other job titles” category includes advanced practice fields and education.
Moderate or extreme dissatisfaction was reported more often by RNs in first-line management positions (12.3 percent) and staff nurses (12 percent).
“Extremely dissatisfied” was reported more often by RNs in senior or middle management positions (2.9 percent).
These data suggest that RNs in positions of the most autonomy and agency, middle managers, faculty, and advanced practice registered nurses, were most likely to be extremely satisfied with their jobs. Staff nurses were least likely to be fully satisfied with their positions.
3-45
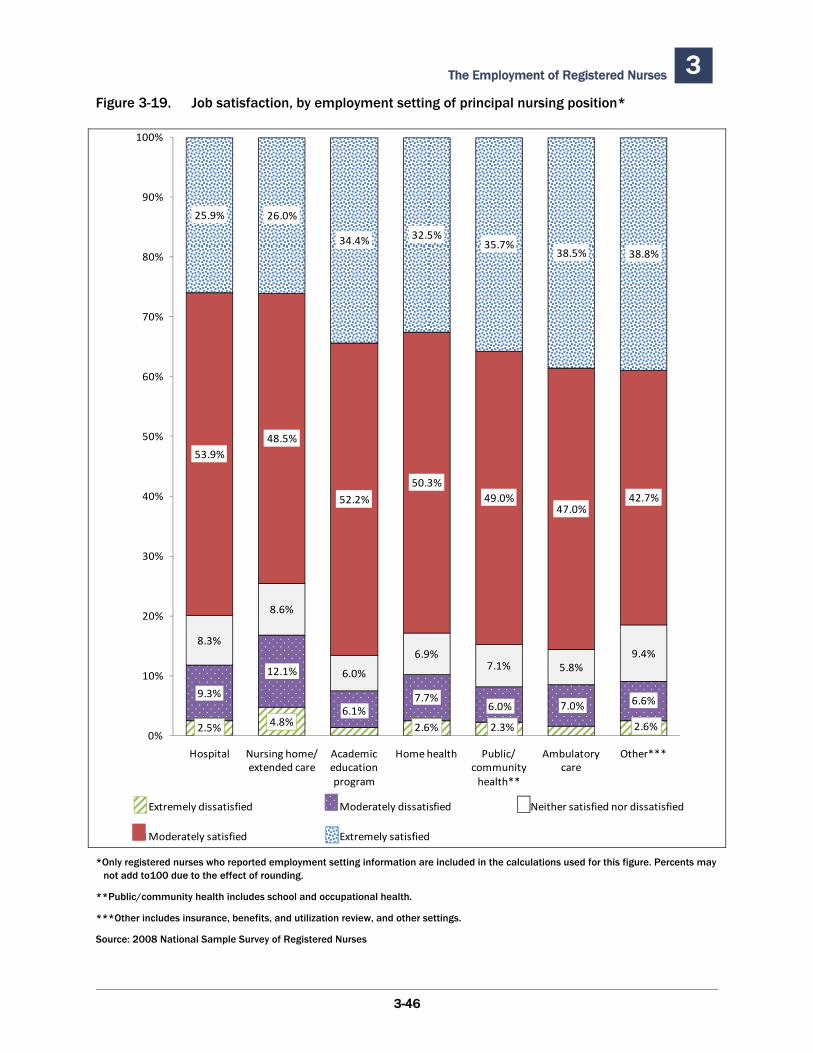
The Employment of Registered Nurses 3 Figure 3-19. Job satisfaction, by employment setting of principal nursing position*
2.5% 4.8% 2.6% 2.3% 2.6%
9.3%
12.1%
6.1%7.7%
6.0% 7.0% 6.6%
8.3%
8.6%
6.0%
6.9%7.1% 5.8%
9.4%
53.9%48.5%
52.2%
50.3%49.0%
47.0%42.7%
25.9% 26.0%
34.4% 32.5%35.7%
38.5% 38.8%
0%
10%
20%
30%
40%
50%
60%
70%
80%
90%
100%
Hospital Nursing home/ extended care
Academic education program
Home health Public/community health**
Ambulatory care
Other***
Extremely dissatisfied Moderately dissatisfied Neither satisfied nor dissatisfied
Moderately satisfied Extremely satisfied
*Only registered nurses who reported employment setting information are included in the calculations used for this figure. Percents may not add to100 due to the effect of rounding.
**Public/community health includes school and occupational health.
***Other includes insurance, benefits, and utilization review, and other settings.
Source: 2008 National Sample Survey of Registered Nurses
3-46
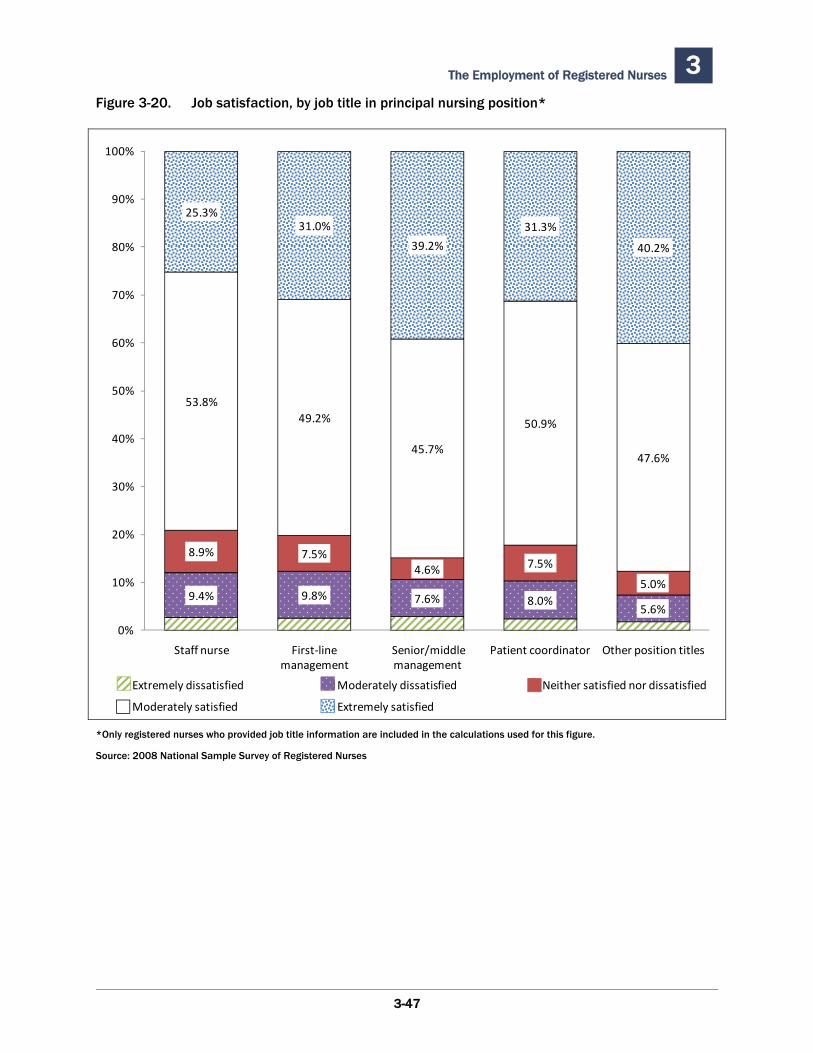
The Employment of Registered Nurses 3 Figure 3-20. Job satisfaction, by job title in principal nursing position*
9.4% 9.8% 7.6% 8.0%5.6%
8.9% 7.5%4.6% 7.5%
5.0%
53.8%49.2%
45.7%
50.9%
47.6%
25.3%31.0%
39.2%
31.3%
40.2%
0%
10%
20%
30%
40%
50%
60%
70%
80%
90%
100%
Staff nurse First‐line management
Senior/middle management
Patient coordinator Other position titles
Extremely dissatisfied Moderately dissatisfied Neither satisfied nor dissatisfied
Moderately satisfied Extremely satisfied
*Only registered nurses who provided job title information are included in the calculations used for this figure.
Source: 2008 National Sample Survey of Registered Nurses
3-47
The Employment of Registered Nurses 3
3.15.3 Job Satisfaction and Age
RN satisfaction generally increases with age (Figure 3-21 and Appendix A, Table 35). This may be because those who are dissatisfied have changed to positions or employment situations which are more satisfying for them.
The percentage of employed RNs who are extremely satisfied continues to increase with age through age 74 years.
The percent of employed RNs who are moderately to extremely satisfied averages around 78 percent for RNs under 35 years old. It averages about 80 percent for RNs who are ages 35 to 49 years. About 82 percent of RNs in their 50s report that they are moderately to extremely satisfied, and after age 60 job satisfaction rises to more than 85 percent.
Moderate and extreme dissatisfaction is greatest between ages 40 and 50, averaging 12.4 and 12.5 percent, respectively.
This should not necessarily be interpreted to mean that age is a factor in job satisfaction. Rather, perhaps young RNs or recent graduates who are dissatisfied with a position may change jobs until they find a position that is more satisfactory. Registered nurses who cannot find a satisfactory position may leave nursing altogether.
3.15.4 Job Satisfaction and Education
Figure 3-22 and Appendix A, Table 36 present data on RNs’ job satisfaction according to their highest nursing or nursing-related education.
RNs with graduate-level education report the highest rates of being extremely satisfied (39.2 percent).
A high percentage of diploma-educated RNs (31.4 percent) are extremely satisfied; diploma-educated RNs also tend to be older than other nurses, and age is correlated with satisfaction.
RNs with ADNs most often report being moderately to extremely dissatisfied (13.1 percent).
3-48
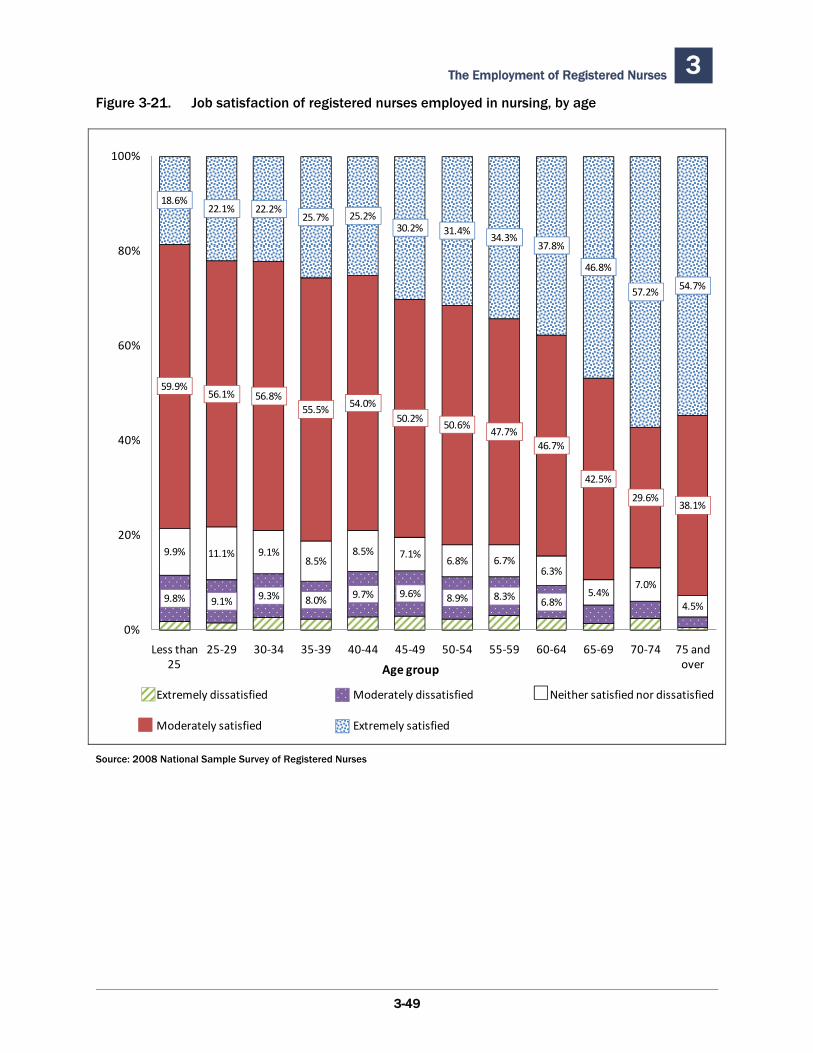
The Employment of Registered Nurses 3 Figure 3-21. Job satisfaction of registered nurses employed in nursing, by age
9.8% 9.1% 9.3% 8.0% 9.7% 9.6% 8.9% 8.3% 6.8%
9.9% 11.1% 9.1%8.5%
8.5% 7.1%6.8% 6.7%
6.3%
5.4%7.0%
4.5%
59.9%56.1% 56.8%
55.5% 54.0%50.2%
50.6%47.7%
46.7%
42.5%
29.6%38.1%
18.6%22.1% 22.2%
25.7% 25.2%30.2% 31.4%
34.3%37.8%
46.8%
57.2% 54.7%
0%
20%
40%
60%
80%
100%
Less than 25
25‐29 30‐34 35‐39 40‐44 45‐49 50‐54 55‐59 60‐64 65‐69 70‐74 75 and over
Extremely dissatisfied Moderately dissatisfied Neither satisfied nor dissatisfied
Moderately satisfied Extremely satisfied
Age group
Source: 2008 National Sample Survey of Registered Nurses
3-49
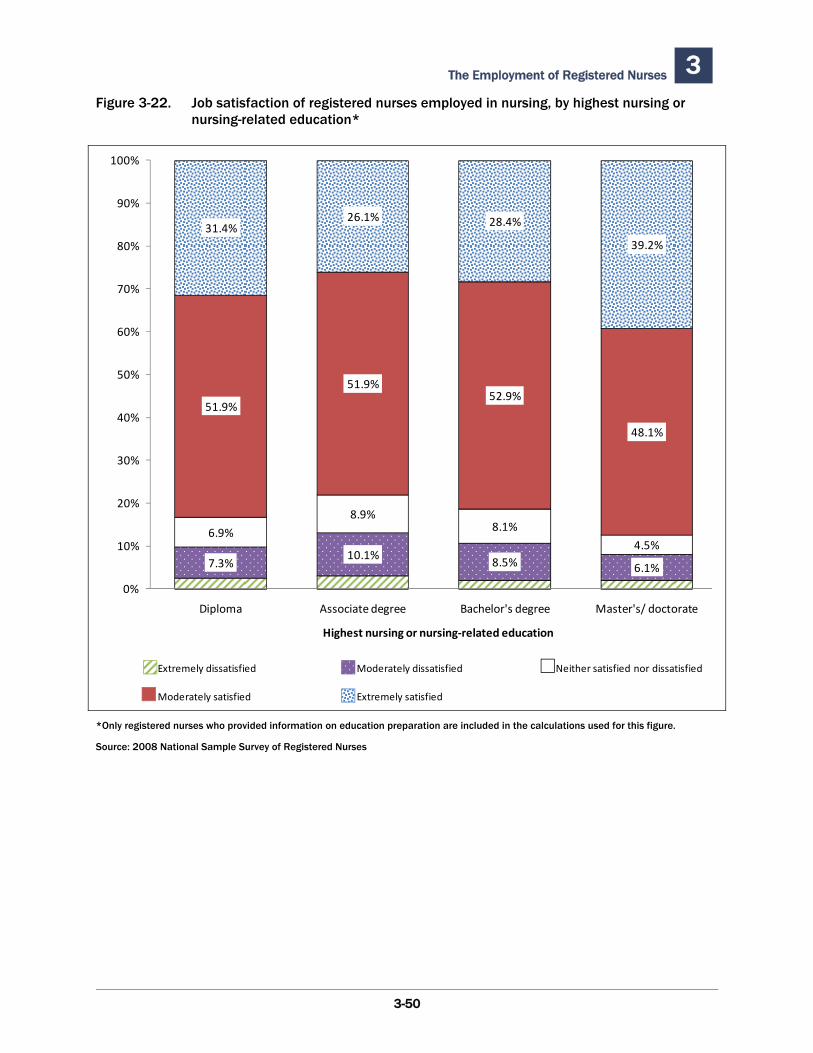
The Employment of Registered Nurses 3 Figure 3-22. Job satisfaction of registered nurses employed in nursing, by highest nursing or
nursing-related education*
7.3%10.1%
8.5% 6.1%
6.9%
8.9%8.1%
4.5%
51.9%
51.9%52.9%
48.1%
31.4%26.1% 28.4%
39.2%
0%
10%
20%
30%
40%
50%
60%
70%
80%
90%
100%
Diploma Associate degree Bachelor's degree Master's/ doctorate
Extremely dissatisfied Moderately dissatisfied Neither satisfied nor dissatisfied
Moderately satisfied Extremely satisfied
Highest nursing or nursing‐related education
*Only registered nurses who provided information on education preparation are included in the calculations used for this figure.
Source: 2008 National Sample Survey of Registered Nurses
3-50
The Employment of Registered Nurses 3
3.16 Job Changes of Registered Nurses
The 2008 NSSRN asked RNs to provide information about their employment status in 2007. Nearly 80 percent of RNs were employed in nursing in both 2007 and 2008 (Figure 3-23). Another 12.3 percent were not employed in nursing in either year. Nearly 3 percent were employed in nursing in 2007, but not in 2008. Conversely, 2.4 percent were employed in 2008 but had not been employed in 2007. Of those who were employed in 2007 but not in 2008, 27.3 percent (24,430) reported that they stopped working due to retirement. A group comprising 2.5 percent of RNs graduated in 2007 or 2008 and was employed only in 2008. These data indicate that departures from nursing work are often short-lived.
Table 3-29 provides more information about principal nursing employment in 2008 compared with 2007.
Among RNs who worked full-time in 2007, 91.5 percent continued to work full-time in 2008. Another 5.8 percent worked part-time in 2008.
Among RNs who worked part-time in 2007, 82.9 percent continued to work part-time in 2008, while 11.2 percent changed to full-time work.
Employment changes of RNs who were employed in both 2007 and 2008 are described in Table 3-30 and Appendix A, Table 37. Many RNs change positions and employers from year to year.
Among RNs who worked full-time in 2007, 11.6 percent changed employer by 2008. Another 6.5 percent worked with the same employer but held a different position.
Among RNs who worked part-time in 2007, 9.7 percent changed employers. These data suggest that part-time RNs are slightly less likely to change employers or positions than are full-time RNs.
Appendix A, Table 38 presents the employment settings of RNs in 2008 as compared with 2007. Among RNs employed in hospital settings in 2008, 90.8 percent had been employed in a hospital in 2007. However, other settings draw many RNs from hospitals. For example, while 82.5 percent of RNs employed in home health in 2008 had worked in that setting in 2007, 7.9 percent had worked in a hospital in 2007. Among RNs employed in ambulatory care in 2008, 8.2 percent had worked in a hospital in 2007.
3-51
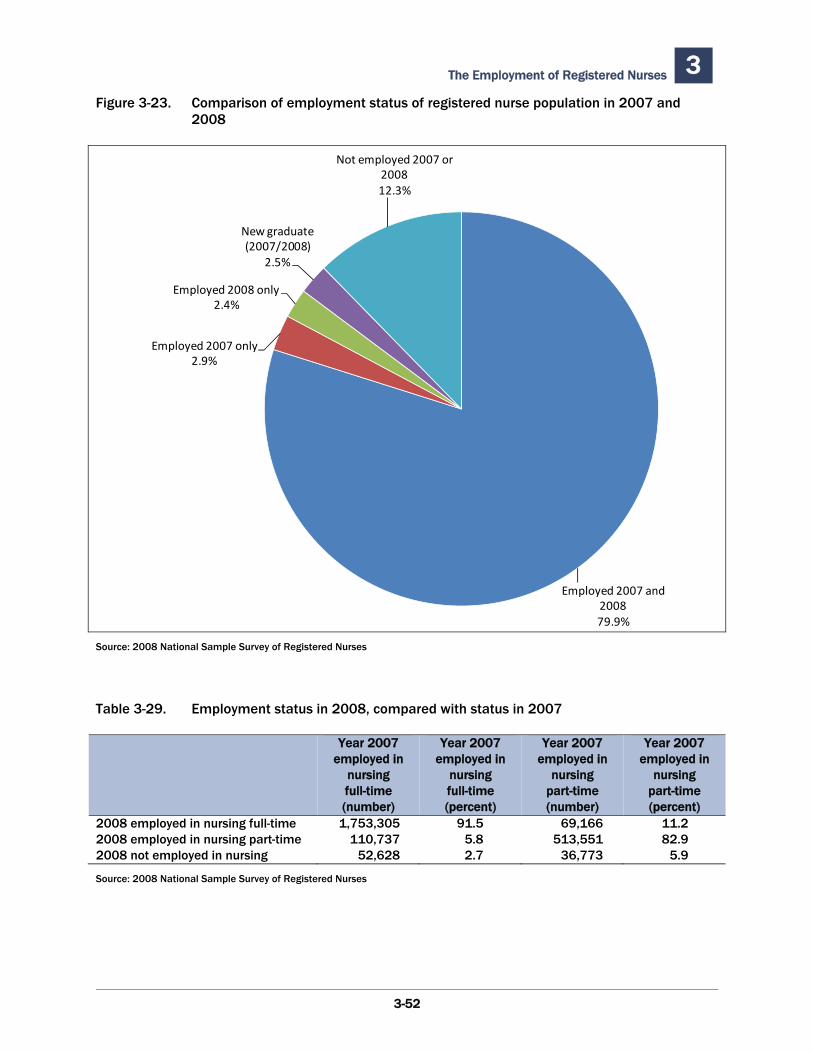
The Employment of Registered Nurses 3 Figure 3-23. Comparison of employment status of registered nurse population in 2007 and
2008
Employed 2007 and 200879.9%
Employed 2007 only2.9%
Employed 2008 only2.4%
New graduate (2007/2008)
2.5%
Not employed 2007 or 200812.3%
Source: 2008 National Sample Survey of Registered Nurses
Table 3-29. Employment status in 2008, compared with status in 2007
Year 2007 Year 2007 Year 2007 Year 2007employed in employed in employed in employed in
nursing nursing nursing nursing full-time full-time part-time part-time (number) (percent) (number) (percent)
2008 employed in nursing full-time 1,753,305 91.5 69,166 11.22008 employed in nursing part-time 110,737 5.8 513,551 82.92008 not employed in nursing 52,628 2.7 36,773 5.9
Source: 2008 National Sample Survey of Registered Nurses
3-52
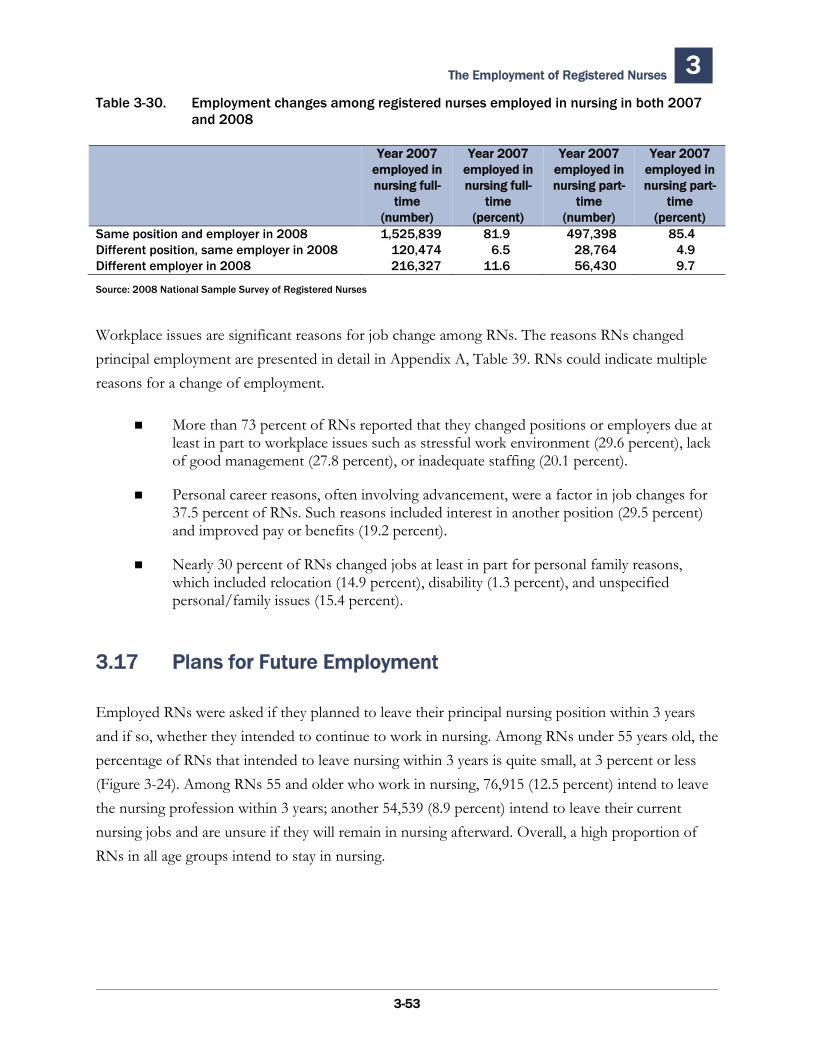
The Employment of Registered Nurses 3 Table 3-30. Employment changes among registered nurses employed in nursing in both 2007
and 2008
Year 2007 Year 2007 Year 2007 Year 2007employed in employed in employed in employed in nursing full- nursing full- nursing part- nursing part-
time time time time (number) (percent) (number) (percent)
Same position and employer in 2008 1,525,839 81.9 497,398 85.4Different position, same employer in 2008 120,474 6.5 28,764 4.9Different employer in 2008 216,327 11.6 56,430 9.7
Source: 2008 National Sample Survey of Registered Nurses
Workplace issues are significant reasons for job change among RNs. The reasons RNs changed principal employment are presented in detail in Appendix A, Table 39. RNs could indicate multiple reasons for a change of employment.
More than 73 percent of RNs reported that they changed positions or employers due at least in part to workplace issues such as stressful work environment (29.6 percent), lack of good management (27.8 percent), or inadequate staffing (20.1 percent).
Personal career reasons, often involving advancement, were a factor in job changes for 37.5 percent of RNs. Such reasons included interest in another position (29.5 percent) and improved pay or benefits (19.2 percent).
Nearly 30 percent of RNs changed jobs at least in part for personal family reasons, which included relocation (14.9 percent), disability (1.3 percent), and unspecified personal/family issues (15.4 percent).
3.17 Plans for Future Employment
Employed RNs were asked if they planned to leave their principal nursing position within 3 years and if so, whether they intended to continue to work in nursing. Among RNs under 55 years old, the percentage of RNs that intended to leave nursing within 3 years is quite small, at 3 percent or less (Figure 3-24). Among RNs 55 and older who work in nursing, 76,915 (12.5 percent) intend to leave the nursing profession within 3 years; another 54,539 (8.9 percent) intend to leave their current nursing jobs and are unsure if they will remain in nursing afterward. Overall, a high proportion of RNs in all age groups intend to stay in nursing.
3-53
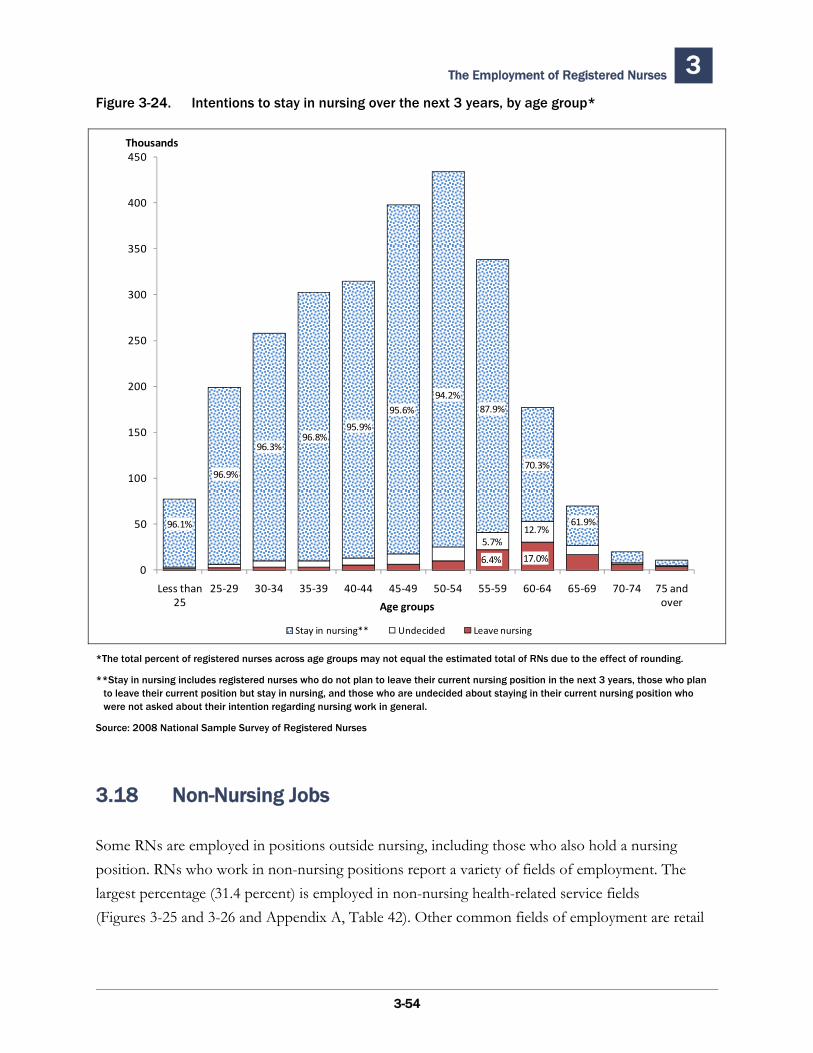
The Employment of Registered Nurses 3 Figure 3-24. Intentions to stay in nursing over the next 3 years, by age group*
0
50
100
150
200
250
300
350
400
450
Less than 25
25‐29 30‐34 35‐39 40‐44 45‐49 50‐54 55‐59 60‐64 65‐69 70‐74 75 and over
Stay in nursing** Undecided Leave nursing
Thousands
Age groups
96.1%
96.3%
95.9%
96.9%
96.8%
95.6% 87.9%
70.3%
94.2%
61.9%
17.0%6.4%
12.7%5.7%
*The total percent of registered nurses across age groups may not equal the estimated total of RNs due to the effect of rounding.
**Stay in nursing includes registered nurses who do not plan to leave their current nursing position in the next 3 years, those who plan to leave their current position but stay in nursing, and those who are undecided about staying in their current nursing position who were not asked about their intention regarding nursing work in general.
Source: 2008 National Sample Survey of Registered Nurses
3.18 Non-Nursing Jobs
Some RNs are employed in positions outside nursing, including those who also hold a nursing position. RNs who work in non-nursing positions report a variety of fields of employment. The largest percentage (31.4 percent) is employed in non-nursing health-related service fields (Figures 3-25 and 3-26 and Appendix A, Table 42). Other common fields of employment are retail
3-54
The Employment of Registered Nurses 3
and food sales and services (14.4 percent), elementary and secondary education (10.4 percent), and pharmaceuticals and medical equipment (9.0 percent).
Among all RNs, an estimated 208,427 held a non-nursing position. Of the RNs employed outside of nursing, 97,365 also had a nursing position (Table 3-31). Among RNs not working in nursing, 23.8 percent held a non-nursing position.
More than half of RNs (54.7 percent) who are not working in nursing and hold a non-nursing job report that their position is health-related (Appendix A, Table 41). The percent of RNs who do not work in nursing and have a non-nursing position generally increases with the number of years since they last worked in nursing (Figure 3-25). Forty percent of RNs who have not worked in nursing for 20 years or more hold non-nursing jobs.
Most RNs who work in health-related occupations that are non-nursing work full-time (73.7 percent) (Appendix A, Table 41).
Only half of RNs who work in nonhealth-related occupations work full-time (50.6 percent).
RNs hold many job titles in their non-nursing fields of employment (Figure 3-27 and Appendix A, Table 43).
More than 75 percent of RNs who work outside nursing and have a management job title say their position is health-related.
Only 26.8 percent of RNs who work outside nursing and are business owner/proprietors say their work is health-related.
3-55
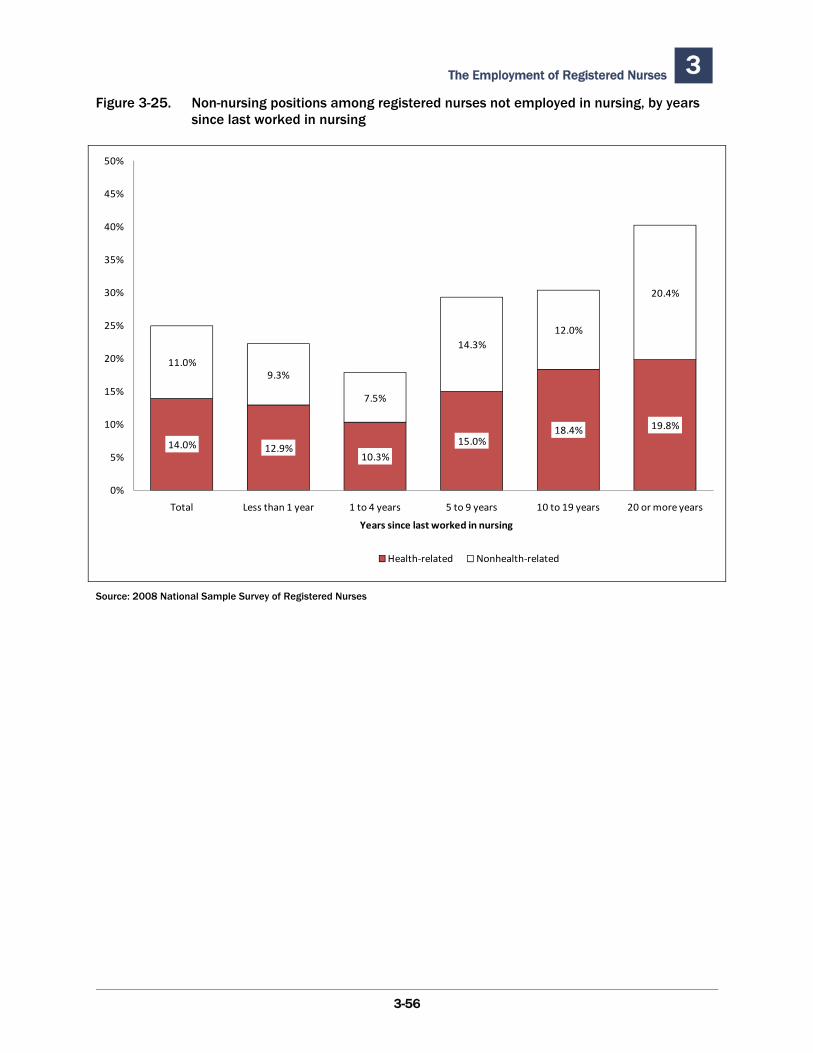
The Employment of Registered Nurses 3 Figure 3-25. Non-nursing positions among registered nurses not employed in nursing, by years
since last worked in nursing
14.0% 12.9%10.3%
15.0%18.4% 19.8%
11.0%9.3%
7.5%
14.3%12.0%
20.4%
0%
5%
10%
15%
20%
25%
30%
35%
40%
45%
50%
Total Less than 1 year 1 to 4 years 5 to 9 years 10 to 19 years 20 or more years
Health‐related Nonhealth‐related
Years since last worked in nursing
Source: 2008 National Sample Survey of Registered Nurses
3-56
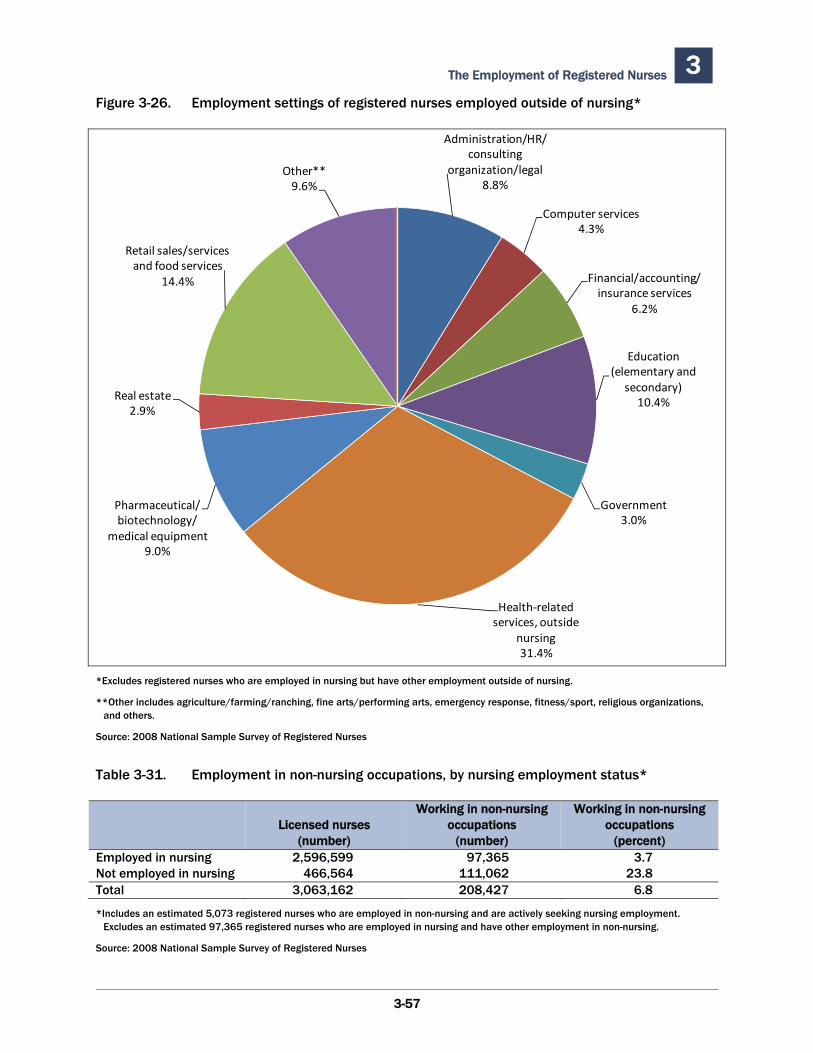
The Employment of Registered Nurses 3 Figure 3-26. Employment settings of registered nurses employed outside of nursing*
Administration/HR/consulting
organization/legal8.8%
Computer services4.3%
Financial/accounting/insurance services
6.2%
Education (elementary and
secondary)10.4%
Government3.0%
Health‐related services, outside
nursing31.4%
Pharmaceutical/biotechnology/
medical equipment9.0%
Real estate2.9%
Retail sales/services and food services
14.4%
Other**9.6%
*Excludes registered nurses who are employed in nursing but have other employment outside of nursing.
**Other includes agriculture/farming/ranching, fine arts/performing arts, emergency response, fitness/sport, religious organizations, and others.
Source: 2008 National Sample Survey of Registered Nurses
Table 3-31. Employment in non-nursing occupations, by nursing employment status*
Working in non-nursing Working in non-nursing Licensed nurses occupations occupations
(number) (number) (percent) Employed in nursing 2,596,599 97,365 3.7 Not employed in nursing 466,564 111,062 23.8 Total 3,063,162 208,427 6.8
*Includes an estimated 5,073 registered nurses who are employed in non-nursing and are actively seeking nursing employment. Excludes an estimated 97,365 registered nurses who are employed in nursing and have other employment in non-nursing.
Source: 2008 National Sample Survey of Registered Nurses
3-57
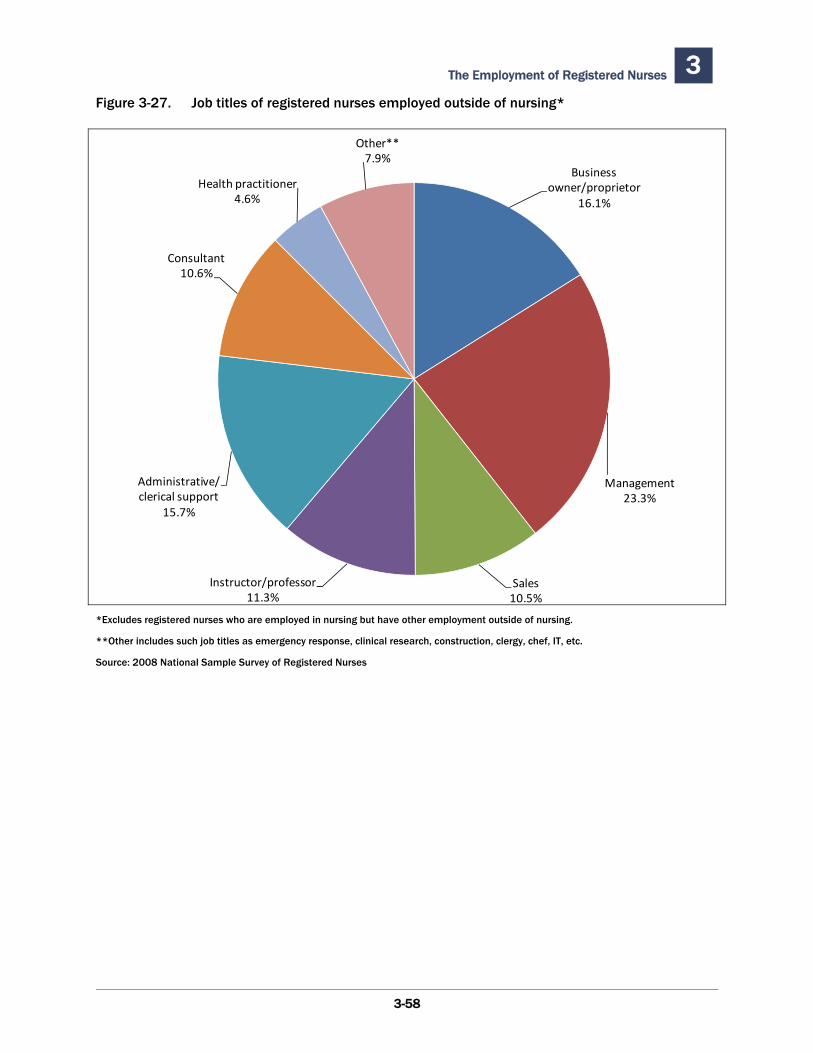
3 The Employment of Registered Nurses Figure 3-27. Job titles of registered nurses employed outside of nursing*
3-58
Business owner/proprietor
16.1%
Management23.3%
Sales10.5%
Instructor/professor11.3%
Administrative/clerical support
15.7%
Consultant10.6%
Health practitioner4.6%
Other**7.9%
*Excludes registered nurses who are employed in nursing but have other employment outside of nursing.
**Other includes such job titles as emergency response, clinical research, construction, clergy, chef, IT, etc.
Source: 2008 National Sample Survey of Registered Nurses
4.1 Introduction
Registered nurses who are nursing education program faculty fill an important role in the nursing workforce and help to ensure that there are adequate numbers of new nurses entering the profession. RNs can serve as faculty or instructors in both their principal and secondary nursing positions. Most RNs whose principal position is in a full-time faculty position teach theoretical and didactic material in the classroom as well as provide clinical education. Those whose faculty work is part-time usually focus on clinical education by teaching and supervising students in clinical settings, or by teaching only one or two didactic courses a year. Depending on the type of nursing program (ADN, diploma, BSN, or higher degree) faculty may be required to teach or may also have other faculty responsibilities such as research, producing scholarly publications, engaging in community and professional organization service, serving on academic committees, and advising students. Faculty members who teach in nurse practitioner programs must also continue clinical practice to maintain national certification and/or State licensure as Advanced Practice Registered Nurses (APRNs) in their area of clinical specialty, which is usually a requirement for RNs who teach clinical courses in nurse practitioner programs.
This chapter includes not only those RNs who reported that their principal position was instructor/lecturer or professor and that their setting was an academic RN program, but also those RNs who reported a secondary nursing job in an academic education program. Nurses whose principal job title was managerial, administrative, or related to patient care in an academic setting are not included as faculty. Nurses with these titles do not primarily provide instruction to nursing students; rather, they provide patient care within academic medical centers, manage education programs, and have other nonteaching responsibilities. Nurses who reported that at least one of their secondary nursing positions is in an academic setting are assumed to have a secondary position as faculty; job titles were not reported for secondary positions.
Nurse Faculty 4
4-1
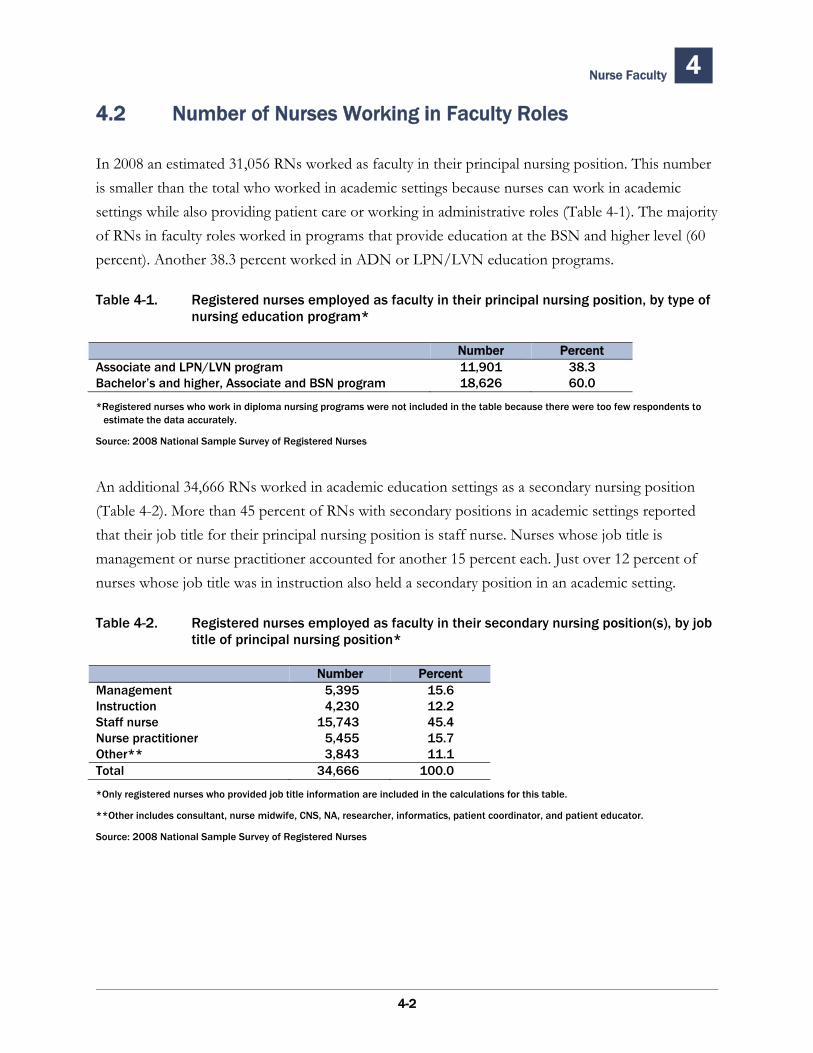
Nurse Faculty 4
4-2
4.2 Number of Nurses Working in Faculty Roles
In 2008 an estimated 31,056 RNs worked as faculty in their principal nursing position. This number is smaller than the total who worked in academic settings because nurses can work in academic settings while also providing patient care or working in administrative roles (Table 4-1). The majority of RNs in faculty roles worked in programs that provide education at the BSN and higher level (60 percent). Another 38.3 percent worked in ADN or LPN/LVN education programs.
Table 4-1. Registered nurses employed as faculty in their principal nursing position, by type of nursing education program*
Number Percent Associate and LPN/LVN program 11,901 38.3 Bachelor’s and higher, Associate and BSN program 18,626 60.0
*Registered nurses who work in diploma nursing programs were not included in the table because there were too few respondents to estimate the data accurately.
Source: 2008 National Sample Survey of Registered Nurses
An additional 34,666 RNs worked in academic education settings as a secondary nursing position (Table 4-2). More than 45 percent of RNs with secondary positions in academic settings reported that their job title for their principal nursing position is staff nurse. Nurses whose job title is management or nurse practitioner accounted for another 15 percent each. Just over 12 percent of nurses whose job title was in instruction also held a secondary position in an academic setting.
Table 4-2. Registered nurses employed as faculty in their secondary nursing position(s), by job title of principal nursing position*
Number PercentManagement 5,395 15.6Instruction 4,230 12.2Staff nurse 15,743 45.4Nurse practitioner 5,455 15.7Other** 3,843 11.1Total 34,666 100.0
*Only registered nurses who provided job title information are included in the calculations for this table.
**Other includes consultant, nurse midwife, CNS, NA, researcher, informatics, patient coordinator, and patient educator.
Source: 2008 National Sample Survey of Registered Nurses
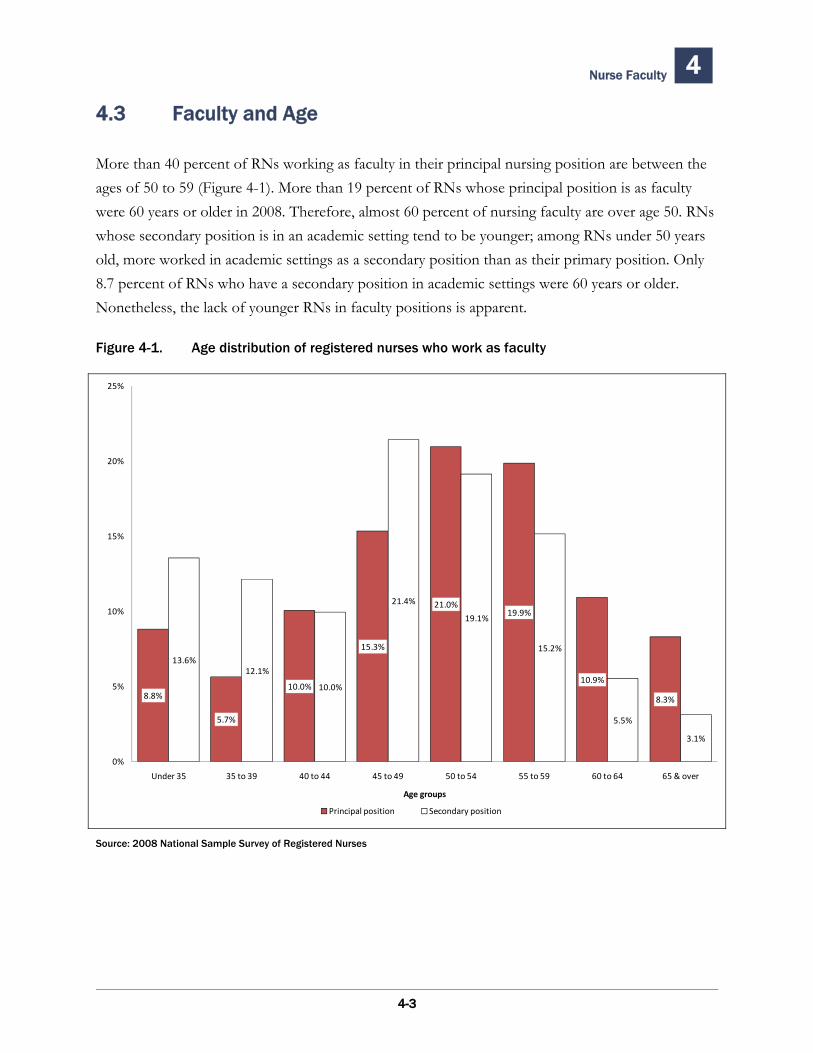
Nurse Faculty 4
4-3
4.3 Faculty and Age
More than 40 percent of RNs working as faculty in their principal nursing position are between the ages of 50 to 59 (Figure 4-1). More than 19 percent of RNs whose principal position is as faculty were 60 years or older in 2008. Therefore, almost 60 percent of nursing faculty are over age 50. RNs whose secondary position is in an academic setting tend to be younger; among RNs under 50 years old, more worked in academic settings as a secondary position than as their primary position. Only 8.7 percent of RNs who have a secondary position in academic settings were 60 years or older. Nonetheless, the lack of younger RNs in faculty positions is apparent.
Figure 4-1. Age distribution of registered nurses who work as faculty
Source: 2008 National Sample Survey of Registered Nurses
8.8%
5.7%
10.0%
15.3%
21.0%19.9%
10.9%
8.3%
13.6%12.1%
10.0%
21.4%
19.1%
15.2%
5.5%
3.1%
0%
5%
10%
15%
20%
25%
Under 35 35 to 39 40 to 44 45 to 49 50 to 54 55 to 59 60 to 64 65 & over
Age groups
Principal position Secondary position
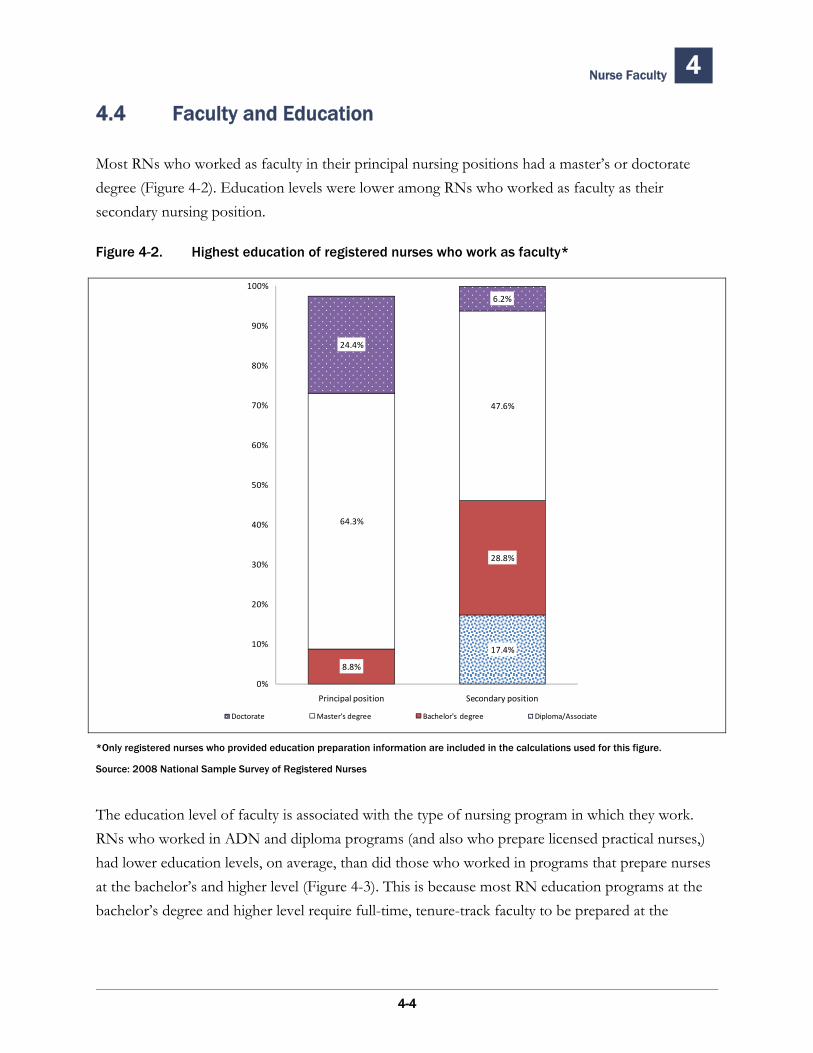
Nurse Faculty 4
4-4
4.4 Faculty and Education
Most RNs who worked as faculty in their principal nursing positions had a master’s or doctorate degree (Figure 4-2). Education levels were lower among RNs who worked as faculty as their secondary nursing position.
Figure 4-2. Highest education of registered nurses who work as faculty*
*Only registered nurses who provided education preparation information are included in the calculations used for this figure.
Source: 2008 National Sample Survey of Registered Nurses
The education level of faculty is associated with the type of nursing program in which they work. RNs who worked in ADN and diploma programs (and also who prepare licensed practical nurses,) had lower education levels, on average, than did those who worked in programs that prepare nurses at the bachelor’s and higher level (Figure 4-3). This is because most RN education programs at the bachelor’s degree and higher level require full-time, tenure-track faculty to be prepared at the
17.4%
8.8%
28.8%
64.3%
47.6%
24.4%
6.2%
0%
10%
20%
30%
40%
50%
60%
70%
80%
90%
100%
Principal position Secondary position
Doctorate Master's degree Bachelor's degree Diploma/Associate
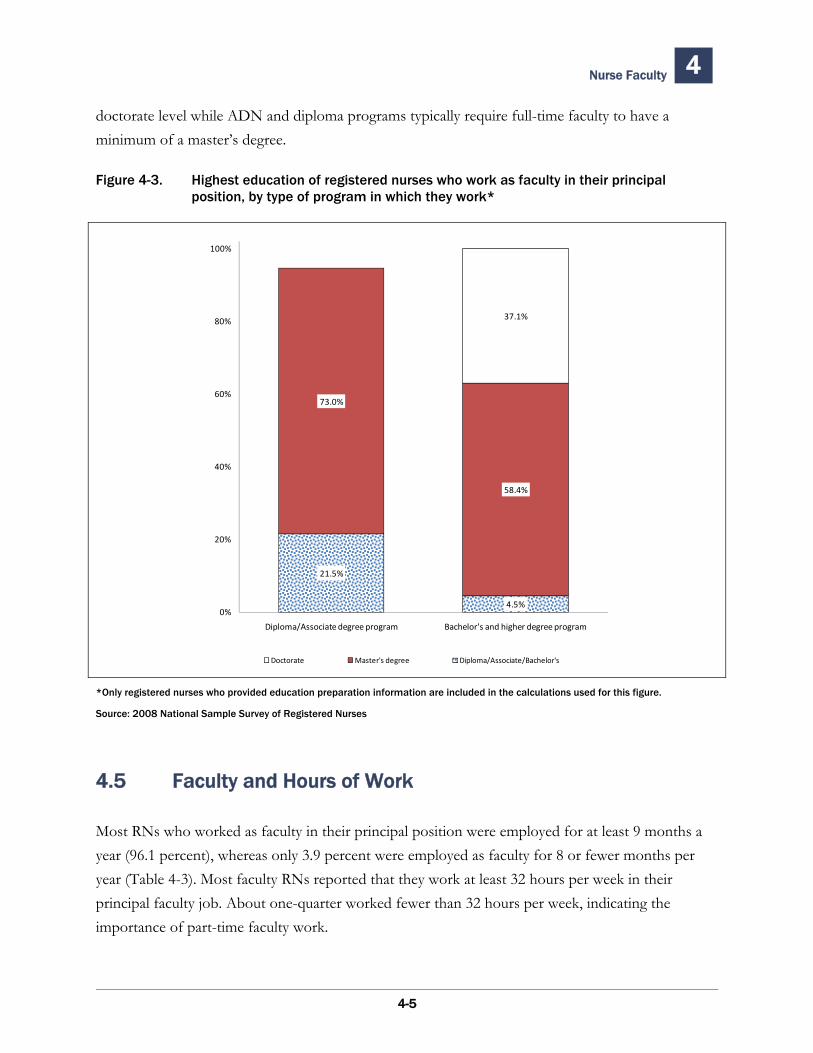
Nurse Faculty 4
4-5
doctorate level while ADN and diploma programs typically require full-time faculty to have a minimum of a master’s degree.
Figure 4-3. Highest education of registered nurses who work as faculty in their principal position, by type of program in which they work*
*Only registered nurses who provided education preparation information are included in the calculations used for this figure.
Source: 2008 National Sample Survey of Registered Nurses
4.5 Faculty and Hours of Work
Most RNs who worked as faculty in their principal position were employed for at least 9 months a year (96.1 percent), whereas only 3.9 percent were employed as faculty for 8 or fewer months per year (Table 4-3). Most faculty RNs reported that they work at least 32 hours per week in their principal faculty job. About one-quarter worked fewer than 32 hours per week, indicating the importance of part-time faculty work.
21.5%
4.5%
73.0%
58.4%
37.1%
0%
20%
40%
60%
80%
100%
Diploma/Associate degree program Bachelor's and higher degree program
Doctorate Master's degree Diploma/Associate/Bachelor's
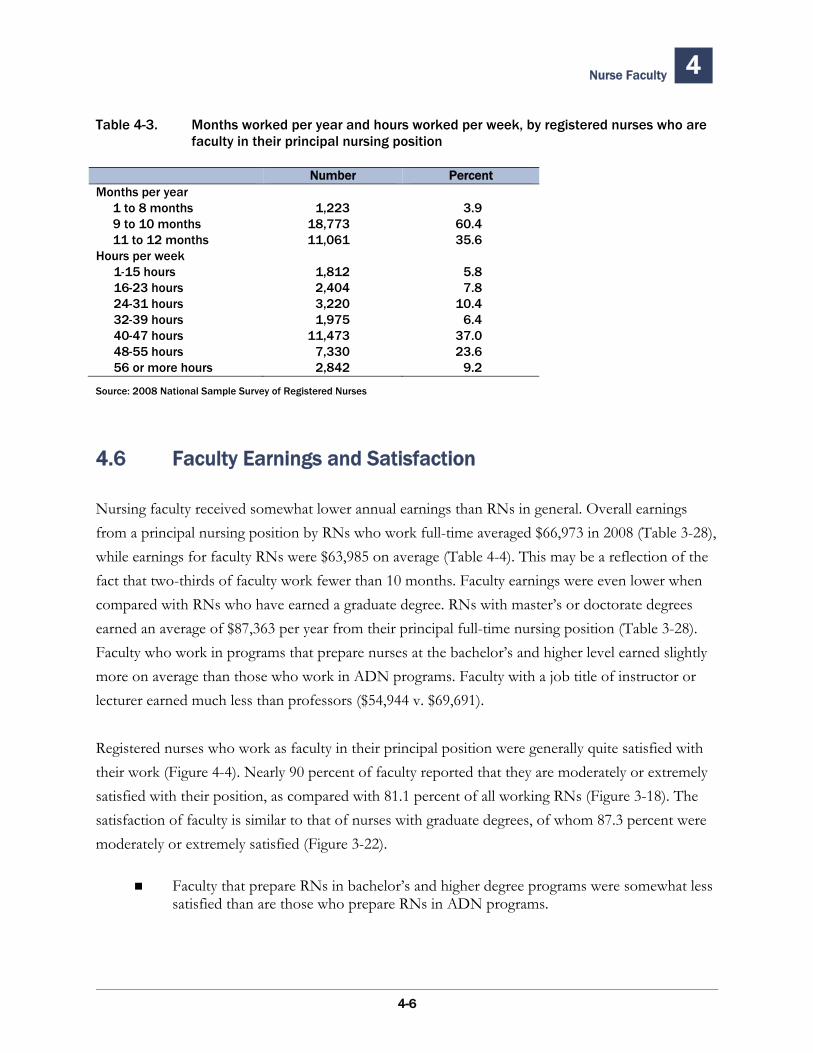
Nurse Faculty 4
4-6
Table 4-3. Months worked per year and hours worked per week, by registered nurses who are faculty in their principal nursing position
Number PercentMonths per year 1 to 8 months 1,223 3.9 9 to 10 months 18,773 60.4 11 to 12 months 11,061 35.6Hours per week 1-15 hours 1,812 5.8 16-23 hours 2,404 7.8 24-31 hours 3,220 10.4 32-39 hours 1,975 6.4 40-47 hours 11,473 37.0 48-55 hours 7,330 23.6 56 or more hours 2,842 9.2
Source: 2008 National Sample Survey of Registered Nurses
4.6 Faculty Earnings and Satisfaction
Nursing faculty received somewhat lower annual earnings than RNs in general. Overall earnings from a principal nursing position by RNs who work full-time averaged $66,973 in 2008 (Table 3-28), while earnings for faculty RNs were $63,985 on average (Table 4-4). This may be a reflection of the fact that two-thirds of faculty work fewer than 10 months. Faculty earnings were even lower when compared with RNs who have earned a graduate degree. RNs with master’s or doctorate degrees earned an average of $87,363 per year from their principal full-time nursing position (Table 3-28). Faculty who work in programs that prepare nurses at the bachelor’s and higher level earned slightly more on average than those who work in ADN programs. Faculty with a job title of instructor or lecturer earned much less than professors ($54,944 v. $69,691).
Registered nurses who work as faculty in their principal position were generally quite satisfied with their work (Figure 4-4). Nearly 90 percent of faculty reported that they are moderately or extremely satisfied with their position, as compared with 81.1 percent of all working RNs (Figure 3-18). The satisfaction of faculty is similar to that of nurses with graduate degrees, of whom 87.3 percent were moderately or extremely satisfied (Figure 3-22).
Faculty that prepare RNs in bachelor’s and higher degree programs were somewhat less satisfied than are those who prepare RNs in ADN programs.
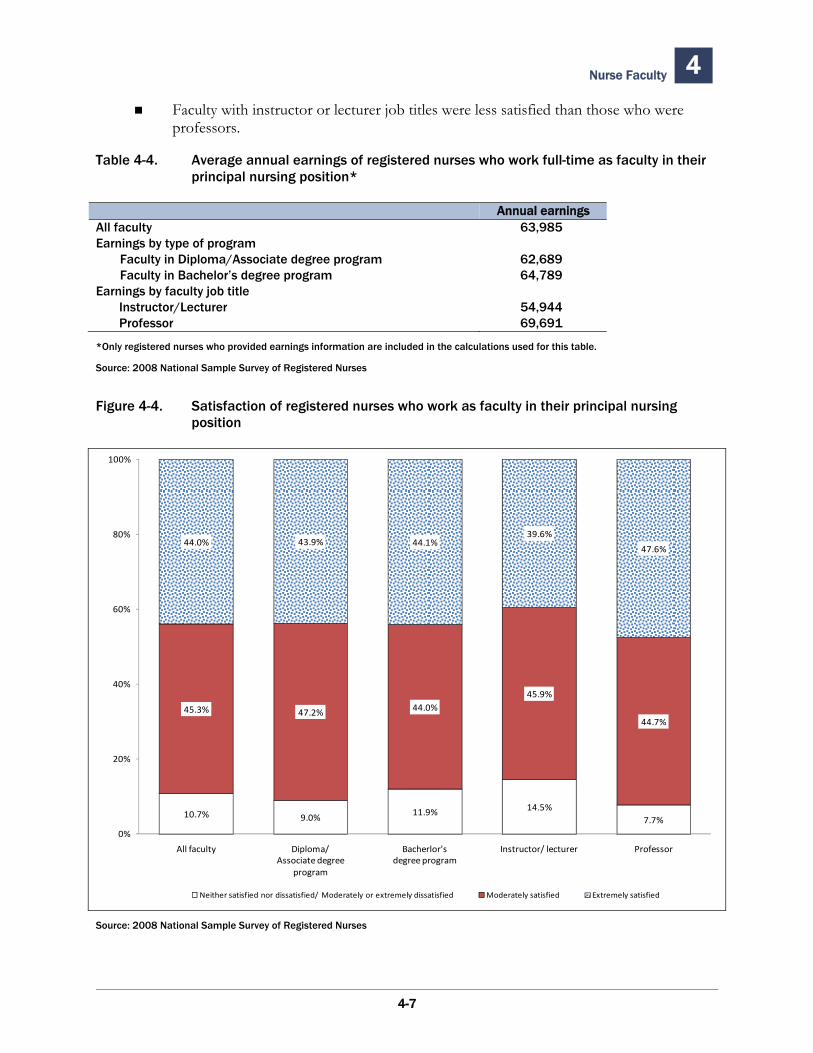
Nurse Faculty 4
4-7
Faculty with instructor or lecturer job titles were less satisfied than those who were professors.
Table 4-4. Average annual earnings of registered nurses who work full-time as faculty in their principal nursing position*
Annual earnings All faculty 63,985Earnings by type of program Faculty in Diploma/Associate degree program 62,689 Faculty in Bachelor’s degree program 64,789Earnings by faculty job title Instructor/Lecturer 54,944 Professor 69,691
*Only registered nurses who provided earnings information are included in the calculations used for this table.
Source: 2008 National Sample Survey of Registered Nurses
Figure 4-4. Satisfaction of registered nurses who work as faculty in their principal nursing position
S
ource: 2008 National Sample Survey of Registered Nurses
10.7% 9.0% 11.9% 14.5%7.7%
45.3% 47.2% 44.0%45.9%
44.7%
44.0% 43.9% 44.1%39.6%
47.6%
0%
20%
40%
60%
80%
100%
All faculty Diploma/Associate degree
program
Bacherlor's degree program
Instructor/ lecturer Professor
Neither satisfied nor dissatisfied/ Moderately or extremely dissatisfied Moderately satisfied Extremely satisfied

Nurse Faculty 4
4-8
This page deliberately blank.
5.1 Introduction
For more than four decades, Advanced Practice Registered Nurses (APRNs) have been an integral part of the health care system and have served in a variety of roles in acute and ambulatory care settings. APRNs are RNs who have received advanced education to develop knowledge and skills in areas not usual for RNs such as diagnosing and managing common acute and chronic diseases, ordering diagnostic tests, prescribing medications, and performing minor procedures. Commonly recognized APRN designations are nurse practitioner (NP), nurse midwife (NM), nurse anesthetist (NA), and clinical nurse specialist (CNS). While most APRNs are prepared in only one advanced practice area, some may be prepared in more than one of these fields. For this report, RNs were categorized as APRNs if they reported that they were prepared as an APRN in one or more of the recognized specialties.
APRNs are required to complete an approved educational program before taking an exam to obtain certification from a nationally recognized professional organization. Each State establishes criteria for State licensure, certification, or other approval of APRNs, which may include requiring graduate education and/or certification from a professional organization.
In 2008, an estimated 250,527 RNs reported that they were prepared as an APRN in one or more advanced specialties or fields. Of these, 220,494 were employed in nursing (Figure 5-1 and Appendix A, Table 44). The largest group of APRNs is NPs, and their estimated numbers rose between 2004 and 2008. CNSs are the second largest group, but their numbers declined between 2004 and 2008, the only group of APRNs to experience a decline. More information about each type of APRN is provided in dedicated sections in this chapter.
5.2 Nurse Practitioners
NP preparation has its roots in public health nursing and school nursing roles in the early part of the 20th century. In the late 1950s, RNs with clinical experience began to collaborate with physicians in the delivery of primary care, particularly in rural areas and in clinics affiliated with medical centers.
Advanced Practice Registered Nurses 5
5-1
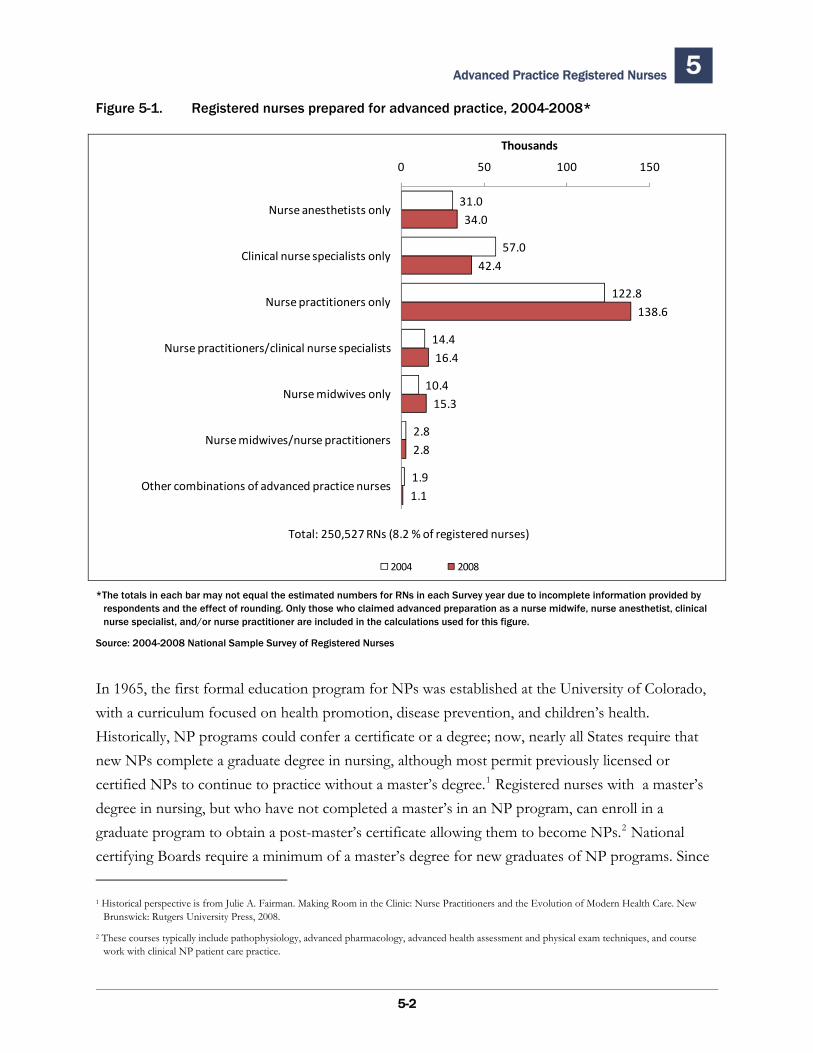
Advanced Practice Registered Nurses 5
5-2
Figure 5-1. Registered nurses prepared for advanced practice, 2004-2008*
*The totals in each bar may not equal the estimated numbers for RNs in each Survey year due to incomplete information provided by respondents and the effect of rounding. Only those who claimed advanced preparation as a nurse midwife, nurse anesthetist, clinical nurse specialist, and/or nurse practitioner are included in the calculations used for this figure.
Source: 2004-2008 National Sample Survey of Registered Nurses
In 1965, the first formal education program for NPs was established at the University of Colorado, with a curriculum focused on health promotion, disease prevention, and children’s health. Historically, NP programs could confer a certificate or a degree; now, nearly all States require that new NPs complete a graduate degree in nursing, although most permit previously licensed or certified NPs to continue to practice without a master’s degree.1 Registered nurses with a master’s degree in nursing, but who have not completed a master’s in an NP program, can enroll in a graduate program to obtain a post-master’s certificate allowing them to become NPs.2 National certifying Boards require a minimum of a master’s degree for new graduates of NP programs. Since 1 Historical perspective is from Julie A. Fairman. Making Room in the Clinic: Nurse Practitioners and the Evolution of Modern Health Care. New
Brunswick: Rutgers University Press, 2008.
2 These courses typically include pathophysiology, advanced pharmacology, advanced health assessment and physical exam techniques, and course work with clinical NP patient care practice.
31.0
57.0
122.8
14.4
10.4
2.8
1.9
34.0
42.4
138.6
16.4
15.3
2.8
1.1
0 50 100 150
Nurse anesthetists only
Clinical nurse specialists only
Nurse practitioners only
Nurse practitioners/clinical nurse specialists
Nurse midwives only
Nurse midwives/nurse practitioners
Other combinations of advanced practice nurses
2004 2008
Thousands
Total: 250,527 RNs (8.2 %of registered nurses)
Advanced Practice Registered Nurses 5
5-3
1999, some nurse education programs have offered the Doctor of Nursing Practice (DNP), in addition to or instead of a master’s degree, although the number of NPs educated in these programs is small thus far.
Early practice for NPs focused on work particularly with women and children in rural and underserved inner city areas where physicians were scarce. NPs are now prepared and certified to work across populations in any geographic region with focus specialty areas including family care, pediatrics, geriatrics, adult health, women’s health, psychiatry, neonatology, and acute hospital care of adults and children (Appendix A, Table 46). To work with the title of an NP, nurses must be certified or recognized by the State in which they practice, which usually requires certification by a national professional organization. The State recognized Scope of Practice for NPs differs depending on State regulations. While regulation of NPs may differ by State, the education, knowledge, and practices of NPs are generally the same nationwide.
To assure that NP data were accurate, care was taken to include only NPs with preparation as nurse practitioners. In this Survey, registered nurses were counted as NPs if they responded as an NP and also provided at least one additional piece of corroborating information indicating either that (1) their primary specialty was a specialty nationally recognized for NPs, (2) they had national or State certification or recognition, (3) they had a master’s or higher degree in nursing, or (4) they held a job title of nurse practitioner. This section focuses on all RNs prepared as NPs, and all data refer to this group unless otherwise specified. The analysis in this chapter includes all RNs who have been prepared as NPs, even if they are not currently licensed or certified as such or do not practice in the field. These NPs may be retired or pursuing other occupations within or outside nursing. Understanding the employment patters of RNs, including APRNs, is a central goal of the NSSRN.
5.2.1 Number of Nurse Practitioners
In 2008, an estimated 158,348 nurses had NP preparation (Figure 5-2 and Appendix A, Table 45). Of these, 16,370 were also prepared as CNSs, accounting for 10.3 percent of NPs. Another 2.2 percent of NPs in 2008 also had preparation as NMs, NAs, or in more than two APRN fields.
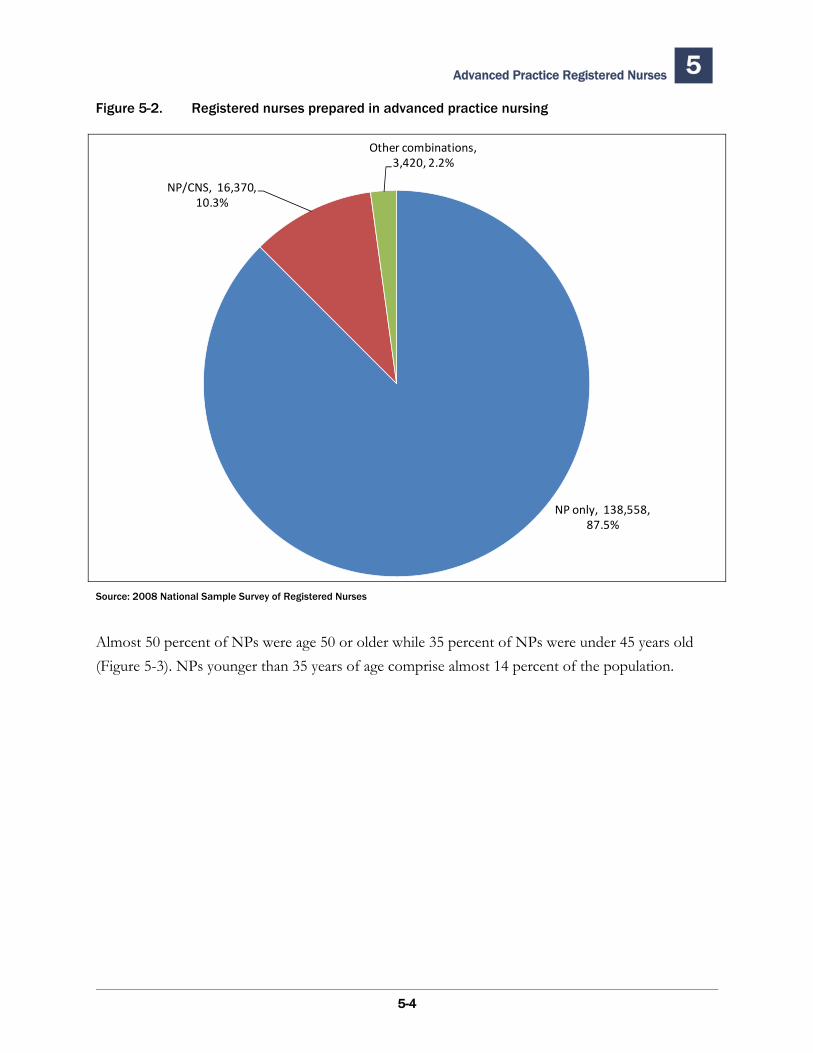
Advanced Practice Registered Nurses 5
5-4
Figure 5-2. Registered nurses prepared in advanced practice nursing
Source: 2008 National Sample Survey of Registered Nurses
Almost 50 percent of NPs were age 50 or older while 35 percent of NPs were under 45 years old (Figure 5-3). NPs younger than 35 years of age comprise almost 14 percent of the population.
NP only, 138,558, 87.5%
NP/CNS, 16,370, 10.3%
Other combinations, 3,420, 2.2%
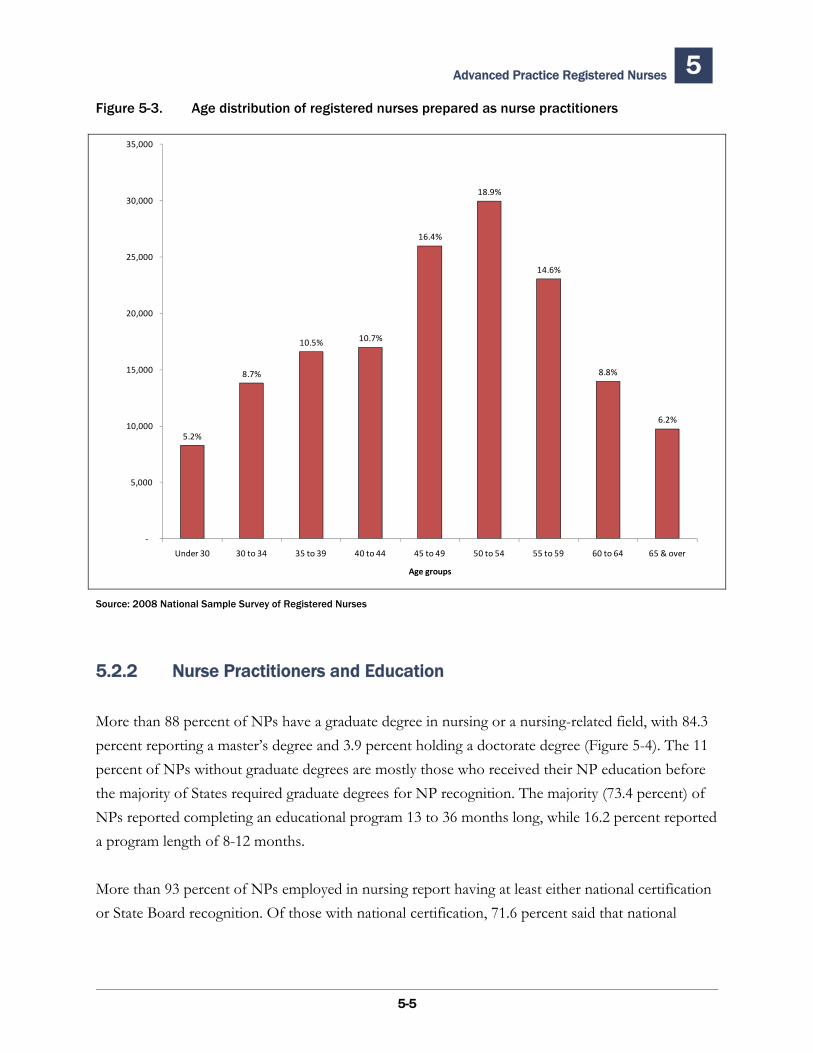
Advanced Practice Registered Nurses 5
5-5
Figure 5-3. Age distribution of registered nurses prepared as nurse practitioners
Source: 2008 National Sample Survey of Registered Nurses
5.2.2 Nurse Practitioners and Education
More than 88 percent of NPs have a graduate degree in nursing or a nursing-related field, with 84.3 percent reporting a master’s degree and 3.9 percent holding a doctorate degree (Figure 5-4). The 11 percent of NPs without graduate degrees are mostly those who received their NP education before the majority of States required graduate degrees for NP recognition. The majority (73.4 percent) of NPs reported completing an educational program 13 to 36 months long, while 16.2 percent reported a program length of 8-12 months.
More than 93 percent of NPs employed in nursing report having at least either national certification or State Board recognition. Of those with national certification, 71.6 percent said that national
5.2%
8.7%
10.5% 10.7%
16.4%
18.9%
14.6%
8.8%
6.2%
‐
5,000
10,000
15,000
20,000
25,000
30,000
35,000
Under 30 30 to 34 35 to 39 40 to 44 45 to 49 50 to 54 55 to 59 60 to 64 65 & over
Age groups
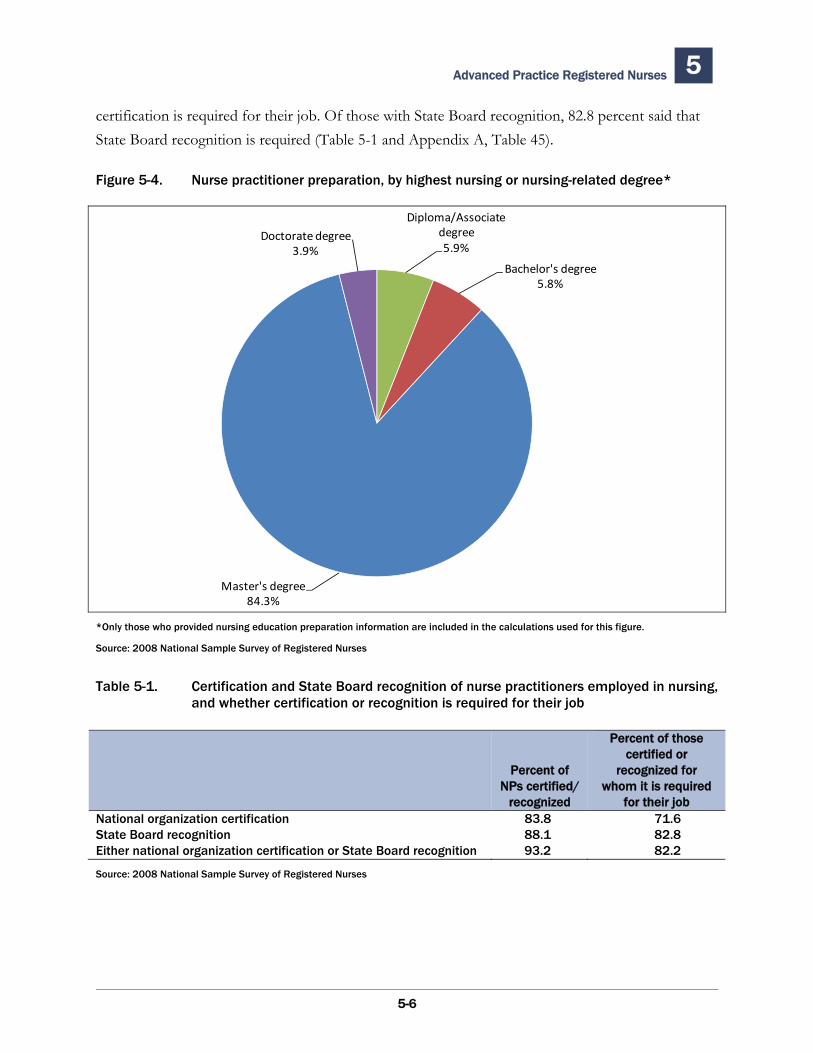
Advanced Practice Registered Nurses 5
5-6
certification is required for their job. Of those with State Board recognition, 82.8 percent said that State Board recognition is required (Table 5-1 and Appendix A, Table 45).
Figure 5-4. Nurse practitioner preparation, by highest nursing or nursing-related degree*
*Only those who provided nursing education preparation information are included in the calculations used for this figure.
Source: 2008 National Sample Survey of Registered Nurses
Table 5-1. Certification and State Board recognition of nurse practitioners employed in nursing, and whether certification or recognition is required for their job
Percent of those certified or
Percent of recognized for NPs certified/ whom it is required
recognized for their job National organization certification 83.8 71.6State Board recognition 88.1 82.8Either national organization certification or State Board recognition 93.2 82.2
Diploma/Associate degree5.9%
Bachelor's degree5.8%
Master's degree84.3%
Doctorate degree3.9%
Source: 2008 National Sample Survey of Registered Nurses
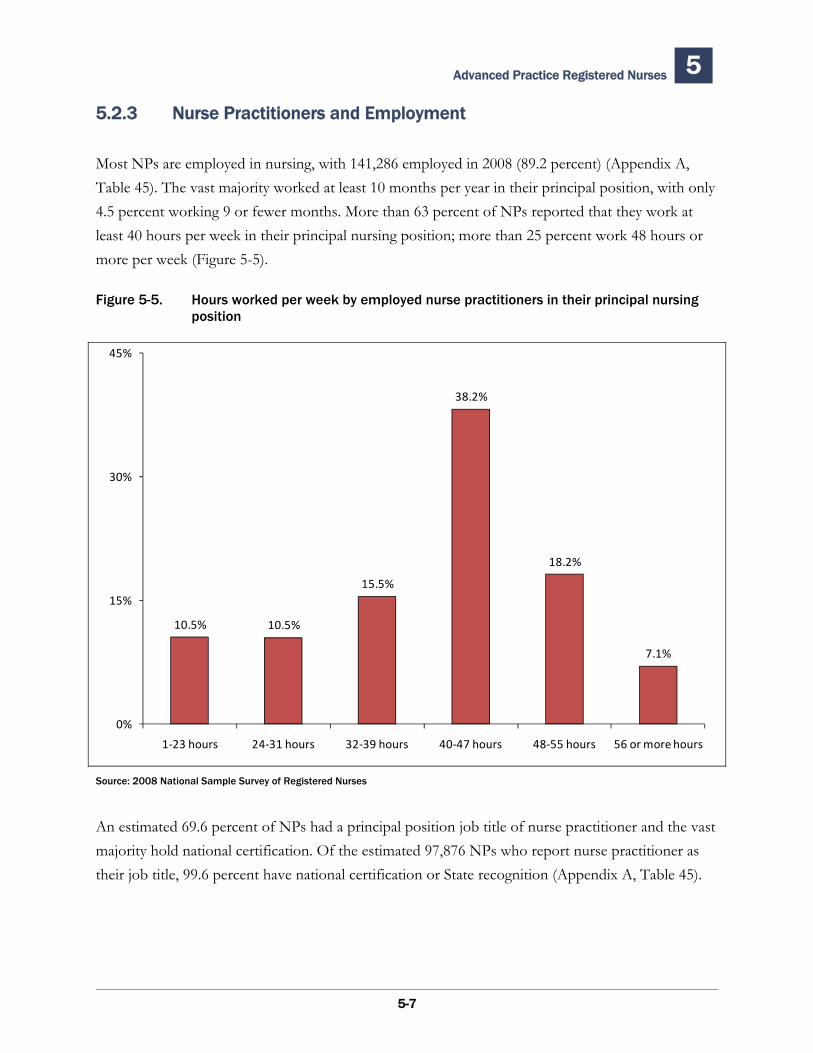
Advanced Practice Registered Nurses 5
5-7
5.2.3 Nurse Practitioners and Employment
Most NPs are employed in nursing, with 141,286 employed in 2008 (89.2 percent) (Appendix A, Table 45). The vast majority worked at least 10 months per year in their principal position, with only 4.5 percent working 9 or fewer months. More than 63 percent of NPs reported that they work at least 40 hours per week in their principal nursing position; more than 25 percent work 48 hours or more per week (Figure 5-5).
Figure 5-5. Hours worked per week by employed nurse practitioners in their principal nursing position
Source: 2008 National Sample Survey of Registered Nurses
An estimated 69.6 percent of NPs had a principal position job title of nurse practitioner and the vast majority hold national certification. Of the estimated 97,876 NPs who report nurse practitioner as their job title, 99.6 percent have national certification or State recognition (Appendix A, Table 45).
10.5% 10.5%
15.5%
38.2%
18.2%
7.1%
0%
15%
30%
45%
1‐23 hours 24‐31 hours 32‐39 hours 40‐47 hours 48‐55 hours 56 or more hours
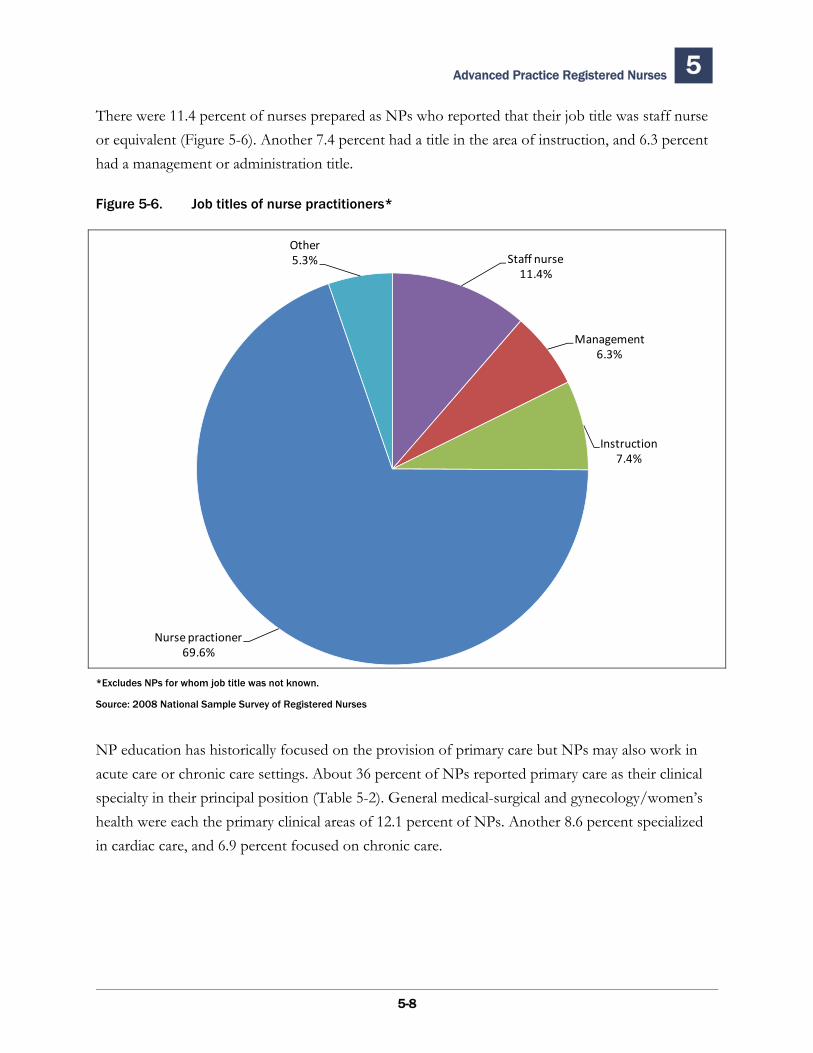
Advanced Practice Registered Nurses 5
5-8
There were 11.4 percent of nurses prepared as NPs who reported that their job title was staff nurse or equivalent (Figure 5-6). Another 7.4 percent had a title in the area of instruction, and 6.3 percent had a management or administration title.
Figure 5-6. Job titles of nurse practitioners*
*Excludes NPs for whom job title was not known.
Source: 2008 National Sample Survey of Registered Nurses
NP education has historically focused on the provision of primary care but NPs may also work in acute care or chronic care settings. About 36 percent of NPs reported primary care as their clinical specialty in their principal position (Table 5-2). General medical-surgical and gynecology/women’s health were each the primary clinical areas of 12.1 percent of NPs. Another 8.6 percent specialized in cardiac care, and 6.9 percent focused on chronic care.
Staff nurse 11.4%
Management6.3%
Instruction7.4%
Nurse practioner69.6%
Other5.3%
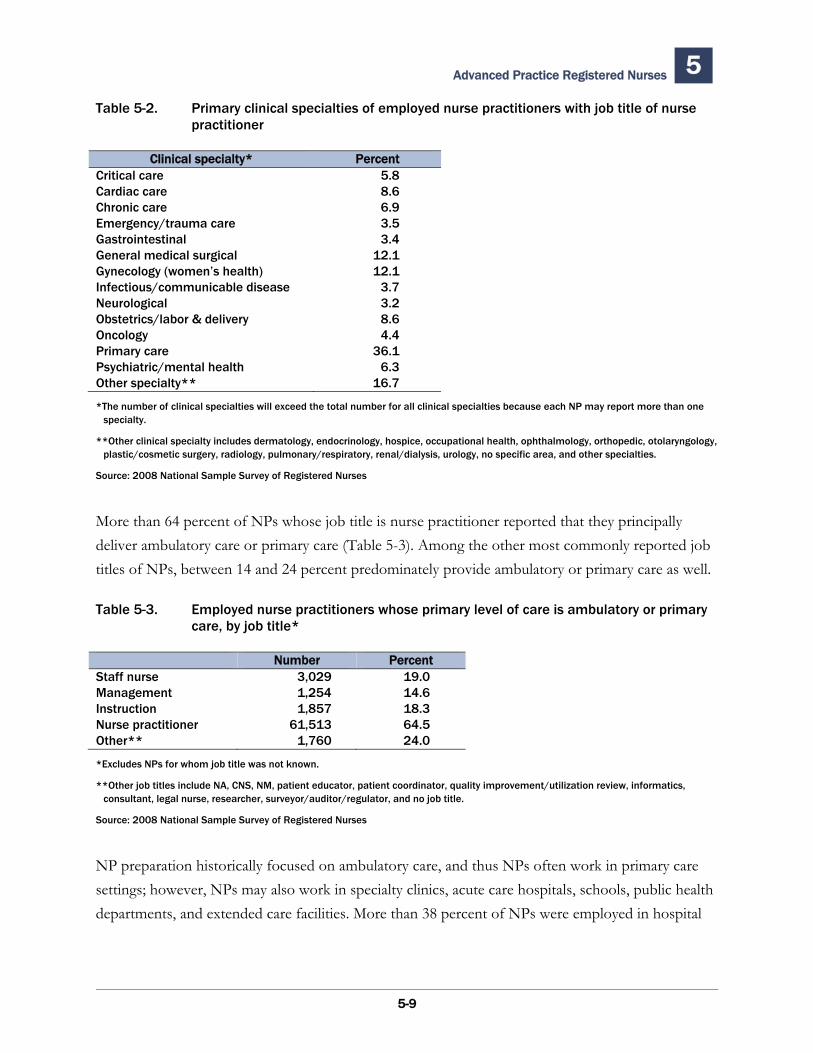
Advanced Practice Registered Nurses 5
5-9
Table 5-2. Primary clinical specialties of employed nurse practitioners with job title of nurse practitioner
Clinical specialty* PercentCritical care 5.8Cardiac care 8.6Chronic care 6.9Emergency/trauma care 3.5Gastrointestinal 3.4General medical surgical 12.1Gynecology (women’s health) 12.1Infectious/communicable disease 3.7Neurological 3.2Obstetrics/labor & delivery 8.6Oncology 4.4Primary care 36.1Psychiatric/mental health 6.3Other specialty** 16.7
*The number of clinical specialties will exceed the total number for all clinical specialties because each NP may report more than one specialty.
**Other clinical specialty includes dermatology, endocrinology, hospice, occupational health, ophthalmology, orthopedic, otolaryngology, plastic/cosmetic surgery, radiology, pulmonary/respiratory, renal/dialysis, urology, no specific area, and other specialties.
Source: 2008 National Sample Survey of Registered Nurses
More than 64 percent of NPs whose job title is nurse practitioner reported that they principally deliver ambulatory care or primary care (Table 5-3). Among the other most commonly reported job titles of NPs, between 14 and 24 percent predominately provide ambulatory or primary care as well.
Table 5-3. Employed nurse practitioners whose primary level of care is ambulatory or primary care, by job title*
Number PercentStaff nurse 3,029 19.0Management 1,254 14.6Instruction 1,857 18.3Nurse practitioner 61,513 64.5Other** 1,760 24.0
*Excludes NPs for whom job title was not known.
**Other job titles include NA, CNS, NM, patient educator, patient coordinator, quality improvement/utilization review, informatics, consultant, legal nurse, researcher, surveyor/auditor/regulator, and no job title.
Source: 2008 National Sample Survey of Registered Nurses
NP preparation historically focused on ambulatory care, and thus NPs often work in primary care settings; however, NPs may also work in specialty clinics, acute care hospitals, schools, public health departments, and extended care facilities. More than 38 percent of NPs were employed in hospital
Advanced Practice Registered Nurses 5
5-10
settings, which can include primary care clinics located in or owned by a hospital (Figure 5-7). Another 35.3 percent worked in ambulatory care settings outside hospitals.
NPs who were employed in ambulatory care settings reported that ambulatory care was the level of care they provide most often (Figure 5-8). However, among NPs who worked in hospital settings, only 33.7 percent listed ambulatory care as their primary level of care. Higher percentages of NPs employed in school health (59.5 percent) and public/community health (47.4 percent) reported that their main level of care was ambulatory or primary care. Only 7.7 percent of NPs work in academic education, and of these NPs, 15.1 percent reported ambulatory or primary care as their main level of care.
5.2.4 Nurse Practitioner Earnings and Job Satisfaction
Registered nurses working both full- and part-time and prepared as NPs earned an average of $73,776 per year in their principal position. Those who worked full-time earned an average of $83,192. NPs were, on average, very satisfied with their work (Figure 5-9). More than 87 percent were moderately or extremely satisfied with their principal position, and only 7.6 percent were moderately or extremely dissatisfied.
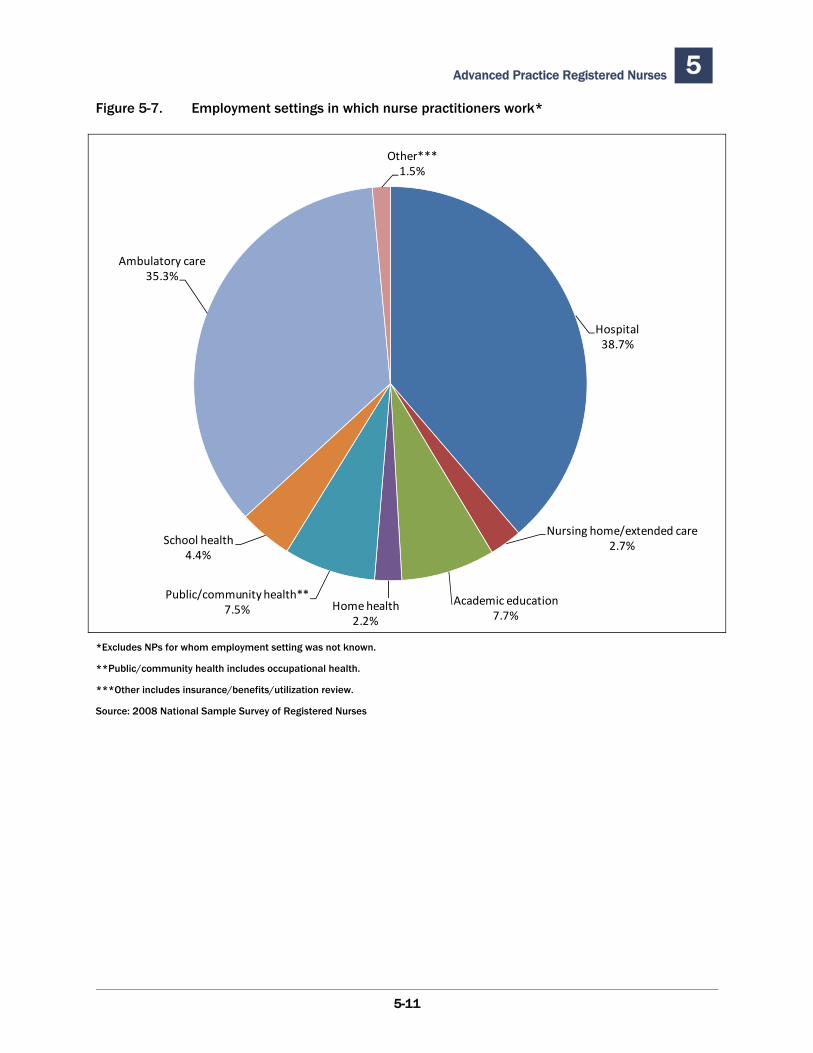
Advanced Practice Registered Nurses 5
5-11
Figure 5-7. Employment settings in which nurse practitioners work*
*Excludes NPs for whom employment setting was not known.
**Public/community health includes occupational health.
***Other includes insurance/benefits/utilization review.
Source: 2008 National Sample Survey of Registered Nurses
Hospital 38.7%
Nursing home/extended care2.7%
Academic education7.7%
Home health2.2%
Public/community health**7.5%
School health 4.4%
Ambulatory care35.3%
Other***1.5%
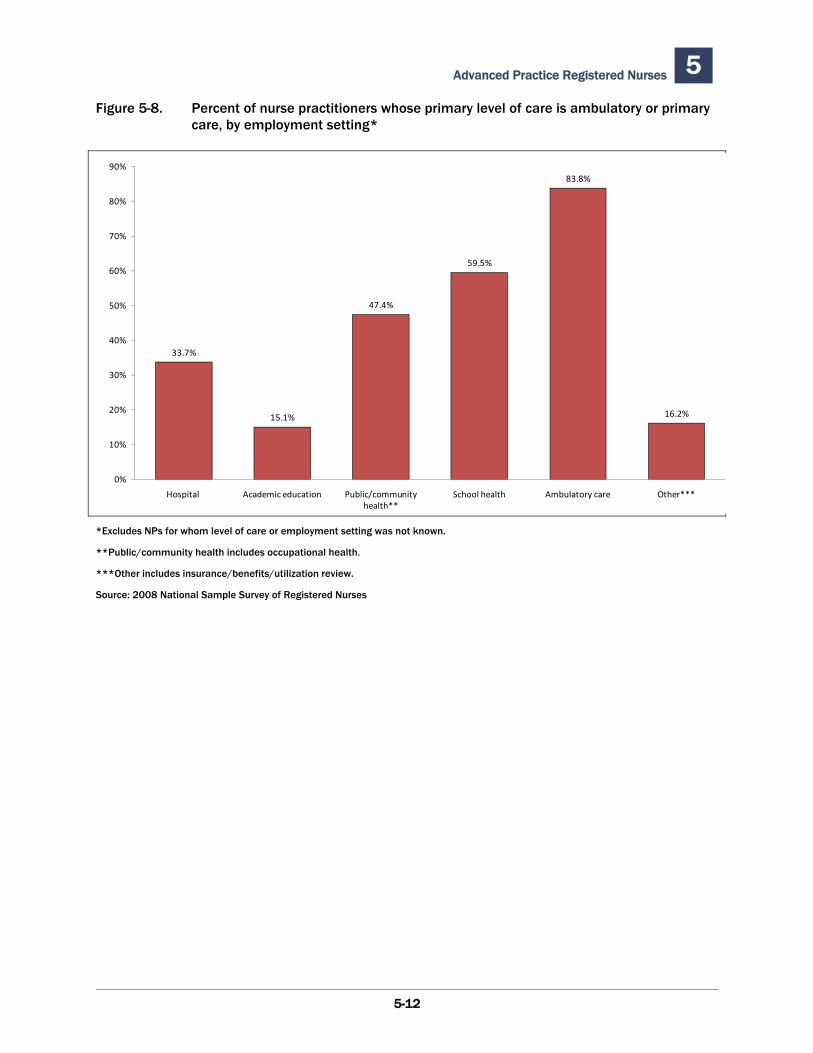
Advanced Practice Registered Nurses 5
5-12
Figure 5-8. Percent of nurse practitioners whose primary level of care is ambulatory or primary care, by employment setting*
*Excludes NPs for whom level of care or employment setting was not known.
**Public/community health includes occupational health.
***Other includes insurance/benefits/utilization review.
Source: 2008 National Sample Survey of Registered Nurses
33.7%
15.1%
47.4%
59.5%
83.8%
16.2%
0%
10%
20%
30%
40%
50%
60%
70%
80%
90%
Hospital Academic education Public/community health**
School health Ambulatory care Other***
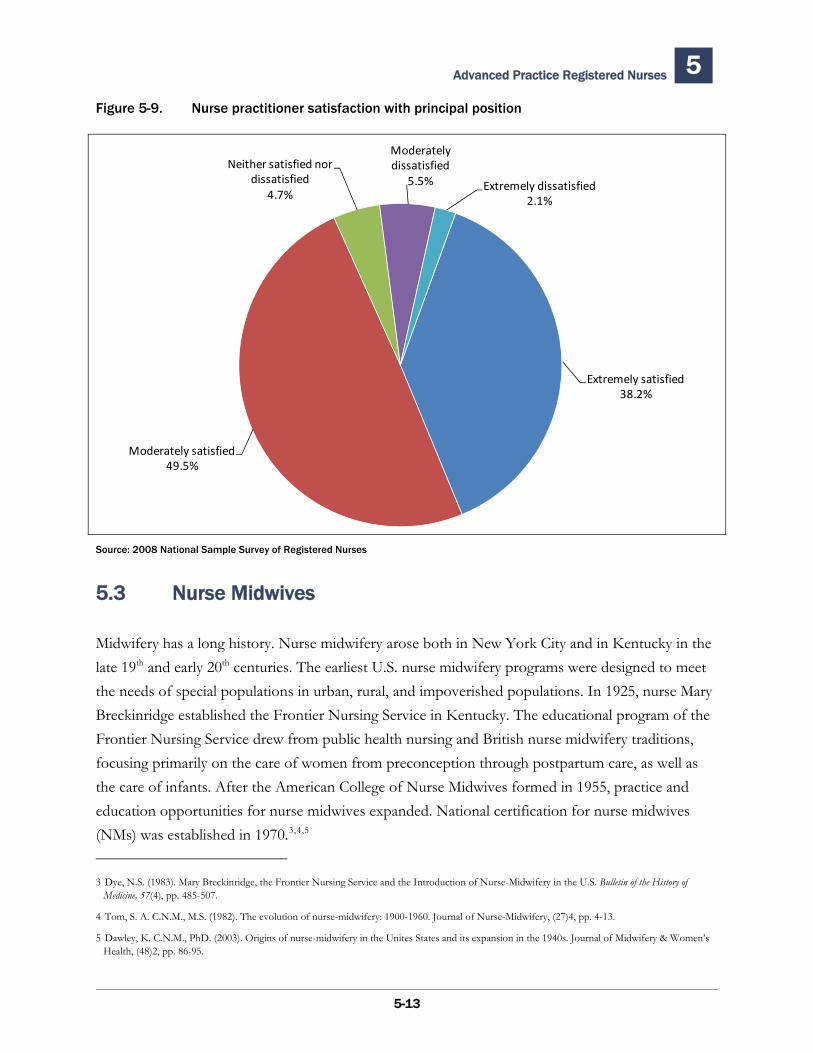
Advanced Practice Registered Nurses 5
5-13
Figure 5-9. Nurse practitioner satisfaction with principal position
Source: 2008 National Sample Survey of Registered Nurses
5.3 Nurse Midwives
Midwifery has a long history. Nurse midwifery arose both in New York City and in Kentucky in the late 19th and early 20th centuries. The earliest U.S. nurse midwifery programs were designed to meet the needs of special populations in urban, rural, and impoverished populations. In 1925, nurse Mary Breckinridge established the Frontier Nursing Service in Kentucky. The educational program of the Frontier Nursing Service drew from public health nursing and British nurse midwifery traditions, focusing primarily on the care of women from preconception through postpartum care, as well as the care of infants. After the American College of Nurse Midwives formed in 1955, practice and education opportunities for nurse midwives expanded. National certification for nurse midwives (NMs) was established in 1970.3,4,5 3 Dye, N.S. (1983). Mary Breckinridge, the Frontier Nursing Service and the Introduction of Nurse-Midwifery in the U.S. Bulletin of the History of
Medicine, 57(4), pp. 485-507.
4 Tom, S. A. C.N.M., M.S. (1982). The evolution of nurse-midwifery: 1900-1960. Journal of Nurse-Midwifery, (27)4, pp. 4-13.
5 Dawley, K. C.N.M., PhD. (2003). Origins of nurse-midwifery in the Unites States and its expansion in the 1940s. Journal of Midwifery & Women’s Health, (48)2, pp. 86-95.
Extremely satisfied38.2%
Moderately satisfied49.5%
Neither satisfied nor dissatisfied
4.7%
Moderately dissatisfied
5.5% Extremely dissatisfied2.1%
Advanced Practice Registered Nurses 5
5-14
Nurse midwifery education requirements vary across States. Few nondegree programs exist in the United States and most programs, including the Frontier Nursing Service program, confer a master’s or doctorate degree. To practice as a nurse midwife, NMs must be certified or recognized by the State in which they practice or by a national professional organization. Much like NPs, the Scope of Practice of NMs varies by State legislation. Many States require a graduate degree in nursing, but some still permit NMs to practice after completing a bachelor’s degree and a post-licensure certification program.
To assure that NM data were accurate, care was taken to include only NMs with preparation as nurse midwives. In this Survey, nurses who responded as having been prepared as an NM were only considered as such if they also provided at least one additional piece of corroborating information indicating either that (1) their primary APRN area of study was family care, maternal-child health, neonatal care, nurse-midwifery, obstetrics/gynecology, or women’s health; (2) they reported national or State certification or recognition; (3) they had a master’s or higher degree in nursing; or (4) their job title was reported as nurse midwife.
5.3.1 Number of Nurse Midwives
NMs comprised the smallest number of the four APRN groups in 2008, with an estimated 18,492 registered nurses prepared as NMs (Appendix A, Table 45). Of these, an estimated 3,164 also have been prepared in another APRN field.
NMs were older than nurses prepared as NPs. More than 54 percent were 50 years or older (Figure 5-10).
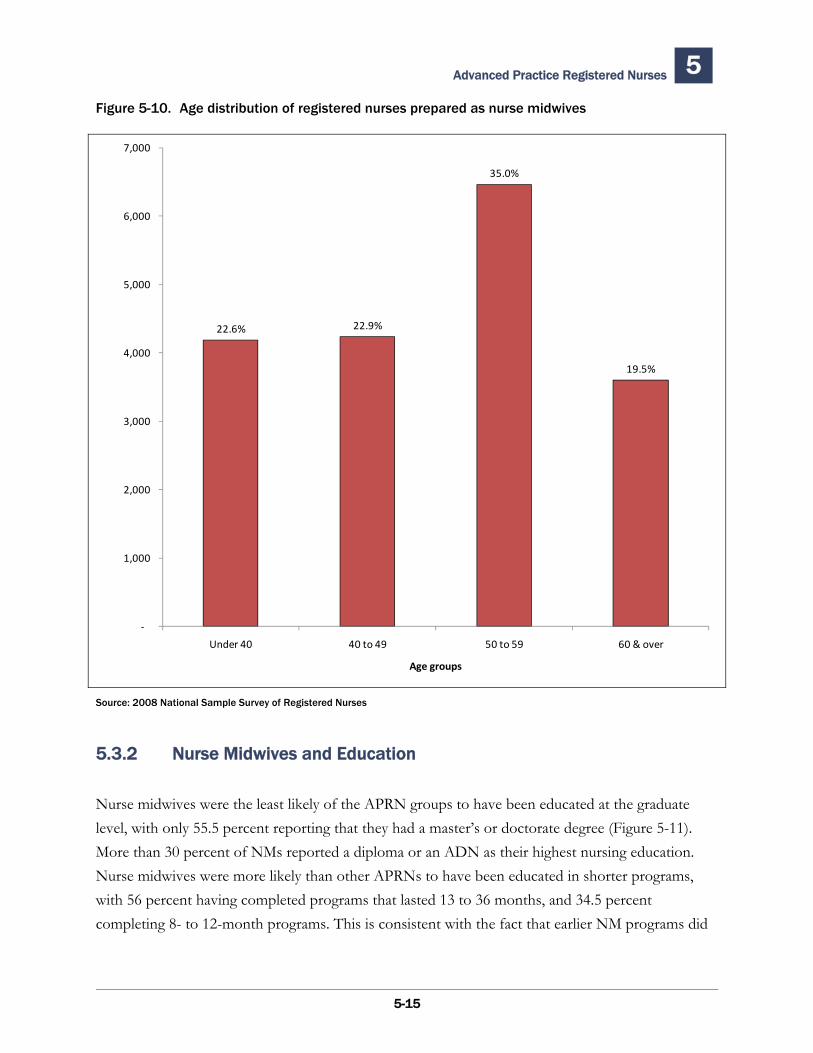
Advanced Practice Registered Nurses 5
5-15
Figure 5-10. Age distribution of registered nurses prepared as nurse midwives
Source: 2008 National Sample Survey of Registered Nurses
5.3.2 Nurse Midwives and Education
Nurse midwives were the least likely of the APRN groups to have been educated at the graduate level, with only 55.5 percent reporting that they had a master’s or doctorate degree (Figure 5-11). More than 30 percent of NMs reported a diploma or an ADN as their highest nursing education. Nurse midwives were more likely than other APRNs to have been educated in shorter programs, with 56 percent having completed programs that lasted 13 to 36 months, and 34.5 percent completing 8- to 12-month programs. This is consistent with the fact that earlier NM programs did
22.6% 22.9%
35.0%
19.5%
‐
1,000
2,000
3,000
4,000
5,000
6,000
7,000
Under 40 40 to 49 50 to 59 60 & over
Age groups
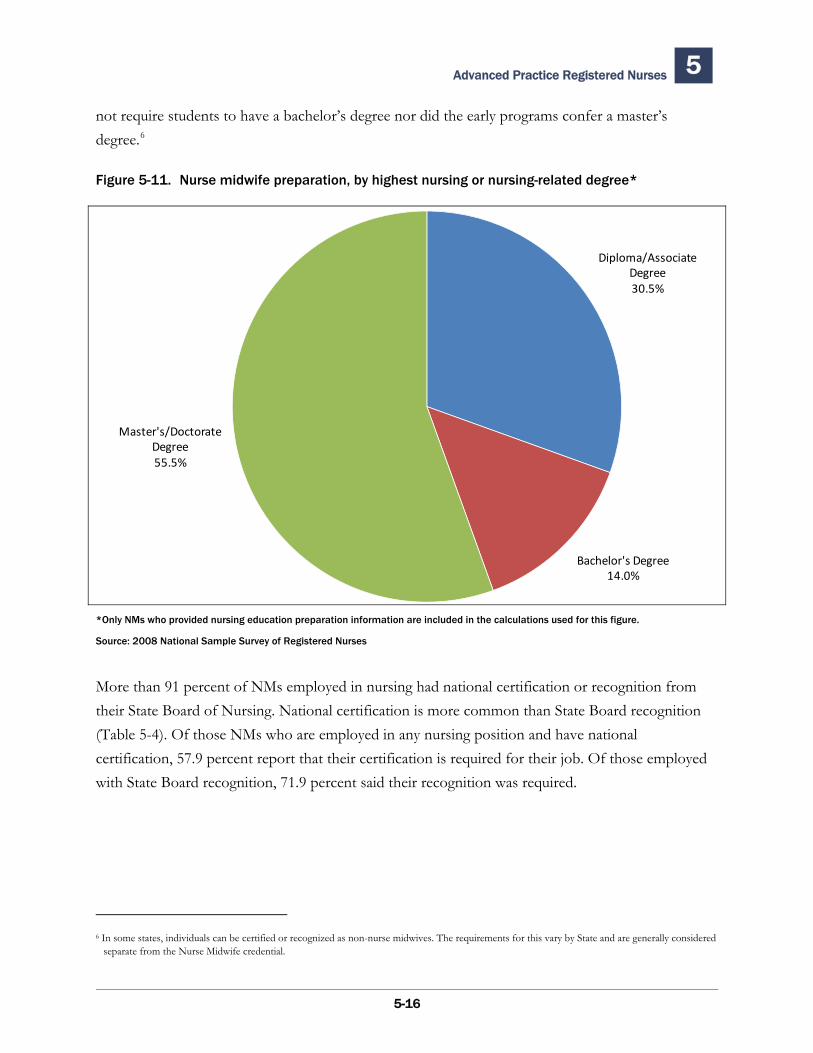
Advanced Practice Registered Nurses 5
5-16
not require students to have a bachelor’s degree nor did the early programs confer a master’s degree.6
Figure 5-11. Nurse midwife preparation, by highest nursing or nursing-related degree*
*Only NMs who provided nursing education preparation information are included in the calculations used for this figure.
Source: 2008 National Sample Survey of Registered Nurses
More than 91 percent of NMs employed in nursing had national certification or recognition from their State Board of Nursing. National certification is more common than State Board recognition (Table 5-4). Of those NMs who are employed in any nursing position and have national certification, 57.9 percent report that their certification is required for their job. Of those employed with State Board recognition, 71.9 percent said their recognition was required.
6 In some states, individuals can be certified or recognized as non-nurse midwives. The requirements for this vary by State and are generally considered
separate from the Nurse Midwife credential.
Diploma/Associate Degree30.5%
Bachelor's Degree14.0%
Master's/Doctorate Degree55.5%
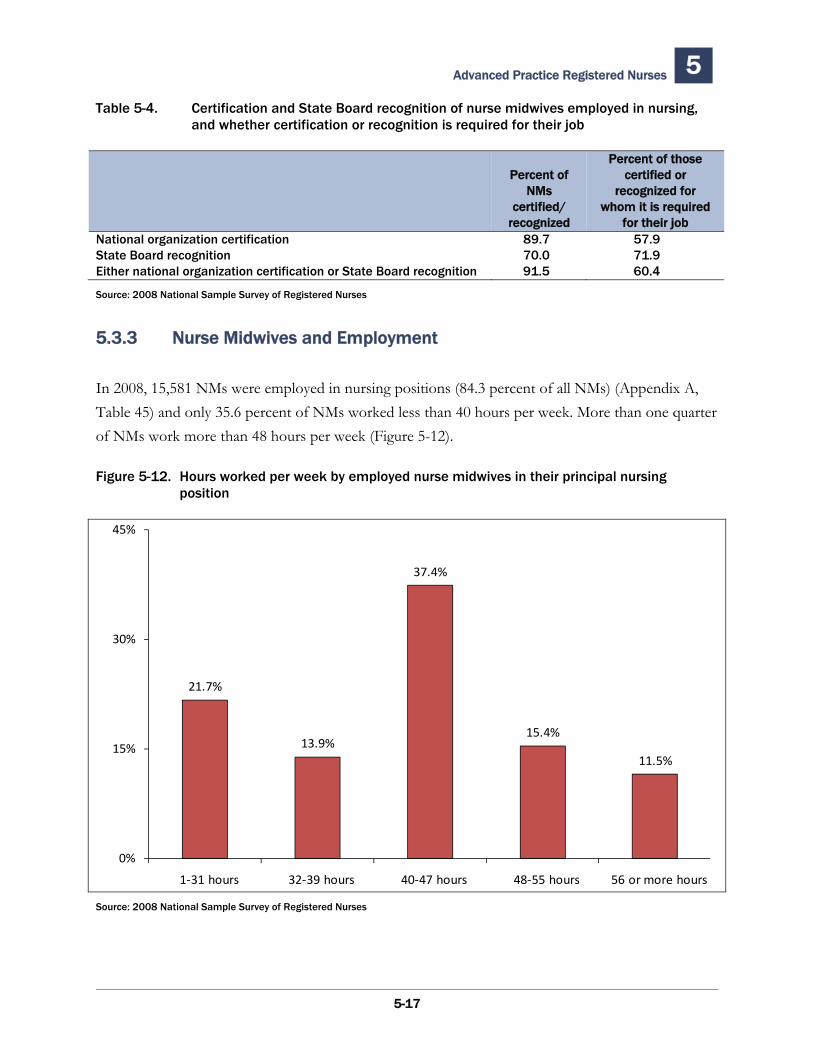
Advanced Practice Registered Nurses 5
5-17
Table 5-4. Certification and State Board recognition of nurse midwives employed in nursing, and whether certification or recognition is required for their job
Percent of those Percent of certified or
NMs recognized for certified/ whom it is required
recognized for their job National organization certification 89.7 57.9State Board recognition 70.0 71.9Either national organization certification or State Board recognition 91.5 60.4
Source: 2008 National Sample Survey of Registered Nurses
5.3.3 Nurse Midwives and Employment
In 2008, 15,581 NMs were employed in nursing positions (84.3 percent of all NMs) (Appendix A, Table 45) and only 35.6 percent of NMs worked less than 40 hours per week. More than one quarter of NMs work more than 48 hours per week (Figure 5-12).
Figure 5-12. Hours worked per week by employed nurse midwives in their principal nursing position
Source: 2008 National Sample Survey of Registered Nurses
21.7%
13.9%
37.4%
15.4%
11.5%
0%
15%
30%
45%
1‐31 hours 32‐39 hours 40‐47 hours 48‐55 hours 56 or more hours
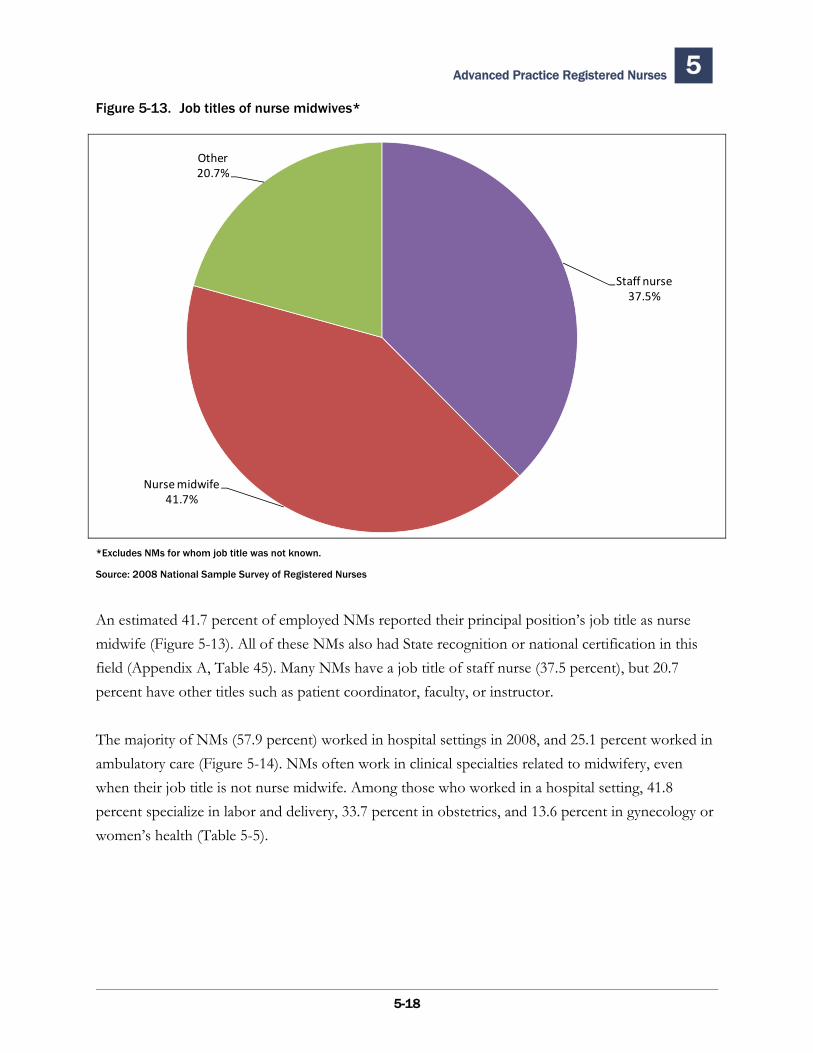
Advanced Practice Registered Nurses 5
5-18
Figure 5-13. Job titles of nurse midwives*
*Excludes NMs for whom job title was not known.
Source: 2008 National Sample Survey of Registered Nurses
An estimated 41.7 percent of employed NMs reported their principal position’s job title as nurse midwife (Figure 5-13). All of these NMs also had State recognition or national certification in this field (Appendix A, Table 45). Many NMs have a job title of staff nurse (37.5 percent), but 20.7 percent have other titles such as patient coordinator, faculty, or instructor.
The majority of NMs (57.9 percent) worked in hospital settings in 2008, and 25.1 percent worked in ambulatory care (Figure 5-14). NMs often work in clinical specialties related to midwifery, even when their job title is not nurse midwife. Among those who worked in a hospital setting, 41.8 percent specialize in labor and delivery, 33.7 percent in obstetrics, and 13.6 percent in gynecology or women’s health (Table 5-5).
Staff nurse 37.5%
Nurse midwife 41.7%
Other20.7%
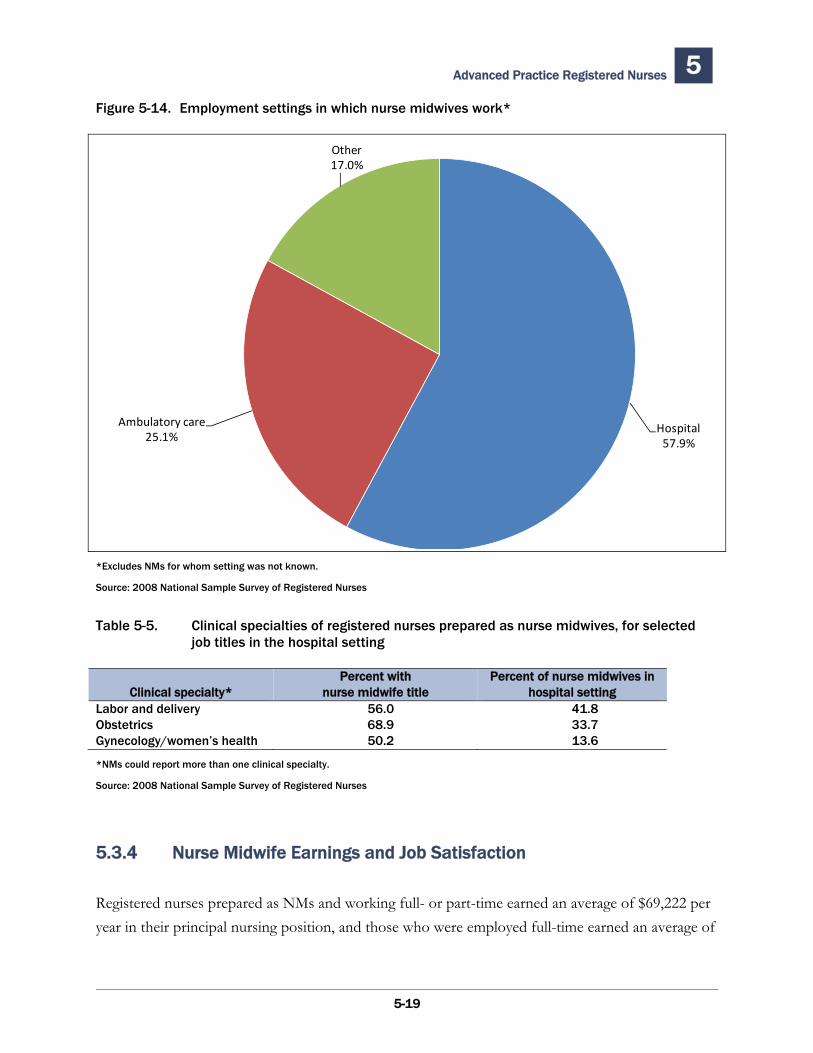
Advanced Practice Registered Nurses 5
5-19
Figure 5-14. Employment settings in which nurse midwives work*
*Excludes NMs for whom setting was not known.
Source: 2008 National Sample Survey of Registered Nurses
Table 5-5. Clinical specialties of registered nurses prepared as nurse midwives, for selected job titles in the hospital setting
Percent with Percent of nurse midwives in Clinical specialty* nurse midwife title hospital setting
Labor and delivery 56.0 41.8 Obstetrics 68.9 33.7 Gynecology/women’s health 50.2 13.6
*NMs could report more than one clinical specialty.
Source: 2008 National Sample Survey of Registered Nurses
5.3.4 Nurse Midwife Earnings and Job Satisfaction
Registered nurses prepared as NMs and working full- or part-time earned an average of $69,222 per year in their principal nursing position, and those who were employed full-time earned an average of
Hospital 57.9%
Ambulatory care25.1%
Other17.0%
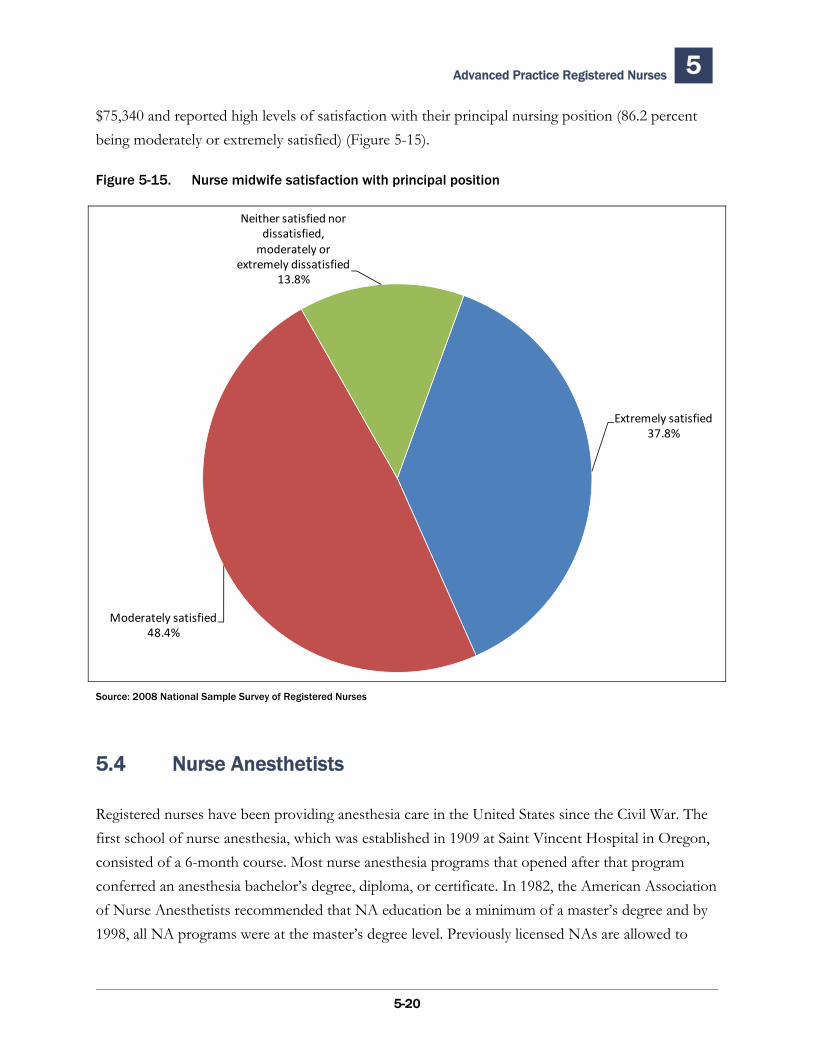
Advanced Practice Registered Nurses 5
5-20
$75,340 and reported high levels of satisfaction with their principal nursing position (86.2 percent being moderately or extremely satisfied) (Figure 5-15).
Figure 5-15. Nurse midwife satisfaction with principal position
Source: 2008 National Sample Survey of Registered Nurses
5.4 Nurse Anesthetists
Registered nurses have been providing anesthesia care in the United States since the Civil War. The first school of nurse anesthesia, which was established in 1909 at Saint Vincent Hospital in Oregon, consisted of a 6-month course. Most nurse anesthesia programs that opened after that program conferred an anesthesia bachelor’s degree, diploma, or certificate. In 1982, the American Association of Nurse Anesthetists recommended that NA education be a minimum of a master’s degree and by 1998, all NA programs were at the master’s degree level. Previously licensed NAs are allowed to
Extremely satisfied37.8%
Moderately satisfied48.4%
Neither satisfied nor dissatisfied, moderately or
extremely dissatisfied13.8%
Advanced Practice Registered Nurses 5
5-21
continue their practice. Nurse anesthetists take a national certification exam at the end of their NA education and are licensed in most States through State nursing boards.7,8
5.4.1 Number of Nurse Anesthetists
Nurse anesthetists were the third largest group of APRNs, next to NPs and CNSs, with an estimated 34,821 nurses prepared as anesthetists in 2008 (Appendix A, Table 45). There was a 7.1 percent growth in the number of NAs between 2004 and 2008, compared with a 9 percent increase between 2000 and 2004.
Nurse anesthetists have a larger proportion of younger nurses than other APRN groups. In 2008, nearly 40 percent were under 45 years old (Figure 5-16). More than 40 percent of NAs are men (Figure 7-2) (discussed in more detail in Chapter 7).
7 Bankert, M. Watchful Care: A History of America’s Nurse Anesthetists. New York: Continuum. 1989.
8 Thatcher, V.S. History of Anesthesia with Emphasis on the Nurse Specialist. Philadelphia: JB Lippincott Company. 1953.
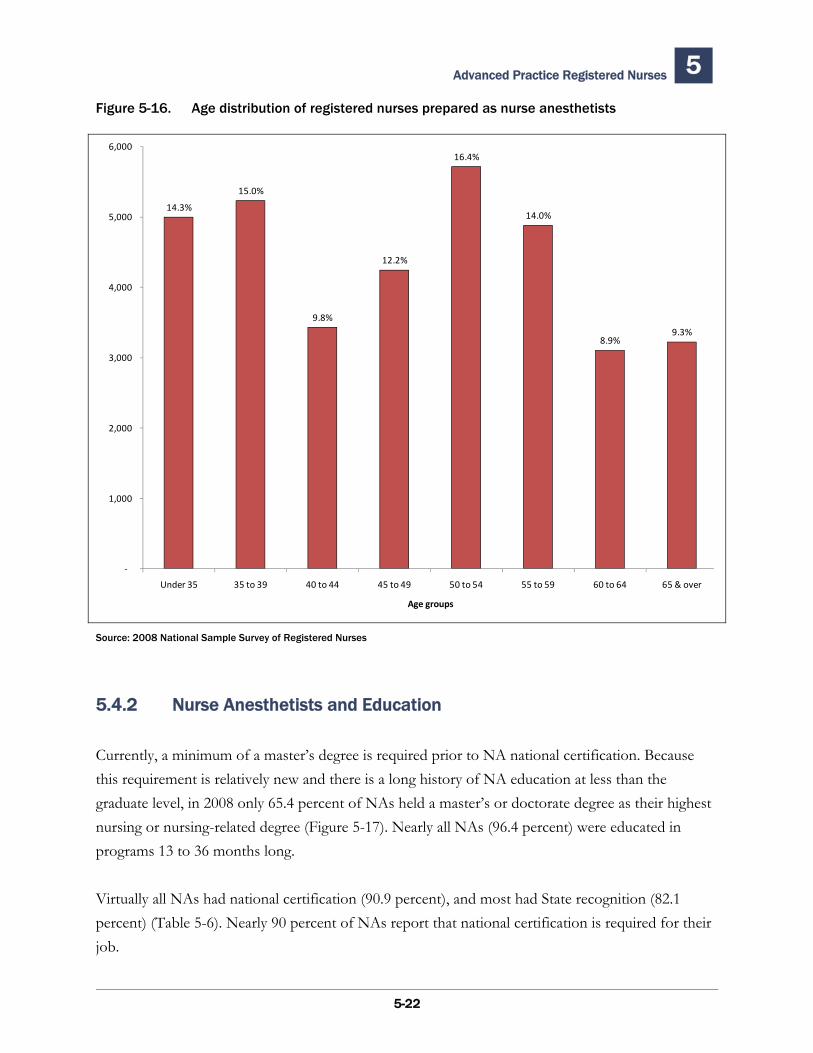
Advanced Practice Registered Nurses 5
5-22
Figure 5-16. Age distribution of registered nurses prepared as nurse anesthetists
Source: 2008 National Sample Survey of Registered Nurses
5.4.2 Nurse Anesthetists and Education
Currently, a minimum of a master’s degree is required prior to NA national certification. Because this requirement is relatively new and there is a long history of NA education at less than the graduate level, in 2008 only 65.4 percent of NAs held a master’s or doctorate degree as their highest nursing or nursing-related degree (Figure 5-17). Nearly all NAs (96.4 percent) were educated in programs 13 to 36 months long.
Virtually all NAs had national certification (90.9 percent), and most had State recognition (82.1 percent) (Table 5-6). Nearly 90 percent of NAs report that national certification is required for their job.
14.3%
15.0%
9.8%
12.2%
16.4%
14.0%
8.9%9.3%
‐
1,000
2,000
3,000
4,000
5,000
6,000
Under 35 35 to 39 40 to 44 45 to 49 50 to 54 55 to 59 60 to 64 65 & over
Age groups
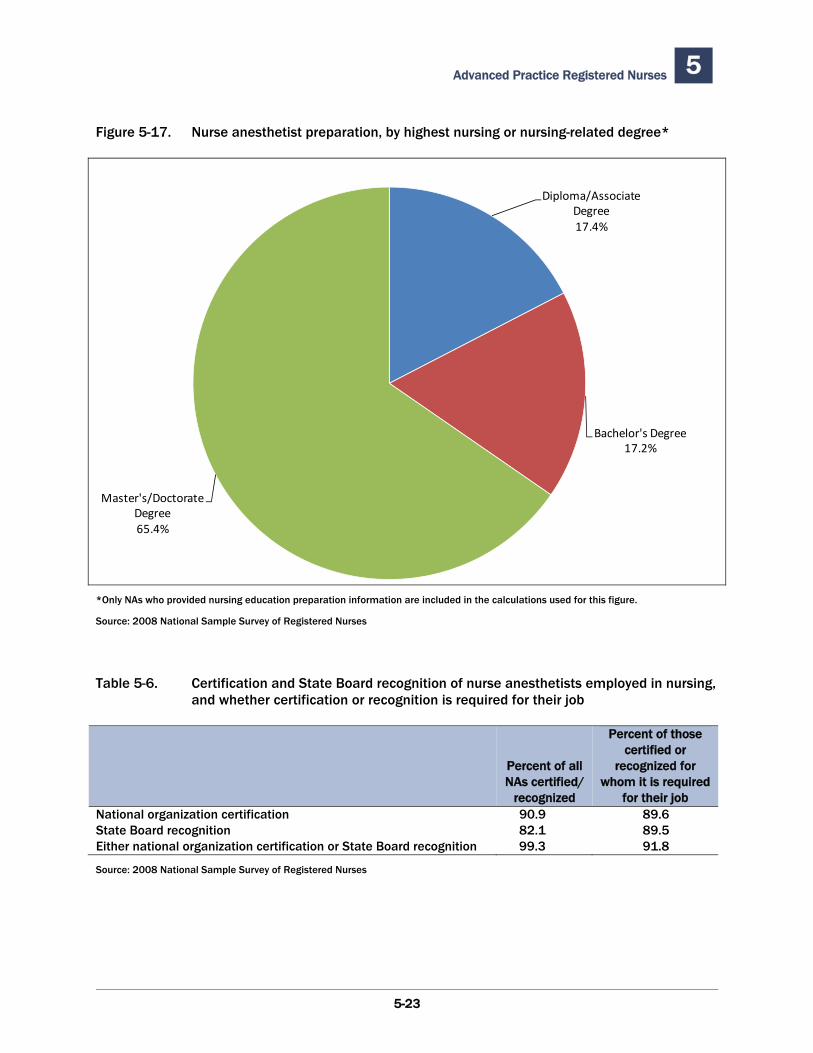
Advanced Practice Registered Nurses 5
5-23
Figure 5-17. Nurse anesthetist preparation, by highest nursing or nursing-related degree*
Diploma/Associate Degree17.4%
Bachelor's Degree17.2%
Master's/Doctorate Degree65.4%
*Only NAs who provided nursing education preparation information are included in the calculations used for this figure.
Source: 2008 National Sample Survey of Registered Nurses
Table 5-6. Certification and State Board recognition of nurse anesthetists employed in nursing, and whether certification or recognition is required for their job
Percent of those certified or
Percent of all recognized for NAs certified/ whom it is required
recognized for their job National organization certification 90.9 89.6State Board recognition 82.1 89.5Either national organization certification or State Board recognition 99.3 91.8
Source: 2008 National Sample Survey of Registered Nurses
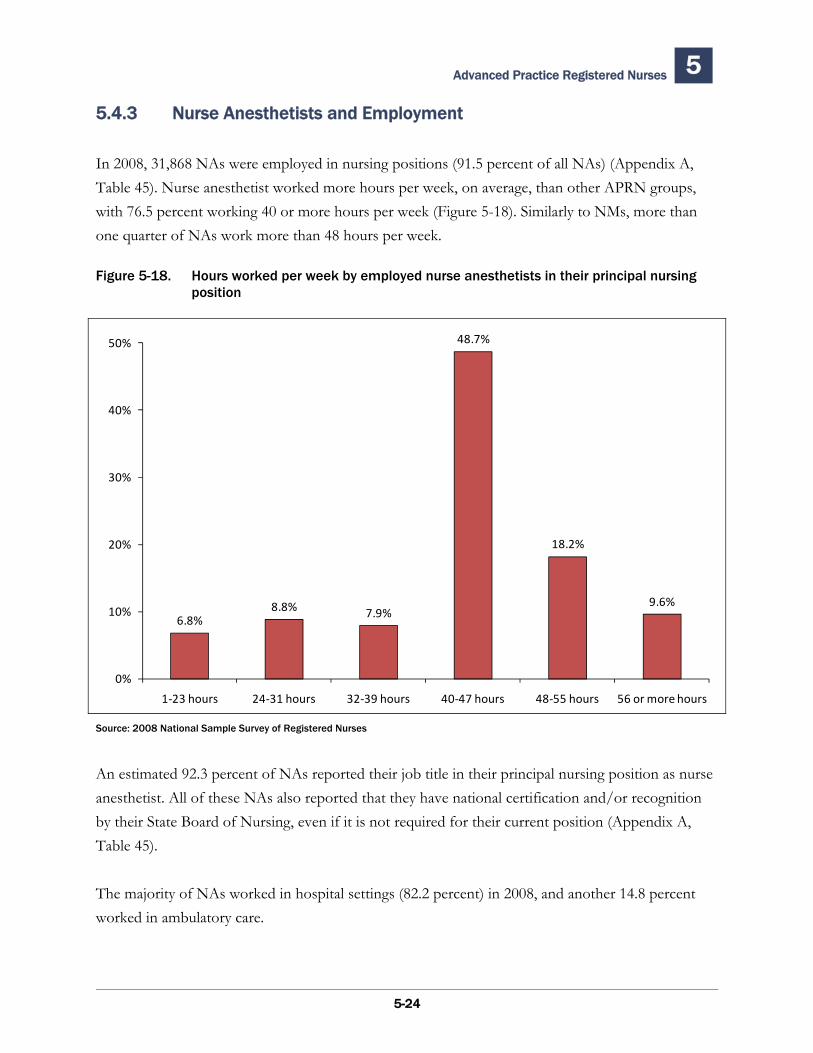
Advanced Practice Registered Nurses 5
5-24
5.4.3 Nurse Anesthetists and Employment
In 2008, 31,868 NAs were employed in nursing positions (91.5 percent of all NAs) (Appendix A, Table 45). Nurse anesthetist worked more hours per week, on average, than other APRN groups, with 76.5 percent working 40 or more hours per week (Figure 5-18). Similarly to NMs, more than one quarter of NAs work more than 48 hours per week.
Figure 5-18. Hours worked per week by employed nurse anesthetists in their principal nursing position
Source: 2008 National Sample Survey of Registered Nurses
An estimated 92.3 percent of NAs reported their job title in their principal nursing position as nurse anesthetist. All of these NAs also reported that they have national certification and/or recognition by their State Board of Nursing, even if it is not required for their current position (Appendix A, Table 45).
The majority of NAs worked in hospital settings (82.2 percent) in 2008, and another 14.8 percent worked in ambulatory care.
6.8%8.8% 7.9%
48.7%
18.2%
9.6%
0%
10%
20%
30%
40%
50%
1‐23 hours 24‐31 hours 32‐39 hours 40‐47 hours 48‐55 hours 56 or more hours
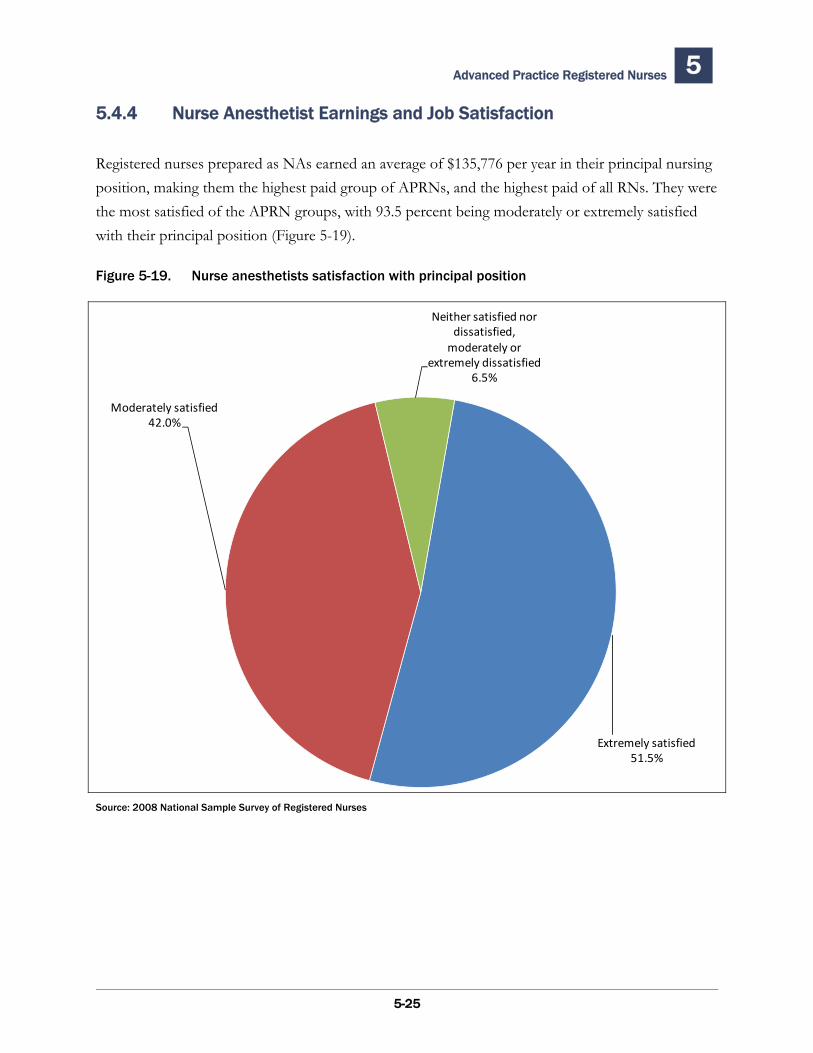
Advanced Practice Registered Nurses 5
5-25
5.4.4 Nurse Anesthetist Earnings and Job Satisfaction
Registered nurses prepared as NAs earned an average of $135,776 per year in their principal nursing position, making them the highest paid group of APRNs, and the highest paid of all RNs. They were the most satisfied of the APRN groups, with 93.5 percent being moderately or extremely satisfied with their principal position (Figure 5-19).
Figure 5-19. Nurse anesthetists satisfaction with principal position
Source: 2008 National Sample Survey of Registered Nurses
Extremely satisfied51.5%
Moderately satisfied42.0%
Neither satisfied nor dissatisfied, moderately or
extremely dissatisfied6.5%
Advanced Practice Registered Nurses 5
5-26
5.5 Clinical Nurse Specialists
The CNS role was conceived in 1954 and developed in acute care settings and mental health hospital settings. The first clinical specialist certification exam was launched in that year in psychiatric/mental health nursing. From the 1960s through the 1990s, clinical nurse specialist master’s education programs were developed in many schools of nursing. The CNS education and role focuses on improving clinical care, primarily in hospitals and extended care facilities by having an expert nurse (the CNS) who could help coordinate care for individuals, educate nursing personnel who provided direct care, and help identify and improve aspects of the health system organization that affected patients and nursing staff. CNSs have expertise in one or more clinical areas such as oncology, pediatrics, geriatrics, psychiatric/mental health, adult health, obstetrics, acute/critical care, and community health.9
CNSs have been required to have a master’s degree in nursing since the inception of this advanced practice field, and while national certification is available for many CNS specialties, certification is not required by State Boards of Nursing nor are most CNSs recognized in many States’ licensure regulations as APRNs. In some States, the job title of clinical nurse specialist is not legally limited to nurses who have CNS preparation or certification. Thus, some RNs who reported that their job title is clinical nurse specialist do not have a graduate degree and were not counted as a prepared CNS in this Survey.
5.5.1 Number of Clinical Nurse Specialists
In 2008, there were an estimated 59,242 nurses prepared as CNSs, some of whom also were prepared in other advanced specialties (Appendix A, Table 45). CNSs are the second largest group of APRNs. There was a marked decline of 18.3 percent in the number of CNSs between 2004 and 2008. However, over the same period there was an increase of 11.4 percent in the number of registered nurses prepared as both NPs and CNSs.
CNSs were older than other APRN groups in 2008, with 63.6 percent over 50 years old and only 18.2 percent under 45 years (Figure 5-20). Few CNSs, only 10.2 percent, are under the age of 40.
9 Montemuro, M.A. MHSc, RN. (1987). The Evolution of the Clinical Nurse Specialist: Response to the Challenge of Professional Nursing Practice.
Clinical Nurse Specialist, (1)3, pp. 106-110.
Advanced Practice Registered Nurses 5
5-27
5.5.2 Clinical Nurse Specialists and Education
CNS education focuses on how clinical care is affected by the patient’s personal and family characteristics and environment, the nursing personnel who provide care, and the health system organization. CNSs have been required to have a master’s degree in nursing since the inception of this advanced practice field. The vast majority of CNSs (92.8 percent) reported a master’s degree as their highest preparation (Figure 5-21). An additional 7.2 percent completed a doctorate degree for their CNS preparation. Most CNSs reported that their education program lasted 13 to 36 months (79.3 percent).
Many registered nurses prepared as CNSs do not have national certification or recognition from their State Board of Nursing; only 54.6 percent have recognition or certification from one or both. Less than 40 percent have national certification, and 41.6 percent have State Board recognition (Table 5-7). Of those with national certification, 39.5 percent said their certification was required for their job, while 47.2 percent of those with State Board recognition reported that their certification was required for their principal position.
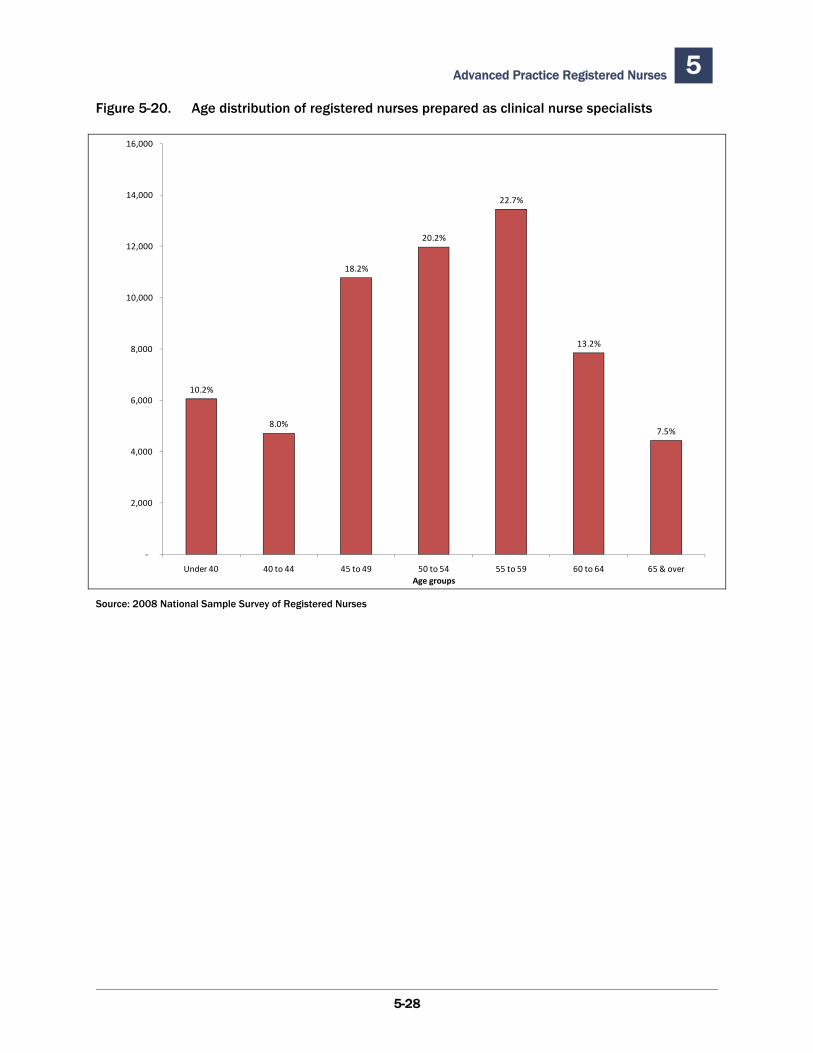
Advanced Practice Registered Nurses 5
5-28
Figure 5-20. Age distribution of registered nurses prepared as clinical nurse specialists
Source: 2008 National Sample Survey of Registered Nurses
10.2%
8.0%
18.2%
20.2%
22.7%
13.2%
7.5%
‐
2,000
4,000
6,000
8,000
10,000
12,000
14,000
16,000
Under 40 40 to 44 45 to 49 50 to 54 55 to 59 60 to 64 65 & overAge groups
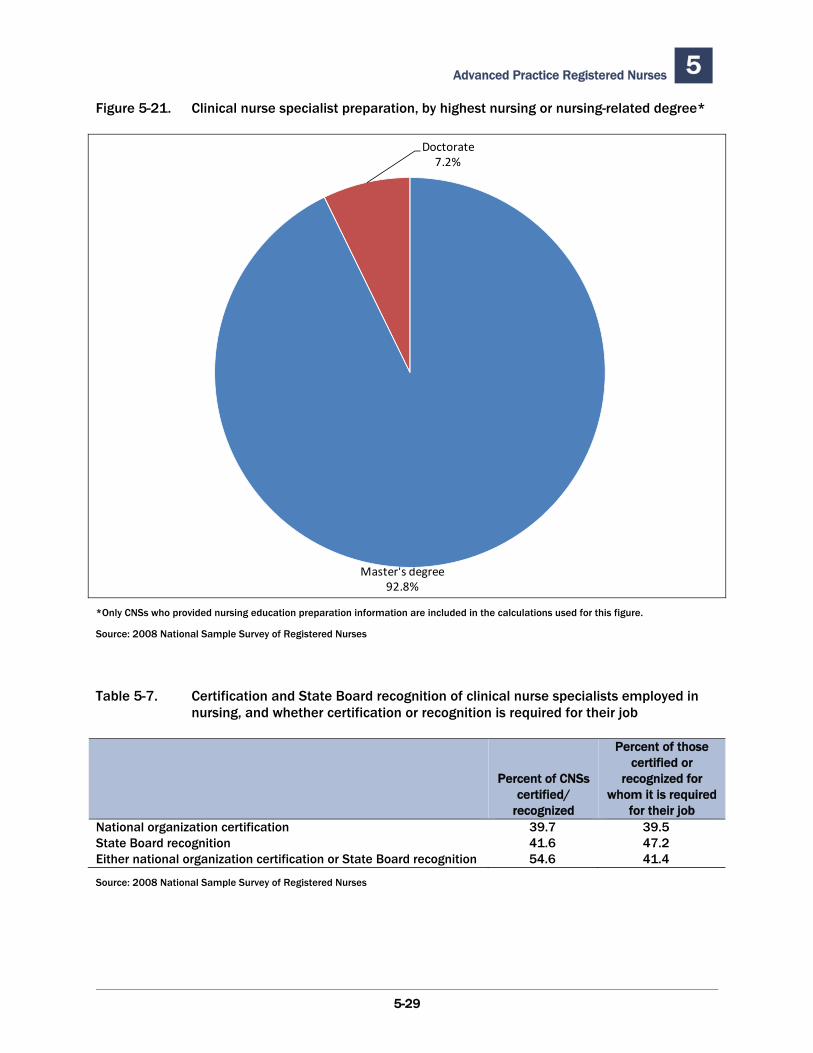
Advanced Practice Registered Nurses 5
5-29
Figure 5-21. Clinical nurse specialist preparation, by highest nursing or nursing-related degree*
Master's degree92.8%
Doctorate7.2%
*Only CNSs who provided nursing education preparation information are included in the calculations used for this figure.
Source: 2008 National Sample Survey of Registered Nurses
Table 5-7. Certification and State Board recognition of clinical nurse specialists employed in nursing, and whether certification or recognition is required for their job
Percent of those certified or
Percent of CNSs recognized for certified/ whom it is required
recognized for their job National organization certification 39.7 39.5State Board recognition 41.6 47.2Either national organization certification or State Board recognition 54.6 41.4
Source: 2008 National Sample Survey of Registered Nurses
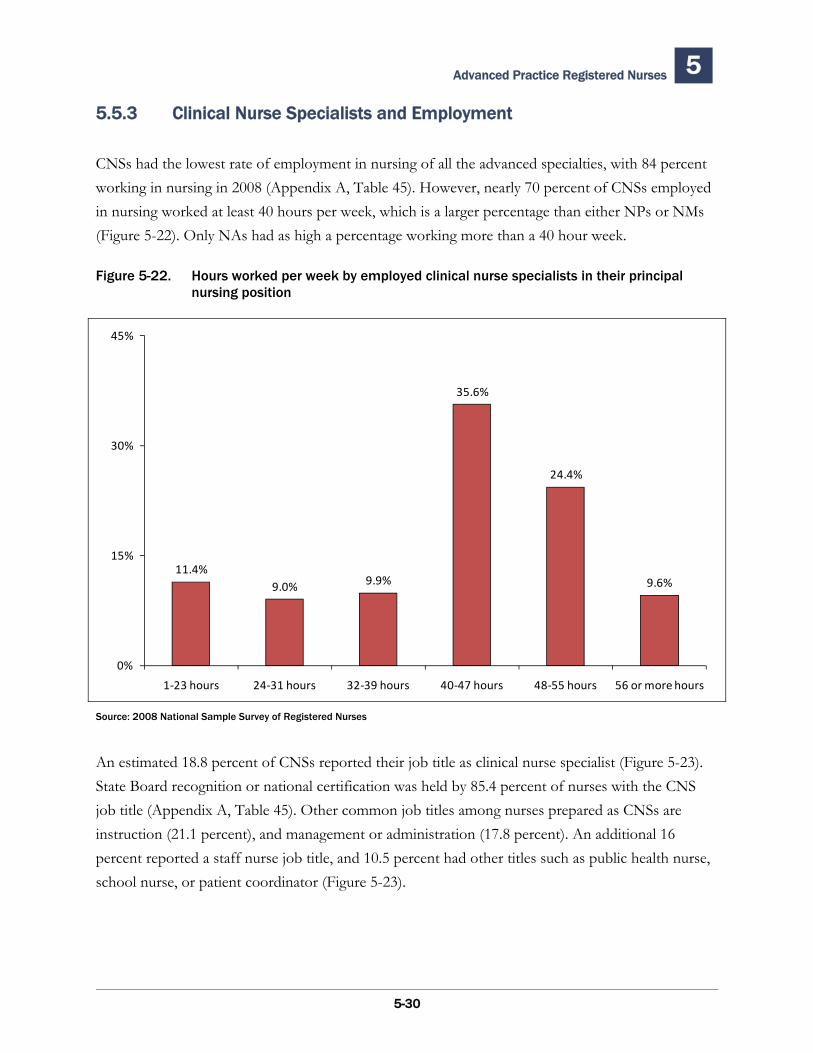
Advanced Practice Registered Nurses 5
5-30
5.5.3 Clinical Nurse Specialists and Employment
CNSs had the lowest rate of employment in nursing of all the advanced specialties, with 84 percent working in nursing in 2008 (Appendix A, Table 45). However, nearly 70 percent of CNSs employed in nursing worked at least 40 hours per week, which is a larger percentage than either NPs or NMs (Figure 5-22). Only NAs had as high a percentage working more than a 40 hour week.
Figure 5-22. Hours worked per week by employed clinical nurse specialists in their principal nursing position
Source: 2008 National Sample Survey of Registered Nurses
An estimated 18.8 percent of CNSs reported their job title as clinical nurse specialist (Figure 5-23). State Board recognition or national certification was held by 85.4 percent of nurses with the CNS job title (Appendix A, Table 45). Other common job titles among nurses prepared as CNSs are instruction (21.1 percent), and management or administration (17.8 percent). An additional 16 percent reported a staff nurse job title, and 10.5 percent had other titles such as public health nurse, school nurse, or patient coordinator (Figure 5-23).
11.4%9.0% 9.9%
35.6%
24.4%
9.6%
0%
15%
30%
45%
1‐23 hours 24‐31 hours 32‐39 hours 40‐47 hours 48‐55 hours 56 or more hours
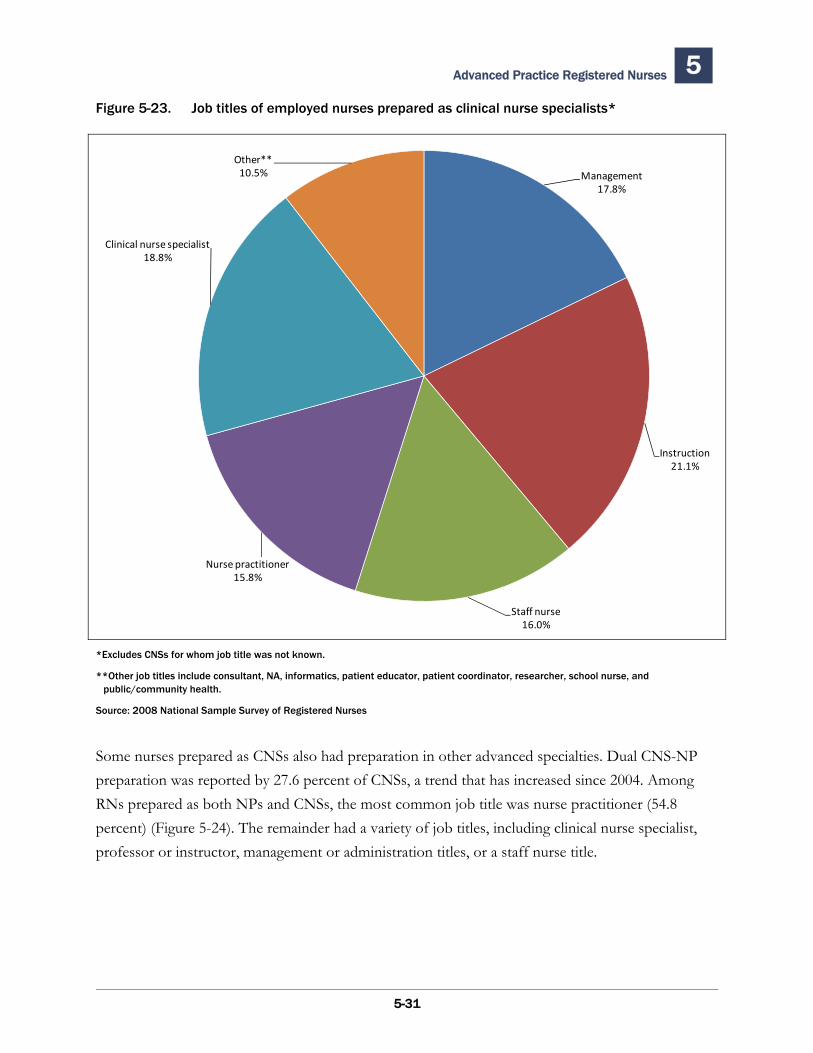
Advanced Practice Registered Nurses 5
5-31
Figure 5-23. Job titles of employed nurses prepared as clinical nurse specialists*
*Excludes CNSs for whom job title was not known.
**Other job titles include consultant, NA, informatics, patient educator, patient coordinator, researcher, school nurse, and public/community health.
Source: 2008 National Sample Survey of Registered Nurses
Some nurses prepared as CNSs also had preparation in other advanced specialties. Dual CNS-NP preparation was reported by 27.6 percent of CNSs, a trend that has increased since 2004. Among RNs prepared as both NPs and CNSs, the most common job title was nurse practitioner (54.8 percent) (Figure 5-24). The remainder had a variety of job titles, including clinical nurse specialist, professor or instructor, management or administration titles, or a staff nurse title.
Management17.8%
Instruction21.1%
Staff nurse16.0%
Nurse practitioner15.8%
Clinical nurse specialist18.8%
Other**10.5%
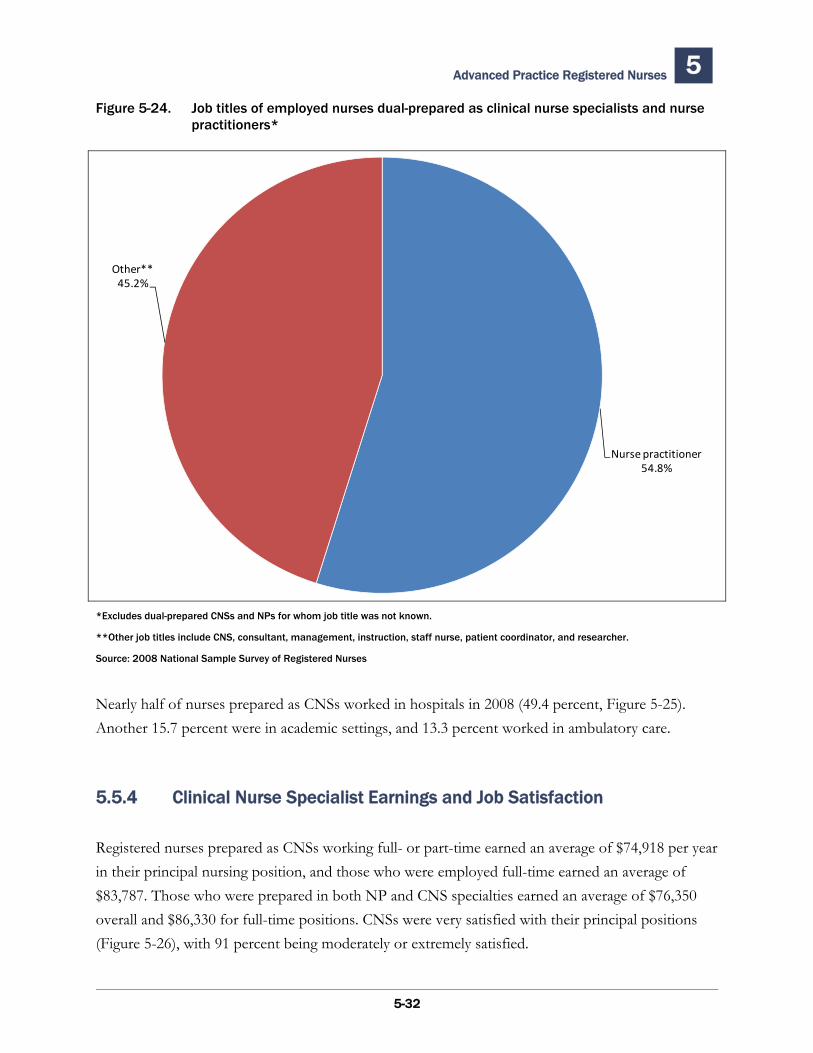
Advanced Practice Registered Nurses 5
5-32
Figure 5-24. Job titles of employed nurses dual-prepared as clinical nurse specialists and nurse practitioners*
*Excludes dual-prepared CNSs and NPs for whom job title was not known.
**Other job titles include CNS, consultant, management, instruction, staff nurse, patient coordinator, and researcher.
Source: 2008 National Sample Survey of Registered Nurses
Nearly half of nurses prepared as CNSs worked in hospitals in 2008 (49.4 percent, Figure 5-25). Another 15.7 percent were in academic settings, and 13.3 percent worked in ambulatory care.
5.5.4 Clinical Nurse Specialist Earnings and Job Satisfaction
Registered nurses prepared as CNSs working full- or part-time earned an average of $74,918 per year in their principal nursing position, and those who were employed full-time earned an average of $83,787. Those who were prepared in both NP and CNS specialties earned an average of $76,350 overall and $86,330 for full-time positions. CNSs were very satisfied with their principal positions (Figure 5-26), with 91 percent being moderately or extremely satisfied.
Nurse practitioner54.8%
Other**45.2%
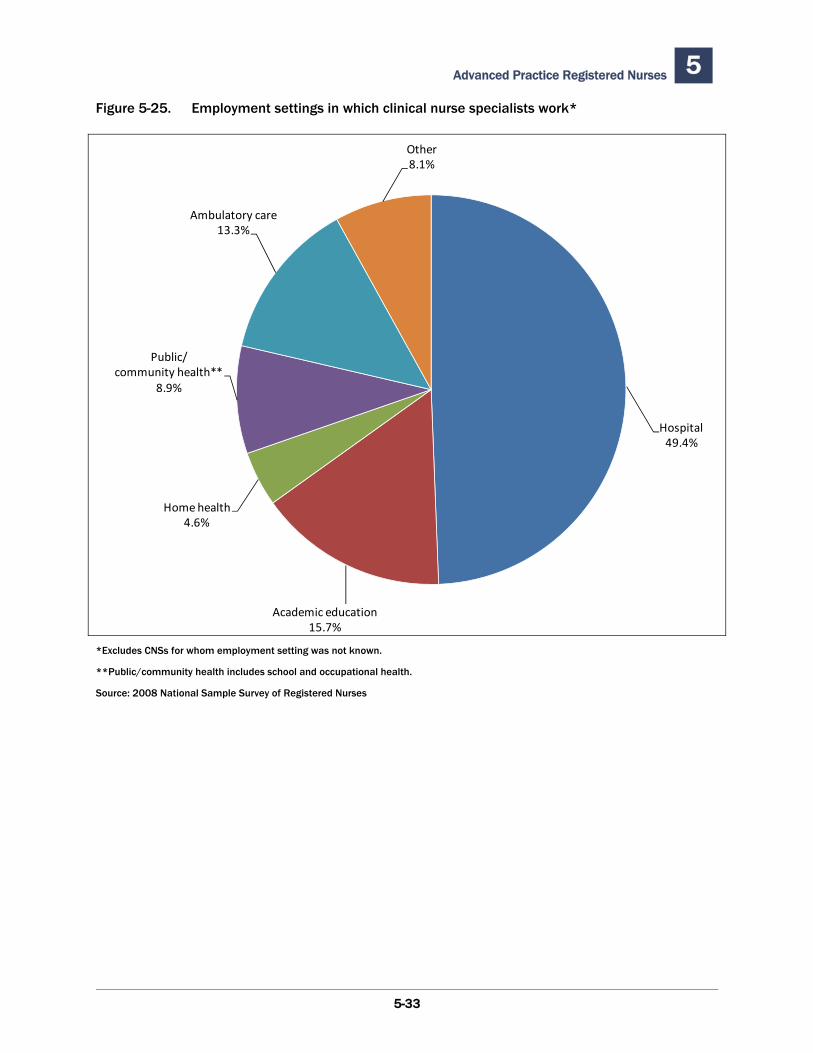
Advanced Practice Registered Nurses 5
5-33
Figure 5-25. Employment settings in which clinical nurse specialists work*
*Excludes CNSs for whom employment setting was not known.
**Public/community health includes school and occupational health.
Source: 2008 National Sample Survey of Registered Nurses
Hospital 49.4%
Academic education15.7%
Home health4.6%
Public/community health**
8.9%
Ambulatory care13.3%
Other8.1%
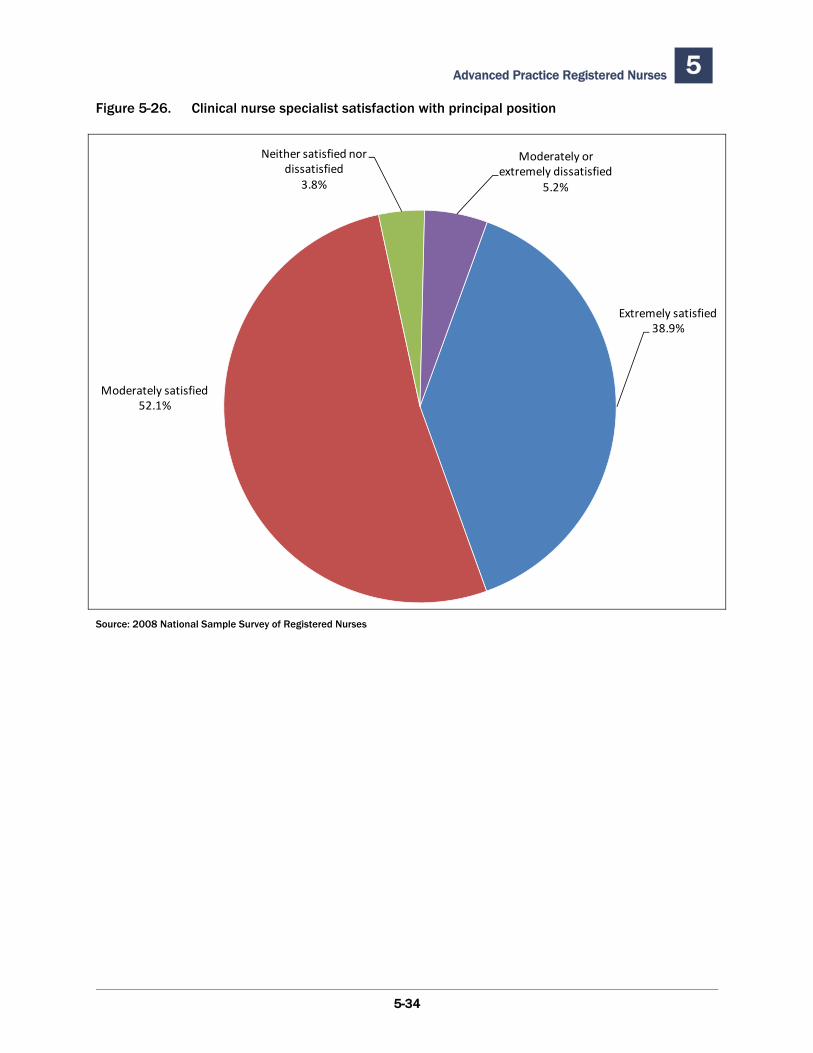
5 Advanced Practice Registered Nurses Figure 5-26. Clinical nurse specialist satisfaction with principal position
Source: 2008 National Sample Survey of Registered Nurses
Extremely satisfied38.9%
Moderately satisfied52.1%
Neither satisfied nor dissatisfied
3.8%
Moderately or extremely dissatisfied
5.2%
5-34
6.1 Introduction
This chapter examines the characteristics of RNs who do not work in nursing and their plans regarding future nursing work. An estimated 466,564 licensed RNs (just over 15 percent of all licensed RNs) were not employed in nursing in 2008. Nurses choose to not work in nursing for a variety of reasons. Some are retired but may choose to retain a nursing license for a variety of reasons including potential future employment or because they feel personally connected to the profession and want to retain the link of licensure. Others stop working to attend to family needs, because of illness, to receive further education, or for other personal reasons. Still others are not working in nursing, either temporarily or permanently, because they are unhappy with some aspect of the profession.
6.2 Demographics of Nurses Not Working in Nursing
6.2.1 Nurses Not Working in Nursing and Age
Nearly one-third of RNs who were not working in nursing in 2008 were 65 years of age or older; almost half were 60 years of age or older (Figure 6-1). This suggests that the majority of nurses who have retained licenses but are no longer working may have left the workforce for age-related reasons.
A disproportionate percentage of licensed RNs aged 50 to 54 have not been working in nursing for 11 to 15 years (17.6 percent of RNs out of work this long) or for 16 or more years (24.3 percent) (Appendix A, Table 48). These individuals left nursing by 1997 or earlier, when they were in their 20s and 30s. During the mid-1990s, RN employment rates were somewhat lower, and the percentage of nurses employed in hospitals declined. These data suggest that nurses who were under age 40 at that time, left the profession and never returned to nursing work.
Nurses Who Do Not Work in Nursing 6
6-1
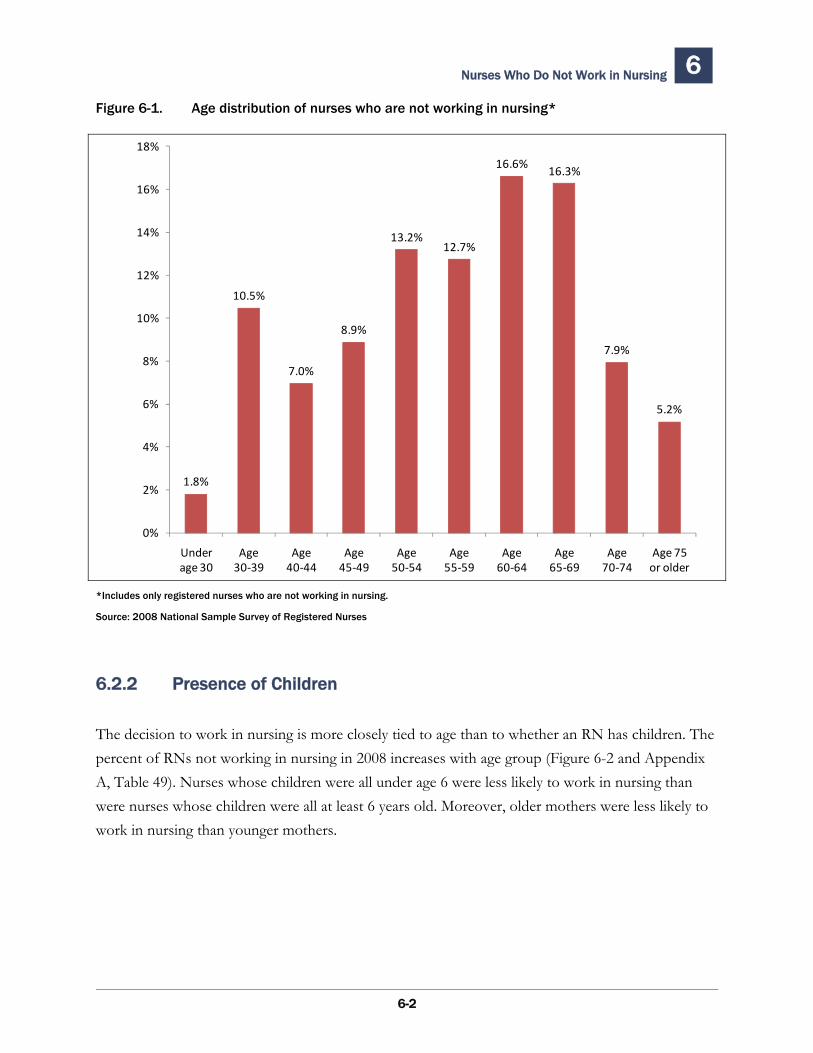
Nurses Who Do Not Work in Nursing 6
6-2
Figure 6-1. Age distribution of nurses who are not working in nursing*
*Includes only registered nurses who are not working in nursing.
Source: 2008 National Sample Survey of Registered Nurses
6.2.2 Presence of Children
The decision to work in nursing is more closely tied to age than to whether an RN has children. The percent of RNs not working in nursing in 2008 increases with age group (Figure 6-2 and Appendix A, Table 49). Nurses whose children were all under age 6 were less likely to work in nursing than were nurses whose children were all at least 6 years old. Moreover, older mothers were less likely to work in nursing than younger mothers.
1.8%
10.5%
7.0%
8.9%
13.2%12.7%
16.6%16.3%
7.9%
5.2%
0%
2%
4%
6%
8%
10%
12%
14%
16%
18%
Under age 30
Age 30‐39
Age 40‐44
Age 45‐49
Age 50‐54
Age 55‐59
Age 60‐64
Age 65‐69
Age 70‐74
Age 75 or older
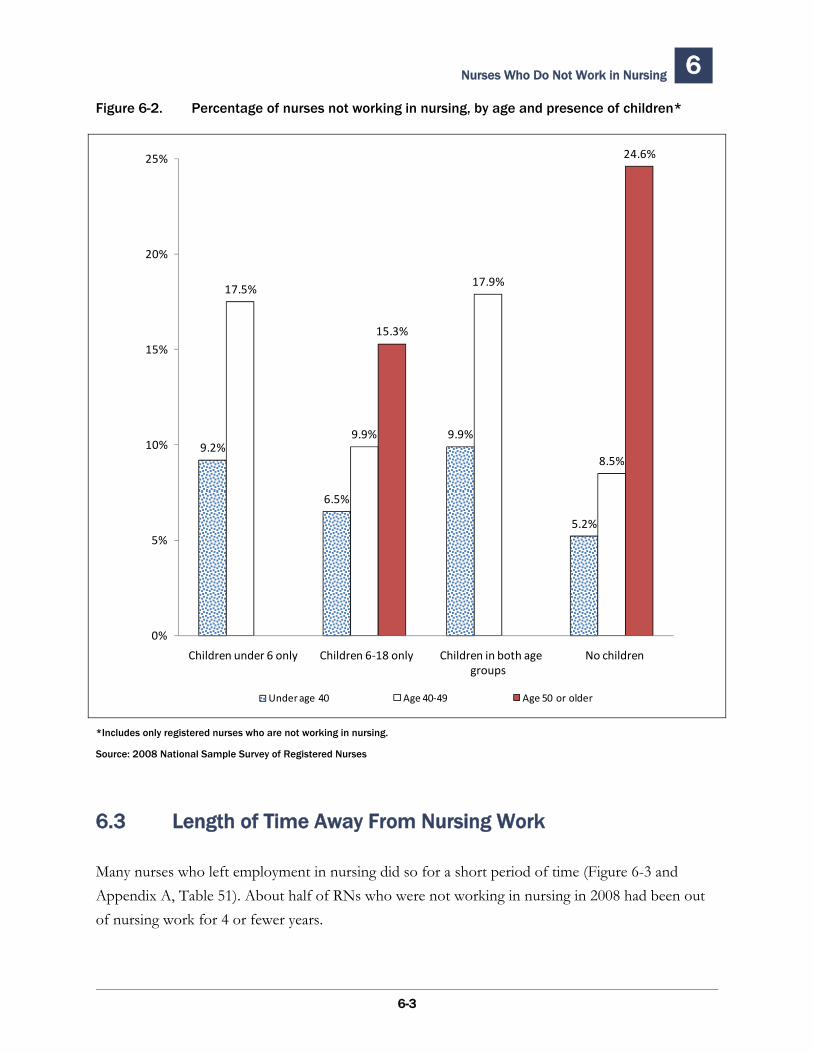
Nurses Who Do Not Work in Nursing 6
6-3
Figure 6-2. Percentage of nurses not working in nursing, by age and presence of children*
*Includes only registered nurses who are not working in nursing.
Source: 2008 National Sample Survey of Registered Nurses
6.3 Length of Time Away From Nursing Work
Many nurses who left employment in nursing did so for a short period of time (Figure 6-3 and Appendix A, Table 51). About half of RNs who were not working in nursing in 2008 had been out of nursing work for 4 or fewer years.
9.2%
6.5%
9.9%
5.2%
17.5%
9.9%
17.9%
8.5%
15.3%
24.6%
0%
5%
10%
15%
20%
25%
Children under 6 only Children 6‐18 only Children in both age groups
No children
Under age 40 Age 40‐49 Age 50 or older
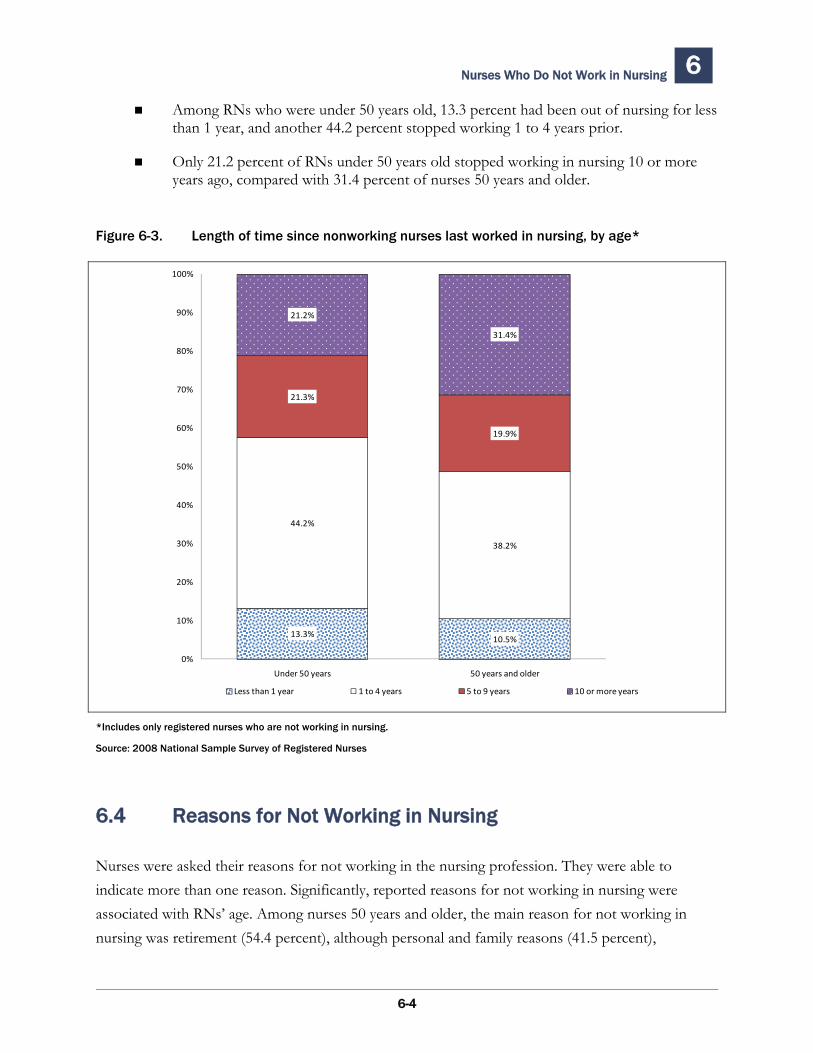
Nurses Who Do Not Work in Nursing 6
6-4
Among RNs who were under 50 years old, 13.3 percent had been out of nursing for less than 1 year, and another 44.2 percent stopped working 1 to 4 years prior.
Only 21.2 percent of RNs under 50 years old stopped working in nursing 10 or more years ago, compared with 31.4 percent of nurses 50 years and older.
Figure 6-3. Length of time since nonworking nurses last worked in nursing, by age*
*Includes only registered nurses who are not working in nursing.
Source: 2008 National Sample Survey of Registered Nurses
6.4 Reasons for Not Working in Nursing
Nurses were asked their reasons for not working in the nursing profession. They were able to indicate more than one reason. Significantly, reported reasons for not working in nursing were associated with RNs’ age. Among nurses 50 years and older, the main reason for not working in nursing was retirement (54.4 percent), although personal and family reasons (41.5 percent),
13.3%10.5%
44.2%
38.2%
21.3%
19.9%
21.2%
31.4%
0%
10%
20%
30%
40%
50%
60%
70%
80%
90%
100%
Under 50 years 50 years and older
Less than 1 year 1 to 4 years 5 to 9 years 10 or more years
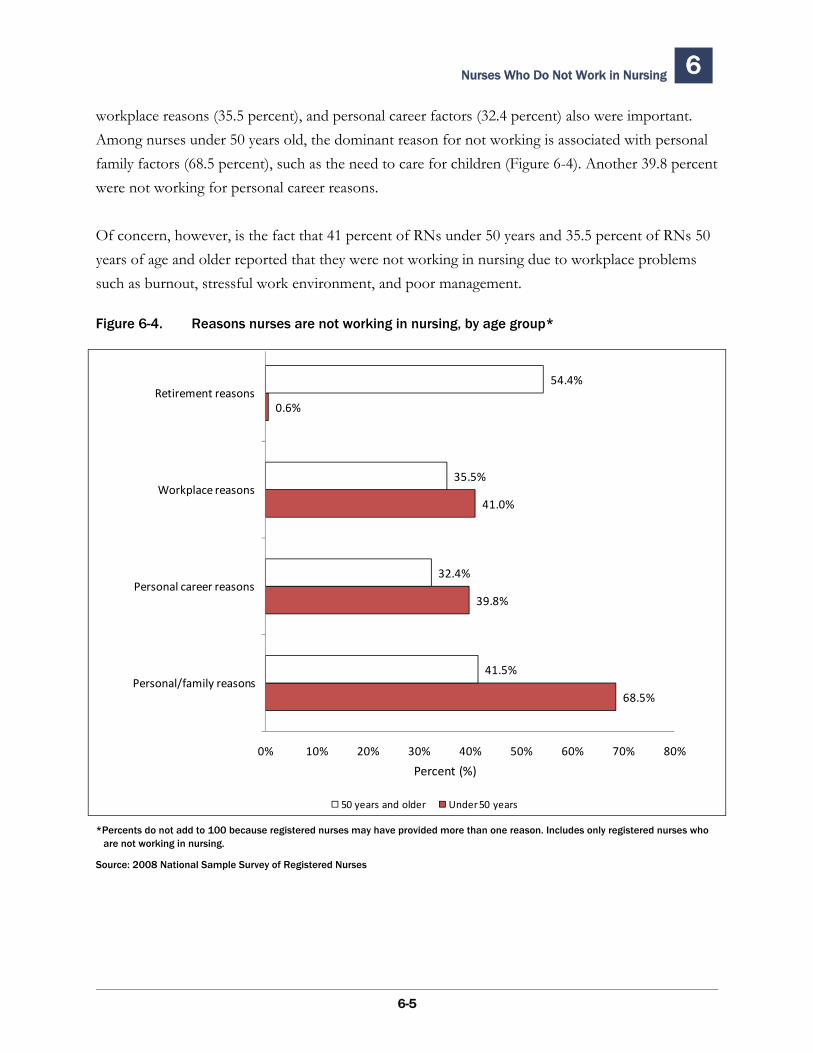
Nurses Who Do Not Work in Nursing 6
6-5
workplace reasons (35.5 percent), and personal career factors (32.4 percent) also were important. Among nurses under 50 years old, the dominant reason for not working is associated with personal family factors (68.5 percent), such as the need to care for children (Figure 6-4). Another 39.8 percent were not working for personal career reasons.
Of concern, however, is the fact that 41 percent of RNs under 50 years and 35.5 percent of RNs 50 years of age and older reported that they were not working in nursing due to workplace problems such as burnout, stressful work environment, and poor management.
Figure 6-4. Reasons nurses are not working in nursing, by age group*
*Percents do not add to 100 because registered nurses may have provided more than one reason. Includes only registered nurses who are not working in nursing.
Source: 2008 National Sample Survey of Registered Nurses
68.5%
39.8%
41.0%
0.6%
41.5%
32.4%
35.5%
54.4%
0% 10% 20% 30% 40% 50% 60% 70% 80%
Personal/family reasons
Personal career reasons
Workplace reasons
Retirement reasons
50 years and older Under 50 years
Percent (%)
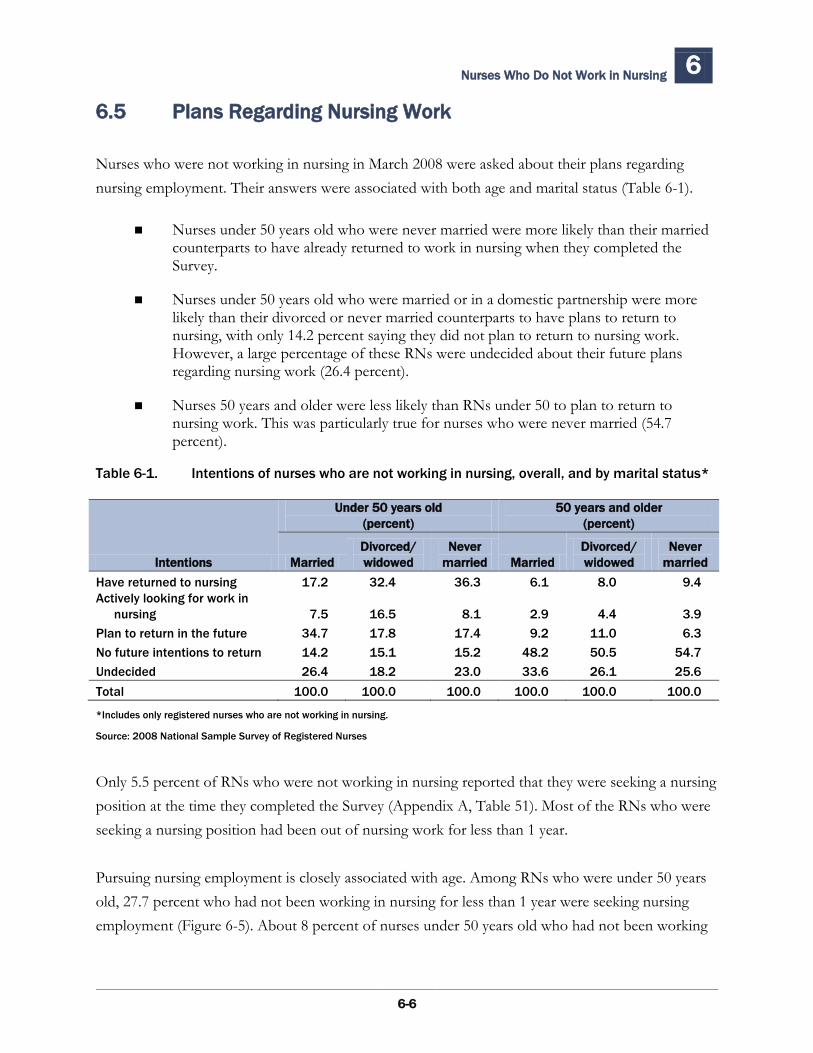
Nurses Who Do Not Work in Nursing 6
6-6
6.5 Plans Regarding Nursing Work
Nurses who were not working in nursing in March 2008 were asked about their plans regarding nursing employment. Their answers were associated with both age and marital status (Table 6-1).
Nurses under 50 years old who were never married were more likely than their married counterparts to have already returned to work in nursing when they completed the Survey.
Nurses under 50 years old who were married or in a domestic partnership were more likely than their divorced or never married counterparts to have plans to return to nursing, with only 14.2 percent saying they did not plan to return to nursing work. However, a large percentage of these RNs were undecided about their future plans regarding nursing work (26.4 percent).
Nurses 50 years and older were less likely than RNs under 50 to plan to return to nursing work. This was particularly true for nurses who were never married (54.7 percent).
Table 6-1. Intentions of nurses who are not working in nursing, overall, and by marital status*
Intentions
Under 50 years old (percent)
50 years and older (percent)
Married Divorced/ widowed
Never married Married
Divorced/ widowed
Never married
Have returned to nursing 17.2 32.4 36.3 6.1 8.0 9.4 Actively looking for work in
nursing 7.5 16.5 8.1 2.9 4.4 3.9 Plan to return in the future 34.7 17.8 17.4 9.2 11.0 6.3 No future intentions to return 14.2 15.1 15.2 48.2 50.5 54.7 Undecided 26.4 18.2 23.0 33.6 26.1 25.6 Total 100.0 100.0 100.0 100.0 100.0 100.0
*Includes only registered nurses who are not working in nursing.
Source: 2008 National Sample Survey of Registered Nurses
Only 5.5 percent of RNs who were not working in nursing reported that they were seeking a nursing position at the time they completed the Survey (Appendix A, Table 51). Most of the RNs who were seeking a nursing position had been out of nursing work for less than 1 year. Pursuing nursing employment is closely associated with age. Among RNs who were under 50 years old, 27.7 percent who had not been working in nursing for less than 1 year were seeking nursing employment (Figure 6-5). About 8 percent of nurses under 50 years old who had not been working
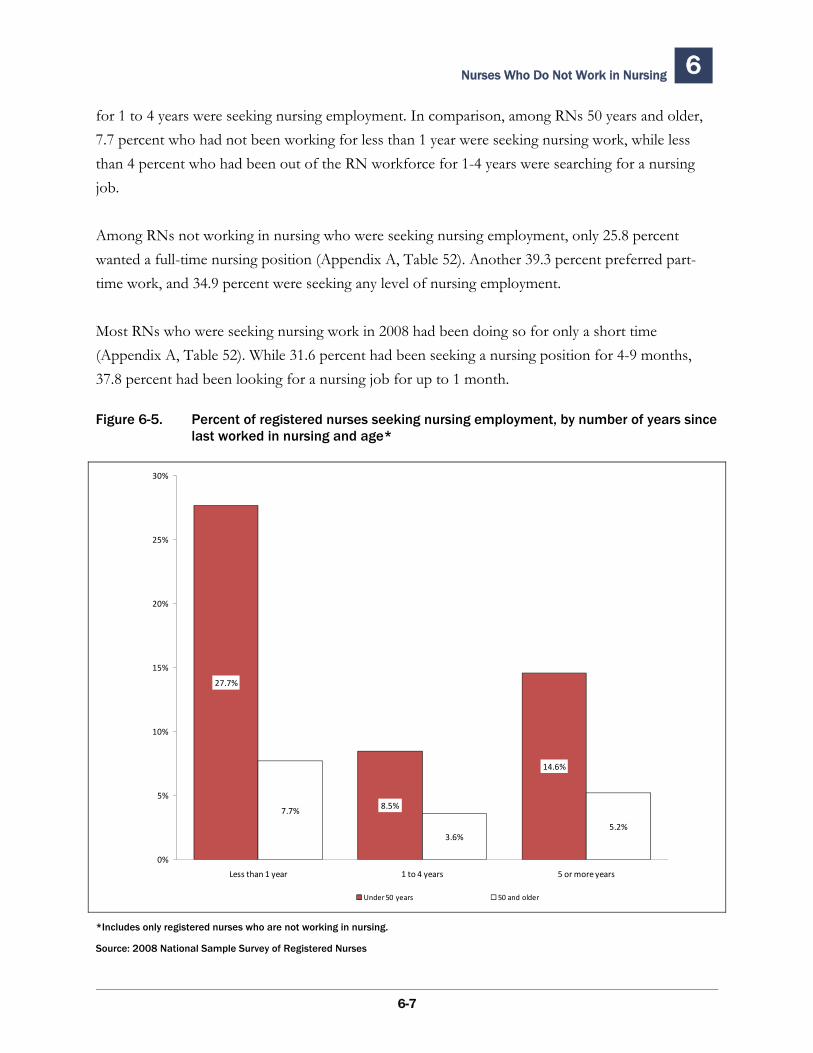
Nurses Who Do Not Work in Nursing 6
6-7
for 1 to 4 years were seeking nursing employment. In comparison, among RNs 50 years and older, 7.7 percent who had not been working for less than 1 year were seeking nursing work, while less than 4 percent who had been out of the RN workforce for 1-4 years were searching for a nursing job.
Among RNs not working in nursing who were seeking nursing employment, only 25.8 percent wanted a full-time nursing position (Appendix A, Table 52). Another 39.3 percent preferred part-time work, and 34.9 percent were seeking any level of nursing employment.
Most RNs who were seeking nursing work in 2008 had been doing so for only a short time (Appendix A, Table 52). While 31.6 percent had been seeking a nursing position for 4-9 months, 37.8 percent had been looking for a nursing job for up to 1 month.
Figure 6-5. Percent of registered nurses seeking nursing employment, by number of years since last worked in nursing and age*
*Includes only registered nurses who are not working in nursing.
Source: 2008 National Sample Survey of Registered Nurses
27.7%
8.5%
14.6%
7.7%
3.6%5.2%
0%
5%
10%
15%
20%
25%
30%
Less than 1 year 1 to 4 years 5 or more years
Under 50 years 50 and older

Nurses Who Do Not Work in Nursing 6
6-8
This page deliberately blank.
7.1 Introduction
This chapter examines the age, gender, race/ethnicity, language competency, and family characteristics of registered nurses, and how these factors are associated with employment. It also presents the geographic distribution of RNs. Nursing employment continues to vary significantly across the country, with a two-fold difference in the employed RN-to-population ratio among the States. Geographic variation occurs in the employment setting, educational level, racial/ethnic minority representation, and median earnings of employed RNs. While still a workforce of primarily White, non-Hispanic women, the population of RNs in the United States continues to become more diverse with an increase of men and racial/ethnic minority groups among new entrants to the workforce.
7.2 Registered Nurses and Age
In 2008, for the first time in the past three decades, the rate of aging of the nursing workforce slowed (Figure 3-3). In 1988, half of the working population of RNs was less than 38 years of age (Table 7-1 and Appendix A, Table 1). By 2004 the median age rose to 46 years. In 2008, however, the median age did not increase but remained steady at 46 years of age.
This plateau in the trend toward aging of the RN workforce was the consequence of an increase in employed RNs under 30 years of age—the first increase seen in this age group since the inaugural NSSRN in 1977—which helped to offset the steady rise in the number of employed RNs age 60 and older (Figure 7-1 and Appendix A, Table 1). The increase in the youngest cohort of RNs is the result of rapidly rising enrollments in schools of nursing, in particular in bachelor’s nursing programs, whose student population is younger than that of other initial nursing education programs. This rising trend in BSN enrollment started a few years earlier, and graduates from it are now entering the workforce.
Demographics of the Registered Nurse Workforce 7
7-1
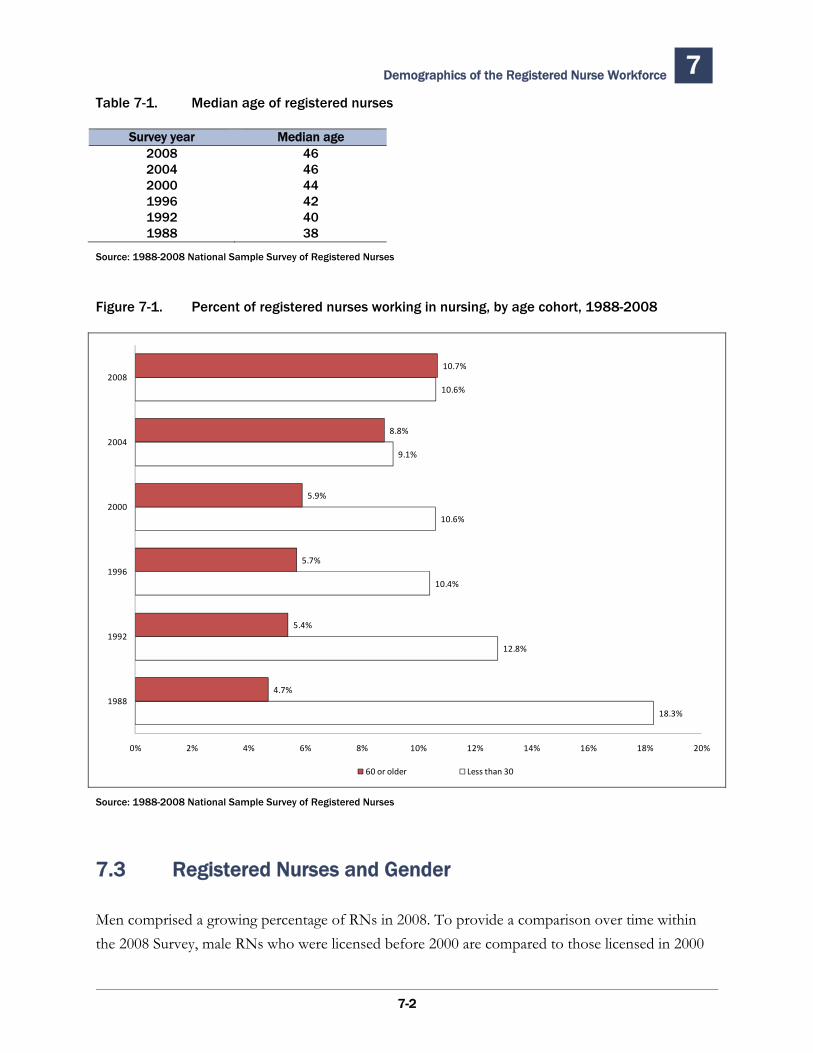
Demographics of the Registered Nurse Workforce 7 Table 7-1. Median age of registered nurses
Survey year Median age2008 46 2004 46 2000 44 1996 42 1992 40 1988 38
Source: 1988-2008 National Sample Survey of Registered Nurses
Figure 7-1. Percent of registered nurses working in nursing, by age cohort, 1988-2008
18.3%
12.8%
10.4%
10.6%
9.1%
10.6%
4.7%
5.4%
5.7%
5.9%
8.8%
10.7%
0% 2% 4% 6% 8% 10% 12% 14% 16% 18% 20%
1988
1992
1996
2000
2004
2008
60 or older Less than 30
Source: 1988-2008 National Sample Survey of Registered Nurses
7.3 Registered Nurses and Gender
Men comprised a growing percentage of RNs in 2008. To provide a comparison over time within the 2008 Survey, male RNs who were licensed before 2000 are compared to those licensed in 2000
7-2
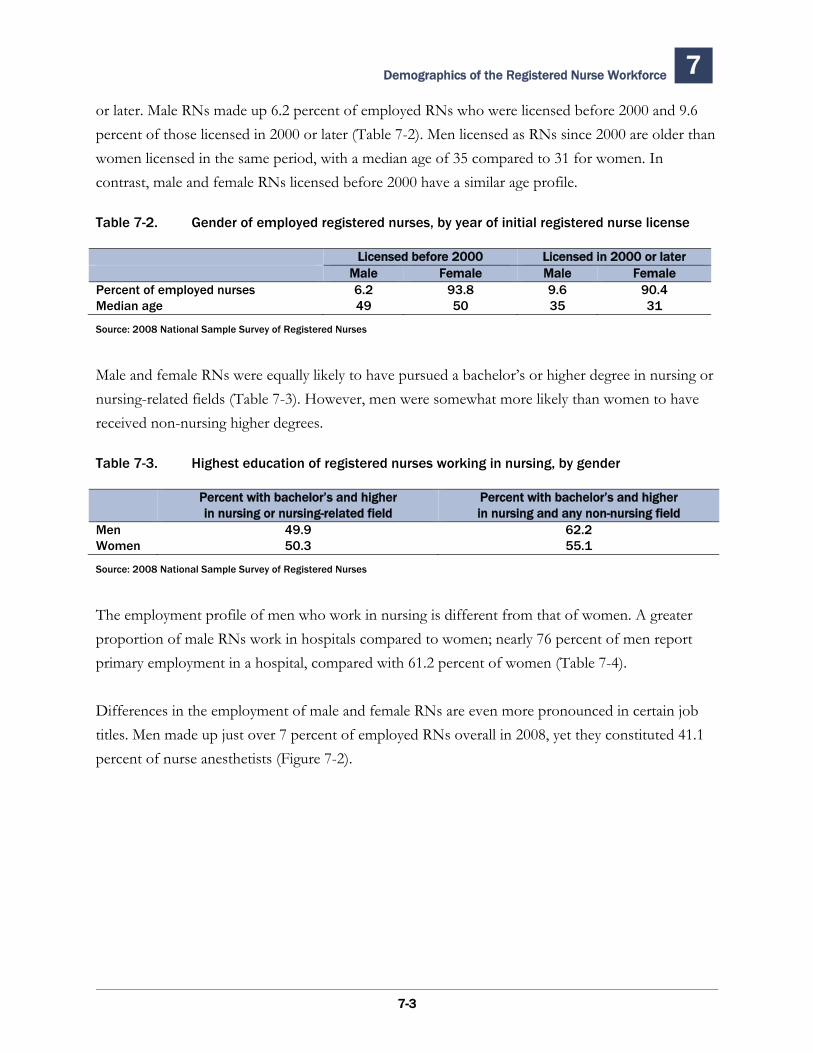
Demographics of the Registered Nurse Workforce 7
or later. Male RNs made up 6.2 percent of employed RNs who were licensed before 2000 and 9.6 percent of those licensed in 2000 or later (Table 7-2). Men licensed as RNs since 2000 are older than women licensed in the same period, with a median age of 35 compared to 31 for women. In contrast, male and female RNs licensed before 2000 have a similar age profile.
Table 7-2. Gender of employed registered nurses, by year of initial registered nurse license
Licensed before 2000 Licensed in 2000 or laterMale Female Male Female
Percent of employed nurses 6.2 93.8 9.6 90.4Median age 49 50 35 31
Source: 2008 National Sample Survey of Registered Nurses
Male and female RNs were equally likely to have pursued a bachelor’s or higher degree in nursing or nursing-related fields (Table 7-3). However, men were somewhat more likely than women to have received non-nursing higher degrees.
Table 7-3. Highest education of registered nurses working in nursing, by gender
Percent with bachelor’s and higher Percent with bachelor’s and higher in nursing or nursing-related field in nursing and any non-nursing field
Men 49.9 62.2Women 50.3 55.1
Source: 2008 National Sample Survey of Registered Nurses
The employment profile of men who work in nursing is different from that of women. A greater proportion of male RNs work in hospitals compared to women; nearly 76 percent of men report primary employment in a hospital, compared with 61.2 percent of women (Table 7-4).
Differences in the employment of male and female RNs are even more pronounced in certain job titles. Men made up just over 7 percent of employed RNs overall in 2008, yet they constituted 41.1 percent of nurse anesthetists (Figure 7-2).
7-3
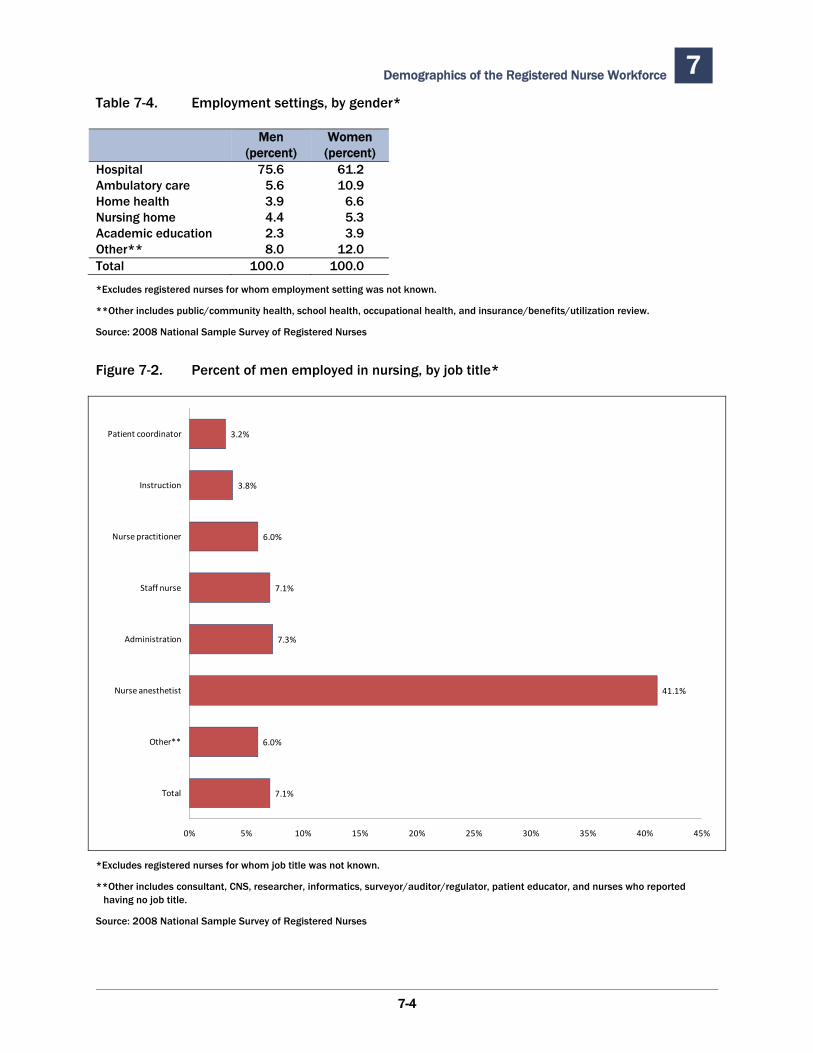
Demographics of the Registered Nurse Workforce 7 Table 7-4. Employment settings, by gender*
Men Women(percent) (percent)
Hospital 75.6 61.2Ambulatory care 5.6 10.9Home health 3.9 6.6Nursing home 4.4 5.3Academic education 2.3 3.9Other** 8.0 12.0Total 100.0 100.0
*Excludes registered nurses for whom employment setting was not known.
**Other includes public/community health, school health, occupational health, and insurance/benefits/utilization review.
Source: 2008 National Sample Survey of Registered Nurses
Figure 7-2. Percent of men employed in nursing, by job title*
7.1%
6.0%
41.1%
7.3%
7.1%
6.0%
3.8%
3.2%
0% 5% 10% 15% 20% 25% 30% 35% 40% 45%
Total
Other**
Nurse anesthetist
Administration
Staff nurse
Nurse practitioner
Instruction
Patient coordinator
*Excludes registered nurses for whom job title was not known.
**Other includes consultant, CNS, researcher, informatics, surveyor/auditor/regulator, patient educator, and nurses who reported having no job title.
Source: 2008 National Sample Survey of Registered Nurses
7-4
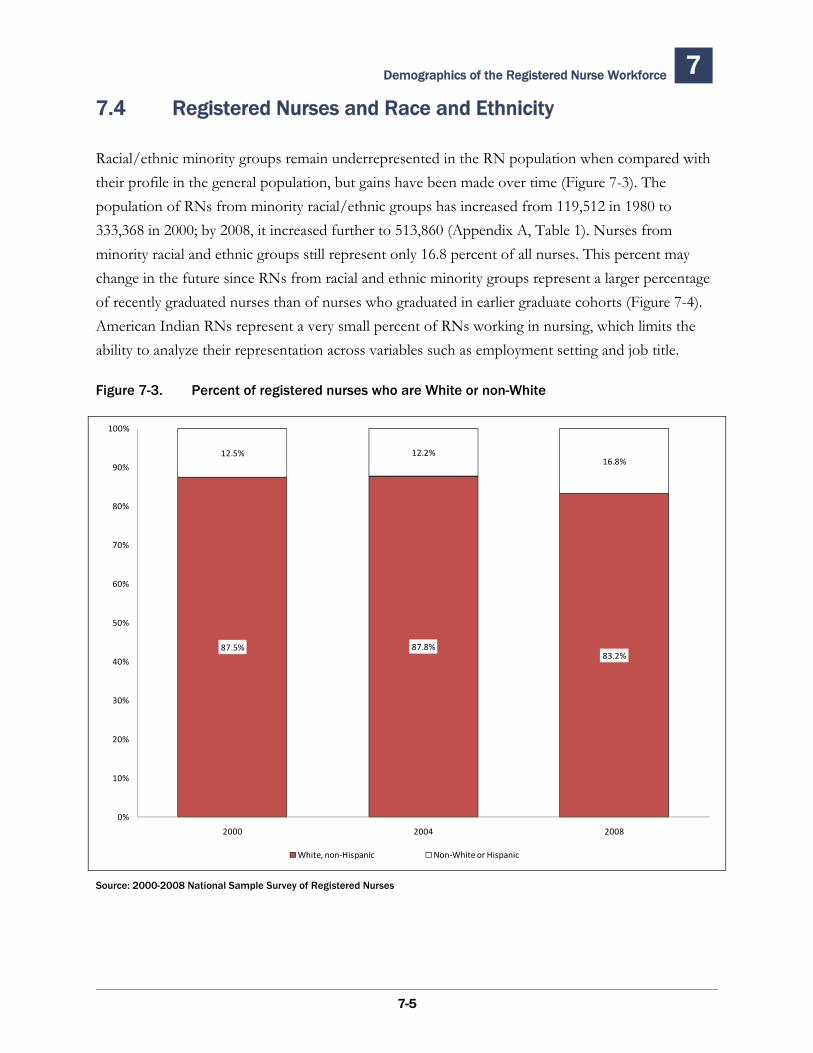
Demographics of the Registered Nurse Workforce 7
7.4 Registered Nurses and Race and Ethnicity
Racial/ethnic minority groups remain underrepresented in the RN population when compared with their profile in the general population, but gains have been made over time (Figure 7-3). The population of RNs from minority racial/ethnic groups has increased from 119,512 in 1980 to 333,368 in 2000; by 2008, it increased further to 513,860 (Appendix A, Table 1). Nurses from minority racial and ethnic groups still represent only 16.8 percent of all nurses. This percent may change in the future since RNs from racial and ethnic minority groups represent a larger percentage of recently graduated nurses than of nurses who graduated in earlier graduate cohorts (Figure 7-4). American Indian RNs represent a very small percent of RNs working in nursing, which limits the ability to analyze their representation across variables such as employment setting and job title.
Figure 7-3. Percent of registered nurses who are White or non-White
87.5% 87.8%83.2%
12.5% 12.2%16.8%
0%
10%
20%
30%
40%
50%
60%
70%
80%
90%
100%
2000 2004 2008
White, non‐Hispanic Non‐White or Hispanic
Source: 2000-2008 National Sample Survey of Registered Nurses
7-5
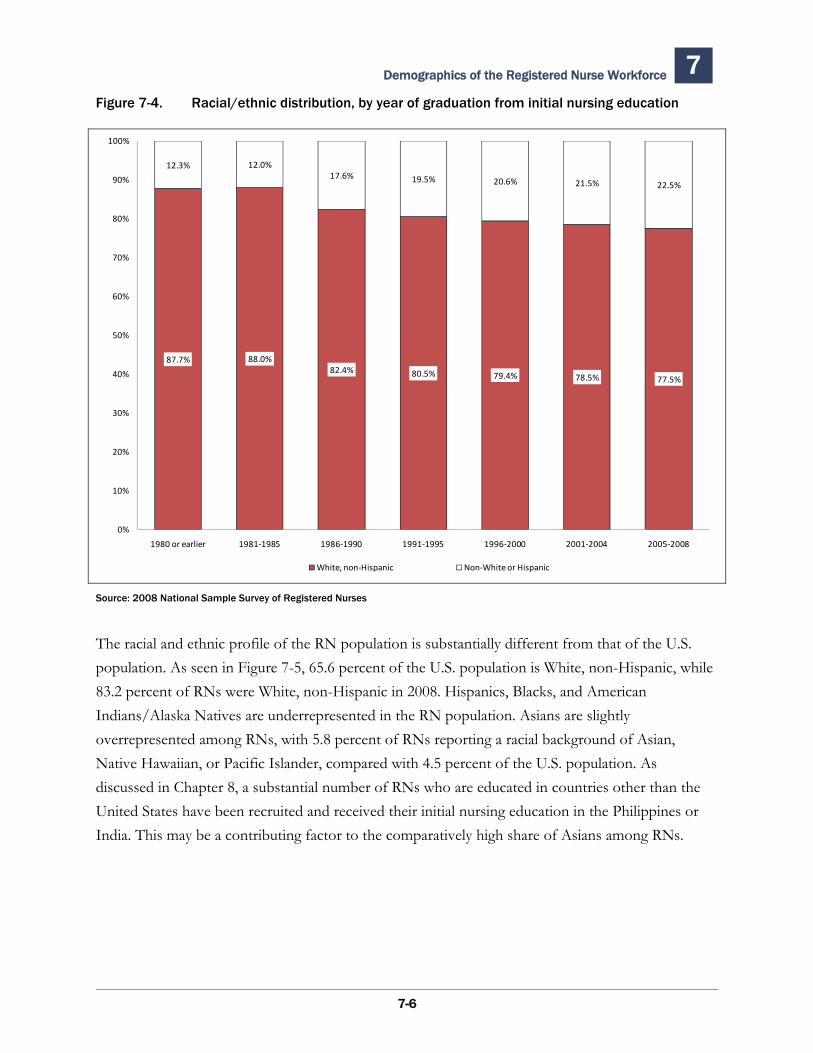
Demographics of the Registered Nurse Workforce 7 Figure 7-4. Racial/ethnic distribution, by year of graduation from initial nursing education
87.7% 88.0%82.4% 80.5% 79.4% 78.5% 77.5%
12.3% 12.0%17.6% 19.5% 20.6% 21.5% 22.5%
0%
10%
20%
30%
40%
50%
60%
70%
80%
90%
100%
1980 or earlier 1981‐1985 1986‐1990 1991‐1995 1996‐2000 2001‐2004 2005‐2008
White, non‐Hispanic Non‐White or Hispanic
Source: 2008 National Sample Survey of Registered Nurses
The racial and ethnic profile of the RN population is substantially different from that of the U.S. population. As seen in Figure 7-5, 65.6 percent of the U.S. population is White, non-Hispanic, while 83.2 percent of RNs were White, non-Hispanic in 2008. Hispanics, Blacks, and American Indians/Alaska Natives are underrepresented in the RN population. Asians are slightly overrepresented among RNs, with 5.8 percent of RNs reporting a racial background of Asian, Native Hawaiian, or Pacific Islander, compared with 4.5 percent of the U.S. population. As discussed in Chapter 8, a substantial number of RNs who are educated in countries other than the United States have been recruited and received their initial nursing education in the Philippines or India. This may be a contributing factor to the comparatively high share of Asians among RNs.
7-6
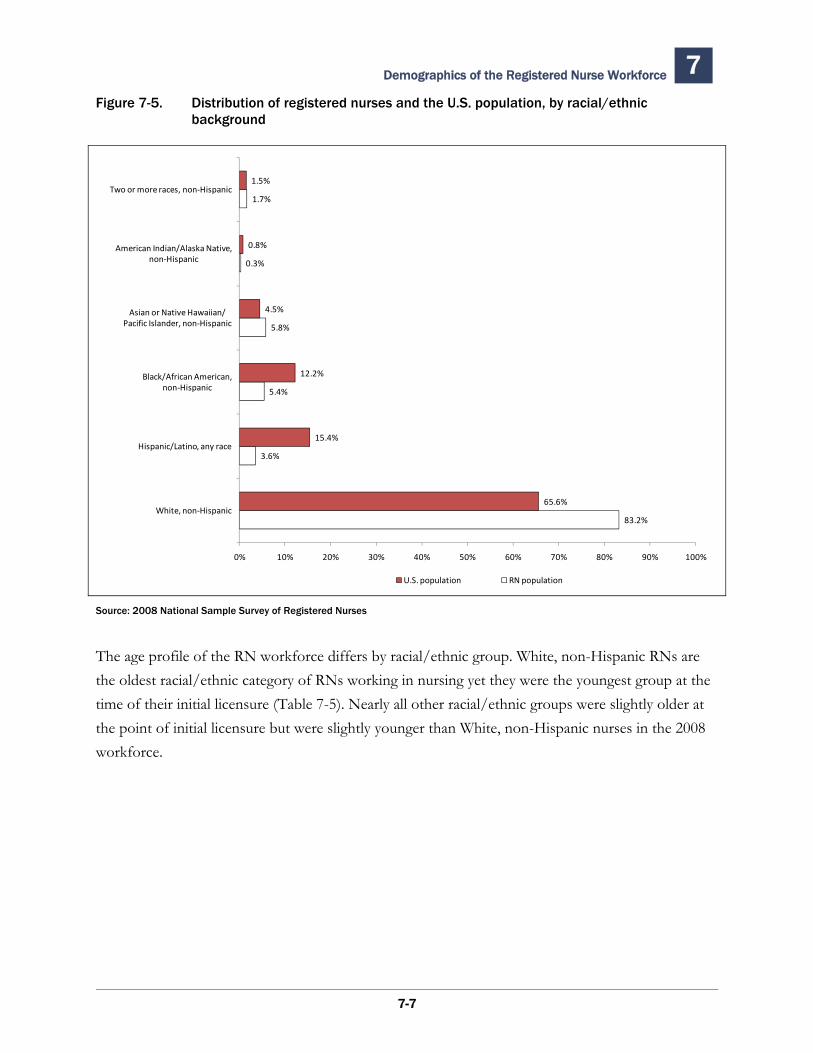
Demographics of the Registered Nurse Workforce 7 Figure 7-5. Distribution of registered nurses and the U.S. population, by racial/ethnic
background
Source: 2008 National Sample Survey of Registered Nurses
The age profile of the RN workforce differs by racial/ethnic group. White, non-Hispanic RNs are the oldest racial/ethnic category of RNs working in nursing yet they were the youngest group at the time of their initial licensure (Table 7-5). Nearly all other racial/ethnic groups were slightly older at the point of initial licensure but were slightly younger than White, non-Hispanic nurses in the 2008 workforce.
83.2%
3.6%
5.4%
5.8%
0.3%
1.7%
65.6%
15.4%
12.2%
4.5%
0.8%
1.5%
0% 10% 20% 30% 40% 50% 60% 70% 80% 90% 100%
White, non‐Hispanic
Hispanic/Latino, any race
Black/African American, non‐Hispanic
Asian or Native Hawaiian/Pacific Islander, non‐Hispanic
American Indian/Alaska Native, non‐Hispanic
Two or more races, non‐Hispanic
U.S. population RN population
7-7
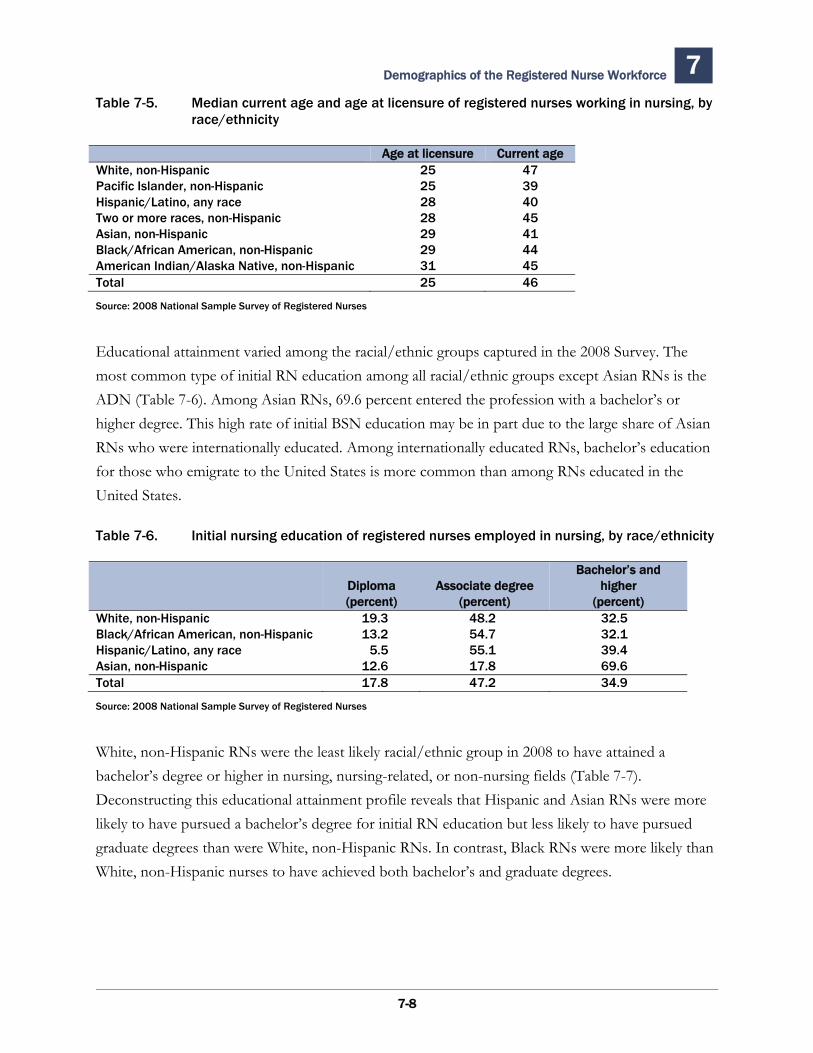
Demographics of the Registered Nurse Workforce 7 Table 7-5. Median current age and age at licensure of registered nurses working in nursing, by
race/ethnicity
Age at licensure Current ageWhite, non-Hispanic 25 47Pacific Islander, non-Hispanic 25 39Hispanic/Latino, any race 28 40Two or more races, non-Hispanic 28 45Asian, non-Hispanic 29 41Black/African American, non-Hispanic 29 44American Indian/Alaska Native, non-Hispanic 31 45Total 25 46
Source: 2008 National Sample Survey of Registered Nurses
Educational attainment varied among the racial/ethnic groups captured in the 2008 Survey. The most common type of initial RN education among all racial/ethnic groups except Asian RNs is the ADN (Table 7-6). Among Asian RNs, 69.6 percent entered the profession with a bachelor’s or higher degree. This high rate of initial BSN education may be in part due to the large share of Asian RNs who were internationally educated. Among internationally educated RNs, bachelor’s education for those who emigrate to the United States is more common than among RNs educated in the United States.
Table 7-6. Initial nursing education of registered nurses employed in nursing, by race/ethnicity
Bachelor’s and Diploma Associate degree higher (percent) (percent) (percent)
White, non-Hispanic 19.3 48.2 32.5 Black/African American, non-Hispanic 13.2 54.7 32.1 Hispanic/Latino, any race 5.5 55.1 39.4 Asian, non-Hispanic 12.6 17.8 69.6 Total 17.8 47.2 34.9
Source: 2008 National Sample Survey of Registered Nurses
White, non-Hispanic RNs were the least likely racial/ethnic group in 2008 to have attained a bachelor’s degree or higher in nursing, nursing-related, or non-nursing fields (Table 7-7). Deconstructing this educational attainment profile reveals that Hispanic and Asian RNs were more likely to have pursued a bachelor’s degree for initial RN education but less likely to have pursued graduate degrees than were White, non-Hispanic RNs. In contrast, Black RNs were more likely than White, non-Hispanic nurses to have achieved both bachelor’s and graduate degrees.
7-8
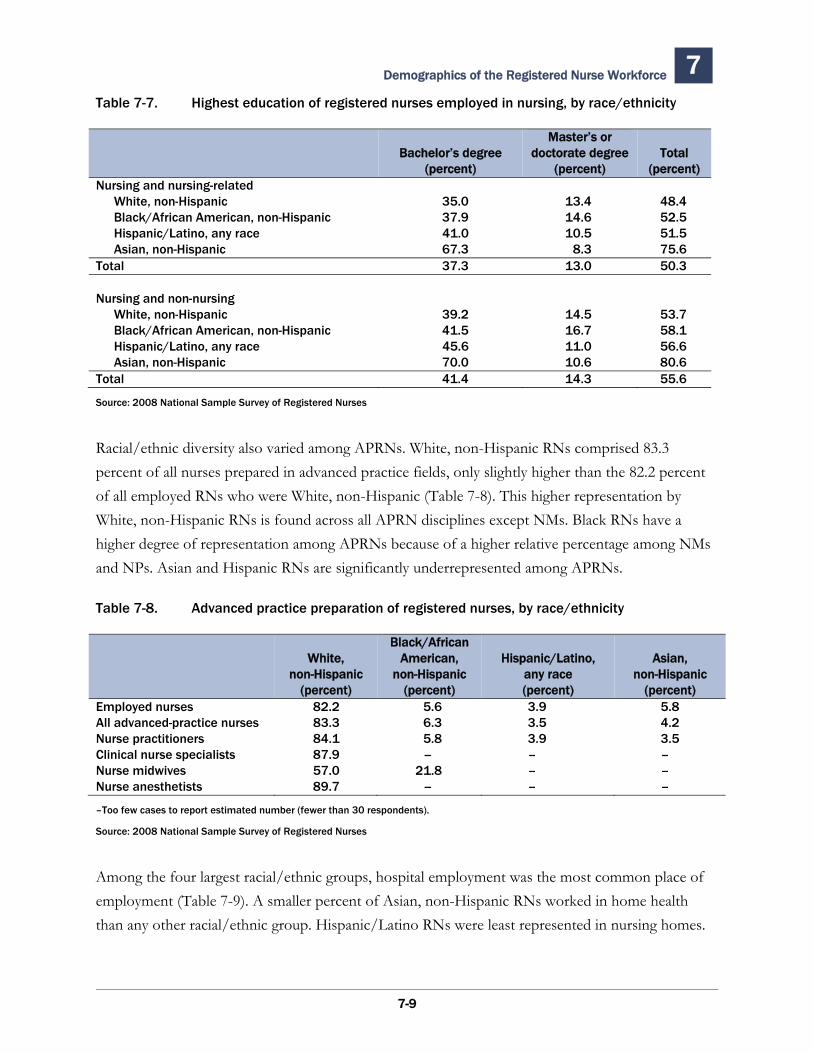
Demographics of the Registered Nurse Workforce 7 Table 7-7. Highest education of registered nurses employed in nursing, by race/ethnicity
Master’s or Bachelor’s degree doctorate degree Total
(percent) (percent) (percent) Nursing and nursing-related
White, non-Hispanic 35.0 13.4 48.4Black/African American, non-Hispanic 37.9 14.6 52.5Hispanic/Latino, any race 41.0 10.5 51.5Asian, non-Hispanic 67.3 8.3 75.6
Total 37.3 13.0 50.3
Nursing and non-nursing White, non-Hispanic 39.2 14.5 53.7Black/African American, non-Hispanic 41.5 16.7 58.1Hispanic/Latino, any race 45.6 11.0 56.6Asian, non-Hispanic 70.0 10.6 80.6
Total 41.4 14.3 55.6
Source: 2008 National Sample Survey of Registered Nurses
Racial/ethnic diversity also varied among APRNs. White, non-Hispanic RNs comprised 83.3 percent of all nurses prepared in advanced practice fields, only slightly higher than the 82.2 percent of all employed RNs who were White, non-Hispanic (Table 7-8). This higher representation by White, non-Hispanic RNs is found across all APRN disciplines except NMs. Black RNs have a higher degree of representation among APRNs because of a higher relative percentage among NMs and NPs. Asian and Hispanic RNs are significantly underrepresented among APRNs.
Table 7-8. Advanced practice preparation of registered nurses, by race/ethnicity
Black/African White, American, Hispanic/Latino, Asian,
non-Hispanic non-Hispanic any race non-Hispanic (percent) (percent) (percent) (percent)
Employed nurses 82.2 5.6 3.9 5.8All advanced-practice nurses 83.3 6.3 3.5 4.2Nurse practitioners 84.1 5.8 3.9 3.5Clinical nurse specialists 87.9 -- -- --Nurse midwives 57.0 21.8 -- --Nurse anesthetists 89.7 -- -- --
–Too few cases to report estimated number (fewer than 30 respondents).
Source: 2008 National Sample Survey of Registered Nurses
Among the four largest racial/ethnic groups, hospital employment was the most common place of employment (Table 7-9). A smaller percent of Asian, non-Hispanic RNs worked in home health than any other racial/ethnic group. Hispanic/Latino RNs were least represented in nursing homes.
7-9
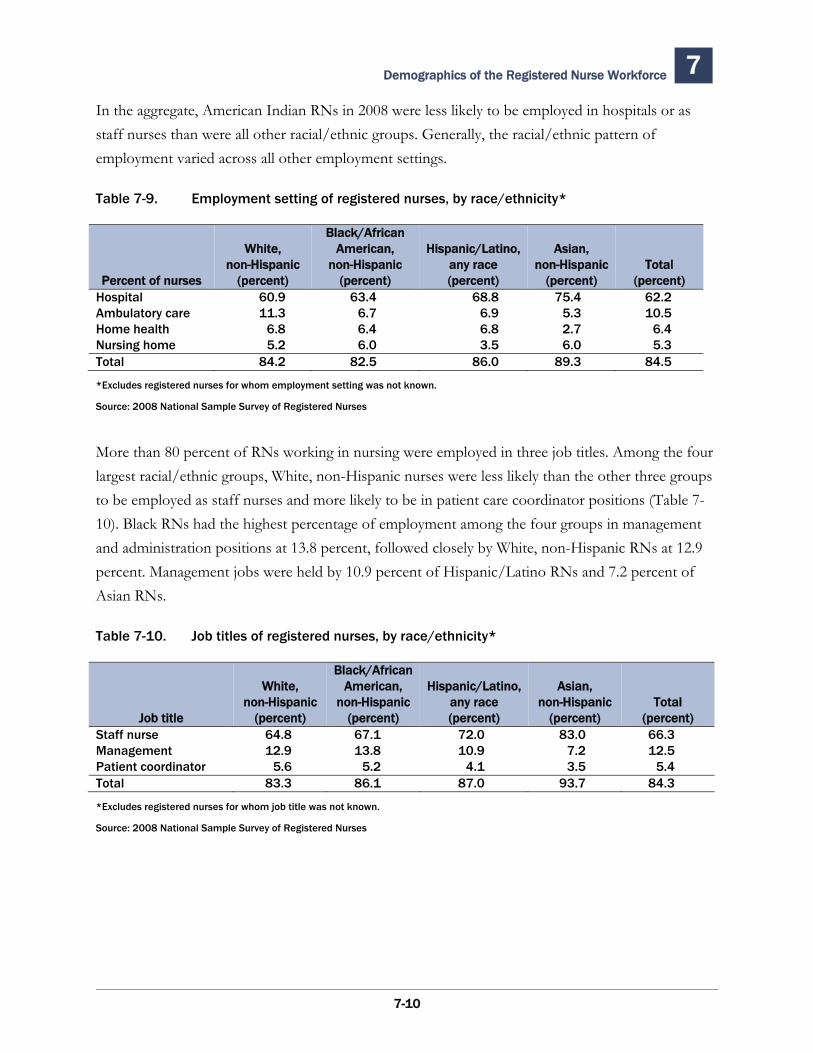
Demographics of the Registered Nurse Workforce 7
In the aggregate, American Indian RNs in 2008 were less likely to be employed in hospitals or as staff nurses than were all other racial/ethnic groups. Generally, the racial/ethnic pattern of employment varied across all other employment settings. Table 7-9. Employment setting of registered nurses, by race/ethnicity*
Black/African White, American, Hispanic/Latino, Asian,
non-Hispanic non-Hispanic any race non-Hispanic Total Percent of nurses (percent) (percent) (percent) (percent) (percent)
Hospital 60.9 63.4 68.8 75.4 62.2Ambulatory care 11.3 6.7 6.9 5.3 10.5Home health 6.8 6.4 6.8 2.7 6.4Nursing home 5.2 6.0 3.5 6.0 5.3Total 84.2 82.5 86.0 89.3 84.5
*Excludes registered nurses for whom employment setting was not known.
Source: 2008 National Sample Survey of Registered Nurses
More than 80 percent of RNs working in nursing were employed in three job titles. Among the four largest racial/ethnic groups, White, non-Hispanic nurses were less likely than the other three groups to be employed as staff nurses and more likely to be in patient care coordinator positions (Table 7-10). Black RNs had the highest percentage of employment among the four groups in management and administration positions at 13.8 percent, followed closely by White, non-Hispanic RNs at 12.9 percent. Management jobs were held by 10.9 percent of Hispanic/Latino RNs and 7.2 percent of Asian RNs.
Table 7-10. Job titles of registered nurses, by race/ethnicity*
Black/African White, American, Hispanic/Latino, Asian,
non-Hispanic non-Hispanic any race non-Hispanic Total Job title (percent) (percent) (percent) (percent) (percent)
Staff nurse 64.8 67.1 72.0 83.0 66.3Management 12.9 13.8 10.9 7.2 12.5Patient coordinator 5.6 5.2 4.1 3.5 5.4Total 83.3 86.1 87.0 93.7 84.3
*Excludes registered nurses for whom job title was not known.
Source: 2008 National Sample Survey of Registered Nurses
7-10
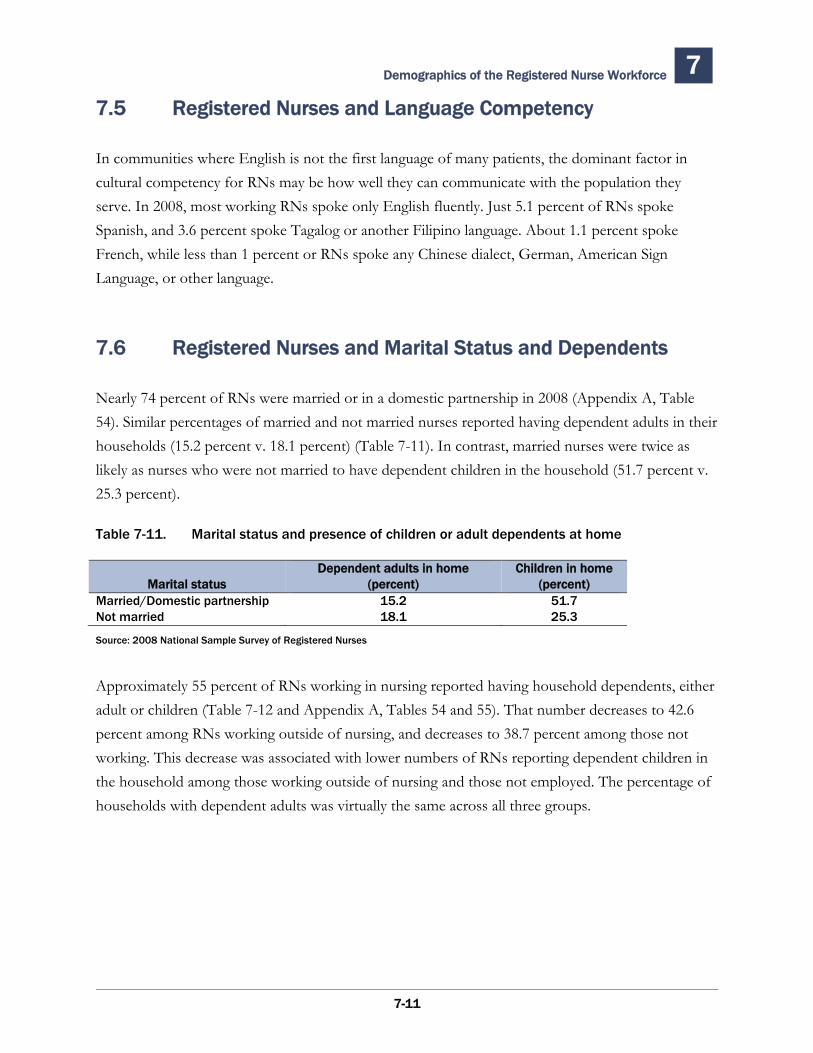
Demographics of the Registered Nurse Workforce 7
7.5 Registered Nurses and Language Competency
In communities where English is not the first language of many patients, the dominant factor in cultural competency for RNs may be how well they can communicate with the population they serve. In 2008, most working RNs spoke only English fluently. Just 5.1 percent of RNs spoke Spanish, and 3.6 percent spoke Tagalog or another Filipino language. About 1.1 percent spoke French, while less than 1 percent or RNs spoke any Chinese dialect, German, American Sign Language, or other language.
7.6 Registered Nurses and Marital Status and Dependents
Nearly 74 percent of RNs were married or in a domestic partnership in 2008 (Appendix A, Table 54). Similar percentages of married and not married nurses reported having dependent adults in their households (15.2 percent v. 18.1 percent) (Table 7-11). In contrast, married nurses were twice as likely as nurses who were not married to have dependent children in the household (51.7 percent v. 25.3 percent).
Table 7-11. Marital status and presence of children or adult dependents at home
Dependent adults in home Children in home Marital status (percent) (percent)
Married/Domestic partnership 15.2 51.7 Not married 18.1 25.3
Source: 2008 National Sample Survey of Registered Nurses
Approximately 55 percent of RNs working in nursing reported having household dependents, either adult or children (Table 7-12 and Appendix A, Tables 54 and 55). That number decreases to 42.6 percent among RNs working outside of nursing, and decreases to 38.7 percent among those not working. This decrease was associated with lower numbers of RNs reporting dependent children in the household among those working outside of nursing and those not employed. The percentage of households with dependent adults was virtually the same across all three groups.
7-11
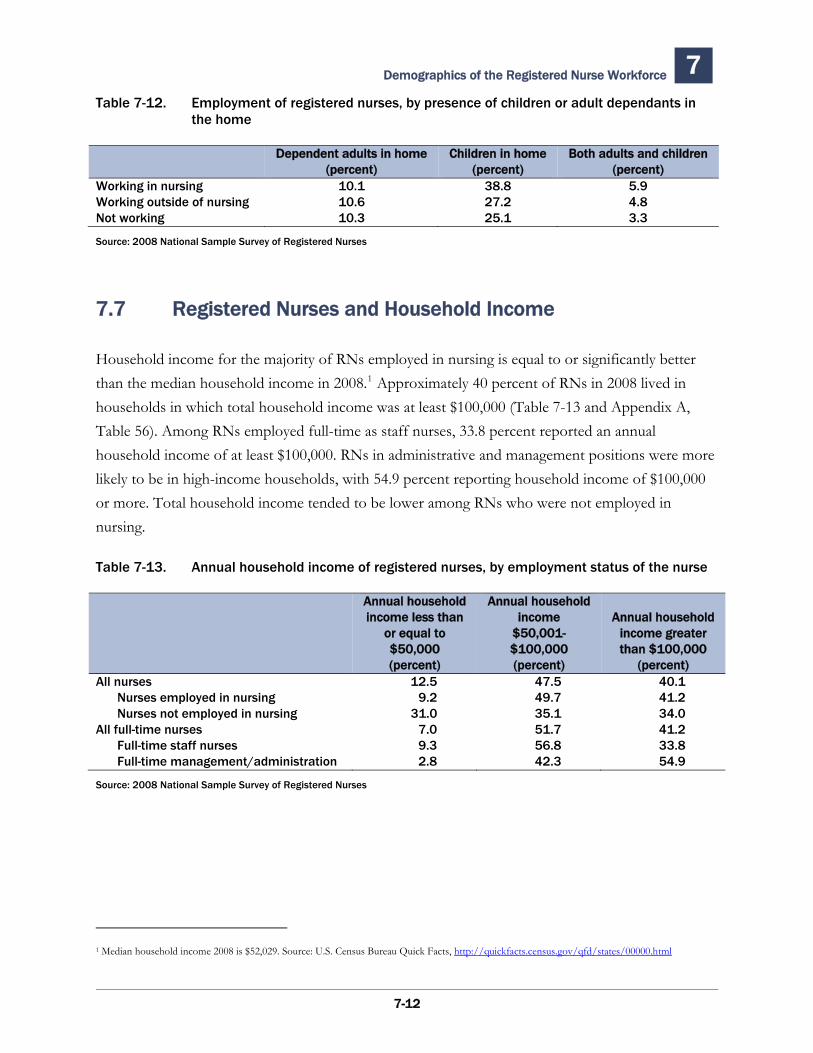
Demographics of the Registered Nurse Workforce 7
7-12
Table 7-12. Employment of registered nurses, by presence of children or adult dependants in the home
Dependent adults in home(percent)
Children in home(percent)
Both adults and children(percent)
Working in nursing 10.1 38.8 5.9 Working outside of nursing 10.6 27.2 4.8 Not working 10.3 25.1 3.3
Source: 2008 National Sample Survey of Registered Nurses
7.7 Registered Nurses and Household Income
Household income for the majority of RNs employed in nursing is equal to or significantly better than the median household income in 2008.1 Approximately 40 percent of RNs in 2008 lived in households in which total household income was at least $100,000 (Table 7-13 and Appendix A, Table 56). Among RNs employed full-time as staff nurses, 33.8 percent reported an annual household income of at least $100,000. RNs in administrative and management positions were more likely to be in high-income households, with 54.9 percent reporting household income of $100,000 or more. Total household income tended to be lower among RNs who were not employed in nursing.
Table 7-13. Annual household income of registered nurses, by employment status of the nurse
Annual household income less than
or equal to $50,000 (percent)
Annual household income
$50,001-$100,000 (percent)
Annual household income greater than $100,000
(percent) All nurses 12.5 47.5 40.1 Nurses employed in nursing 9.2 49.7 41.2 Nurses not employed in nursing 31.0 35.1 34.0All full-time nurses 7.0 51.7 41.2 Full-time staff nurses 9.3 56.8 33.8 Full-time management/administration 2.8 42.3 54.9
Source: 2008 National Sample Survey of Registered Nurses
1 Median household income 2008 is $52,029. Source: U.S. Census Bureau Quick Facts, http://quickfacts.census.gov/qfd/states/00000.html
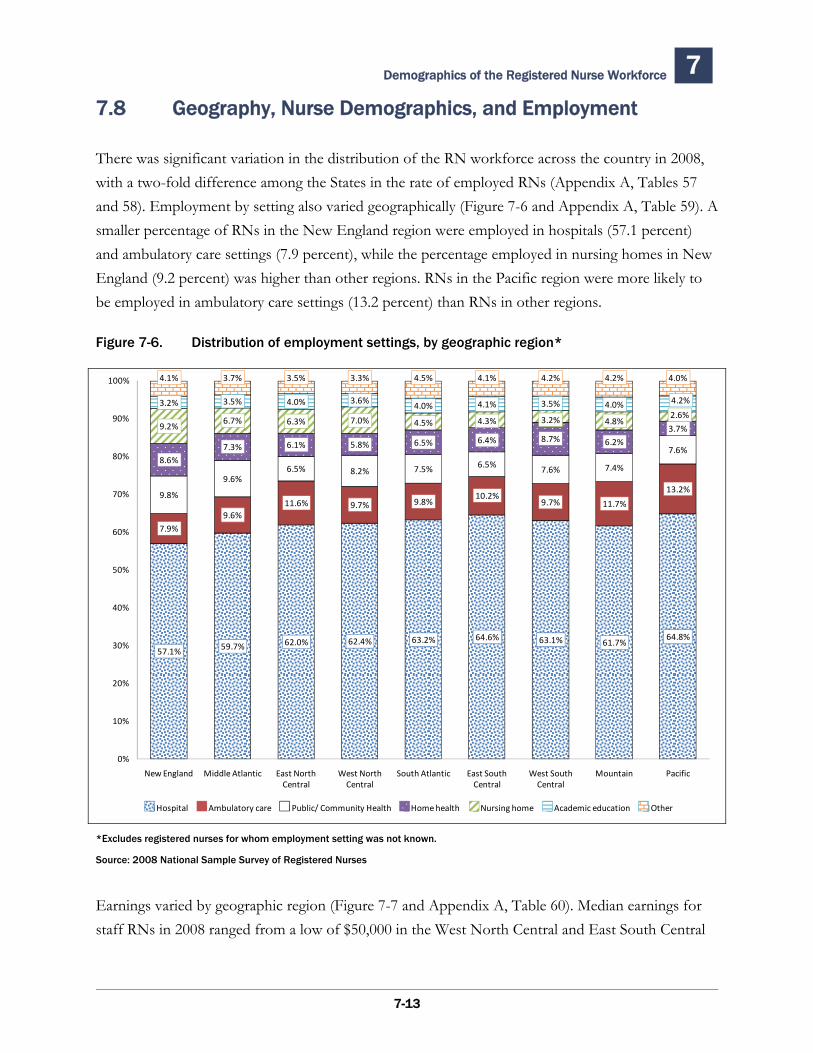
Demographics of the Registered Nurse Workforce 7
7.8 Geography, Nurse Demographics, and Employment
There was significant variation in the distribution of the RN workforce across the country in 2008, with a two-fold difference among the States in the rate of employed RNs (Appendix A, Tables 57 and 58). Employment by setting also varied geographically (Figure 7-6 and Appendix A, Table 59). A smaller percentage of RNs in the New England region were employed in hospitals (57.1 percent) and ambulatory care settings (7.9 percent), while the percentage employed in nursing homes in New England (9.2 percent) was higher than other regions. RNs in the Pacific region were more likely to be employed in ambulatory care settings (13.2 percent) than RNs in other regions.
Figure 7-6. Distribution of employment settings, by geographic region*
57.1% 59.7% 62.0% 62.4% 63.2% 64.6% 63.1% 61.7%64.8%
7.9%9.6%
11.6% 9.7% 9.8%10.2%
9.7% 11.7%
13.2%9.8%
9.6%6.5% 8.2% 7.5% 6.5% 7.6% 7.4%
7.6%8.6%
7.3% 6.1% 5.8% 6.5% 6.4% 8.7% 6.2%
3.7%9.2%6.7% 6.3% 7.0% 4.5% 4.3% 3.2% 4.8%
2.6%3.2% 3.5% 4.0% 3.6%
4.0% 4.1% 3.5% 4.0% 4.2%
4.1% 3.7% 3.5% 3.3% 4.5% 4.1% 4.2% 4.2% 4.0%
0%
10%
20%
30%
40%
50%
60%
70%
80%
90%
100%
New England Middle Atlantic East North Central
West North Central
South Atlantic East South Central
West South Central
Mountain Pacific
Hospital Ambulatory care Public/ Community Health Home health Nursing home Academic education Other
*Excludes registered nurses for whom employment setting was not known.
Source: 2008 National Sample Survey of Registered Nurses
Earnings varied by geographic region (Figure 7-7 and Appendix A, Table 60). Median earnings for staff RNs in 2008 ranged from a low of $50,000 in the West North Central and East South Central
7-13
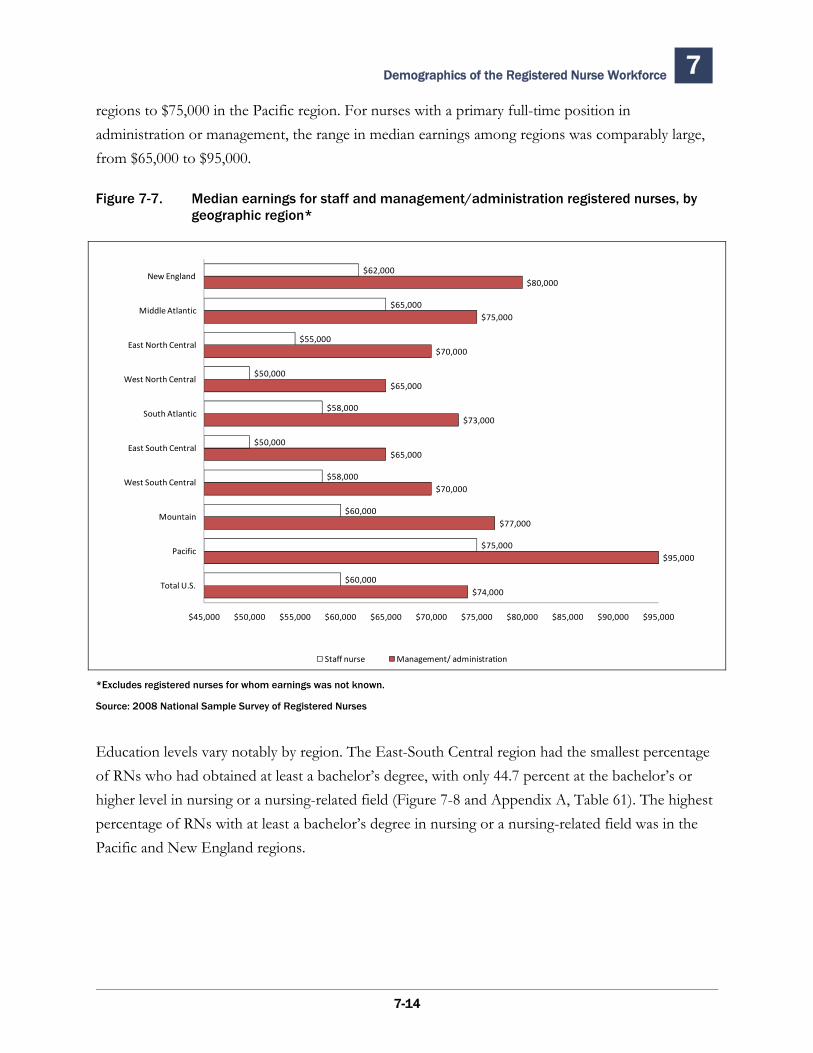
Demographics of the Registered Nurse Workforce 7
regions to $75,000 in the Pacific region. For nurses with a primary full-time position in administration or management, the range in median earnings among regions was comparably large, from $65,000 to $95,000.
Figure 7-7. Median earnings for staff and management/administration registered nurses, by geographic region*
$74,000
$95,000
$77,000
$70,000
$65,000
$73,000
$65,000
$70,000
$75,000
$80,000
$60,000
$75,000
$60,000
$58,000
$50,000
$58,000
$50,000
$55,000
$65,000
$62,000
$45,000 $50,000 $55,000 $60,000 $65,000 $70,000 $75,000 $80,000 $85,000 $90,000 $95,000
Total U.S.
Pacific
Mountain
West South Central
East South Central
South Atlantic
West North Central
East North Central
Middle Atlantic
New England
Staff nurse Management/ administration
*Excludes registered nurses for whom earnings was not known.
Source: 2008 National Sample Survey of Registered Nurses
Education levels vary notably by region. The East-South Central region had the smallest percentage of RNs who had obtained at least a bachelor’s degree, with only 44.7 percent at the bachelor’s or higher level in nursing or a nursing-related field (Figure 7-8 and Appendix A, Table 61). The highest percentage of RNs with at least a bachelor’s degree in nursing or a nursing-related field was in the Pacific and New England regions.
7-14
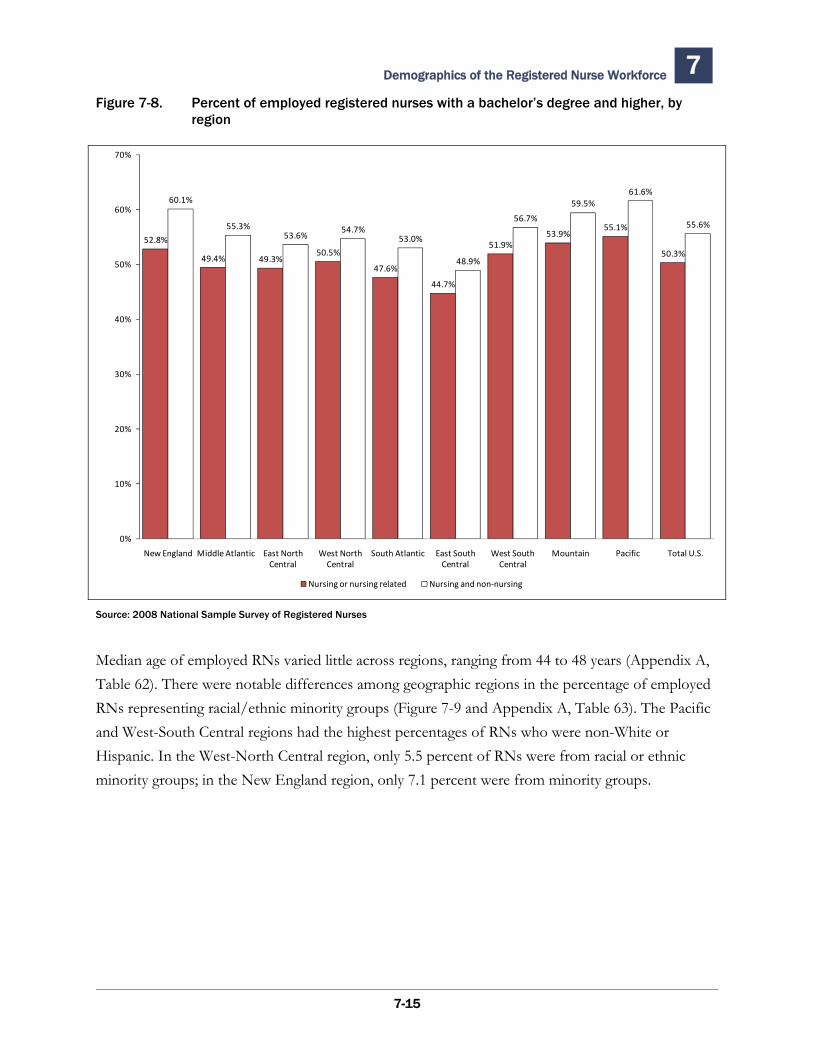
Demographics of the Registered Nurse Workforce 7 Figure 7-8. Percent of employed registered nurses with a bachelor’s degree and higher, by
region
52.8%
49.4% 49.3%50.5%
47.6%
44.7%
51.9%53.9%
55.1%
50.3%
60.1%
55.3%53.6%
54.7%53.0%
48.9%
56.7%
59.5%61.6%
55.6%
0%
10%
20%
30%
40%
50%
60%
70%
New England Middle Atlantic East North Central
West North Central
South Atlantic East South Central
West South Central
Mountain Pacific Total U.S.
Nursing or nursing related Nursing and non‐nursing
Source: 2008 National Sample Survey of Registered Nurses
Median age of employed RNs varied little across regions, ranging from 44 to 48 years (Appendix A, Table 62). There were notable differences among geographic regions in the percentage of employed RNs representing racial/ethnic minority groups (Figure 7-9 and Appendix A, Table 63). The Pacific and West-South Central regions had the highest percentages of RNs who were non-White or Hispanic. In the West-North Central region, only 5.5 percent of RNs were from racial or ethnic minority groups; in the New England region, only 7.1 percent were from minority groups.
7-15
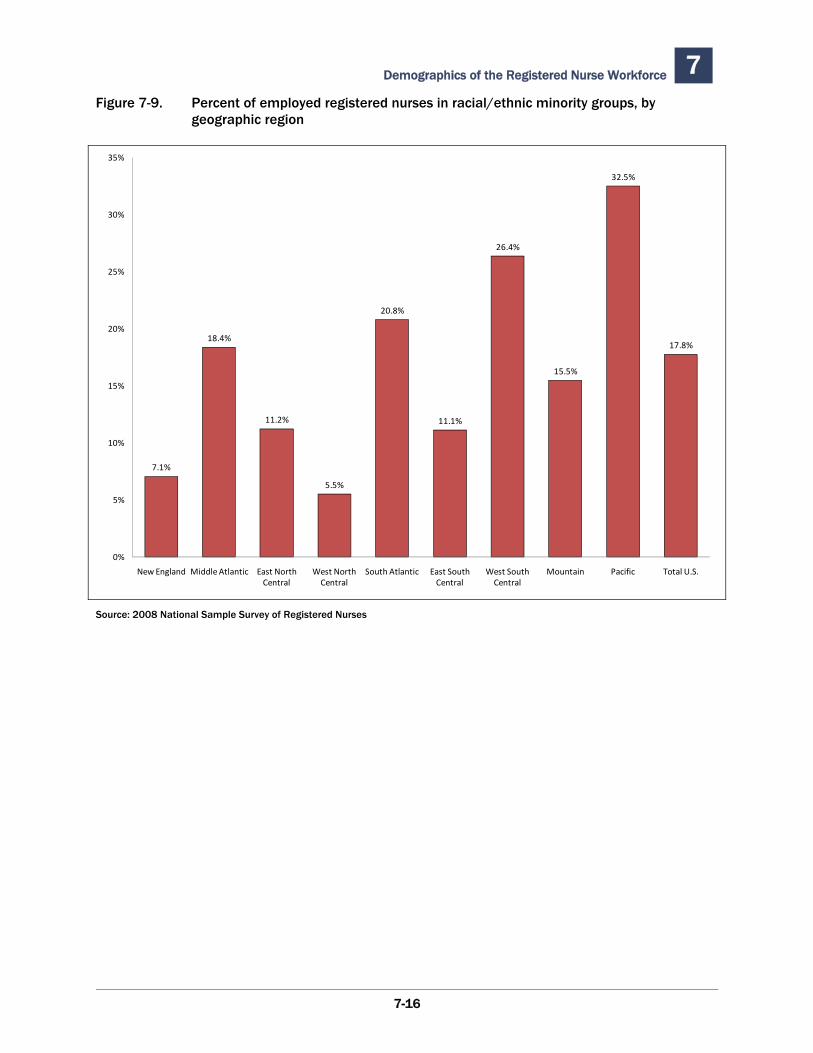
7 Demographics of the Registered Nurse Workforce Figure 7-9. Percent of employed registered nurses in racial/ethnic minority groups, by
geographic region
7.1%
18.4%
11.2%
5.5%
20.8%
11.1%
26.4%
15.5%
32.5%
17.8%
0%
5%
10%
15%
20%
25%
30%
35%
New England Middle Atlantic East North Central
West North Central
South Atlantic East South Central
West South Central
Mountain Pacific Total U.S.
Source: 2008 National Sample Survey of Registered Nurses
7-16
8.1 Introduction
This chapter reviews the characteristics and employment of internationally educated nurses (IENs), formerly termed foreign-trained or foreign-educated nurses. These nurses have completed primary nursing education, often in British or U.S. modeled nursing education programs, outside of the United States or in the U.S. territories. Since the early 1900s, IENs have worked in the United States RN workforce. Prior to World War II, IENs came predominantly from Canada and western European English-speaking countries. Since that time, IENs have come to the United States from the Caribbean, Asia, South America, and most recently some African nations, in addition to Canada and Europe. Internationally educated nurses include RNs who individually immigrate for personal and/or economic reasons and also may include larger populations of IENs who are recruited to fill U.S. hospital nursing shortages by employment agencies specializing in international nursing recruitment.
In 2008, IENs from the Philippines continued to be the largest group of IENs in the U.S. workforce, followed by RNs from Canada. In recent years, IENs constitute a small but an increasing percentage of the U.S. RN workforce.
8.2 IEN Licensure and National Origin
In 2008 there were an estimated 165,539 IENs living in the United States, accounting for 5.4 percent of all licensed RNs (Table 8-1 and Appendix A, Table 65). Of these, 146,097 were employed in nursing in 2008, comprising 5.6 percent of the RN workforce. Approximately one-quarter of working IENs received their first U.S. nursing license in 2004 or later. The number of IENs is slowly growing: IENs licensed between 2004-2008 represented 8.1 percent of the total of recently licensed employed RNs, compared with 5.1 percent of those licensed before 2004.
IENs from the Philippines comprised just over 50 percent of all IENs and 52 percent of those working in nursing (Figure 8-1 and Appendix A, Table 65). Nearly 12 percent of IENs came from
Internationally Educated Nurses (IENs) 8
8-1
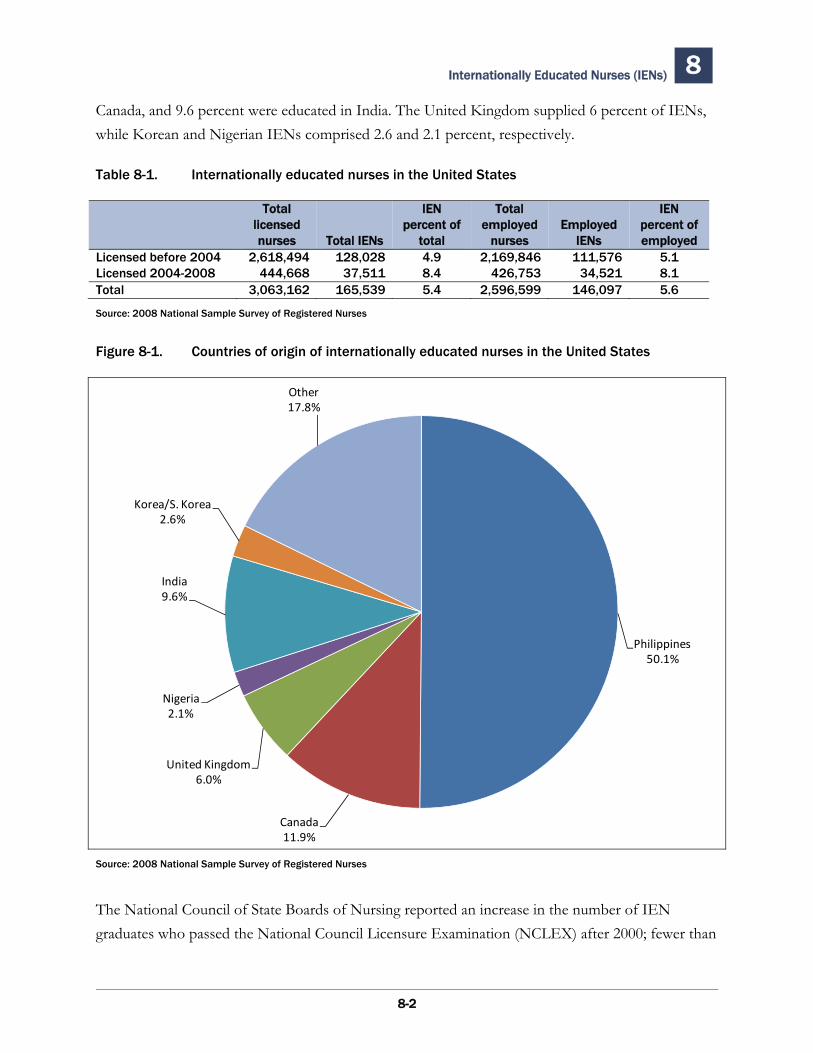
Internationally Educated Nurses (IENs) 8
Canada, and 9.6 percent were educated in India. The United Kingdom supplied 6 percent of IENs, while Korean and Nigerian IENs comprised 2.6 and 2.1 percent, respectively.
Table 8-1. Internationally educated nurses in the United States
Total IEN Total IEN licensed percent of employed Employed percent of nurses Total IENs total nurses IENs employed
Licensed before 2004 2,618,494 128,028 4.9 2,169,846 111,576 5.1Licensed 2004-2008 444,668 37,511 8.4 426,753 34,521 8.1Total 3,063,162 165,539 5.4 2,596,599 146,097 5.6
Source: 2008 National Sample Survey of Registered Nurses
Figure 8-1. Countries of origin of internationally educated nurses in the United States
Philippines50.1%
Canada11.9%
United Kingdom6.0%
Nigeria2.1%
India9.6%
Korea/S. Korea2.6%
Other17.8%
Source: 2008 National Sample Survey of Registered Nurses
The National Council of State Boards of Nursing reported an increase in the number of IEN graduates who passed the National Council Licensure Examination (NCLEX) after 2000; fewer than
8-2
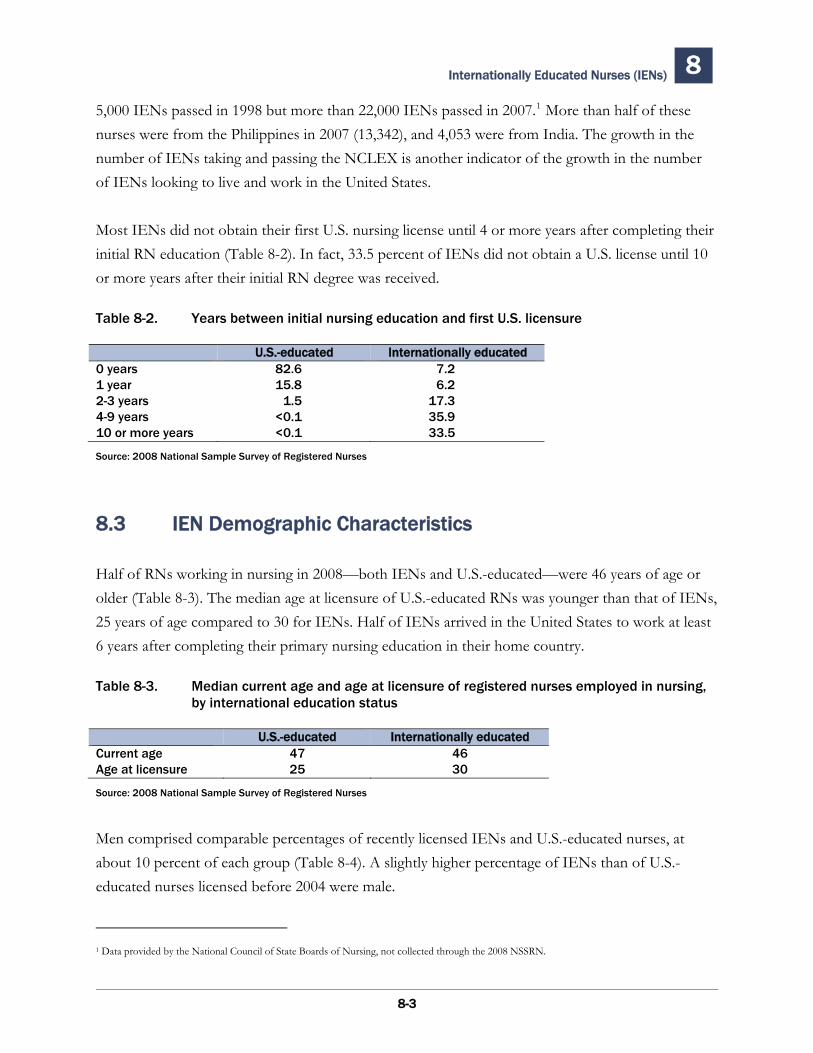
Internationally Educated Nurses (IENs) 8
8-3
5,000 IENs passed in 1998 but more than 22,000 IENs passed in 2007.1 More than half of these nurses were from the Philippines in 2007 (13,342), and 4,053 were from India. The growth in the number of IENs taking and passing the NCLEX is another indicator of the growth in the number of IENs looking to live and work in the United States.
Most IENs did not obtain their first U.S. nursing license until 4 or more years after completing their initial RN education (Table 8-2). In fact, 33.5 percent of IENs did not obtain a U.S. license until 10 or more years after their initial RN degree was received.
Table 8-2. Years between initial nursing education and first U.S. licensure
U.S.-educated Internationally educated0 years 82.6 7.21 year 15.8 6.22-3 years 1.5 17.34-9 years <0.1 35.910 or more years <0.1 33.5
Source: 2008 National Sample Survey of Registered Nurses
8.3 IEN Demographic Characteristics
Half of RNs working in nursing in 2008—both IENs and U.S.-educated—were 46 years of age or older (Table 8-3). The median age at licensure of U.S.-educated RNs was younger than that of IENs, 25 years of age compared to 30 for IENs. Half of IENs arrived in the United States to work at least 6 years after completing their primary nursing education in their home country.
Table 8-3. Median current age and age at licensure of registered nurses employed in nursing, by international education status
U.S.-educated Internationally educatedCurrent age 47 46Age at licensure 25 30
Source: 2008 National Sample Survey of Registered Nurses
Men comprised comparable percentages of recently licensed IENs and U.S.-educated nurses, at about 10 percent of each group (Table 8-4). A slightly higher percentage of IENs than of U.S.-educated nurses licensed before 2004 were male.
1 Data provided by the National Council of State Boards of Nursing, not collected through the 2008 NSSRN.
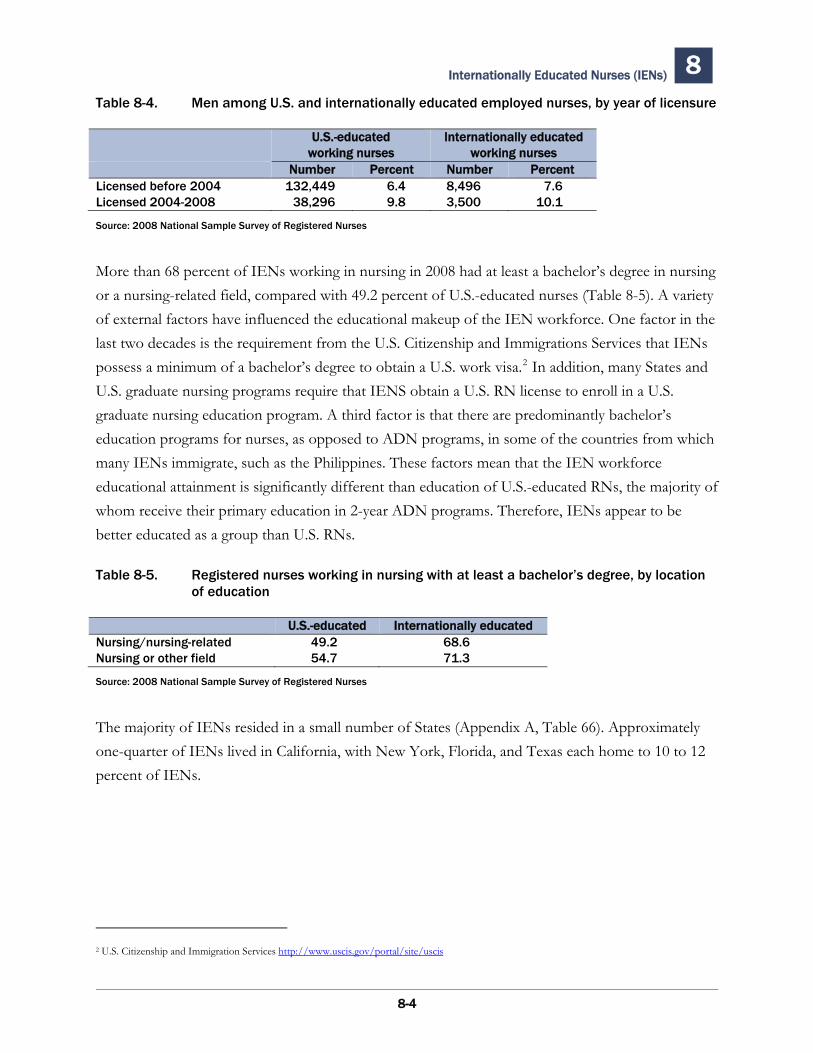
Internationally Educated Nurses (IENs) 8
8-4
Table 8-4. Men among U.S. and internationally educated employed nurses, by year of licensure
U.S.-educated working nurses
Internationally educated working nurses
Number Percent Number Percent Licensed before 2004 132,449 6.4 8,496 7.6Licensed 2004-2008 38,296 9.8 3,500 10.1
Source: 2008 National Sample Survey of Registered Nurses
More than 68 percent of IENs working in nursing in 2008 had at least a bachelor’s degree in nursing or a nursing-related field, compared with 49.2 percent of U.S.-educated nurses (Table 8-5). A variety of external factors have influenced the educational makeup of the IEN workforce. One factor in the last two decades is the requirement from the U.S. Citizenship and Immigrations Services that IENs possess a minimum of a bachelor’s degree to obtain a U.S. work visa.2 In addition, many States and U.S. graduate nursing programs require that IENS obtain a U.S. RN license to enroll in a U.S. graduate nursing education program. A third factor is that there are predominantly bachelor’s education programs for nurses, as opposed to ADN programs, in some of the countries from which many IENs immigrate, such as the Philippines. These factors mean that the IEN workforce educational attainment is significantly different than education of U.S.-educated RNs, the majority of whom receive their primary education in 2-year ADN programs. Therefore, IENs appear to be better educated as a group than U.S. RNs.
Table 8-5. Registered nurses working in nursing with at least a bachelor’s degree, by location of education
U.S.-educated Internationally educatedNursing/nursing-related 49.2 68.6Nursing or other field 54.7 71.3
Source: 2008 National Sample Survey of Registered Nurses
The majority of IENs resided in a small number of States (Appendix A, Table 66). Approximately one-quarter of IENs lived in California, with New York, Florida, and Texas each home to 10 to 12 percent of IENs.
2 U.S. Citizenship and Immigration Services http://www.uscis.gov/portal/site/uscis
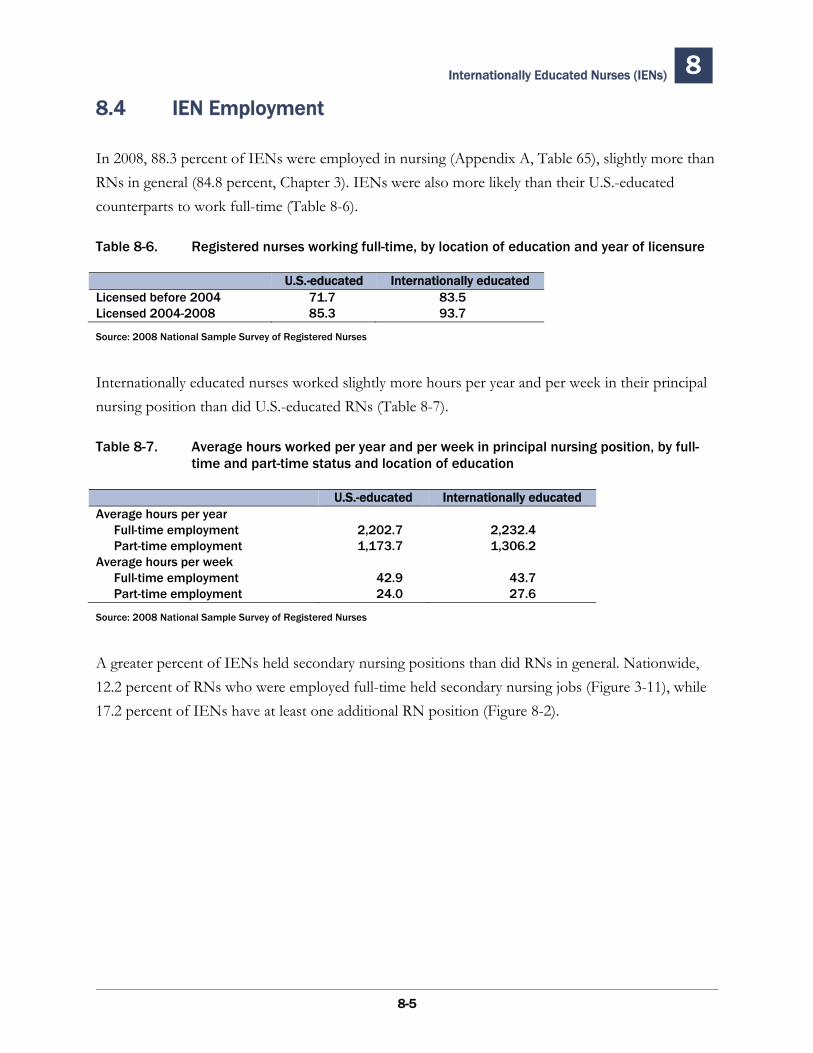
Internationally Educated Nurses (IENs) 8
8.4 IEN Employment
In 2008, 88.3 percent of IENs were employed in nursing (Appendix A, Table 65), slightly more than RNs in general (84.8 percent, Chapter 3). IENs were also more likely than their U.S.-educated counterparts to work full-time (Table 8-6).
Table 8-6. Registered nurses working full-time, by location of education and year of licensure
U.S.-educated Internationally educatedLicensed before 2004 71.7 83.5Licensed 2004-2008 85.3 93.7
Source: 2008 National Sample Survey of Registered Nurses
Internationally educated nurses worked slightly more hours per year and per week in their principal nursing position than did U.S.-educated RNs (Table 8-7).
Table 8-7. Average hours worked per year and per week in principal nursing position, by full-time and part-time status and location of education
U.S.-educated Internationally educated Average hours per year
Full-time employment 2,202.7 2,232.4Part-time employment 1,173.7 1,306.2
Average hours per week Full-time employment 42.9 43.7Part-time employment 24.0 27.6
Source: 2008 National Sample Survey of Registered Nurses
A greater percent of IENs held secondary nursing positions than did RNs in general. Nationwide, 12.2 percent of RNs who were employed full-time held secondary nursing jobs (Figure 3-11), while 17.2 percent of IENs have at least one additional RN position (Figure 8-2).
8-5
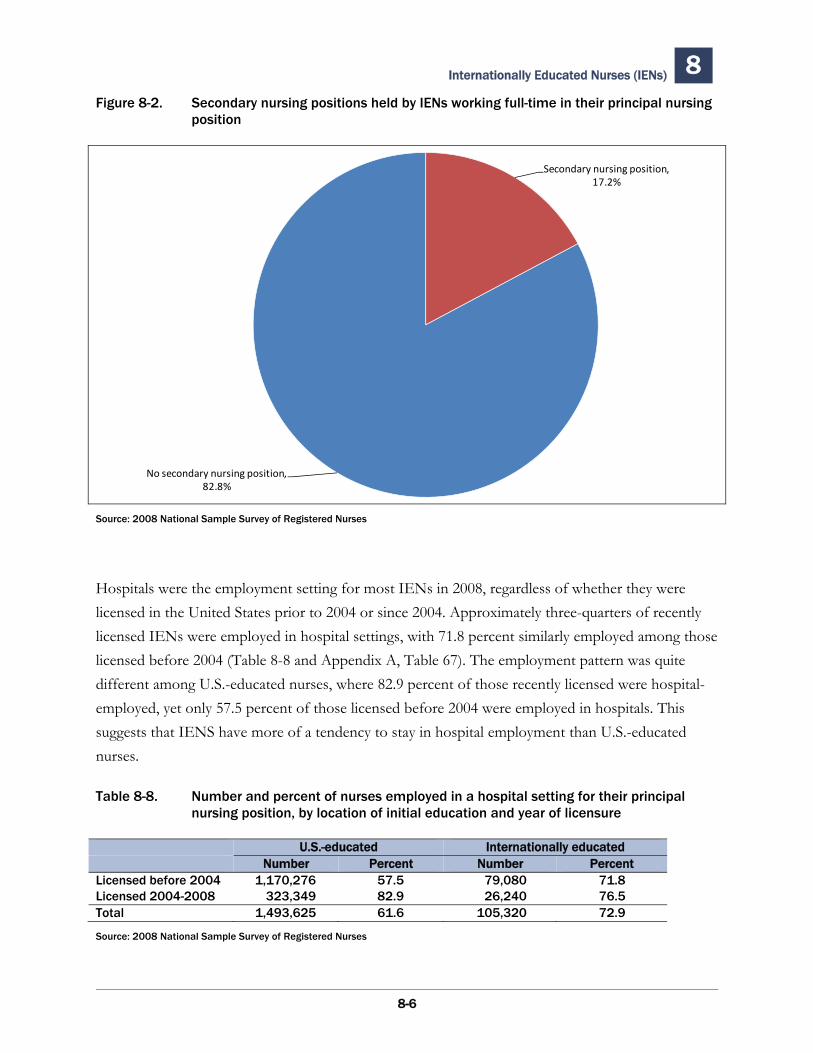
Internationally Educated Nurses (IENs) 8 Figure 8-2. Secondary nursing positions held by IENs working full-time in their principal nursing
position
Source: 2008 National Sample Survey of Registered Nurses
Secondary nursing position, 17.2%
No secondary nursing position, 82.8%
Hospitals were the employment setting for most IENs in 2008, regardless of whether they were licensed in the United States prior to 2004 or since 2004. Approximately three-quarters of recently licensed IENs were employed in hospital settings, with 71.8 percent similarly employed among those licensed before 2004 (Table 8-8 and Appendix A, Table 67). The employment pattern was quite different among U.S.-educated nurses, where 82.9 percent of those recently licensed were hospital-employed, yet only 57.5 percent of those licensed before 2004 were employed in hospitals. This suggests that IENS have more of a tendency to stay in hospital employment than U.S.-educated nurses.
Table 8-8. Number and percent of nurses employed in a hospital setting for their principal nursing position, by location of initial education and year of licensure
U.S.-educated Internationally educated Number Percent Number Percent
Licensed before 2004 1,170,276 57.5 79,080 71.8 Licensed 2004-2008 323,349 82.9 26,240 76.5 Total 1,493,625 61.6 105,320 72.9
Source: 2008 National Sample Survey of Registered Nurses
8-6
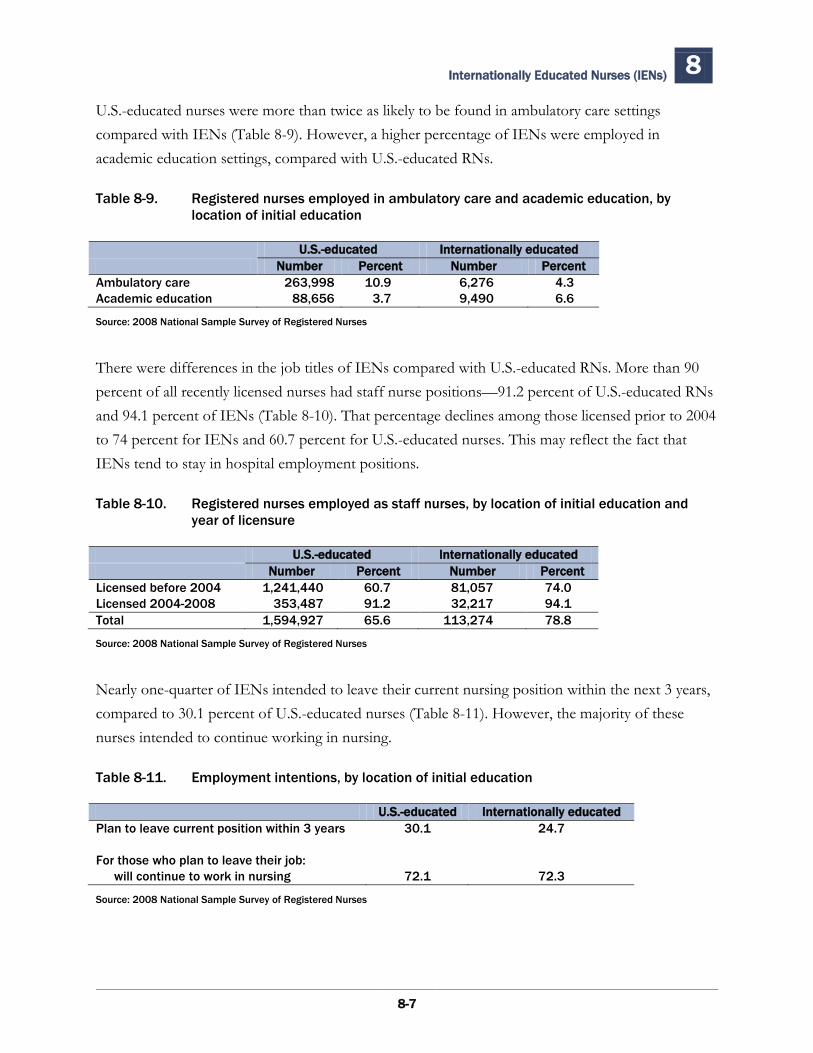
Internationally Educated Nurses (IENs) 8
8-7
U.S.-educated nurses were more than twice as likely to be found in ambulatory care settings compared with IENs (Table 8-9). However, a higher percentage of IENs were employed in academic education settings, compared with U.S.-educated RNs. Table 8-9. Registered nurses employed in ambulatory care and academic education, by
location of initial education
U.S.-educated Internationally educated
Number Percent Number Percent Ambulatory care 263,998 10.9 6,276 4.3 Academic education 88,656 3.7 9,490 6.6
Source: 2008 National Sample Survey of Registered Nurses
There were differences in the job titles of IENs compared with U.S.-educated RNs. More than 90 percent of all recently licensed nurses had staff nurse positions—91.2 percent of U.S.-educated RNs and 94.1 percent of IENs (Table 8-10). That percentage declines among those licensed prior to 2004 to 74 percent for IENs and 60.7 percent for U.S.-educated nurses. This may reflect the fact that IENs tend to stay in hospital employment positions. Table 8-10. Registered nurses employed as staff nurses, by location of initial education and
year of licensure
U.S.-educated Internationally educated Number Percent Number Percent
Licensed before 2004 1,241,440 60.7 81,057 74.0 Licensed 2004-2008 353,487 91.2 32,217 94.1 Total 1,594,927 65.6 113,274 78.8
Source: 2008 National Sample Survey of Registered Nurses
Nearly one-quarter of IENs intended to leave their current nursing position within the next 3 years, compared to 30.1 percent of U.S.-educated nurses (Table 8-11). However, the majority of these nurses intended to continue working in nursing. Table 8-11. Employment intentions, by location of initial education
U.S.-educated Internationally educated Plan to leave current position within 3 years 30.1 24.7 For those who plan to leave their job:
will continue to work in nursing 72.1 72.3
Source: 2008 National Sample Survey of Registered Nurses

Internationally Educated Nurses (IENs) 8
8-8
This page deliberately blank.
9.1 Introduction
In this report recent graduates are defined as RNs who completed initial nursing education after 2000 (from 2001 to 2008). Within this group, another cohort was identified as the most recent graduates who completed their initial nursing education after 2004 (2005–2008). The sample of most recent graduates includes few RNs who graduated and obtained their licenses in 2008 because the survey sample was selected in early 2008.
In 2008, RNs who completed initial registered nursing programs after 2000 comprised nearly 20 percent of all RNs in the United States and 22.3 percent of those employed. These nurses are indicative of expansions in RN education programs responding to a national RN shortage. When these recent graduates completed their nursing program, they were nearly 4 years older at graduation than RNs who graduated before 2001. Many more recent graduates completed postsecondary education in another field prior to starting their RN education, and a considerable number worked in a health care position before completing initial RN education. These new graduates are more diverse than previous cohorts, with men and minorities comprising a greater percentage. More than 95 percent of new nurses were employed in nursing positions, and they were most likely to be employed in a hospital and as a staff nurse, compared with other employment setting and job title options. They changed employers at a rate of 17.7 percent between 2007 and 2008, often to advance their careers. As expected, most recent graduates had lower salaries and a narrower range of job titles than did RNs who graduated between 2001 and 2004.
9.2 Demographic Characteristics of Recent Registered Nurse Graduates
The number of RNs who received their first registered nursing degree between 2001 and 2008, and live in the United States, is estimated to be 603,402, comprising nearly 20 percent of the total RN population in 2008 (Table 9-1). The earlier group of these RNs—who graduated between 2001 and 2004—represent nearly 10 percent of all RNs and more than 10 percent of RNs employed in
Recent Registered Nurse Graduates 9
9-1
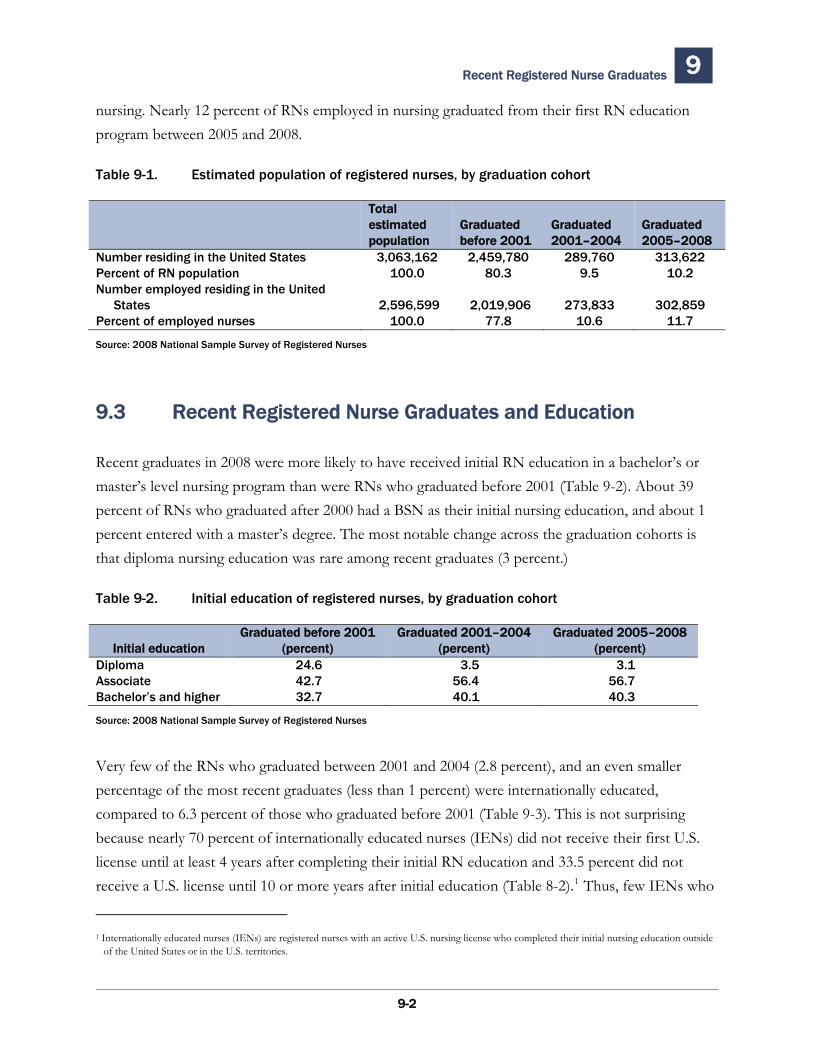
Recent Registered Nurse Graduates 9
9-2
nursing. Nearly 12 percent of RNs employed in nursing graduated from their first RN education program between 2005 and 2008.
Table 9-1. Estimated population of registered nurses, by graduation cohort
Total estimated population
Graduated before 2001
Graduated 2001–2004
Graduated 2005–2008
Number residing in the United States 3,063,162 2,459,780 289,760 313,622Percent of RN population 100.0 80.3 9.5 10.2Number employed residing in the United
States 2,596,599 2,019,906 273,833 302,859 Percent of employed nurses 100.0 77.8 10.6 11.7
Source: 2008 National Sample Survey of Registered Nurses
9.3 Recent Registered Nurse Graduates and Education
Recent graduates in 2008 were more likely to have received initial RN education in a bachelor’s or master’s level nursing program than were RNs who graduated before 2001 (Table 9-2). About 39 percent of RNs who graduated after 2000 had a BSN as their initial nursing education, and about 1 percent entered with a master’s degree. The most notable change across the graduation cohorts is that diploma nursing education was rare among recent graduates (3 percent.)
Table 9-2. Initial education of registered nurses, by graduation cohort
Initial education Graduated before 2001
(percent) Graduated 2001–2004
(percent) Graduated 2005–2008
(percent) Diploma 24.6 3.5 3.1 Associate 42.7 56.4 56.7 Bachelor’s and higher 32.7 40.1 40.3
Source: 2008 National Sample Survey of Registered Nurses
Very few of the RNs who graduated between 2001 and 2004 (2.8 percent), and an even smaller percentage of the most recent graduates (less than 1 percent) were internationally educated, compared to 6.3 percent of those who graduated before 2001 (Table 9-3). This is not surprising because nearly 70 percent of internationally educated nurses (IENs) did not receive their first U.S. license until at least 4 years after completing their initial RN education and 33.5 percent did not receive a U.S. license until 10 or more years after initial education (Table 8-2).1 Thus, few IENs who
1 Internationally educated nurses (IENs) are registered nurses with an active U.S. nursing license who completed their initial nursing education outside
of the United States or in the U.S. territories.
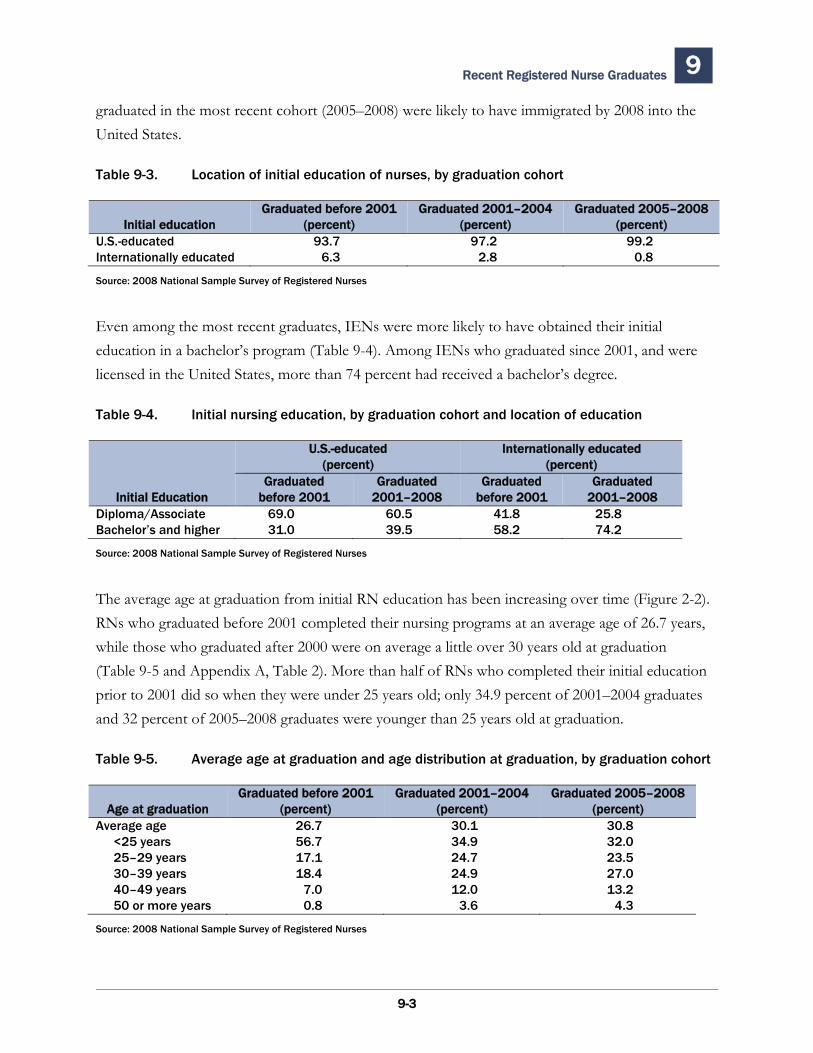
Recent Registered Nurse Graduates 9
graduated in the most recent cohort (2005–2008) were likely to have immigrated by 2008 into the United States.
Table 9-3. Location of initial education of nurses, by graduation cohort
Graduated before 2001 Graduated 2001–2004 Graduated 2005–2008Initial education (percent) (percent) (percent)
U.S.-educated 93.7 97.2 99.2 Internationally educated 6.3 2.8 0.8
Source: 2008 National Sample Survey of Registered Nurses
Even among the most recent graduates, IENs were more likely to have obtained their initial education in a bachelor’s program (Table 9-4). Among IENs who graduated since 2001, and were licensed in the United States, more than 74 percent had received a bachelor’s degree.
Table 9-4. Initial nursing education, by graduation cohort and location of education
U.S.-educated (percent)
Internationally educated (percent)
Graduated Graduated Graduated Graduated Initial Education before 2001 2001–2008 before 2001 2001–2008
Diploma/Associate Bachelor’s and higher
69.0 31.0
60.539.5
41.858.2
25.8 74.2
Source: 2008 National Sample Survey of Registered Nurses
The average age at graduation from initial RN education has been increasing over time (Figure 2-2). RNs who graduated before 2001 completed their nursing programs at an average age of 26.7 years, while those who graduated after 2000 were on average a little over 30 years old at graduation (Table 9-5 and Appendix A, Table 2). More than half of RNs who completed their initial education prior to 2001 did so when they were under 25 years old; only 34.9 percent of 2001–2004 graduates and 32 percent of 2005–2008 graduates were younger than 25 years old at graduation.
Table 9-5. Average age at graduation and age distribution at graduation, by graduation cohort
Graduated before 2001 Graduated 2001–2004 Graduated 2005–2008Age at graduation (percent) (percent) (percent)
Average age 26.7 30.1 30.8 <25 years 56.7 34.9 32.0 25–29 years 17.1 24.7 23.5 30–39 years 18.4 24.9 27.0 40–49 years 7.0 12.0 13.2 50 or more years 0.8 3.6 4.3
Source: 2008 National Sample Survey of Registered Nurses
9-3
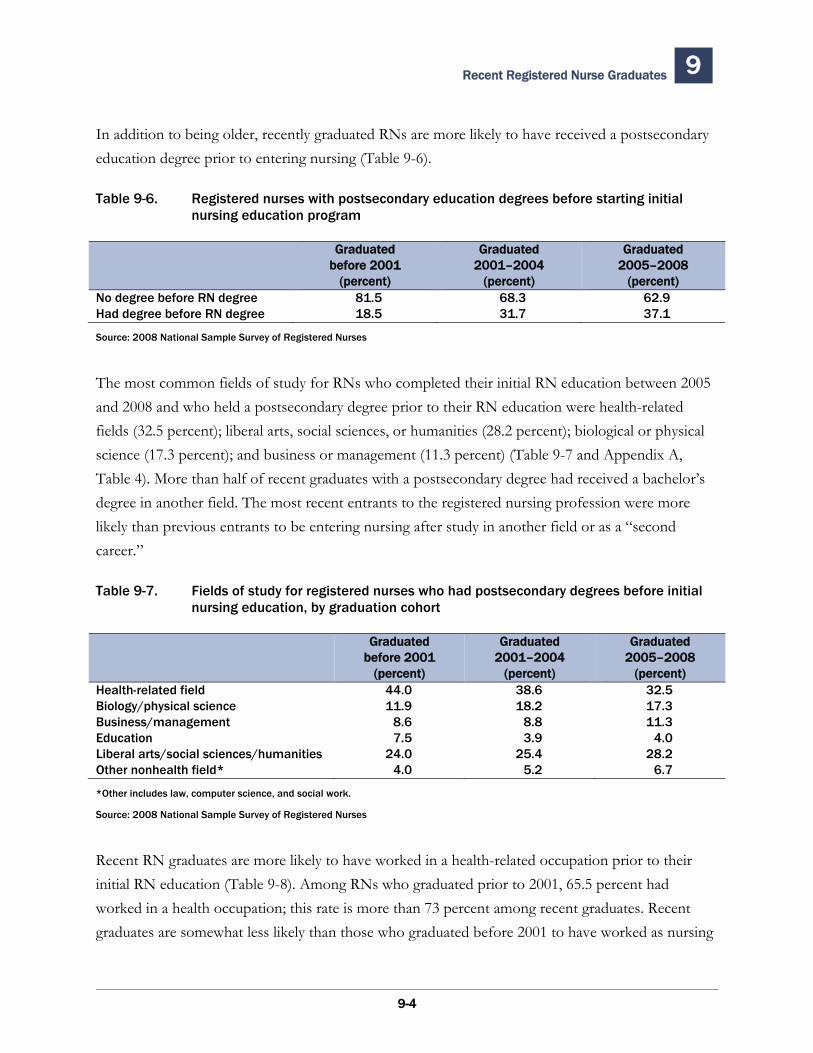
Recent Registered Nurse Graduates 9
In addition to being older, recently graduated RNs are more likely to have received a postsecondary education degree prior to entering nursing (Table 9-6).
Table 9-6. Registered nurses with postsecondary education degrees before starting initial nursing education program
Graduated Graduated Graduated before 2001 2001–2004 2005–2008
(percent) (percent) (percent) No degree before RN degree 81.5 68.3 62.9Had degree before RN degree 18.5 31.7 37.1
Source: 2008 National Sample Survey of Registered Nurses
The most common fields of study for RNs who completed their initial RN education between 2005 and 2008 and who held a postsecondary degree prior to their RN education were health-related fields (32.5 percent); liberal arts, social sciences, or humanities (28.2 percent); biological or physical science (17.3 percent); and business or management (11.3 percent) (Table 9-7 and Appendix A, Table 4). More than half of recent graduates with a postsecondary degree had received a bachelor’s degree in another field. The most recent entrants to the registered nursing profession were more likely than previous entrants to be entering nursing after study in another field or as a “second career.”
Table 9-7. Fields of study for registered nurses who had postsecondary degrees before initial nursing education, by graduation cohort
Graduated Graduated Graduated before 2001 2001–2004 2005–2008
(percent) (percent) (percent) Health-related field 44.0 38.6 32.5Biology/physical science 11.9 18.2 17.3Business/management 8.6 8.8 11.3Education 7.5 3.9 4.0Liberal arts/social sciences/humanities 24.0 25.4 28.2Other nonhealth field* 4.0 5.2 6.7
*Other includes law, computer science, and social work.
Source: 2008 National Sample Survey of Registered Nurses
Recent RN graduates are more likely to have worked in a health-related occupation prior to their initial RN education (Table 9-8). Among RNs who graduated prior to 2001, 65.5 percent had worked in a health occupation; this rate is more than 73 percent among recent graduates. Recent graduates are somewhat less likely than those who graduated before 2001 to have worked as nursing
9-4
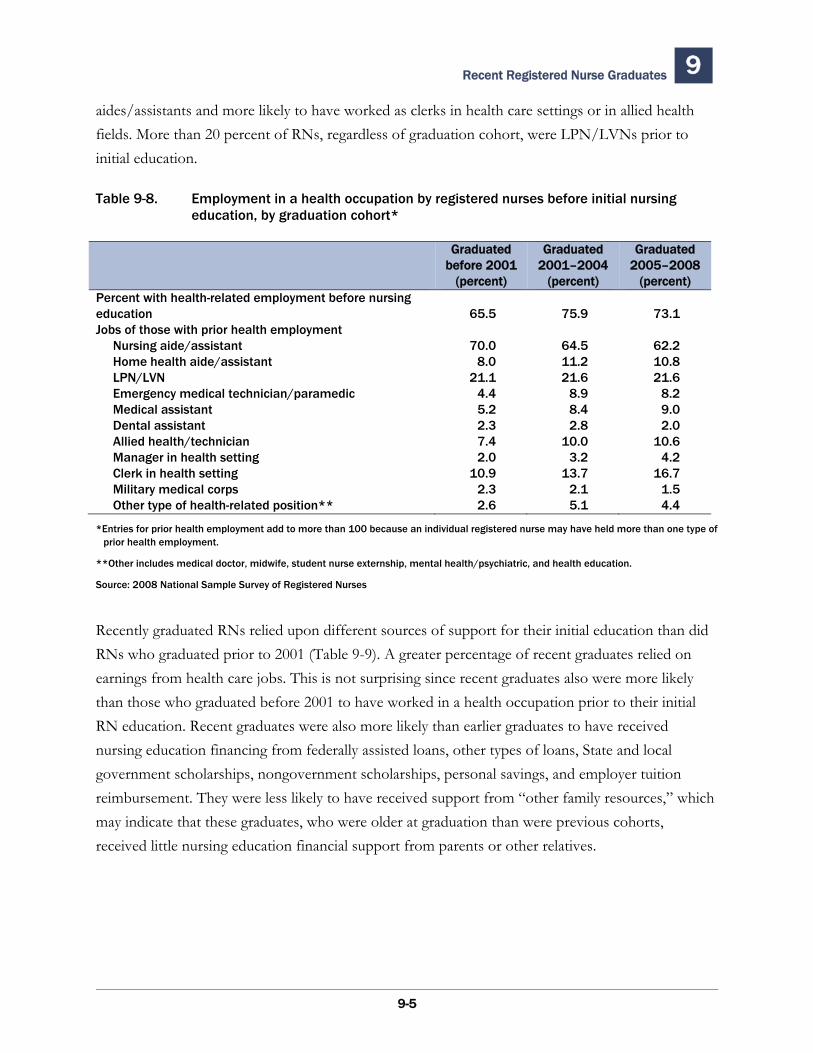
Recent Registered Nurse Graduates 9
aides/assistants and more likely to have worked as clerks in health care settings or in allied health fields. More than 20 percent of RNs, regardless of graduation cohort, were LPN/LVNs prior to initial education.
Table 9-8. Employment in a health occupation by registered nurses before initial nursing education, by graduation cohort*
Graduated Graduated Graduated before 2001 2001–2004 2005–2008
(percent) (percent) (percent) Percent with health-related employment before nursing education 65.5 75.9 73.1Jobs of those with prior health employment Nursing aide/assistant 70.0 64.5 62.2 Home health aide/assistant 8.0 11.2 10.8 LPN/LVN 21.1 21.6 21.6 Emergency medical technician/paramedic 4.4 8.9 8.2 Medical assistant 5.2 8.4 9.0 Dental assistant 2.3 2.8 2.0 Allied health/technician 7.4 10.0 10.6 Manager in health setting 2.0 3.2 4.2 Clerk in health setting 10.9 13.7 16.7 Military medical corps 2.3 2.1 1.5 Other type of health-related position** 2.6 5.1 4.4
*Entries for prior health employment add to more than 100 because an individual registered nurse may have held more than one type of prior health employment.
**Other includes medical doctor, midwife, student nurse externship, mental health/psychiatric, and health education.
Source: 2008 National Sample Survey of Registered Nurses
Recently graduated RNs relied upon different sources of support for their initial education than did RNs who graduated prior to 2001 (Table 9-9). A greater percentage of recent graduates relied on earnings from health care jobs. This is not surprising since recent graduates also were more likely than those who graduated before 2001 to have worked in a health occupation prior to their initial RN education. Recent graduates were also more likely than earlier graduates to have received nursing education financing from federally assisted loans, other types of loans, State and local government scholarships, nongovernment scholarships, personal savings, and employer tuition reimbursement. They were less likely to have received support from “other family resources,” which may indicate that these graduates, who were older at graduation than were previous cohorts, received little nursing education financial support from parents or other relatives.
9-5
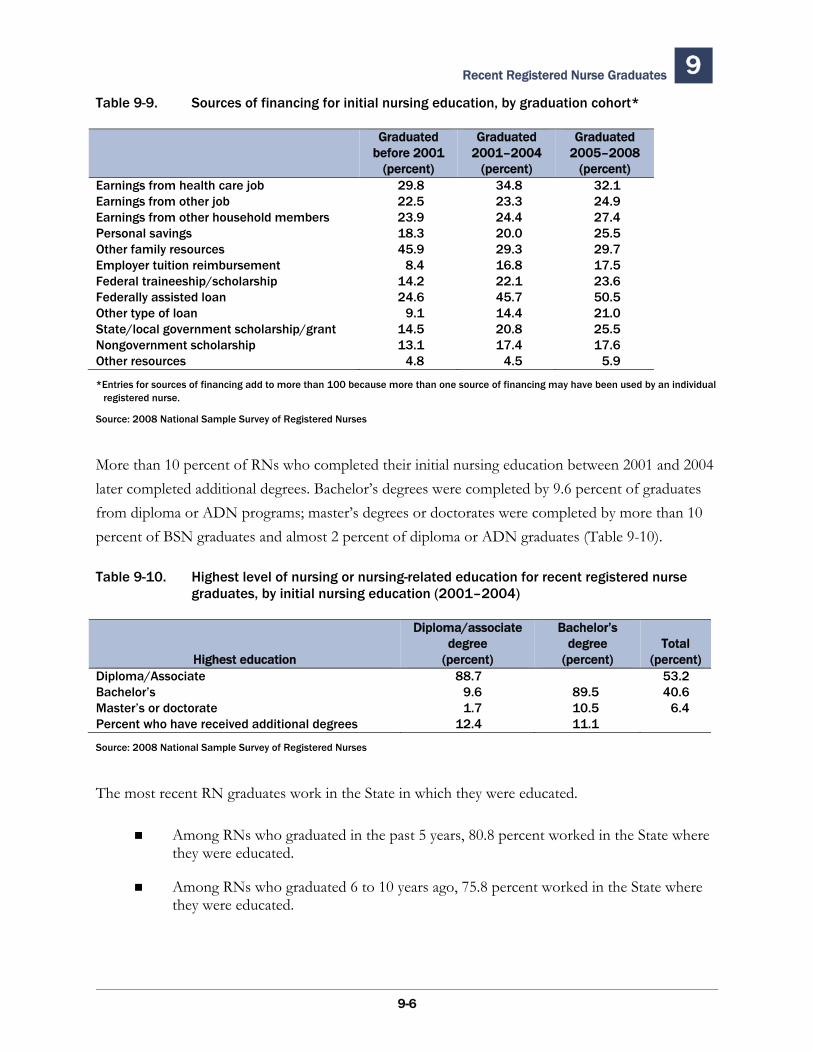
Recent Registered Nurse Graduates 9 Table 9-9. Sources of financing for initial nursing education, by graduation cohort*
Graduated Graduated Graduated before 2001 2001–2004 2005–2008
(percent) (percent) (percent) Earnings from health care job 29.8 34.8 32.1 Earnings from other job 22.5 23.3 24.9 Earnings from other household members 23.9 24.4 27.4 Personal savings 18.3 20.0 25.5 Other family resources 45.9 29.3 29.7 Employer tuition reimbursement 8.4 16.8 17.5 Federal traineeship/scholarship 14.2 22.1 23.6 Federally assisted loan 24.6 45.7 50.5 Other type of loan 9.1 14.4 21.0 State/local government scholarship/grant 14.5 20.8 25.5 Nongovernment scholarship 13.1 17.4 17.6 Other resources 4.8 4.5 5.9
*Entries for sources of financing add to more than 100 because more than one source of financing may have been used by an individual registered nurse.
Source: 2008 National Sample Survey of Registered Nurses
More than 10 percent of RNs who completed their initial nursing education between 2001 and 2004 later completed additional degrees. Bachelor’s degrees were completed by 9.6 percent of graduates from diploma or ADN programs; master’s degrees or doctorates were completed by more than 10 percent of BSN graduates and almost 2 percent of diploma or ADN graduates (Table 9-10).
Table 9-10. Highest level of nursing or nursing-related education for recent registered nurse graduates, by initial nursing education (2001–2004)
Diploma/associate Bachelor’s degree degree Total
Highest education (percent) (percent) (percent) Diploma/Associate 88.7 53.2Bachelor’s 9.6 89.5 40.6Master’s or doctorate 1.7 10.5 6.4Percent who have received additional degrees 12.4 11.1
Source: 2008 National Sample Survey of Registered Nurses
The most recent RN graduates work in the State in which they were educated.
Among RNs who graduated in the past 5 years, 80.8 percent worked in the State where they were educated.
Among RNs who graduated 6 to 10 years ago, 75.8 percent worked in the State where they were educated.
9-6
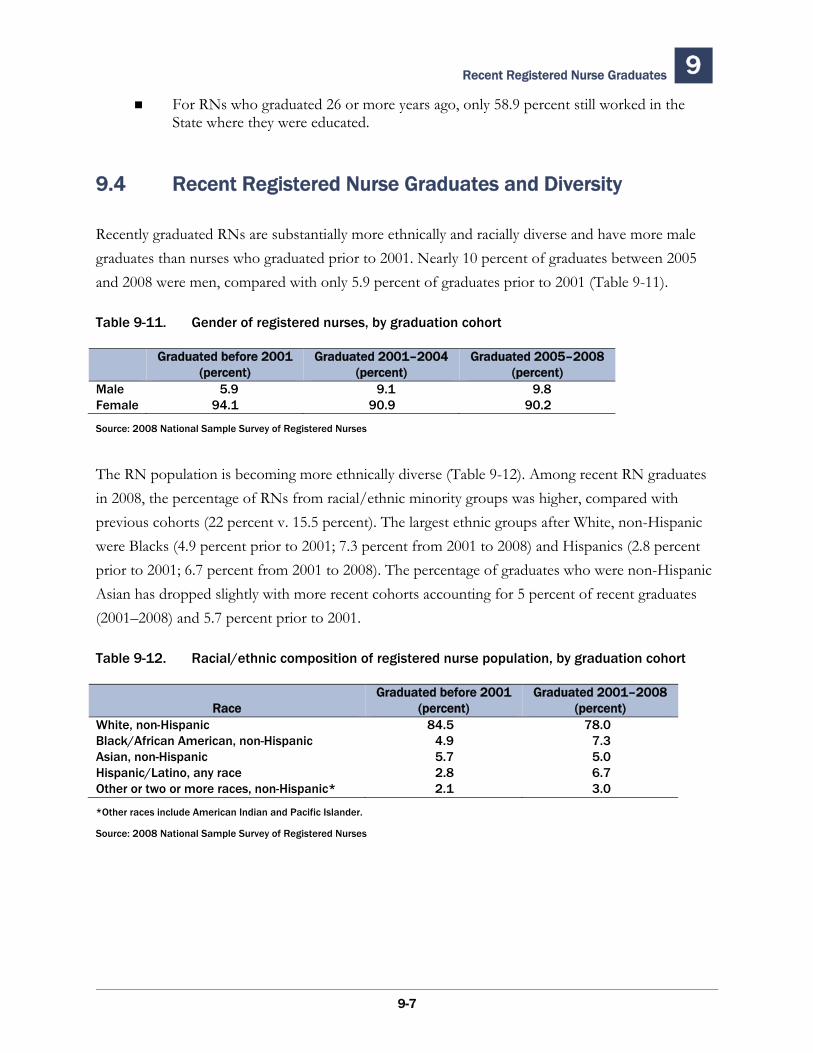
Recent Registered Nurse Graduates 9
For RNs who graduated 26 or more years ago, only 58.9 percent still worked in the State where they were educated.
9.4 Recent Registered Nurse Graduates and Diversity
Recently graduated RNs are substantially more ethnically and racially diverse and have more male graduates than nurses who graduated prior to 2001. Nearly 10 percent of graduates between 2005 and 2008 were men, compared with only 5.9 percent of graduates prior to 2001 (Table 9-11).
Table 9-11. Gender of registered nurses, by graduation cohort
Graduated before 2001 Graduated 2001–2004 Graduated 2005–2008 (percent) (percent) (percent)
Male 5.9 9.1 9.8Female 94.1 90.9 90.2
Source: 2008 National Sample Survey of Registered Nurses
The RN population is becoming more ethnically diverse (Table 9-12). Among recent RN graduates in 2008, the percentage of RNs from racial/ethnic minority groups was higher, compared with previous cohorts (22 percent v. 15.5 percent). The largest ethnic groups after White, non-Hispanic were Blacks (4.9 percent prior to 2001; 7.3 percent from 2001 to 2008) and Hispanics (2.8 percent prior to 2001; 6.7 percent from 2001 to 2008). The percentage of graduates who were non-Hispanic Asian has dropped slightly with more recent cohorts accounting for 5 percent of recent graduates (2001–2008) and 5.7 percent prior to 2001.
Table 9-12. Racial/ethnic composition of registered nurse population, by graduation cohort
Graduated before 2001 Graduated 2001–2008Race (percent) (percent)
White, non-Hispanic 84.5 78.0 Black/African American, non-Hispanic 4.9 7.3 Asian, non-Hispanic 5.7 5.0 Hispanic/Latino, any race 2.8 6.7 Other or two or more races, non-Hispanic* 2.1 3.0
*Other races include American Indian and Pacific Islander.
Source: 2008 National Sample Survey of Registered Nurses
9-7
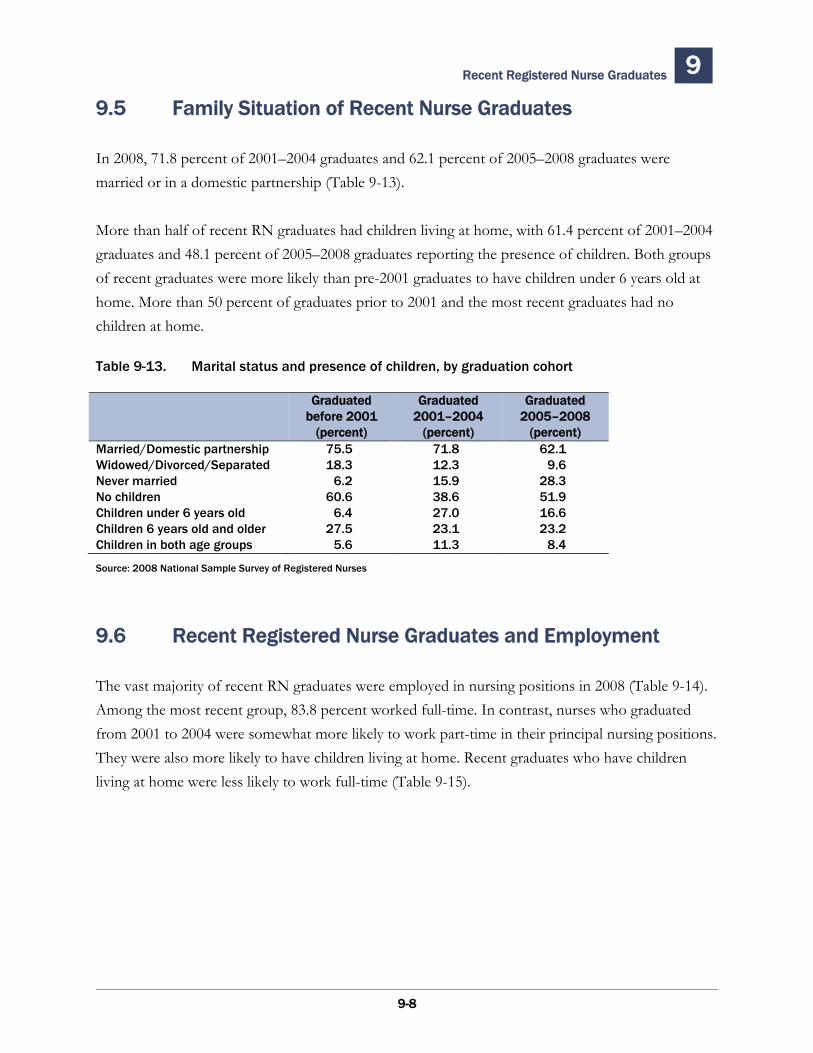
Recent Registered Nurse Graduates 9
9.5 Family Situation of Recent Nurse Graduates
In 2008, 71.8 percent of 2001–2004 graduates and 62.1 percent of 2005–2008 graduates were married or in a domestic partnership (Table 9-13).
More than half of recent RN graduates had children living at home, with 61.4 percent of 2001–2004 graduates and 48.1 percent of 2005–2008 graduates reporting the presence of children. Both groups of recent graduates were more likely than pre-2001 graduates to have children under 6 years old at home. More than 50 percent of graduates prior to 2001 and the most recent graduates had no children at home.
Table 9-13. Marital status and presence of children, by graduation cohort
Graduated Graduated Graduated before 2001 2001–2004 2005–2008
(percent) (percent) (percent) Married/Domestic partnership 75.5 71.8 62.1Widowed/Divorced/Separated 18.3 12.3 9.6Never married 6.2 15.9 28.3No children 60.6 38.6 51.9Children under 6 years old 6.4 27.0 16.6Children 6 years old and older 27.5 23.1 23.2Children in both age groups 5.6 11.3 8.4
Source: 2008 National Sample Survey of Registered Nurses
9.6 Recent Registered Nurse Graduates and Employment
The vast majority of recent RN graduates were employed in nursing positions in 2008 (Table 9-14). Among the most recent group, 83.8 percent worked full-time. In contrast, nurses who graduated from 2001 to 2004 were somewhat more likely to work part-time in their principal nursing positions. They were also more likely to have children living at home. Recent graduates who have children living at home were less likely to work full-time (Table 9-15).
9-8
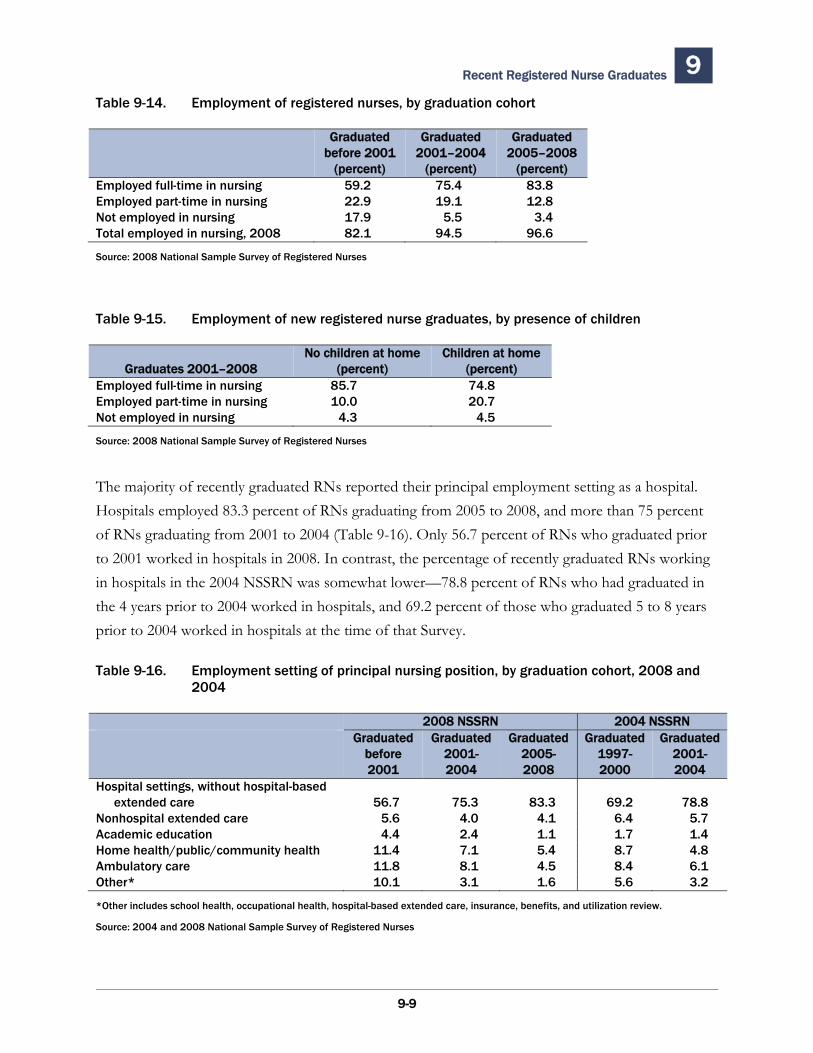
Recent Registered Nurse Graduates 9 Table 9-14. Employment of registered nurses, by graduation cohort
Graduated Graduated Graduated before 2001 2001–2004 2005–2008
(percent) (percent) (percent) Employed full-time in nursing 59.2 75.4 83.8Employed part-time in nursing 22.9 19.1 12.8Not employed in nursing 17.9 5.5 3.4Total employed in nursing, 2008 82.1 94.5 96.6
Source: 2008 National Sample Survey of Registered Nurses
Table 9-15. Employment of new registered nurse graduates, by presence of children
No children at home Children at homeGraduates 2001–2008 (percent) (percent)
Employed full-time in nursing 85.7 74.8Employed part-time in nursing 10.0 20.7Not employed in nursing 4.3 4.5
Source: 2008 National Sample Survey of Registered Nurses
The majority of recently graduated RNs reported their principal employment setting as a hospital. Hospitals employed 83.3 percent of RNs graduating from 2005 to 2008, and more than 75 percent of RNs graduating from 2001 to 2004 (Table 9-16). Only 56.7 percent of RNs who graduated prior to 2001 worked in hospitals in 2008. In contrast, the percentage of recently graduated RNs working in hospitals in the 2004 NSSRN was somewhat lower—78.8 percent of RNs who had graduated in the 4 years prior to 2004 worked in hospitals, and 69.2 percent of those who graduated 5 to 8 years prior to 2004 worked in hospitals at the time of that Survey.
Table 9-16. Employment setting of principal nursing position, by graduation cohort, 2008 and 2004
2008 NSSRN 2004 NSSRNGraduated Graduated Graduated Graduated Graduated
before 2001- 2005- 1997- 2001-2001 2004 2008 2000 2004
Hospital settings, without hospital-based extended care 56.7 75.3 83.3 69.2 78.8
Nonhospital extended care 5.6 4.0 4.1 6.4 5.7Academic education 4.4 2.4 1.1 1.7 1.4Home health/public/community health 11.4 7.1 5.4 8.7 4.8Ambulatory care 11.8 8.1 4.5 8.4 6.1Other* 10.1 3.1 1.6 5.6 3.2
*Other includes school health, occupational health, hospital-based extended care, insurance, benefits, and utilization review.
Source: 2004 and 2008 National Sample Survey of Registered Nurses
9-9
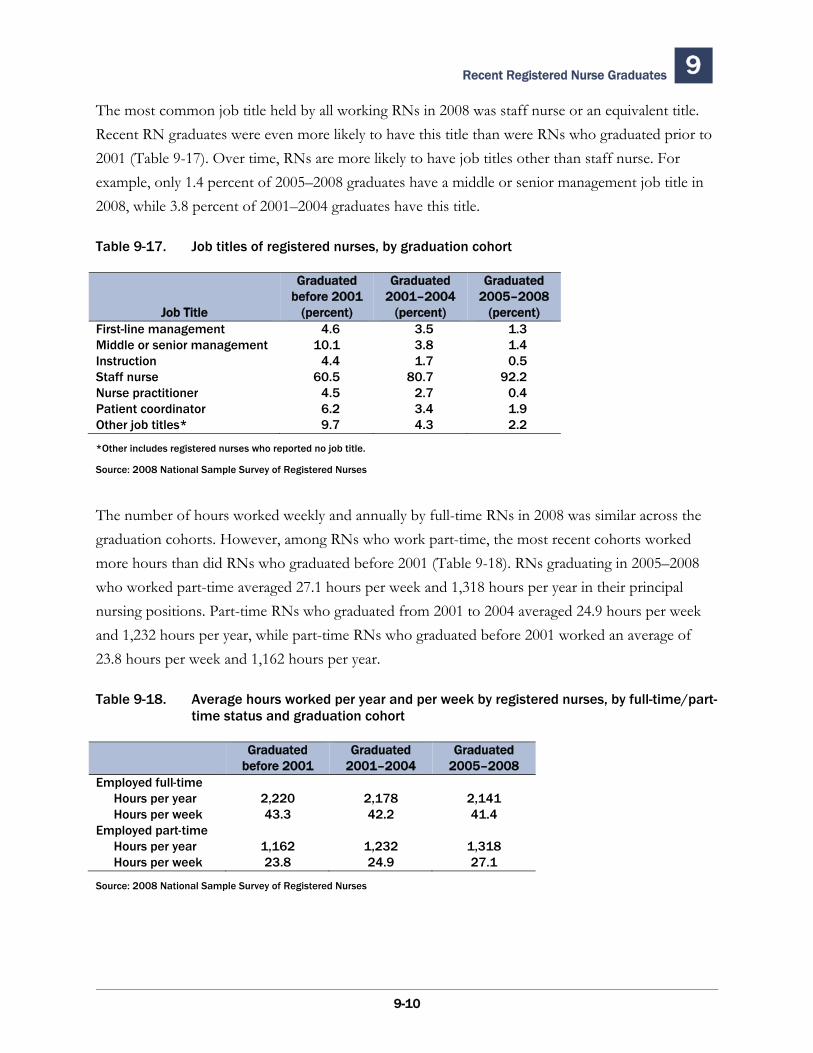
Recent Registered Nurse Graduates 9
The most common job title held by all working RNs in 2008 was staff nurse or an equivalent title. Recent RN graduates were even more likely to have this title than were RNs who graduated prior to 2001 (Table 9-17). Over time, RNs are more likely to have job titles other than staff nurse. For example, only 1.4 percent of 2005–2008 graduates have a middle or senior management job title in 2008, while 3.8 percent of 2001–2004 graduates have this title.
Table 9-17. Job titles of registered nurses, by graduation cohort
Graduated Graduated Graduated before 2001 2001–2004 2005–2008
Job Title (percent) (percent) (percent) First-line management 4.6 3.5 1.3Middle or senior management 10.1 3.8 1.4Instruction 4.4 1.7 0.5Staff nurse 60.5 80.7 92.2Nurse practitioner 4.5 2.7 0.4Patient coordinator 6.2 3.4 1.9Other job titles* 9.7 4.3 2.2
*Other includes registered nurses who reported no job title.
Source: 2008 National Sample Survey of Registered Nurses
The number of hours worked weekly and annually by full-time RNs in 2008 was similar across the graduation cohorts. However, among RNs who work part-time, the most recent cohorts worked more hours than did RNs who graduated before 2001 (Table 9-18). RNs graduating in 2005–2008 who worked part-time averaged 27.1 hours per week and 1,318 hours per year in their principal nursing positions. Part-time RNs who graduated from 2001 to 2004 averaged 24.9 hours per week and 1,232 hours per year, while part-time RNs who graduated before 2001 worked an average of 23.8 hours per week and 1,162 hours per year.
Table 9-18. Average hours worked per year and per week by registered nurses, by full-time/part-time status and graduation cohort
Graduated Graduated Graduated before 2001 2001–2004 2005–2008
Employed full-time Hours per year 2,220 2,178 2,141 Hours per week 43.3 42.2 41.4Employed part-time Hours per year 1,162 1,232 1,318 Hours per week 23.8 24.9 27.1
Source: 2008 National Sample Survey of Registered Nurses
9-10
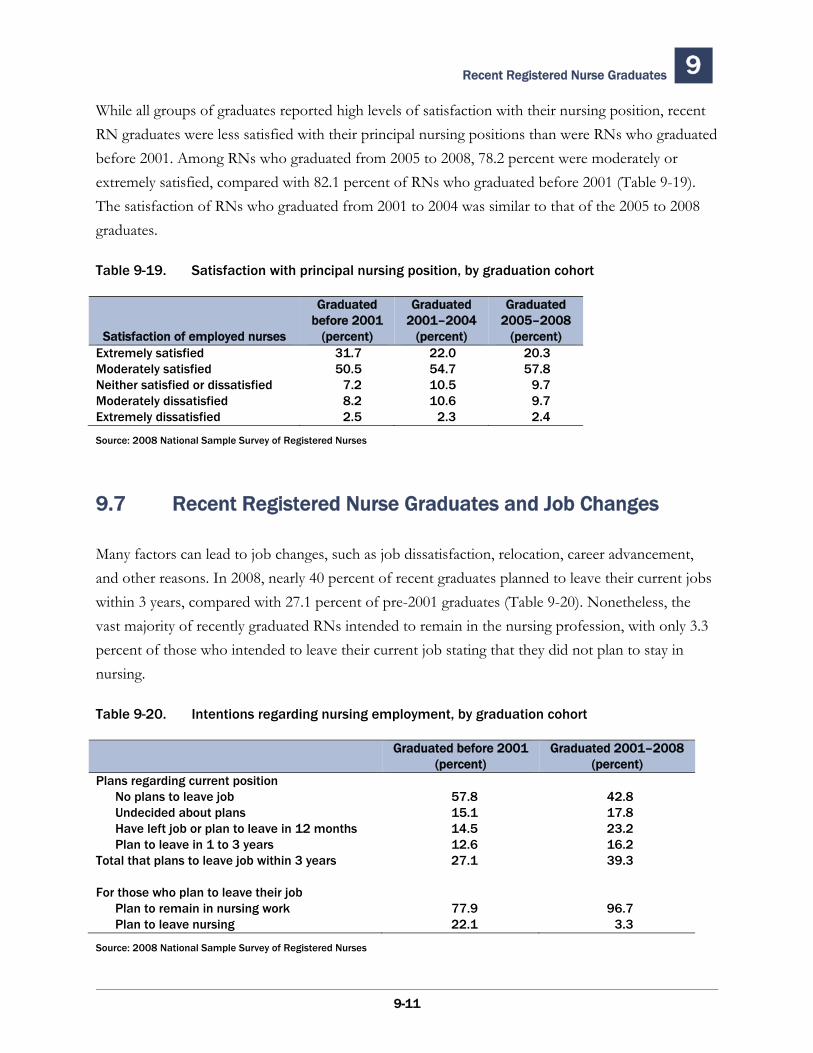
Recent Registered Nurse Graduates 9
While all groups of graduates reported high levels of satisfaction with their nursing position, recent RN graduates were less satisfied with their principal nursing positions than were RNs who graduated before 2001. Among RNs who graduated from 2005 to 2008, 78.2 percent were moderately or extremely satisfied, compared with 82.1 percent of RNs who graduated before 2001 (Table 9-19). The satisfaction of RNs who graduated from 2001 to 2004 was similar to that of the 2005 to 2008 graduates.
Table 9-19. Satisfaction with principal nursing position, by graduation cohort
Graduated Graduated Graduated before 2001 2001–2004 2005–2008
Satisfaction of employed nurses (percent) (percent) (percent) Extremely satisfied 31.7 22.0 20.3Moderately satisfied 50.5 54.7 57.8Neither satisfied or dissatisfied 7.2 10.5 9.7Moderately dissatisfied 8.2 10.6 9.7Extremely dissatisfied 2.5 2.3 2.4
Source: 2008 National Sample Survey of Registered Nurses
9.7 Recent Registered Nurse Graduates and Job Changes
Many factors can lead to job changes, such as job dissatisfaction, relocation, career advancement, and other reasons. In 2008, nearly 40 percent of recent graduates planned to leave their current jobs within 3 years, compared with 27.1 percent of pre-2001 graduates (Table 9-20). Nonetheless, the vast majority of recently graduated RNs intended to remain in the nursing profession, with only 3.3 percent of those who intended to leave their current job stating that they did not plan to stay in nursing.
Table 9-20. Intentions regarding nursing employment, by graduation cohort
Graduated before 2001 Graduated 2001–2008(percent) (percent)
Plans regarding current position No plans to leave job 57.8 42.8 Undecided about plans 15.1 17.8 Have left job or plan to leave in 12 months 14.5 23.2 Plan to leave in 1 to 3 years 12.6 16.2 Total that plans to leave job within 3 years 27.1 39.3
For those who plan to leave their job Plan to remain in nursing work 77.9 96.7 Plan to leave nursing 22.1 3.3
Source: 2008 National Sample Survey of Registered Nurses
9-11
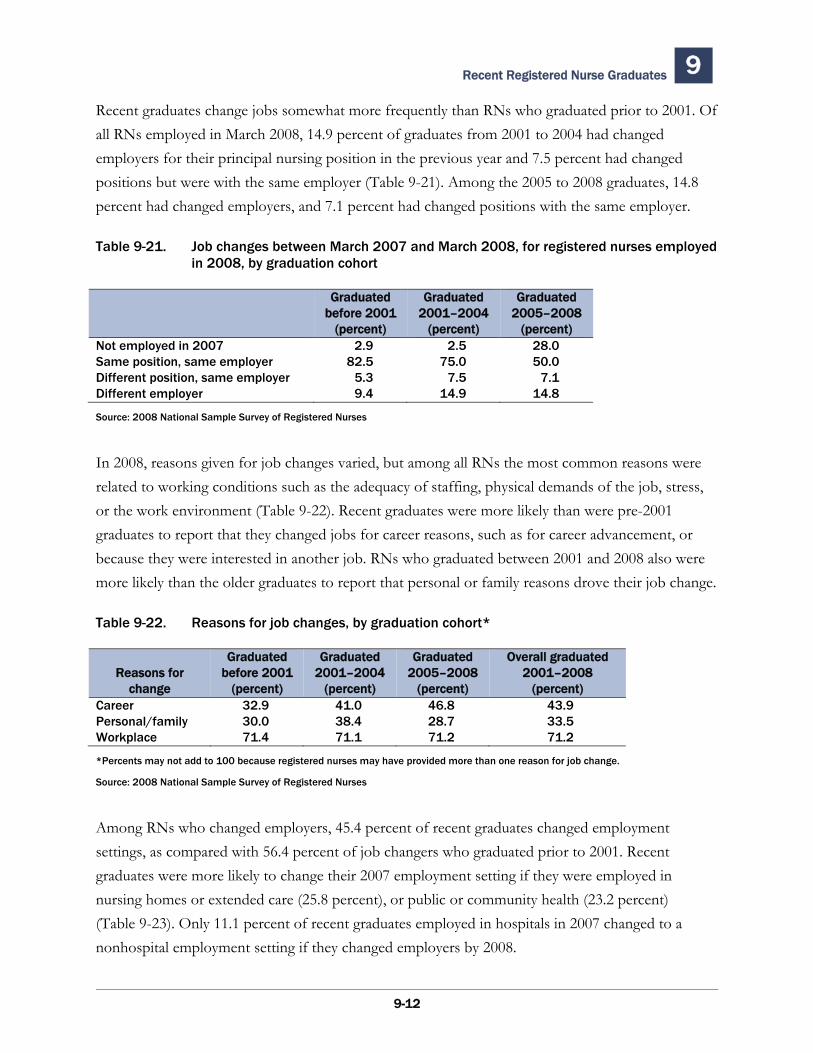
Recent Registered Nurse Graduates 9
Recent graduates change jobs somewhat more frequently than RNs who graduated prior to 2001. Of all RNs employed in March 2008, 14.9 percent of graduates from 2001 to 2004 had changed employers for their principal nursing position in the previous year and 7.5 percent had changed positions but were with the same employer (Table 9-21). Among the 2005 to 2008 graduates, 14.8 percent had changed employers, and 7.1 percent had changed positions with the same employer.
Table 9-21. Job changes between March 2007 and March 2008, for registered nurses employed in 2008, by graduation cohort
Graduated Graduated Graduated before 2001 2001–2004 2005–2008
(percent) (percent) (percent) Not employed in 2007 2.9 2.5 28.0Same position, same employer 82.5 75.0 50.0Different position, same employer 5.3 7.5 7.1Different employer 9.4 14.9 14.8
Source: 2008 National Sample Survey of Registered Nurses
In 2008, reasons given for job changes varied, but among all RNs the most common reasons were related to working conditions such as the adequacy of staffing, physical demands of the job, stress, or the work environment (Table 9-22). Recent graduates were more likely than were pre-2001 graduates to report that they changed jobs for career reasons, such as for career advancement, or because they were interested in another job. RNs who graduated between 2001 and 2008 also were more likely than the older graduates to report that personal or family reasons drove their job change.
Table 9-22. Reasons for job changes, by graduation cohort*
Graduated Graduated Graduated Overall graduated Reasons for before 2001 2001–2004 2005–2008 2001–2008
change (percent) (percent) (percent) (percent) Career 32.9 41.0 46.8 43.9 Personal/family 30.0 38.4 28.7 33.5 Workplace 71.4 71.1 71.2 71.2
*Percents may not add to 100 because registered nurses may have provided more than one reason for job change.
Source: 2008 National Sample Survey of Registered Nurses
Among RNs who changed employers, 45.4 percent of recent graduates changed employment settings, as compared with 56.4 percent of job changers who graduated prior to 2001. Recent graduates were more likely to change their 2007 employment setting if they were employed in nursing homes or extended care (25.8 percent), or public or community health (23.2 percent) (Table 9-23). Only 11.1 percent of recent graduates employed in hospitals in 2007 changed to a nonhospital employment setting if they changed employers by 2008.
9-12
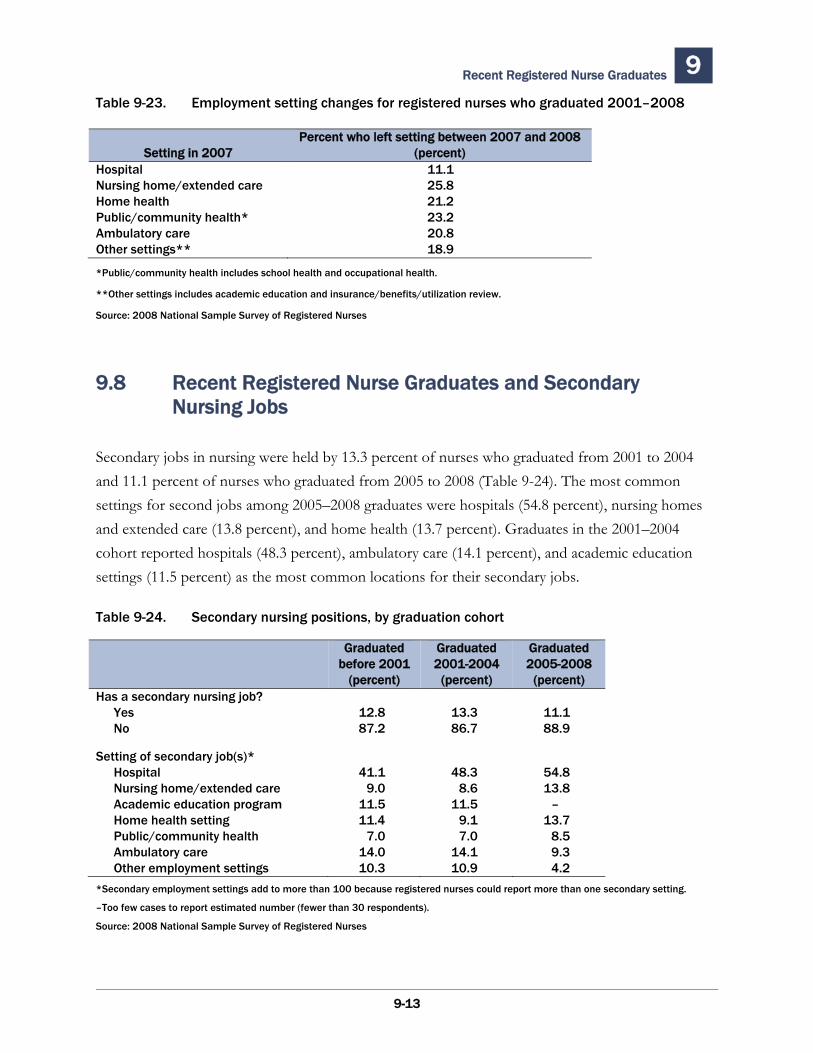
Recent Registered Nurse Graduates 9 Table 9-23. Employment setting changes for registered nurses who graduated 2001–2008
Percent who left setting between 2007 and 2008 Setting in 2007 (percent)
Hospital 11.1Nursing home/extended care 25.8Home health 21.2Public/community health* 23.2Ambulatory care 20.8Other settings** 18.9
*Public/community health includes school health and occupational health.
**Other settings includes academic education and insurance/benefits/utilization review.
Source: 2008 National Sample Survey of Registered Nurses
9.8 Recent Registered Nurse Graduates and Secondary Nursing Jobs
Secondary jobs in nursing were held by 13.3 percent of nurses who graduated from 2001 to 2004 and 11.1 percent of nurses who graduated from 2005 to 2008 (Table 9-24). The most common settings for second jobs among 2005–2008 graduates were hospitals (54.8 percent), nursing homes and extended care (13.8 percent), and home health (13.7 percent). Graduates in the 2001–2004 cohort reported hospitals (48.3 percent), ambulatory care (14.1 percent), and academic education settings (11.5 percent) as the most common locations for their secondary jobs.
Table 9-24. Secondary nursing positions, by graduation cohort
Graduated Graduated Graduated before 2001 2001-2004 2005-2008
(percent) (percent) (percent) Has a secondary nursing job?
Yes 12.8 13.3 11.1No 87.2 86.7 88.9
Setting of secondary job(s)* Hospital 41.1 48.3 54.8Nursing home/extended care 9.0 8.6 13.8Academic education program 11.5 11.5 –Home health setting 11.4 9.1 13.7Public/community health 7.0 7.0 8.5Ambulatory care 14.0 14.1 9.3Other employment settings 10.3 10.9 4.2
*Secondary employment settings add to more than 100 because registered nurses could report more than one secondary setting.
–Too few cases to report estimated number (fewer than 30 respondents).
Source: 2008 National Sample Survey of Registered Nurses
9-13
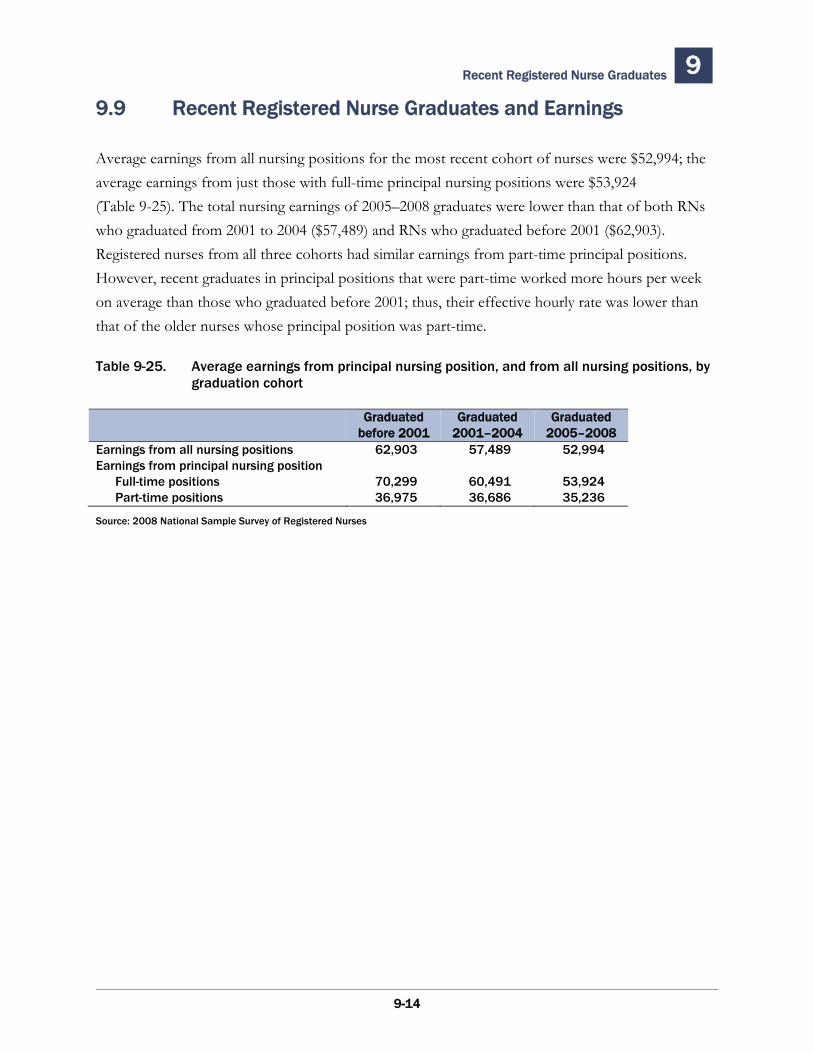
Recent Registered Nurse Graduates 9
9-14
9.9 Recent Registered Nurse Graduates and Earnings
Average earnings from all nursing positions for the most recent cohort of nurses were $52,994; the average earnings from just those with full-time principal nursing positions were $53,924 (Table 9-25). The total nursing earnings of 2005–2008 graduates were lower than that of both RNs who graduated from 2001 to 2004 ($57,489) and RNs who graduated before 2001 ($62,903). Registered nurses from all three cohorts had similar earnings from part-time principal positions. However, recent graduates in principal positions that were part-time worked more hours per week on average than those who graduated before 2001; thus, their effective hourly rate was lower than that of the older nurses whose principal position was part-time.
Table 9-25. Average earnings from principal nursing position, and from all nursing positions, by graduation cohort
Graduated Graduated Graduated before 2001 2001–2004 2005–2008
Earnings from all nursing positions 62,903 57,489 52,994 Earnings from principal nursing position Full-time positions 70,299 60,491 53,924 Part-time positions 36,975 36,686 35,236
Source: 2008 National Sample Survey of Registered Nurses
10-1
10.1 Introduction
This chapter describes the demographic, education, and employment characteristics of RNs 50 years of age and older. Historically, NSSRN data have shown a decline in work participation around this age. However, retirement literature fails to provide guidance on when RNs actually retire from the nursing workforce and when they allow their nursing license to lapse. In this chapter, “older RNs” are defined as the RN population that is 50 years of age or older, while “younger RNs” refers to RNs younger than 50 years of age in 2008.1
10.2 Demographics Characteristics of Registered Nurses Nearing Retirement
Older RNs comprised 44.7 percent of the total RN population in 2008, compared with 41.1 percent in 2004 and 33.4 percent in 2000. The percentage of RNs who were 60 years and older increased from 13.6 percent in 2004 to 15.5 percent in 2008 (Figure 3-3 and Appendix A, Table 1).
Older RNs in 2008 were more likely to be female (94.7 percent) and White, non-Hispanic (87.2 percent) than younger nurses (Table 10-1).
Older nurses were also more likely than younger nurses to have received their initial nursing education through a diploma program and less likely to have received their initial education through a bachelor’s program (Table 10-1). A greater percentage of older RNs have attained master’s or doctorate degrees (16.8 percent) than have younger nurses (10.3 percent).
1 The NSSRN data reflect only those RNs with active licenses and do not reflect RNs whose licenses have lapsed and have not been renewed.
Registered Nurses Nearing Retirement 10
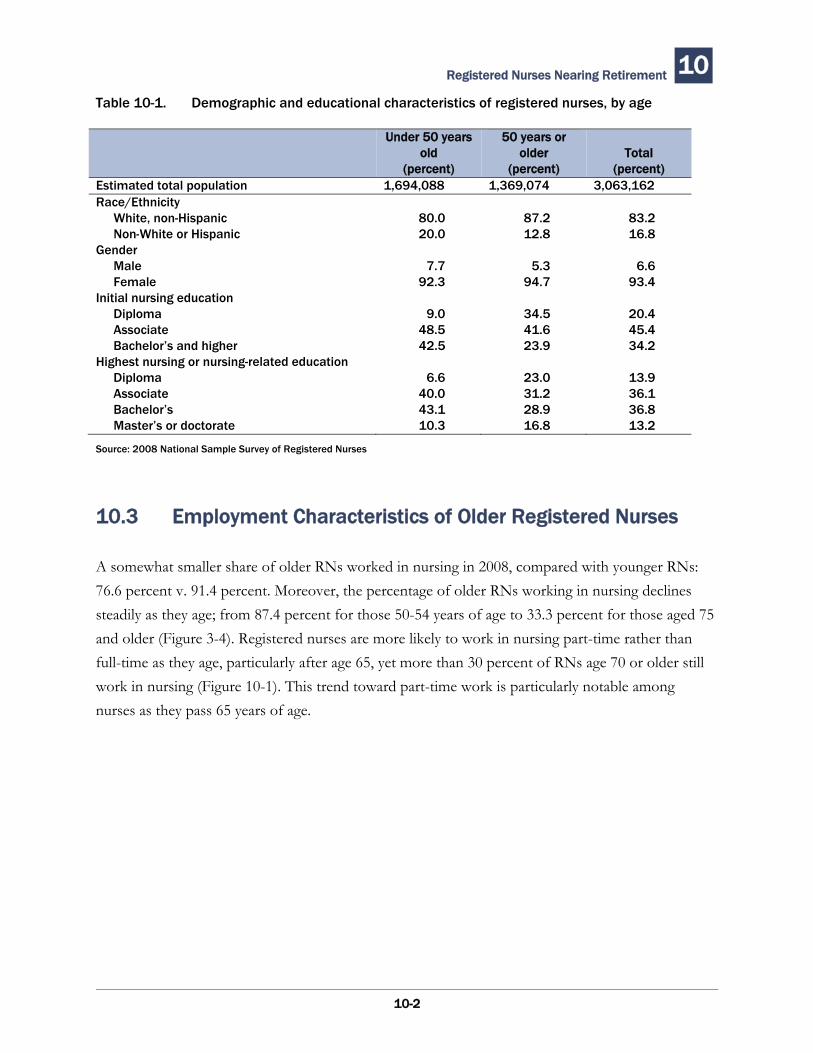
Registered Nurses Nearing Retirement 10 Table 10-1. Demographic and educational characteristics of registered nurses, by age
Under 50 years old
(percent)
50 years or older
(percent) Total
(percent) Estimated total population 1,694,088 1,369,074 3,063,162Race/Ethnicity White, non-Hispanic Non-White or Hispanic Gender Male Female Initial nursing education Diploma Associate Bachelor’s and higher Highest nursing or nursing-related education Diploma Associate Bachelor’s Master’s or doctorate
80.020.0
7.792.3
9.048.542.5
6.640.043.110.3
87.212.8
5.394.7
34.541.623.9
23.031.228.916.8
83.216.8
6.693.4
20.445.434.2
13.936.136.813.2
Source: 2008 National Sample Survey of Registered Nurses
10.3 Employment Characteristics of Older Registered Nurses
A somewhat smaller share of older RNs worked in nursing in 2008, compared with younger RNs: 76.6 percent v. 91.4 percent. Moreover, the percentage of older RNs working in nursing declines steadily as they age; from 87.4 percent for those 50-54 years of age to 33.3 percent for those aged 75 and older (Figure 3-4). Registered nurses are more likely to work in nursing part-time rather than full-time as they age, particularly after age 65, yet more than 30 percent of RNs age 70 or older still work in nursing (Figure 10-1). This trend toward part-time work is particularly notable among nurses as they pass 65 years of age.
10-2
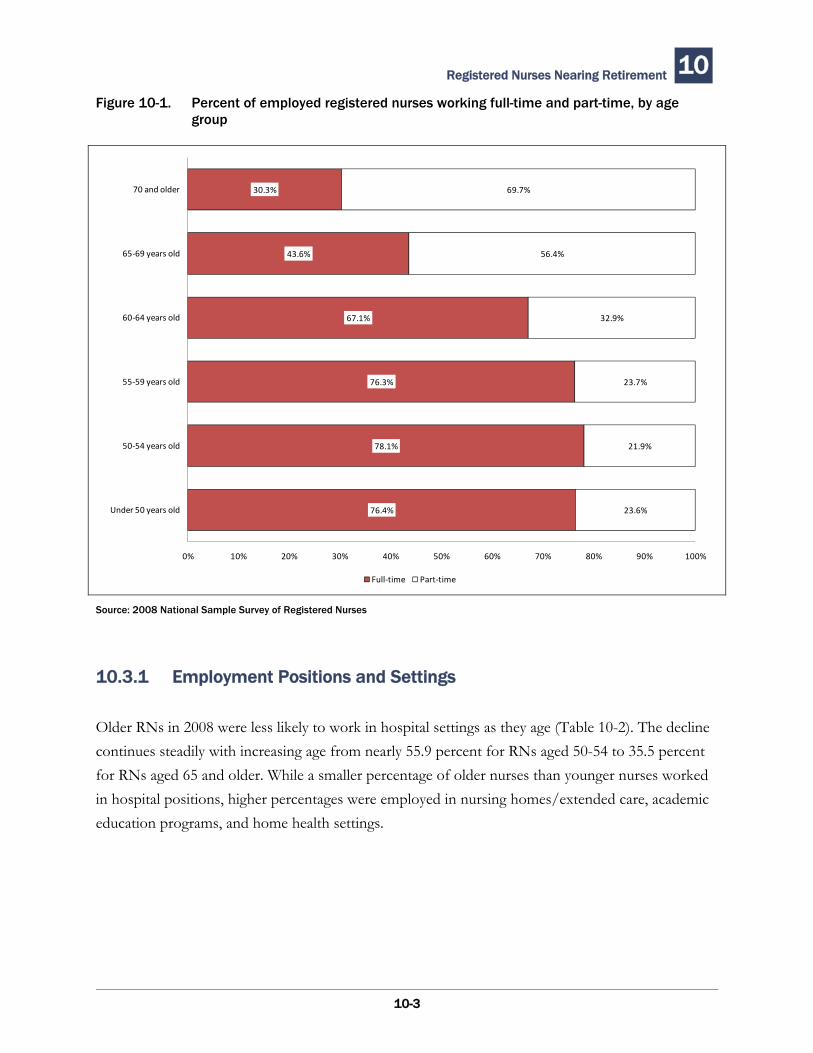
Registered Nurses Nearing Retirement 10 Figure 10-1. Percent of employed registered nurses working full-time and part-time, by age
group
76.4%
78.1%
76.3%
67.1%
43.6%
70 and older 30.3% 69.7%
65‐69 years old 56.4%
60‐64 years old 32.9%
55‐59 years old 23.7%
50‐54 years old 21.9%
Under 50 years old 23.6%
0% 10% 20% 30% 40% 50% 60% 70% 80% 90% 100%
Full‐time Part‐time
Source: 2008 National Sample Survey of Registered Nurses
10.3.1 Employment Positions and Settings
Older RNs in 2008 were less likely to work in hospital settings as they age (Table 10-2). The decline continues steadily with increasing age from nearly 55.9 percent for RNs aged 50-54 to 35.5 percent for RNs aged 65 and older. While a smaller percentage of older nurses than younger nurses worked in hospital positions, higher percentages were employed in nursing homes/extended care, academic education programs, and home health settings.
10-3
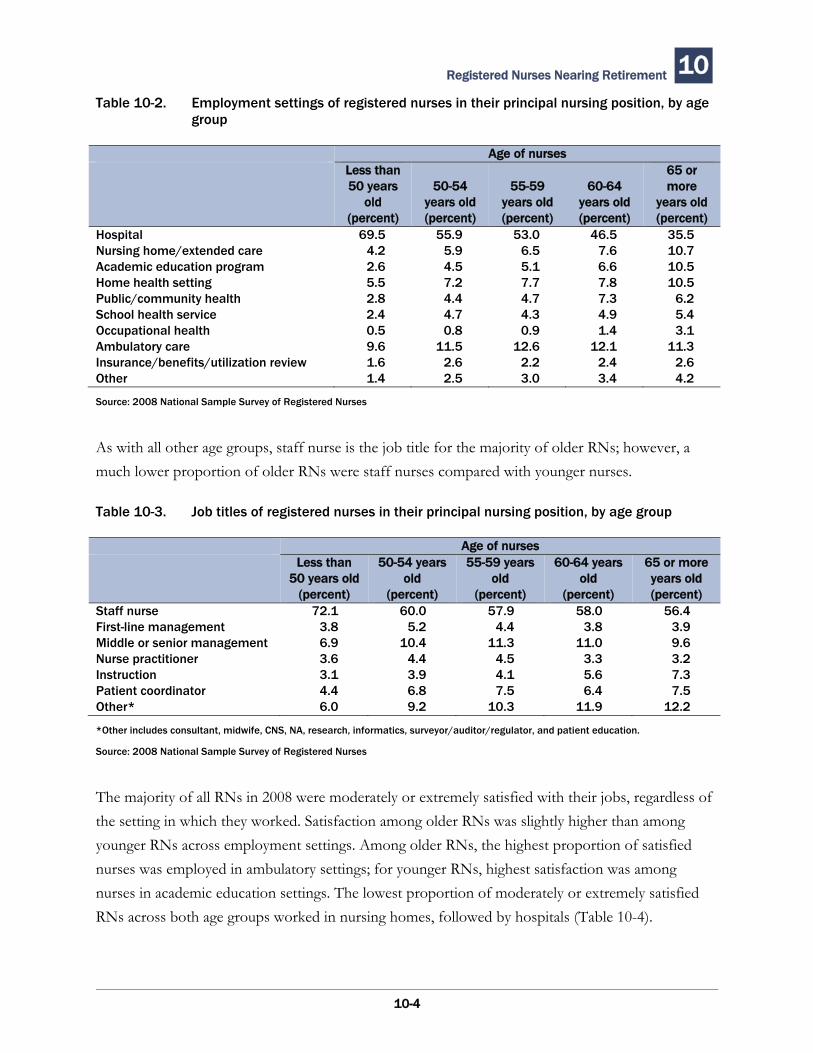
Registered Nurses Nearing Retirement 10 Table 10-2. Employment settings of registered nurses in their principal nursing position, by age
group
Age of nursesLess than 50 years
old (percent)
50-54 years old (percent)
55-59 years old (percent)
60-64 years old (percent)
65 or more
years old (percent)
Hospital Nursing home/extended care Academic education program Home health setting Public/community health School health service Occupational health Ambulatory care Insurance/benefits/utilization review Other
69.54.22.65.52.82.40.59.61.61.4
55.95.94.57.24.44.70.8
11.52.62.5
53.06.55.17.74.74.30.9
12.62.23.0
46.5 7.6 6.6 7.8 7.3 4.9 1.4
12.1 2.4 3.4
35.510.710.510.5
6.25.43.1
11.32.64.2
Source: 2008 National Sample Survey of Registered Nurses
As with all other age groups, staff nurse is the job title for the majority of older RNs; however, a much lower proportion of older RNs were staff nurses compared with younger nurses.
Table 10-3. Job titles of registered nurses in their principal nursing position, by age group
Age of nursesLess than 50-54 years 55-59 years 60-64 years 65 or more
50 years old old old old years old (percent) (percent) (percent) (percent) (percent)
Staff nurse 72.1 60.0 57.9 58.0 56.4First-line management 3.8 5.2 4.4 3.8 3.9Middle or senior management 6.9 10.4 11.3 11.0 9.6Nurse practitioner 3.6 4.4 4.5 3.3 3.2Instruction 3.1 3.9 4.1 5.6 7.3Patient coordinator 4.4 6.8 7.5 6.4 7.5Other* 6.0 9.2 10.3 11.9 12.2
*Other includes consultant, midwife, CNS, NA, research, informatics, surveyor/auditor/regulator, and patient education.
Source: 2008 National Sample Survey of Registered Nurses
The majority of all RNs in 2008 were moderately or extremely satisfied with their jobs, regardless of the setting in which they worked. Satisfaction among older RNs was slightly higher than among younger RNs across employment settings. Among older RNs, the highest proportion of satisfied nurses was employed in ambulatory settings; for younger RNs, highest satisfaction was among nurses in academic education settings. The lowest proportion of moderately or extremely satisfied RNs across both age groups worked in nursing homes, followed by hospitals (Table 10-4).
10-4
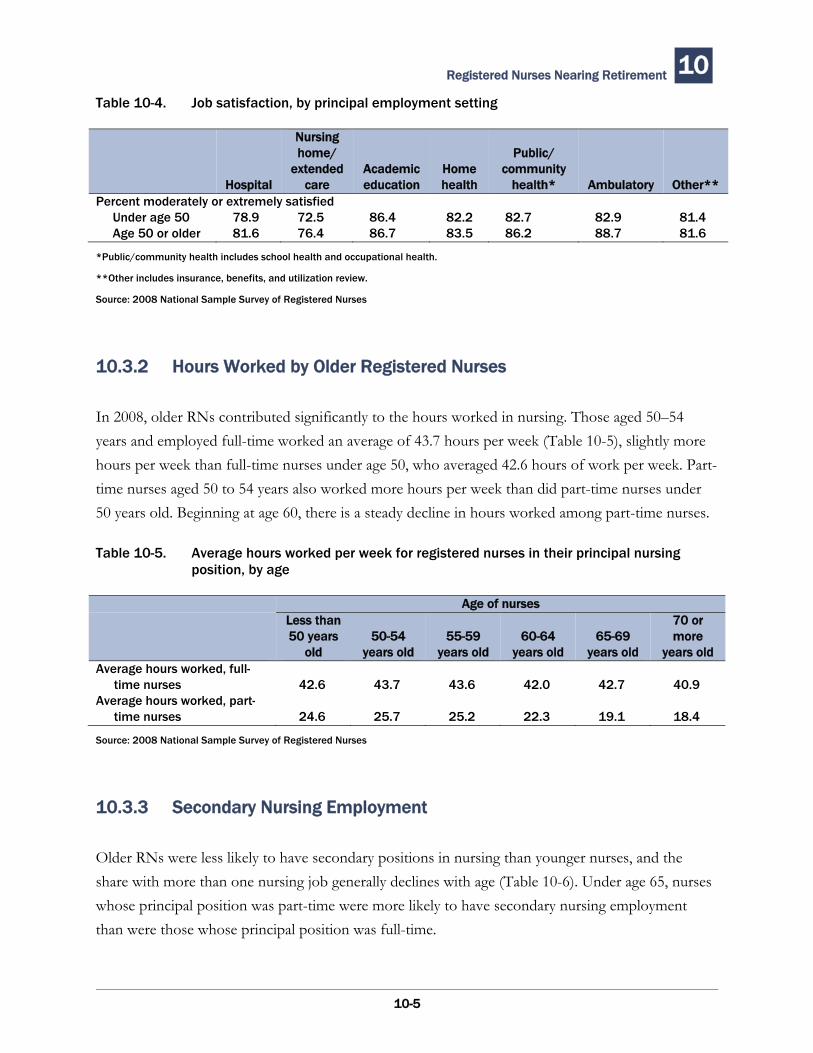
Registered Nurses Nearing Retirement 10 Table 10-4. Job satisfaction, by principal employment setting
Nursing home/ Public/
extended Academic Home community Hospital care education health health* Ambulatory Other**
Percent moderately or extremely satisfied Under age 50 78.9 72.5 86.4 82.2 82.7 82.9 81.4 Age 50 or older 81.6 76.4 86.7 83.5 86.2 88.7 81.6
*Public/community health includes school health and occupational health.
**Other includes insurance, benefits, and utilization review.
Source: 2008 National Sample Survey of Registered Nurses
10.3.2 Hours Worked by Older Registered Nurses
In 2008, older RNs contributed significantly to the hours worked in nursing. Those aged 50–54 years and employed full-time worked an average of 43.7 hours per week (Table 10-5), slightly more hours per week than full-time nurses under age 50, who averaged 42.6 hours of work per week. Part-time nurses aged 50 to 54 years also worked more hours per week than did part-time nurses under 50 years old. Beginning at age 60, there is a steady decline in hours worked among part-time nurses.
Table 10-5. Average hours worked per week for registered nurses in their principal nursing position, by age
Age of nursesLess than 70 or 50 years 50-54 55-59 60-64 65-69 more
old years old years old years old years old years old Average hours worked, full-
time nurses 42.6 43.7 43.6 42.0 42.7 40.9 Average hours worked, part-
time nurses 24.6 25.7 25.2 22.3 19.1 18.4
Source: 2008 National Sample Survey of Registered Nurses
10.3.3 Secondary Nursing Employment
Older RNs were less likely to have secondary positions in nursing than younger nurses, and the share with more than one nursing job generally declines with age (Table 10-6). Under age 65, nurses whose principal position was part-time were more likely to have secondary nursing employment than were those whose principal position was full-time.
10-5
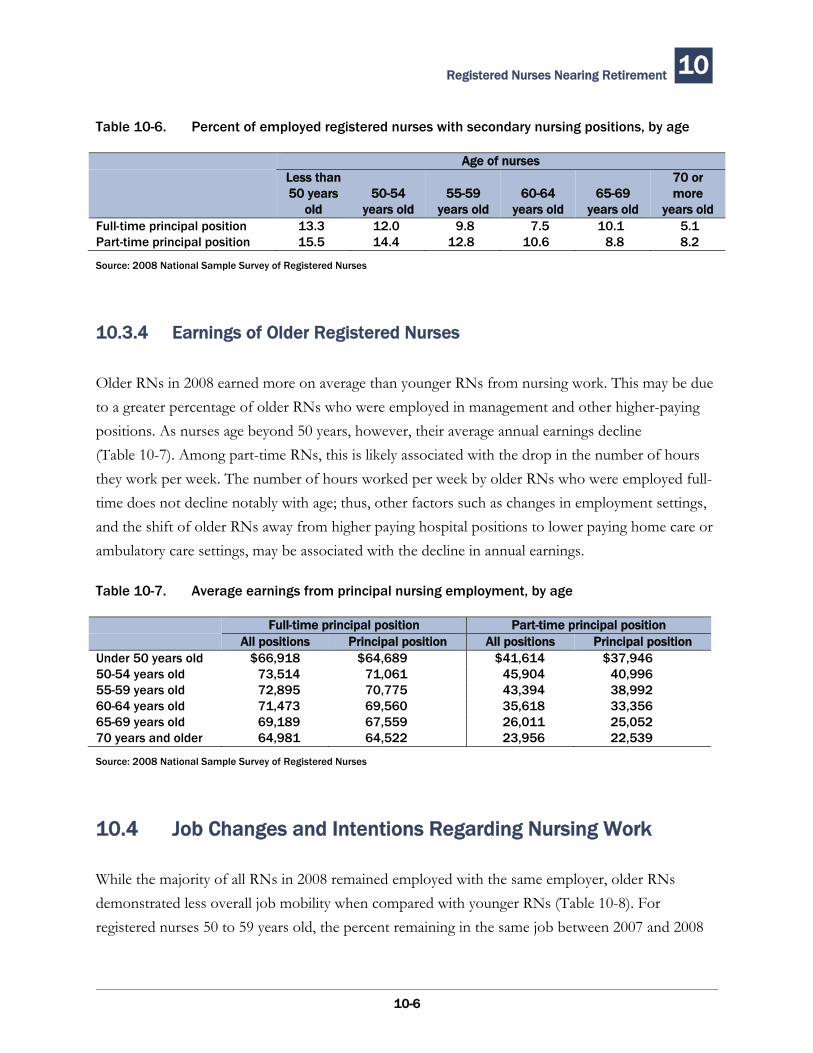
Registered Nurses Nearing Retirement 10
Table 10-6. Percent of employed registered nurses with secondary nursing positions, by age
Age of nursesLess than 70 or 50 years 50-54 55-59 60-64 65-69 more
old years old years old years old years old years old Full-time principal position 13.3 12.0 9.8 7.5 10.1 5.1Part-time principal position 15.5 14.4 12.8 10.6 8.8 8.2
Source: 2008 National Sample Survey of Registered Nurses
10.3.4 Earnings of Older Registered Nurses
Older RNs in 2008 earned more on average than younger RNs from nursing work. This may be due to a greater percentage of older RNs who were employed in management and other higher-paying positions. As nurses age beyond 50 years, however, their average annual earnings decline (Table 10-7). Among part-time RNs, this is likely associated with the drop in the number of hours they work per week. The number of hours worked per week by older RNs who were employed full-time does not decline notably with age; thus, other factors such as changes in employment settings, and the shift of older RNs away from higher paying hospital positions to lower paying home care or ambulatory care settings, may be associated with the decline in annual earnings.
Table 10-7. Average earnings from principal nursing employment, by age
Full-time principal position Part-time principal positionAll positions Principal position All positions Principal position
Under 50 years old $66,918 $64,689 $41,614 $37,946 50-54 years old 73,514 71,061 45,904 40,996 55-59 years old 72,895 70,775 43,394 38,992 60-64 years old 71,473 69,560 35,618 33,356 65-69 years old 69,189 67,559 26,011 25,052 70 years and older 64,981 64,522 23,956 22,539
Source: 2008 National Sample Survey of Registered Nurses
10.4 Job Changes and Intentions Regarding Nursing Work
While the majority of all RNs in 2008 remained employed with the same employer, older RNs demonstrated less overall job mobility when compared with younger RNs (Table 10-8). For registered nurses 50 to 59 years old, the percent remaining in the same job between 2007 and 2008
10-6
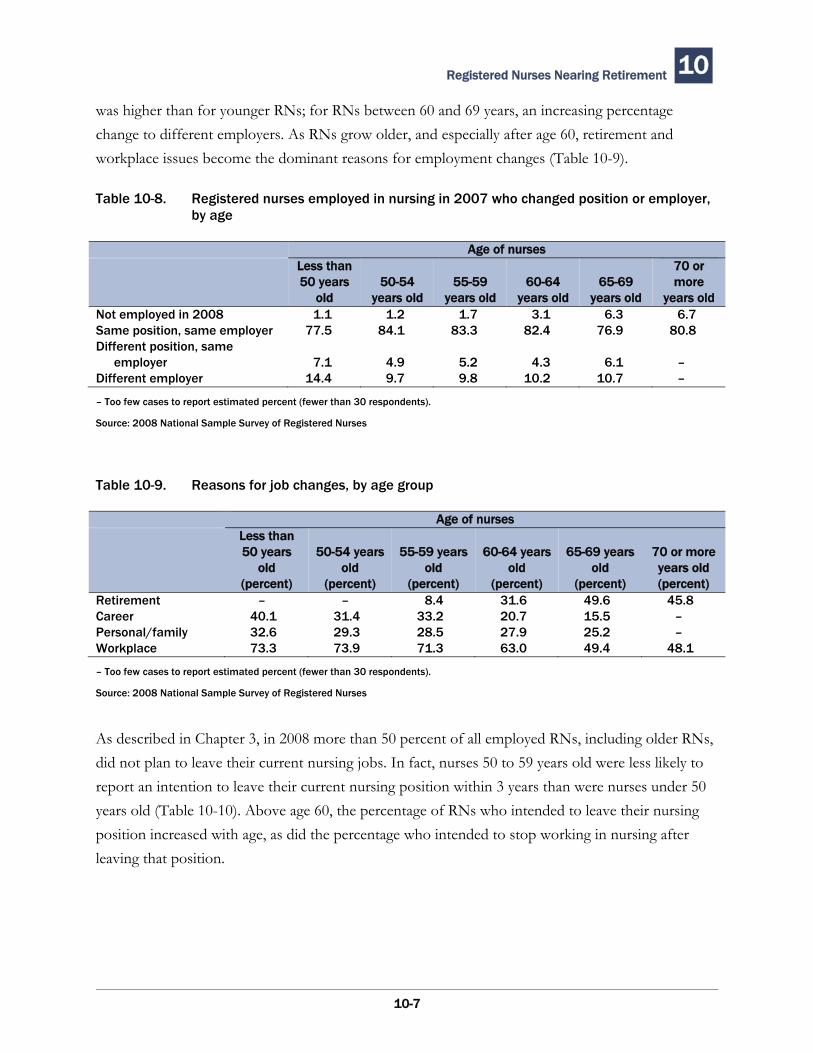
Registered Nurses Nearing Retirement 10
was higher than for younger RNs; for RNs between 60 and 69 years, an increasing percentage change to different employers. As RNs grow older, and especially after age 60, retirement and workplace issues become the dominant reasons for employment changes (Table 10-9).
Table 10-8. Registered nurses employed in nursing in 2007 who changed position or employer, by age
Age of nursesLess than 70 or 50 years 50-54 55-59 60-64 65-69 more
old years old years old years old years old years old Not employed in 2008 1.1 1.2 1.7 3.1 6.3 6.7Same position, same employer 77.5 84.1 83.3 82.4 76.9 80.8Different position, same
employer 7.1 4.9 5.2 4.3 6.1 – Different employer 14.4 9.7 9.8 10.2 10.7 –
– Too few cases to report estimated percent (fewer than 30 respondents).
Source: 2008 National Sample Survey of Registered Nurses
Table 10-9. Reasons for job changes, by age group
Age of nursesLess than 50 years 50-54 years 55-59 years 60-64 years 65-69 years 70 or more
old old old old old years old (percent) (percent) (percent) (percent) (percent) (percent)
Retirement – – 8.4 31.6 49.6 45.8Career 40.1 31.4 33.2 20.7 15.5 –Personal/family 32.6 29.3 28.5 27.9 25.2 –Workplace 73.3 73.9 71.3 63.0 49.4 48.1
– Too few cases to report estimated percent (fewer than 30 respondents).
Source: 2008 National Sample Survey of Registered Nurses
As described in Chapter 3, in 2008 more than 50 percent of all employed RNs, including older RNs, did not plan to leave their current nursing jobs. In fact, nurses 50 to 59 years old were less likely to report an intention to leave their current nursing position within 3 years than were nurses under 50 years old (Table 10-10). Above age 60, the percentage of RNs who intended to leave their nursing position increased with age, as did the percentage who intended to stop working in nursing after leaving that position.
10-7
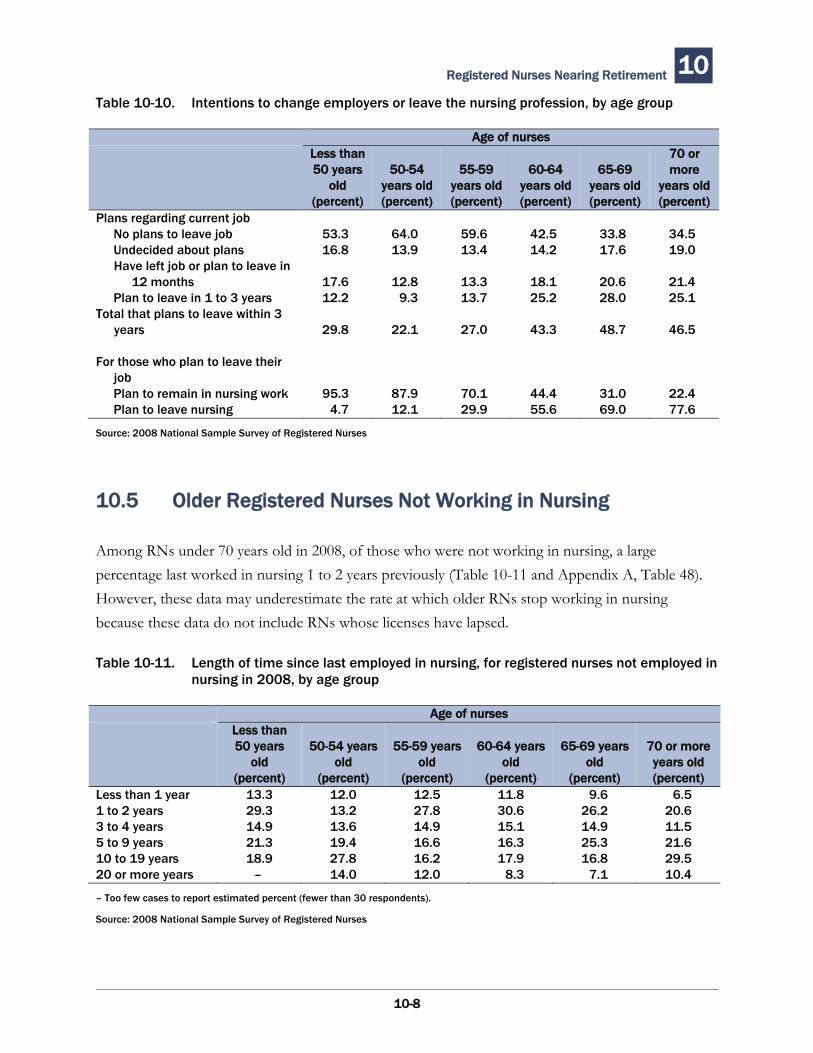
Registered Nurses Nearing Retirement 10 Table 10-10. Intentions to change employers or leave the nursing profession, by age group
Age of nursesLess than50 years
old (percent)
50-54 years old (percent)
55-59 years old (percent)
60-64 years old (percent)
65-69 years old (percent)
70 or more
years old (percent)
Plans regarding current job No plans to leave job Undecided about plans
Have left job or plan to leave in 12 months
Plan to leave in 1 to 3 years Total that plans to leave within 3
years
For those who plan to leave their job
Plan to remain in nursing work Plan to leave nursing
53.316.8
17.6 12.2
29.8
95.34.7
64.013.9
12.8 9.3
22.1
87.912.1
59.613.4
13.3 13.7
27.0
70.129.9
42.514.2
18.1 25.2
43.3
44.455.6
33.8 17.6
20.6 28.0
48.7
31.0 69.0
34.519.0
21.4 25.1
46.5
22.477.6
Source: 2008 National Sample Survey of Registered Nurses
10.5 Older Registered Nurses Not Working in Nursing
Among RNs under 70 years old in 2008, of those who were not working in nursing, a large percentage last worked in nursing 1 to 2 years previously (Table 10-11 and Appendix A, Table 48). However, these data may underestimate the rate at which older RNs stop working in nursing because these data do not include RNs whose licenses have lapsed.
Table 10-11. Length of time since last employed in nursing, for registered nurses not employed in nursing in 2008, by age group
Age of nursesLess than 50 years 50-54 years 55-59 years 60-64 years 65-69 years 70 or more
old old old old old years old (percent) (percent) (percent) (percent) (percent) (percent)
Less than 1 year 13.3 12.0 12.5 11.8 9.6 6.51 to 2 years 29.3 13.2 27.8 30.6 26.2 20.63 to 4 years 14.9 13.6 14.9 15.1 14.9 11.55 to 9 years 21.3 19.4 16.6 16.3 25.3 21.610 to 19 years 18.9 27.8 16.2 17.9 16.8 29.520 or more years – 14.0 12.0 8.3 7.1 10.4
– Too few cases to report estimated percent (fewer than 30 respondents).
Source: 2008 National Sample Survey of Registered Nurses
10-8
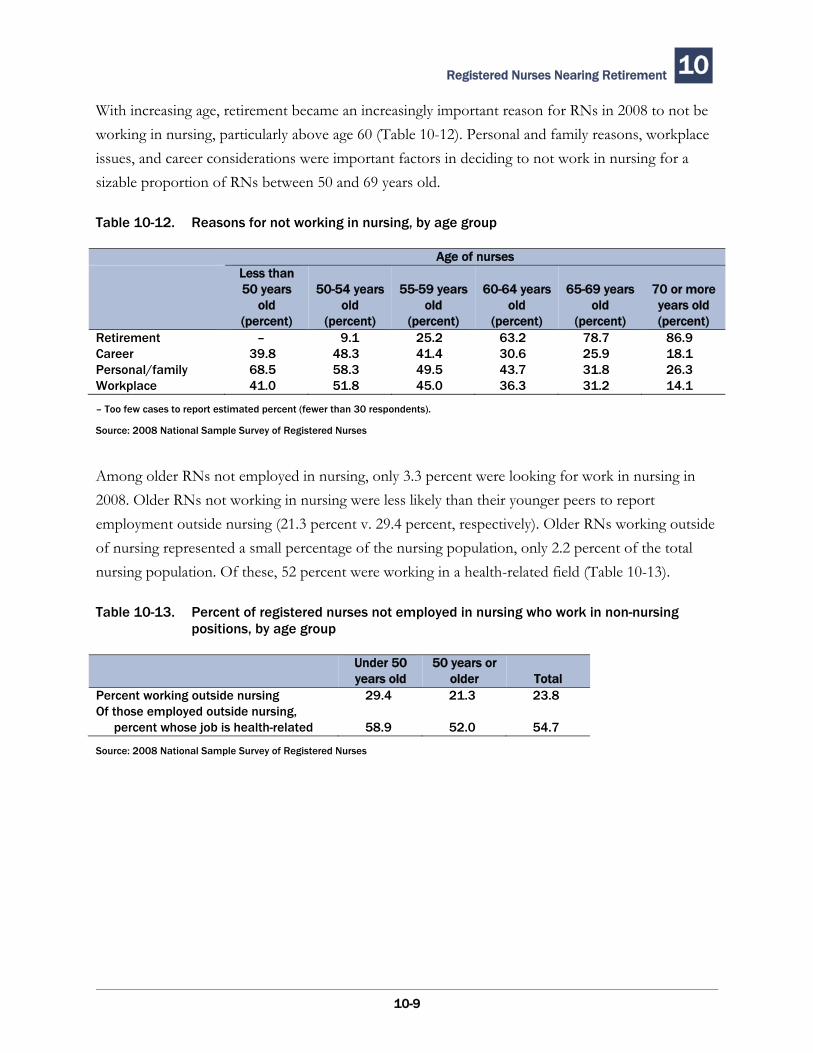
Registered Nurses Nearing Retirement 10
With increasing age, retirement became an increasingly important reason for RNs in 2008 to not be working in nursing, particularly above age 60 (Table 10-12). Personal and family reasons, workplace issues, and career considerations were important factors in deciding to not work in nursing for a sizable proportion of RNs between 50 and 69 years old.
Table 10-12. Reasons for not working in nursing, by age group
Age of nursesLess than 50 years 50-54 years 55-59 years 60-64 years 65-69 years 70 or more
old old old old old years old (percent) (percent) (percent) (percent) (percent) (percent)
Retirement – 9.1 25.2 63.2 78.7 86.9Career 39.8 48.3 41.4 30.6 25.9 18.1Personal/family 68.5 58.3 49.5 43.7 31.8 26.3Workplace 41.0 51.8 45.0 36.3 31.2 14.1
– Too few cases to report estimated percent (fewer than 30 respondents).
Source: 2008 National Sample Survey of Registered Nurses
Among older RNs not employed in nursing, only 3.3 percent were looking for work in nursing in 2008. Older RNs not working in nursing were less likely than their younger peers to report employment outside nursing (21.3 percent v. 29.4 percent, respectively). Older RNs working outside of nursing represented a small percentage of the nursing population, only 2.2 percent of the total nursing population. Of these, 52 percent were working in a health-related field (Table 10-13).
Table 10-13. Percent of registered nurses not employed in nursing who work in non-nursing positions, by age group
Under 50 50 years or years old older Total
Percent working outside nursing 29.4 21.3 23.8Of those employed outside nursing,
percent whose job is health-related 58.9 52.0 54.7
Source: 2008 National Sample Survey of Registered Nurses
10-9

Registered Nurses Nearing Retirement 10
10-10
This page deliberately blank.

Appendix A
Data Tables

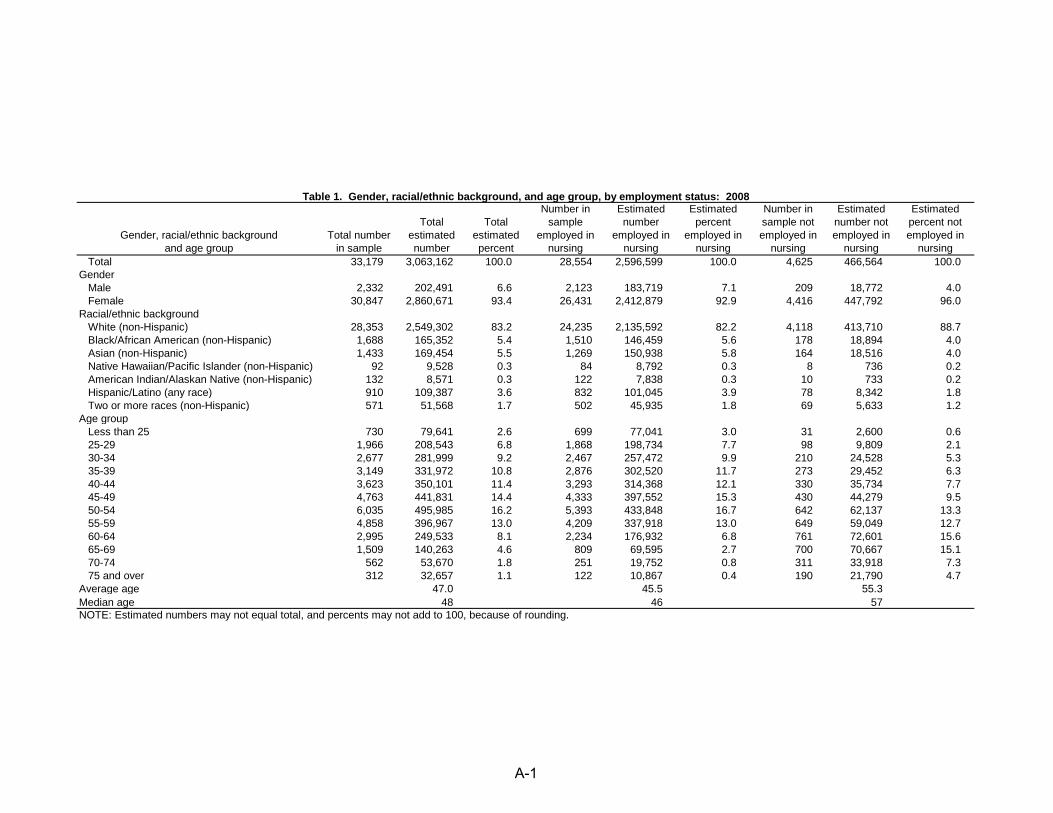
Table 1. Gender, racial/ethnic background, and age group, by employment status: 2008
Gender, racial/ethnic background and age group
Total number in sample
Total estimated number
Total estimated percent
Number in sample
employed in nursing
Estimated number
employed in nursing
Estimated percent
employed in nursing
Number in sample not employed in
nursing
Estimated number not employed in
nursing
Estimated percent not employed in
nursing Total 33,179 3,063,162 100.0 28,554 2,596,599 100.0 4,625 466,564 100.0Gender Male 2,332 202,491 6.6 2,123 183,719 7.1 209 18,772 4.0 Female 30,847 2,860,671 93.4 26,431 2,412,879 92.9 4,416 447,792 96.0Racial/ethnic background White (non-Hispanic) 28,353 2,549,302 83.2 24,235 2,135,592 82.2 4,118 413,710 88.7 Black/African American (non-Hispanic) 1,688 165,352 5.4 1,510 146,459 5.6 178 18,894 4.0 Asian (non-Hispanic) 1,433 169,454 5.5 1,269 150,938 5.8 164 18,516 4.0 Native Hawaiian/Pacific Islander (non-Hispanic) 92 9,528 0.3 84 8,792 0.3 8 736 0.2 American Indian/Alaskan Native (non-Hispanic) 132 8,571 0.3 122 7,838 0.3 10 733 0.2 Hispanic/Latino (any race) 910 109,387 3.6 832 101,045 3.9 78 8,342 1.8 Two or more races (non-Hispanic) 571 51,568 1.7 502 45,935 1.8 69 5,633 1.2Age group Less than 25 730 79,641 2.6 699 77,041 3.0 31 2,600 0.6 25-29 1,966 208,543 6.8 1,868 198,734 7.7 98 9,809 2.1 30-34 2,677 281,999 9.2 2,467 257,472 9.9 210 24,528 5.3 35-39 3,149 331,972 10.8 2,876 302,520 11.7 273 29,452 6.3 40-44 3,623 350,101 11.4 3,293 314,368 12.1 330 35,734 7.7 45-49 4,763 441,831 14.4 4,333 397,552 15.3 430 44,279 9.5 50-54 6,035 495,985 16.2 5,393 433,848 16.7 642 62,137 13.3 55-59 4,858 396,967 13.0 4,209 337,918 13.0 649 59,049 12.7 60-64 2,995 249,533 8.1 2,234 176,932 6.8 761 72,601 15.6 65-69 1,509 140,263 4.6 809 69,595 2.7 700 70,667 15.1 70-74 562 53,670 1.8 251 19,752 0.8 311 33,918 7.3 75 and over 312 32,657 1.1 122 10,867 0.4 190 21,790 4.7Average age 47.0 45.5 55.3 Median age 48 46 57 NOTE: Estimated numbers may not equal total, and percents may not add to 100, because of rounding.
A-1
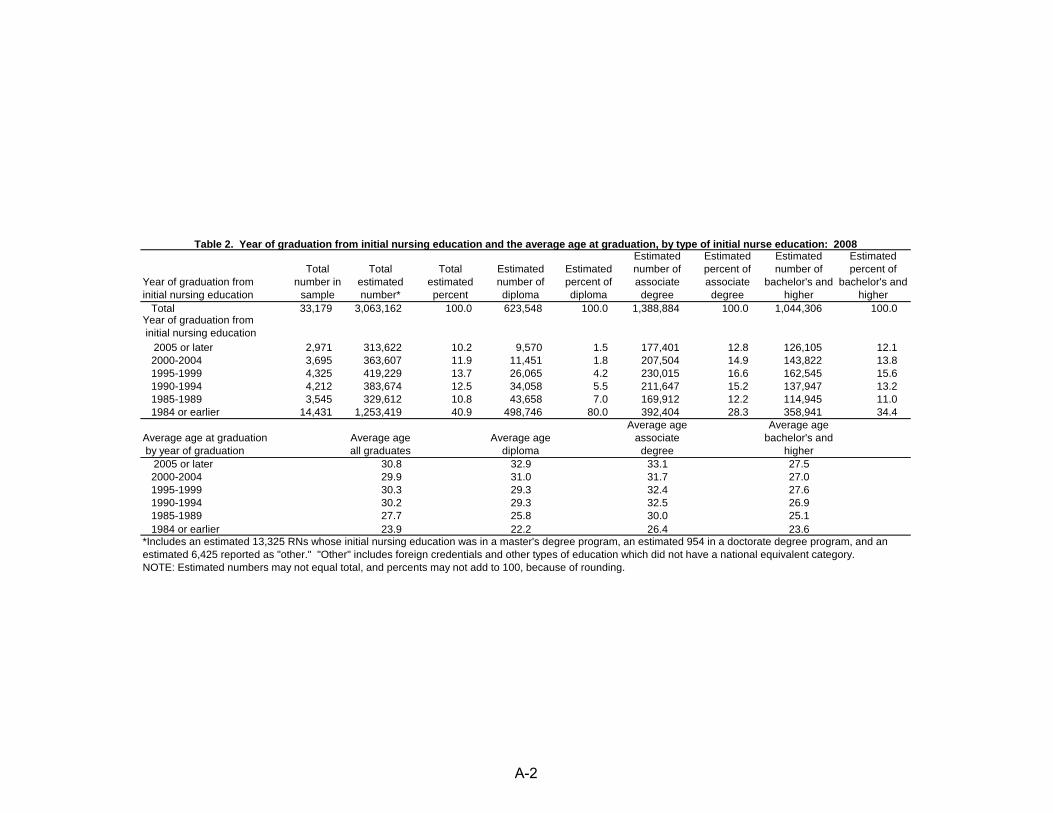
Table 2. Year of graduation from initial nursing education and the average age at graduation, by type of initial nurse education: 2008
Year of graduation from initial nursing education
Total number in
sample
Total estimated number*
Total estimated percent
Estimated number of diploma
Estimated percent of diploma
Estimated number of associate degree
Estimated percent of associate degree
Estimated number of
bachelor's and higher
Estimated percent of
bachelor's and higher
Total 33,179 3,063,162 100.0 623,548 100.0 1,388,884 100.0 1,044,306 100.0Year of graduation from initial nursing education
2005 or later 2,971 313,622 10.2 9,570 1.5 177,401 12.8 126,105 12.1 2000-2004 3,695 363,607 11.9 11,451 1.8 207,504 14.9 143,822 13.8 1995-1999 4,325 419,229 13.7 26,065 4.2 230,015 16.6 162,545 15.6 1990-1994 4,212 383,674 12.5 34,058 5.5 211,647 15.2 137,947 13.2 1985-1989 3,545 329,612 10.8 43,658 7.0 169,912 12.2 114,945 11.0 1984 or earlier 14,431 1,253,419 40.9 498,746 80.0 392,404 28.3 358,941 34.4
Average age at graduation by year of graduation
Average age all graduates
Average age diploma
Average age associate
degree
Average age bachelor's and
higher 2005 or later 30.8 32.9 33.1 27.5
2000-2004 29.9 31.0 31.7 27.0 1995-1999 30.3 29.3 32.4 27.6 1990-1994 30.2 29.3 32.5 26.9 1985-1989 27.7 25.8 30.0 25.1 1984 or earlier 23.9 22.2 26.4 23.6 *Includes an estimated 13,325 RNs whose initial nursing education was in a master's degree program, an estimated 954 in a doctorate degree program, and an estimated 6,425 reported as "other." "Other" includes foreign credentials and other types of education which did not have a national equivalent category.NOTE: Estimated numbers may not equal total, and percents may not add to 100, because of rounding.
A-2
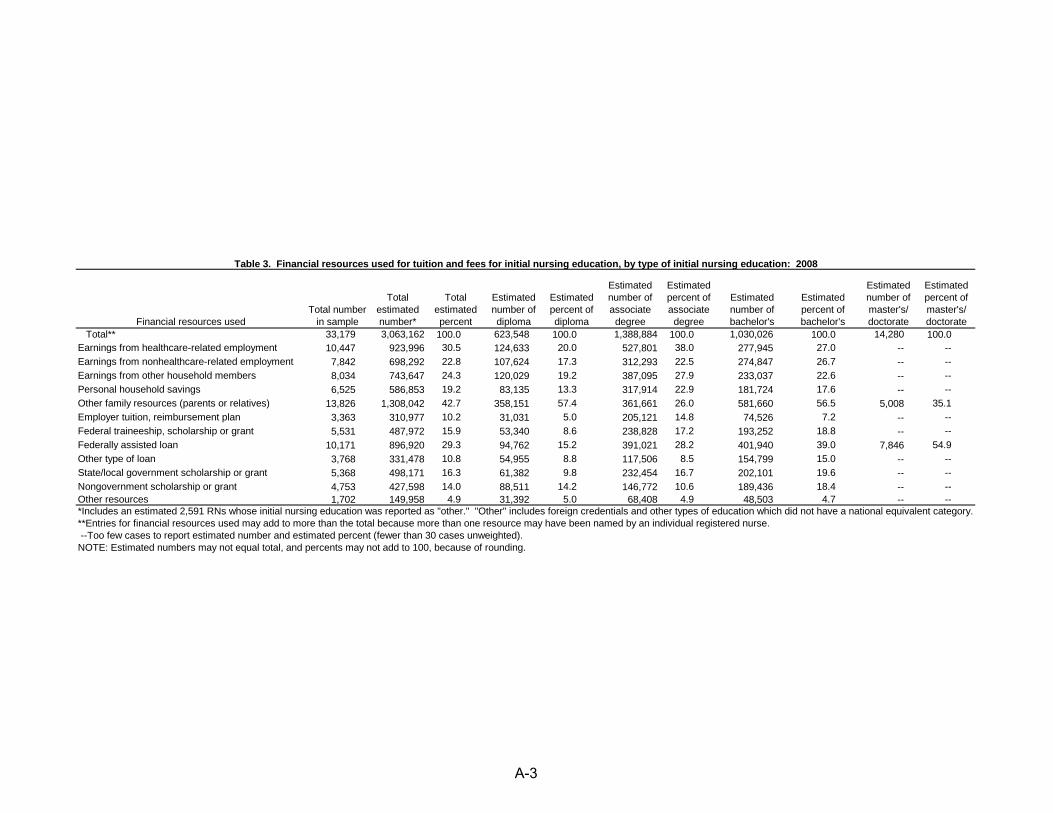
Table 3. Financial resources used for tuition and fees for initial nursing education, by type of initial nursing education: 2008
Financial resources usedTotal number
in sample
Total estimated number*
Total estimated percent
Estimated number of diploma
Estimated percent of diploma
Estimated number of associate
degree
Estimated percent of associate
degree
Estimated number of bachelor's
Estimated percent of bachelor's
Estimated number of master's/ doctorate
Estimated percent of master's/ doctorate
Total** 33,179 3,063,162 100.0 623,548 100.0 1,388,884 100.0 1,030,026 100.0 14,280 100.0Earnings from healthcare-related employment 10,447 923,996 30.5 124,633 20.0 527,801 38.0 277,945 27.0 -- --Earnings from nonhealthcare-related employment 7,842 698,292 22.8 107,624 17.3 312,293 22.5 274,847 26.7 -- --Earnings from other household members 8,034 743,647 24.3 120,029 19.2 387,095 27.9 233,037 22.6 -- --Personal household savings 6,525 586,853 19.2 83,135 13.3 317,914 22.9 181,724 17.6 -- --Other family resources (parents or relatives) 13,826 1,308,042 42.7 358,151 57.4 361,661 26.0 581,660 56.5 5,008 35.1Employer tuition, reimbursement plan 3,363 310,977 10.2 31,031 5.0 205,121 14.8 74,526 7.2 -- --Federal traineeship, scholarship or grant 5,531 487,972 15.9 53,340 8.6 238,828 17.2 193,252 18.8 -- --Federally assisted loan 10,171 896,920 29.3 94,762 15.2 391,021 28.2 401,940 39.0 7,846 54.9Other type of loan 3,768 331,478 10.8 54,955 8.8 117,506 8.5 154,799 15.0 -- --State/local government scholarship or grant 5,368 498,171 16.3 61,382 9.8 232,454 16.7 202,101 19.6 -- --Nongovernment scholarship or grant 4,753 427,598 14.0 88,511 14.2 146,772 10.6 189,436 18.4 -- --Other resources 1,702 149,958 4.9 31,392 5.0 68,408 4.9 48,503 4.7 -- --*Includes an estimated 2,591 RNs whose initial nursing education was reported as "other." "Other" includes foreign credentials and other types of education which did not have a national equivalent category.**Entries for financial resources used may add to more than the total because more than one resource may have been named by an individual registered nurse. --Too few cases to report estimated number and estimated percent (fewer than 30 cases unweighted).NOTE: Estimated numbers may not equal total, and percents may not add to 100, because of rounding.
A-3
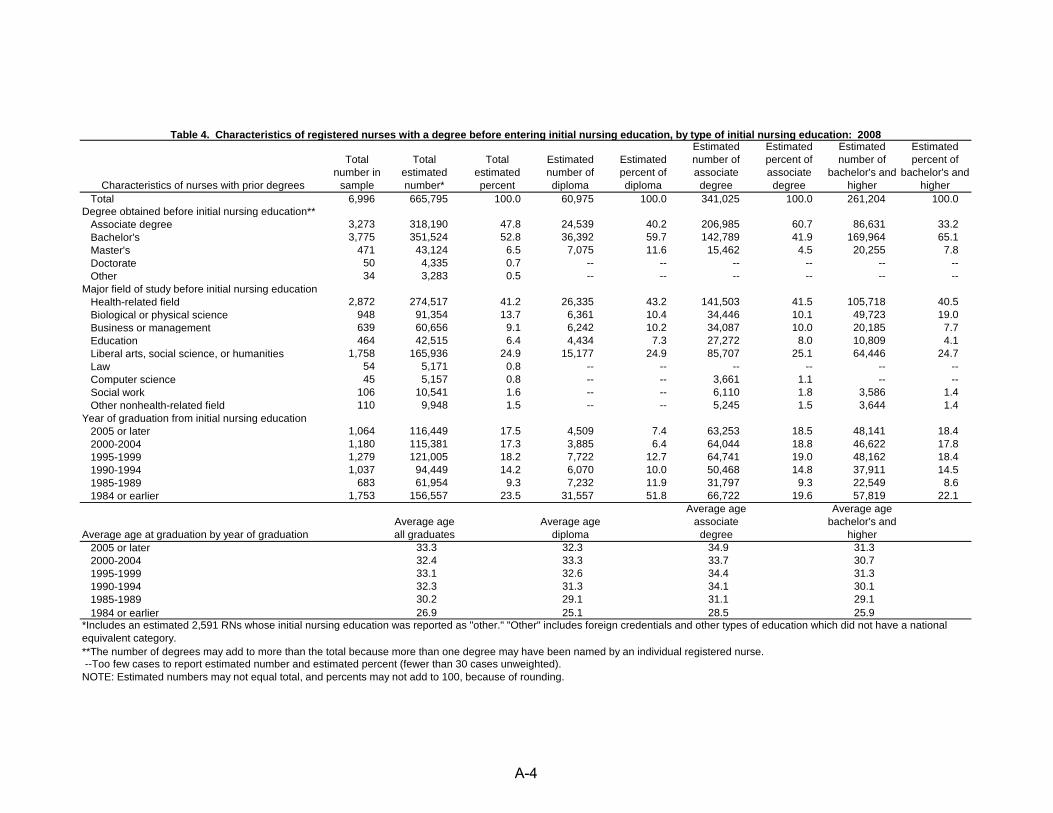
Table 4. Characteristics of registered nurses with a degree before entering initial nursing education, by type of initial nursing education: 2008
Characteristics of nurses with prior degrees
Total number in
sample
Total estimated number*
Total estimated percent
Estimated number of diploma
Estimated percent of diploma
Estimated number of associate degree
Estimated percent of associate degree
Estimated number of
bachelor's and higher
Estimated percent of
bachelor's and higher
Total 6,996 665,795 100.0 60,975 100.0 341,025 100.0 261,204 100.0Degree obtained before initial nursing education** Associate degree 3,273 318,190 47.8 24,539 40.2 206,985 60.7 86,631 33.2 Bachelor's 3,775 351,524 52.8 36,392 59.7 142,789 41.9 169,964 65.1 Master's 471 43,124 6.5 7,075 11.6 15,462 4.5 20,255 7.8 Doctorate 50 4,335 0.7 -- -- -- -- -- -- Other 34 3,283 0.5 -- -- -- -- -- --Major field of study before initial nursing education Health-related field 2,872 274,517 41.2 26,335 43.2 141,503 41.5 105,718 40.5 Biological or physical science 948 91,354 13.7 6,361 10.4 34,446 10.1 49,723 19.0 Business or management 639 60,656 9.1 6,242 10.2 34,087 10.0 20,185 7.7 Education 464 42,515 6.4 4,434 7.3 27,272 8.0 10,809 4.1 Liberal arts, social science, or humanities 1,758 165,936 24.9 15,177 24.9 85,707 25.1 64,446 24.7 Law 54 5,171 0.8 -- -- -- -- -- -- Computer science 45 5,157 0.8 -- -- 3,661 1.1 -- -- Social work 106 10,541 1.6 -- -- 6,110 1.8 3,586 1.4 Other nonhealth-related field 110 9,948 1.5 -- -- 5,245 1.5 3,644 1.4Year of graduation from initial nursing education 2005 or later 1,064 116,449 17.5 4,509 7.4 63,253 18.5 48,141 18.4 2000-2004 1,180 115,381 17.3 3,885 6.4 64,044 18.8 46,622 17.8 1995-1999 1,279 121,005 18.2 7,722 12.7 64,741 19.0 48,162 18.4 1990-1994 1,037 94,449 14.2 6,070 10.0 50,468 14.8 37,911 14.5 1985-1989 683 61,954 9.3 7,232 11.9 31,797 9.3 22,549 8.6 1984 or earlier 1,753 156,557 23.5 31,557 51.8 66,722 19.6 57,819 22.1
Average age at graduation by year of graduation Average age all graduates
Average age diploma
Average age associate
degree
Average age bachelor's and
higher 2005 or later 33.3 32.3 34.9 31.3 2000-2004 32.4 33.3 33.7 30.7 1995-1999 33.1 32.6 34.4 31.3 1990-1994 32.3 31.3 34.1 30.1 1985-1989 30.2 29.1 31.1 29.1 1984 or earlier 26.9 25.1 28.5 25.9
*Includes an estimated 2,591 RNs whose initial nursing education was reported as "other." "Other" includes foreign credentials and other types of education which did not have a national equivalent category.**The number of degrees may add to more than the total because more than one degree may have been named by an individual registered nurse. --Too few cases to report estimated number and estimated percent (fewer than 30 cases unweighted).NOTE: Estimated numbers may not equal total, and percents may not add to 100, because of rounding.
A-4
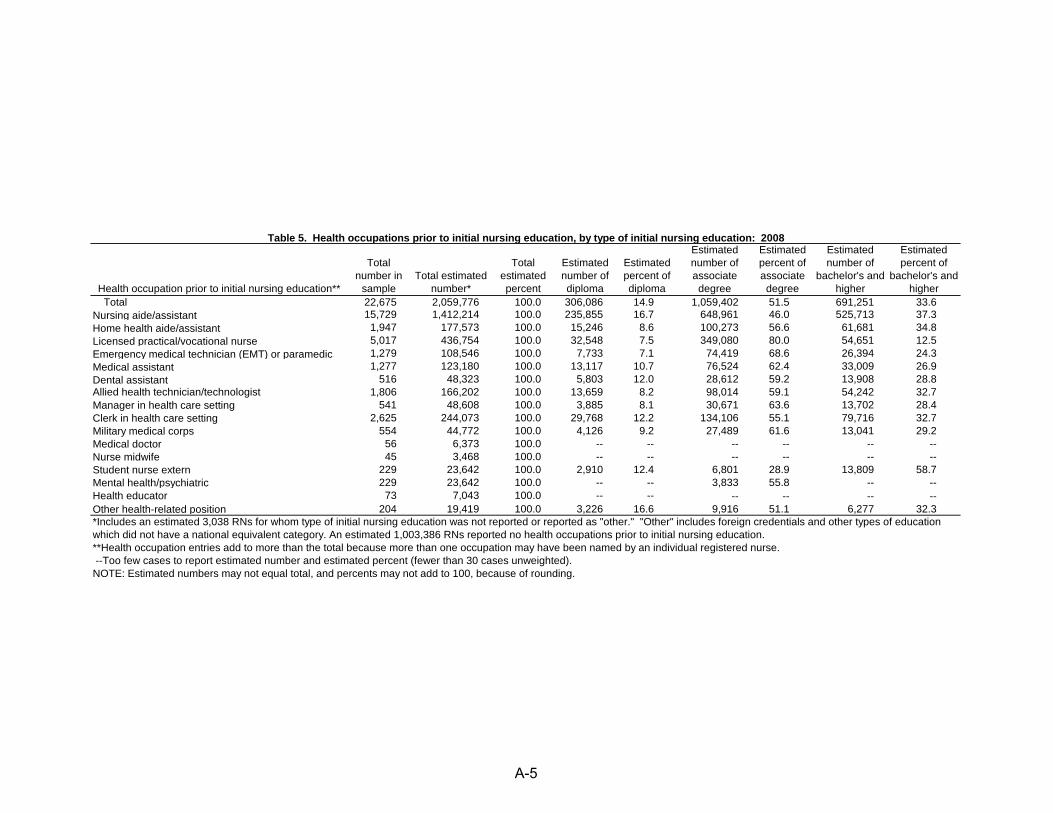
Table 5. Health occupations prior to initial nursing education, by type of initial nursing education: 2008
Health occupation prior to initial nursing education**
Total number in
sampleTotal estimated
number*
Total estimated percent
Estimated number of diploma
Estimated percent of diploma
Estimated number of associate degree
Estimated percent of associate degree
Estimated number of
bachelor's and higher
Estimated percent of
bachelor's and higher
Total 22,675 2,059,776 100.0 306,086 14.9 1,059,402 51.5 691,251 33.6Nursing aide/assistant 15,729 1,412,214 100.0 235,855 16.7 648,961 46.0 525,713 37.3Home health aide/assistant 1,947 177,573 100.0 15,246 8.6 100,273 56.6 61,681 34.8Licensed practical/vocational nurse 5,017 436,754 100.0 32,548 7.5 349,080 80.0 54,651 12.5Emergency medical technician (EMT) or paramedic 1,279 108,546 100.0 7,733 7.1 74,419 68.6 26,394 24.3Medical assistant 1,277 123,180 100.0 13,117 10.7 76,524 62.4 33,009 26.9Dental assistant 516 48,323 100.0 5,803 12.0 28,612 59.2 13,908 28.8Allied health technician/technologist 1,806 166,202 100.0 13,659 8.2 98,014 59.1 54,242 32.7Manager in health care setting 541 48,608 100.0 3,885 8.1 30,671 63.6 13,702 28.4Clerk in health care setting 2,625 244,073 100.0 29,768 12.2 134,106 55.1 79,716 32.7Military medical corps 554 44,772 100.0 4,126 9.2 27,489 61.6 13,041 29.2Medical doctor 56 6,373 100.0 -- -- -- -- -- --Nurse midwife 45 3,468 100.0 -- -- -- -- -- --Student nurse extern 229 23,642 100.0 2,910 12.4 6,801 28.9 13,809 58.7Mental health/psychiatric 229 23,642 100.0 -- -- 3,833 55.8 -- --Health educator 73 7,043 100.0 -- -- -- -- -- --Other health-related position 204 19,419 100.0 3,226 16.6 9,916 51.1 6,277 32.3*Includes an estimated 3,038 RNs for whom type of initial nursing education was not reported or reported as "other." "Other" includes foreign credentials and other types of education which did not have a national equivalent category. An estimated 1,003,386 RNs reported no health occupations prior to initial nursing education.**Health occupation entries add to more than the total because more than one occupation may have been named by an individual registered nurse.
NOTE: Estimated numbers may not equal total, and percents may not add to 100, because of rounding. --Too few cases to report estimated number and estimated percent (fewer than 30 cases unweighted).
A-5
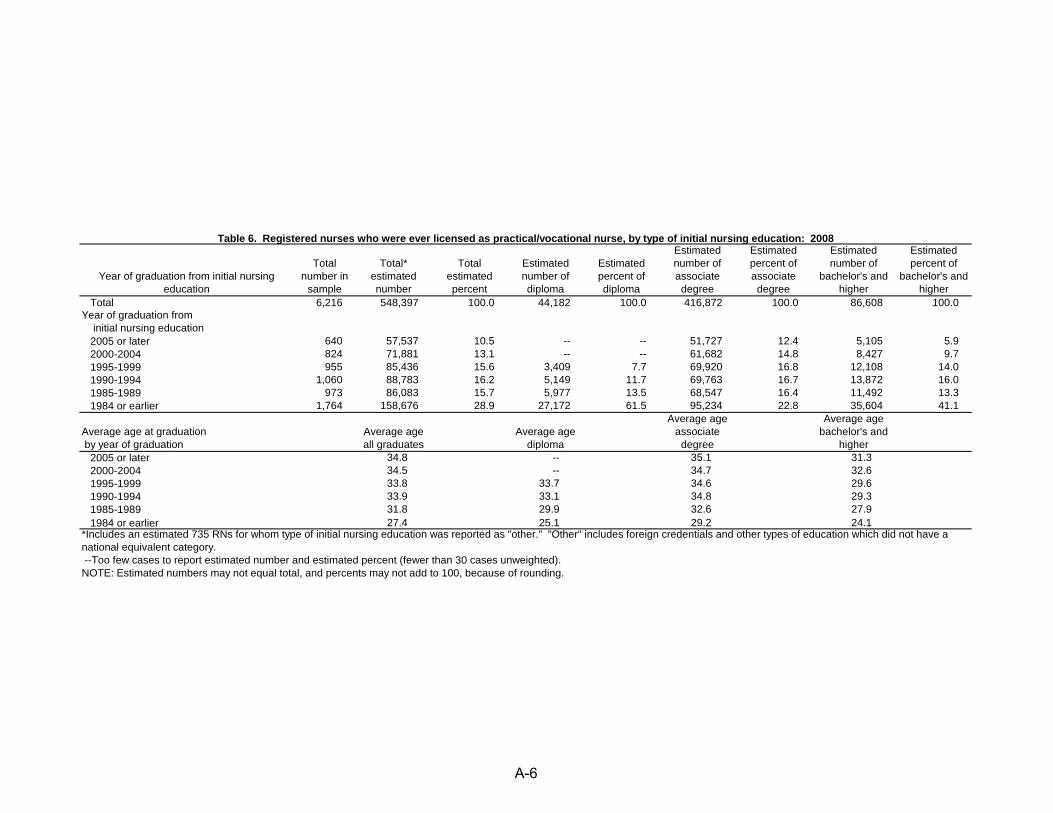
Table 6. Registered nurses who were ever licensed as practical/vocational nurse, by type of initial nursing education: 2008
Year of graduation from initial nursing education
Total number in
sample
Total* estimated number
Total estimated percent
Estimated number of diploma
Estimated percent of diploma
Estimated number of associate degree
Estimated percent of associate degree
Estimated number of
bachelor's and higher
Estimated percent of
bachelor's and higher
Total 6,216 548,397 100.0 44,182 100.0 416,872 100.0 86,608 100.0Year of graduation from initial nursing education 2005 or later 640 57,537 10.5 -- -- 51,727 12.4 5,105 5.9 2000-2004 824 71,881 13.1 -- -- 61,682 14.8 8,427 9.7 1995-1999 955 85,436 15.6 3,409 7.7 69,920 16.8 12,108 14.0 1990-1994 1,060 88,783 16.2 5,149 11.7 69,763 16.7 13,872 16.0 1985-1989 973 86,083 15.7 5,977 13.5 68,547 16.4 11,492 13.3 1984 or earlier 1,764 158,676 28.9 27,172 61.5 95,234 22.8 35,604 41.1
Average age at graduation by year of graduation
Average age all graduates
Average age diploma
Average age associate
degree
Average age bachelor's and
higher 2005 or later 34.8 -- 35.1 31.3 2000-2004 34.5 -- 34.7 32.6 1995-1999 33.8 33.7 34.6 29.6 1990-1994 33.9 33.1 34.8 29.3 1985-1989 31.8 29.9 32.6 27.9 1984 or earlier 27.4 25.1 29.2 24.1 *Includes an estimated 735 RNs for whom type of initial nursing education was reported as "other." "Other" includes foreign credentials and other types of education which did not have a national equivalent category.
NOTE: Estimated numbers may not equal total, and percents may not add to 100, because of rounding. --Too few cases to report estimated number and estimated percent (fewer than 30 cases unweighted).
A-6
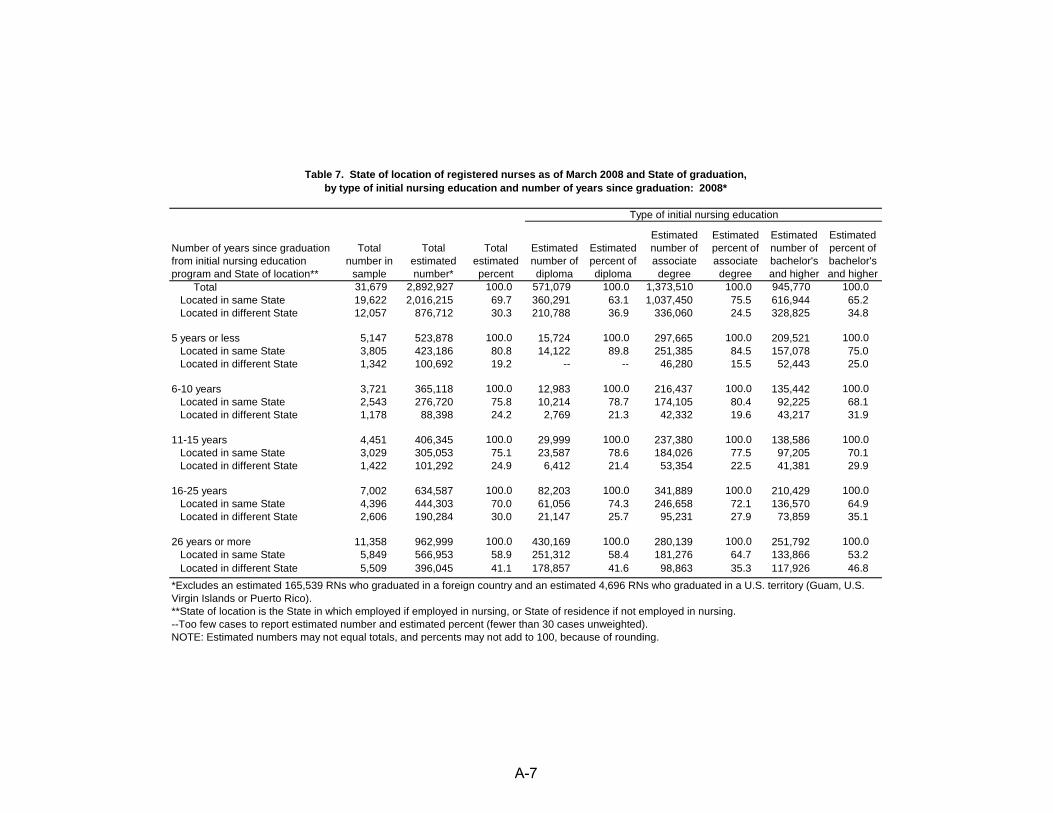
Table 7. State of location of registered nurses as of March 2008 and State of graduation, by type of initial nursing education and number of years since graduation: 2008*
Number of years since graduation from initial nursing education program and State of location**
Total number in
sample
Total estimated number*
Total estimated percent
Estimated number of diploma
Estimated percent of diploma
Estimated number of associate degree
Estimated percent of associate degree
Estimated number of bachelor's and higher
Estimated percent of bachelor's and higher
Total 31,679 2,892,927 100.0 571,079 100.0 1,373,510 100.0 945,770 100.0 Located in same State 19,622 2,016,215 69.7 360,291 63.1 1,037,450 75.5 616,944 65.2 Located in different State 12,057 876,712 30.3 210,788 36.9 336,060 24.5 328,825 34.8
5 years or less 5,147 523,878 100.0 15,724 100.0 297,665 100.0 209,521 100.0 Located in same State 3,805 423,186 80.8 14,122 89.8 251,385 84.5 157,078 75.0 Located in different State 1,342 100,692 19.2 -- -- 46,280 15.5 52,443 25.0
6-10 years 3,721 365,118 100.0 12,983 100.0 216,437 100.0 135,442 100.0 Located in same State 2,543 276,720 75.8 10,214 78.7 174,105 80.4 92,225 68.1 Located in different State 1,178 88,398 24.2 2,769 21.3 42,332 19.6 43,217 31.9
11-15 years 4,451 406,345 100.0 29,999 100.0 237,380 100.0 138,586 100.0 Located in same State 3,029 305,053 75.1 23,587 78.6 184,026 77.5 97,205 70.1 Located in different State 1,422 101,292 24.9 6,412 21.4 53,354 22.5 41,381 29.9
16-25 years 7,002 634,587 100.0 82,203 100.0 341,889 100.0 210,429 100.0 Located in same State 4,396 444,303 70.0 61,056 74.3 246,658 72.1 136,570 64.9 Located in different State 2,606 190,284 30.0 21,147 25.7 95,231 27.9 73,859 35.1
26 years or more 11,358 962,999 100.0 430,169 100.0 280,139 100.0 251,792 100.0 Located in same State 5,849 566,953 58.9 251,312 58.4 181,276 64.7 133,866 53.2 Located in different State 5,509 396,045 41.1 178,857 41.6 98,863 35.3 117,926 46.8
Type of initial nursing education
NOTE: Estimated numbers may not equal totals, and percents may not add to 100, because of rounding.
*Excludes an estimated 165,539 RNs who graduated in a foreign country and an estimated 4,696 RNs who graduated in a U.S. territory (Guam, U.S. Virgin Islands or Puerto Rico).**State of location is the State in which employed if employed in nursing, or State of residence if not employed in nursing.--Too few cases to report estimated number and estimated percent (fewer than 30 cases unweighted).
A-7
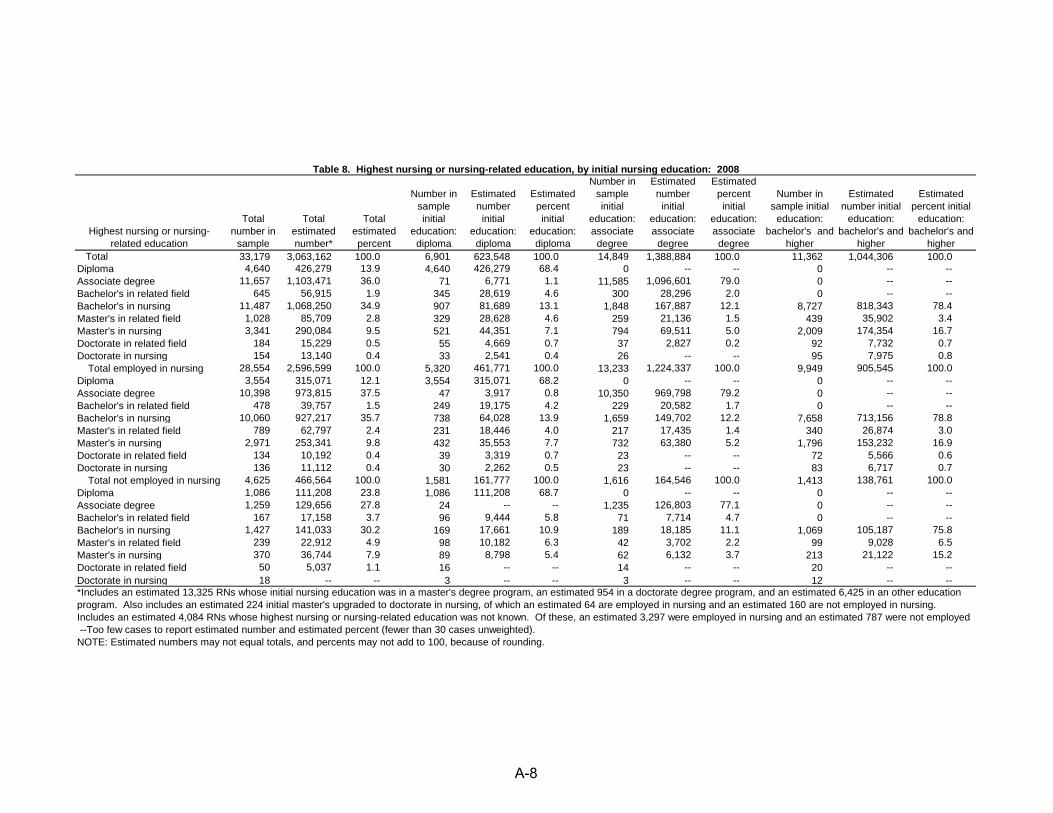
Table 8. Highest nursing or nursing-related education, by initial nursing education: 2008
Highest nursing or nursing-related education
Total number in
sample
Total estimated number*
Total estimated percent
Number in sample initial
education: diploma
Estimated number
initial education:
diploma
Estimated percent initial
education: diploma
Number in sample initial
education: associate
degree
Estimated number
initial education: associate
degree
Estimated percent initial
education: associate
degree
Number in sample initial
education: bachelor's and
higher
Estimated number initial
education: bachelor's and
higher
Estimated percent initial
education: bachelor's and
higher Total 33,179 3,063,162 100.0 6,901 623,548 100.0 14,849 1,388,884 100.0 11,362 1,044,306 100.0Diploma 4,640 426,279 13.9 4,640 426,279 68.4 0 -- -- 0 -- --Associate degree 11,657 1,103,471 36.0 71 6,771 1.1 11,585 1,096,601 79.0 0 -- --Bachelor's in related field 645 56,915 1.9 345 28,619 4.6 300 28,296 2.0 0 -- --Bachelor's in nursing 11,487 1,068,250 34.9 907 81,689 13.1 1,848 167,887 12.1 8,727 818,343 78.4Master's in related field 1,028 85,709 2.8 329 28,628 4.6 259 21,136 1.5 439 35,902 3.4Master's in nursing 3,341 290,084 9.5 521 44,351 7.1 794 69,511 5.0 2,009 174,354 16.7Doctorate in related field 184 15,229 0.5 55 4,669 0.7 37 2,827 0.2 92 7,732 0.7Doctorate in nursing 154 13,140 0.4 33 2,541 0.4 26 -- -- 95 7,975 0.8
Total employed in nursing 28,554 2,596,599 100.0 5,320 461,771 100.0 13,233 1,224,337 100.0 9,949 905,545 100.0Diploma 3,554 315,071 12.1 3,554 315,071 68.2 0 -- -- 0 -- --Associate degree 10,398 973,815 37.5 47 3,917 0.8 10,350 969,798 79.2 0 -- --Bachelor's in related field 478 39,757 1.5 249 19,175 4.2 229 20,582 1.7 0 -- --Bachelor's in nursing 10,060 927,217 35.7 738 64,028 13.9 1,659 149,702 12.2 7,658 713,156 78.8Master's in related field 789 62,797 2.4 231 18,446 4.0 217 17,435 1.4 340 26,874 3.0Master's in nursing 2,971 253,341 9.8 432 35,553 7.7 732 63,380 5.2 1,796 153,232 16.9Doctorate in related field 134 10,192 0.4 39 3,319 0.7 23 -- -- 72 5,566 0.6Doctorate in nursing 136 11,112 0.4 30 2,262 0.5 23 -- -- 83 6,717 0.7
Total not employed in nursing 4,625 466,564 100.0 1,581 161,777 100.0 1,616 164,546 100.0 1,413 138,761 100.0Diploma 1,086 111,208 23.8 1,086 111,208 68.7 0 -- -- 0 -- --Associate degree 1,259 129,656 27.8 24 -- -- 1,235 126,803 77.1 0 -- --Bachelor's in related field 167 17,158 3.7 96 9,444 5.8 71 7,714 4.7 0 -- --Bachelor's in nursing 1,427 141,033 30.2 169 17,661 10.9 189 18,185 11.1 1,069 105,187 75.8Master's in related field 239 22,912 4.9 98 10,182 6.3 42 3,702 2.2 99 9,028 6.5Master's in nursing 370 36,744 7.9 89 8,798 5.4 62 6,132 3.7 213 21,122 15.2Doctorate in related field 50 5,037 1.1 16 -- -- 14 -- -- 20 -- --Doctorate in nursing 18 -- -- 3 -- -- 3 -- -- 12 -- --*Includes an estimated 13,325 RNs whose initial nursing education was in a master's degree program, an estimated 954 in a doctorate degree program, and an estimated 6,425 in an other education program. Also includes an estimated 224 initial master's upgraded to doctorate in nursing, of which an estimated 64 are employed in nursing and an estimated 160 are not employed in nursing.Includes an estimated 4,084 RNs whose highest nursing or nursing-related education was not known. Of these, an estimated 3,297 were employed in nursing and an estimated 787 were not employed --Too few cases to report estimated number and estimated percent (fewer than 30 cases unweighted).NOTE: Estimated numbers may not equal totals, and percents may not add to 100, because of rounding.
A-8
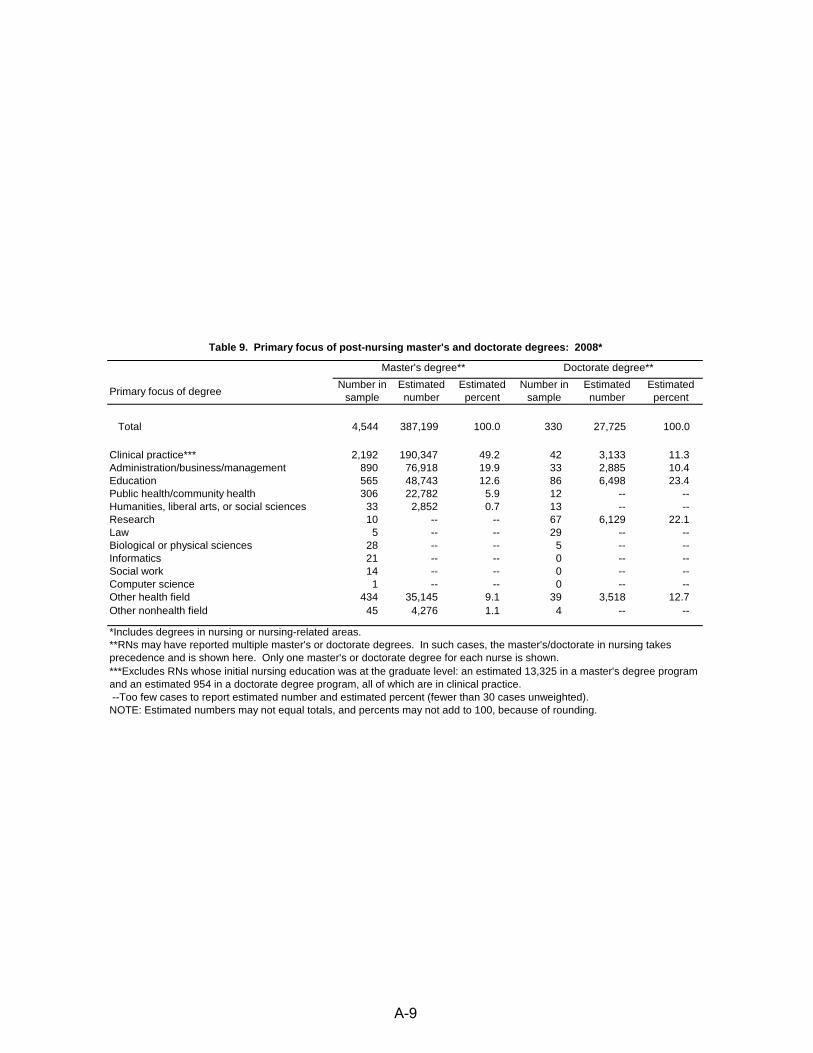
Table 9. Primary focus of post-nursing master's and doctorate degrees: 2008*
Primary focus of degreeNumber in
sample Estimated number
Estimated percent
Number in sample
Estimated number
Estimated percent
Total 4,544 387,199 100.0 330 27,725 100.0
Clinical practice*** 2,192 190,347 49.2 42 3,133 11.3Administration/business/management 890 76,918 19.9 33 2,885 10.4Education 565 48,743 12.6 86 6,498 23.4Public health/community health 306 22,782 5.9 12 -- --Humanities, liberal arts, or social sciences 33 2,852 0.7 13 -- --Research 10 -- -- 67 6,129 22.1Law 5 -- -- 29 -- --Biological or physical sciences 28 -- -- 5 -- --Informatics 21 -- -- 0 -- --Social work 14 -- -- 0 -- --Computer science 1 -- -- 0 -- --Other health field 434 35,145 9.1 39 3,518 12.7Other nonhealth field 45 4,276 1.1 4 -- --
Master's degree** Doctorate degree**
*Includes degrees in nursing or nursing-related areas.**RNs may have reported multiple master's or doctorate degrees. In such cases, the master's/doctorate in nursing takes precedence and is shown here. Only one master's or doctorate degree for each nurse is shown.***Excludes RNs whose initial nursing education was at the graduate level: an estimated 13,325 in a master's degree program and an estimated 954 in a doctorate degree program, all of which are in clinical practice. --Too few cases to report estimated number and estimated percent (fewer than 30 cases unweighted).NOTE: Estimated numbers may not equal totals, and percents may not add to 100, because of rounding.
A-9
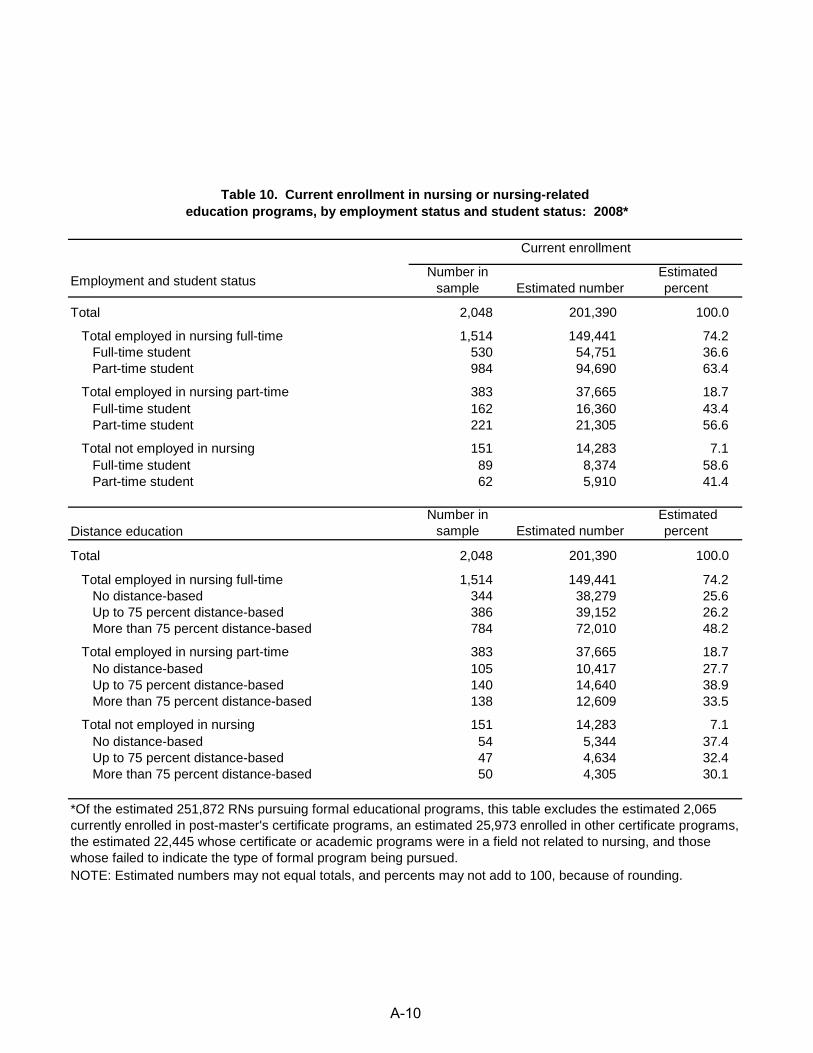
Table 10. Current enrollment in nursing or nursing-related education programs, by employment status and student status: 2008*
Current enrollment
Employment and student statusNumber in
sample Estimated number Estimated
percent
Total 2,048 201,390 100.0
Total employed in nursing full-time 1,514 149,441 74.2 Full-time student 530 54,751 36.6 Part-time student 984 94,690 63.4
Total employed in nursing part-time 383 37,665 18.7 Full-time student 162 16,360 43.4 Part-time student 221 21,305 56.6
Total not employed in nursing 151 14,283 7.1 Full-time student 89 8,374 58.6 Part-time student 62 5,910 41.4
Distance educationNumber in
sample Estimated number Estimated
percent
Total 2,048 201,390 100.0
Total employed in nursing full-time 1,514 149,441 74.2No distance-based 344 38,279 25.6
Up to 75 percent distance-based 386 39,152 26.2 More than 75 percent distance-based 784 72,010 48.2
Total employed in nursing part-time 383 37,665 18.7No distance-based 105 10,417 27.7
Up to 75 percent distance-based 140 14,640 38.9 More than 75 percent distance-based 138 12,609 33.5
Total not employed in nursing 151 14,283 7.1No distance-based 54 5,344 37.4
Up to 75 percent distance-based 47 4,634 32.4 More than 75 percent distance-based 50 4,305 30.1
NOTE: Estimated numbers may not equal totals, and percents may not add to 100, because of rounding.
*Of the estimated 251,872 RNs pursuing formal educational programs, this table excludes the estimated 2,065 currently enrolled in post-master's certificate programs, an estimated 25,973 enrolled in other certificate programs, the estimated 22,445 whose certificate or academic programs were in a field not related to nursing, and those whose failed to indicate the type of formal program being pursued.
A-10
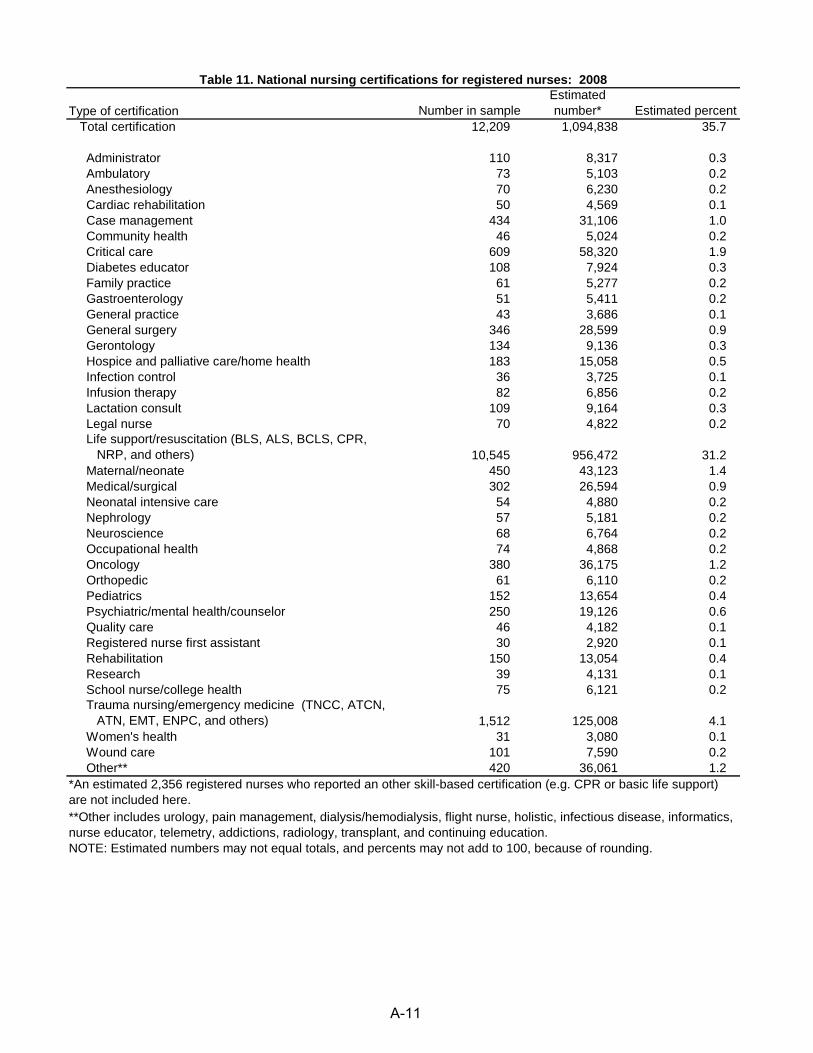
Table 11. National nursing certifications for registered nurses: 2008
Type of certification Number in sampleEstimated number* Estimated percent
Total certification 12,209 1,094,838 35.7
Administrator 110 8,317 0.3 Ambulatory 73 5,103 0.2 Anesthesiology 70 6,230 0.2 Cardiac rehabilitation 50 4,569 0.1 Case management 434 31,106 1.0 Community health 46 5,024 0.2 Critical care 609 58,320 1.9 Diabetes educator 108 7,924 0.3 Family practice 61 5,277 0.2 Gastroenterology 51 5,411 0.2 General practice 43 3,686 0.1 General surgery 346 28,599 0.9 Gerontology 134 9,136 0.3 Hospice and palliative care/home health 183 15,058 0.5 Infection control 36 3,725 0.1 Infusion therapy 82 6,856 0.2 Lactation consult 109 9,164 0.3 Legal nurse 70 4,822 0.2 Life support/resuscitation (BLS, ALS, BCLS, CPR, NRP, and others) 10,545 956,472 31.2 Maternal/neonate 450 43,123 1.4 Medical/surgical 302 26,594 0.9 Neonatal intensive care 54 4,880 0.2 Nephrology 57 5,181 0.2 Neuroscience 68 6,764 0.2 Occupational health 74 4,868 0.2 Oncology 380 36,175 1.2 Orthopedic 61 6,110 0.2 Pediatrics 152 13,654 0.4 Psychiatric/mental health/counselor 250 19,126 0.6 Quality care 46 4,182 0.1 Registered nurse first assistant 30 2,920 0.1 Rehabilitation 150 13,054 0.4 Research 39 4,131 0.1 School nurse/college health 75 6,121 0.2 Trauma nursing/emergency medicine (TNCC, ATCN, ATN, EMT, ENPC, and others) 1,512 125,008 4.1 Women's health 31 3,080 0.1 Wound care 101 7,590 0.2 Other** 420 36,061 1.2*An estimated 2,356 registered nurses who reported an other skill-based certification (e.g. CPR or basic life support) are not included here.**Other includes urology, pain management, dialysis/hemodialysis, flight nurse, holistic, infectious disease, informatics, nurse educator, telemetry, addictions, radiology, transplant, and continuing education.NOTE: Estimated numbers may not equal totals, and percents may not add to 100, because of rounding.
A-11
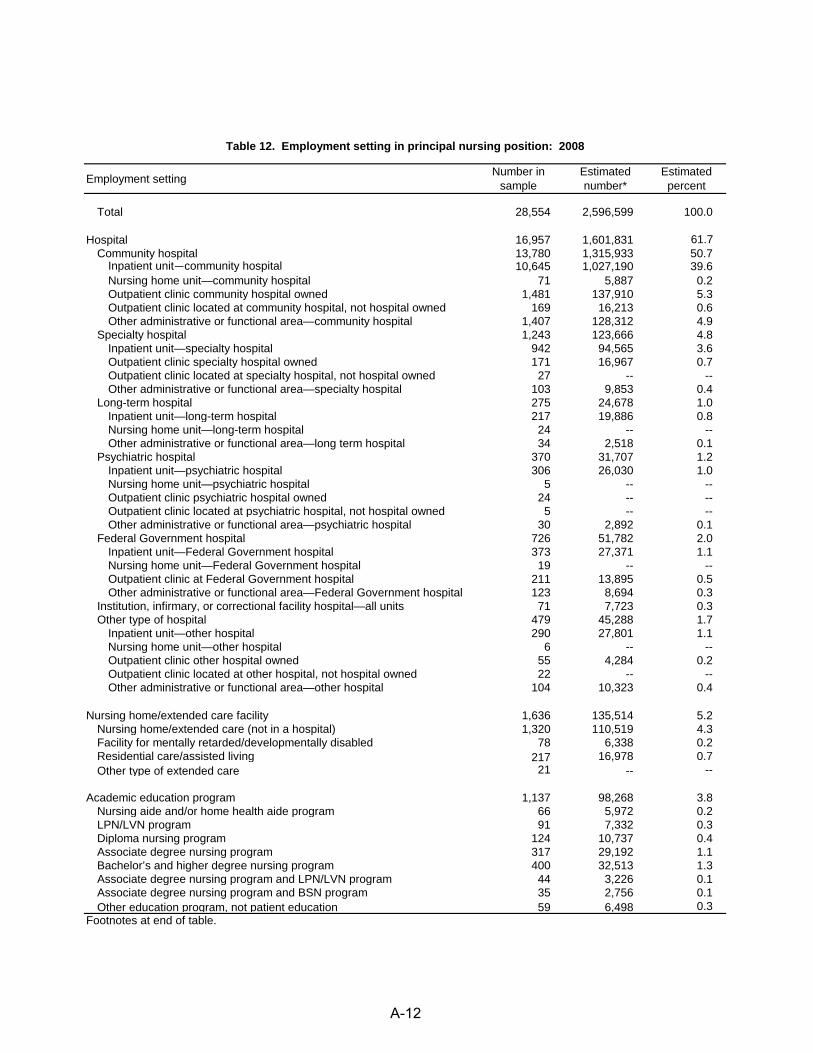
Table 12. Employment setting in principal nursing position: 2008
Employment setting Number in sample
Estimated number*
Estimated percent
Total 28,554 2,596,599 100.0
Hospital 16,957 1,601,831 61.7Community hospital 13,780 1,315,933 50.7
Inpatient unit—community hospital 10,645 1,027,190 39.6Nursing home unit—community hospital 71 5,887 0.2Outpatient clinic community hospital owned 1,481 137,910 5.3Outpatient clinic located at community hospital, not hospital owned 169 16,213 0.6Other administrative or functional area—community hospital 1,407 128,312 4.9
Specialty hospital 1,243 123,666 4.8Inpatient unit—specialty hospital 942 94,565 3.6Outpatient clinic specialty hospital owned 171 16,967 0.7Outpatient clinic located at specialty hospital, not hospital owned 27 -- --Other administrative or functional area—specialty hospital 103 9,853 0.4
Long-term hospital 275 24,678 1.0Inpatient unit—long-term hospital 217 19,886 0.8Nursing home unit—long-term hospital 24 -- --Other administrative or functional area—long term hospital 34 2,518 0.1
Psychiatric hospital 370 31,707 1.2Inpatient unit—psychiatric hospital 306 26,030 1.0Nursing home unit—psychiatric hospital 5 -- --Outpatient clinic psychiatric hospital owned 24 -- --Outpatient clinic located at psychiatric hospital, not hospital owned 5 -- --Other administrative or functional area—psychiatric hospital 30 2,892 0.1
Federal Government hospital 726 51,782 2.0Inpatient unit—Federal Government hospital 373 27,371 1.1Nursing home unit—Federal Government hospital 19 -- --Outpatient clinic at Federal Government hospital 211 13,895 0.5Other administrative or functional area—Federal Government hospital 123 8,694 0.3
Institution, infirmary, or correctional facility hospital—all units 71 7,723 0.3Other type of hospital 479 45,288 1.7
Inpatient unit—other hospital 290 27,801 1.1Nursing home unit—other hospital 6 -- --Outpatient clinic other hospital owned 55 4,284 0.2Outpatient clinic located at other hospital, not hospital owned 22 -- --Other administrative or functional area—other hospital 104 10,323 0.4
Nursing home/extended care facility 1,636 135,514 5.2Nursing home/extended care (not in a hospital) 1,320 110,519 4.3Facility for mentally retarded/developmentally disabled 78 6,338 0.2Residential care/assisted living 217 16,978 0.7Other type of extended care 21 -- --
Academic education program 1,137 98,268 3.8Nursing aide and/or home health aide program 66 5,972 0.2LPN/LVN program 91 7,332 0.3Diploma nursing program 124 10,737 0.4Associate degree nursing program 317 29,192 1.1Bachelor’s and higher degree nursing program 400 32,513 1.3Associate degree nursing program and LPN/LVN program 44 3,226 0.1Associate degree nursing program and BSN program 35 2,756 0.1Other education program, not patient education 59 6,498 0.3
Footnotes at end of table.
A-12
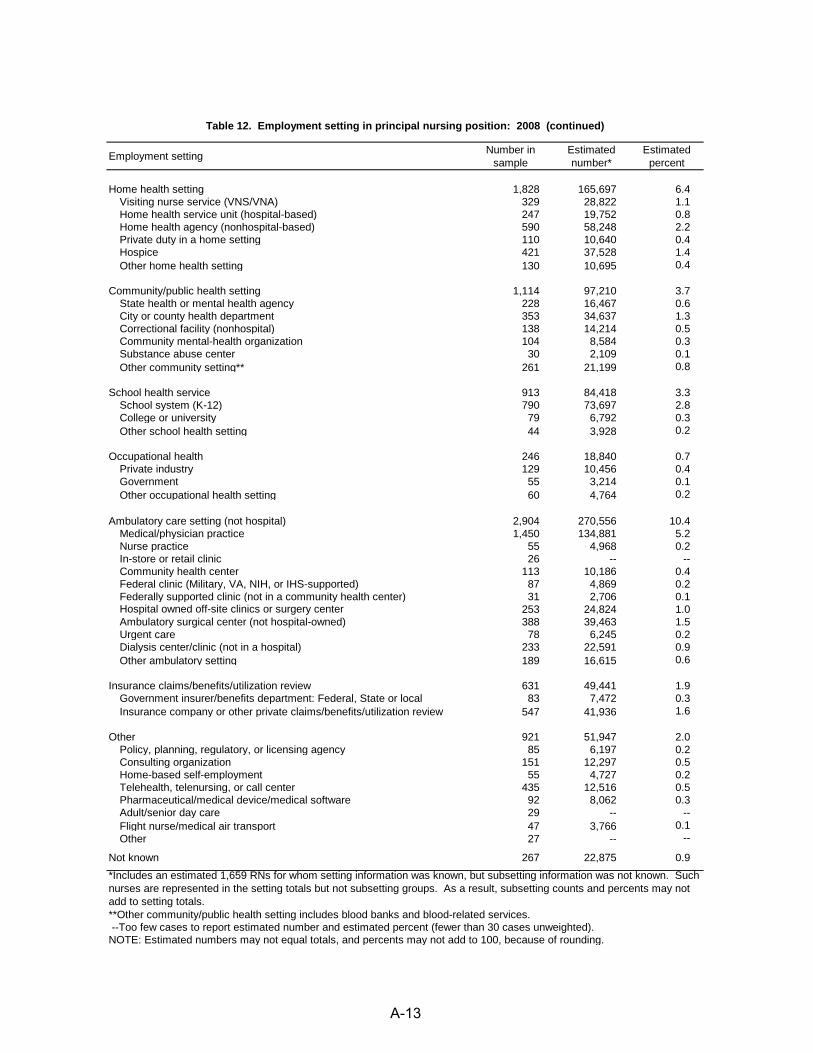
Table 12. Employment setting in principal nursing position: 2008 (continued)
Employment setting Number in sample
Estimated number*
Estimated percent
Home health setting 1,828 165,697 6.4Visiting nurse service (VNS/VNA) 329 28,822 1.1Home health service unit (hospital-based) 247 19,752 0.8Home health agency (nonhospital-based) 590 58,248 2.2Private duty in a home setting 110 10,640 0.4Hospice 421 37,528 1.4Other home health setting 130 10,695 0.4
Community/public health setting 1,114 97,210 3.7State health or mental health agency 228 16,467 0.6City or county health department 353 34,637 1.3Correctional facility (nonhospital) 138 14,214 0.5Community mental-health organization 104 8,584 0.3Substance abuse center 30 2,109 0.1Other community setting** 261 21,199 0.8
School health service 913 84,418 3.3School system (K-12) 790 73,697 2.8College or university 79 6,792 0.3Other school health setting 44 3,928 0.2
Occupational health 246 18,840 0.7Private industry 129 10,456 0.4Government 55 3,214 0.1Other occupational health setting 60 4,764 0.2
Ambulatory care setting (not hospital) 2,904 270,556 10.4Medical/physician practice 1,450 134,881 5.2Nurse practice 55 4,968 0.2In-store or retail clinic 26 -- --Community health center 113 10,186 0.4Federal clinic (Military, VA, NIH, or IHS-supported) 87 4,869 0.2Federally supported clinic (not in a community health center) 31 2,706 0.1Hospital owned off-site clinics or surgery center 253 24,824 1.0Ambulatory surgical center (not hospital-owned) 388 39,463 1.5Urgent care 78 6,245 0.2Dialysis center/clinic (not in a hospital) 233 22,591 0.9Other ambulatory setting 189 16,615 0.6
Insurance claims/benefits/utilization review 631 49,441 1.9Government insurer/benefits department: Federal, State or local 83 7,472 0.3Insurance company or other private claims/benefits/utilization review 547 41,936 1.6
Other 921 51,947 2.0Policy, planning, regulatory, or licensing agency 85 6,197 0.2Consulting organization 151 12,297 0.5Home-based self-employment 55 4,727 0.2Telehealth, telenursing, or call center 435 12,516 0.5Pharmaceutical/medical device/medical software 92 8,062 0.3Adult/senior day care 29 -- --Flight nurse/medical air transport 47 3,766 0.1Other 27 -- --
Not known 267 22,875 0.9
--Too few cases to report estimated number and estimated percent (fewer than 30 cases unweighted).NOTE: Estimated numbers may not equal totals, and percents may not add to 100, because of rounding.
*Includes an estimated 1,659 RNs for whom setting information was known, but subsetting information was not known. Such nurses are represented in the setting totals but not subsetting groups. As a result, subsetting counts and percents may not add to setting totals.**Other community/public health setting includes blood banks and blood-related services.
A-13
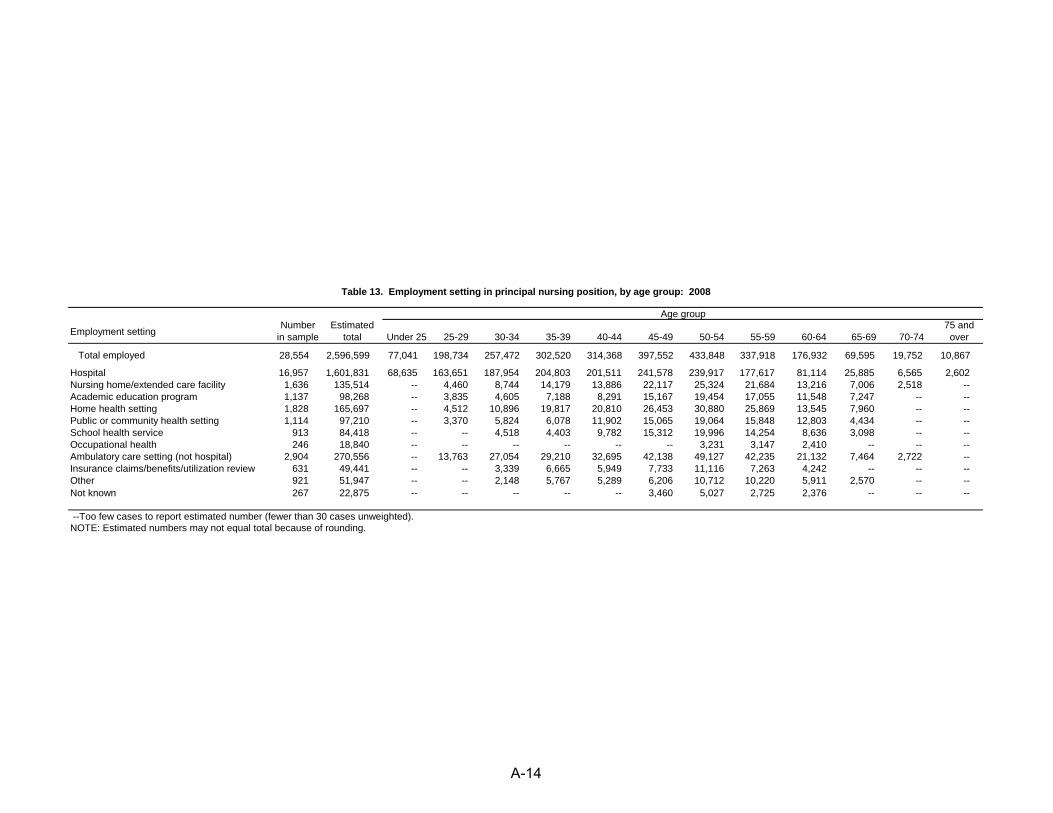
Table 13. Employment setting in principal nursing position, by age group: 2008
Employment settingNumber
in sampleEstimated
total Under 25 25-29 30-34 35-39 40-44 45-49 50-54 55-59 60-64 65-69 70-7475 and
over
Total employed 28,554 2,596,599 77,041 198,734 257,472 302,520 314,368 397,552 433,848 337,918 176,932 69,595 19,752 10,867
Hospital 16,957 1,601,831 68,635 163,651 187,954 204,803 201,511 241,578 239,917 177,617 81,114 25,885 6,565 2,602Nursing home/extended care facility 1,636 135,514 -- 4,460 8,744 14,179 13,886 22,117 25,324 21,684 13,216 7,006 2,518 --Academic education program 1,137 98,268 -- 3,835 4,605 7,188 8,291 15,167 19,454 17,055 11,548 7,247 -- --Home health setting 1,828 165,697 -- 4,512 10,896 19,817 20,810 26,453 30,880 25,869 13,545 7,960 -- --Public or community health setting 1,114 97,210 -- 3,370 5,824 6,078 11,902 15,065 19,064 15,848 12,803 4,434 -- --School health service 913 84,418 -- -- 4,518 4,403 9,782 15,312 19,996 14,254 8,636 3,098 -- --Occupational health 246 18,840 -- -- -- -- -- -- 3,231 3,147 2,410 -- -- --Ambulatory care setting (not hospital) 2,904 270,556 -- 13,763 27,054 29,210 32,695 42,138 49,127 42,235 21,132 7,464 2,722 --Insurance claims/benefits/utilization review 631 49,441 -- -- 3,339 6,665 5,949 7,733 11,116 7,263 4,242 -- -- --Other 921 51,947 -- -- 2,148 5,767 5,289 6,206 10,712 10,220 5,911 2,570 -- --Not known 267 22,875 -- -- -- -- -- 3,460 5,027 2,725 2,376 -- -- --
Age group
--Too few cases to report estimated number (fewer than 30 cases unweighted).NOTE: Estimated numbers may not equal total because of rounding.
A-14
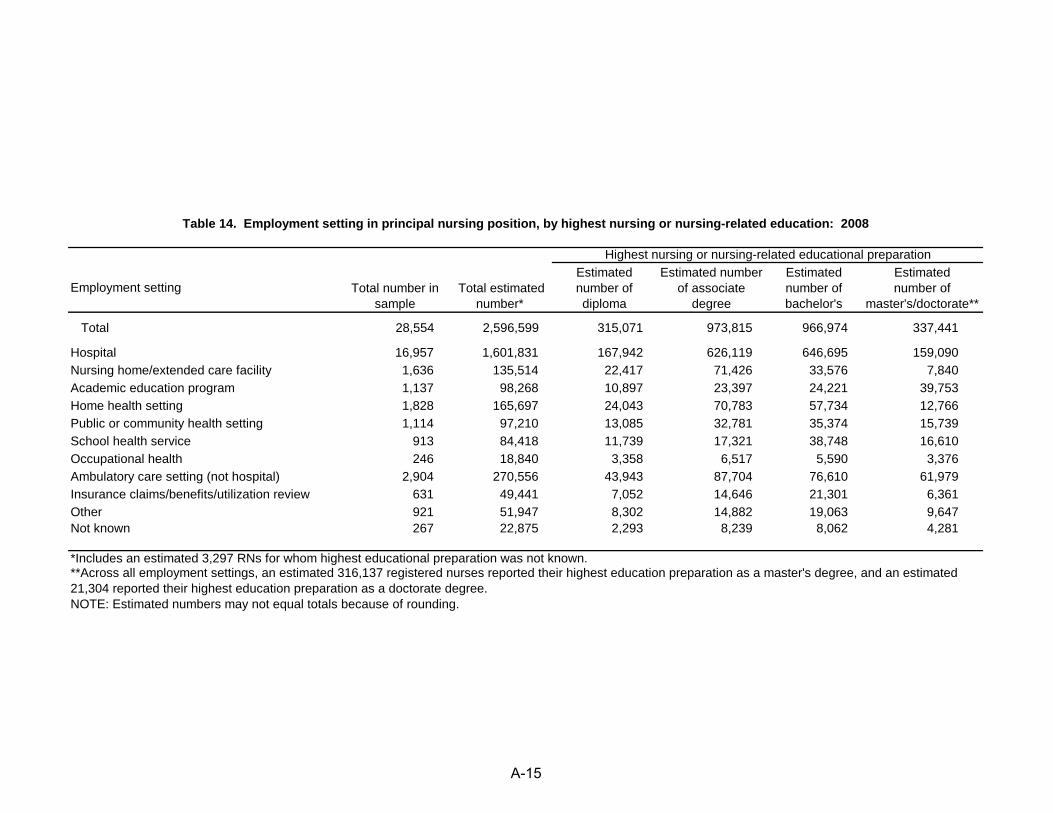
Table 14. Employment setting in principal nursing position, by highest nursing or nursing-related education: 2008
Employment setting Total number in sample
Total estimated number*
Estimated number of diploma
Estimated number of associate
degree
Estimated number of bachelor's
Estimated number of
master's/doctorate**
Total 28,554 2,596,599 315,071 973,815 966,974 337,441
Hospital 16,957 1,601,831 167,942 626,119 646,695 159,090Nursing home/extended care facility 1,636 135,514 22,417 71,426 33,576 7,840Academic education program 1,137 98,268 10,897 23,397 24,221 39,753Home health setting 1,828 165,697 24,043 70,783 57,734 12,766Public or community health setting 1,114 97,210 13,085 32,781 35,374 15,739School health service 913 84,418 11,739 17,321 38,748 16,610Occupational health 246 18,840 3,358 6,517 5,590 3,376Ambulatory care setting (not hospital) 2,904 270,556 43,943 87,704 76,610 61,979Insurance claims/benefits/utilization review 631 49,441 7,052 14,646 21,301 6,361Other 921 51,947 8,302 14,882 19,063 9,647Not known 267 22,875 2,293 8,239 8,062 4,281
Highest nursing or nursing-related educational preparation
*Includes an estimated 3,297 RNs for whom highest educational preparation was not known.**Across all employment settings, an estimated 316,137 registered nurses reported their highest education preparation as a master's degree, and an estimated 21,304 reported their highest education preparation as a doctorate degree. NOTE: Estimated numbers may not equal totals because of rounding.
A-15
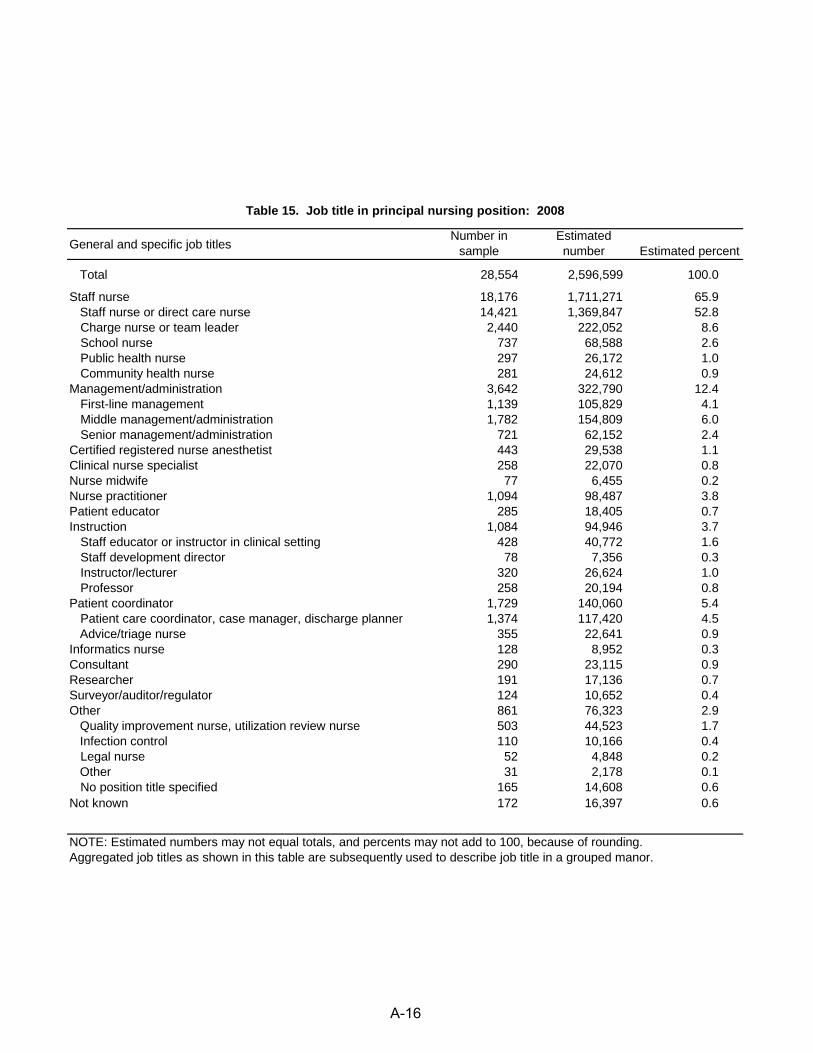
Table 15. Job title in principal nursing position: 2008
General and specific job titlesNumber in
sampleEstimated number Estimated percent
Total 28,554 2,596,599 100.0
Staff nurse 18,176 1,711,271 65.9 Staff nurse or direct care nurse 14,421 1,369,847 52.8
Charge nurse or team leader 2,440 222,052 8.6School nurse 737 68,588 2.6Public health nurse 297 26,172 1.0Community health nurse 281 24,612 0.9
Management/administration 3,642 322,790 12.4First-line management 1,139 105,829 4.1Middle management/administration 1,782 154,809 6.0Senior management/administration 721 62,152 2.4
Certified registered nurse anesthetist 443 29,538 1.1Clinical nurse specialist 258 22,070 0.8Nurse midwife 77 6,455 0.2Nurse practitioner 1,094 98,487 3.8Patient educator 285 18,405 0.7Instruction 1,084 94,946 3.7
Staff educator or instructor in clinical setting 428 40,772 1.6Staff development director 78 7,356 0.3Instructor/lecturer 320 26,624 1.0Professor 258 20,194 0.8
Patient coordinator 1,729 140,060 5.4Patient care coordinator, case manager, discharge planner 1,374 117,420 4.5
Advice/triage nurse 355 22,641 0.9Informatics nurse 128 8,952 0.3Consultant 290 23,115 0.9Researcher 191 17,136 0.7Surveyor/auditor/regulator 124 10,652 0.4Other 861 76,323 2.9 Quality improvement nurse, utilization review nurse 503 44,523 1.7 Infection control 110 10,166 0.4
Legal nurse 52 4,848 0.2 Other 31 2,178 0.1
No position title specified 165 14,608 0.6Not known 172 16,397 0.6
NOTE: Estimated numbers may not equal totals, and percents may not add to 100, because of rounding. Aggregated job titles as shown in this table are subsequently used to describe job title in a grouped manor.
A-16
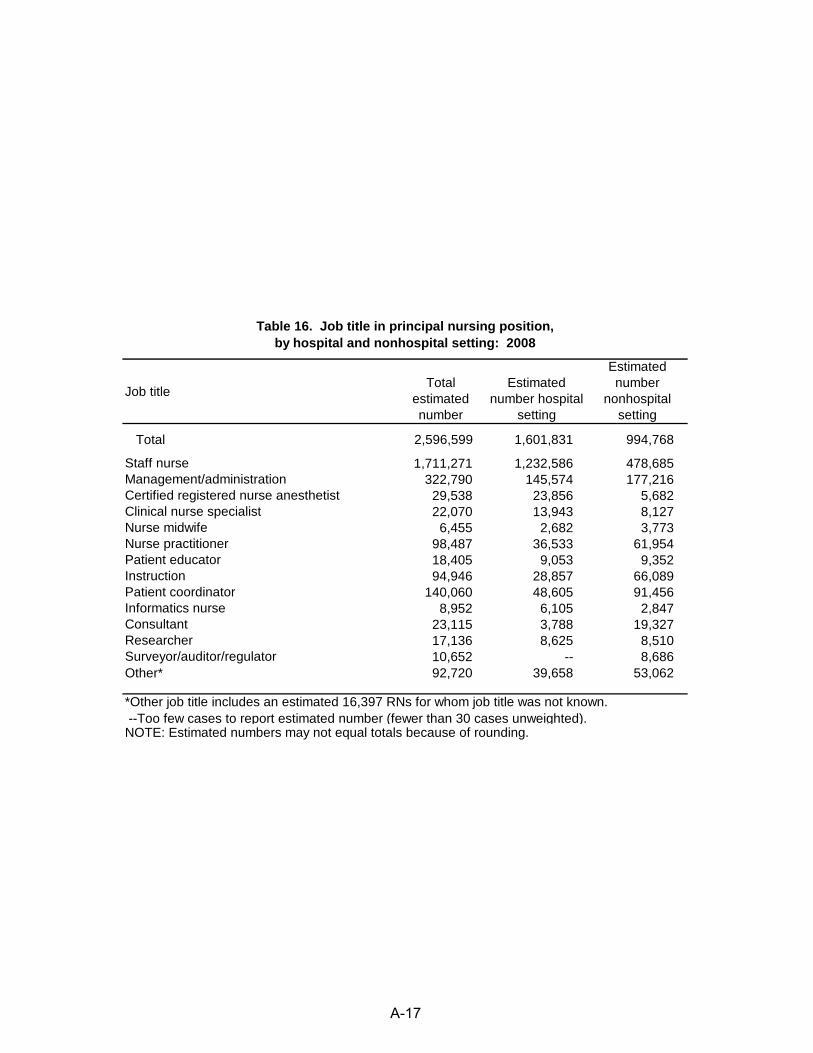
Table 16. Job title in principal nursing position, by hospital and nonhospital setting: 2008
Job titleTotal
estimated number
Estimated number hospital
setting
Estimated number
nonhospital setting
Total 2,596,599 1,601,831 994,768
Staff nurse 1,711,271 1,232,586 478,685Management/administration 322,790 145,574 177,216Certified registered nurse anesthetist 29,538 23,856 5,682Clinical nurse specialist 22,070 13,943 8,127Nurse midwife 6,455 2,682 3,773Nurse practitioner 98,487 36,533 61,954Patient educator 18,405 9,053 9,352Instruction 94,946 28,857 66,089Patient coordinator 140,060 48,605 91,456Informatics nurse 8,952 6,105 2,847Consultant 23,115 3,788 19,327Researcher 17,136 8,625 8,510Surveyor/auditor/regulator 10,652 -- 8,686Other* 92,720 39,658 53,062
*Other job title includes an estimated 16,397 RNs for whom job title was not known. --Too few cases to report estimated number (fewer than 30 cases unweighted).NOTE: Estimated numbers may not equal totals because of rounding.
A-17
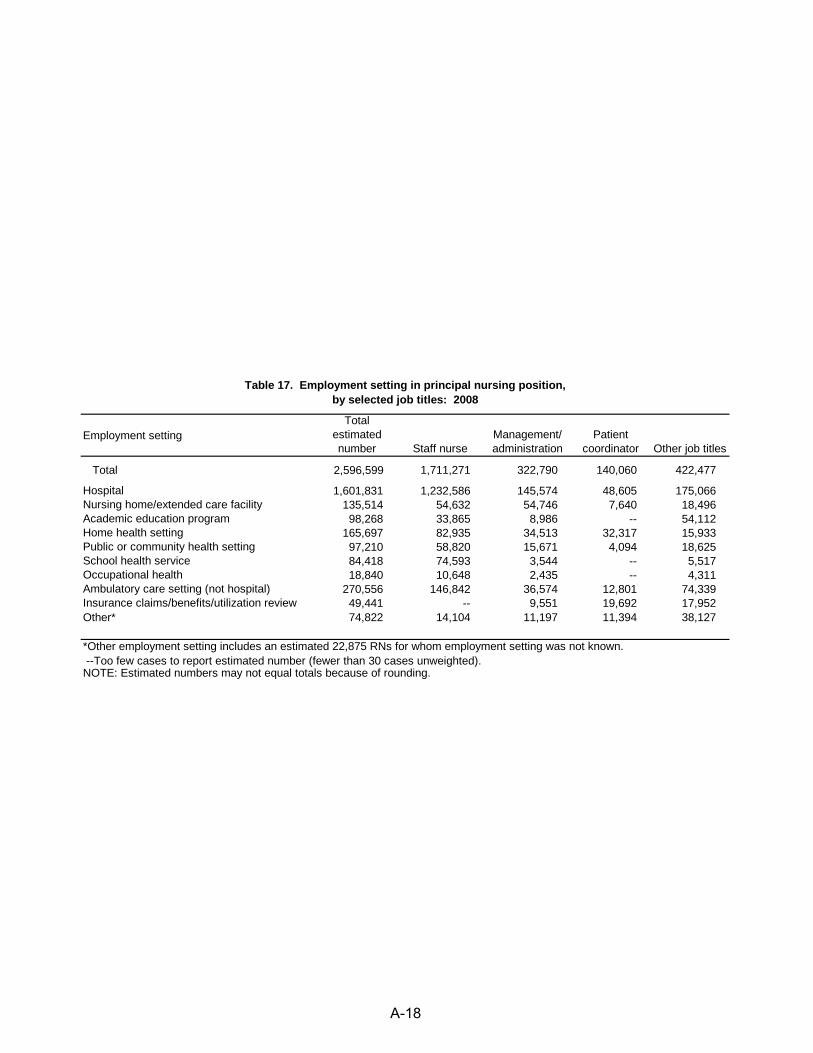
Table 17. Employment setting in principal nursing position, by selected job titles: 2008
Employment settingTotal
estimated number Staff nurse
Management/ administration
Patient coordinator Other job titles
Total 2,596,599 1,711,271 322,790 140,060 422,477
Hospital 1,601,831 1,232,586 145,574 48,605 175,066Nursing home/extended care facility 135,514 54,632 54,746 7,640 18,496Academic education program 98,268 33,865 8,986 -- 54,112Home health setting 165,697 82,935 34,513 32,317 15,933Public or community health setting 97,210 58,820 15,671 4,094 18,625School health service 84,418 74,593 3,544 -- 5,517Occupational health 18,840 10,648 2,435 -- 4,311Ambulatory care setting (not hospital) 270,556 146,842 36,574 12,801 74,339Insurance claims/benefits/utilization review 49,441 -- 9,551 19,692 17,952Other* 74,822 14,104 11,197 11,394 38,127
*Other employment setting includes an estimated 22,875 RNs for whom employment setting was not known. --Too few cases to report estimated number (fewer than 30 cases unweighted).NOTE: Estimated numbers may not equal totals because of rounding.
A-18
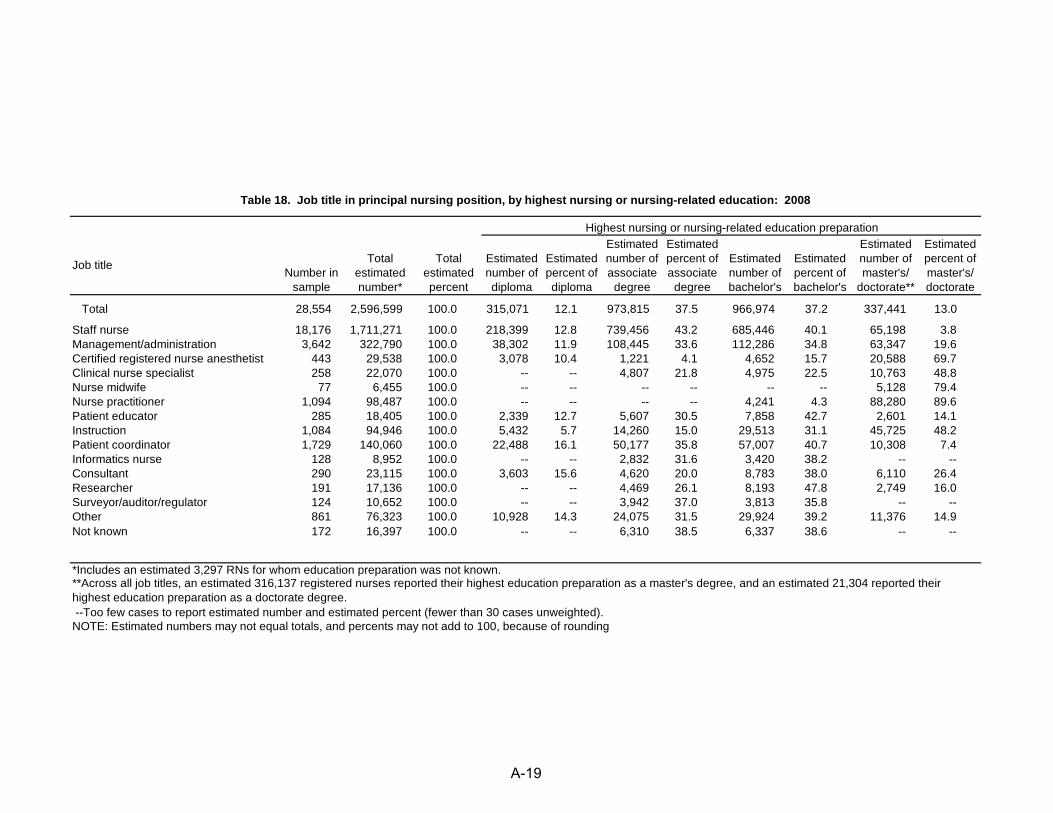
Table 18. Job title in principal nursing position, by highest nursing or nursing-related education: 2008
Job title Number in sample
Total estimated number*
Total estimated percent
Estimated number of diploma
Estimated percent of diploma
Estimated number of associate
degree
Estimated percent of associate
degree
Estimated number of bachelor's
Estimated percent of bachelor's
Estimated number of master's/
doctorate**
Estimated percent of master's/ doctorate
Total 28,554 2,596,599 100.0 315,071 12.1 973,815 37.5 966,974 37.2 337,441 13.0
Staff nurse 18,176 1,711,271 100.0 218,399 12.8 739,456 43.2 685,446 40.1 65,198 3.8Management/administration 3,642 322,790 100.0 38,302 11.9 108,445 33.6 112,286 34.8 63,347 19.6Certified registered nurse anesthetist 443 29,538 100.0 3,078 10.4 1,221 4.1 4,652 15.7 20,588 69.7Clinical nurse specialist 258 22,070 100.0 -- -- 4,807 21.8 4,975 22.5 10,763 48.8Nurse midwife 77 6,455 100.0 -- -- -- -- -- -- 5,128 79.4Nurse practitioner 1,094 98,487 100.0 -- -- -- -- 4,241 4.3 88,280 89.6Patient educator 285 18,405 100.0 2,339 12.7 5,607 30.5 7,858 42.7 2,601 14.1Instruction 1,084 94,946 100.0 5,432 5.7 14,260 15.0 29,513 31.1 45,725 48.2Patient coordinator 1,729 140,060 100.0 22,488 16.1 50,177 35.8 57,007 40.7 10,308 7.4Informatics nurse 128 8,952 100.0 -- -- 2,832 31.6 3,420 38.2 -- --Consultant 290 23,115 100.0 3,603 15.6 4,620 20.0 8,783 38.0 6,110 26.4Researcher 191 17,136 100.0 -- -- 4,469 26.1 8,193 47.8 2,749 16.0Surveyor/auditor/regulator 124 10,652 100.0 -- -- 3,942 37.0 3,813 35.8 -- --Other 861 76,323 100.0 10,928 14.3 24,075 31.5 29,924 39.2 11,376 14.9Not known 172 16,397 100.0 -- -- 6,310 38.5 6,337 38.6 -- --
Highest nursing or nursing-related education preparation
*Includes an estimated 3,297 RNs for whom education preparation was not known.**Across all job titles, an estimated 316,137 registered nurses reported their highest education preparation as a master's degree, and an estimated 21,304 reported their highest education preparation as a doctorate degree. --Too few cases to report estimated number and estimated percent (fewer than 30 cases unweighted).NOTE: Estimated numbers may not equal totals, and percents may not add to 100, because of rounding
A-19
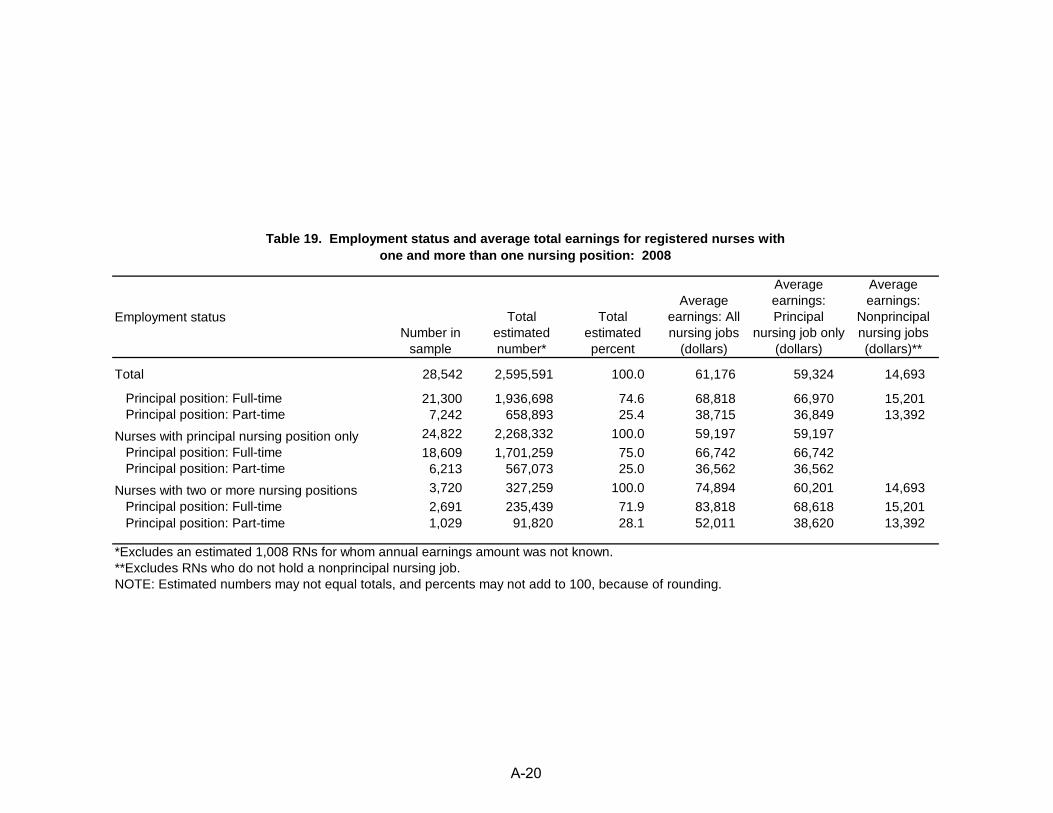
Table 19. Employment status and average total earnings for registered nurses with one and more than one nursing position: 2008
Employment statusNumber in
sample
Total estimated number*
Total estimated percent
Average earnings: All nursing jobs
(dollars)
Average earnings: Principal
nursing job only (dollars)
Average earnings:
Nonprincipal nursing jobs (dollars)**
Total 28,542 2,595,591 100.0 61,176 59,324 14,693
Principal position: Full-time 21,300 1,936,698 74.6 68,818 66,970 15,201Principal position: Part-time 7,242 658,893 25.4 38,715 36,849 13,392
Nurses with principal nursing position only 24,822 2,268,332 100.0 59,197 59,197 Principal position: Full-time 18,609 1,701,259 75.0 66,742 66,742 Principal position: Part-time 6,213 567,073 25.0 36,562 36,562
Nurses with two or more nursing positions 3,720 327,259 100.0 74,894 60,201 14,693Principal position: Full-time 2,691 235,439 71.9 83,818 68,618 15,201Principal position: Part-time 1,029 91,820 28.1 52,011 38,620 13,392
*Excludes an estimated 1,008 RNs for whom annual earnings amount was not known.**Excludes RNs who do not hold a nonprincipal nursing job.NOTE: Estimated numbers may not equal totals, and percents may not add to 100, because of rounding.
A-20
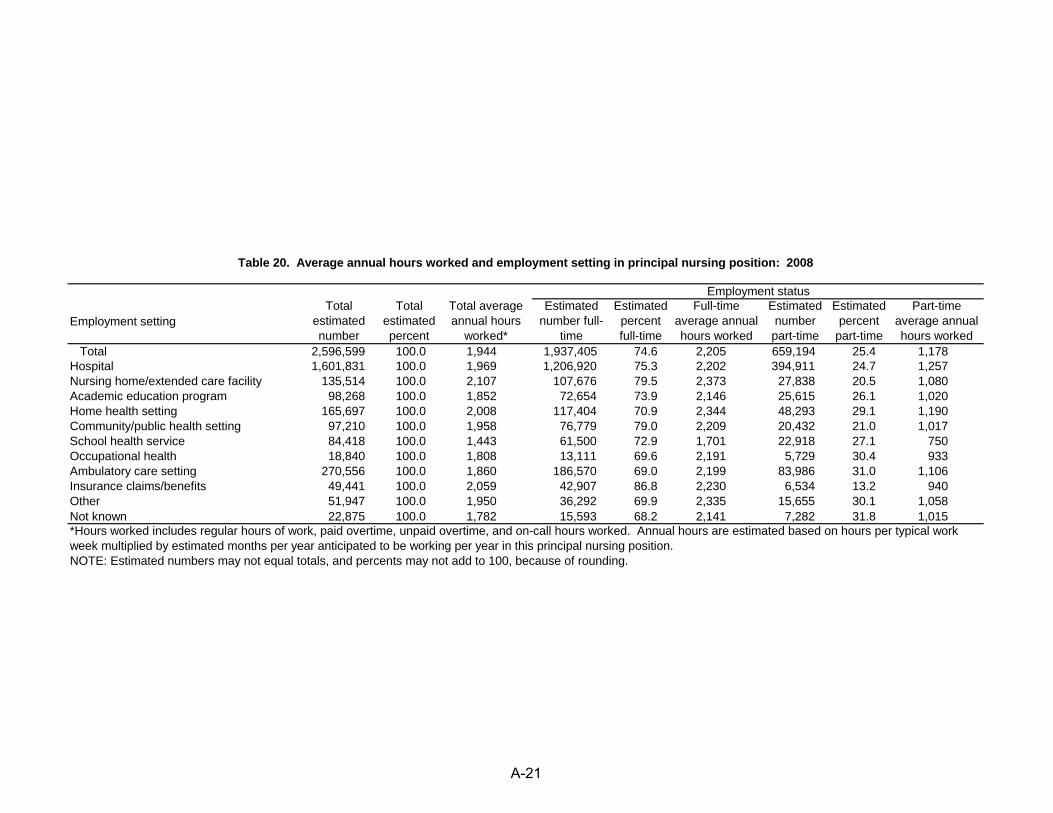
Table 20. Average annual hours worked and employment setting in principal nursing position: 2008
Employment settingTotal
estimated number
Total estimated percent
Total average annual hours
worked*
Estimated number full-
time
Estimated percent full-time
Full-time average annual hours worked
Estimated number part-time
Estimated percent
part-time
Part-time average annual hours worked
Total 2,596,599 100.0 1,944 1,937,405 74.6 2,205 659,194 25.4 1,178Hospital 1,601,831 100.0 1,969 1,206,920 75.3 2,202 394,911 24.7 1,257Nursing home/extended care facility 135,514 100.0 2,107 107,676 79.5 2,373 27,838 20.5 1,080Academic education program 98,268 100.0 1,852 72,654 73.9 2,146 25,615 26.1 1,020Home health setting 165,697 100.0 2,008 117,404 70.9 2,344 48,293 29.1 1,190Community/public health setting 97,210 100.0 1,958 76,779 79.0 2,209 20,432 21.0 1,017School health service 84,418 100.0 1,443 61,500 72.9 1,701 22,918 27.1 750Occupational health 18,840 100.0 1,808 13,111 69.6 2,191 5,729 30.4 933Ambulatory care setting 270,556 100.0 1,860 186,570 69.0 2,199 83,986 31.0 1,106Insurance claims/benefits 49,441 100.0 2,059 42,907 86.8 2,230 6,534 13.2 940Other 51,947 100.0 1,950 36,292 69.9 2,335 15,655 30.1 1,058Not known 22,875 100.0 1,782 15,593 68.2 2,141 7,282 31.8 1,015
Employment status
*Hours worked includes regular hours of work, paid overtime, unpaid overtime, and on-call hours worked. Annual hours are estimated based on hours per typical work week multiplied by estimated months per year anticipated to be working per year in this principal nursing position.NOTE: Estimated numbers may not equal totals, and percents may not add to 100, because of rounding.
A-21
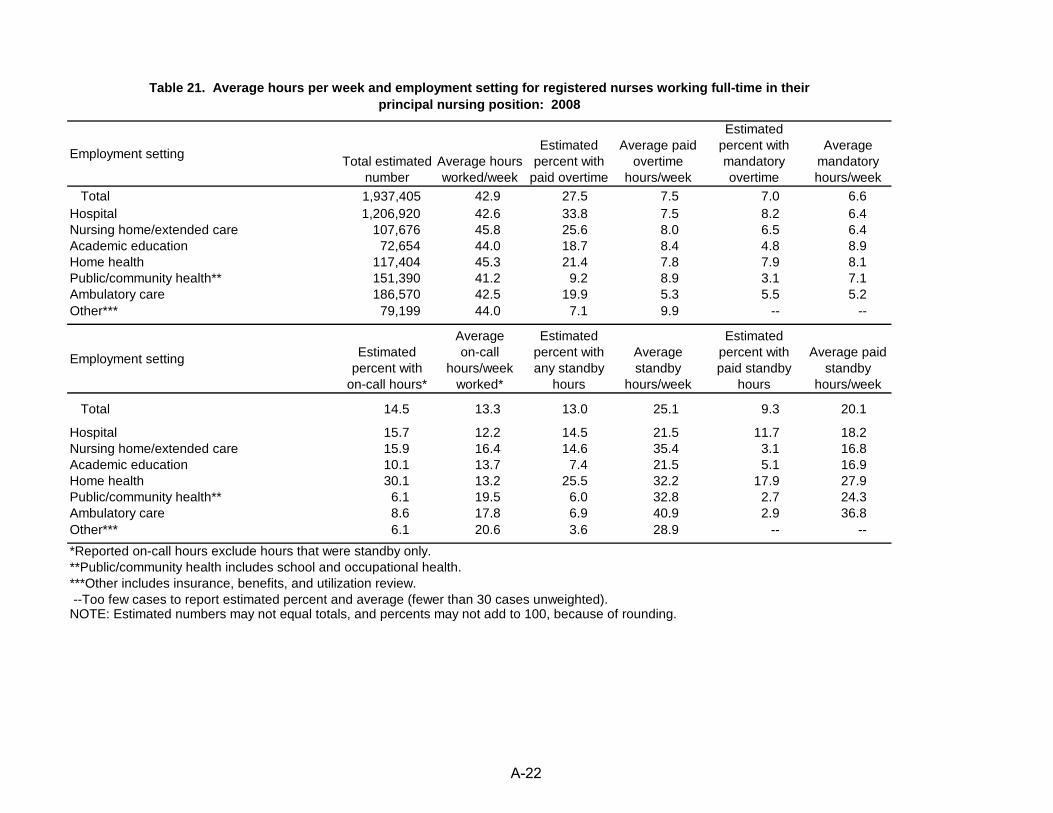
Table 21. Average hours per week and employment setting for registered nurses working full-time in their principal nursing position: 2008
Employment setting Total estimated number
Average hours worked/week
Estimated percent with
paid overtime
Average paid overtime
hours/week
Estimated percent with mandatory overtime
Average mandatory hours/week
Total 1,937,405 42.9 27.5 7.5 7.0 6.6Hospital 1,206,920 42.6 33.8 7.5 8.2 6.4Nursing home/extended care 107,676 45.8 25.6 8.0 6.5 6.4Academic education 72,654 44.0 18.7 8.4 4.8 8.9Home health 117,404 45.3 21.4 7.8 7.9 8.1Public/community health** 151,390 41.2 9.2 8.9 3.1 7.1Ambulatory care 186,570 42.5 19.9 5.3 5.5 5.2Other*** 79,199 44.0 7.1 9.9 -- --
Employment setting Estimated percent with
on-call hours*
Average on-call
hours/week worked*
Estimated percent with any standby
hours
Average standby
hours/week
Estimated percent with paid standby
hours
Average paid standby
hours/week
Total 14.5 13.3 13.0 25.1 9.3 20.1
Hospital 15.7 12.2 14.5 21.5 11.7 18.2Nursing home/extended care 15.9 16.4 14.6 35.4 3.1 16.8Academic education 10.1 13.7 7.4 21.5 5.1 16.9Home health 30.1 13.2 25.5 32.2 17.9 27.9Public/community health** 6.1 19.5 6.0 32.8 2.7 24.3Ambulatory care 8.6 17.8 6.9 40.9 2.9 36.8Other*** 6.1 20.6 3.6 28.9 -- --*Reported on-call hours exclude hours that were standby only.**Public/community health includes school and occupational health.***Other includes insurance, benefits, and utilization review. --Too few cases to report estimated percent and average (fewer than 30 cases unweighted).NOTE: Estimated numbers may not equal totals, and percents may not add to 100, because of rounding.
A-22
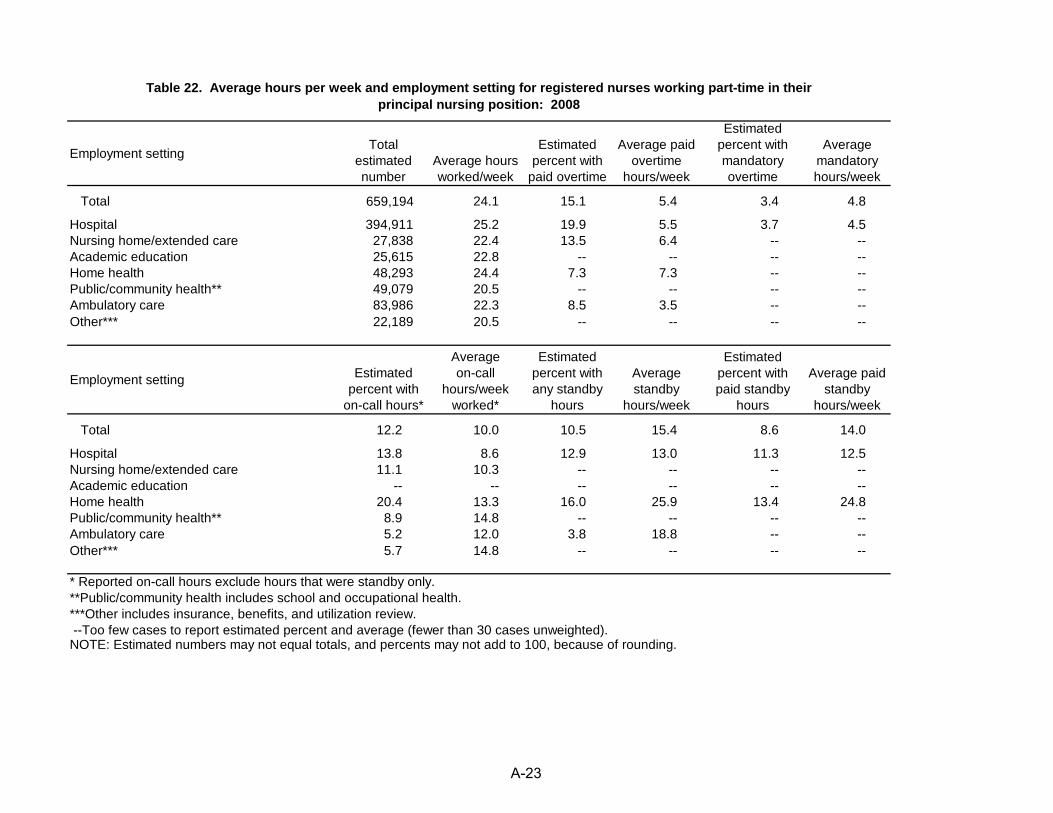
Table 22. Average hours per week and employment setting for registered nurses working part-time in their principal nursing position: 2008
Employment settingTotal
estimated number
Average hours worked/week
Estimated percent with
paid overtime
Average paid overtime
hours/week
Estimated percent with mandatory overtime
Average mandatory hours/week
Total 659,194 24.1 15.1 5.4 3.4 4.8
Hospital 394,911 25.2 19.9 5.5 3.7 4.5Nursing home/extended care 27,838 22.4 13.5 6.4 -- --Academic education 25,615 22.8 -- -- -- --Home health 48,293 24.4 7.3 7.3 -- --Public/community health** 49,079 20.5 -- -- -- --Ambulatory care 83,986 22.3 8.5 3.5 -- --Other*** 22,189 20.5 -- -- -- --
Employment setting Estimated percent with
on-call hours*
Average on-call
hours/week worked*
Estimated percent with any standby
hours
Average standby
hours/week
Estimated percent with paid standby
hours
Average paid standby
hours/week
Total 12.2 10.0 10.5 15.4 8.6 14.0
Hospital 13.8 8.6 12.9 13.0 11.3 12.5Nursing home/extended care 11.1 10.3 -- -- -- --Academic education -- -- -- -- -- --Home health 20.4 13.3 16.0 25.9 13.4 24.8Public/community health** 8.9 14.8 -- -- -- --Ambulatory care 5.2 12.0 3.8 18.8 -- --Other*** 5.7 14.8 -- -- -- --
* Reported on-call hours exclude hours that were standby only.**Public/community health includes school and occupational health.***Other includes insurance, benefits, and utilization review. --Too few cases to report estimated percent and average (fewer than 30 cases unweighted).NOTE: Estimated numbers may not equal totals, and percents may not add to 100, because of rounding.
A-23
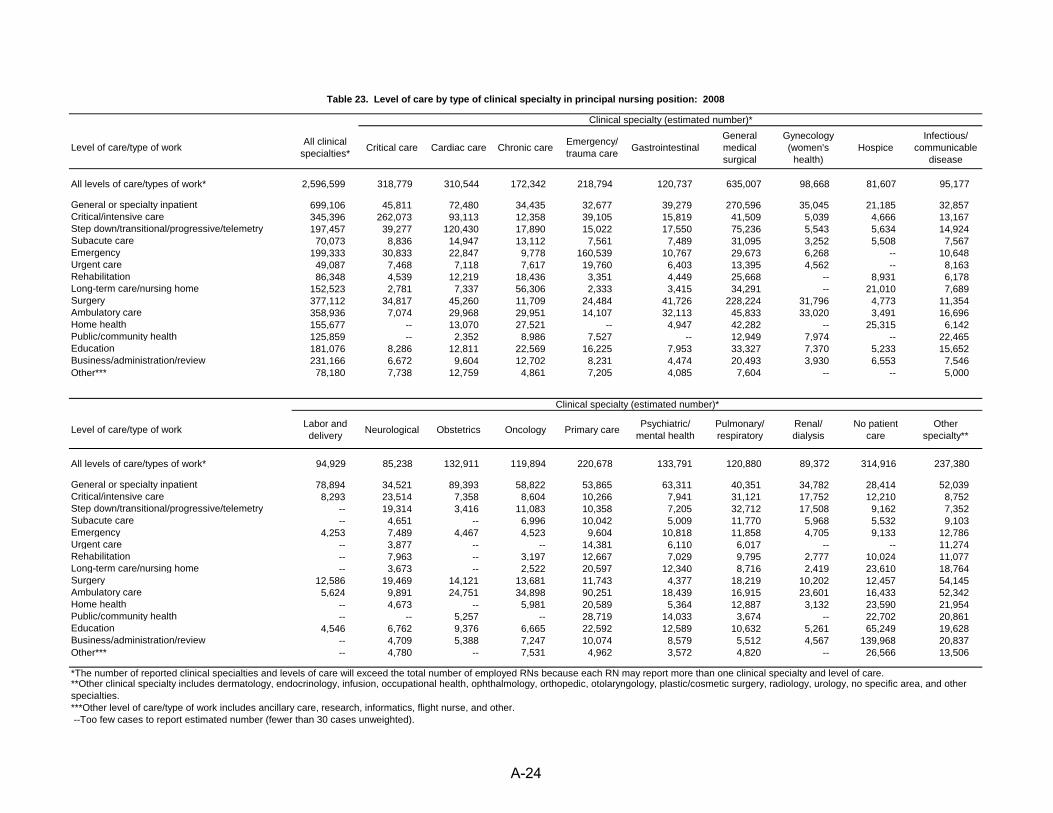
Table 23. Level of care by type of clinical specialty in principal nursing position: 2008
Level of care/type of work All clinical specialties* Critical care Cardiac care Chronic care Emergency/
trauma care GastrointestinalGeneral medical surgical
Gynecology (women's
health)Hospice
Infectious/communicable
disease
All levels of care/types of work* 2,596,599 318,779 310,544 172,342 218,794 120,737 635,007 98,668 81,607 95,177
General or specialty inpatient 699,106 45,811 72,480 34,435 32,677 39,279 270,596 35,045 21,185 32,857Critical/intensive care 345,396 262,073 93,113 12,358 39,105 15,819 41,509 5,039 4,666 13,167Step down/transitional/progressive/telemetry 197,457 39,277 120,430 17,890 15,022 17,550 75,236 5,543 5,634 14,924Subacute care 70,073 8,836 14,947 13,112 7,561 7,489 31,095 3,252 5,508 7,567Emergency 199,333 30,833 22,847 9,778 160,539 10,767 29,673 6,268 -- 10,648Urgent care 49,087 7,468 7,118 7,617 19,760 6,403 13,395 4,562 -- 8,163Rehabilitation 86,348 4,539 12,219 18,436 3,351 4,449 25,668 -- 8,931 6,178Long-term care/nursing home 152,523 2,781 7,337 56,306 2,333 3,415 34,291 -- 21,010 7,689Surgery 377,112 34,817 45,260 11,709 24,484 41,726 228,224 31,796 4,773 11,354Ambulatory care 358,936 7,074 29,968 29,951 14,107 32,113 45,833 33,020 3,491 16,696Home health 155,677 -- 13,070 27,521 -- 4,947 42,282 -- 25,315 6,142Public/community health 125,859 -- 2,352 8,986 7,527 -- 12,949 7,974 -- 22,465Education 181,076 8,286 12,811 22,569 16,225 7,953 33,327 7,370 5,233 15,652Business/administration/review 231,166 6,672 9,604 12,702 8,231 4,474 20,493 3,930 6,553 7,546Other*** 78,180 7,738 12,759 4,861 7,205 4,085 7,604 -- -- 5,000
Clinical specialty (estimated number)*
Level of care/type of work Labor and delivery Neurological Obstetrics Oncology Primary care Psychiatric/
mental healthPulmonary/respiratory
Renal/dialysis
No patient care
Other specialty**
All levels of care/types of work* 94,929 85,238 132,911 119,894 220,678 133,791 120,880 89,372 314,916 237,380
General or specialty inpatient 78,894 34,521 89,393 58,822 53,865 63,311 40,351 34,782 28,414 52,039Critical/intensive care 8,293 23,514 7,358 8,604 10,266 7,941 31,121 17,752 12,210 8,752Step down/transitional/progressive/telemetry -- 19,314 3,416 11,083 10,358 7,205 32,712 17,508 9,162 7,352Subacute care -- 4,651 -- 6,996 10,042 5,009 11,770 5,968 5,532 9,103Emergency 4,253 7,489 4,467 4,523 9,604 10,818 11,858 4,705 9,133 12,786Urgent care -- 3,877 -- -- 14,381 6,110 6,017 -- -- 11,274Rehabilitation -- 7,963 -- 3,197 12,667 7,029 9,795 2,777 10,024 11,077Long-term care/nursing home -- 3,673 -- 2,522 20,597 12,340 8,716 2,419 23,610 18,764Surgery 12,586 19,469 14,121 13,681 11,743 4,377 18,219 10,202 12,457 54,145Ambulatory care 5,624 9,891 24,751 34,898 90,251 18,439 16,915 23,601 16,433 52,342Home health -- 4,673 -- 5,981 20,589 5,364 12,887 3,132 23,590 21,954Public/community health -- -- 5,257 -- 28,719 14,033 3,674 -- 22,702 20,861Education 4,546 6,762 9,376 6,665 22,592 12,589 10,632 5,261 65,249 19,628Business/administration/review -- 4,709 5,388 7,247 10,074 8,579 5,512 4,567 139,968 20,837Other*** -- 4,780 -- 7,531 4,962 3,572 4,820 -- 26,566 13,506
Clinical specialty (estimated number)*
*The number of reported clinical specialties and levels of care will exceed the total number of employed RNs because each RN may report more than one clinical specialty and level of care.**Other clinical specialty includes dermatology, endocrinology, infusion, occupational health, ophthalmology, orthopedic, otolaryngology, plastic/cosmetic surgery, radiology, urology, no specific area, and other specialties.***Other level of care/type of work includes ancillary care, research, informatics, flight nurse, and other. --Too few cases to report estimated number (fewer than 30 cases unweighted).
A-24
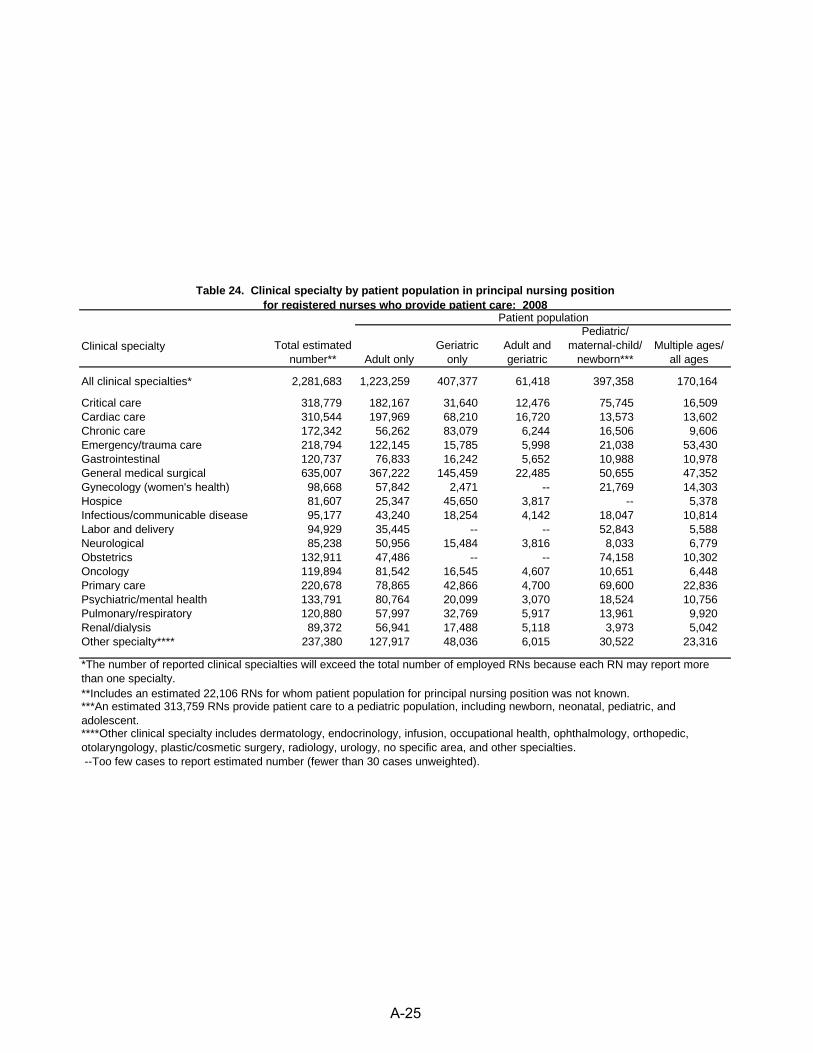
Table 24. Clinical specialty by patient population in principal nursing positionfor registered nurses who provide patient care: 2008
Clinical specialty Total estimated number** Adult only
Geriatric only
Adult and geriatric
Pediatric/ maternal-child/
newborn*** Multiple ages/
all ages
All clinical specialties* 2,281,683 1,223,259 407,377 61,418 397,358 170,164
Critical care 318,779 182,167 31,640 12,476 75,745 16,509Cardiac care 310,544 197,969 68,210 16,720 13,573 13,602Chronic care 172,342 56,262 83,079 6,244 16,506 9,606Emergency/trauma care 218,794 122,145 15,785 5,998 21,038 53,430Gastrointestinal 120,737 76,833 16,242 5,652 10,988 10,978General medical surgical 635,007 367,222 145,459 22,485 50,655 47,352Gynecology (women's health) 98,668 57,842 2,471 -- 21,769 14,303Hospice 81,607 25,347 45,650 3,817 -- 5,378Infectious/communicable disease 95,177 43,240 18,254 4,142 18,047 10,814Labor and delivery 94,929 35,445 -- -- 52,843 5,588Neurological 85,238 50,956 15,484 3,816 8,033 6,779Obstetrics 132,911 47,486 -- -- 74,158 10,302Oncology 119,894 81,542 16,545 4,607 10,651 6,448Primary care 220,678 78,865 42,866 4,700 69,600 22,836Psychiatric/mental health 133,791 80,764 20,099 3,070 18,524 10,756Pulmonary/respiratory 120,880 57,997 32,769 5,917 13,961 9,920Renal/dialysis 89,372 56,941 17,488 5,118 3,973 5,042Other specialty**** 237,380 127,917 48,036 6,015 30,522 23,316
Patient population
*The number of reported clinical specialties will exceed the total number of employed RNs because each RN may report more than one specialty.**Includes an estimated 22,106 RNs for whom patient population for principal nursing position was not known.***An estimated 313,759 RNs provide patient care to a pediatric population, including newborn, neonatal, pediatric, and adolescent.****Other clinical specialty includes dermatology, endocrinology, infusion, occupational health, ophthalmology, orthopedic, otolaryngology, plastic/cosmetic surgery, radiology, urology, no specific area, and other specialties. --Too few cases to report estimated number (fewer than 30 cases unweighted).
A-25
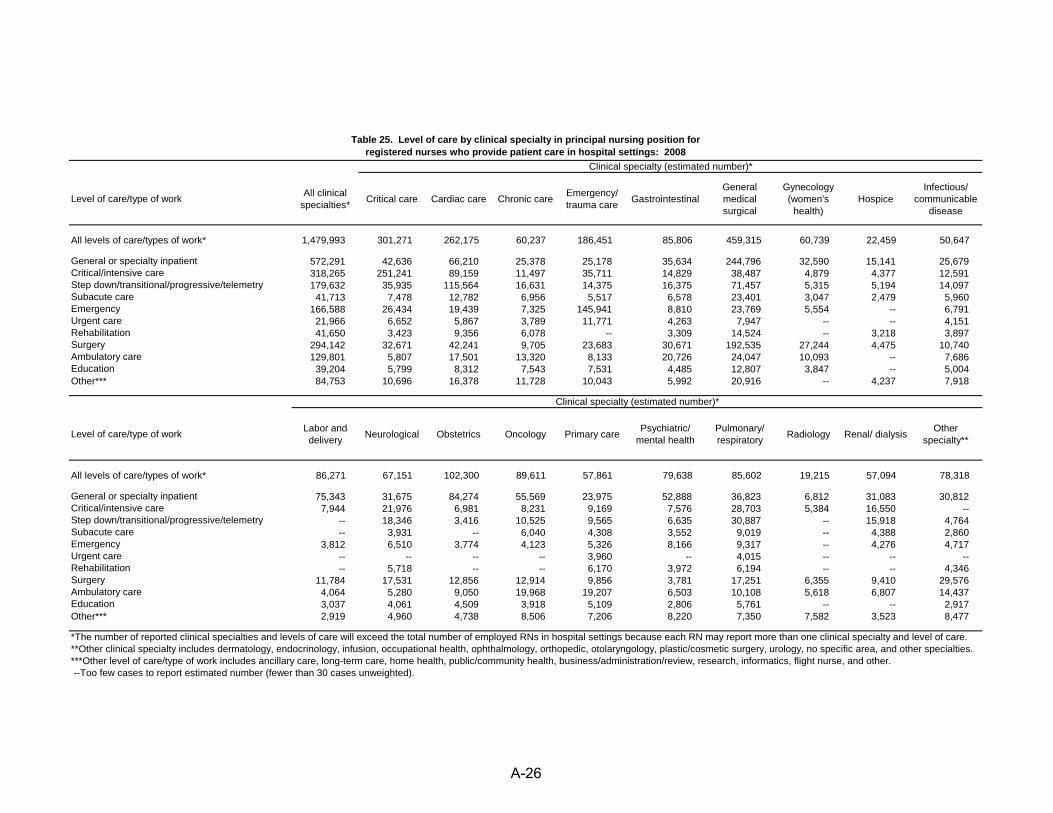
Table 25. Level of care by clinical specialty in principal nursing position for registered nurses who provide patient care in hospital settings: 2008
Level of care/type of work
Clinical specialty (estimated number)*
All clinical specialties* Critical care Cardiac care Chronic care Emergency/
trauma care GastrointestinalGeneral medical surgical
Gynecology (women's
health)Hospice
Infectious/ communicable
disease
All levels of care/types of work* 1,479,993 301,271 262,175 60,237 186,451 85,806 459,315 60,739 22,459 50,647
General or specialty inpatient 572,291 42,636 66,210 25,378 25,178 35,634 244,796 32,590 15,141 25,679Critical/intensive care 318,265 251,241 89,159 11,497 35,711 14,829 38,487 4,879 4,377 12,591Step down/transitional/progressive/telemetry 179,632 35,935 115,564 16,631 14,375 16,375 71,457 5,315 5,194 14,097Subacute care 41,713 7,478 12,782 6,956 5,517 6,578 23,401 3,047 2,479 5,960Emergency 166,588 26,434 19,439 7,325 145,941 8,810 23,769 5,554 -- 6,791Urgent care 21,966 6,652 5,867 3,789 11,771 4,263 7,947 -- -- 4,151Rehabilitation 41,650 3,423 9,356 6,078 -- 3,309 14,524 -- 3,218 3,897Surgery 294,142 32,671 42,241 9,705 23,683 30,671 192,535 27,244 4,475 10,740Ambulatory care 129,801 5,807 17,501 13,320 8,133 20,726 24,047 10,093 -- 7,686Education 39,204 5,799 8,312 7,543 7,531 4,485 12,807 3,847 -- 5,004Other*** 84,753 10,696 16,378 11,728 10,043 5,992 20,916 -- 4,237 7,918
Level of care/type of work
Clinical specialty (estimated number)*
Labor and delivery Neurological Obstetrics Oncology Primary care Psychiatric/
mental healthPulmonary/ respiratory Radiology Renal/ dialysis Other
specialty**
All levels of care/types of work* 86,271 67,151 102,300 89,611 57,861 79,638 85,602 19,215 57,094 78,318
General or specialty inpatient 75,343 31,675 84,274 55,569 23,975 52,888 36,823 6,812 31,083 30,812Critical/intensive care 7,944 21,976 6,981 8,231 9,169 7,576 28,703 5,384 16,550 --Step down/transitional/progressive/telemetry -- 18,346 3,416 10,525 9,565 6,635 30,887 -- 15,918 4,764Subacute care -- 3,931 -- 6,040 4,308 3,552 9,019 -- 4,388 2,860Emergency 3,812 6,510 3,774 4,123 5,326 8,166 9,317 -- 4,276 4,717Urgent care -- -- -- -- 3,960 -- 4,015 -- -- --Rehabilitation -- 5,718 -- -- 6,170 3,972 6,194 -- -- 4,346Surgery 11,784 17,531 12,856 12,914 9,856 3,781 17,251 6,355 9,410 29,576Ambulatory care 4,064 5,280 9,050 19,968 19,207 6,503 10,108 5,618 6,807 14,437Education 3,037 4,061 4,509 3,918 5,109 2,806 5,761 -- -- 2,917Other*** 2,919 4,960 4,738 8,506 7,206 8,220 7,350 7,582 3,523 8,477
--Too few cases to report estimated number (fewer than 30 cases unweighted).***Other level of care/type of work includes ancillary care, long-term care, home health, public/community health, business/administration/review, research, informatics, flight nurse, and other.
*The number of reported clinical specialties and levels of care will exceed the total number of employed RNs in hospital settings because each RN may report more than one clinical specialty and level of care.**Other clinical specialty includes dermatology, endocrinology, infusion, occupational health, ophthalmology, orthopedic, otolaryngology, plastic/cosmetic surgery, urology, no specific area, and other specialties.
A-26
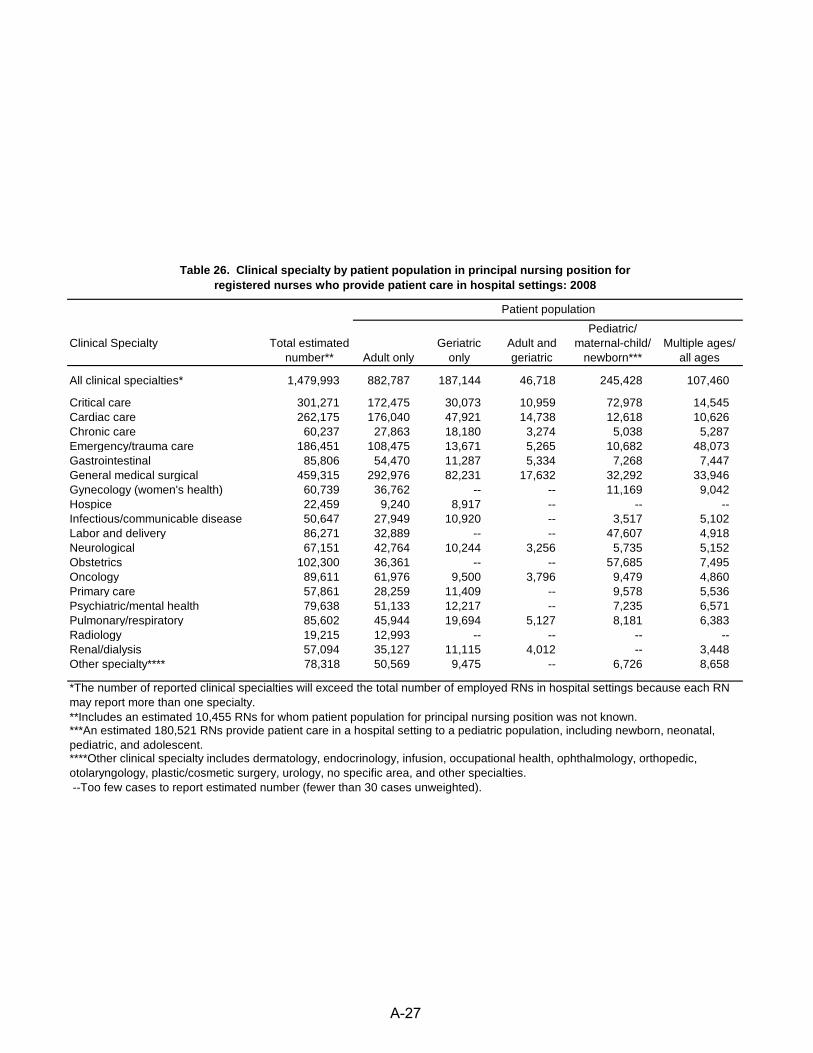
Table 26. Clinical specialty by patient population in principal nursing position forregistered nurses who provide patient care in hospital settings: 2008
Patient population
Clinical Specialty Total estimated number** Adult only
Geriatric only
Adult and geriatric
Pediatric/ maternal-child/
newborn*** Multiple ages/
all ages
All clinical specialties* 1,479,993 882,787 187,144 46,718 245,428 107,460
Critical care 301,271 172,475 30,073 10,959 72,978 14,545Cardiac care 262,175 176,040 47,921 14,738 12,618 10,626Chronic care 60,237 27,863 18,180 3,274 5,038 5,287Emergency/trauma care 186,451 108,475 13,671 5,265 10,682 48,073Gastrointestinal 85,806 54,470 11,287 5,334 7,268 7,447General medical surgical 459,315 292,976 82,231 17,632 32,292 33,946Gynecology (women's health) 60,739 36,762 -- -- 11,169 9,042Hospice 22,459 9,240 8,917 -- -- --Infectious/communicable disease 50,647 27,949 10,920 -- 3,517 5,102Labor and delivery 86,271 32,889 -- -- 47,607 4,918Neurological 67,151 42,764 10,244 3,256 5,735 5,152Obstetrics 102,300 36,361 -- -- 57,685 7,495Oncology 89,611 61,976 9,500 3,796 9,479 4,860Primary care 57,861 28,259 11,409 -- 9,578 5,536Psychiatric/mental health 79,638 51,133 12,217 -- 7,235 6,571Pulmonary/respiratory 85,602 45,944 19,694 5,127 8,181 6,383Radiology 19,215 12,993 -- -- -- --Renal/dialysis 57,094 35,127 11,115 4,012 -- 3,448Other specialty**** 78,318 50,569 9,475 -- 6,726 8,658
*The number of reported clinical specialties will exceed the total number of employed RNs in hospital settings because each RN may report more than one specialty.**Includes an estimated 10,455 RNs for whom patient population for principal nursing position was not known.***An estimated 180,521 RNs provide patient care in a hospital setting to a pediatric population, including newborn, neonatal, pediatric, and adolescent.****Other clinical specialty includes dermatology, endocrinology, infusion, occupational health, ophthalmology, orthopedic, otolaryngology, plastic/cosmetic surgery, urology, no specific area, and other specialties. --Too few cases to report estimated number (fewer than 30 cases unweighted).
A-27
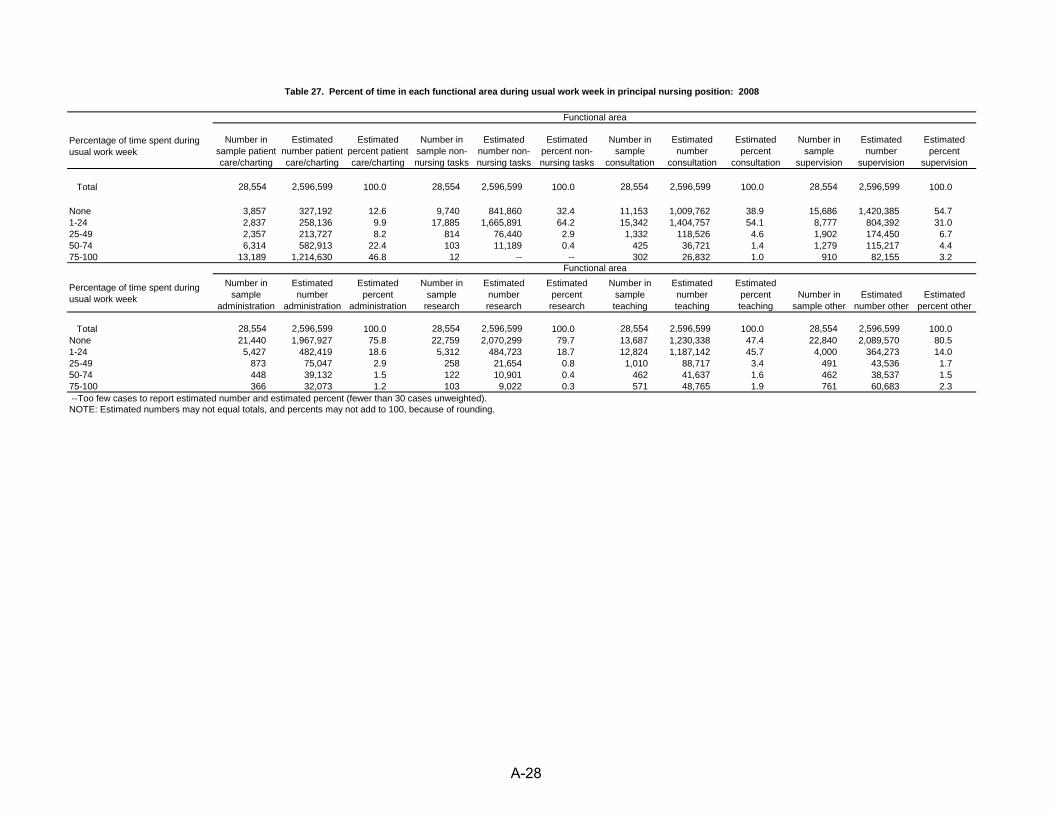
Table 27. Percent of time in each functional area during usual work week in principal nursing position: 2008
Percentage of time spent during usual work week
Functional area
Number in sample patient care/charting
Estimated number patient care/charting
Estimated percent patient care/charting
Number in sample non-nursing tasks
Estimated number non-nursing tasks
Estimated percent non-nursing tasks
Number in sample
consultation
Estimated number
consultation
Estimated percent
consultation
Number in sample
supervision
Estimated number
supervision
Estimated percent
supervision
Total 28,554 2,596,599 100.0 28,554 2,596,599 100.0 28,554 2,596,599 100.0 28,554 2,596,599 100.0
None 3,857 327,192 12.6 9,740 841,860 32.4 11,153 1,009,762 38.9 15,686 1,420,385 54.71-24 2,837 258,136 9.9 17,885 1,665,891 64.2 15,342 1,404,757 54.1 8,777 804,392 31.025-49 2,357 213,727 8.2 814 76,440 2.9 1,332 118,526 4.6 1,902 174,450 6.750-74 6,314 582,913 22.4 103 11,189 0.4 425 36,721 1.4 1,279 115,217 4.475-100 13,189 1,214,630 46.8 12 -- -- 302 26,832 1.0 910 82,155 3.2
Percentage of time spent during usual work week
Functional areaNumber in
sample administration
Estimated number
administration
Estimated percent
administration
Number in sample
research
Estimated number research
Estimated percent research
Number in sample teaching
Estimated number teaching
Estimated percent teaching
Number in sample other
Estimated number other
Estimated percent other
Total 28,554 2,596,599 100.0 28,554 2,596,599 100.0 28,554 2,596,599 100.0 28,554 2,596,599 100.0None 21,440 1,967,927 75.8 22,759 2,070,299 79.7 13,687 1,230,338 47.4 22,840 2,089,570 80.51-24 5,427 482,419 18.6 5,312 484,723 18.7 12,824 1,187,142 45.7 4,000 364,273 14.025-49 873 75,047 2.9 258 21,654 0.8 1,010 88,717 3.4 491 43,536 1.750-74 448 39,132 1.5 122 10,901 0.4 462 41,637 1.6 462 38,537 1.575-100 366 32,073 1.2 103 9,022 0.3 571 48,765 1.9 761 60,683 2.3
--Too few cases to report estimated number and estimated percent (fewer than 30 cases unweighted).NOTE: Estimated numbers may not equal totals, and percents may not add to 100, because of rounding.
A-28
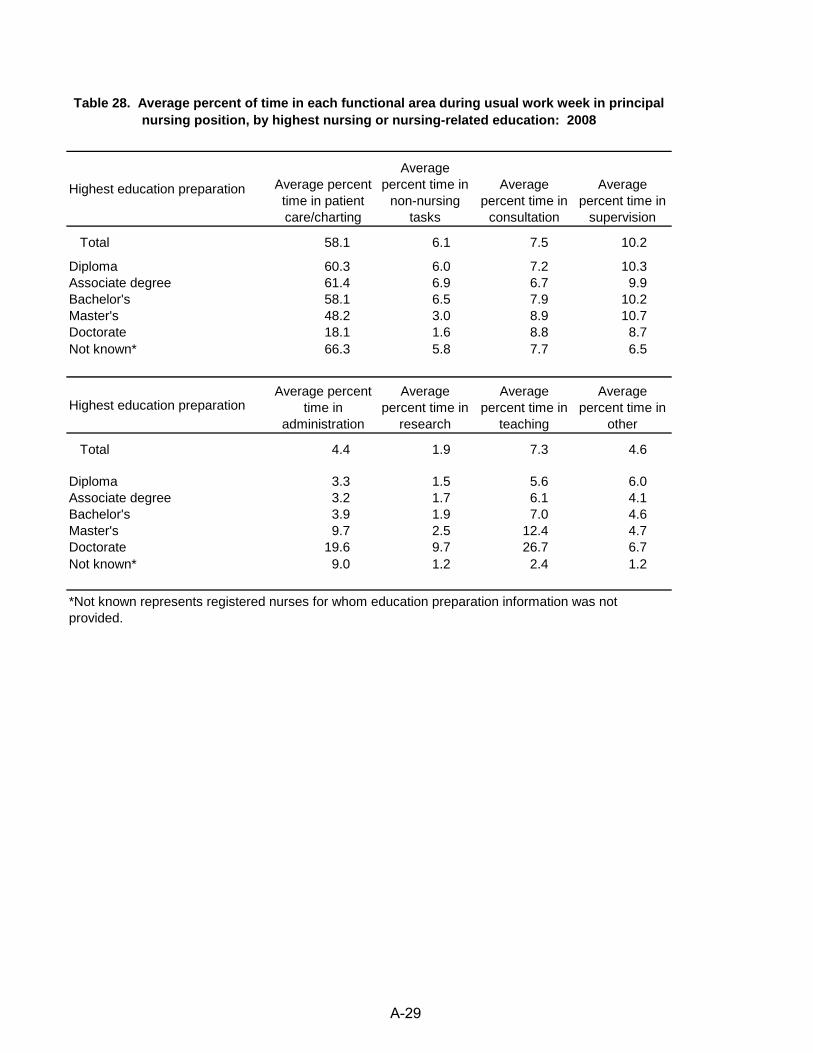
Table 28. Average percent of time in each functional area during usual work week in principal nursing position, by highest nursing or nursing-related education: 2008
Highest education preparation Average percent time in patient care/charting
Average percent time in
non-nursing tasks
Average percent time in
consultation
Average percent time in
supervision
Total 58.1 6.1 7.5 10.2
Diploma 60.3 6.0 7.2 10.3Associate degree 61.4 6.9 6.7 9.9Bachelor's 58.1 6.5 7.9 10.2Master's 48.2 3.0 8.9 10.7Doctorate 18.1 1.6 8.8 8.7Not known* 66.3 5.8 7.7 6.5
Highest education preparationAverage percent
time in administration
Average percent time in
research
Average percent time in
teaching
Average percent time in
other
Total 4.4 1.9 7.3 4.6
Diploma 3.3 1.5 5.6 6.0Associate degree 3.2 1.7 6.1 4.1Bachelor's 3.9 1.9 7.0 4.6Master's 9.7 2.5 12.4 4.7Doctorate 19.6 9.7 26.7 6.7Not known* 9.0 1.2 2.4 1.2
*Not known represents registered nurses for whom education preparation information was not provided.
A-29
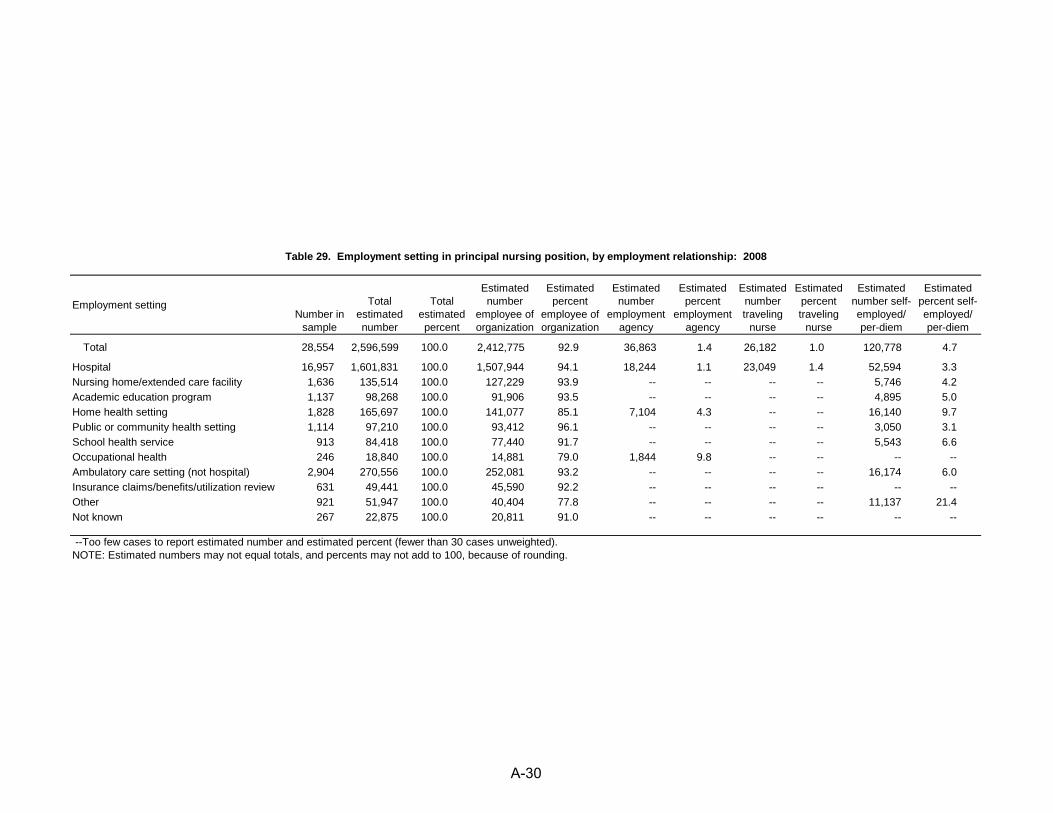
Table 29. Employment setting in principal nursing position, by employment relationship: 2008
Employment settingNumber in
sample
Total estimated number
Total estimated percent
Estimated number
employee of organization
Estimated percent
employee of organization
Estimated number
employment agency
Estimated percent
employment agency
Estimated number traveling
nurse
Estimated percent traveling
nurse
Estimated number self-employed/ per-diem
Estimated percent self-employed/ per-diem
Total 28,554 2,596,599 100.0 2,412,775 92.9 36,863 1.4 26,182 1.0 120,778 4.7
Hospital 16,957 1,601,831 100.0 1,507,944 94.1 18,244 1.1 23,049 1.4 52,594 3.3Nursing home/extended care facility 1,636 135,514 100.0 127,229 93.9 -- -- -- -- 5,746 4.2Academic education program 1,137 98,268 100.0 91,906 93.5 -- -- -- -- 4,895 5.0Home health setting 1,828 165,697 100.0 141,077 85.1 7,104 4.3 -- -- 16,140 9.7Public or community health setting 1,114 97,210 100.0 93,412 96.1 -- -- -- -- 3,050 3.1School health service 913 84,418 100.0 77,440 91.7 -- -- -- -- 5,543 6.6Occupational health 246 18,840 100.0 14,881 79.0 1,844 9.8 -- -- -- --Ambulatory care setting (not hospital) 2,904 270,556 100.0 252,081 93.2 -- -- -- -- 16,174 6.0Insurance claims/benefits/utilization review 631 49,441 100.0 45,590 92.2 -- -- -- -- -- --Other 921 51,947 100.0 40,404 77.8 -- -- -- -- 11,137 21.4Not known 267 22,875 100.0 20,811 91.0 -- -- -- -- -- --
--Too few cases to report estimated number and estimated percent (fewer than 30 cases unweighted).NOTE: Estimated numbers may not equal totals, and percents may not add to 100, because of rounding.
A-30
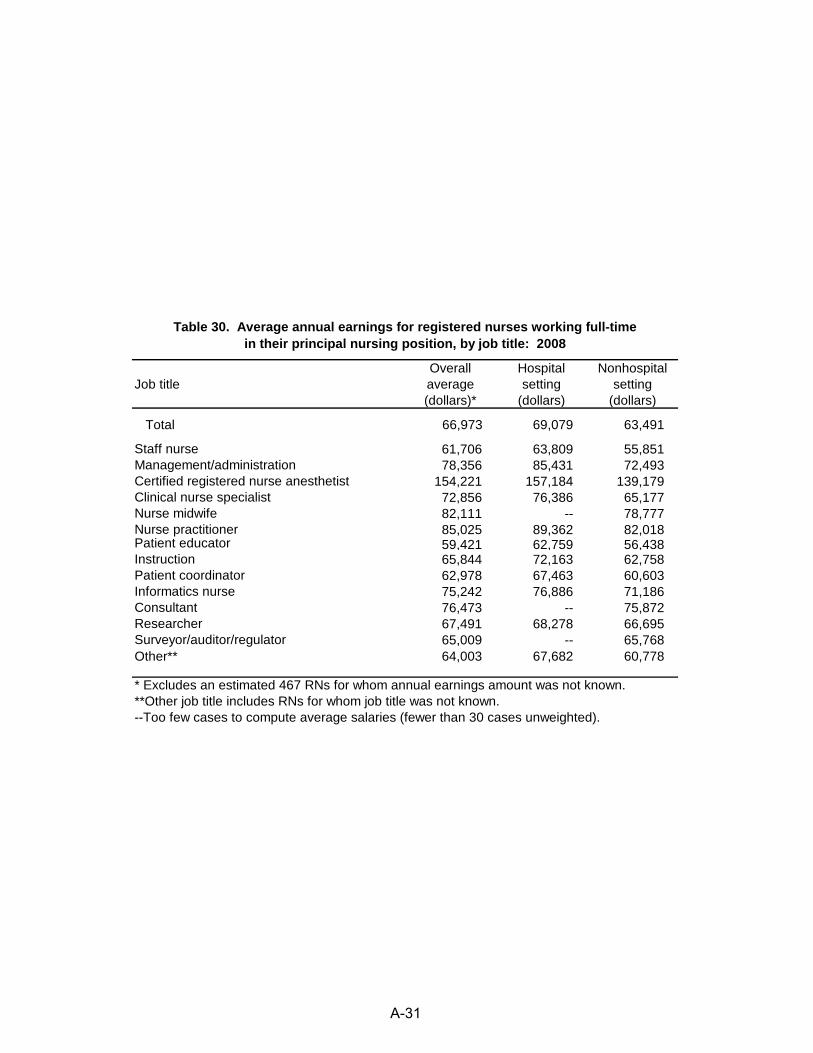
Table 30. Average annual earnings for registered nurses working full-time in their principal nursing position, by job title: 2008
Job titleOverall average (dollars)*
Hospital setting
(dollars)
Nonhospital setting
(dollars)
Total 66,973 69,079 63,491
Staff nurse 61,706 63,809 55,851Management/administration 78,356 85,431 72,493Certified registered nurse anesthetist 154,221 157,184 139,179Clinical nurse specialist 72,856 76,386 65,177Nurse midwife 82,111 -- 78,777Nurse practitioner 85,025 89,362 82,018Patient educator 59,421 62,759 56,438Instruction 65,844 72,163 62,758Patient coordinator 62,978 67,463 60,603Informatics nurse 75,242 76,886 71,186Consultant 76,473 -- 75,872Researcher 67,491 68,278 66,695Surveyor/auditor/regulator 65,009 -- 65,768Other** 64,003 67,682 60,778
* Excludes an estimated 467 RNs for whom annual earnings amount was not known.**Other job title includes RNs for whom job title was not known.--Too few cases to compute average salaries (fewer than 30 cases unweighted).
A-31
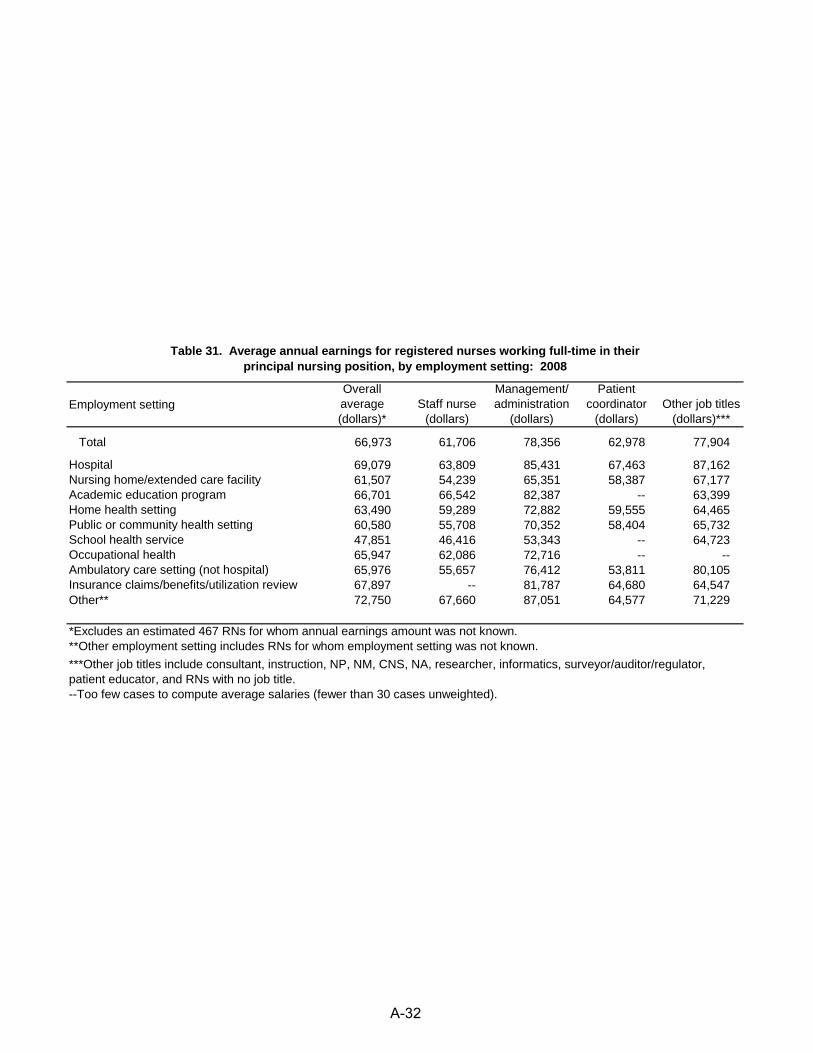
Table 31. Average annual earnings for registered nurses working full-time in their principal nursing position, by employment setting: 2008
Employment settingOverall average (dollars)*
Staff nurse (dollars)
Management/ administration
(dollars)
Patient coordinator
(dollars)Other job titles
(dollars)***
Total 66,973 61,706 78,356 62,978 77,904
Hospital 69,079 63,809 85,431 67,463 87,162Nursing home/extended care facility 61,507 54,239 65,351 58,387 67,177Academic education program 66,701 66,542 82,387 -- 63,399Home health setting 63,490 59,289 72,882 59,555 64,465Public or community health setting 60,580 55,708 70,352 58,404 65,732School health service 47,851 46,416 53,343 -- 64,723Occupational health 65,947 62,086 72,716 -- --Ambulatory care setting (not hospital) 65,976 55,657 76,412 53,811 80,105Insurance claims/benefits/utilization review 67,897 -- 81,787 64,680 64,547Other** 72,750 67,660 87,051 64,577 71,229
*Excludes an estimated 467 RNs for whom annual earnings amount was not known.**Other employment setting includes RNs for whom employment setting was not known.
--Too few cases to compute average salaries (fewer than 30 cases unweighted).
***Other job titles include consultant, instruction, NP, NM, CNS, NA, researcher, informatics, surveyor/auditor/regulator, patient educator, and RNs with no job title.
A-32
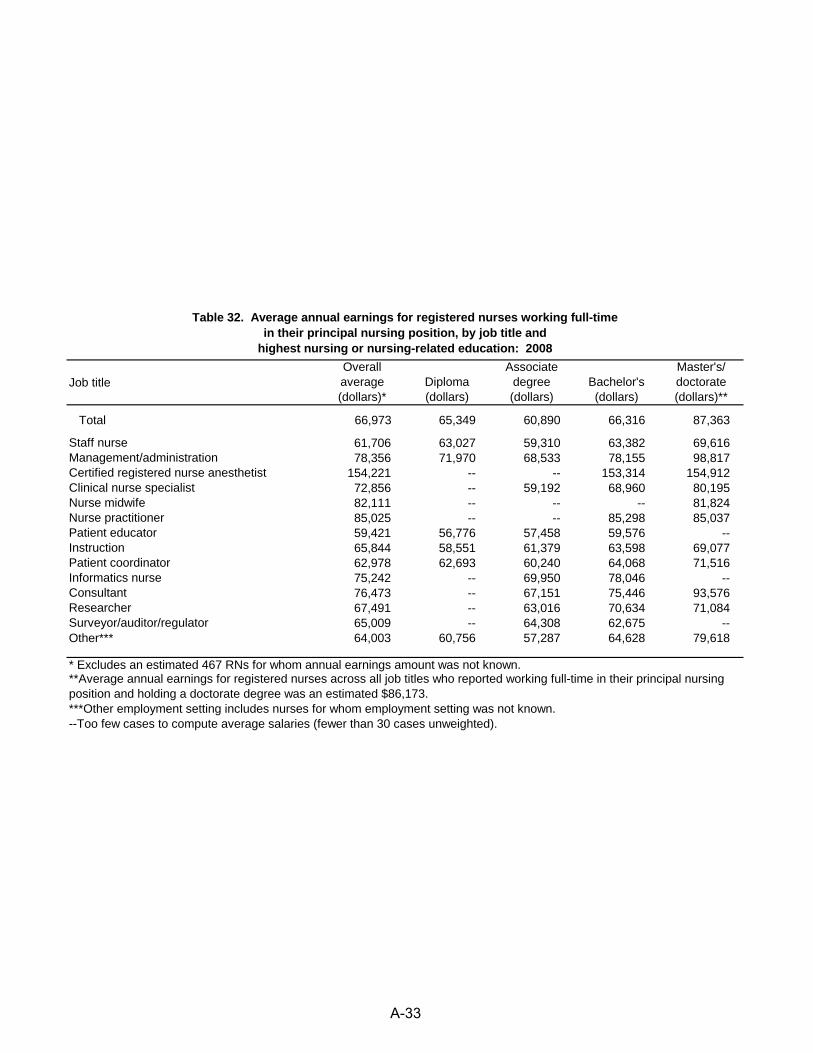
Table 32. Average annual earnings for registered nurses working full-time in their principal nursing position, by job title and
highest nursing or nursing-related education: 2008
Job titleOverall average (dollars)*
Diploma (dollars)
Associate degree (dollars)
Bachelor's (dollars)
Master's/ doctorate (dollars)**
Total 66,973 65,349 60,890 66,316 87,363
Staff nurse 61,706 63,027 59,310 63,382 69,616Management/administration 78,356 71,970 68,533 78,155 98,817Certified registered nurse anesthetist 154,221 -- -- 153,314 154,912Clinical nurse specialist 72,856 -- 59,192 68,960 80,195Nurse midwife 82,111 -- -- -- 81,824Nurse practitioner 85,025 -- -- 85,298 85,037Patient educator 59,421 56,776 57,458 59,576 --Instruction 65,844 58,551 61,379 63,598 69,077Patient coordinator 62,978 62,693 60,240 64,068 71,516Informatics nurse 75,242 -- 69,950 78,046 --Consultant 76,473 -- 67,151 75,446 93,576Researcher 67,491 -- 63,016 70,634 71,084Surveyor/auditor/regulator 65,009 -- 64,308 62,675 --Other*** 64,003 60,756 57,287 64,628 79,618
* Excludes an estimated 467 RNs for whom annual earnings amount was not known.**Average annual earnings for registered nurses across all job titles who reported working full-time in their principal nursing position and holding a doctorate degree was an estimated $86,173. ***Other employment setting includes nurses for whom employment setting was not known.--Too few cases to compute average salaries (fewer than 30 cases unweighted).
A-33
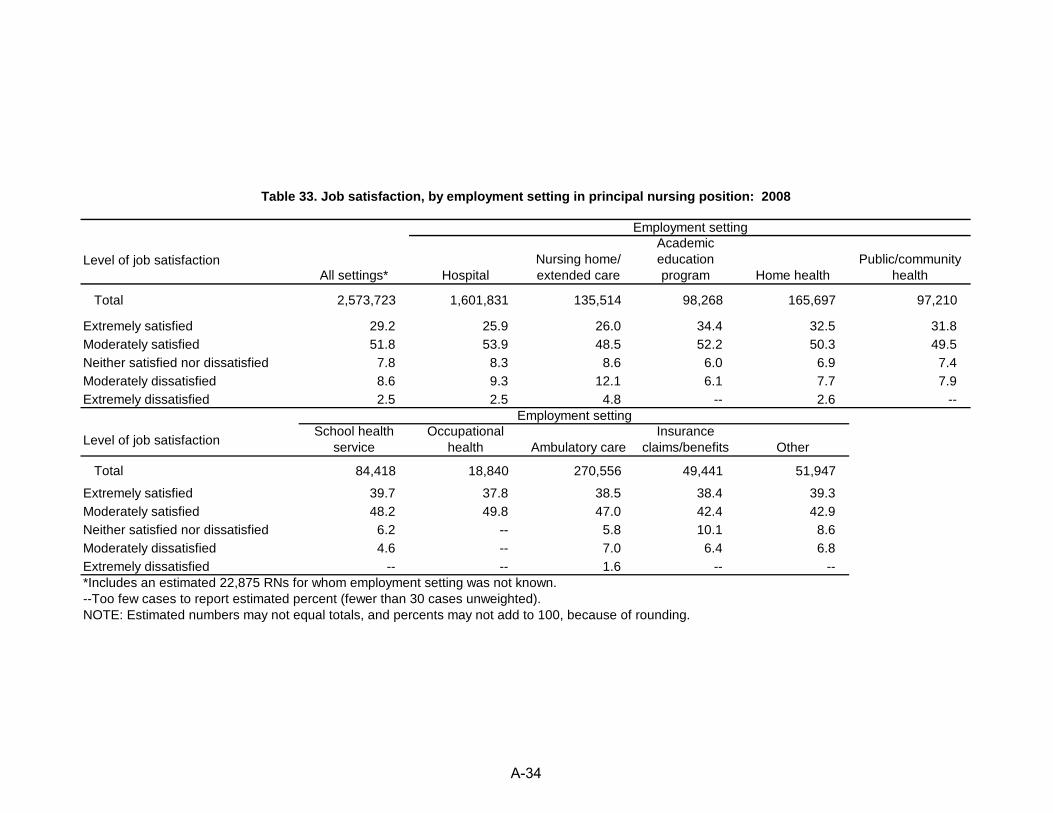
Table 33. Job satisfaction, by employment setting in principal nursing position: 2008
Level of job satisfaction
Employment setting
All settings* HospitalNursing home/ extended care
Academic education program Home health
Public/community health
Total 2,573,723 1,601,831 135,514 98,268 165,697 97,210
Extremely satisfied 29.2 25.9 26.0 34.4 32.5 31.8Moderately satisfied 51.8 53.9 48.5 52.2 50.3 49.5Neither satisfied nor dissatisfied 7.8 8.3 8.6 6.0 6.9 7.4Moderately dissatisfied 8.6 9.3 12.1 6.1 7.7 7.9Extremely dissatisfied 2.5 2.5 4.8 -- 2.6 --
Level of job satisfaction
Employment settingSchool health
serviceOccupational
health Ambulatory careInsurance
claims/benefits Other
Total 84,418 18,840 270,556 49,441 51,947 Extremely satisfied 39.7 37.8 38.5 38.4 39.3 Moderately satisfied 48.2 49.8 47.0 42.4 42.9 Neither satisfied nor dissatisfied 6.2 -- 5.8 10.1 8.6 Moderately dissatisfied 4.6 -- 7.0 6.4 6.8 Extremely dissatisfied -- -- 1.6 -- --*Includes an estimated 22,875 RNs for whom employment setting was not known.--Too few cases to report estimated percent (fewer than 30 cases unweighted).NOTE: Estimated numbers may not equal totals, and percents may not add to 100, because of rounding.
A-34
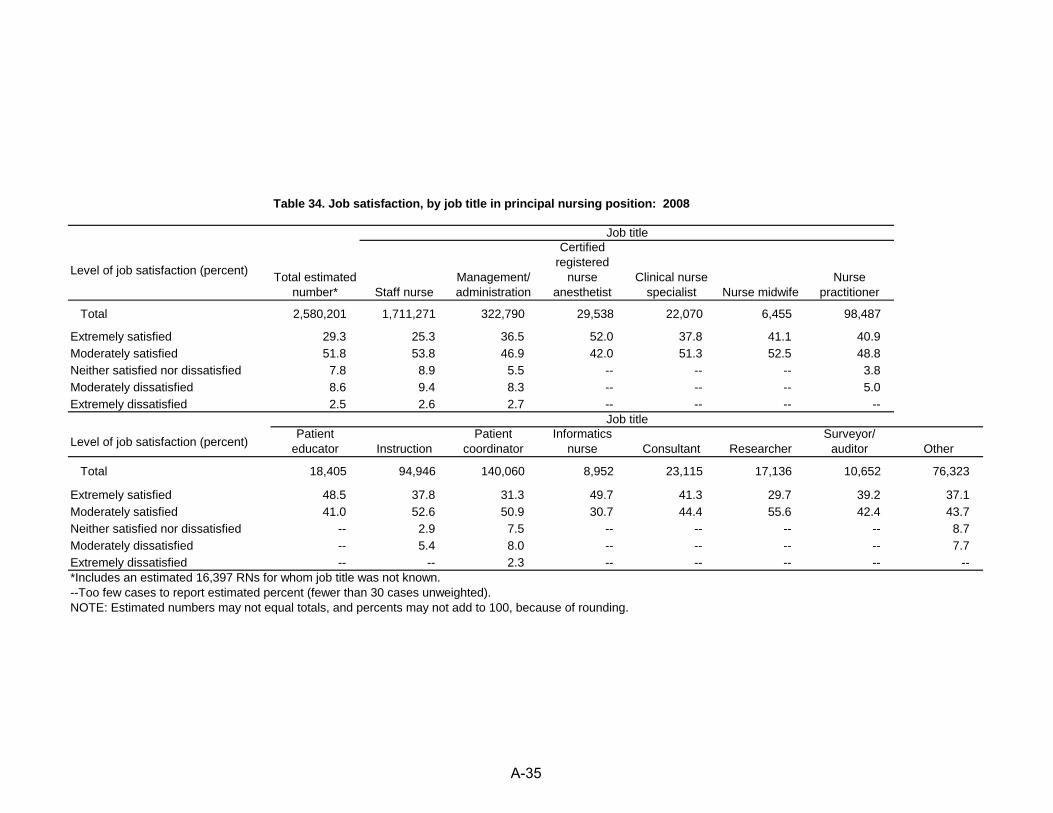
Table 34. Job satisfaction, by job title in principal nursing position: 2008
Level of job satisfaction (percent)
Job title
Total estimated number* Staff nurse
Management/administration
Certified registered
nurse anesthetist
Clinical nurse specialist Nurse midwife
Nurse practitioner
Total 2,580,201 1,711,271 322,790 29,538 22,070 6,455 98,487
Extremely satisfied 29.3 25.3 36.5 52.0 37.8 41.1 40.9 Moderately satisfied 51.8 53.8 46.9 42.0 51.3 52.5 48.8 Neither satisfied nor dissatisfied 7.8 8.9 5.5 -- -- -- 3.8 Moderately dissatisfied 8.6 9.4 8.3 -- -- -- 5.0 Extremely dissatisfied 2.5 2.6 2.7 -- -- -- --
Level of job satisfaction (percent)
Job titlePatient
educator InstructionPatient
coordinatorInformatics
nurse Consultant ResearcherSurveyor/
auditor Other
Total 18,405 94,946 140,060 8,952 23,115 17,136 10,652 76,323
Extremely satisfied 48.5 37.8 31.3 49.7 41.3 29.7 39.2 37.1Moderately satisfied 41.0 52.6 50.9 30.7 44.4 55.6 42.4 43.7Neither satisfied nor dissatisfied -- 2.9 7.5 -- -- -- -- 8.7Moderately dissatisfied -- 5.4 8.0 -- -- -- -- 7.7Extremely dissatisfied -- -- 2.3 -- -- -- -- --*Includes an estimated 16,397 RNs for whom job title was not known.--Too few cases to report estimated percent (fewer than 30 cases unweighted).NOTE: Estimated numbers may not equal totals, and percents may not add to 100, because of rounding.
A-35
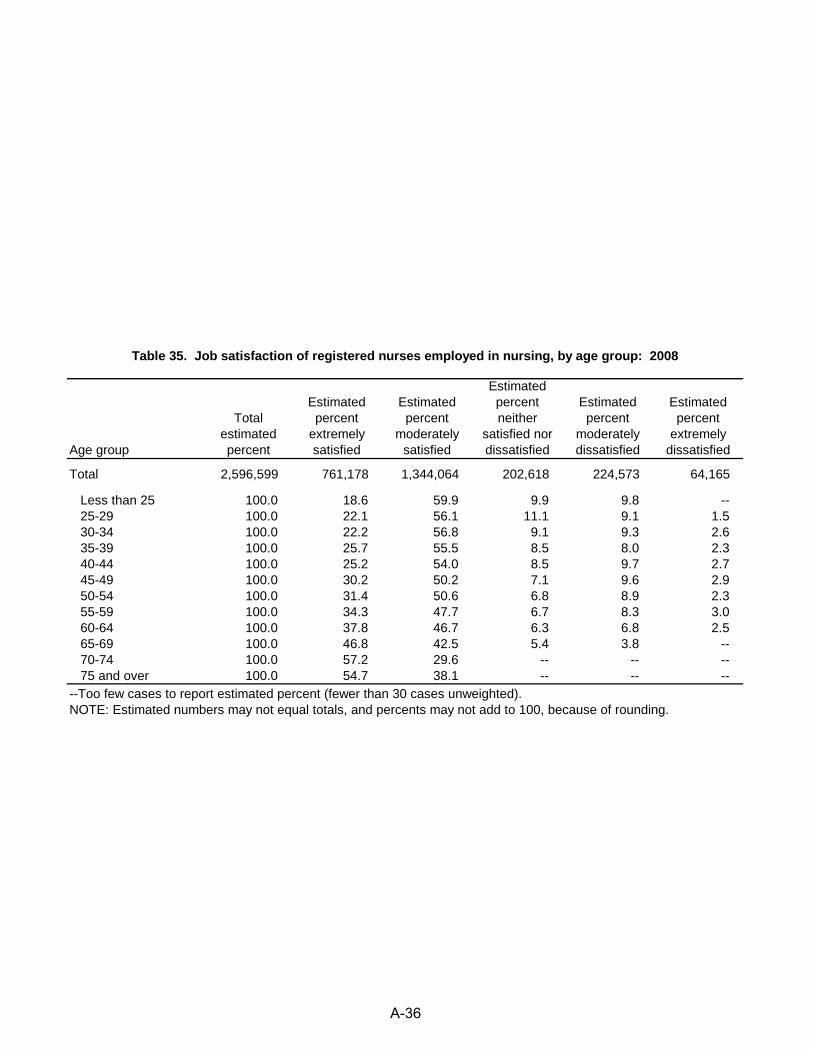
Table 35. Job satisfaction of registered nurses employed in nursing, by age group: 2008
Age group
Total estimated percent
Estimated percent
extremely satisfied
Estimated percent
moderately satisfied
Estimated percent neither
satisfied nor dissatisfied
Estimated percent
moderately dissatisfied
Estimated percent
extremely dissatisfied
Total 2,596,599 761,178 1,344,064 202,618 224,573 64,165
Less than 25 100.0 18.6 59.9 9.9 9.8 -- 25-29 100.0 22.1 56.1 11.1 9.1 1.5 30-34 100.0 22.2 56.8 9.1 9.3 2.6 35-39 100.0 25.7 55.5 8.5 8.0 2.3 40-44 100.0 25.2 54.0 8.5 9.7 2.7 45-49 100.0 30.2 50.2 7.1 9.6 2.9 50-54 100.0 31.4 50.6 6.8 8.9 2.3 55-59 100.0 34.3 47.7 6.7 8.3 3.0 60-64 100.0 37.8 46.7 6.3 6.8 2.5
65-69 100.0 46.8 42.5 5.4 3.8 --70-74 100.0 57.2 29.6 -- -- --
75 and over 100.0 54.7 38.1 -- -- ----Too few cases to report estimated percent (fewer than 30 cases unweighted).NOTE: Estimated numbers may not equal totals, and percents may not add to 100, because of rounding.
A-36
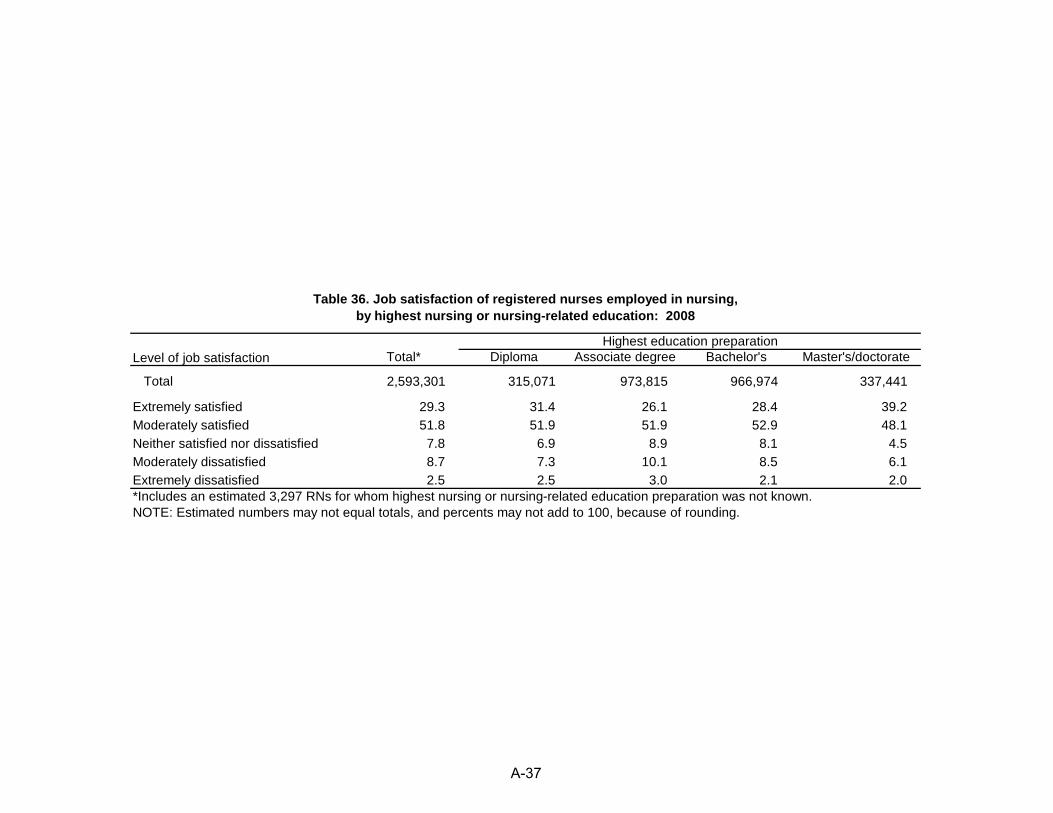
Table 36. Job satisfaction of registered nurses employed in nursing, by highest nursing or nursing-related education: 2008
Level of job satisfaction Highest education preparation
Total* Diploma Associate degree Bachelor's Master's/doctorate
Total 2,593,301 315,071 973,815 966,974 337,441
Extremely satisfied 29.3 31.4 26.1 28.4 39.2Moderately satisfied 51.8 51.9 51.9 52.9 48.1Neither satisfied nor dissatisfied 7.8 6.9 8.9 8.1 4.5Moderately dissatisfied 8.7 7.3 10.1 8.5 6.1Extremely dissatisfied 2.5 2.5 3.0 2.1 2.0*Includes an estimated 3,297 RNs for whom highest nursing or nursing-related education preparation was not known.NOTE: Estimated numbers may not equal totals, and percents may not add to 100, because of rounding.
A-37
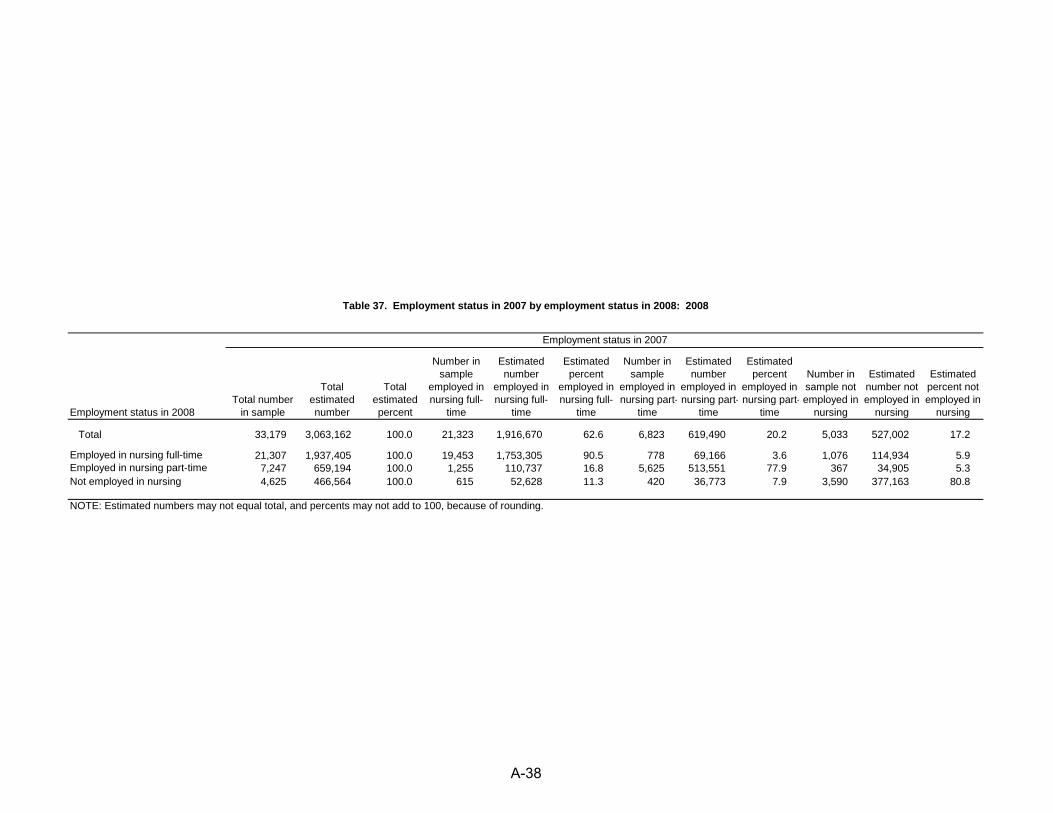
Table 37. Employment status in 2007 by employment status in 2008: 2008
Employment status in 2008
Employment status in 2007
Total number in sample
Total estimated number
Total estimated percent
Number in sample
employed in nursing full-
time
Estimated number
employed in nursing full-
time
Estimated percent
employed in nursing full-
time
Number in sample
employed in nursing part-
time
Estimated number
employed in nursing part-
time
Estimated percent
employed in nursing part-
time
Number in sample not employed in
nursing
Estimated number not employed in
nursing
Estimated percent not employed in
nursing
Total 33,179 3,063,162 100.0 21,323 1,916,670 62.6 6,823 619,490 20.2 5,033 527,002 17.2
Employed in nursing full-time 21,307 1,937,405 100.0 19,453 1,753,305 90.5 778 69,166 3.6 1,076 114,934 5.9Employed in nursing part-time 7,247 659,194 100.0 1,255 110,737 16.8 5,625 513,551 77.9 367 34,905 5.3Not employed in nursing 4,625 466,564 100.0 615 52,628 11.3 420 36,773 7.9 3,590 377,163 80.8
NOTE: Estimated numbers may not equal total, and percents may not add to 100, because of rounding.
A-38
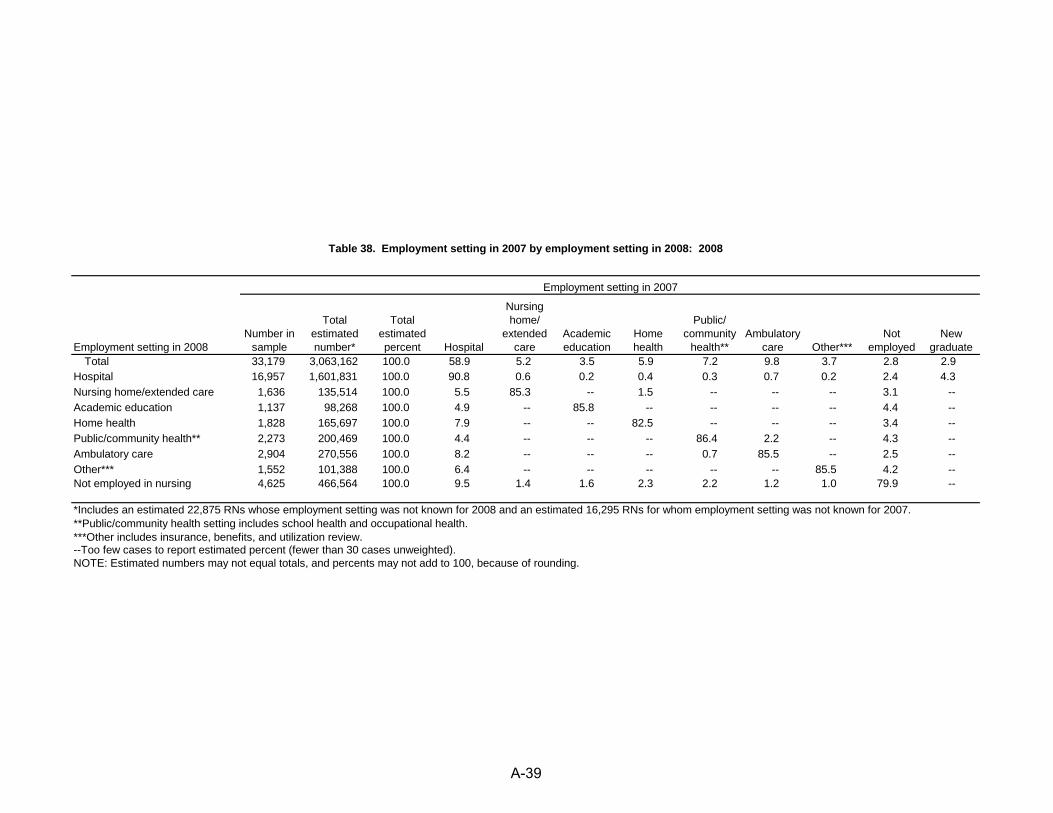
Table 38. Employment setting in 2007 by employment setting in 2008: 2008
Employment setting in 2008
Employment setting in 2007
Number in sample
Total estimated number*
Total estimated percent Hospital
Nursing home/
extended care
Academic education
Home health
Public/ community
health**Ambulatory
care Other***Not
employedNew
graduateTotal 33,179 3,063,162 100.0 58.9 5.2 3.5 5.9 7.2 9.8 3.7 2.8 2.9
Hospital 16,957 1,601,831 100.0 90.8 0.6 0.2 0.4 0.3 0.7 0.2 2.4 4.3Nursing home/extended care 1,636 135,514 100.0 5.5 85.3 -- 1.5 -- -- -- 3.1 --Academic education 1,137 98,268 100.0 4.9 -- 85.8 -- -- -- -- 4.4 --Home health 1,828 165,697 100.0 7.9 -- -- 82.5 -- -- -- 3.4 --Public/community health** 2,273 200,469 100.0 4.4 -- -- -- 86.4 2.2 -- 4.3 --Ambulatory care 2,904 270,556 100.0 8.2 -- -- -- 0.7 85.5 -- 2.5 --Other*** 1,552 101,388 100.0 6.4 -- -- -- -- -- 85.5 4.2 --Not employed in nursing 4,625 466,564 100.0 9.5 1.4 1.6 2.3 2.2 1.2 1.0 79.9 --
*Includes an estimated 22,875 RNs whose employment setting was not known for 2008 and an estimated 16,295 RNs for whom employment setting was not known for 2007.**Public/community health setting includes school health and occupational health.***Other includes insurance, benefits, and utilization review.--Too few cases to report estimated percent (fewer than 30 cases unweighted).NOTE: Estimated numbers may not equal totals, and percents may not add to 100, because of rounding.
A-39
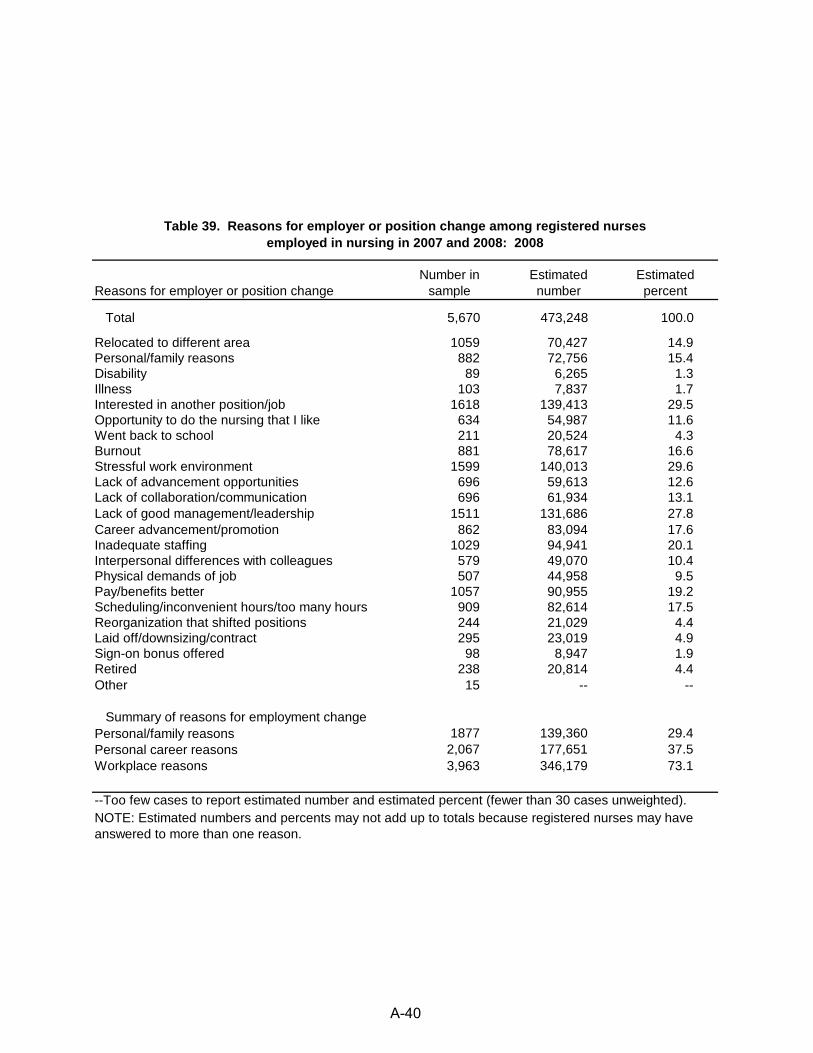
Table 39. Reasons for employer or position change among registered nurses employed in nursing in 2007 and 2008: 2008
Reasons for employer or position changeNumber in
sampleEstimated number
Estimated percent
Total 5,670 473,248 100.0
Relocated to different area 1059 70,427 14.9Personal/family reasons 882 72,756 15.4Disability 89 6,265 1.3Illness 103 7,837 1.7Interested in another position/job 1618 139,413 29.5Opportunity to do the nursing that I like 634 54,987 11.6Went back to school 211 20,524 4.3Burnout 881 78,617 16.6Stressful work environment 1599 140,013 29.6Lack of advancement opportunities 696 59,613 12.6Lack of collaboration/communication 696 61,934 13.1Lack of good management/leadership 1511 131,686 27.8Career advancement/promotion 862 83,094 17.6Inadequate staffing 1029 94,941 20.1Interpersonal differences with colleagues 579 49,070 10.4Physical demands of job 507 44,958 9.5Pay/benefits better 1057 90,955 19.2Scheduling/inconvenient hours/too many hours 909 82,614 17.5Reorganization that shifted positions 244 21,029 4.4Laid off/downsizing/contract 295 23,019 4.9Sign-on bonus offered 98 8,947 1.9Retired 238 20,814 4.4Other 15 -- --
Summary of reasons for employment change Personal/family reasons 1877 139,360 29.4Personal career reasons 2,067 177,651 37.5Workplace reasons 3,963 346,179 73.1
--Too few cases to report estimated number and estimated percent (fewer than 30 cases unweighted).NOTE: Estimated numbers and percents may not add up to totals because registered nurses may have answered to more than one reason.
A-40
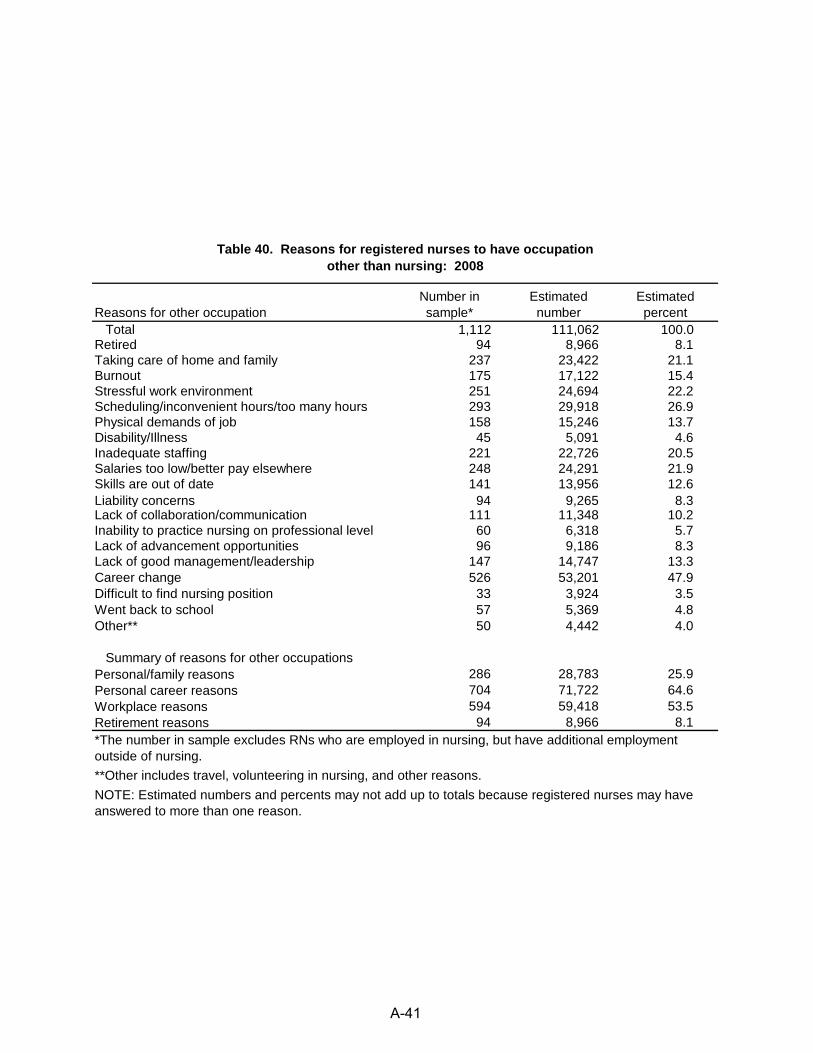
Table 40. Reasons for registered nurses to have occupation other than nursing: 2008
Reasons for other occupationNumber in sample*
Estimated number
Estimated percent
Total 1,112 111,062 100.0Retired 94 8,966 8.1Taking care of home and family 237 23,422 21.1Burnout 175 17,122 15.4Stressful work environment 251 24,694 22.2Scheduling/inconvenient hours/too many hours 293 29,918 26.9Physical demands of job 158 15,246 13.7Disability/Illness 45 5,091 4.6Inadequate staffing 221 22,726 20.5Salaries too low/better pay elsewhere 248 24,291 21.9Skills are out of date 141 13,956 12.6Liability concerns 94 9,265 8.3Lack of collaboration/communication 111 11,348 10.2Inability to practice nursing on professional level 60 6,318 5.7Lack of advancement opportunities 96 9,186 8.3Lack of good management/leadership 147 14,747 13.3Career change 526 53,201 47.9Difficult to find nursing position 33 3,924 3.5Went back to school 57 5,369 4.8Other** 50 4,442 4.0
Summary of reasons for other occupationsPersonal/family reasons 286 28,783 25.9Personal career reasons 704 71,722 64.6Workplace reasons 594 59,418 53.5Retirement reasons 94 8,966 8.1*The number in sample excludes RNs who are employed in nursing, but have additional employment outside of nursing.**Other includes travel, volunteering in nursing, and other reasons.NOTE: Estimated numbers and percents may not add up to totals because registered nurses may have answered to more than one reason.
A-41
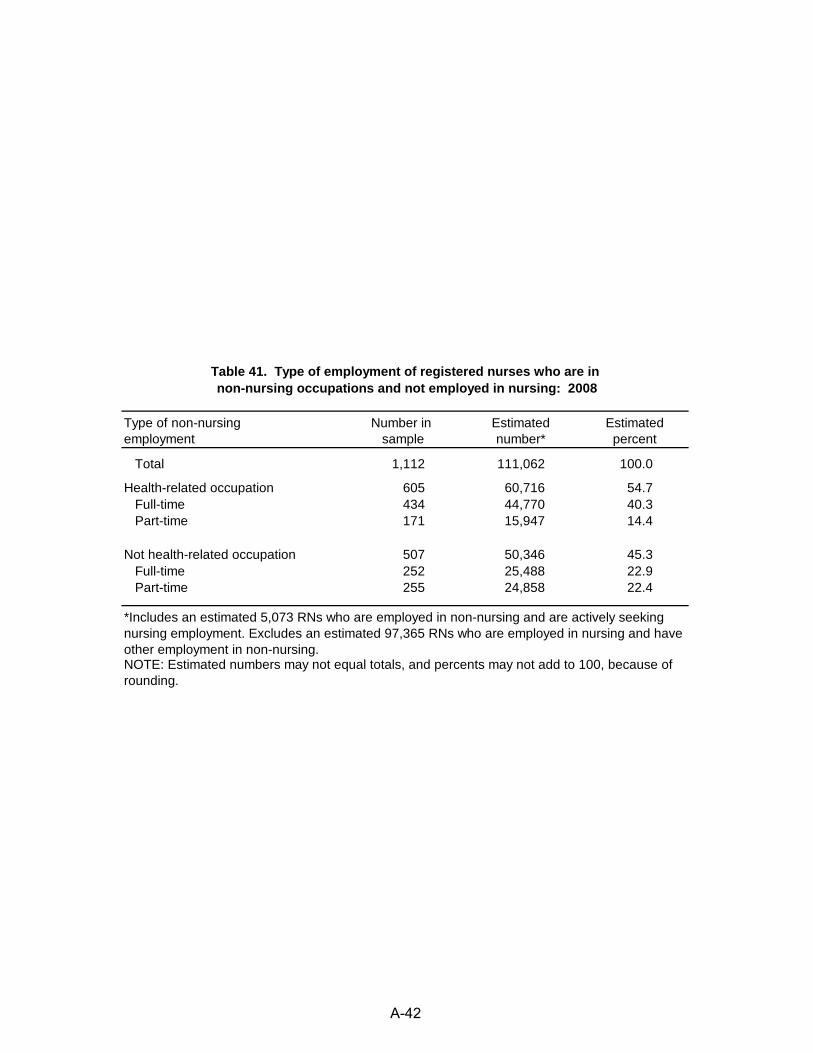
Table 41. Type of employment of registered nurses who are in non-nursing occupations and not employed in nursing: 2008
Type of non-nursing employment
Number in sample
Estimated number*
Estimated percent
Total 1,112 111,062 100.0
Health-related occupation 605 60,716 54.7Full-time 434 44,770 40.3Part-time 171 15,947 14.4
Not health-related occupation 507 50,346 45.3Full-time 252 25,488 22.9Part-time 255 24,858 22.4
*Includes an estimated 5,073 RNs who are employed in non-nursing and are actively seeking nursing employment. Excludes an estimated 97,365 RNs who are employed in nursing and have other employment in non-nursing. NOTE: Estimated numbers may not equal totals, and percents may not add to 100, because of rounding.
A-42
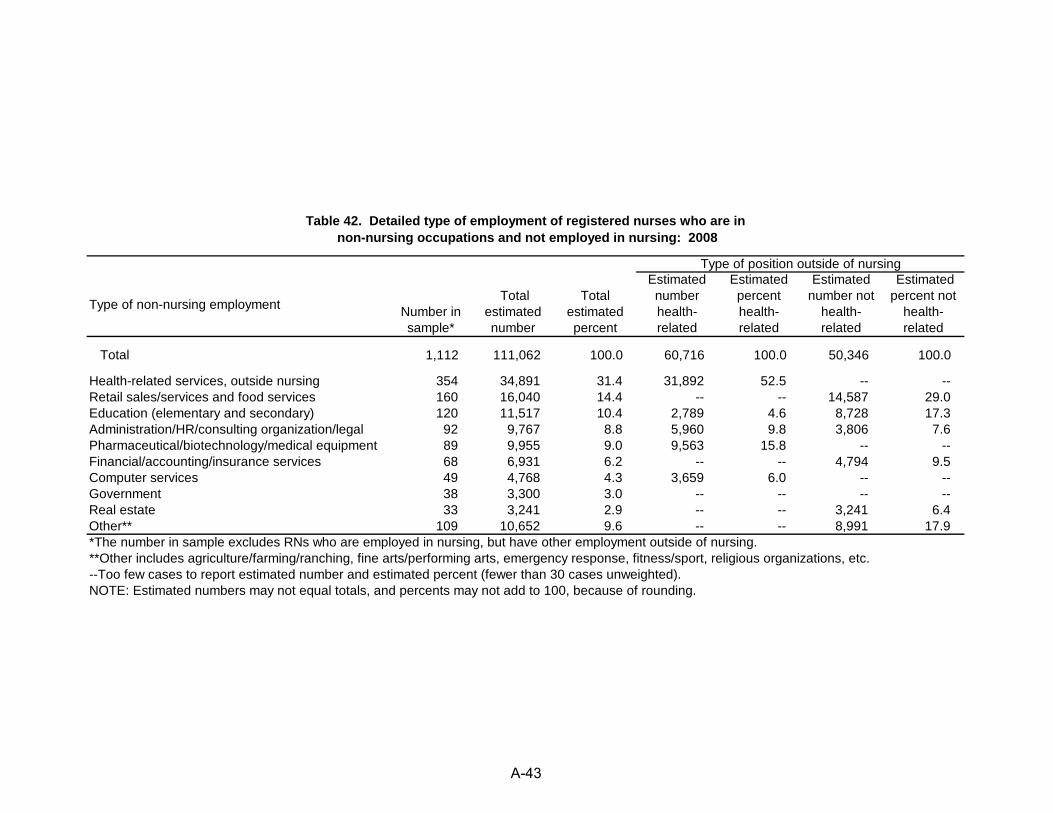
Table 42. Detailed type of employment of registered nurses who are in non-nursing occupations and not employed in nursing: 2008
Type of non-nursing employment
Type of position outside of nursing
Number in sample*
Total estimated number
Total estimated percent
Estimated number health-related
Estimated percent health-related
Estimated number not
health-related
Estimated percent not
health-related
Total 1,112 111,062 100.0 60,716 100.0 50,346 100.0
Health-related services, outside nursing 354 34,891 31.4 31,892 52.5 -- --Retail sales/services and food services 160 16,040 14.4 -- -- 14,587 29.0Education (elementary and secondary) 120 11,517 10.4 2,789 4.6 8,728 17.3Administration/HR/consulting organization/legal 92 9,767 8.8 5,960 9.8 3,806 7.6Pharmaceutical/biotechnology/medical equipment 89 9,955 9.0 9,563 15.8 -- --Financial/accounting/insurance services 68 6,931 6.2 -- -- 4,794 9.5Computer services 49 4,768 4.3 3,659 6.0 -- --Government 38 3,300 3.0 -- -- -- --Real estate 33 3,241 2.9 -- -- 3,241 6.4Other** 109 10,652 9.6 -- -- 8,991 17.9*The number in sample excludes RNs who are employed in nursing, but have other employment outside of nursing.**Other includes agriculture/farming/ranching, fine arts/performing arts, emergency response, fitness/sport, religious organizations, etc.--Too few cases to report estimated number and estimated percent (fewer than 30 cases unweighted).NOTE: Estimated numbers may not equal totals, and percents may not add to 100, because of rounding.
A-43
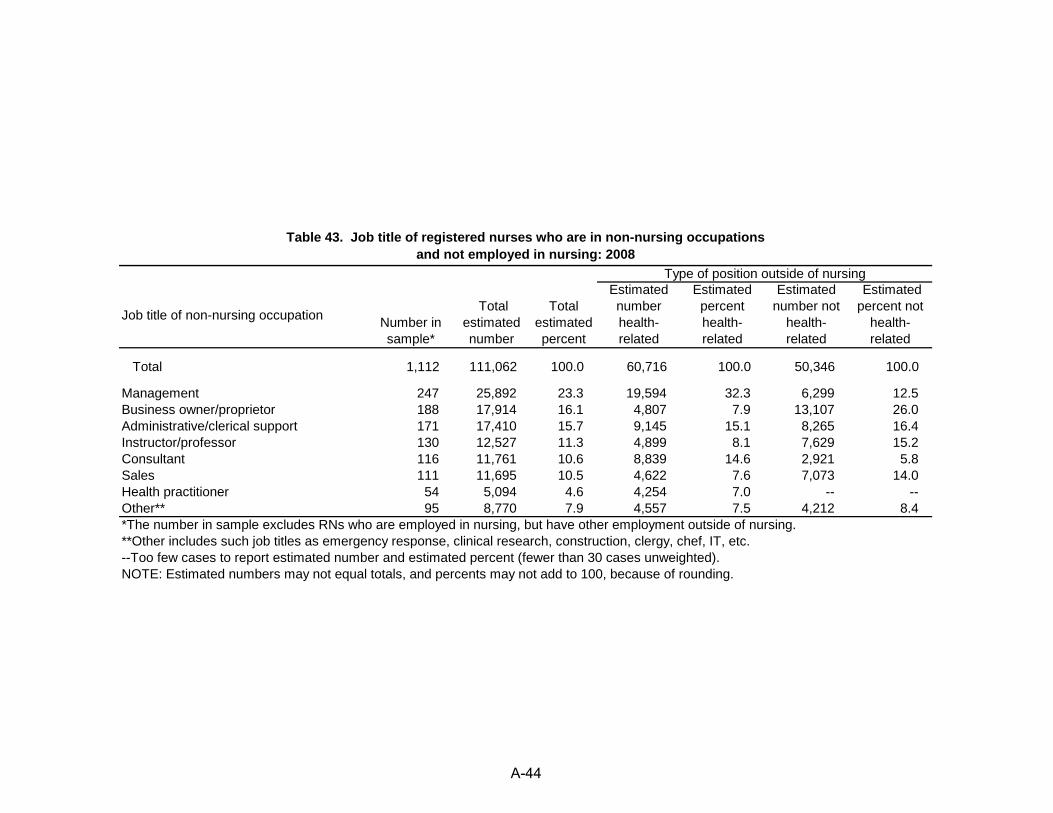
Table 43. Job title of registered nurses who are in non-nursing occupations and not employed in nursing: 2008
Job title of non-nursing occupation Number in sample*
Total estimated number
Total estimated percent
Estimated number health-related
Estimated percent health-related
Estimated number not
health-related
Estimated percent not
health-related
Total 1,112 111,062 100.0 60,716 100.0 50,346 100.0
Management 247 25,892 23.3 19,594 32.3 6,299 12.5Business owner/proprietor 188 17,914 16.1 4,807 7.9 13,107 26.0Administrative/clerical support 171 17,410 15.7 9,145 15.1 8,265 16.4Instructor/professor 130 12,527 11.3 4,899 8.1 7,629 15.2Consultant 116 11,761 10.6 8,839 14.6 2,921 5.8Sales 111 11,695 10.5 4,622 7.6 7,073 14.0Health practitioner 54 5,094 4.6 4,254 7.0 -- --Other** 95 8,770 7.9 4,557 7.5 4,212 8.4
Type of position outside of nursing
*The number in sample excludes RNs who are employed in nursing, but have other employment outside of nursing.**Other includes such job titles as emergency response, clinical research, construction, clergy, chef, IT, etc.--Too few cases to report estimated number and estimated percent (fewer than 30 cases unweighted).NOTE: Estimated numbers may not equal totals, and percents may not add to 100, because of rounding.
A-44
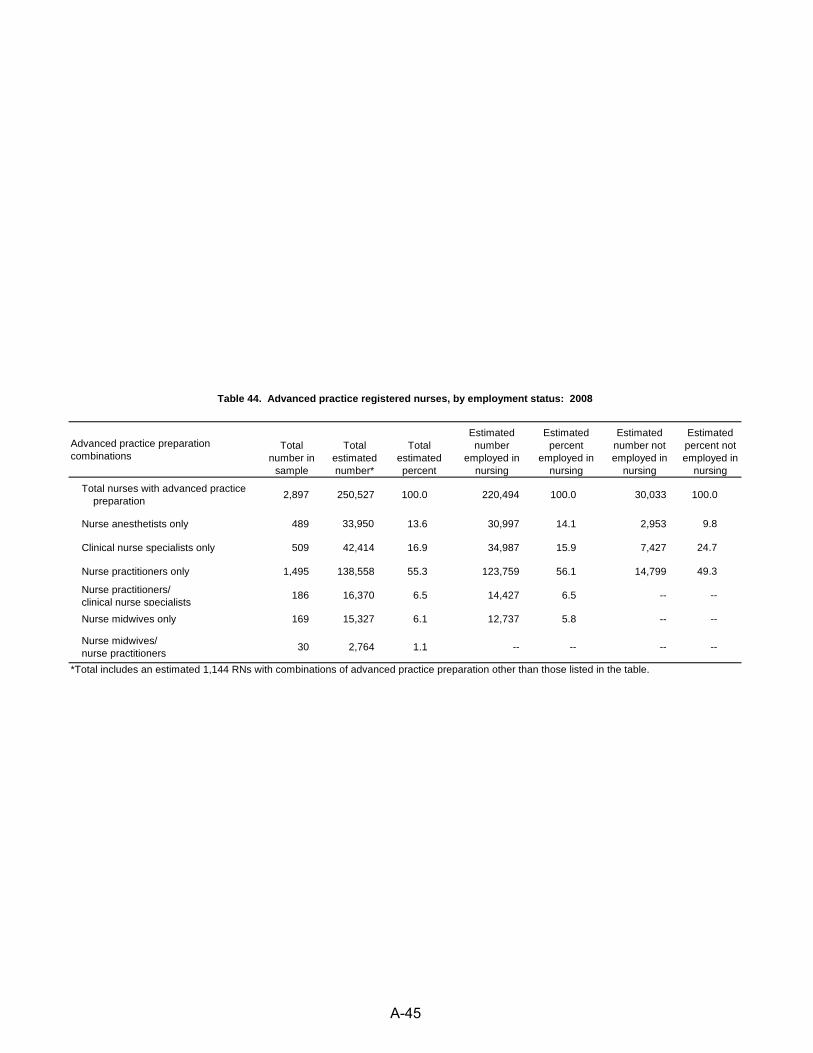
Table 44. Advanced practice registered nurses, by employment status: 2008
Advanced practice preparation combinations
Total number in
sample
Total estimated number*
Total estimated percent
Estimated number
employed in nursing
Estimated percent
employed in nursing
Estimated number not employed in
nursing
Estimated percent not employed in
nursing
Total nurses with advanced practice preparation 2,897 250,527 100.0 220,494 100.0 30,033 100.0
Nurse anesthetists only 489 33,950 13.6 30,997 14.1 2,953 9.8
Clinical nurse specialists only 509 42,414 16.9 34,987 15.9 7,427 24.7
Nurse practitioners only 1,495 138,558 55.3 123,759 56.1 14,799 49.3
Nurse practitioners/clinical nurse specialists
186 16,370 6.5 14,427 6.5 -- --
Nurse midwives only 169 15,327 6.1 12,737 5.8 -- --
Nurse midwives/nurse practitioners 30 2,764 1.1 -- -- -- --
*Total includes an estimated 1,144 RNs with combinations of advanced practice preparation other than those listed in the table.
A-45
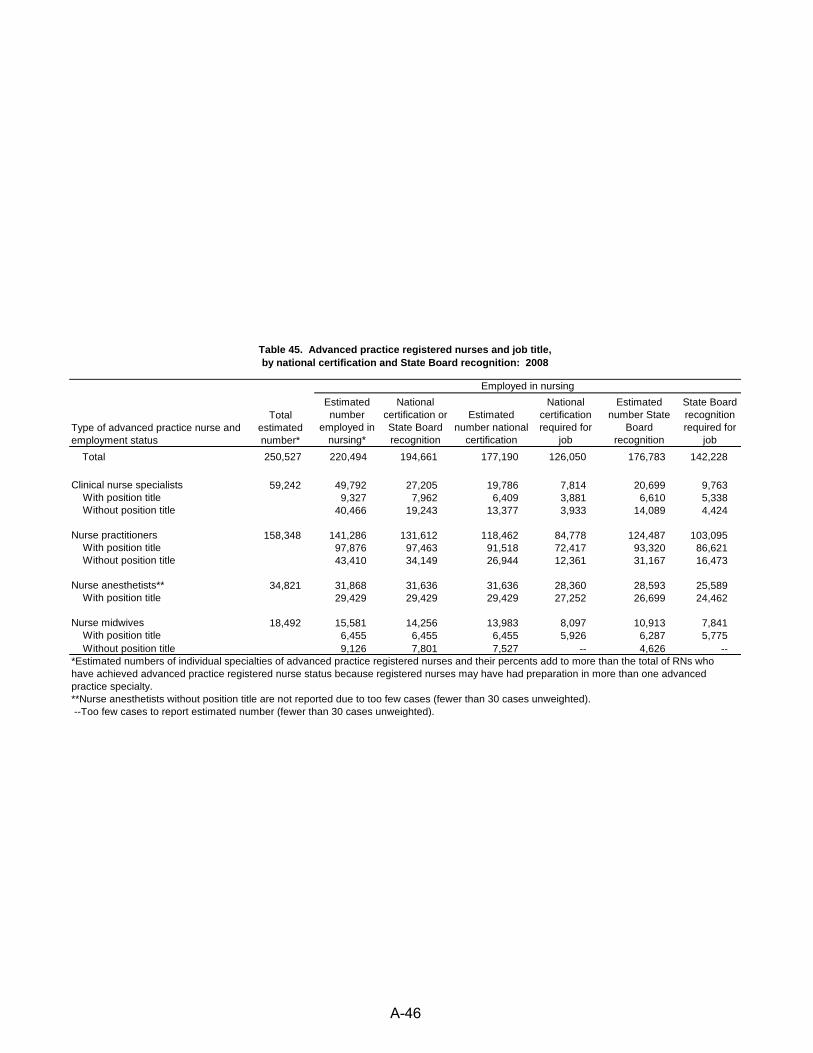
Table 45. Advanced practice registered nurses and job title, by national certification and State Board recognition: 2008
Type of advanced practice nurse and employment status
Employed in nursing
Total estimated number*
Estimated number
employed in nursing*
National certification or State Board recognition
Estimated number national
certification
National certification required for
job
Estimated number State
Board recognition
State Board recognition required for
jobTotal 250,527 220,494 194,661 177,190 126,050 176,783 142,228
Clinical nurse specialists 59,242 49,792 27,205 19,786 7,814 20,699 9,763 With position title 9,327 7,962 6,409 3,881 6,610 5,338 Without position title 40,466 19,243 13,377 3,933 14,089 4,424
Nurse practitioners 158,348 141,286 131,612 118,462 84,778 124,487 103,095 With position title 97,876 97,463 91,518 72,417 93,320 86,621 Without position title 43,410 34,149 26,944 12,361 31,167 16,473
Nurse anesthetists** 34,821 31,868 31,636 31,636 28,360 28,593 25,589 With position title 29,429 29,429 29,429 27,252 26,699 24,462
Nurse midwives 18,492 15,581 14,256 13,983 8,097 10,913 7,841 With position title 6,455 6,455 6,455 5,926 6,287 5,775 Without position title 9,126 7,801 7,527 -- 4,626 --*Estimated numbers of individual specialties of advanced practice registered nurses and their percents add to more than the total of RNs who have achieved advanced practice registered nurse status because registered nurses may have had preparation in more than one advanced practice specialty. **Nurse anesthetists without position title are not reported due to too few cases (fewer than 30 cases unweighted). --Too few cases to report estimated number (fewer than 30 cases unweighted).
A-46
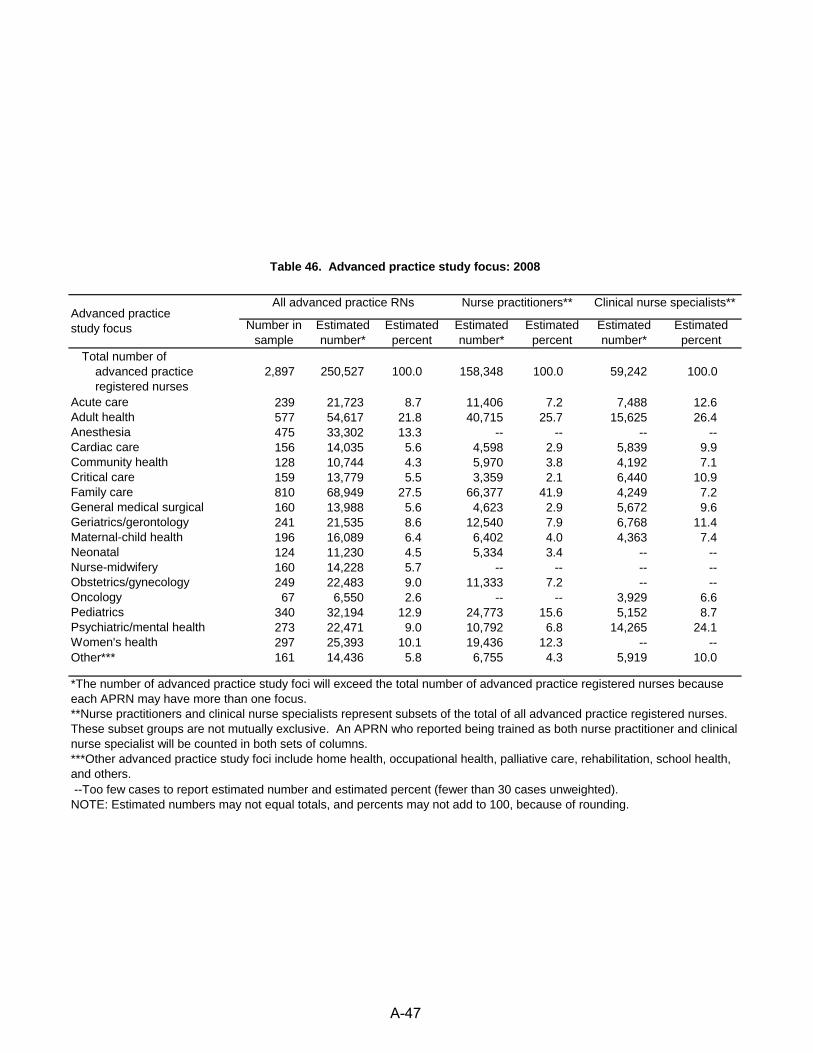
Table 46. Advanced practice study focus: 2008
Advanced practice study focus
All advanced practice RNs Nurse practitioners** Clinical nurse specialists**
Number in sample
Estimated number*
Estimated percent
Estimated number*
Estimated percent
Estimated number*
Estimated percent
Total number of advanced practice registered nurses
2,897 250,527 100.0 158,348 100.0 59,242 100.0
Acute care 239 21,723 8.7 11,406 7.2 7,488 12.6Adult health 577 54,617 21.8 40,715 25.7 15,625 26.4Anesthesia 475 33,302 13.3 -- -- -- --Cardiac care 156 14,035 5.6 4,598 2.9 5,839 9.9Community health 128 10,744 4.3 5,970 3.8 4,192 7.1Critical care 159 13,779 5.5 3,359 2.1 6,440 10.9Family care 810 68,949 27.5 66,377 41.9 4,249 7.2General medical surgical 160 13,988 5.6 4,623 2.9 5,672 9.6Geriatrics/gerontology 241 21,535 8.6 12,540 7.9 6,768 11.4Maternal-child health 196 16,089 6.4 6,402 4.0 4,363 7.4Neonatal 124 11,230 4.5 5,334 3.4 -- --Nurse-midwifery 160 14,228 5.7 -- -- -- --Obstetrics/gynecology 249 22,483 9.0 11,333 7.2 -- --Oncology 67 6,550 2.6 -- -- 3,929 6.6Pediatrics 340 32,194 12.9 24,773 15.6 5,152 8.7Psychiatric/mental health 273 22,471 9.0 10,792 6.8 14,265 24.1Women's health 297 25,393 10.1 19,436 12.3 -- --Other*** 161 14,436 5.8 6,755 4.3 5,919 10.0
--Too few cases to report estimated number and estimated percent (fewer than 30 cases unweighted).NOTE: Estimated numbers may not equal totals, and percents may not add to 100, because of rounding.
*The number of advanced practice study foci will exceed the total number of advanced practice registered nurses because each APRN may have more than one focus. **Nurse practitioners and clinical nurse specialists represent subsets of the total of all advanced practice registered nurses. These subset groups are not mutually exclusive. An APRN who reported being trained as both nurse practitioner and clinical nurse specialist will be counted in both sets of columns.***Other advanced practice study foci include home health, occupational health, palliative care, rehabilitation, school health, and others.
A-47
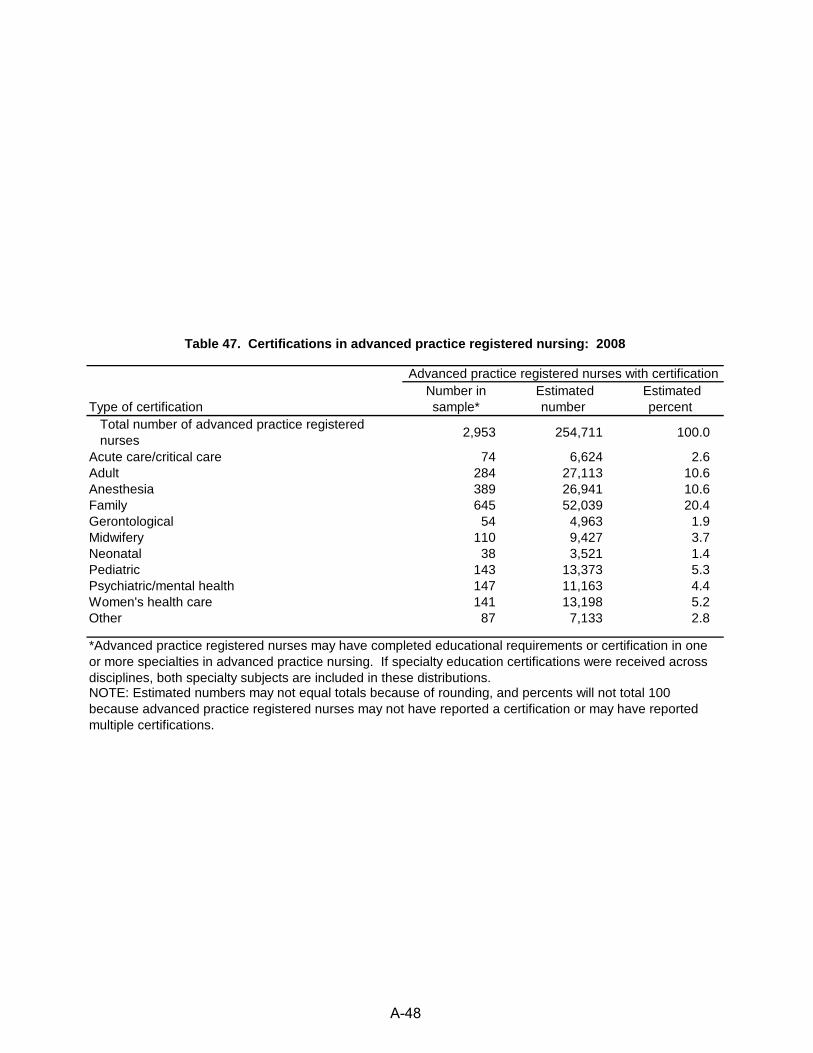
Table 47. Certifications in advanced practice registered nursing: 2008
Type of certification
Advanced practice registered nurses with certificationNumber in sample*
Estimated number
Estimated percent
Total number of advanced practice registered nurses 2,953 254,711 100.0
Acute care/critical care 74 6,624 2.6Adult 284 27,113 10.6Anesthesia 389 26,941 10.6Family 645 52,039 20.4Gerontological 54 4,963 1.9Midwifery 110 9,427 3.7Neonatal 38 3,521 1.4Pediatric 143 13,373 5.3Psychiatric/mental health 147 11,163 4.4Women's health care 141 13,198 5.2Other 87 7,133 2.8
*Advanced practice registered nurses may have completed educational requirements or certification in one or more specialties in advanced practice nursing. If specialty education certifications were received across disciplines, both specialty subjects are included in these distributions.NOTE: Estimated numbers may not equal totals because of rounding, and percents will not total 100 because advanced practice registered nurses may not have reported a certification or may have reported multiple certifications.
A-48
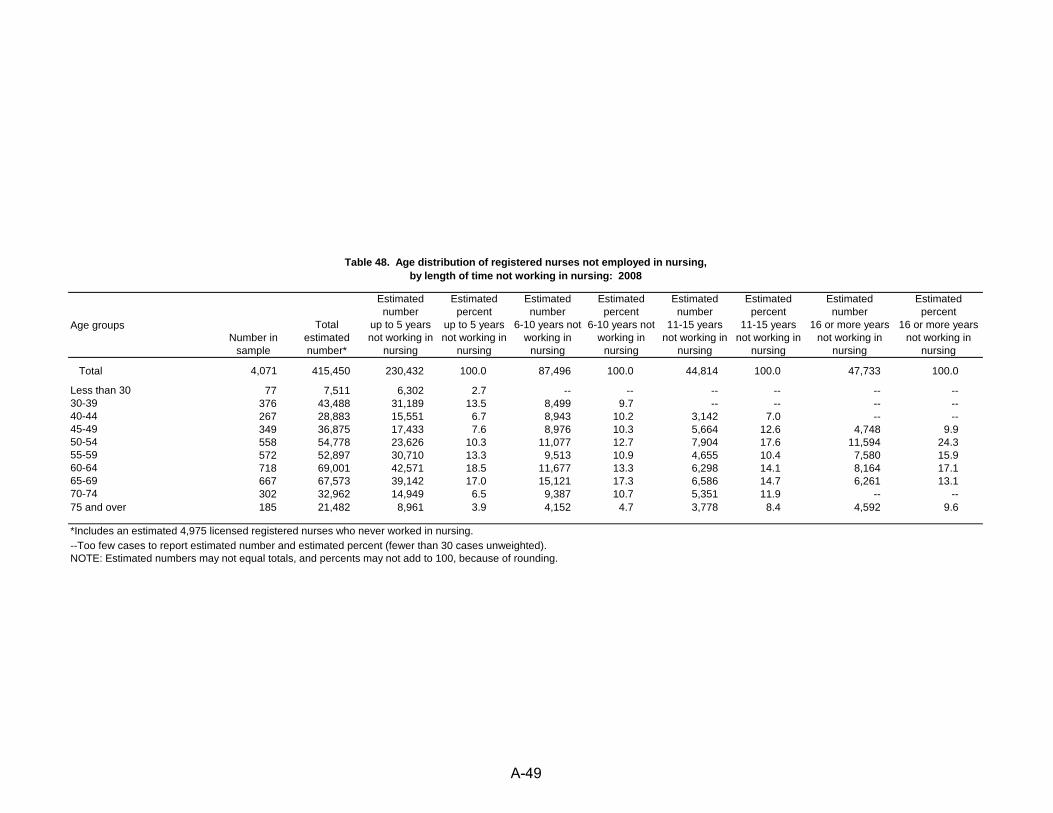
Table 48. Age distribution of registered nurses not employed in nursing,by length of time not working in nursing: 2008
Age groupsNumber in
sample
Total estimated number*
Estimated number
up to 5 years not working in
nursing
Estimated percent
up to 5 years not working in
nursing
Estimated number
6-10 years not working in
nursing
Estimated percent
6-10 years not working in
nursing
Estimated number
11-15 years not working in
nursing
Estimated percent
11-15 years not working in
nursing
Estimated number
16 or more years not working in
nursing
Estimated percent
16 or more years not working in
nursing
Total 4,071 415,450 230,432 100.0 87,496 100.0 44,814 100.0 47,733 100.0
Less than 30 77 7,511 6,302 2.7 -- -- -- -- -- --30-39 376 43,488 31,189 13.5 8,499 9.7 -- -- -- --40-44 267 28,883 15,551 6.7 8,943 10.2 3,142 7.0 -- --45-49 349 36,875 17,433 7.6 8,976 10.3 5,664 12.6 4,748 9.950-54 558 54,778 23,626 10.3 11,077 12.7 7,904 17.6 11,594 24.355-59 572 52,897 30,710 13.3 9,513 10.9 4,655 10.4 7,580 15.960-64 718 69,001 42,571 18.5 11,677 13.3 6,298 14.1 8,164 17.165-69 667 67,573 39,142 17.0 15,121 17.3 6,586 14.7 6,261 13.170-74 302 32,962 14,949 6.5 9,387 10.7 5,351 11.9 -- --75 and over 185 21,482 8,961 3.9 4,152 4.7 3,778 8.4 4,592 9.6
*Includes an estimated 4,975 licensed registered nurses who never worked in nursing.--Too few cases to report estimated number and estimated percent (fewer than 30 cases unweighted).NOTE: Estimated numbers may not equal totals, and percents may not add to 100, because of rounding.
A-49
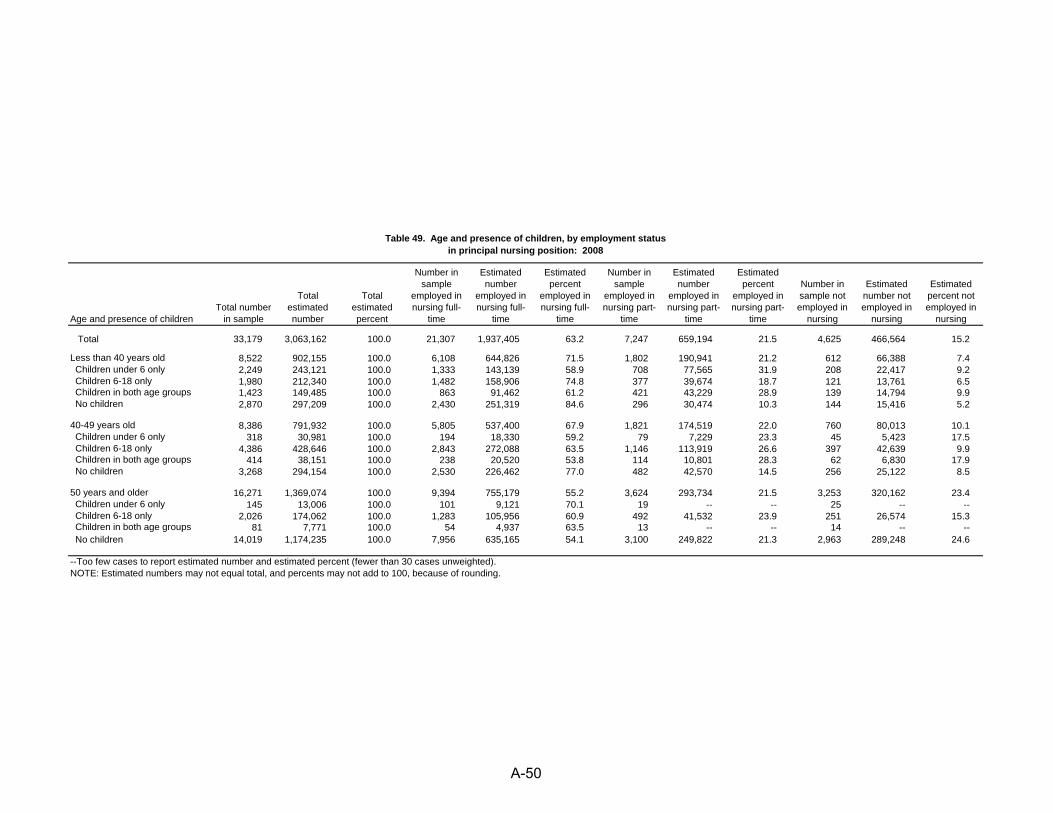
Table 49. Age and presence of children, by employment status in principal nursing position: 2008
Age and presence of childrenTotal number
in sample
Total estimated number
Total estimated percent
Number in sample
employed in nursing full-
time
Estimated number
employed in nursing full-
time
Estimated percent
employed in nursing full-
time
Number in sample
employed in nursing part-
time
Estimated number
employed in nursing part-
time
Estimated percent
employed in nursing part-
time
Number in sample not employed in
nursing
Estimated number not employed in
nursing
Estimated percent not employed in
nursing
Total 33,179 3,063,162 100.0 21,307 1,937,405 63.2 7,247 659,194 21.5 4,625 466,564 15.2
Less than 40 years old 8,522 902,155 100.0 6,108 644,826 71.5 1,802 190,941 21.2 612 66,388 7.4 Children under 6 only 2,249 243,121 100.0 1,333 143,139 58.9 708 77,565 31.9 208 22,417 9.2 Children 6-18 only 1,980 212,340 100.0 1,482 158,906 74.8 377 39,674 18.7 121 13,761 6.5 Children in both age groups 1,423 149,485 100.0 863 91,462 61.2 421 43,229 28.9 139 14,794 9.9 No children 2,870 297,209 100.0 2,430 251,319 84.6 296 30,474 10.3 144 15,416 5.2
40-49 years old 8,386 791,932 100.0 5,805 537,400 67.9 1,821 174,519 22.0 760 80,013 10.1 Children under 6 only 318 30,981 100.0 194 18,330 59.2 79 7,229 23.3 45 5,423 17.5 Children 6-18 only 4,386 428,646 100.0 2,843 272,088 63.5 1,146 113,919 26.6 397 42,639 9.9 Children in both age groups 414 38,151 100.0 238 20,520 53.8 114 10,801 28.3 62 6,830 17.9 No children 3,268 294,154 100.0 2,530 226,462 77.0 482 42,570 14.5 256 25,122 8.5
50 years and older 16,271 1,369,074 100.0 9,394 755,179 55.2 3,624 293,734 21.5 3,253 320,162 23.4 Children under 6 only 145 13,006 100.0 101 9,121 70.1 19 -- -- 25 -- -- Children 6-18 only 2,026 174,062 100.0 1,283 105,956 60.9 492 41,532 23.9 251 26,574 15.3 Children in both age groups 81 7,771 100.0 54 4,937 63.5 13 -- -- 14 -- -- No children 14,019 1,174,235 100.0 7,956 635,165 54.1 3,100 249,822 21.3 2,963 289,248 24.6
--Too few cases to report estimated number and estimated percent (fewer than 30 cases unweighted).NOTE: Estimated numbers may not equal total, and percents may not add to 100, because of rounding.
A-50
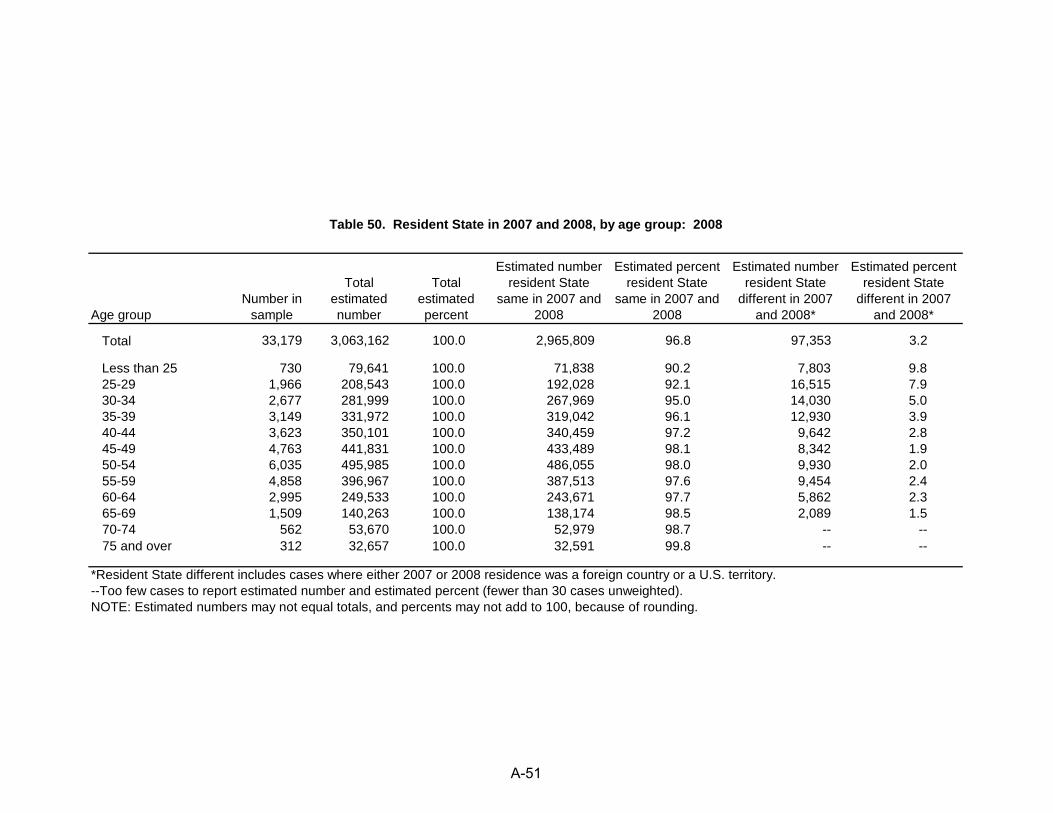
Table 50. Resident State in 2007 and 2008, by age group: 2008
Age groupNumber in
sample
Total estimated number
Total estimated percent
Estimated number resident State
same in 2007 and 2008
Estimated percent resident State
same in 2007 and 2008
Estimated number resident State
different in 2007 and 2008*
Estimated percent resident State
different in 2007 and 2008*
Total 33,179 3,063,162 100.0 2,965,809 96.8 97,353 3.2
Less than 25 730 79,641 100.0 71,838 90.2 7,803 9.825-29 1,966 208,543 100.0 192,028 92.1 16,515 7.930-34 2,677 281,999 100.0 267,969 95.0 14,030 5.035-39 3,149 331,972 100.0 319,042 96.1 12,930 3.940-44 3,623 350,101 100.0 340,459 97.2 9,642 2.845-49 4,763 441,831 100.0 433,489 98.1 8,342 1.950-54 6,035 495,985 100.0 486,055 98.0 9,930 2.055-59 4,858 396,967 100.0 387,513 97.6 9,454 2.460-64 2,995 249,533 100.0 243,671 97.7 5,862 2.365-69 1,509 140,263 100.0 138,174 98.5 2,089 1.570-74 562 53,670 100.0 52,979 98.7 -- --75 and over 312 32,657 100.0 32,591 99.8 -- --
*Resident State different includes cases where either 2007 or 2008 residence was a foreign country or a U.S. territory.--Too few cases to report estimated number and estimated percent (fewer than 30 cases unweighted).NOTE: Estimated numbers may not equal totals, and percents may not add to 100, because of rounding.
A-51
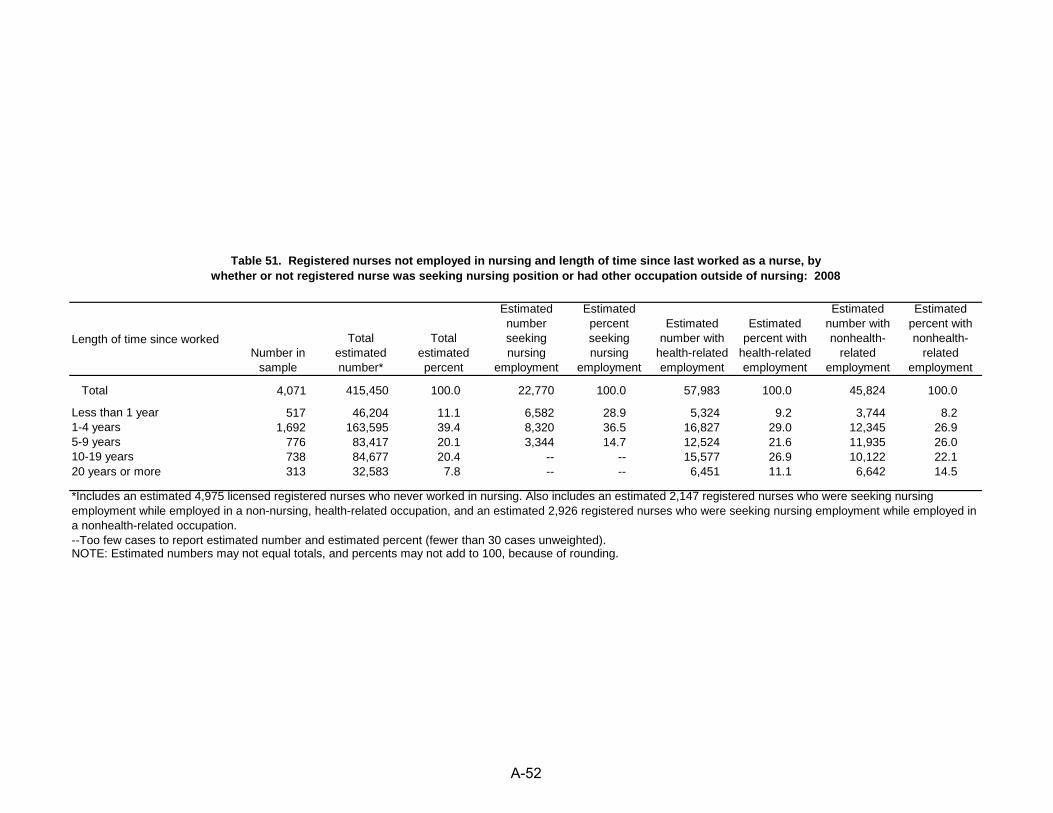
Table 51. Registered nurses not employed in nursing and length of time since last worked as a nurse, by whether or not registered nurse was seeking nursing position or had other occupation outside of nursing: 2008
Length of time since workedNumber in
sample
Total estimated number*
Total estimated percent
Estimated number seeking nursing
employment
Estimated percent seeking nursing
employment
Estimated number with
health-related employment
Estimated percent with
health-related employment
Estimated number with nonhealth-
related employment
Estimated percent with nonhealth-
related employment
Total 4,071 415,450 100.0 22,770 100.0 57,983 100.0 45,824 100.0
Less than 1 year 517 46,204 11.1 6,582 28.9 5,324 9.2 3,744 8.21-4 years 1,692 163,595 39.4 8,320 36.5 16,827 29.0 12,345 26.95-9 years 776 83,417 20.1 3,344 14.7 12,524 21.6 11,935 26.010-19 years 738 84,677 20.4 -- -- 15,577 26.9 10,122 22.120 years or more 313 32,583 7.8 -- -- 6,451 11.1 6,642 14.5
*Includes an estimated 4,975 licensed registered nurses who never worked in nursing. Also includes an estimated 2,147 registered nurses who were seeking nursing employment while employed in a non-nursing, health-related occupation, and an estimated 2,926 registered nurses who were seeking nursing employment while employed in a nonhealth-related occupation.--Too few cases to report estimated number and estimated percent (fewer than 30 cases unweighted).NOTE: Estimated numbers may not equal totals, and percents may not add to 100, because of rounding.
A-52
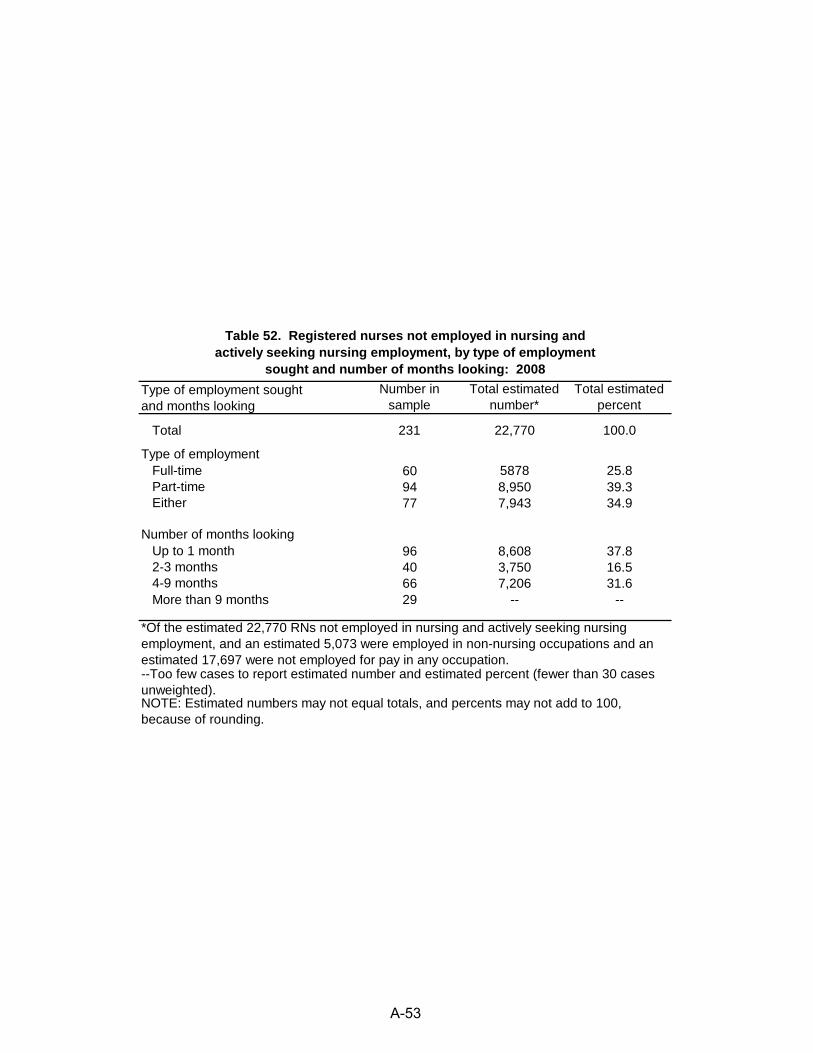
Table 52. Registered nurses not employed in nursing andactively seeking nursing employment, by type of employment
sought and number of months looking: 2008Type of employment soughtand months looking
Number in sample
Total estimated number*
Total estimated percent
Total 231 22,770 100.0
Type of employment Full-time 60 5878 25.8Part-time 94 8,950 39.3Either 77 7,943 34.9
Number of months looking Up to 1 month 96 8,608 37.82-3 months 40 3,750 16.54-9 months 66 7,206 31.6More than 9 months 29 -- --
*Of the estimated 22,770 RNs not employed in nursing and actively seeking nursing employment, and an estimated 5,073 were employed in non-nursing occupations and an estimated 17,697 were not employed for pay in any occupation.--Too few cases to report estimated number and estimated percent (fewer than 30 cases unweighted).NOTE: Estimated numbers may not equal totals, and percents may not add to 100, because of rounding.
A-53
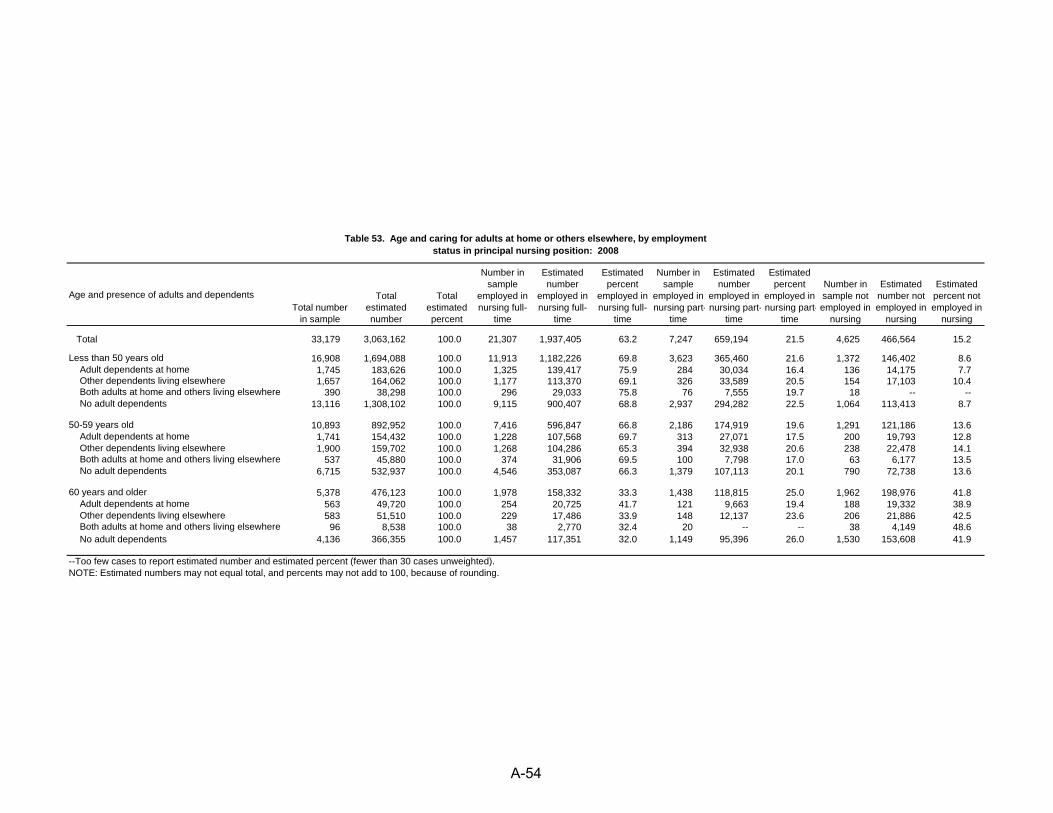
Table 53. Age and caring for adults at home or others elsewhere, by employment status in principal nursing position: 2008
Age and presence of adults and dependentsTotal number
in sample
Total estimated number
Total estimated percent
Number in sample
employed in nursing full-
time
Estimated number
employed in nursing full-
time
Estimated percent
employed in nursing full-
time
Number in sample
employed in nursing part-
time
Estimated number
employed in nursing part-
time
Estimated percent
employed in nursing part-
time
Number in sample not employed in
nursing
Estimated number not employed in
nursing
Estimated percent not employed in
nursing
Total 33,179 3,063,162 100.0 21,307 1,937,405 63.2 7,247 659,194 21.5 4,625 466,564 15.2
Less than 50 years old 16,908 1,694,088 100.0 11,913 1,182,226 69.8 3,623 365,460 21.6 1,372 146,402 8.6Adult dependents at home 1,745 183,626 100.0 1,325 139,417 75.9 284 30,034 16.4 136 14,175 7.7Other dependents living elsewhere 1,657 164,062 100.0 1,177 113,370 69.1 326 33,589 20.5 154 17,103 10.4Both adults at home and others living elsewhere 390 38,298 100.0 296 29,033 75.8 76 7,555 19.7 18 -- --No adult dependents 13,116 1,308,102 100.0 9,115 900,407 68.8 2,937 294,282 22.5 1,064 113,413 8.7
50-59 years old 10,893 892,952 100.0 7,416 596,847 66.8 2,186 174,919 19.6 1,291 121,186 13.6Adult dependents at home 1,741 154,432 100.0 1,228 107,568 69.7 313 27,071 17.5 200 19,793 12.8Other dependents living elsewhere 1,900 159,702 100.0 1,268 104,286 65.3 394 32,938 20.6 238 22,478 14.1Both adults at home and others living elsewhere 537 45,880 100.0 374 31,906 69.5 100 7,798 17.0 63 6,177 13.5No adult dependents 6,715 532,937 100.0 4,546 353,087 66.3 1,379 107,113 20.1 790 72,738 13.6
60 years and older 5,378 476,123 100.0 1,978 158,332 33.3 1,438 118,815 25.0 1,962 198,976 41.8Adult dependents at home 563 49,720 100.0 254 20,725 41.7 121 9,663 19.4 188 19,332 38.9Other dependents living elsewhere 583 51,510 100.0 229 17,486 33.9 148 12,137 23.6 206 21,886 42.5Both adults at home and others living elsewhere 96 8,538 100.0 38 2,770 32.4 20 -- -- 38 4,149 48.6No adult dependents 4,136 366,355 100.0 1,457 117,351 32.0 1,149 95,396 26.0 1,530 153,608 41.9
--Too few cases to report estimated number and estimated percent (fewer than 30 cases unweighted).NOTE: Estimated numbers may not equal total, and percents may not add to 100, because of rounding.
A-54
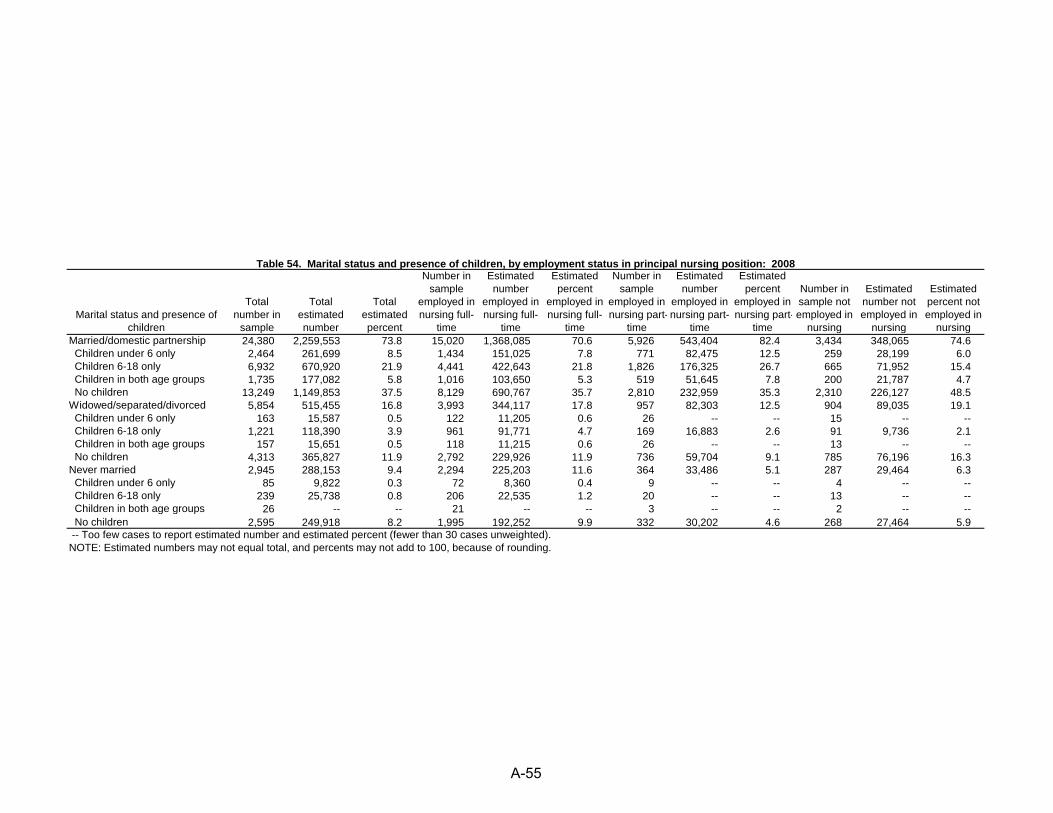
Table 54. Marital status and presence of children, by employment status in principal nursing position: 2008
Marital status and presence of children
Total number in
sample
Total estimated number
Total estimated percent
Number in sample
employed in nursing full-
time
Estimated number
employed in nursing full-
time
Estimated percent
employed in nursing full-
time
Number in sample
employed in nursing part-
time
Estimated number
employed in nursing part-
time
Estimated percent
employed in nursing part-
time
Number in sample not employed in
nursing
Estimated number not employed in
nursing
Estimated percent not employed in
nursing Married/domestic partnership 24,380 2,259,553 73.8 15,020 1,368,085 70.6 5,926 543,404 82.4 3,434 348,065 74.6 Children under 6 only 2,464 261,699 8.5 1,434 151,025 7.8 771 82,475 12.5 259 28,199 6.0 Children 6-18 only 6,932 670,920 21.9 4,441 422,643 21.8 1,826 176,325 26.7 665 71,952 15.4 Children in both age groups 1,735 177,082 5.8 1,016 103,650 5.3 519 51,645 7.8 200 21,787 4.7 No children 13,249 1,149,853 37.5 8,129 690,767 35.7 2,810 232,959 35.3 2,310 226,127 48.5Widowed/separated/divorced 5,854 515,455 16.8 3,993 344,117 17.8 957 82,303 12.5 904 89,035 19.1 Children under 6 only 163 15,587 0.5 122 11,205 0.6 26 -- -- 15 -- -- Children 6-18 only 1,221 118,390 3.9 961 91,771 4.7 169 16,883 2.6 91 9,736 2.1 Children in both age groups 157 15,651 0.5 118 11,215 0.6 26 -- -- 13 -- -- No children 4,313 365,827 11.9 2,792 229,926 11.9 736 59,704 9.1 785 76,196 16.3Never married 2,945 288,153 9.4 2,294 225,203 11.6 364 33,486 5.1 287 29,464 6.3 Children under 6 only 85 9,822 0.3 72 8,360 0.4 9 -- -- 4 -- -- Children 6-18 only 239 25,738 0.8 206 22,535 1.2 20 -- -- 13 -- -- Children in both age groups 26 -- -- 21 -- -- 3 -- -- 2 -- -- No children 2,595 249,918 8.2 1,995 192,252 9.9 332 30,202 4.6 268 27,464 5.9 -- Too few cases to report estimated number and estimated percent (fewer than 30 cases unweighted).NOTE: Estimated numbers may not equal total, and percents may not add to 100, because of rounding.
A-55
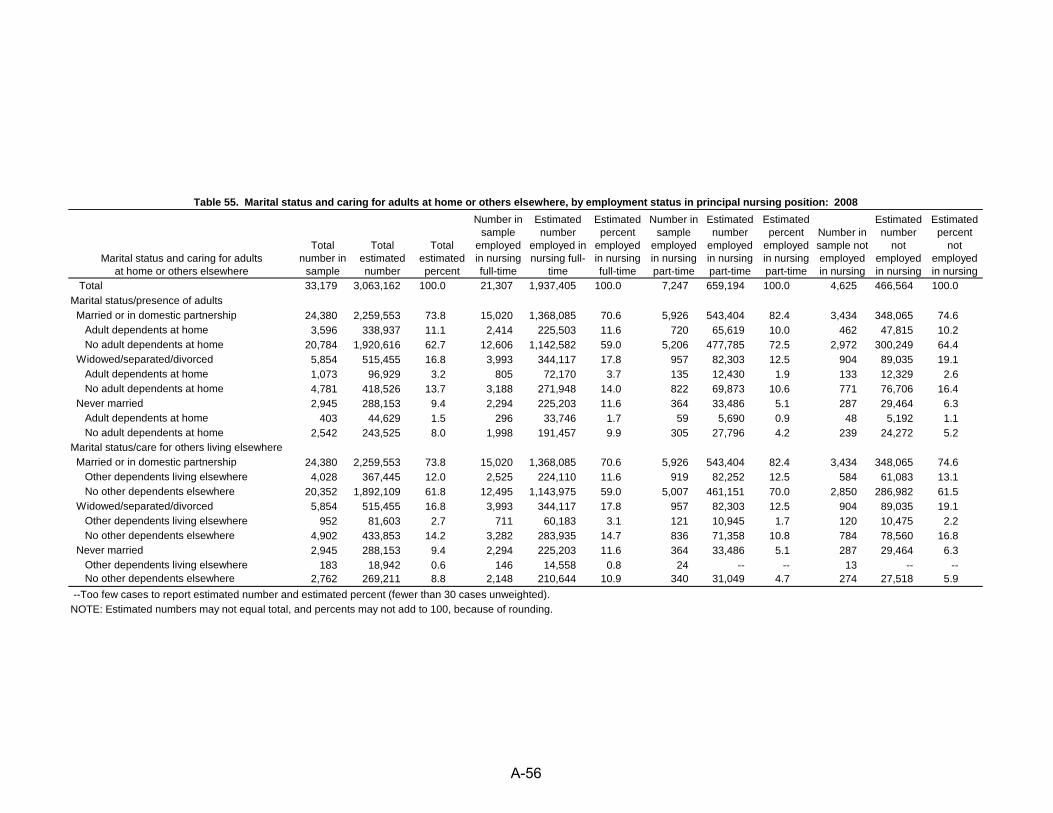
Table 55. Marital status and caring for adults at home or others elsewhere, by employment status in principal nursing position: 2008
Marital status and caring for adults at home or others elsewhere
Total number in
sample
Total estimated number
Total estimated percent
Number in sample
employed in nursing full-time
Estimated number
employed in nursing full-
time
Estimated percent
employed in nursing full-time
Number in sample
employed in nursing part-time
Estimated number
employed in nursing part-time
Estimated percent
employed in nursing part-time
Number in sample not employed in nursing
Estimated number
not employed in nursing
Estimated percent
not employed in nursing
Total 33,179 3,063,162 100.0 21,307 1,937,405 100.0 7,247 659,194 100.0 4,625 466,564 100.0Marital status/presence of adults Married or in domestic partnership 24,380 2,259,553 73.8 15,020 1,368,085 70.6 5,926 543,404 82.4 3,434 348,065 74.6 Adult dependents at home 3,596 338,937 11.1 2,414 225,503 11.6 720 65,619 10.0 462 47,815 10.2 No adult dependents at home 20,784 1,920,616 62.7 12,606 1,142,582 59.0 5,206 477,785 72.5 2,972 300,249 64.4 Widowed/separated/divorced 5,854 515,455 16.8 3,993 344,117 17.8 957 82,303 12.5 904 89,035 19.1 Adult dependents at home 1,073 96,929 3.2 805 72,170 3.7 135 12,430 1.9 133 12,329 2.6 No adult dependents at home 4,781 418,526 13.7 3,188 271,948 14.0 822 69,873 10.6 771 76,706 16.4 Never married 2,945 288,153 9.4 2,294 225,203 11.6 364 33,486 5.1 287 29,464 6.3 Adult dependents at home 403 44,629 1.5 296 33,746 1.7 59 5,690 0.9 48 5,192 1.1 No adult dependents at home 2,542 243,525 8.0 1,998 191,457 9.9 305 27,796 4.2 239 24,272 5.2Marital status/care for others living elsewhere Married or in domestic partnership 24,380 2,259,553 73.8 15,020 1,368,085 70.6 5,926 543,404 82.4 3,434 348,065 74.6 Other dependents living elsewhere 4,028 367,445 12.0 2,525 224,110 11.6 919 82,252 12.5 584 61,083 13.1 No other dependents elsewhere 20,352 1,892,109 61.8 12,495 1,143,975 59.0 5,007 461,151 70.0 2,850 286,982 61.5 Widowed/separated/divorced 5,854 515,455 16.8 3,993 344,117 17.8 957 82,303 12.5 904 89,035 19.1 Other dependents living elsewhere 952 81,603 2.7 711 60,183 3.1 121 10,945 1.7 120 10,475 2.2 No other dependents elsewhere 4,902 433,853 14.2 3,282 283,935 14.7 836 71,358 10.8 784 78,560 16.8 Never married 2,945 288,153 9.4 2,294 225,203 11.6 364 33,486 5.1 287 29,464 6.3 Other dependents living elsewhere 183 18,942 0.6 146 14,558 0.8 24 -- -- 13 -- -- No other dependents elsewhere 2,762 269,211 8.8 2,148 210,644 10.9 340 31,049 4.7 274 27,518 5.9 --Too few cases to report estimated number and estimated percent (fewer than 30 cases unweighted).NOTE: Estimated numbers may not equal total, and percents may not add to 100, because of rounding.
A-56
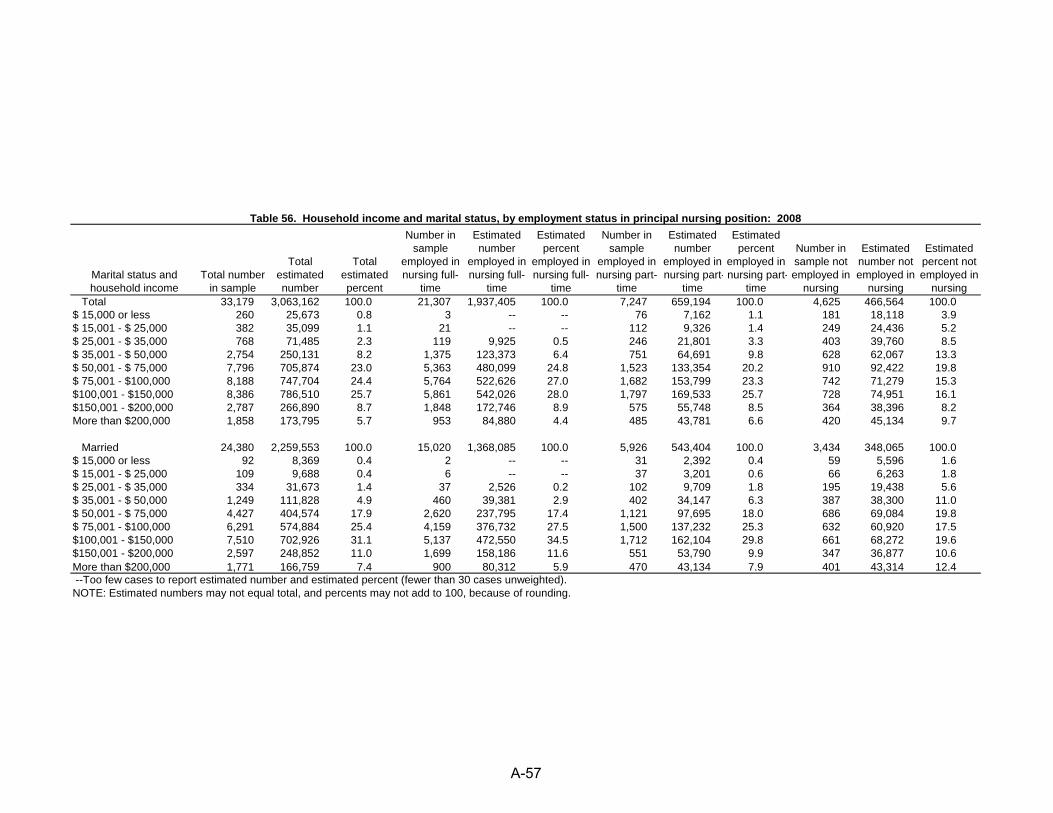
Table 56. Household income and marital status, by employment status in principal nursing position: 2008
Marital status and household income
Total number in sample
Total estimated number
Total estimated percent
Number in sample
employed in nursing full-
time
Estimated number
employed in nursing full-
time
Estimated percent
employed in nursing full-
time
Number in sample
employed in nursing part-
time
Estimated number
employed in nursing part-
time
Estimated percent
employed in nursing part-
time
Number in sample not employed in
nursing
Estimated number not employed in
nursing
Estimated percent not employed in
nursing Total 33,179 3,063,162 100.0 21,307 1,937,405 100.0 7,247 659,194 100.0 4,625 466,564 100.0$ 15,000 or less 260 25,673 0.8 3 -- -- 76 7,162 1.1 181 18,118 3.9$ 15,001 - $ 25,000 382 35,099 1.1 21 -- -- 112 9,326 1.4 249 24,436 5.2$ 25,001 - $ 35,000 768 71,485 2.3 119 9,925 0.5 246 21,801 3.3 403 39,760 8.5$ 35,001 - $ 50,000 2,754 250,131 8.2 1,375 123,373 6.4 751 64,691 9.8 628 62,067 13.3$ 50,001 - $ 75,000 7,796 705,874 23.0 5,363 480,099 24.8 1,523 133,354 20.2 910 92,422 19.8$ 75,001 - $100,000 8,188 747,704 24.4 5,764 522,626 27.0 1,682 153,799 23.3 742 71,279 15.3$100,001 - $150,000 8,386 786,510 25.7 5,861 542,026 28.0 1,797 169,533 25.7 728 74,951 16.1$150,001 - $200,000 2,787 266,890 8.7 1,848 172,746 8.9 575 55,748 8.5 364 38,396 8.2More than $200,000 1,858 173,795 5.7 953 84,880 4.4 485 43,781 6.6 420 45,134 9.7
Married 24,380 2,259,553 100.0 15,020 1,368,085 100.0 5,926 543,404 100.0 3,434 348,065 100.0$ 15,000 or less 92 8,369 0.4 2 -- -- 31 2,392 0.4 59 5,596 1.6$ 15,001 - $ 25,000 109 9,688 0.4 6 -- -- 37 3,201 0.6 66 6,263 1.8$ 25,001 - $ 35,000 334 31,673 1.4 37 2,526 0.2 102 9,709 1.8 195 19,438 5.6$ 35,001 - $ 50,000 1,249 111,828 4.9 460 39,381 2.9 402 34,147 6.3 387 38,300 11.0$ 50,001 - $ 75,000 4,427 404,574 17.9 2,620 237,795 17.4 1,121 97,695 18.0 686 69,084 19.8$ 75,001 - $100,000 6,291 574,884 25.4 4,159 376,732 27.5 1,500 137,232 25.3 632 60,920 17.5$100,001 - $150,000 7,510 702,926 31.1 5,137 472,550 34.5 1,712 162,104 29.8 661 68,272 19.6$150,001 - $200,000 2,597 248,852 11.0 1,699 158,186 11.6 551 53,790 9.9 347 36,877 10.6More than $200,000 1,771 166,759 7.4 900 80,312 5.9 470 43,134 7.9 401 43,314 12.4 --Too few cases to report estimated number and estimated percent (fewer than 30 cases unweighted).NOTE: Estimated numbers may not equal total, and percents may not add to 100, because of rounding.
A-57
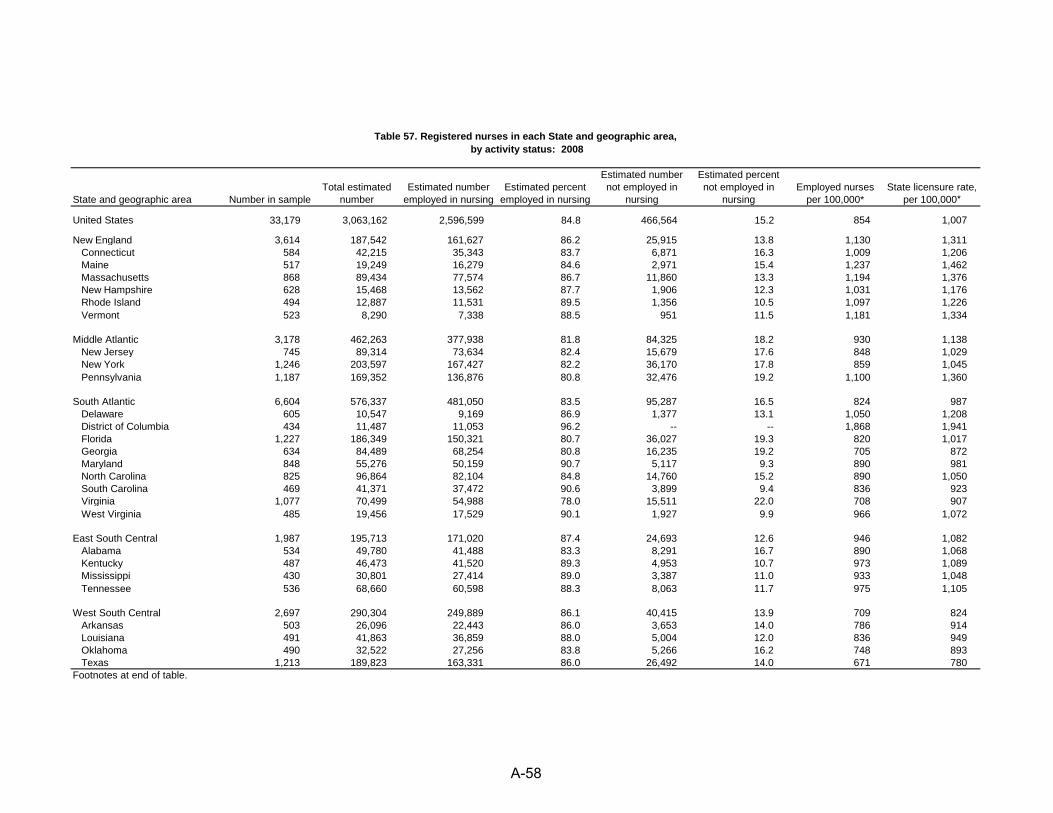
Table 57. Registered nurses in each State and geographic area, by activity status: 2008
State and geographic area Number in sampleTotal estimated
numberEstimated number
employed in nursingEstimated percent
employed in nursing
Estimated number not employed in
nursing
Estimated percent not employed in
nursing Employed nurses
per 100,000*State licensure rate,
per 100,000*
United States 33,179 3,063,162 2,596,599 84.8 466,564 15.2 854 1,007
New England 3,614 187,542 161,627 86.2 25,915 13.8 1,130 1,311 Connecticut 584 42,215 35,343 83.7 6,871 16.3 1,009 1,206 Maine 517 19,249 16,279 84.6 2,971 15.4 1,237 1,462 Massachusetts 868 89,434 77,574 86.7 11,860 13.3 1,194 1,376 New Hampshire 628 15,468 13,562 87.7 1,906 12.3 1,031 1,176 Rhode Island 494 12,887 11,531 89.5 1,356 10.5 1,097 1,226 Vermont 523 8,290 7,338 88.5 951 11.5 1,181 1,334
Middle Atlantic 3,178 462,263 377,938 81.8 84,325 18.2 930 1,138 New Jersey 745 89,314 73,634 82.4 15,679 17.6 848 1,029 New York 1,246 203,597 167,427 82.2 36,170 17.8 859 1,045 Pennsylvania 1,187 169,352 136,876 80.8 32,476 19.2 1,100 1,360
South Atlantic 6,604 576,337 481,050 83.5 95,287 16.5 824 987 Delaware 605 10,547 9,169 86.9 1,377 13.1 1,050 1,208 District of Columbia 434 11,487 11,053 96.2 -- -- 1,868 1,941 Florida 1,227 186,349 150,321 80.7 36,027 19.3 820 1,017 Georgia 634 84,489 68,254 80.8 16,235 19.2 705 872 Maryland 848 55,276 50,159 90.7 5,117 9.3 890 981 North Carolina 825 96,864 82,104 84.8 14,760 15.2 890 1,050 South Carolina 469 41,371 37,472 90.6 3,899 9.4 836 923 Virginia 1,077 70,499 54,988 78.0 15,511 22.0 708 907 West Virginia 485 19,456 17,529 90.1 1,927 9.9 966 1,072
East South Central 1,987 195,713 171,020 87.4 24,693 12.6 946 1,082 Alabama 534 49,780 41,488 83.3 8,291 16.7 890 1,068 Kentucky 487 46,473 41,520 89.3 4,953 10.7 973 1,089 Mississippi 430 30,801 27,414 89.0 3,387 11.0 933 1,048 Tennessee 536 68,660 60,598 88.3 8,063 11.7 975 1,105
West South Central 2,697 290,304 249,889 86.1 40,415 13.9 709 824 Arkansas 503 26,096 22,443 86.0 3,653 14.0 786 914 Louisiana 491 41,863 36,859 88.0 5,004 12.0 836 949 Oklahoma 490 32,522 27,256 83.8 5,266 16.2 748 893 Texas 1,213 189,823 163,331 86.0 26,492 14.0 671 780Footnotes at end of table.
A-58
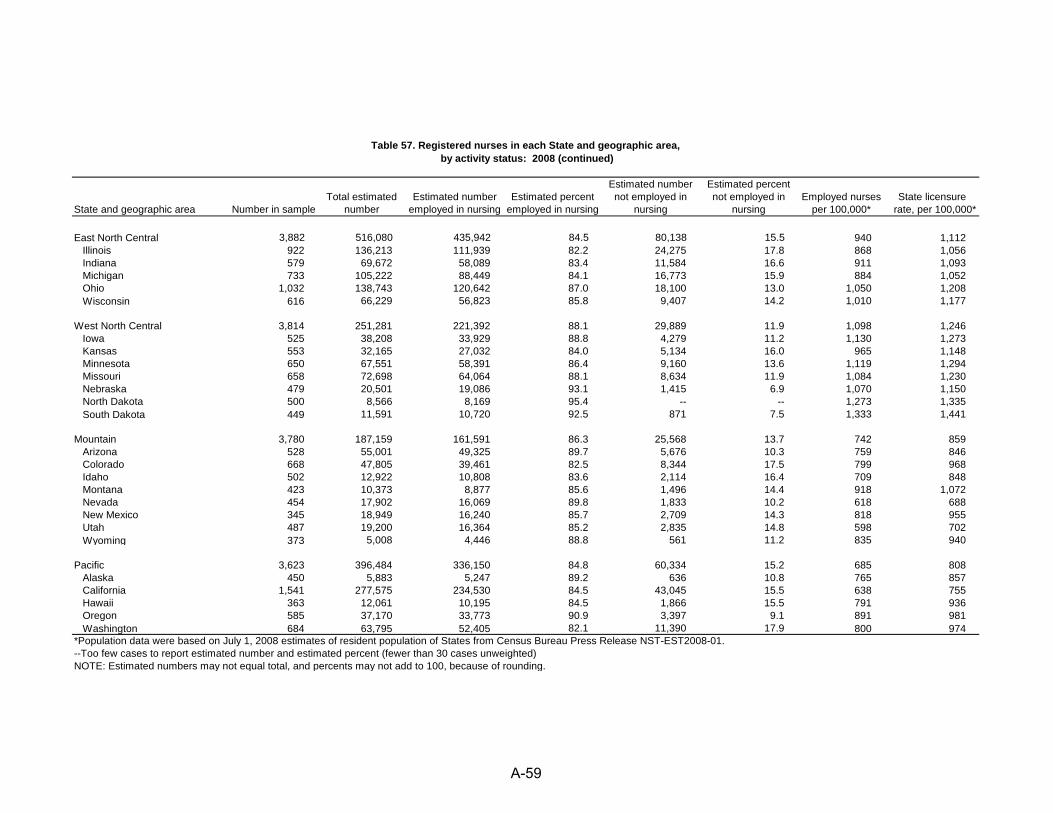
Table 57. Registered nurses in each State and geographic area, by activity status: 2008 (continued)
State and geographic area Number in sampleTotal estimated
numberEstimated number
employed in nursingEstimated percent
employed in nursing
Estimated number not employed in
nursing
Estimated percent not employed in
nursing Employed nurses
per 100,000*State licensure
rate, per 100,000*
East North Central 3,882 516,080 435,942 84.5 80,138 15.5 940 1,112 Illinois 922 136,213 111,939 82.2 24,275 17.8 868 1,056 Indiana 579 69,672 58,089 83.4 11,584 16.6 911 1,093 Michigan 733 105,222 88,449 84.1 16,773 15.9 884 1,052 Ohio 1,032 138,743 120,642 87.0 18,100 13.0 1,050 1,208 Wisconsin 616 66,229 56,823 85.8 9,407 14.2 1,010 1,177
West North Central 3,814 251,281 221,392 88.1 29,889 11.9 1,098 1,246 Iowa 525 38,208 33,929 88.8 4,279 11.2 1,130 1,273 Kansas 553 32,165 27,032 84.0 5,134 16.0 965 1,148 Minnesota 650 67,551 58,391 86.4 9,160 13.6 1,119 1,294 Missouri 658 72,698 64,064 88.1 8,634 11.9 1,084 1,230 Nebraska 479 20,501 19,086 93.1 1,415 6.9 1,070 1,150 North Dakota 500 8,566 8,169 95.4 -- -- 1,273 1,335 South Dakota 449 11,591 10,720 92.5 871 7.5 1,333 1,441
Mountain 3,780 187,159 161,591 86.3 25,568 13.7 742 859 Arizona 528 55,001 49,325 89.7 5,676 10.3 759 846 Colorado 668 47,805 39,461 82.5 8,344 17.5 799 968 Idaho 502 12,922 10,808 83.6 2,114 16.4 709 848 Montana 423 10,373 8,877 85.6 1,496 14.4 918 1,072 Nevada 454 17,902 16,069 89.8 1,833 10.2 618 688 New Mexico 345 18,949 16,240 85.7 2,709 14.3 818 955 Utah 487 19,200 16,364 85.2 2,835 14.8 598 702 Wyoming 373 5,008 4,446 88.8 561 11.2 835 940
Pacific 3,623 396,484 336,150 84.8 60,334 15.2 685 808 Alaska 450 5,883 5,247 89.2 636 10.8 765 857 California 1,541 277,575 234,530 84.5 43,045 15.5 638 755 Hawaii 363 12,061 10,195 84.5 1,866 15.5 791 936 Oregon 585 37,170 33,773 90.9 3,397 9.1 891 981 Washington 684 63,795 52,405 82.1 11,390 17.9 800 974*Population data were based on July 1, 2008 estimates of resident population of States from Census Bureau Press Release NST-EST2008-01.--Too few cases to report estimated number and estimated percent (fewer than 30 cases unweighted)NOTE: Estimated numbers may not equal total, and percents may not add to 100, because of rounding.
A-59
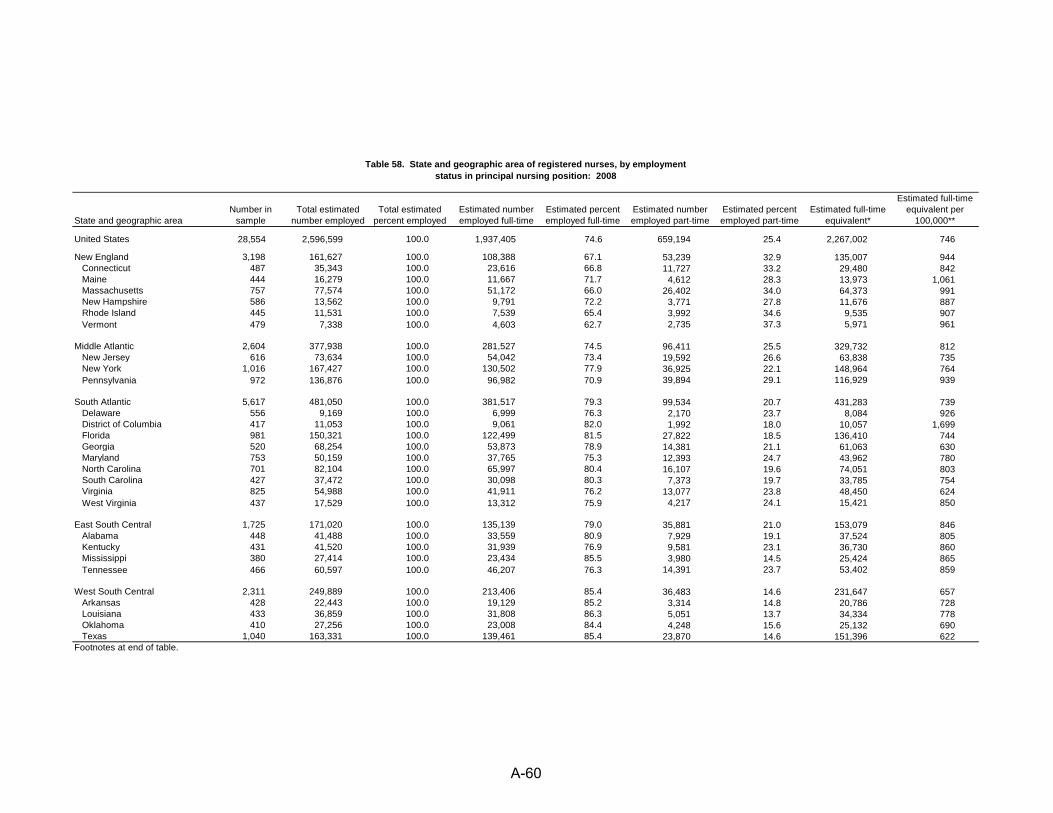
Table 58. State and geographic area of registered nurses, by employment status in principal nursing position: 2008
State and geographic areaNumber in
sampleTotal estimated
number employedTotal estimated
percent employedEstimated number employed full-time
Estimated percent employed full-time
Estimated number employed part-time
Estimated percent employed part-time
Estimated full-time equivalent*
Estimated full-time equivalent per
100,000**
United States 28,554 2,596,599 100.0 1,937,405 74.6 659,194 25.4 2,267,002 746
New England 3,198 161,627 100.0 108,388 67.1 53,239 32.9 135,007 944 Connecticut 487 35,343 100.0 23,616 66.8 11,727 33.2 29,480 842 Maine 444 16,279 100.0 11,667 71.7 4,612 28.3 13,973 1,061 Massachusetts 757 77,574 100.0 51,172 66.0 26,402 34.0 64,373 991 New Hampshire 586 13,562 100.0 9,791 72.2 3,771 27.8 11,676 887 Rhode Island 445 11,531 100.0 7,539 65.4 3,992 34.6 9,535 907 Vermont 479 7,338 100.0 4,603 62.7 2,735 37.3 5,971 961
Middle Atlantic 2,604 377,938 100.0 281,527 74.5 96,411 25.5 329,732 812 New Jersey 616 73,634 100.0 54,042 73.4 19,592 26.6 63,838 735 New York 1,016 167,427 100.0 130,502 77.9 36,925 22.1 148,964 764 Pennsylvania 972 136,876 100.0 96,982 70.9 39,894 29.1 116,929 939
South Atlantic 5,617 481,050 100.0 381,517 79.3 99,534 20.7 431,283 739 Delaware 556 9,169 100.0 6,999 76.3 2,170 23.7 8,084 926 District of Columbia 417 11,053 100.0 9,061 82.0 1,992 18.0 10,057 1,699 Florida 981 150,321 100.0 122,499 81.5 27,822 18.5 136,410 744 Georgia 520 68,254 100.0 53,873 78.9 14,381 21.1 61,063 630 Maryland 753 50,159 100.0 37,765 75.3 12,393 24.7 43,962 780 North Carolina 701 82,104 100.0 65,997 80.4 16,107 19.6 74,051 803 South Carolina 427 37,472 100.0 30,098 80.3 7,373 19.7 33,785 754 Virginia 825 54,988 100.0 41,911 76.2 13,077 23.8 48,450 624 West Virginia 437 17,529 100.0 13,312 75.9 4,217 24.1 15,421 850
East South Central 1,725 171,020 100.0 135,139 79.0 35,881 21.0 153,079 846 Alabama 448 41,488 100.0 33,559 80.9 7,929 19.1 37,524 805 Kentucky 431 41,520 100.0 31,939 76.9 9,581 23.1 36,730 860 Mississippi 380 27,414 100.0 23,434 85.5 3,980 14.5 25,424 865 Tennessee 466 60,597 100.0 46,207 76.3 14,391 23.7 53,402 859
West South Central 2,311 249,889 100.0 213,406 85.4 36,483 14.6 231,647 657 Arkansas 428 22,443 100.0 19,129 85.2 3,314 14.8 20,786 728 Louisiana 433 36,859 100.0 31,808 86.3 5,051 13.7 34,334 778 Oklahoma 410 27,256 100.0 23,008 84.4 4,248 15.6 25,132 690 Texas 1,040 163,331 100.0 139,461 85.4 23,870 14.6 151,396 622Footnotes at end of table.
A-60
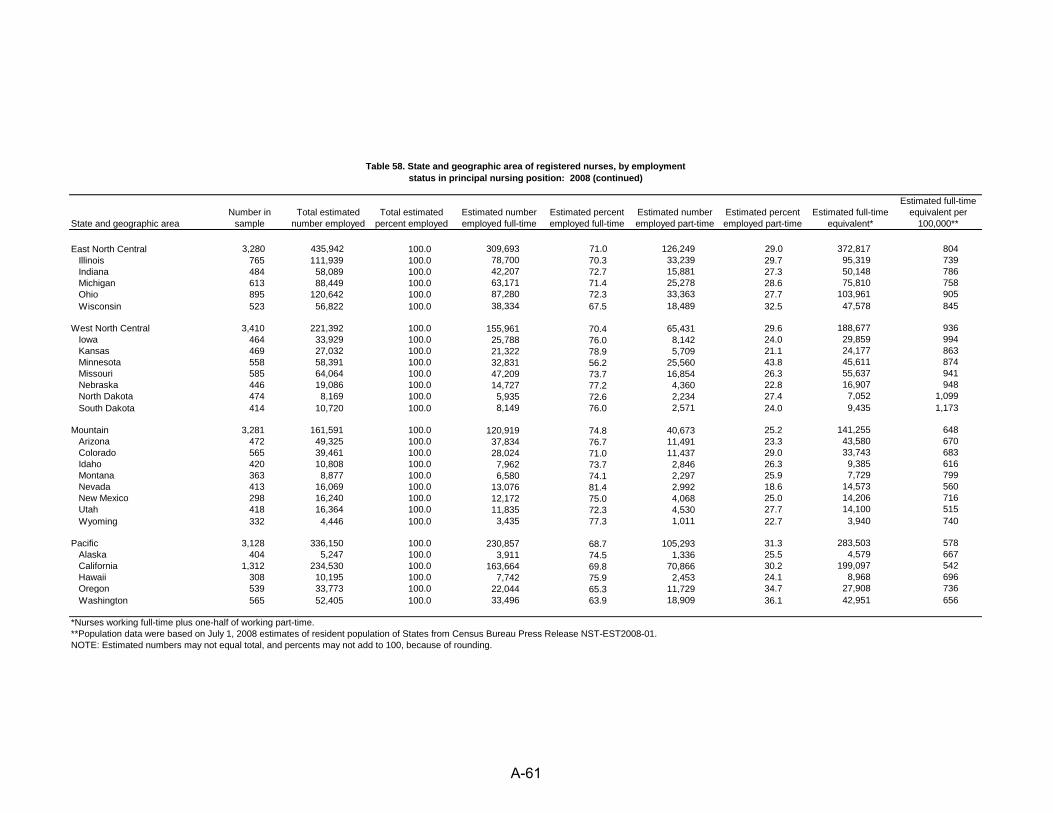
Table 58. State and geographic area of registered nurses, by employment status in principal nursing position: 2008 (continued)
State and geographic areaNumber in
sampleTotal estimated
number employedTotal estimated
percent employedEstimated number employed full-time
Estimated percent employed full-time
Estimated number employed part-time
Estimated percent employed part-time
Estimated full-time equivalent*
Estimated full-time equivalent per
100,000**
East North Central 3,280 435,942 100.0 309,693 71.0 126,249 29.0 372,817 804 Illinois 765 111,939 100.0 78,700 70.3 33,239 29.7 95,319 739 Indiana 484 58,089 100.0 42,207 72.7 15,881 27.3 50,148 786 Michigan 613 88,449 100.0 63,171 71.4 25,278 28.6 75,810 758 Ohio 895 120,642 100.0 87,280 72.3 33,363 27.7 103,961 905 Wisconsin 523 56,822 100.0 38,334 67.5 18,489 32.5 47,578 845
West North Central 3,410 221,392 100.0 155,961 70.4 65,431 29.6 188,677 936 Iowa 464 33,929 100.0 25,788 76.0 8,142 24.0 29,859 994 Kansas 469 27,032 100.0 21,322 78.9 5,709 21.1 24,177 863 Minnesota 558 58,391 100.0 32,831 56.2 25,560 43.8 45,611 874 Missouri 585 64,064 100.0 47,209 73.7 16,854 26.3 55,637 941 Nebraska 446 19,086 100.0 14,727 77.2 4,360 22.8 16,907 948 North Dakota 474 8,169 100.0 5,935 72.6 2,234 27.4 7,052 1,099 South Dakota 414 10,720 100.0 8,149 76.0 2,571 24.0 9,435 1,173
Mountain 3,281 161,591 100.0 120,919 74.8 40,673 25.2 141,255 648 Arizona 472 49,325 100.0 37,834 76.7 11,491 23.3 43,580 670 Colorado 565 39,461 100.0 28,024 71.0 11,437 29.0 33,743 683 Idaho 420 10,808 100.0 7,962 73.7 2,846 26.3 9,385 616 Montana 363 8,877 100.0 6,580 74.1 2,297 25.9 7,729 799 Nevada 413 16,069 100.0 13,076 81.4 2,992 18.6 14,573 560 New Mexico 298 16,240 100.0 12,172 75.0 4,068 25.0 14,206 716 Utah 418 16,364 100.0 11,835 72.3 4,530 27.7 14,100 515 Wyoming 332 4,446 100.0 3,435 77.3 1,011 22.7 3,940 740
Pacific 3,128 336,150 100.0 230,857 68.7 105,293 31.3 283,503 578 Alaska 404 5,247 100.0 3,911 74.5 1,336 25.5 4,579 667 California 1,312 234,530 100.0 163,664 69.8 70,866 30.2 199,097 542 Hawaii 308 10,195 100.0 7,742 75.9 2,453 24.1 8,968 696 Oregon 539 33,773 100.0 22,044 65.3 11,729 34.7 27,908 736 Washington 565 52,405 100.0 33,496 63.9 18,909 36.1 42,951 656
*Nurses working full-time plus one-half of working part-time. **Population data were based on July 1, 2008 estimates of resident population of States from Census Bureau Press Release NST-EST2008-01.NOTE: Estimated numbers may not equal total, and percents may not add to 100, because of rounding.
A-61
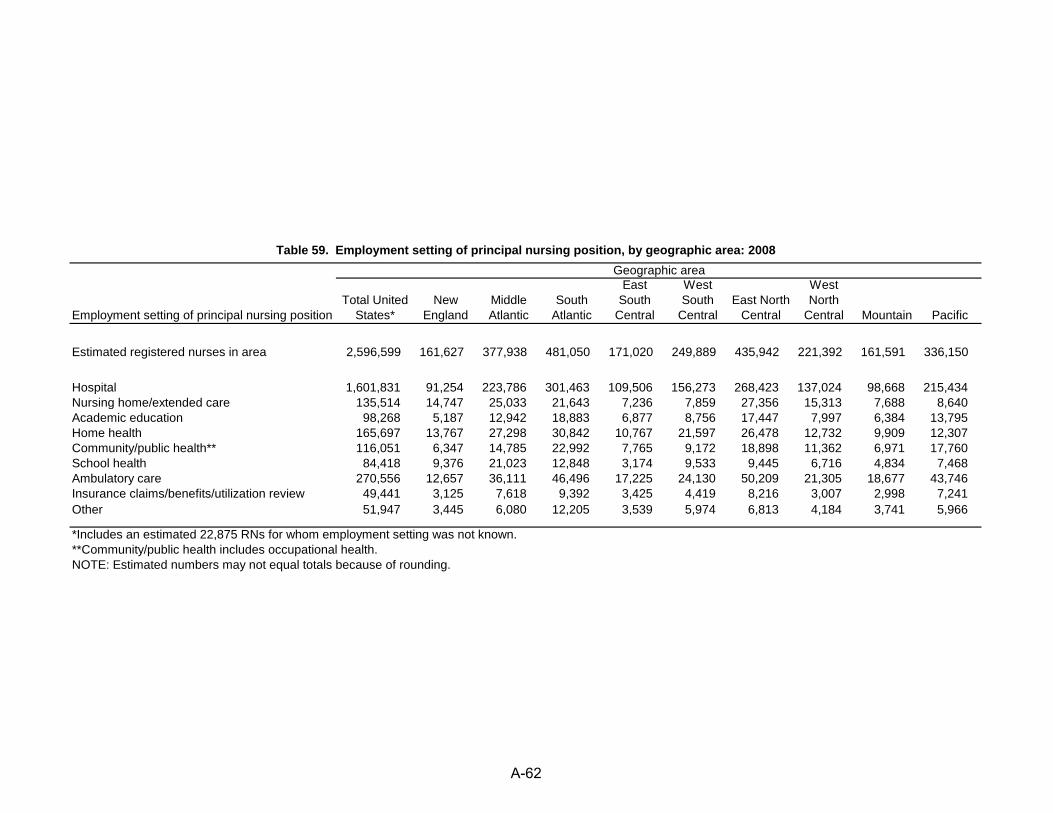
Table 59. Employment setting of principal nursing position, by geographic area: 2008
Employment setting of principal nursing positionTotal United
States*New
EnglandMiddle Atlantic
South Atlantic
East South
Central
West South
CentralEast North
Central
West North
Central Mountain Pacific
Estimated registered nurses in area 2,596,599 161,627 377,938 481,050 171,020 249,889 435,942 221,392 161,591 336,150
Hospital 1,601,831 91,254 223,786 301,463 109,506 156,273 268,423 137,024 98,668 215,434Nursing home/extended care 135,514 14,747 25,033 21,643 7,236 7,859 27,356 15,313 7,688 8,640Academic education 98,268 5,187 12,942 18,883 6,877 8,756 17,447 7,997 6,384 13,795Home health 165,697 13,767 27,298 30,842 10,767 21,597 26,478 12,732 9,909 12,307Community/public health** 116,051 6,347 14,785 22,992 7,765 9,172 18,898 11,362 6,971 17,760School health 84,418 9,376 21,023 12,848 3,174 9,533 9,445 6,716 4,834 7,468Ambulatory care 270,556 12,657 36,111 46,496 17,225 24,130 50,209 21,305 18,677 43,746Insurance claims/benefits/utilization review 49,441 3,125 7,618 9,392 3,425 4,419 8,216 3,007 2,998 7,241Other 51,947 3,445 6,080 12,205 3,539 5,974 6,813 4,184 3,741 5,966
Geographic area
*Includes an estimated 22,875 RNs for whom employment setting was not known.**Community/public health includes occupational health.NOTE: Estimated numbers may not equal totals because of rounding.
A-62
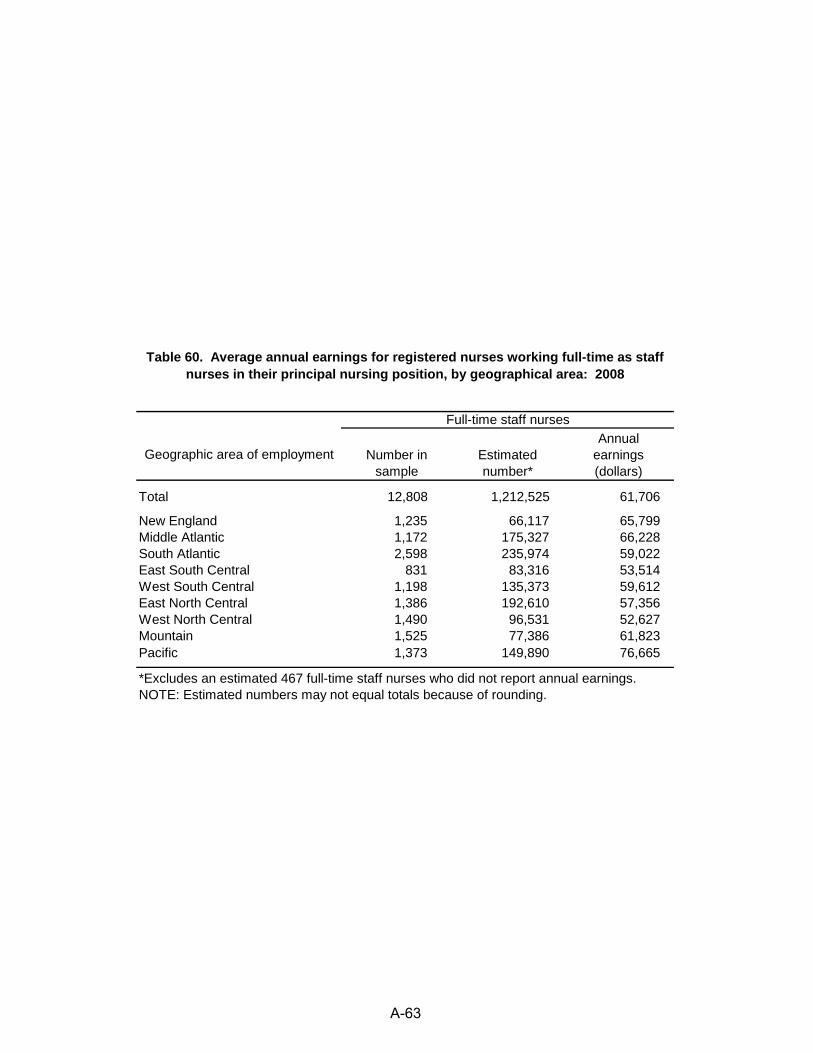
Table 60. Average annual earnings for registered nurses working full-time as staff nurses in their principal nursing position, by geographical area: 2008
Geographic area of employment Number in sample
Estimated number*
Annual earnings(dollars)
Total 12,808 1,212,525 61,706
New England 1,235 66,117 65,799Middle Atlantic 1,172 175,327 66,228South Atlantic 2,598 235,974 59,022East South Central 831 83,316 53,514West South Central 1,198 135,373 59,612East North Central 1,386 192,610 57,356West North Central 1,490 96,531 52,627Mountain 1,525 77,386 61,823Pacific 1,373 149,890 76,665
Full-time staff nurses
*Excludes an estimated 467 full-time staff nurses who did not report annual earnings.NOTE: Estimated numbers may not equal totals because of rounding.
A-63
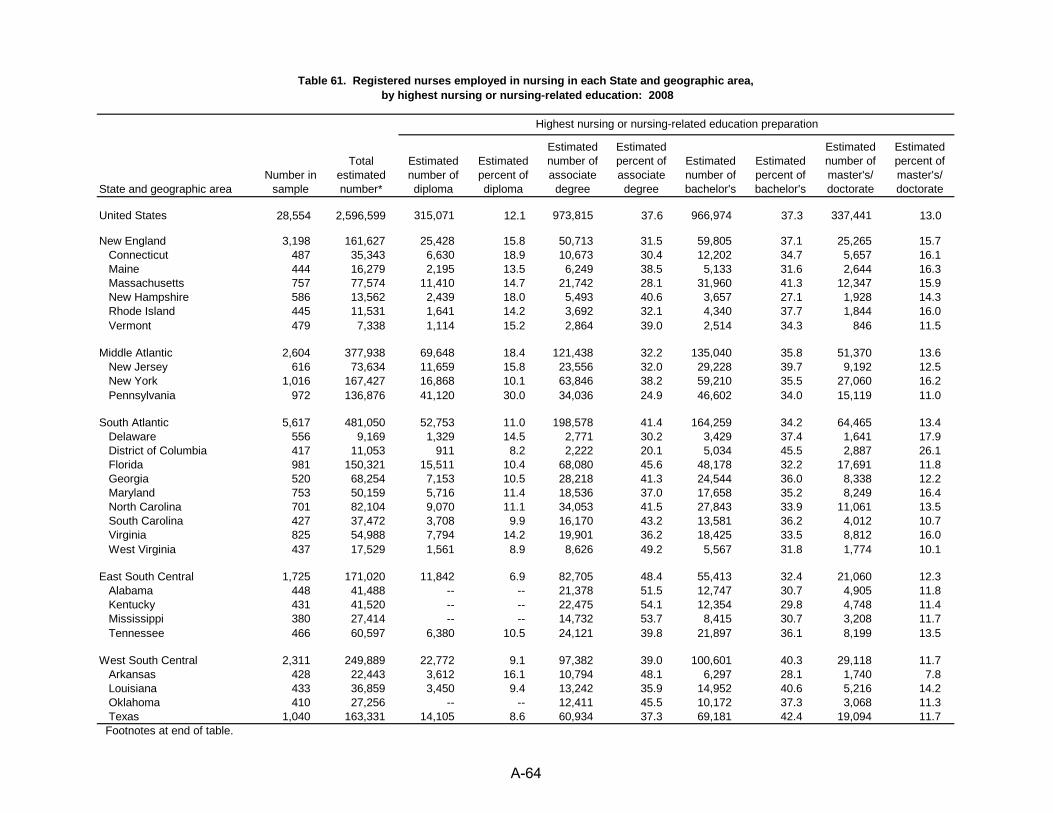
Table 61. Registered nurses employed in nursing in each State and geographic area, by highest nursing or nursing-related education: 2008
State and geographic areaNumber in
sample
Total estimated number*
Estimated number of diploma
Estimated percent of diploma
Estimated number of associate
degree
Estimated percent of associate
degree
Estimated number of bachelor's
Estimated percent of bachelor's
Estimated number of master's/ doctorate
Estimated percent of master's/ doctorate
United States 28,554 2,596,599 315,071 12.1 973,815 37.6 966,974 37.3 337,441 13.0
New England 3,198 161,627 25,428 15.8 50,713 31.5 59,805 37.1 25,265 15.7 Connecticut 487 35,343 6,630 18.9 10,673 30.4 12,202 34.7 5,657 16.1 Maine 444 16,279 2,195 13.5 6,249 38.5 5,133 31.6 2,644 16.3 Massachusetts 757 77,574 11,410 14.7 21,742 28.1 31,960 41.3 12,347 15.9 New Hampshire 586 13,562 2,439 18.0 5,493 40.6 3,657 27.1 1,928 14.3 Rhode Island 445 11,531 1,641 14.2 3,692 32.1 4,340 37.7 1,844 16.0 Vermont 479 7,338 1,114 15.2 2,864 39.0 2,514 34.3 846 11.5
Middle Atlantic 2,604 377,938 69,648 18.4 121,438 32.2 135,040 35.8 51,370 13.6 New Jersey 616 73,634 11,659 15.8 23,556 32.0 29,228 39.7 9,192 12.5 New York 1,016 167,427 16,868 10.1 63,846 38.2 59,210 35.5 27,060 16.2 Pennsylvania 972 136,876 41,120 30.0 34,036 24.9 46,602 34.0 15,119 11.0
South Atlantic 5,617 481,050 52,753 11.0 198,578 41.4 164,259 34.2 64,465 13.4 Delaware 556 9,169 1,329 14.5 2,771 30.2 3,429 37.4 1,641 17.9 District of Columbia 417 11,053 911 8.2 2,222 20.1 5,034 45.5 2,887 26.1 Florida 981 150,321 15,511 10.4 68,080 45.6 48,178 32.2 17,691 11.8 Georgia 520 68,254 7,153 10.5 28,218 41.3 24,544 36.0 8,338 12.2 Maryland 753 50,159 5,716 11.4 18,536 37.0 17,658 35.2 8,249 16.4 North Carolina 701 82,104 9,070 11.1 34,053 41.5 27,843 33.9 11,061 13.5 South Carolina 427 37,472 3,708 9.9 16,170 43.2 13,581 36.2 4,012 10.7 Virginia 825 54,988 7,794 14.2 19,901 36.2 18,425 33.5 8,812 16.0 West Virginia 437 17,529 1,561 8.9 8,626 49.2 5,567 31.8 1,774 10.1
East South Central 1,725 171,020 11,842 6.9 82,705 48.4 55,413 32.4 21,060 12.3 Alabama 448 41,488 -- -- 21,378 51.5 12,747 30.7 4,905 11.8 Kentucky 431 41,520 -- -- 22,475 54.1 12,354 29.8 4,748 11.4 Mississippi 380 27,414 -- -- 14,732 53.7 8,415 30.7 3,208 11.7 Tennessee 466 60,597 6,380 10.5 24,121 39.8 21,897 36.1 8,199 13.5
West South Central 2,311 249,889 22,772 9.1 97,382 39.0 100,601 40.3 29,118 11.7 Arkansas 428 22,443 3,612 16.1 10,794 48.1 6,297 28.1 1,740 7.8 Louisiana 433 36,859 3,450 9.4 13,242 35.9 14,952 40.6 5,216 14.2 Oklahoma 410 27,256 -- -- 12,411 45.5 10,172 37.3 3,068 11.3 Texas 1,040 163,331 14,105 8.6 60,934 37.3 69,181 42.4 19,094 11.7
Highest nursing or nursing-related education preparation
Footnotes at end of table.
A-64
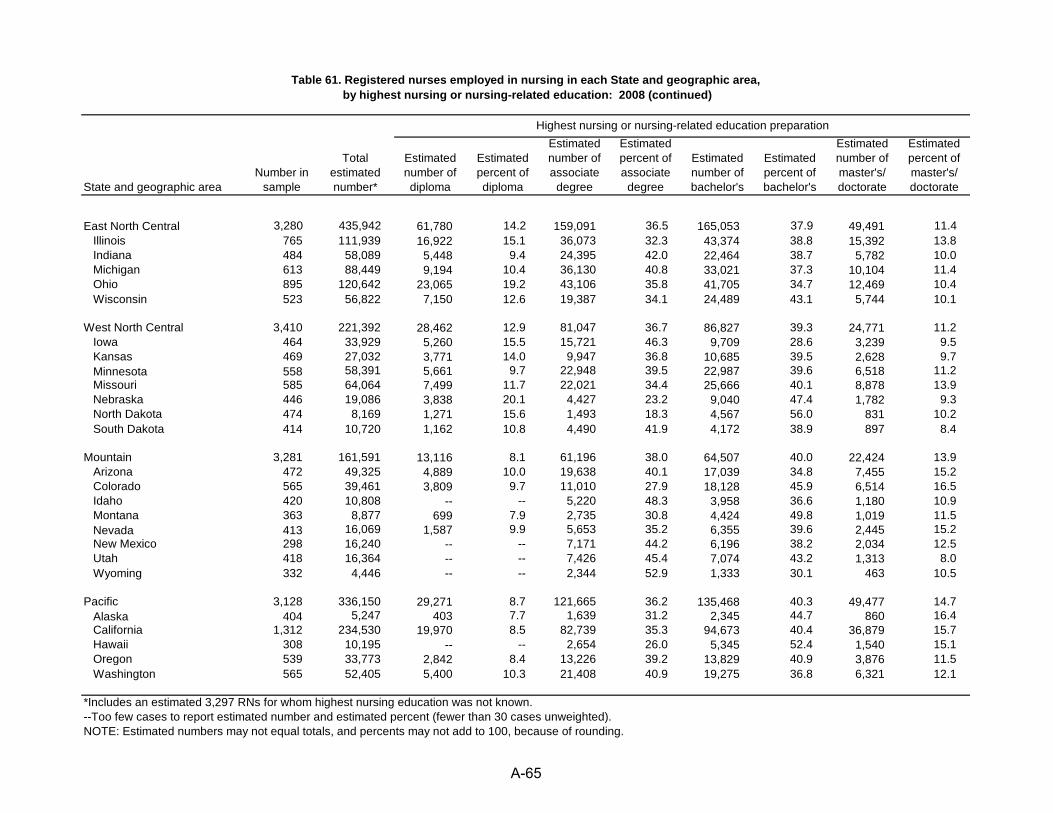
Table 61. Registered nurses employed in nursing in each State and geographic area, by highest nursing or nursing-related education: 2008 (continued)
State and geographic areaNumber in
sample
Total estimated number*
Estimated number of diploma
Estimated percent of diploma
Estimated number of associate
degree
Estimated percent of associate
degree
Estimated number of bachelor's
Estimated percent of bachelor's
Estimated number of master's/ doctorate
Estimated percent of master's/ doctorate
East North Central 3,280 435,942 61,780 14.2 159,091 36.5 165,053 37.9 49,491 11.4 Illinois 765 111,939 16,922 15.1 36,073 32.3 43,374 38.8 15,392 13.8 Indiana 484 58,089 5,448 9.4 24,395 42.0 22,464 38.7 5,782 10.0 Michigan 613 88,449 9,194 10.4 36,130 40.8 33,021 37.3 10,104 11.4 Ohio 895 120,642 23,065 19.2 43,106 35.8 41,705 34.7 12,469 10.4 Wisconsin 523 56,822 7,150 12.6 19,387 34.1 24,489 43.1 5,744 10.1
West North Central 3,410 221,392 28,462 12.9 81,047 36.7 86,827 39.3 24,771 11.2 Iowa 464 33,929 5,260 15.5 15,721 46.3 9,709 28.6 3,239 9.5 Kansas 469 27,032 3,771 14.0 9,947 36.8 10,685 39.5 2,628 9.7 Minnesota 558 58,391 5,661 9.7 22,948 39.5 22,987 39.6 6,518 11.2 Missouri 585 64,064 7,499 11.7 22,021 34.4 25,666 40.1 8,878 13.9 Nebraska 446 19,086 3,838 20.1 4,427 23.2 9,040 47.4 1,782 9.3 North Dakota 474 8,169 1,271 15.6 1,493 18.3 4,567 56.0 831 10.2 South Dakota 414 10,720 1,162 10.8 4,490 41.9 4,172 38.9 897 8.4
Mountain 3,281 161,591 13,116 8.1 61,196 38.0 64,507 40.0 22,424 13.9 Arizona 472 49,325 4,889 10.0 19,638 40.1 17,039 34.8 7,455 15.2 Colorado 565 39,461 3,809 9.7 11,010 27.9 18,128 45.9 6,514 16.5 Idaho 420 10,808 -- -- 5,220 48.3 3,958 36.6 1,180 10.9 Montana 363 8,877 699 7.9 2,735 30.8 4,424 49.8 1,019 11.5 Nevada 413 16,069 1,587 9.9 5,653 35.2 6,355 39.6 2,445 15.2 New Mexico 298 16,240 -- -- 7,171 44.2 6,196 38.2 2,034 12.5 Utah 418 16,364 -- -- 7,426 45.4 7,074 43.2 1,313 8.0 Wyoming 332 4,446 -- -- 2,344 52.9 1,333 30.1 463 10.5
Pacific 3,128 336,150 29,271 8.7 121,665 36.2 135,468 40.3 49,477 14.7 Alaska 404 5,247 403 7.7 1,639 31.2 2,345 44.7 860 16.4 California 1,312 234,530 19,970 8.5 82,739 35.3 94,673 40.4 36,879 15.7 Hawaii 308 10,195 -- -- 2,654 26.0 5,345 52.4 1,540 15.1 Oregon 539 33,773 2,842 8.4 13,226 39.2 13,829 40.9 3,876 11.5 Washington 565 52,405 5,400 10.3 21,408 40.9 19,275 36.8 6,321 12.1
Highest nursing or nursing-related education preparation
*Includes an estimated 3,297 RNs for whom highest nursing education was not known.--Too few cases to report estimated number and estimated percent (fewer than 30 cases unweighted).NOTE: Estimated numbers may not equal totals, and percents may not add to 100, because of rounding.
A-65
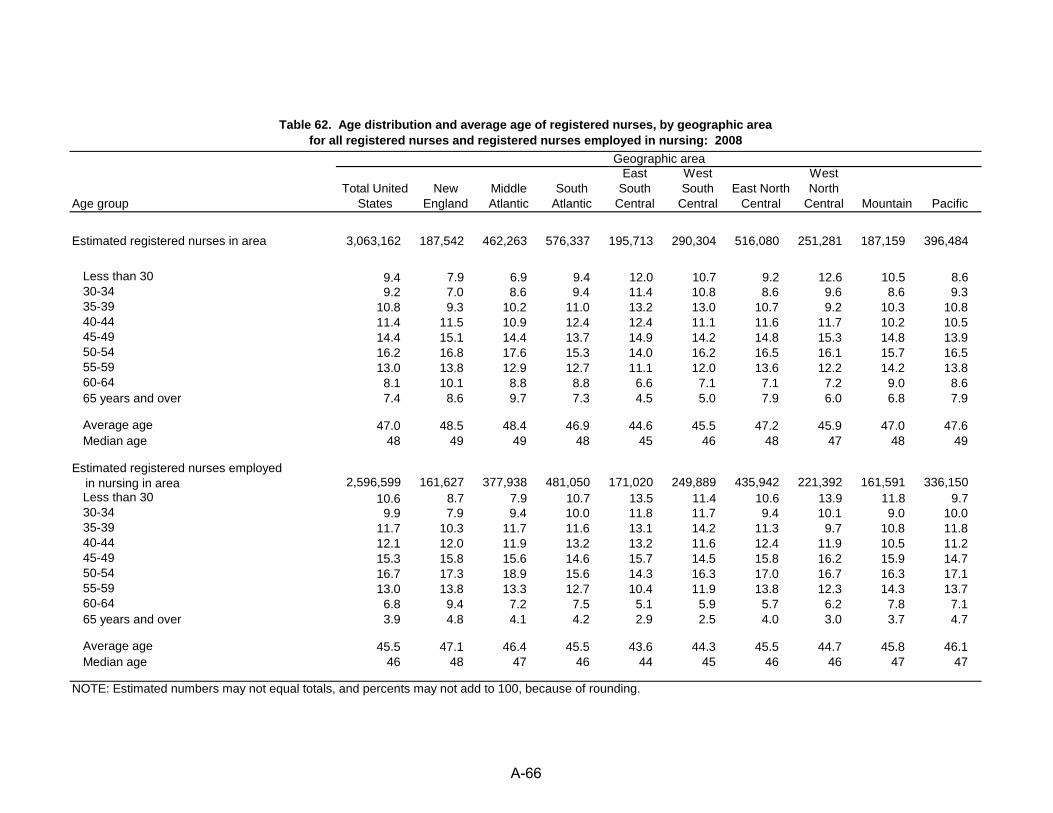
Table 62. Age distribution and average age of registered nurses, by geographic areafor all registered nurses and registered nurses employed in nursing: 2008
Age groupTotal United
StatesNew
EnglandMiddle Atlantic
South Atlantic
East South
Central
West South
CentralEast North
Central
West North
Central Mountain Pacific
Estimated registered nurses in area 3,063,162 187,542 462,263 576,337 195,713 290,304 516,080 251,281 187,159 396,484
Less than 30 9.4 7.9 6.9 9.4 12.0 10.7 9.2 12.6 10.5 8.630-34 9.2 7.0 8.6 9.4 11.4 10.8 8.6 9.6 8.6 9.335-39 10.8 9.3 10.2 11.0 13.2 13.0 10.7 9.2 10.3 10.840-44 11.4 11.5 10.9 12.4 12.4 11.1 11.6 11.7 10.2 10.545-49 14.4 15.1 14.4 13.7 14.9 14.2 14.8 15.3 14.8 13.950-54 16.2 16.8 17.6 15.3 14.0 16.2 16.5 16.1 15.7 16.555-59 13.0 13.8 12.9 12.7 11.1 12.0 13.6 12.2 14.2 13.860-64 8.1 10.1 8.8 8.8 6.6 7.1 7.1 7.2 9.0 8.665 years and over 7.4 8.6 9.7 7.3 4.5 5.0 7.9 6.0 6.8 7.9
Average age 47.0 48.5 48.4 46.9 44.6 45.5 47.2 45.9 47.0 47.6Median age 48 49 49 48 45 46 48 47 48 49
Estimated registered nurses employed in nursing in area 2,596,599 161,627 377,938 481,050 171,020 249,889 435,942 221,392 161,591 336,150
Less than 30 10.6 8.7 7.9 10.7 13.5 11.4 10.6 13.9 11.8 9.730-34 9.9 7.9 9.4 10.0 11.8 11.7 9.4 10.1 9.0 10.035-39 11.7 10.3 11.7 11.6 13.1 14.2 11.3 9.7 10.8 11.840-44 12.1 12.0 11.9 13.2 13.2 11.6 12.4 11.9 10.5 11.245-49 15.3 15.8 15.6 14.6 15.7 14.5 15.8 16.2 15.9 14.750-54 16.7 17.3 18.9 15.6 14.3 16.3 17.0 16.7 16.3 17.155-59 13.0 13.8 13.3 12.7 10.4 11.9 13.8 12.3 14.3 13.760-64 6.8 9.4 7.2 7.5 5.1 5.9 5.7 6.2 7.8 7.165 years and over 3.9 4.8 4.1 4.2 2.9 2.5 4.0 3.0 3.7 4.7
Average age 45.5 47.1 46.4 45.5 43.6 44.3 45.5 44.7 45.8 46.1Median age 46 48 47 46 44 45 46 46 47 47
Geographic area
NOTE: Estimated numbers may not equal totals, and percents may not add to 100, because of rounding.
A-66
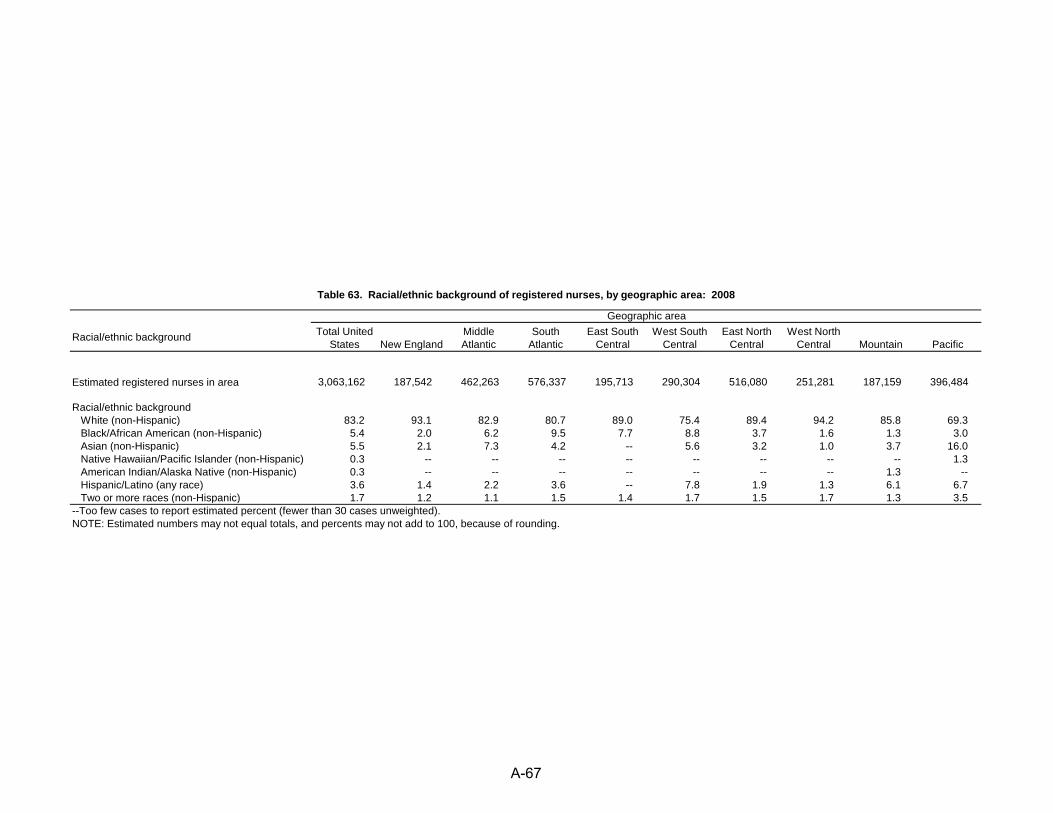
Table 63. Racial/ethnic background of registered nurses, by geographic area: 2008
Racial/ethnic background Total United States New England
Middle Atlantic
South Atlantic
East South Central
West South Central
East North Central
West North Central Mountain Pacific
Estimated registered nurses in area 3,063,162 187,542 462,263 576,337 195,713 290,304 516,080 251,281 187,159 396,484
Racial/ethnic background White (non-Hispanic) 83.2 93.1 82.9 80.7 89.0 75.4 89.4 94.2 85.8 69.3 Black/African American (non-Hispanic) 5.4 2.0 6.2 9.5 7.7 8.8 3.7 1.6 1.3 3.0 Asian (non-Hispanic) 5.5 2.1 7.3 4.2 -- 5.6 3.2 1.0 3.7 16.0 Native Hawaiian/Pacific Islander (non-Hispanic) 0.3 -- -- -- -- -- -- -- -- 1.3 American Indian/Alaska Native (non-Hispanic) 0.3 -- -- -- -- -- -- -- 1.3 -- Hispanic/Latino (any race) 3.6 1.4 2.2 3.6 -- 7.8 1.9 1.3 6.1 6.7 Two or more races (non-Hispanic) 1.7 1.2 1.1 1.5 1.4 1.7 1.5 1.7 1.3 3.5
Geographic area
--Too few cases to report estimated percent (fewer than 30 cases unweighted).NOTE: Estimated numbers may not equal totals, and percents may not add to 100, because of rounding.
A-67
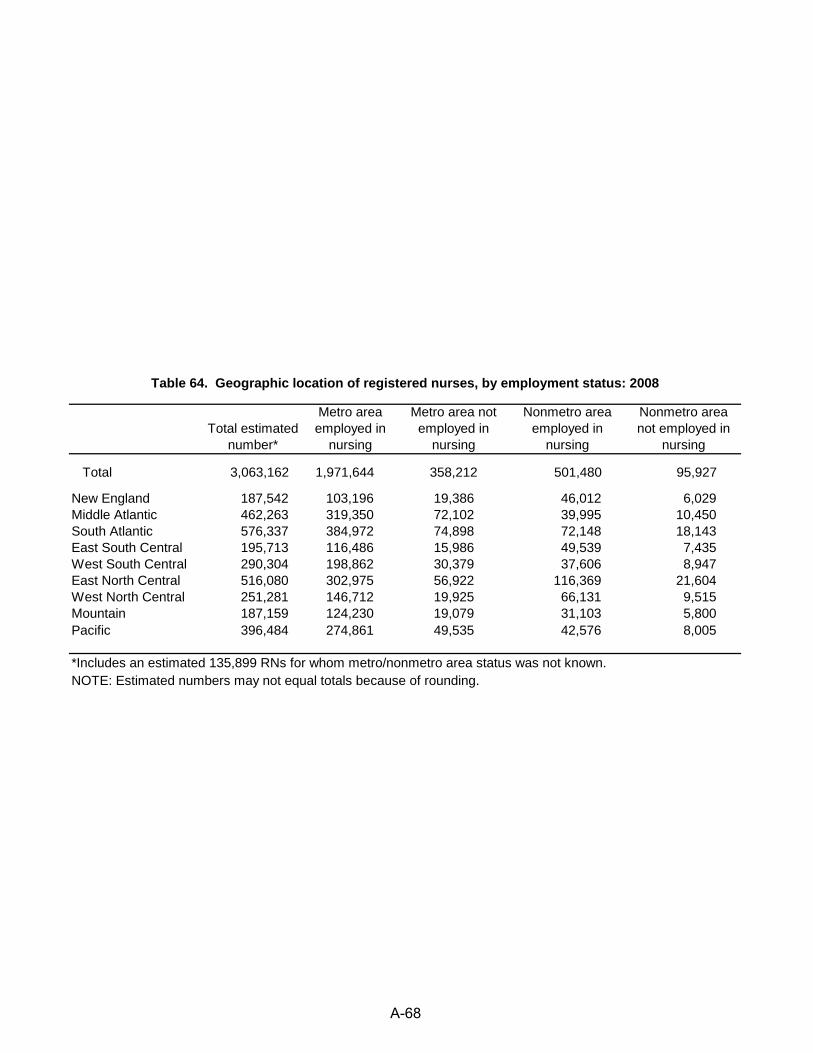
Table 64. Geographic location of registered nurses, by employment status: 2008
Total estimated
number*
Metro area employed in
nursing
Metro area not employed in
nursing
Nonmetro area employed in
nursing
Nonmetro area not employed in
nursing
Total 3,063,162 1,971,644 358,212 501,480 95,927
New England 187,542 103,196 19,386 46,012 6,029Middle Atlantic 462,263 319,350 72,102 39,995 10,450South Atlantic 576,337 384,972 74,898 72,148 18,143East South Central 195,713 116,486 15,986 49,539 7,435West South Central 290,304 198,862 30,379 37,606 8,947East North Central 516,080 302,975 56,922 116,369 21,604West North Central 251,281 146,712 19,925 66,131 9,515Mountain 187,159 124,230 19,079 31,103 5,800Pacific 396,484 274,861 49,535 42,576 8,005
*Includes an estimated 135,899 RNs for whom metro/nonmetro area status was not known.NOTE: Estimated numbers may not equal totals because of rounding.
A-68
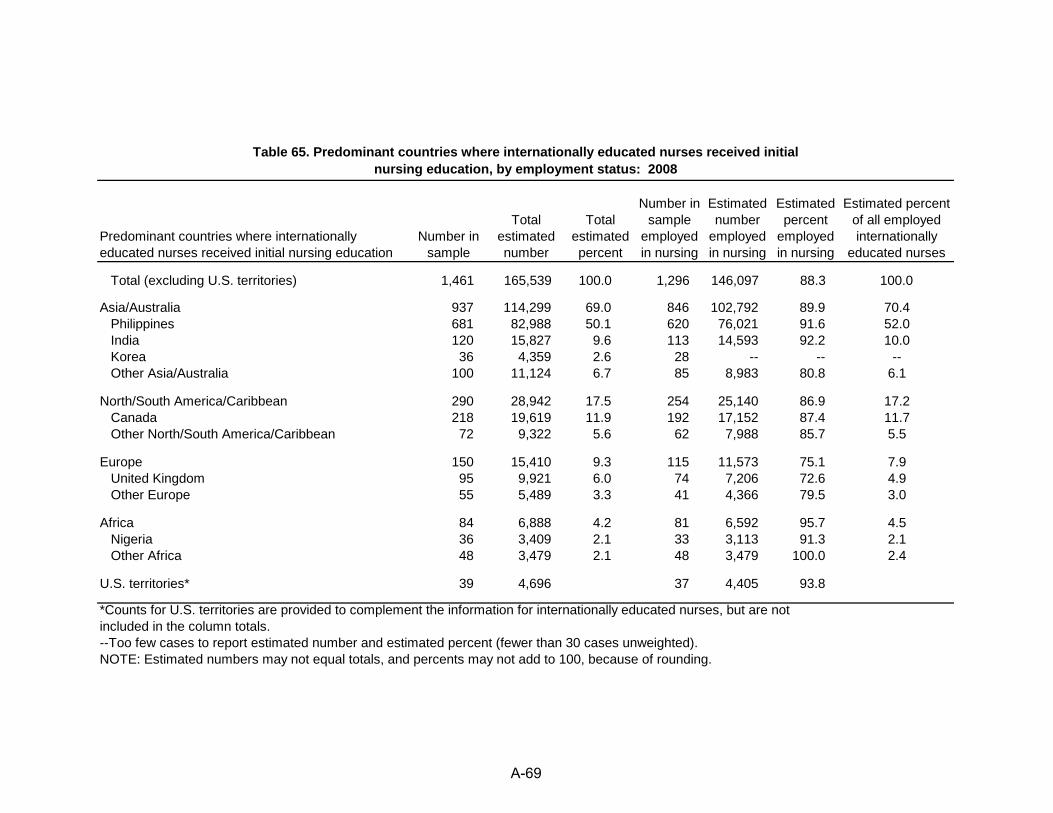
Table 65. Predominant countries where internationally educated nurses received initial nursing education, by employment status: 2008
Predominant countries where internationally educated nurses received initial nursing education
Number in sample
Total estimated number
Total estimated percent
Number in sample
employed in nursing
Estimated number
employed in nursing
Estimated percent
employed in nursing
Estimated percent of all employed internationally
educated nurses
Total (excluding U.S. territories) 1,461 165,539 100.0 1,296 146,097 88.3 100.0
Asia/Australia 937 114,299 69.0 846 102,792 89.9 70.4Philippines 681 82,988 50.1 620 76,021 91.6 52.0India 120 15,827 9.6 113 14,593 92.2 10.0Korea 36 4,359 2.6 28 -- -- --Other Asia/Australia 100 11,124 6.7 85 8,983 80.8 6.1
North/South America/Caribbean 290 28,942 17.5 254 25,140 86.9 17.2Canada 218 19,619 11.9 192 17,152 87.4 11.7Other North/South America/Caribbean 72 9,322 5.6 62 7,988 85.7 5.5
Europe 150 15,410 9.3 115 11,573 75.1 7.9United Kingdom 95 9,921 6.0 74 7,206 72.6 4.9Other Europe 55 5,489 3.3 41 4,366 79.5 3.0
Africa 84 6,888 4.2 81 6,592 95.7 4.5Nigeria 36 3,409 2.1 33 3,113 91.3 2.1Other Africa 48 3,479 2.1 48 3,479 100.0 2.4
U.S. territories* 39 4,696 37 4,405 93.8
*Counts for U.S. territories are provided to complement the information for internationally educated nurses, but are not included in the column totals.--Too few cases to report estimated number and estimated percent (fewer than 30 cases unweighted).NOTE: Estimated numbers may not equal totals, and percents may not add to 100, because of rounding.
A-69
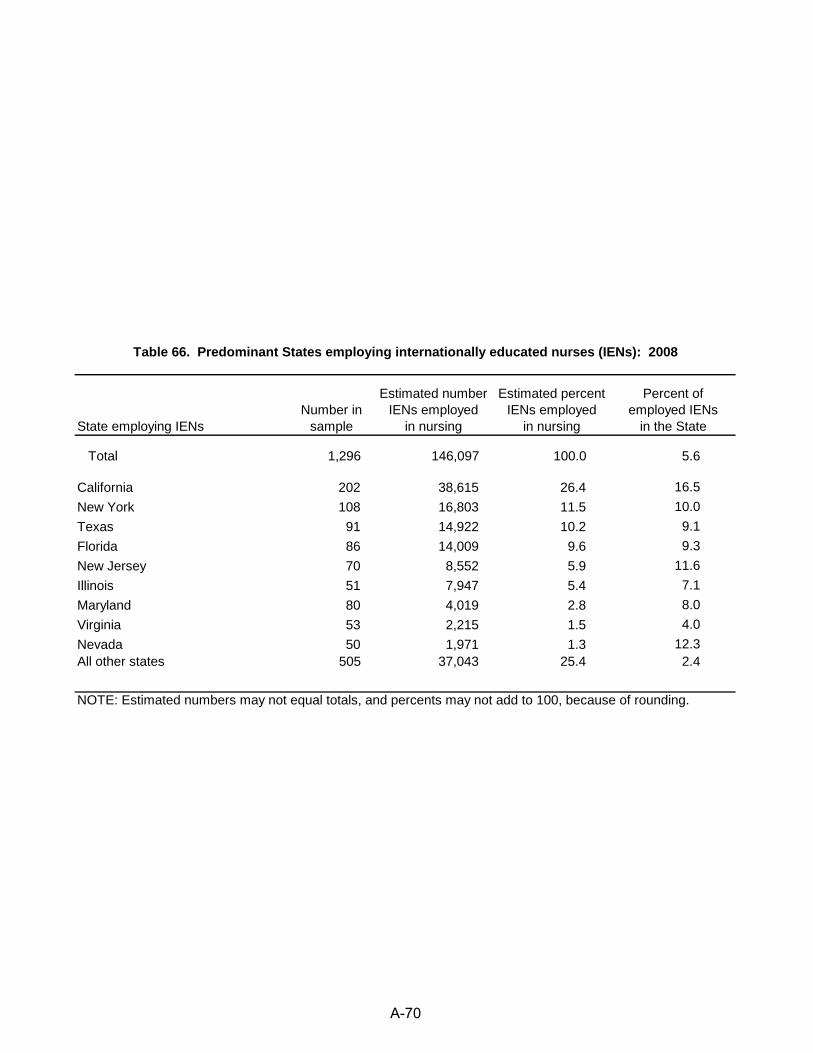
Table 66. Predominant States employing internationally educated nurses (IENs): 2008
State employing IENsNumber in
sample
Estimated number IENs employed
in nursing
Estimated percent IENs employed
in nursing
Percent of employed IENs
in the State
Total 1,296 146,097 100.0 5.6
California 202 38,615 26.4 16.5New York 108 16,803 11.5 10.0Texas 91 14,922 10.2 9.1Florida 86 14,009 9.6 9.3New Jersey 70 8,552 5.9 11.6Illinois 51 7,947 5.4 7.1Maryland 80 4,019 2.8 8.0Virginia 53 2,215 1.5 4.0Nevada 50 1,971 1.3 12.3All other states 505 37,043 25.4 2.4
NOTE: Estimated numbers may not equal totals, and percents may not add to 100, because of rounding.
A-70
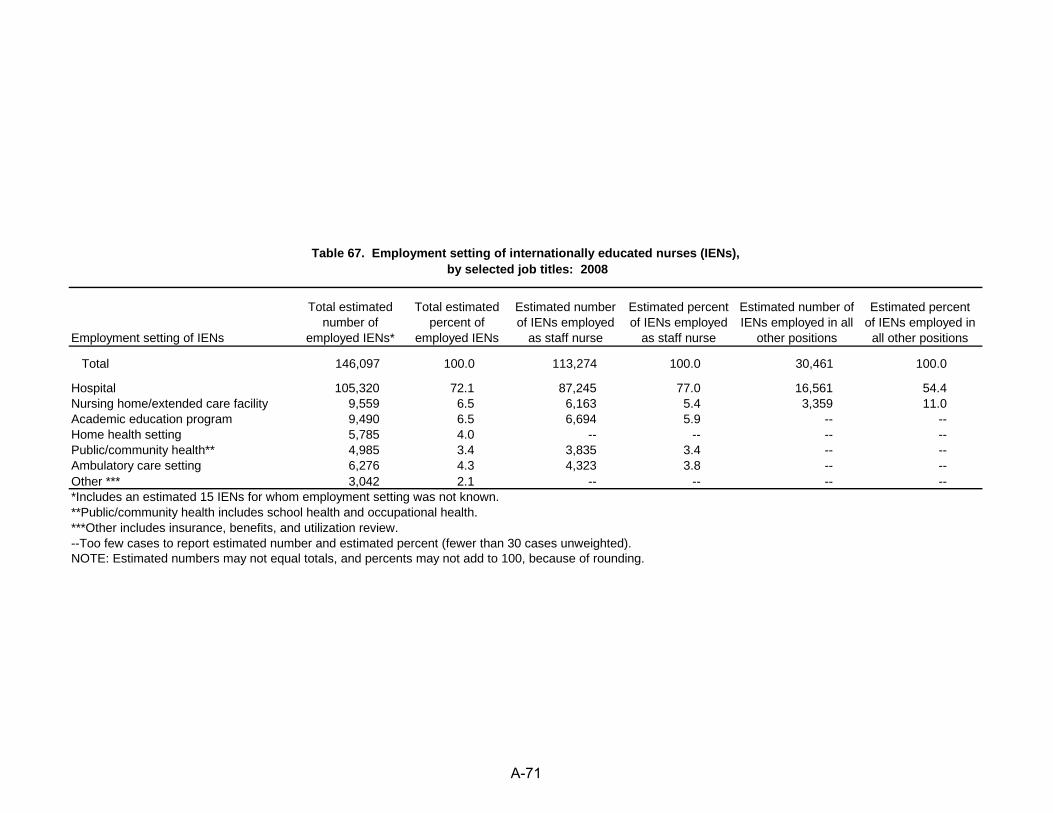
Table 67. Employment setting of internationally educated nurses (IENs), by selected job titles: 2008
Employment setting of IENs
Total estimated number of
employed IENs*
Total estimated percent of
employed IENs
Estimated number of IENs employed
as staff nurse
Estimated percent of IENs employed
as staff nurse
Estimated number of IENs employed in all
other positions
Estimated percent of IENs employed in
all other positions
Total 146,097 100.0 113,274 100.0 30,461 100.0
Hospital 105,320 72.1 87,245 77.0 16,561 54.4Nursing home/extended care facility 9,559 6.5 6,163 5.4 3,359 11.0Academic education program 9,490 6.5 6,694 5.9 -- --Home health setting 5,785 4.0 -- -- -- --Public/community health** 4,985 3.4 3,835 3.4 -- --Ambulatory care setting 6,276 4.3 4,323 3.8 -- --Other *** 3,042 2.1 -- -- -- --*Includes an estimated 15 IENs for whom employment setting was not known.**Public/community health includes school health and occupational health.***Other includes insurance, benefits, and utilization review.--Too few cases to report estimated number and estimated percent (fewer than 30 cases unweighted).NOTE: Estimated numbers may not equal totals, and percents may not add to 100, because of rounding.
A-71

Appendix B
Survey Methodology

Appendix B: Survey Methodology
B.1 Sampling
Since the inception of the National Sample Survey of Registered Nurses (NSSRN), the sample of
Registered Nurses (RNs) was based on a nested cluster design, clustering RNs based on last names.
This last name cluster design is referred to as the alpha-segment design. While the alpha-segment
design helped produce good estimates of the nursing workforce over the years, it has some
shortcomings. Since people of the same racial/ethnic background tended to be clustered within the
same alphabetic clusters of last names, the clustered design resulted in larger than desired variation
for some estimates, most notably the racial and ethnic composition of the RN workforce.
Additionally, constructing the alpha-segment frame and implementing the sample design were
tedious and time-consuming tasks. Sorting to achieve implicit stratification was not feasible, and the
alpha-segment design made adjustments to account for differential nonresponse a bit more
cumbersome.
For the 2008 NSSRN, the Health Resources and Service Administration (HRSA) implemented a
sample design based on independent systematic random samples selected from State-based strata
with equal probability of selection within each stratum. An equal probability systematic random
sample can be thought of as randomly selecting a record from the beginning of a list with probability
1/n and then every nth record after that until all records on the list have had a chance of being
selected. This kind of design was not feasible in 1976, but technological advances and the advent of
electronic recordkeeping have largely eliminated the barriers that existed previously. This design was
straightforward to implement and eliminated the clustering that could contribute undesirably to the
variability of sample estimates, particularly for those associated with race/ethnicity.
B.1.1 Sample Selection
The 2008 NSSRN included a sample of 55,151 RN records.
Systematic random samples of RNs were selected from each of the sample frames established. A
sample frame was developed for each of the 50 States (and the District of Columbia) of those RNs
with currently active licenses in the State. The sample frames were developed from listings obtained
from each of the State licensure boards.
B-1
Appendix B: Survey Methodology
State frames were first partitioned into explicit strata for sample selection purposes. RNs appearing
in sample frame of licensed nurses for more than one State had multiple chances of selection for the
2008 NSSRN. Hence multi-State strata were formed for several groups of States where a relatively
high degree of interstate commuting was expected. Probability matching was used to form such
strata, using only a single record for those RNs found on listings from two or more States in a given
group (for example, a stratum was formed for all RNs with licenses found in New York and New
Jersey, each such RN having only a single record in that stratum). Following are the groupings of
States where such strata were formed:
District of Columbia, Maryland, and Virginia
New York, New Jersey, and Pennsylvania
Arizona, California, and Nevada
Massachusetts, New Hampshire, and Vermont
Delaware, Pennsylvania, and New Jersey
For most of the remaining States, four geographic sampling strata were used: one stratum for the
State itself, and three additional, much smaller, strata. These three strata were for RNs whose
respective residence was listed as Alaska, Hawaii, or New Mexico. These additional strata were
created because nurses working in Federal facilities need not be licensed in the State in which they
work, and such RNs are found at disproportionately high rates in Alaska, Hawaii, and New Mexico.
When sampling for Alaska, Hawaii, and New Mexico, only three total strata were used. Alaska,
Hawaii, and New Mexico strata were also formed for the ―multi-State strata‖ groups listed above.
Prior to sample selection, the sample frame for each stratum was sorted on variables such as age
group, ZIP Code, or other variables. The choice of variables depended on the variables available on
a State’s frame and which among them were of greatest analytic interest or were related to variables
of analytic interest. If a frame was sorted only on one variable, say ZIP Code, then the sample would
have a proportionate or approximately proportionate distribution across the ZIP Codes appearing
on the frame. If a second variable was added, say age group, then within each ZIP Code a
proportionate distribution across age groups would be obtained. Thus, sorting was done to help
achieve a proportionate or approximately proportionate sample distribution across important
variables related to analytic variables of interest, helping to increase the precision of the Survey
estimates.
B-2
Appendix B: Survey Methodology
B.1.2 Final Sample Allocation
Tables B1-1 and B1-2 show the final allocation of sampled RNs across the States where the multi-
State strata mentioned earlier were not established. Table B1-1 is arranged in the order of size of
frame from largest to smallest while Table B1-2 is arranged alphabetically. Table B1-3 shows the
final allocation of RNs across the States where multiple strata were established associated with
neighboring States.
Four columns of numbers are provided for each State or strata: the 2008 State and strata frame size
after unduplication; 2008 sample size after assigning Alaska, Hawaii, and Mexico samples from
different State or strata back to Alaska, Hawaii, and New Mexico; targeted sample size used to set
the sampling rate for the State or stratum; and the difference between the targeted sample size and
the actual sample size.1 Note that for the District of Columbia/Maryland/Virginia strata it was
decided to form strata taking into account whether or not the RN lived in the DC metro area
regardless of which records matched. So summing across strata does not produce unduplicated
totals for the District of Columbia, Maryland, or Virginia separately. Had the Nurse Licensure
Compact (the Compact) State specifications been applied perfectly, there would have been no RNs
found on both the Virginia and Maryland listings. However, there were a few (perhaps due to very
recent residential moves from one State to the other) where synchronization of the licensing to
eliminate the earlier compact license had not yet been achieved.
B.2 Sample Performance
Response rates serve to help assess the quality or unbiasedness of survey results and are often
reported both unweighted and weighted. An unweighted response rate provides an indication of the
degree to which the RNs actually selected for the sample decided to participate in the survey. A
weighted response rate provides an estimate of the propensity to respond to the survey among the
members of the target population generally. A weighted response rate accounts for factors such as
oversampling. For example, for the 2008 NSSRN, RNs have been allocated to the smaller States at
disproportionately high rates (i.e., they have been ―oversampled‖) in order to help achieve adequate
precision for State level estimates for all States.
1 Departures arose due to the relatively few RNs in each State with a residence address of Alaska, Hawaii, or New Mexico
B-3
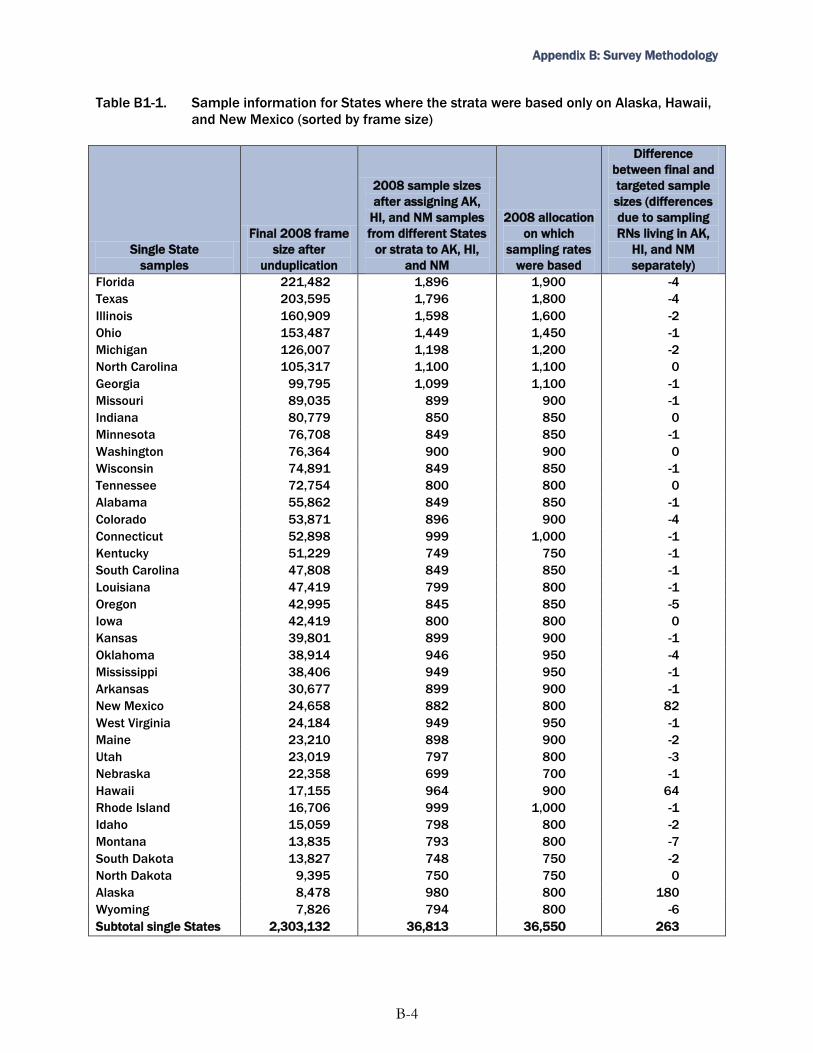
Appendix B: Survey Methodology
Table B1-1. Sample information for States where the strata were based only on Alaska, Hawaii,
and New Mexico (sorted by frame size)
Single State
samples
Final 2008 frame
size after
unduplication
2008 sample sizes
after assigning AK,
HI, and NM samples
from different States
or strata to AK, HI,
and NM
2008 allocation
on which
sampling rates
were based
Difference
between final and
targeted sample
sizes (differences
due to sampling
RNs living in AK,
HI, and NM
separately)
Florida 221,482 1,896 1,900 -4
Texas 203,595 1,796 1,800 -4
Illinois 160,909 1,598 1,600 -2
Ohio 153,487 1,449 1,450 -1
Michigan 126,007 1,198 1,200 -2
North Carolina 105,317 1,100 1,100 0
Georgia 99,795 1,099 1,100 -1
Missouri 89,035 899 900 -1
Indiana 80,779 850 850 0
Minnesota 76,708 849 850 -1
Washington 76,364 900 900 0
Wisconsin 74,891 849 850 -1
Tennessee 72,754 800 800 0
Alabama 55,862 849 850 -1
Colorado 53,871 896 900 -4
Connecticut 52,898 999 1,000 -1
Kentucky 51,229 749 750 -1
South Carolina 47,808 849 850 -1
Louisiana 47,419 799 800 -1
Oregon 42,995 845 850 -5
Iowa 42,419 800 800 0
Kansas 39,801 899 900 -1
Oklahoma 38,914 946 950 -4
Mississippi 38,406 949 950 -1
Arkansas 30,677 899 900 -1
New Mexico 24,658 882 800 82
West Virginia 24,184 949 950 -1
Maine 23,210 898 900 -2
Utah 23,019 797 800 -3
Nebraska 22,358 699 700 -1
Hawaii 17,155 964 900 64
Rhode Island 16,706 999 1,000 -1
Idaho 15,059 798 800 -2
Montana 13,835 793 800 -7
South Dakota 13,827 748 750 -2
North Dakota 9,395 750 750 0
Alaska 8,478 980 800 180
Wyoming 7,826 794 800 -6
Subtotal single States 2,303,132 36,813 36,550 263
B-4
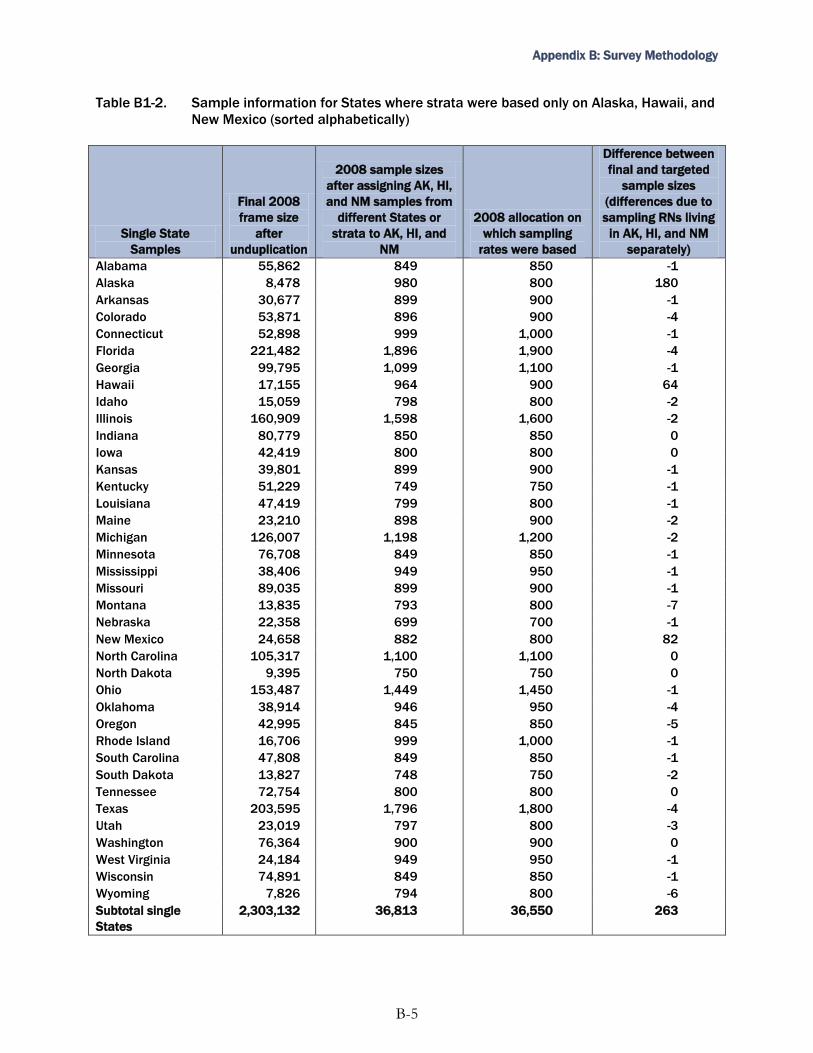
Appendix B: Survey Methodology
Table B1-2. Sample information for States where strata were based only on Alaska, Hawaii, and
New Mexico (sorted alphabetically)
Single State
Samples
Final 2008
frame size
after
unduplication
2008 sample sizes
after assigning AK, HI,
and NM samples from
different States or
strata to AK, HI, and
NM
2008 allocation on
which sampling
rates were based
Difference between
final and targeted
sample sizes
(differences due to
sampling RNs living
in AK, HI, and NM
separately)
Alabama 55,862 849 850 -1
Alaska 8,478 980 800 180
Arkansas 30,677 899 900 -1
Colorado 53,871 896 900 -4
Connecticut 52,898 999 1,000 -1
Florida 221,482 1,896 1,900 -4
Georgia 99,795 1,099 1,100 -1
Hawaii 17,155 964 900 64
Idaho 15,059 798 800 -2
Illinois 160,909 1,598 1,600 -2
Indiana 80,779 850 850 0
Iowa 42,419 800 800 0
Kansas 39,801 899 900 -1
Kentucky 51,229 749 750 -1
Louisiana 47,419 799 800 -1
Maine 23,210 898 900 -2
Michigan 126,007 1,198 1,200 -2
Minnesota 76,708 849 850 -1
Mississippi 38,406 949 950 -1
Missouri 89,035 899 900 -1
Montana 13,835 793 800 -7
Nebraska 22,358 699 700 -1
New Mexico 24,658 882 800 82
North Carolina 105,317 1,100 1,100 0
North Dakota 9,395 750 750 0
Ohio 153,487 1,449 1,450 -1
Oklahoma 38,914 946 950 -4
Oregon 42,995 845 850 -5
Rhode Island 16,706 999 1,000 -1
South Carolina 47,808 849 850 -1
South Dakota 13,827 748 750 -2
Tennessee 72,754 800 800 0
Texas 203,595 1,796 1,800 -4
Utah 23,019 797 800 -3
Washington 76,364 900 900 0
West Virginia 24,184 949 950 -1
Wisconsin 74,891 849 850 -1
Wyoming 7,826 794 800 -6
Subtotal single
States
2,303,132 36,813 36,550 263
B-5
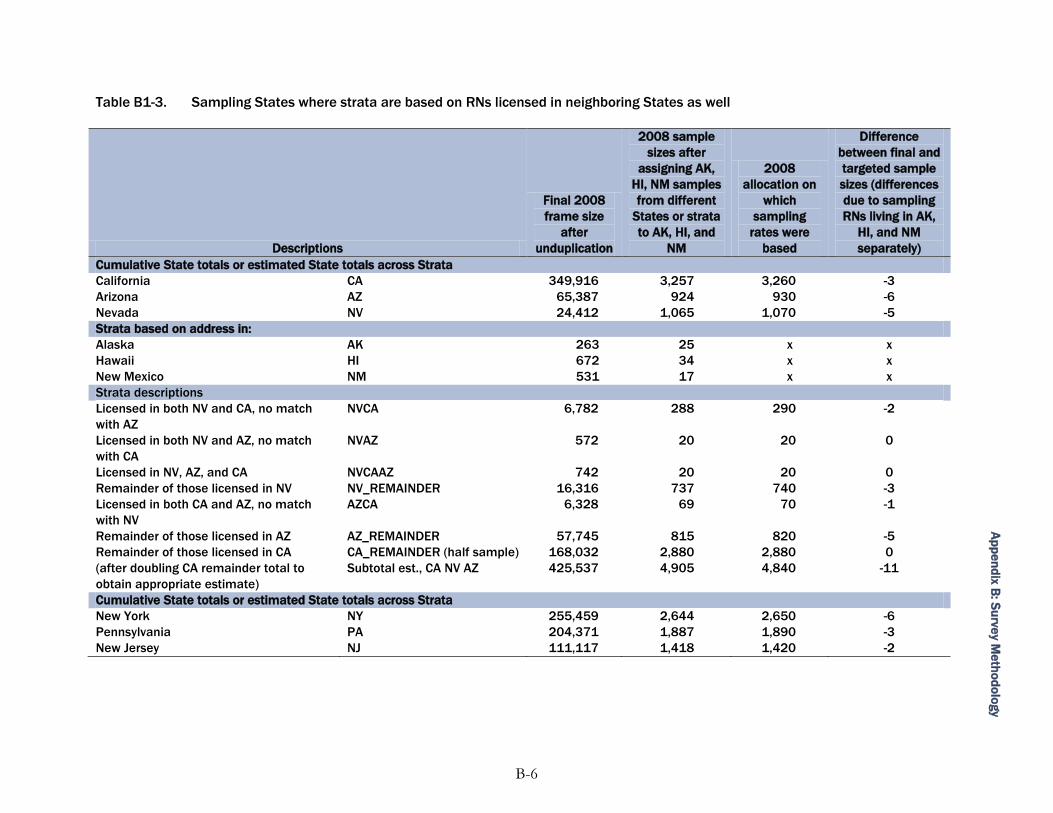
Ap
pe
nd
ix B: S
urve
y Me
tho
do
log
y
Table B1-3. Sampling States where strata are based on RNs licensed in neighboring States as well
Descriptions
Final 2008
frame size
after
unduplication
2008 sample
sizes after
assigning AK,
HI, NM samples
from different
States or strata
to AK, HI, and
NM
2008
allocation on
which
sampling
rates were
based
Difference
between final and
targeted sample
sizes (differences
due to sampling
RNs living in AK,
HI, and NM
separately)
Cumulative State totals or estimated State totals across Strata
California CA 349,916 3,257 3,260 -3
Arizona AZ 65,387 924 930 -6
Nevada NV 24,412 1,065 1,070 -5
Strata based on address in:
Alaska AK 263 25 x x
Hawaii HI 672 34 x x
New Mexico NM 531 17 x x
Strata descriptions
Licensed in both NV and CA, no match
with AZ
NVCA 6,782 288 290 -2
Licensed in both NV and AZ, no match
with CA
NVAZ 572 20 20 0
Licensed in NV, AZ, and CA NVCAAZ 742 20 20 0
Remainder of those licensed in NV NV_REMAINDER 16,316 737 740 -3
Licensed in both CA and AZ, no match
with NV
AZCA 6,328 69 70 -1
Remainder of those licensed in AZ AZ_REMAINDER 57,745 815 820 -5
Remainder of those licensed in CA CA_REMAINDER (half sample) 168,032 2,880 2,880 0
(after doubling CA remainder total to
obtain appropriate estimate)
Subtotal est., CA NV AZ 425,537 4,905 4,840 -11
Cumulative State totals or estimated State totals across Strata
New York NY 255,459 2,644 2,650 -6
Pennsylvania PA 204,371 1,887 1,890 -3
New Jersey NJ 111,117 1,418 1,420 -2
B-6
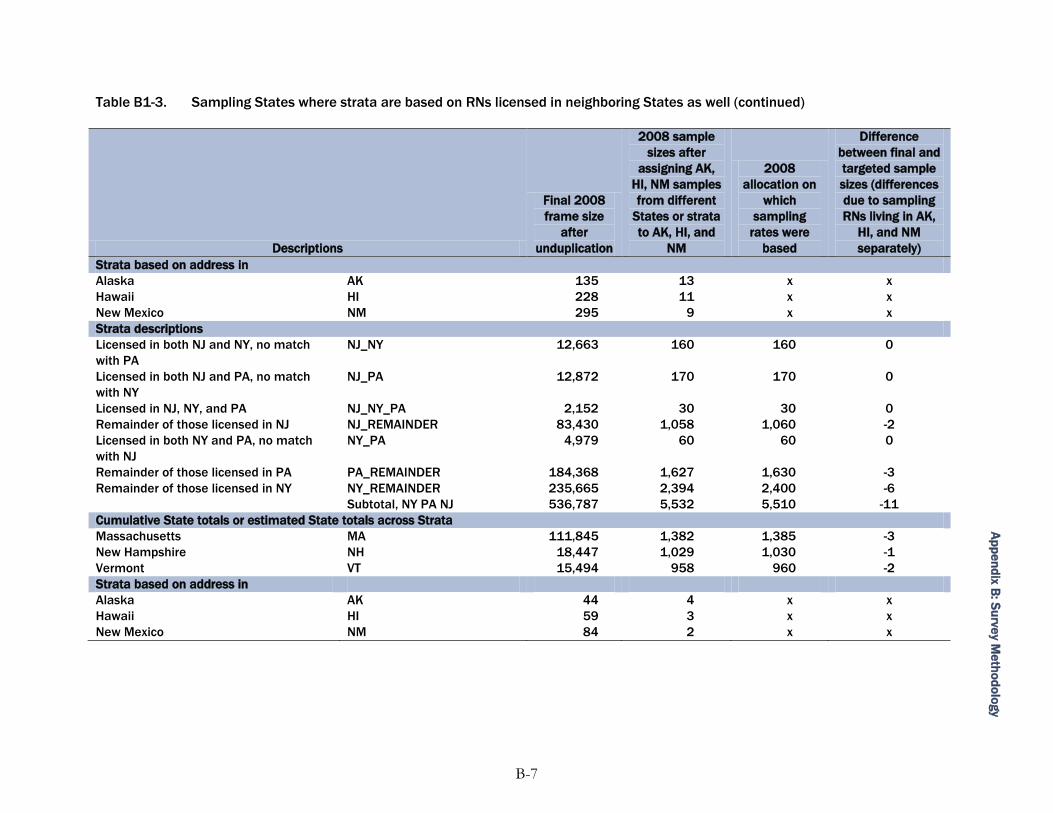
Ap
pe
nd
ix B: S
urve
y Me
tho
do
log
y
Table B1-3. Sampling States where strata are based on RNs licensed in neighboring States as well (continued)
Descriptions
Final 2008
frame size
after
unduplication
2008 sample
sizes after
assigning AK,
HI, NM samples
from different
States or strata
to AK, HI, and
NM
2008
allocation on
which
sampling
rates were
based
Difference
between final and
targeted sample
sizes (differences
due to sampling
RNs living in AK,
HI, and NM
separately)
Strata based on address in
Alaska AK 135 13 x x
Hawaii HI 228 11 x x
New Mexico NM 295 9 x x
Strata descriptions
Licensed in both NJ and NY, no match
with PA
NJ_NY 12,663 160 160 0
Licensed in both NJ and PA, no match
with NY
NJ_PA 12,872 170 170 0
Licensed in NJ, NY, and PA NJ_NY_PA 2,152 30 30 0
Remainder of those licensed in NJ NJ_REMAINDER 83,430 1,058 1,060 -2
Licensed in both NY and PA, no match
with NJ
NY_PA 4,979 60 60 0
Remainder of those licensed in PA PA_REMAINDER 184,368 1,627 1,630 -3
Remainder of those licensed in NY NY_REMAINDER 235,665 2,394 2,400 -6
Subtotal, NY PA NJ 536,787 5,532 5,510 -11
Cumulative State totals or estimated State totals across Strata
Massachusetts MA 111,845 1,382 1,385 -3
New Hampshire NH 18,447 1,029 1,030 -1
Vermont VT 15,494 958 960 -2
Strata based on address in
Alaska AK 44 4 x x
Hawaii HI 59 3 x x
New Mexico NM 84 2 x x
B-7
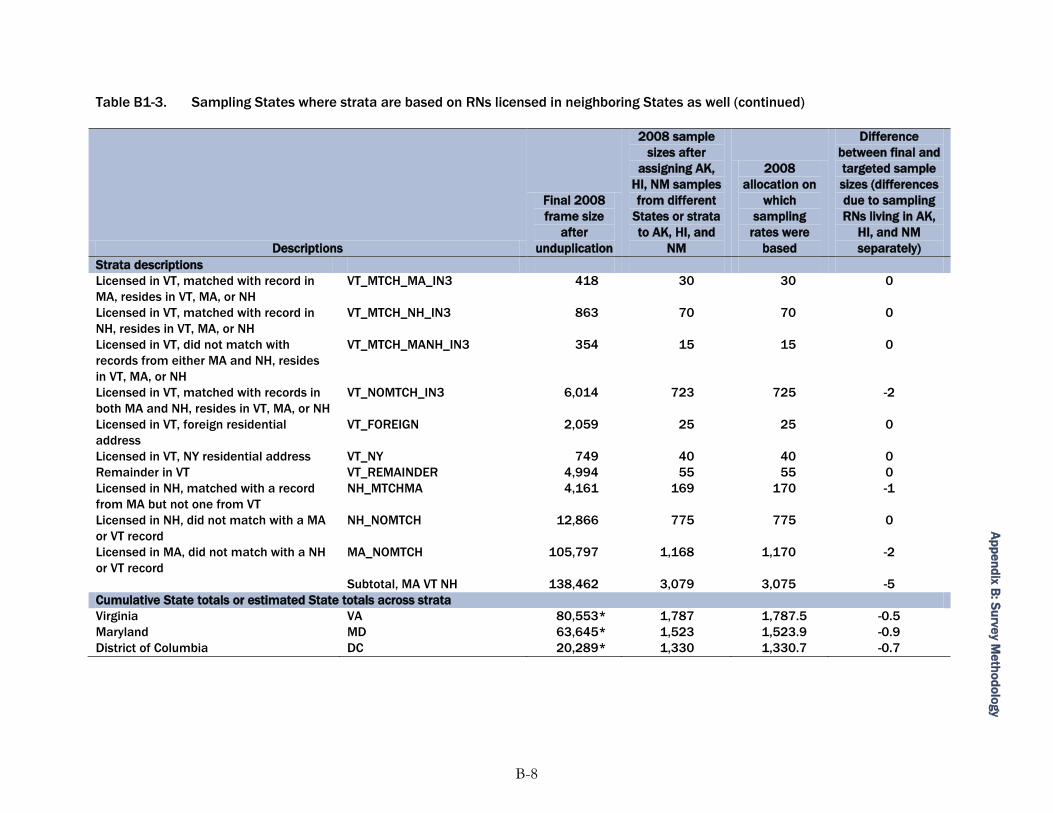
Ap
pe
nd
ix B: S
urve
y Me
tho
do
log
y
Table B1-3. Sampling States where strata are based on RNs licensed in neighboring States as well (continued)
Descriptions
Final 2008
frame size
after
unduplication
2008 sample
sizes after
assigning AK,
HI, NM samples
from different
States or strata
to AK, HI, and
NM
2008
allocation on
which
sampling
rates were
based
Difference
between final and
targeted sample
sizes (differences
due to sampling
RNs living in AK,
HI, and NM
separately)
Strata descriptions
Licensed in VT, matched with record in
MA, resides in VT, MA, or NH
VT_MTCH_MA_IN3 418 30 30 0
Licensed in VT, matched with record in
NH, resides in VT, MA, or NH
VT_MTCH_NH_IN3 863 70 70 0
Licensed in VT, did not match with
records from either MA and NH, resides
in VT, MA, or NH
VT_MTCH_MANH_IN3 354 15 15 0
Licensed in VT, matched with records in
both MA and NH, resides in VT, MA, or NH
VT_NOMTCH_IN3 6,014 723 725 -2
Licensed in VT, foreign residential
address
VT_FOREIGN 2,059 25 25 0
Licensed in VT, NY residential address VT_NY 749 40 40 0
Remainder in VT VT_REMAINDER 4,994 55 55 0
Licensed in NH, matched with a record
from MA but not one from VT
NH_MTCHMA 4,161 169 170 -1
Licensed in NH, did not match with a MA
or VT record
NH_NOMTCH 12,866 775 775 0
Licensed in MA, did not match with a NH
or VT record
MA_NOMTCH 105,797 1,168 1,170 -2
Subtotal, MA VT NH 138,462 3,079 3,075 -5
Cumulative State totals or estimated State totals across strata
Virginia VA 80,553* 1,787 1,787.5 -0.5
Maryland MD 63,645* 1,523 1,523.9 -0.9
District of Columbia DC 20,289* 1,330 1,330.7 -0.7
B-8
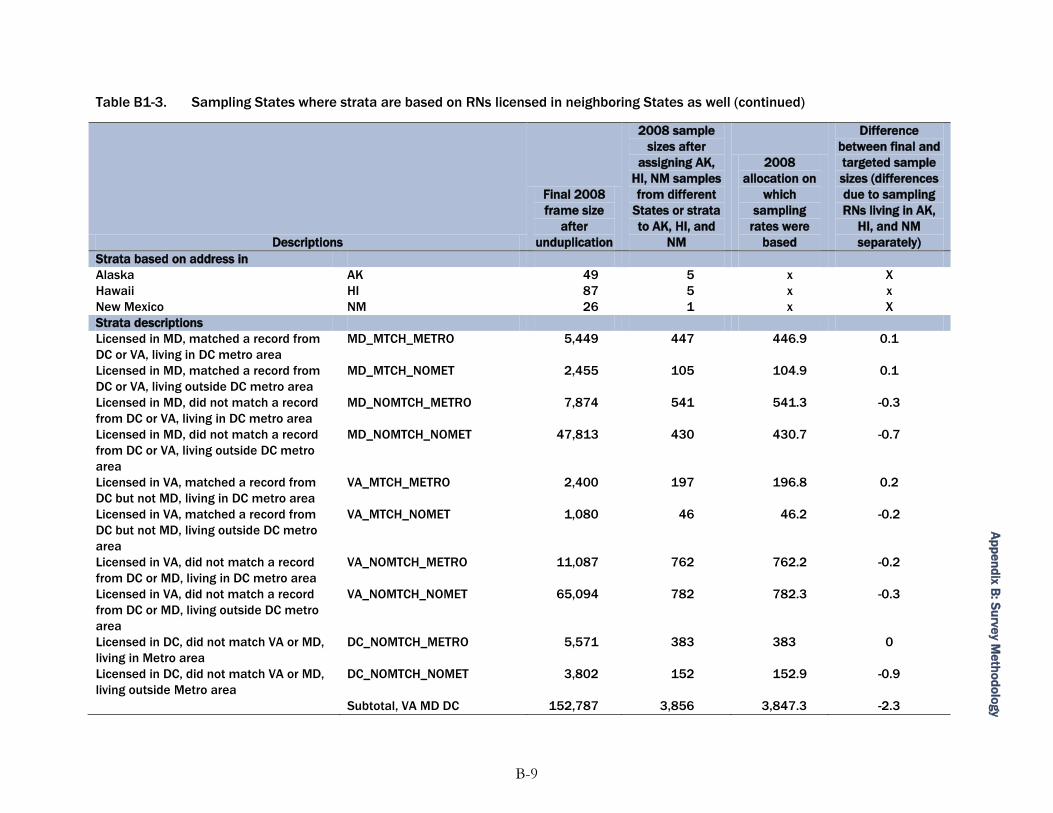
Ap
pe
nd
ix B: S
urve
y Me
tho
do
log
y
Table B1-3. Sampling States where strata are based on RNs licensed in neighboring States as well (continued)
Descriptions
Final 2008
frame size
after
unduplication
2008 sample
sizes after
assigning AK,
HI, NM samples
from different
States or strata
to AK, HI, and
NM
2008
allocation on
which
sampling
rates were
based
Difference
between final and
targeted sample
sizes (differences
due to sampling
RNs living in AK,
HI, and NM
separately)
Strata based on address in
Alaska AK 49 5 x X
Hawaii HI 87 5 x x
New Mexico NM 26 1 x X
Strata descriptions
Licensed in MD, matched a record from
DC or VA, living in DC metro area
MD_MTCH_METRO 5,449 447 446.9 0.1
Licensed in MD, matched a record from
DC or VA, living outside DC metro area
MD_MTCH_NOMET 2,455 105 104.9 0.1
Licensed in MD, did not match a record
from DC or VA, living in DC metro area
MD_NOMTCH_METRO 7,874 541 541.3 -0.3
Licensed in MD, did not match a record
from DC or VA, living outside DC metro
area
MD_NOMTCH_NOMET 47,813 430 430.7 -0.7
Licensed in VA, matched a record from
DC but not MD, living in DC metro area
VA_MTCH_METRO 2,400 197 196.8 0.2
Licensed in VA, matched a record from
DC but not MD, living outside DC metro
area
VA_MTCH_NOMET 1,080 46 46.2 -0.2
Licensed in VA, did not match a record
from DC or MD, living in DC metro area
VA_NOMTCH_METRO 11,087 762 762.2 -0.2
Licensed in VA, did not match a record
from DC or MD, living outside DC metro
area
VA_NOMTCH_NOMET 65,094 782 782.3 -0.3
Licensed in DC, did not match VA or MD,
living in Metro area
DC_NOMTCH_METRO 5,571 383 383 0
Licensed in DC, did not match VA or MD,
living outside Metro area
DC_NOMTCH_NOMET 3,802 152 152.9 -0.9
Subtotal, VA MD DC 152,787 3,856 3,847.3 -2.3
B-9
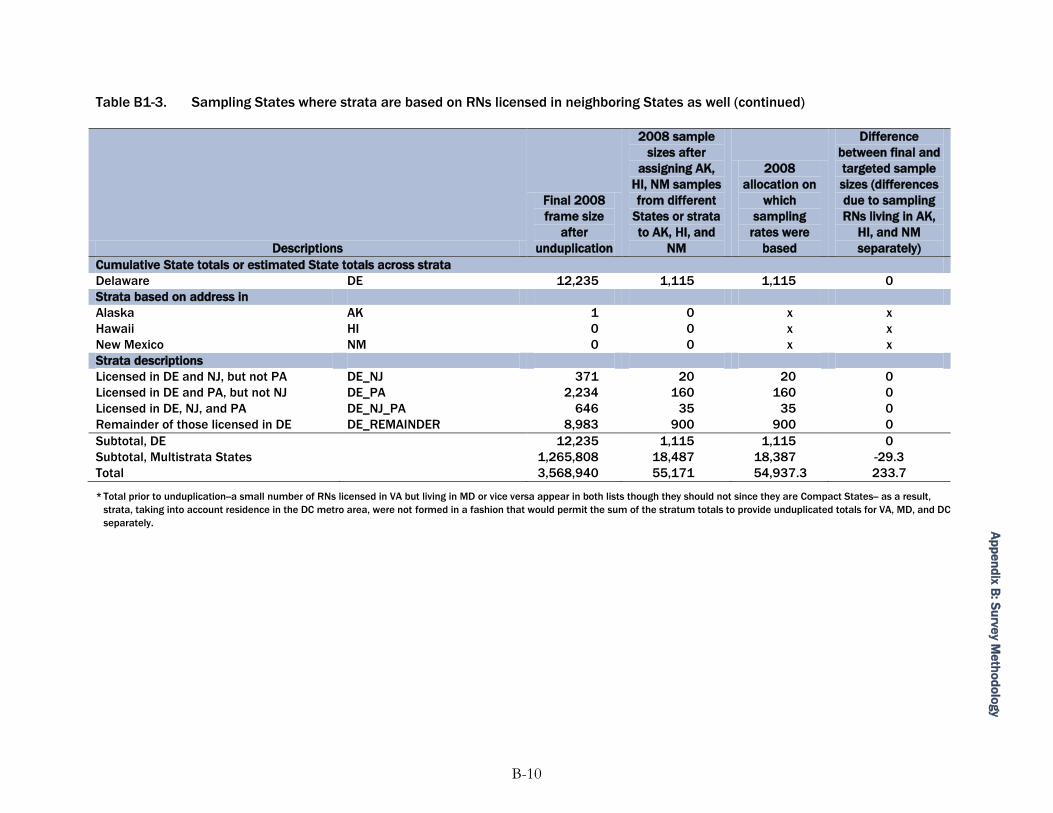
Ap
pe
nd
ix B: S
urve
y Me
tho
do
log
y
Table B1-3. Sampling States where strata are based on RNs licensed in neighboring States as well (continued)
Descriptions
Final 2008
frame size
after
unduplication
2008 sample
sizes after
assigning AK,
HI, NM samples
from different
States or strata
to AK, HI, and
NM
2008
allocation on
which
sampling
rates were
based
Difference
between final and
targeted sample
sizes (differences
due to sampling
RNs living in AK,
HI, and NM
separately)
Cumulative State totals or estimated State totals across strata
Delaware DE 12,235 1,115 1,115 0
Strata based on address in
Alaska AK 1 0 x x
Hawaii HI 0 0 x x
New Mexico NM 0 0 x x
Strata descriptions
Licensed in DE and NJ, but not PA DE_NJ 371 20 20 0
Licensed in DE and PA, but not NJ DE_PA 2,234 160 160 0
Licensed in DE, NJ, and PA DE_NJ_PA 646 35 35 0
Remainder of those licensed in DE DE_REMAINDER 8,983 900 900 0
Subtotal, DE 12,235 1,115 1,115 0
Subtotal, Multistrata States 1,265,808 18,487 18,387 -29.3
Total 3,568,940 55,171 54,937.3 233.7
* Total prior to unduplication--a small number of RNs licensed in VA but living in MD or vice versa appear in both lists though they should not since they are Compact States-- as a result,
strata, taking into account residence in the DC metro area, were not formed in a fashion that would permit the sum of the stratum totals to provide unduplicated totals for VA, MD, and DC
separately.
B-10
Appendix B: Survey Methodology
The overall NSSRN unweighted response rate was 62.41 percent while the overall weighted
response rate was 61.48 percent.2 Response rates varied by State (Table B2-1). Unweighted response
rates ranged from 49.62 percent (New Mexico) to 74.79 percent (Wisconsin), while weighted
response rates ranged from 49.54 percent to 74.87 percent (also for New Mexico and Wisconsin,
respectively). State is defined here as the State licensure file(s) on which the given RN could be
found; RNs appearing in more than one State’s licensure files can contribute to more than one
State’s (weighted and unweighted) response rate.
B.2.1 Vermont Sample Performance
Vermont’s listing of RNs with currently active licenses was partitioned into a number of strata in
order to deal with a variety of issues. These include: RNs licensed in Vermont and either
Massachusetts or New Hampshire, or both; a large number of RNs licensed in Vermont, but living
in foreign countries; and RNs licensed in Vermont but with addresses indicating they are living in
States but not in the immediate vicinity of Vermont. Vermont appears to be somewhat of a gateway
for RNs from foreign countries seeking to become licensed in the United States.
RNs licensed in Vermont with addresses indicating they are living in the United States but not in the
immediate vicinity of Vermont were sampled at a disproportionately low rate for Vermont. It was
considered highly unlikely that this group of RNs would either work or live in Vermont and as a
result, would not contribute to the Vermont estimates. In fact, no RNs who responded from this
latter group did work or live in Vermont, so this sampling strategy appears to have accomplished
what it was intended to: reduce the expenditure of survey resources on records not likely to
contribute to estimates for groups of analytic interest for Vermont estimates.
Among RNs licensed in Vermont, living in the United States but not in the immediate vicinity, the
response rates were low. From among 49 sampled RNs, only 13 completed the 2008 NSSRN,
yielding a response rate of roughly 25 percent. The reason for the low response rate for this
particular group is uncertain. While this portion of the Vermont sample was small, it had a dramatic
impact on the weighted response rate for RNs sampled from among those licensed in Vermont.
2 The American Association for Public Opinion Research Response Rate #3 calculation was used; it is defined as the number of completed surveys
divided by the number of returned surveys (complete plus partial) plus an estimate of the number of eligible cases among those who did not respond
and whose eligibility could not be ascertained.
B-11
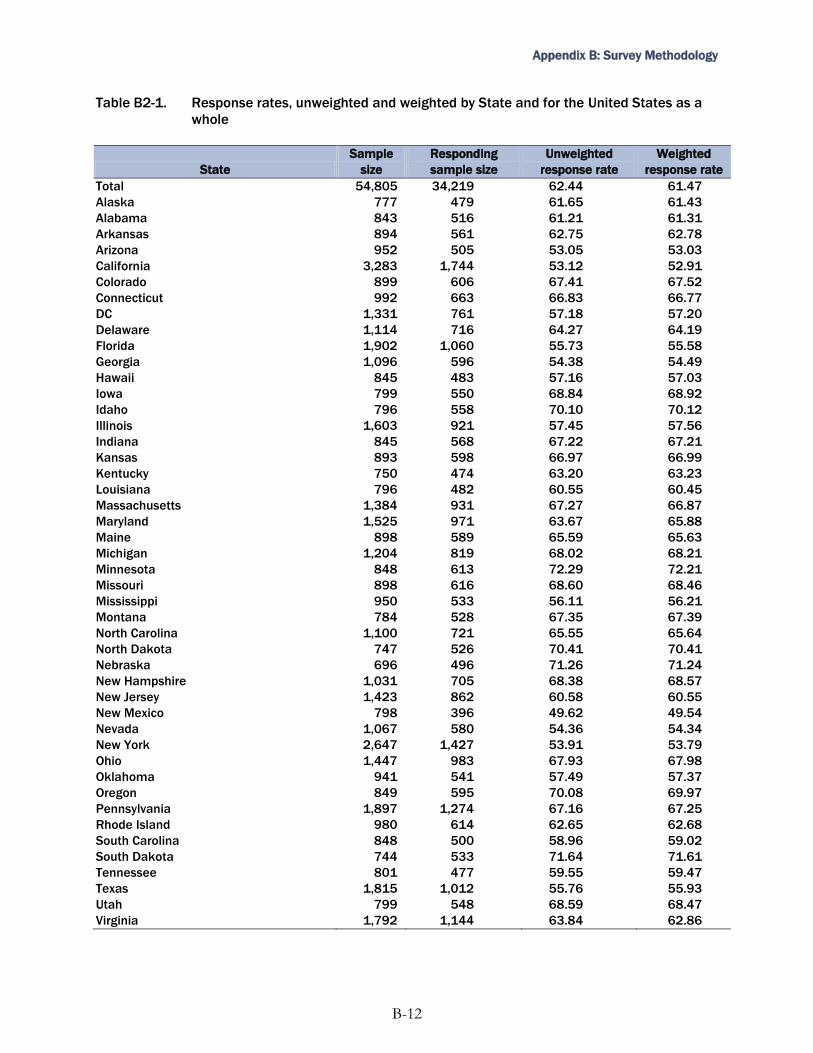
Appendix B: Survey Methodology
Table B2-1. Response rates, unweighted and weighted by State and for the United States as a
whole
State
Sample
size
Responding
sample size
Unweighted
response rate
Weighted
response rate
Total 54,805 34,219 62.44 61.47
Alaska 777 479 61.65 61.43
Alabama 843 516 61.21 61.31
Arkansas 894 561 62.75 62.78
Arizona 952 505 53.05 53.03
California 3,283 1,744 53.12 52.91
Colorado 899 606 67.41 67.52
Connecticut 992 663 66.83 66.77
DC 1,331 761 57.18 57.20
Delaware 1,114 716 64.27 64.19
Florida 1,902 1,060 55.73 55.58
Georgia 1,096 596 54.38 54.49
Hawaii 845 483 57.16 57.03
Iowa 799 550 68.84 68.92
Idaho 796 558 70.10 70.12
Illinois 1,603 921 57.45 57.56
Indiana 845 568 67.22 67.21
Kansas 893 598 66.97 66.99
Kentucky 750 474 63.20 63.23
Louisiana 796 482 60.55 60.45
Massachusetts 1,384 931 67.27 66.87
Maryland 1,525 971 63.67 65.88
Maine 898 589 65.59 65.63
Michigan 1,204 819 68.02 68.21
Minnesota 848 613 72.29 72.21
Missouri 898 616 68.60 68.46
Mississippi 950 533 56.11 56.21
Montana 784 528 67.35 67.39
North Carolina 1,100 721 65.55 65.64
North Dakota 747 526 70.41 70.41
Nebraska 696 496 71.26 71.24
New Hampshire 1,031 705 68.38 68.57
New Jersey 1,423 862 60.58 60.55
New Mexico 798 396 49.62 49.54
Nevada 1,067 580 54.36 54.34
New York 2,647 1,427 53.91 53.79
Ohio 1,447 983 67.93 67.98
Oklahoma 941 541 57.49 57.37
Oregon 849 595 70.08 69.97
Pennsylvania 1,897 1,274 67.16 67.25
Rhode Island 980 614 62.65 62.68
South Carolina 848 500 58.96 59.02
South Dakota 744 533 71.64 71.61
Tennessee 801 477 59.55 59.47
Texas 1,815 1,012 55.76 55.93
Utah 799 548 68.59 68.47
Virginia 1,792 1,144 63.84 62.86
B-12
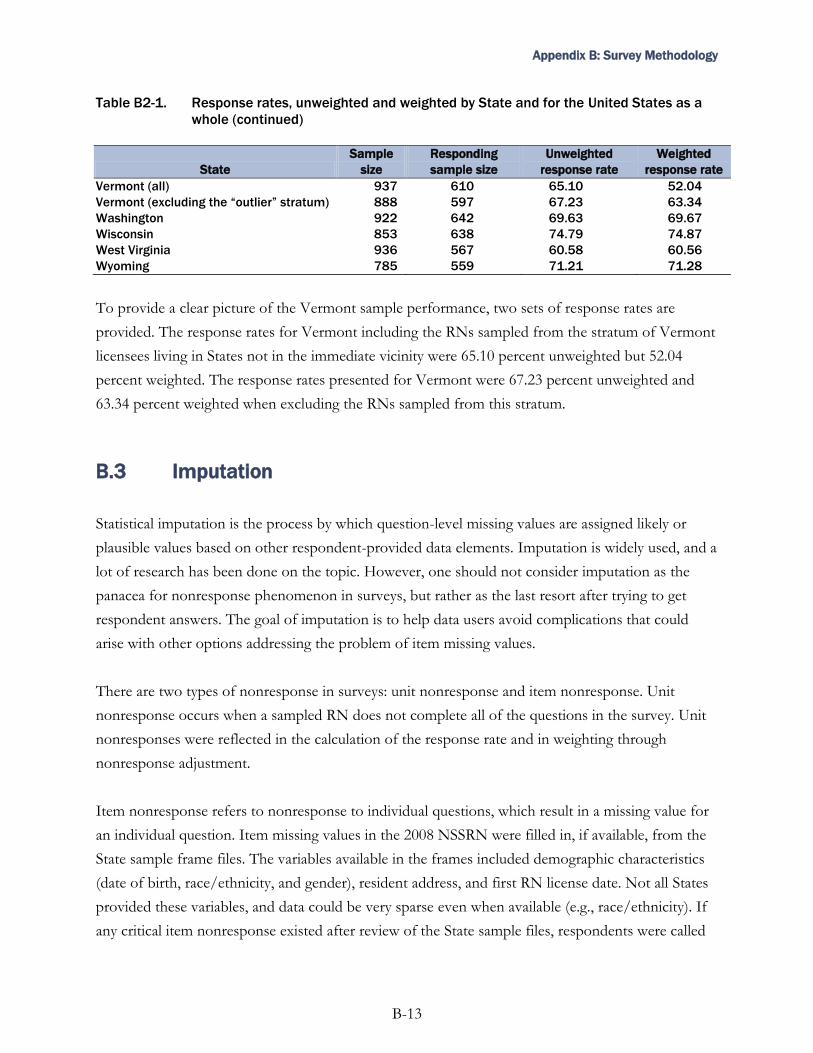
Appendix B: Survey Methodology
Table B2-1. Response rates, unweighted and weighted by State and for the United States as a
whole (continued)
State
Sample
size
Responding
sample size
Unweighted
response rate
Weighted
response rate
Vermont (all) 937 610 65.10 52.04
Vermont (excluding the “outlier” stratum) 888 597 67.23 63.34
Washington 922 642 69.63 69.67
Wisconsin 853 638 74.79 74.87
West Virginia 936 567 60.58 60.56
Wyoming 785 559 71.21 71.28
To provide a clear picture of the Vermont sample performance, two sets of response rates are
provided. The response rates for Vermont including the RNs sampled from the stratum of Vermont
licensees living in States not in the immediate vicinity were 65.10 percent unweighted but 52.04
percent weighted. The response rates presented for Vermont were 67.23 percent unweighted and
63.34 percent weighted when excluding the RNs sampled from this stratum.
B.3 Imputation
Statistical imputation is the process by which question-level missing values are assigned likely or
plausible values based on other respondent-provided data elements. Imputation is widely used, and a
lot of research has been done on the topic. However, one should not consider imputation as the
panacea for nonresponse phenomenon in surveys, but rather as the last resort after trying to get
respondent answers. The goal of imputation is to help data users avoid complications that could
arise with other options addressing the problem of item missing values.
There are two types of nonresponse in surveys: unit nonresponse and item nonresponse. Unit
nonresponse occurs when a sampled RN does not complete all of the questions in the survey. Unit
nonresponses were reflected in the calculation of the response rate and in weighting through
nonresponse adjustment.
Item nonresponse refers to nonresponse to individual questions, which result in a missing value for
an individual question. Item missing values in the 2008 NSSRN were filled in, if available, from the
State sample frame files. The variables available in the frames included demographic characteristics
(date of birth, race/ethnicity, and gender), resident address, and first RN license date. Not all States
provided these variables, and data could be very sparse even when available (e.g., race/ethnicity). If
any critical item nonresponse existed after review of the State sample files, respondents were called
B-13
Appendix B: Survey Methodology
and queried about the missing data item(s). The process of calling respondents to fill in item
nonresponse is referred to as data retrieval. For item nonresponse that persisted after review of the
sample frame file, data cleaning and data retrieval, as a last resort, statistical imputation was used to
assign values.
To improve response rates, a short form of the questionnaire was adapted for the telephone
interview. The short form included all the questionnaire items deemed necessary to obtain a
completed survey. Questions not asked in the short form were designated as missing and imputed.
However, it should be noted that these contribute to a small percentage of missing values and do
not compromise the integrity of the data.
B.3.1 Imputation Methods
In using an imputation procedure, one tries to obtain the best value for the missing case instead of
picking an arbitrary value to fill in the missing. Regression modeling is very useful in this process. If
a strong regression model is available for a particular variable with missing values, good imputed
values can be generated using the model. For example, a registered nurse’s year of graduation from
initial nursing education and year of first licensure are highly correlated. If the year of licensure is
missing, but not the year of graduation, the missing year of licensure value can be imputed using the
predicted value of the year of licensure. This is done by a regression model with the year of licensure
as the dependent variable and the year of graduation as the independent (or predictor) variable—the
possible value for the year of licensure is predicted using the regression model and the predictor
variable, year of graduation. The regression model can be estimated from respondent cases with
nonmissing year of licensure and year of graduation. The regression model can be improved by
using more predictor variables.
To avoid nonsensical values, donor imputation is used. Regression modeling is used to facilitate the
donor imputation procedure. Donor imputation is a popular technique whereby a donor cell is
selected and the donor’s value is donated or copied to the missing (recipient) case on a cell by cell
basis. If donor and recipients are selected randomly, the procedure is known as hot-deck imputation.
Hot-deck imputation was used extensively for the 2008 NSSRN data.
B-14
Appendix B: Survey Methodology
B.3.2 Procedures
Sometimes, missing values can be precisely deduced. For example, if variables A and B are
percentages that are supposed to be summed to 100. If A is present and B is missing, then B should
be (100 – A). Such imputation is called deterministic imputation. This step was included in data
cleaning and not discussed here.
The majority of missing values however, cannot be deduced with certainty. These missing values are
prime candidates for statistical imputation.
Imputation was not attempted for some variables because imputation was unnecessary or
impractical (such as the ―Other Specify‖ variables). The ―other-specify‖ variables were not imputed,
not because their imputation was too difficult, but because nonmissing answers were unique in the
sense that the respondents could not find appropriate answers among the common categories
provided in the questionnaire and their answers were individualistic so that using them as donors for
missing cases does not make sense. Further, some variables were simply too difficult to impute
coherently while maintaining complex inter-relationships with other variables, such as employment
setting, job title, upgrade education, and preparation for advanced practice RNs.
Variables that were not statistically imputed for 2008 NSSRN include the following:
Survey eligibility and nursing employment status (questions 1, 19, and 21). These items were considered essential for survey completion and therefore did not have missing values;
Address fields except State in questions 55, 59, and 61;
Licensure and certification detail (questions 70A, 70B, 70C, and 70D);
All ―other-specify‖ variables and their leading questions;
Education upgrades (questions13E_A through 13E_J);
All subitems in the question series about preparation as a nurse practitioner, clinical nurse specialist, nurse midwife and nurse anesthetist (questions 14, 14A, 14B, 14C, 14D, 14E, 14E2, 14F, 14F2, and 14G);
Employment setting (question 23);
Job title (question 24);
B-15
Appendix B: Survey Methodology
Level of care (question 29A);
Patient population served (question 29B); and
Clinical specialty; (question 29C).
Lastly, while questions 30, 37, and 49 (the three salary variables) were imputed, some cases still have
missing values for these three variables. Imputation could not provide a logical value for these cases.
So, even though they were imputed, there are still some missing values for these three variables.
The imputation procedures can be summarized as follows:
1. Impute data for items using a preliminary hot deck imputation that respects skip patterns;
2. Build a regression model for each variable to be imputed through stepwise regression modeling starting with all available predictors;
3. Re-impute data using predictive means matching, through grouping similar regression predicted values, again respecting skip patterns; and
4. Cycle through steps 2 and 3 until convergence criteria are met for all the variables or the maximum number of iterations specified is reached.
B.3.3 Results and Implications on Variance Estimates
For each imputed variable a conditional imputation rate was computed. Conditional rate is defined
as the ratio of the number of imputed applicable cases by the total number of applicable cases in the
data set. The conditional rate allows the analyst to see impact of imputation on data analysis.
Eighty percent of the imputed variables for the 2008 NSSRN have imputation rates below 10
percent (Table B3-1), 19 percent are borderline (imputation rate of 10-19 percent), and three
variables (1 percent) have an imputation rate greater than 20 percent. The three variables are:
question 11B—total number of hours provided for emergency preparedness training in the past year
(imputation rate: 46 percent); question 13D_A—year receiving an upgrade Associate Degree in
Nursing (ADN) (imputation rate: 36 percent); and question 41—years until planned return to paid
work in nursing (imputation rate: 21 percent). When these variables are analyzed, the analyst should
be aware of the potential underestimation of the variance and bias in the point estimates.
B-16
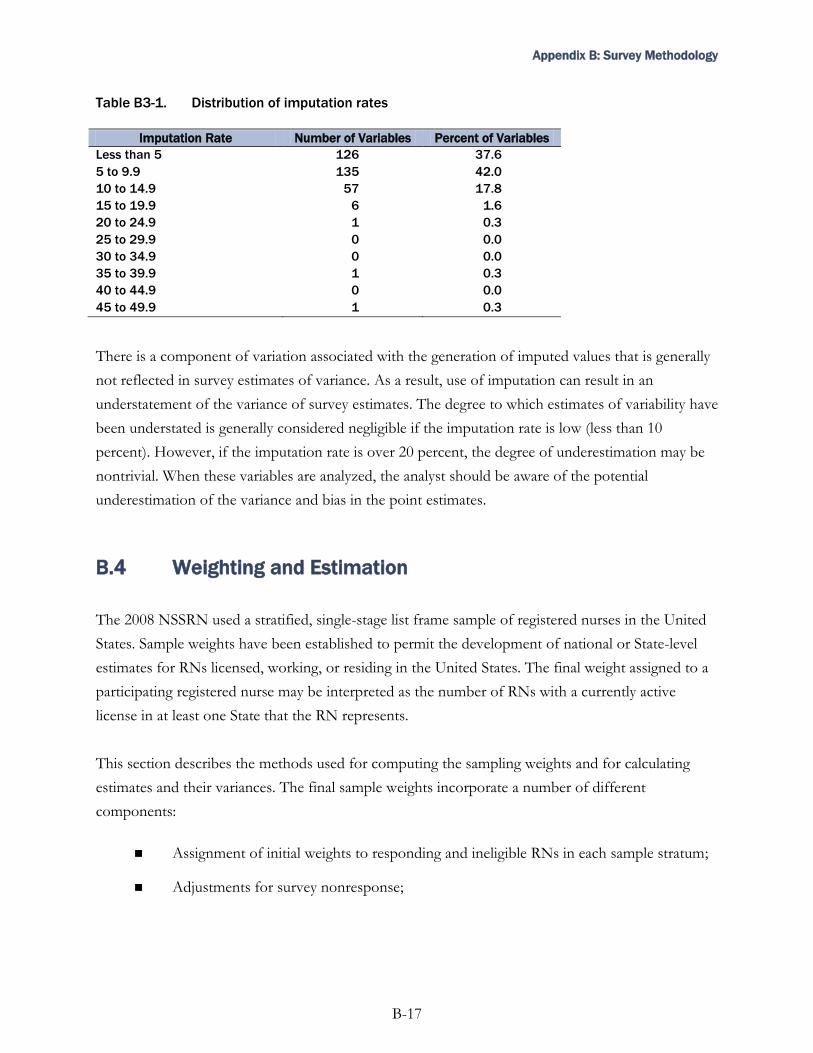
Appendix B: Survey Methodology
Table B3-1. Distribution of imputation rates
Imputation Rate Number of Variables Percent of Variables
Less than 5 126 37.6
5 to 9.9 135 42.0
10 to 14.9 57 17.8
15 to 19.9 6 1.6
20 to 24.9 1 0.3
25 to 29.9 0 0.0
30 to 34.9 0 0.0
35 to 39.9 1 0.3
40 to 44.9 0 0.0
45 to 49.9 1 0.3
There is a component of variation associated with the generation of imputed values that is generally
not reflected in survey estimates of variance. As a result, use of imputation can result in an
understatement of the variance of survey estimates. The degree to which estimates of variability have
been understated is generally considered negligible if the imputation rate is low (less than 10
percent). However, if the imputation rate is over 20 percent, the degree of underestimation may be
nontrivial. When these variables are analyzed, the analyst should be aware of the potential
underestimation of the variance and bias in the point estimates.
B.4 Weighting and Estimation
The 2008 NSSRN used a stratified, single-stage list frame sample of registered nurses in the United
States. Sample weights have been established to permit the development of national or State-level
estimates for RNs licensed, working, or residing in the United States. The final weight assigned to a
participating registered nurse may be interpreted as the number of RNs with a currently active
license in at least one State that the RN represents.
This section describes the methods used for computing the sampling weights and for calculating
estimates and their variances. The final sample weights incorporate a number of different
components:
Assignment of initial weights to responding and ineligible RNs in each sample stratum;
Adjustments for survey nonresponse;
B-17
Appendix B: Survey Methodology
Adjustments to reflect multiple chances for selection; and
Adjustments to achieve agreement with State totals of number of RNs licensed.
Survey estimates can be obtained by applying the final sample weights to records representing the
eligible responding RNs. Corresponding estimates of variability (standard errors or confidence
intervals) can be obtained through the use of 100 jackknife replicate weights developed for this
purpose.
B.4.1 Sample Weighting
The 2008 NSSRN weighting process consisted of several steps. The first few steps involved the use
of records at the ―sampled license‖ level. The sampled license level reflects the original unit of
sample selection that was a record on the list of RNs with currently active licenses. Thus, for these
initial steps, any RN sampled multiple times (due to the holding of licenses in multiple States) will
have several records associated with her/him. After completion of the adjustments at the sampled
license level, any RN sampled multiple times had her/his records ―folded‖ into a single record,
producing a database with a single record representing each RN who participated in the 2008
NSSRN.
The weighting process can be described as follows:
Determination of the initially assigned weights at the sampled license level;
Adjustment for survey nonresponse by age group (for strata where age was available);
Assignment of factors to account for multiple opportunities for selection (determined as part of a matching effort to determine the number of sample frames on which an RN appeared);
Establishing an initial weight at the RN level; and
Iterative Raking procedures to converge on State and national totals.
Each step is described in more detail below.
B-18
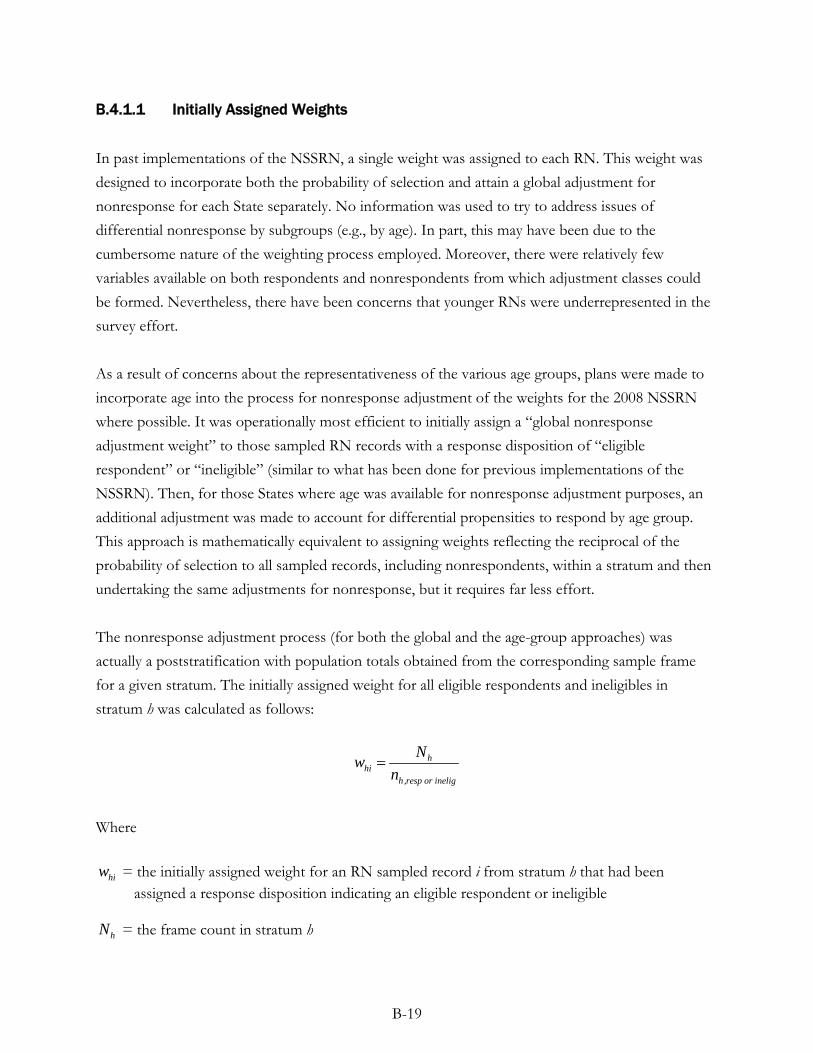
B.4.1.1 Initially Assigned Weights
In past implementations of the NSSRN, a single weight was assigned to each RN. This weight was designed to incorporate both the probability of selection and attain a global adjustment for nonresponse for each State separately. No information was used to try to address issues of differential nonresponse by subgroups (e.g., by age). In part, this may have been due to the cumbersome nature of the weighting process employed. Moreover, there were relatively few variables available on both respondents and nonrespondents from which adjustment classes could be formed. Nevertheless, there have been concerns that younger RNs were underrepresented in the survey effort.
As a result of concerns about the representativeness of the various age groups, plans were made to incorporate age into the process for nonresponse adjustment of the weights for the 2008 NSSRN where possible. It was operationally most efficient to initially assign a “global nonresponse adjustment weight” to those sampled RN records with a response disposition of “eligible respondent” or “ineligible” (similar to what has been done for previous implementations of the NSSRN). Then, for those States where age was available for nonresponse adjustment purposes, an additional adjustment was made to account for differential propensities to respond by age group. This approach is mathematically equivalent to assigning weights reflecting the reciprocal of the probability of selection to all sampled records, including nonrespondents, within a stratum and then undertaking the same adjustments for nonresponse, but it requires far less effort.
The nonresponse adjustment process (for both the global and the age-group approaches) was actually a poststratification with population totals obtained from the corresponding sample frame for a given stratum. The initially assigned weight for all eligible respondents and ineligibles in stratum h was calculated as follows:
whi =Nh
nh,resp or inelig
Where
whi = the initially assigned weight for an RN sampled record i from stratum h that had been assigned a response disposition indicating an eligible respondent or ineligible
Nh = the frame count in stratum h
B-19
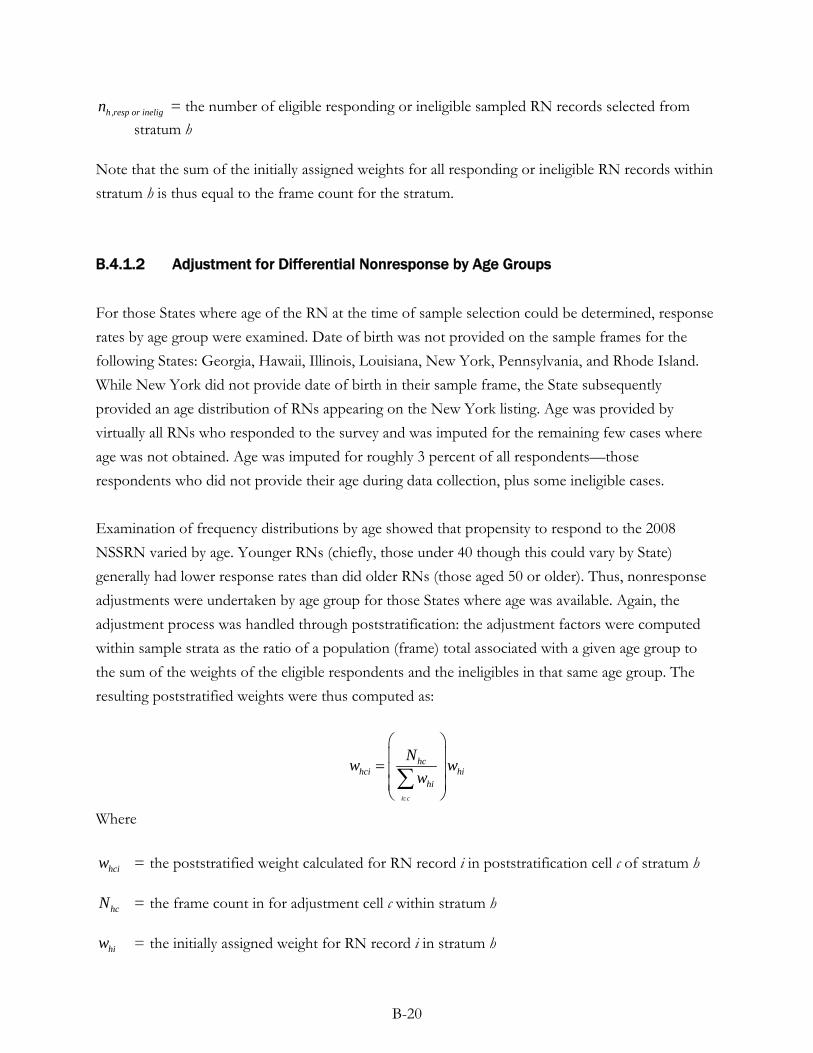
nh,resp or inelig = the number of eligible responding or ineligible sampled RN records selected from stratum h
Note that the sum of the initially assigned weights for all responding or ineligible RN records within stratum h is thus equal to the frame count for the stratum.
B.4.1.2 Adjustment for Differential Nonresponse by Age Groups
For those States where age of the RN at the time of sample selection could be determined, response rates by age group were examined. Date of birth was not provided on the sample frames for the following States: Georgia, Hawaii, Illinois, Louisiana, New York, Pennsylvania, and Rhode Island. While New York did not provide date of birth in their sample frame, the State subsequently provided an age distribution of RNs appearing on the New York listing. Age was provided by virtually all RNs who responded to the survey and was imputed for the remaining few cases where age was not obtained. Age was imputed for roughly 3 percent of all respondents—those respondents who did not provide their age during data collection, plus some ineligible cases.
Examination of frequency distributions by age showed that propensity to respond to the 2008 NSSRN varied by age. Younger RNs (chiefly, those under 40 though this could vary by State) generally had lower response rates than did older RNs (those aged 50 or older). Thus, nonresponse adjustments were undertaken by age group for those States where age was available. Again, the adjustment process was handled through poststratification: the adjustment factors were computed within sample strata as the ratio of a population (frame) total associated with a given age group to the sum of the weights of the eligible respondents and the ineligibles in that same age group. The resulting poststratified weights were thus computed as:
hci =Nhc
hi∑whii c
w w
∈
⎛ ⎞⎜ ⎟⎜ ⎟⎜ ⎟⎝ ⎠
Where
whci = the poststratified weight calculated for RN record i in poststratification cell c of stratum h
Nhc = the frame count in for adjustment cell c within stratum h
whi = the initially assigned weight for RN record i in stratum h
B-20
The poststratification cells c within each stratum were defined by age.
For those States where age was not available (with one exception discussed below), the initially assigned weight was simply retained.
Note that for the purposes of computing adjustments for differential nonresponse by age, RN records selected from strata associated with residence in Alaska, Hawaii, or New Mexico (regardless of the State frame from which they were sampled) were treated as if they were sampled from a single stratum associated with Alaska, Hawaii, and New Mexico, respectively. (Please see Section B.1 for a discussion of the strata associated with Alaska, Hawaii and New Mexico).
As described in Section B.1 on Sampling, the New York sample frame was partitioned into strata representing overlap between the New Jersey and Pennsylvania frames. New Jersey records included date of birth, so those RNs licensed in both New York and New Jersey already had their weights adjusted for nonresponse. The focus of the nonresponse adjustment here was for those RNs who were licensed in New York but not New Jersey, which represented about 92 percent of all records on the New York frame.
For such RNs who responded or were ineligible and that were sampled from a stratum which included New York licensees but not those from New Jersey, estimates of the number of RNs in two age-based adjustment cells (“under 40” and “41 or older”) were developed and served as control totals for the poststratification process so that the weights of eligible responding and ineligible RNs were calibrated to match the cell estimates. Since there was a bit more uncertainty associated with the New York poststratification (estimates of the control totals had to be developed and a few records had imputed ages), it was decided to use only two cells, thus simplifying the poststratification process and limiting the opportunities for misclassification which would be a potential source of bias. It was expected that the gains in reducing the potential for bias due to differential nonresponse would be greater than the potential for bias arising from any misclassification that might be incurred.
Upon completion of this poststratification process, the sum of the resulting weights for all responding or ineligible cases within a stratum equaled the frame counts for each stratum, and, if summed within age groups for the States where age adjustments were possible, corresponded to frame counts by age group as well.
B-21

B.4.1.3 Adjustment to Account for Multiple Chances of Selection
An extensive effort was undertaken to identify the number of sample frames on which a selected RN appeared, and thus, the number of chances that an RN had to be sampled. To appropriately account for this probability of selection in the development of the sample weight, a factor Hi was
established indicating the number of different strata in which RN i appeared, whether or not he or she happened to be sampled from a given frame. This factor can be used to implement the “generalized weight share method” described by Lavallee (2007). Lohr (2010) provides an illustrative example of this method in the form of a textbook problem. The weight adjustment is simply the reciprocal of Hi . It is multiplied by the nonresponse adjusted weight associated with each eligible responding or ineligible RN sampled record (license) i to produce the “penultimate” weight wp ,i
(the “final weight at the sampled RN record” level—responding RNs sampled from multiple strata will have a different “final” weight associated with each sampled record, with each weight depending on the stratum from which the record was sampled):
w wp,i =1
Hihci
⎛ ⎞⎜ ⎟⎝ ⎠
B.4.1.4 Establishing a Sample Weight for Each Registered Nurse
The final sample weight is at the RN level. That is, each eligible responding RN receives a single weight, regardless of the number of times he or she was sampled. Up to this point the weighting process was at the level of (RN) sampled record(s) (licenses). To obtain a single weight wj for each RN j , the weights wp ,i for all sampled license records i associated with the same RN j were summed. This serves as the initial RN level weight wj (prior to raking) and was calculated as
follows:
w wj =∑ p ,ii j∈
The sum over all of the RN level weights wj across all States provides an estimate of the number of
registered nurses in the nation who appear on at least one sample frame used in sampling. Thus, it represents an estimate of all RNs with currently active licenses in the United States, plus a relatively small number of RNs who previously had active licenses and have had them lapse, but who have not been purged from the State files of licensed RNs. This national estimate of the number of unique
B-22
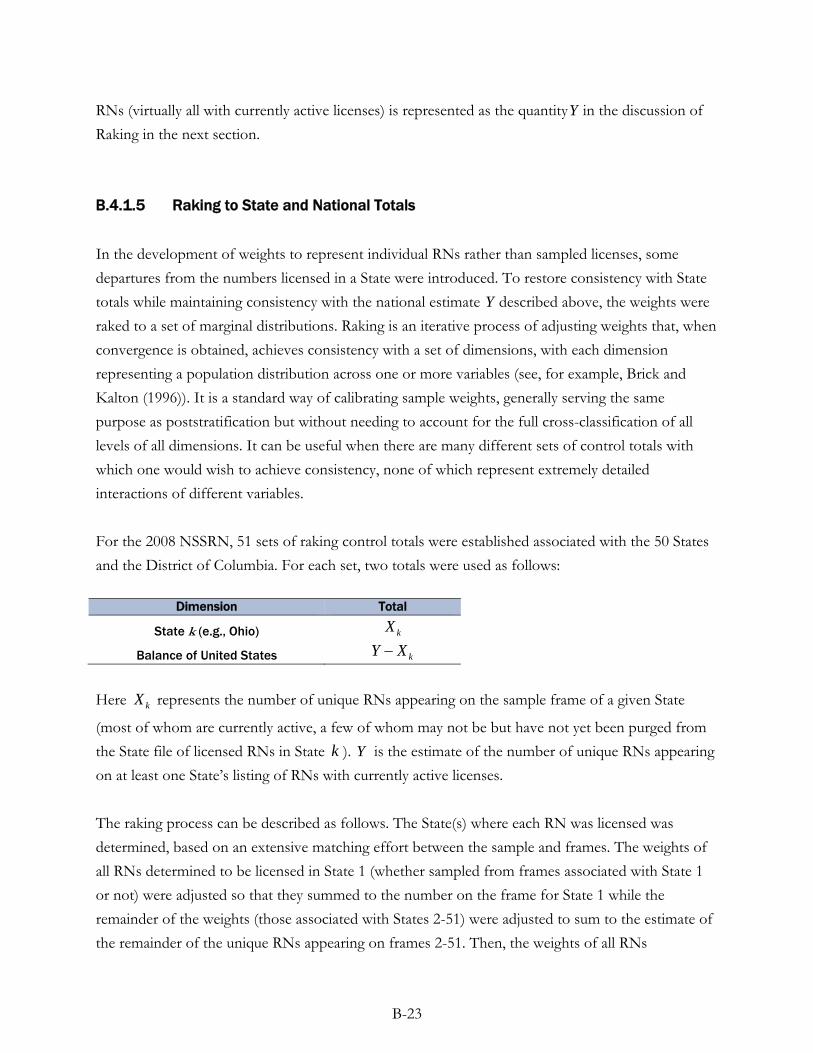
RNs (virtually all with currently active licenses) is represented as the quantityY in the discussion of Raking in the next section.
B.4.1.5 Raking to State and National Totals
In the development of weights to represent individual RNs rather than sampled licenses, some departures from the numbers licensed in a State were introduced. To restore consistency with State totals while maintaining consistency with the national estimate Y described above, the weights were raked to a set of marginal distributions. Raking is an iterative process of adjusting weights that, when convergence is obtained, achieves consistency with a set of dimensions, with each dimension representing a population distribution across one or more variables (see, for example, Brick and Kalton (1996)). It is a standard way of calibrating sample weights, generally serving the same purpose as poststratification but without needing to account for the full cross-classification of all levels of all dimensions. It can be useful when there are many different sets of control totals with which one would wish to achieve consistency, none of which represent extremely detailed interactions of different variables.
For the 2008 NSSRN, 51 sets of raking control totals were established associated with the 50 States and the District of Columbia. For each set, two totals were used as follows:
Dimension Total
State k (e.g., Ohio) Xk
Balance of United States Y X k−
Here Xk represents the number of unique RNs appearing on the sample frame of a given State
(most of whom are currently active, a few of whom may not be but have not yet been purged from the State file of licensed RNs in State k ). Y is the estimate of the number of unique RNs appearing on at least one State’s listing of RNs with currently active licenses.
The raking process can be described as follows. The State(s) where each RN was licensed was determined, based on an extensive matching effort between the sample and frames. The weights of all RNs determined to be licensed in State 1 (whether sampled from frames associated with State 1 or not) were adjusted so that they summed to the number on the frame for State 1 while the remainder of the weights (those associated with States 2-51) were adjusted to sum to the estimate of the remainder of the unique RNs appearing on frames 2-51. Then, the weights of all RNs
B-23
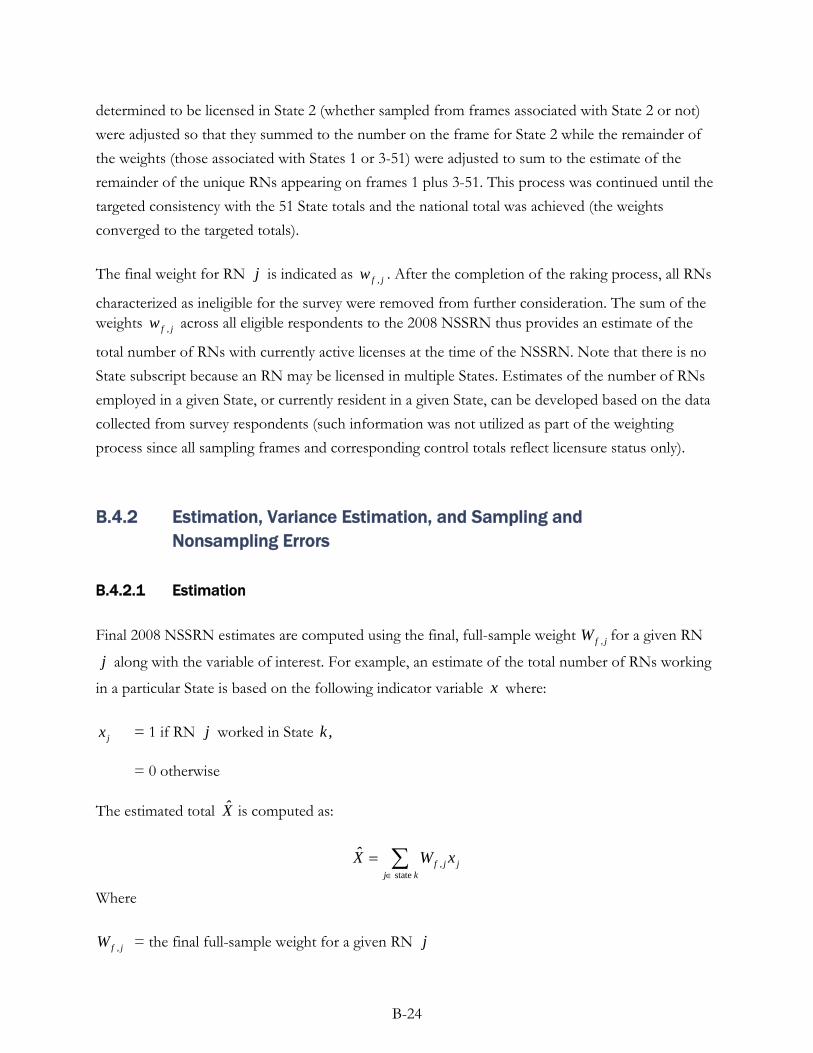
determined to be licensed in State 2 (whether sampled from frames associated with State 2 or not) were adjusted so that they summed to the number on the frame for State 2 while the remainder of the weights (those associated with States 1 or 3-51) were adjusted to sum to the estimate of the remainder of the unique RNs appearing on frames 1 plus 3-51. This process was continued until the targeted consistency with the 51 State totals and the national total was achieved (the weights converged to the targeted totals).
The final weight for RN j is indicated as wf , j . After the completion of the raking process, all RNs
characterized as ineligible for the survey were removed from further consideration. The sum of the weights wf , j across all eligible respondents to the 2008 NSSRN thus provides an estimate of the
total number of RNs with currently active licenses at the time of the NSSRN. Note that there is no State subscript because an RN may be licensed in multiple States. Estimates of the number of RNs employed in a given State, or currently resident in a given State, can be developed based on the data collected from survey respondents (such information was not utilized as part of the weighting process since all sampling frames and corresponding control totals reflect licensure status only).
B.4.2 Estimation, Variance Estimation, and Sampling and Nonsampling Errors
B.4.2.1 Estimation
Final 2008 NSSRN estimates are computed using the final, full-sample weight Wf , j for a given RN
j along with the variable of interest. For example, an estimate of the total number of RNs working
in a particular State is based on the following indicator variable x where:
xj = 1 if RN j worked in State k,
= 0 otherwise
The estimated total X̂ is computed as:
X̂ W= ∑j∈ state k
f , j x j
Where
Wf , j = the final full-sample weight for a given RN j
B-24
Estimates of ratios and averages are obtained as the ratio of estimated totals, where the estimated totals are defined as given above (for averages the estimated total in the denominator will be determined as a sum of weights).
B.4.2.2 Variance Estimation
The 2008 NSSRN, as with previous administrations of the NSSRN, is considered a complex sample survey. To avoid concerns of bias, estimates of variance must be developed that fully reflect the sample design and sample weighting. One such approach is Jackknife replication (Wolter, 2007), which has been used for the 2008 NSSRN as well as for previous NSSRNs.
Variance estimation using the jackknife approach requires the weights for the full sample and a set of replicate weights using standard procedures for identifying and computing replicate weights. Each replicate weight is based on a subsample of the full NSSRN sample. The variability of an estimate is measured as the variation of the estimates obtained from the replicate subsamples about the estimate based on the full sample weight. For the 2008 NSSRN, 100 replicate weights were constructed. This is a substantial increase over the 20 replicate weights obtained under the previous NSSRN sample design (the alpha segment approach) and thus provides more degrees of freedom for variance estimation.
The variance of estimate y is estimated as follows using the jackknife replication method of variance estimation developed for the 2008 NSSRN:
Var ( )y = −100
∑m=1
( ym y )2
Where
y = an estimated total obtained using the full sample weight
and
ym = an estimated total obtained using replicate weight m
There are many widely available software packages such as SUDAAN, WesVar, and Stata that permit the development of variance estimates using replicate weights.
B-25
B.4.2.3 Sampling and Nonsampling Errors
Given reasonably large sample sizes, relatively precise estimates of the licensed RN population of the United States can be made because of the underlying probability sample. However, several sources of error can cause sample estimates to differ from the true population values. These sources of error are commonly classified as sampling errors and nonsampling errors. Each of these sources of error is briefly described.
Sampling Error
Sample survey estimates are subject to variation. This error is known as sampling error and is the consequence of not measuring every unit in the population. Sampling error is measurable, however, and can be reduced with larger sample sizes and more efficient sample designs. Sample design elements that increase variances of estimates are variation in sampling rates and clustering of the sample. In the 2008 NSSRN, in order to increase precision for estimation purposes at the State level, variation in sampling rates arose between States. Sampling rates for smaller States were generally larger than sampling rates for larger States. Rates also varied between strata within a State for the small percentage who were:
In a State frame and also resident of Alaska, New Mexico, or Hawaii; and
Members of the groups of States where multi-State strata were developed.
The sampling error of an estimate is measured as its variance or standard error (the square root of the variance.) Given the 100 replicate weights and the roughly 100 degrees of freedom thus available, the probability is approximately 95 percent that the statistic of interest differs from the true population value by not more than 1.96 standard errors.
Specifically, a 95 percent confidence interval for an estimate x can be constructed as:
x .±1 96σ x
where
σ x = the estimated standard error of x .
B-26
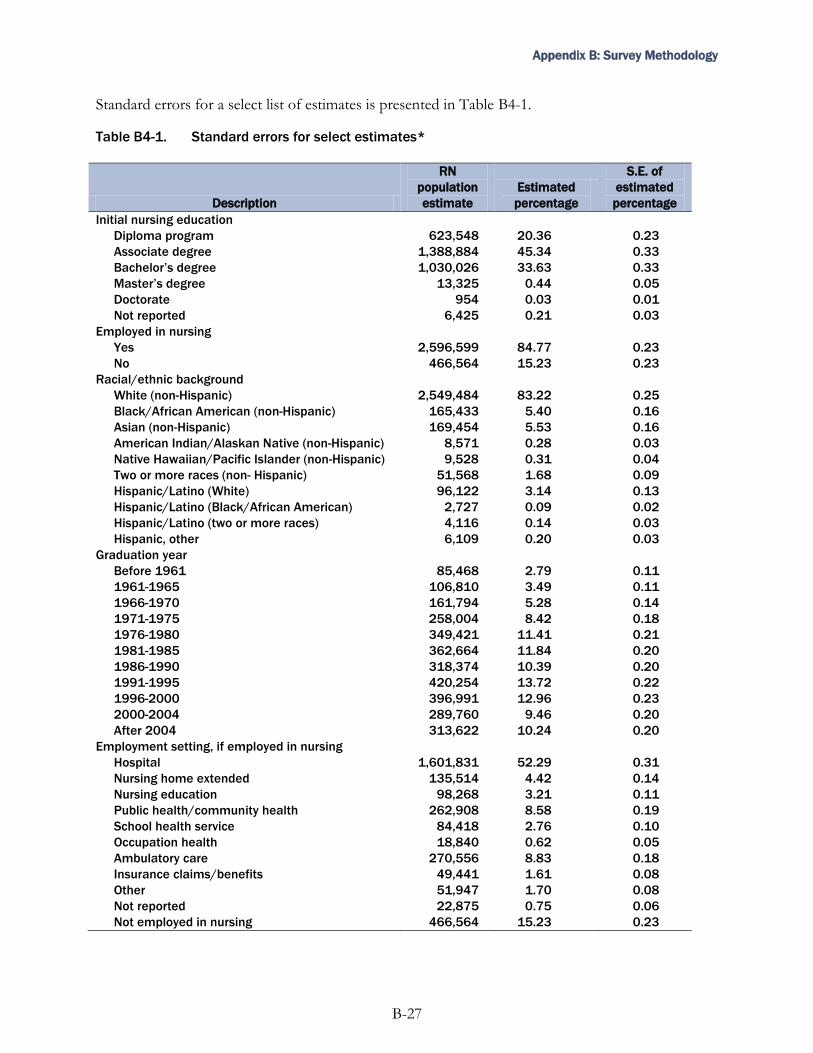
Appendix B: Survey Methodology
Standard errors for a select list of estimates is presented in Table B4-1.
Table B4-1. Standard errors for select estimates*
Description
RN
population
estimate
Estimated
percentage
S.E. of
estimated
percentage
Initial nursing education
Diploma program 623,548 20.36 0.23
Associate degree 1,388,884 45.34 0.33
Bachelor’s degree 1,030,026 33.63 0.33
Master’s degree 13,325 0.44 0.05
Doctorate 954 0.03 0.01
Not reported 6,425 0.21 0.03
Employed in nursing
Yes 2,596,599 84.77 0.23
No 466,564 15.23 0.23
Racial/ethnic background
White (non-Hispanic) 2,549,484 83.22 0.25
Black/African American (non-Hispanic) 165,433 5.40 0.16
Asian (non-Hispanic) 169,454 5.53 0.16
American Indian/Alaskan Native (non-Hispanic) 8,571 0.28 0.03
Native Hawaiian/Pacific Islander (non-Hispanic) 9,528 0.31 0.04
Two or more races (non- Hispanic) 51,568 1.68 0.09
Hispanic/Latino (White) 96,122 3.14 0.13
Hispanic/Latino (Black/African American) 2,727 0.09 0.02
Hispanic/Latino (two or more races) 4,116 0.14 0.03
Hispanic, other 6,109 0.20 0.03
Graduation year
Before 1961 85,468 2.79 0.11
1961-1965 106,810 3.49 0.11
1966-1970 161,794 5.28 0.14
1971-1975 258,004 8.42 0.18
1976-1980 349,421 11.41 0.21
1981-1985 362,664 11.84 0.20
1986-1990 318,374 10.39 0.20
1991-1995 420,254 13.72 0.22
1996-2000 396,991 12.96 0.23
2000-2004 289,760 9.46 0.20
After 2004 313,622 10.24 0.20
Employment setting, if employed in nursing
Hospital 1,601,831 52.29 0.31
Nursing home extended 135,514 4.42 0.14
Nursing education 98,268 3.21 0.11
Public health/community health 262,908 8.58 0.19
School health service 84,418 2.76 0.10
Occupation health 18,840 0.62 0.05
Ambulatory care 270,556 8.83 0.18
Insurance claims/benefits 49,441 1.61 0.08
Other 51,947 1.70 0.08
Not reported 22,875 0.75 0.06
Not employed in nursing 466,564 15.23 0.23
B-27
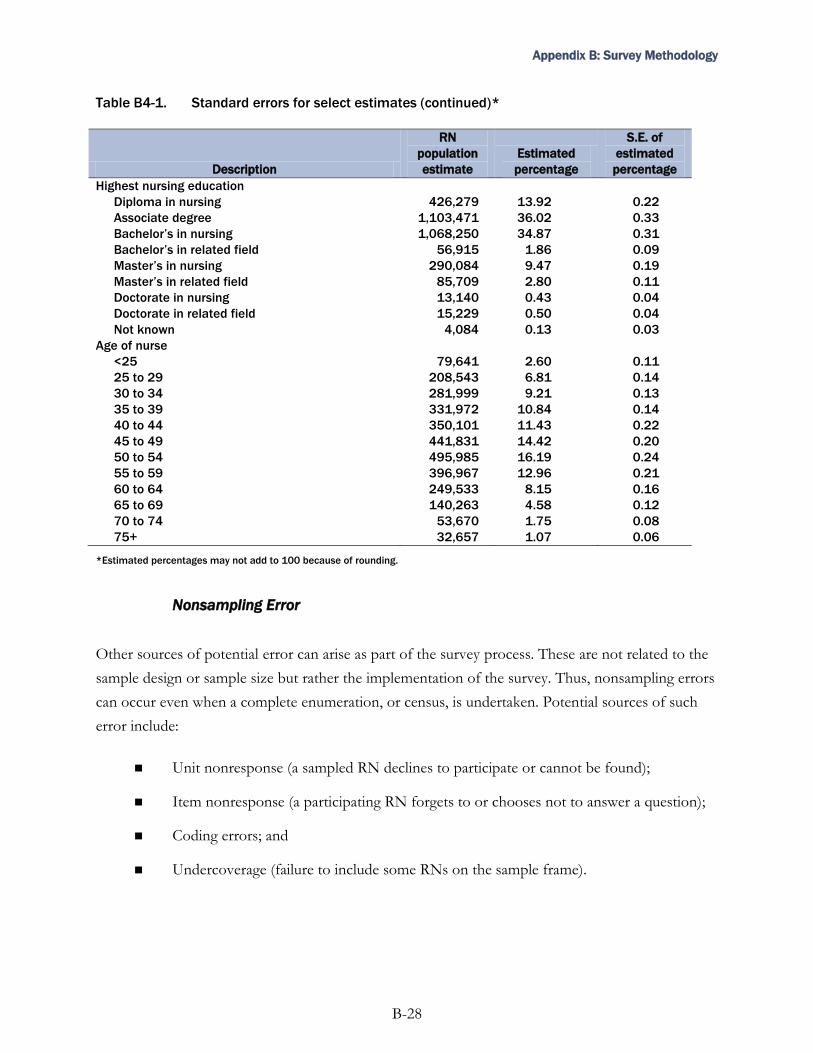
Appendix B: Survey Methodology
Table B4-1. Standard errors for select estimates (continued)*
Description
RN
population
estimate
Estimated
percentage
S.E. of
estimated
percentage
Highest nursing education
Diploma in nursing 426,279 13.92 0.22
Associate degree 1,103,471 36.02 0.33
Bachelor’s in nursing 1,068,250 34.87 0.31
Bachelor’s in related field 56,915 1.86 0.09
Master’s in nursing 290,084 9.47 0.19
Master’s in related field 85,709 2.80 0.11
Doctorate in nursing 13,140 0.43 0.04
Doctorate in related field 15,229 0.50 0.04
Not known 4,084 0.13 0.03
Age of nurse
<25 79,641 2.60 0.11
25 to 29 208,543 6.81 0.14
30 to 34 281,999 9.21 0.13
35 to 39 331,972 10.84 0.14
40 to 44 350,101 11.43 0.22
45 to 49 441,831 14.42 0.20
50 to 54 495,985 16.19 0.24
55 to 59 396,967 12.96 0.21
60 to 64 249,533 8.15 0.16
65 to 69 140,263 4.58 0.12
70 to 74 53,670 1.75 0.08
75+ 32,657 1.07 0.06
*Estimated percentages may not add to 100 because of rounding.
Nonsampling Error
Other sources of potential error can arise as part of the survey process. These are not related to the
sample design or sample size but rather the implementation of the survey. Thus, nonsampling errors
can occur even when a complete enumeration, or census, is undertaken. Potential sources of such
error include:
Unit nonresponse (a sampled RN declines to participate or cannot be found);
Item nonresponse (a participating RN forgets to or chooses not to answer a question);
Coding errors; and
Undercoverage (failure to include some RNs on the sample frame).
B-28
Appendix B: Survey Methodology
Attempts to address these nonsampling errors include:
Efforts to maximize response rates, including refusal conversion;
Adjustment of the weights for nonresponse;
Imputation of omitted data items;
Careful coding of responses; and
Highly controlled processing of the survey data.
B.5 Nonresponse Bias Analysis
In any survey that includes sampling or achieves less than a 100 percent response rate there is
potential for nonresponse bias. This is to say, respondents to the survey may differ in some ways
from nonrespondents, and, to the extent that such differences affect estimates, systematic departures
may arise between these estimates and the actual population value (unknown) being estimated. In
this section we describe the potential sources of nonresponse bias in the 2008 NSSRN, explain the
measures that were taken to reduce that bias, and show two sets of comparisons to help assess the
degree to which nonresponse bias may exist in the 2008 NSSRN data.
The sample design and weighting processes for the 2008 NSSRN differed in important ways from
those employed in previous implementations of the NSSRN dating back to 1977. Departures from
historically utilized methodologies reflected, in part, a concern about undercoverage of racial/ethnic
minorities and undercoverage of RNs within particular age groups.
B.5.1 Underrepresentation of Racial and Ethnic Minorities
Most notably from the sample design perspective, independent systematic random samples were
selected from each stratum for the 2008 NSSRN, while a nested cluster design (clustering RNs based
on last names) had been employed previously. The 2008 approach was expected to reduce sample
variances to some extent, particularly for estimates of race/ethnicity since clusters based on last
name are highly correlated with racial/ethnic background. There had been concern about possible
underrepresentation of some minorities using the original design, and efforts were previously made
B-29
Appendix B: Survey Methodology
to supplement the sample in some States to see if minority representation could be improved. This
initiative of the NSSRN sample design achieved little success.
Differential nonresponse for some minorities was another possible reason for lower than expected
estimated percentages for minority RNs. Race and ethnicity are not generally available on the
NSSRN sample frames that are received from the State boards of nursing, and when available race
and ethnicity data have substantial amounts of missing data. In fact, other than date of birth
(available on 44 of the State listings for the 2008 NSSRN), the only other information uniformly
available on the sample frames that was feasible for nonresponse adjustment purposes was address
based. In terms of information actually on the frame this would be ZIP Code.
B.5.2 Underrepresentation of Younger Nurses
In addition to underrepresentation of nurses of minority race and ethnicity in surveys prior to 2008,
concern had been expressed that the youngest RNs seemed to be underrepresented in the
population. In the 2004 NSSRN, the weights of RNs under the age of 26 were poststratified to
control figures that were derived from external data reflecting numbers of people passing nursing
licensure exams in the recent past. This age group, however, represents a relatively small percentage
of the population of RNs with currently active licenses. Moreover, this apparent underrepresentation
of younger RNs could also be due to differential nonresponse, so focusing on a single small class of
RNs would not necessarily address the issue of concern. The issue of differential response rates by
age among nurses over 25 had never been addressed in previous surveys.
Prior to the 2008 NSSRN, nonresponse adjustment of sample weights was accomplished through
poststratification of survey respondents’ weights to totals representing frame counts of RNs in a
hierarchical ordering of States, essentially from smallest to biggest (the frame counts were adjusted
to reflect RNs also licensed in a State appearing higher in the hierarchy and thus already accounted
for in the weighting process). This weighting procedure thus did not account for differential
nonresponse between subgroups within the RN population.
When data collection for the 2008 NSSRN was completed, the ratio of survey respondents to
sampled RNs was computed for specified age groupings for each of the 44 States where date of
birth was available, as well as for New York, as described earlier. Examination of these ratios
showed that older RNs did indeed respond rates at generally higher than the rates for younger RNs.
Thus, as part of the weighting process, adjustment cells were constructed to account for these
B-30
Appendix B: Survey Methodology
differential response rates, helping to ensure that the weights of responding RNs reflect the age
distribution of the States in which they were licensed.
B.5.3 Comparative Analyses
Two sets of analyses were undertaken to examine the potential for nonresponse bias in the 2008
NSSRN. The first was a comparison of 2008 NSSRN estimates based on two different sets of
nonresponse adjusted weights. The two estimates were computed based on weights devised in an
identical fashion except that the second set of weights excluded the ratio adjustment for age. The
nonage-adjusted estimates thus simulated the types of estimates that had been developed for prior
administrations of NSSRN. Comparison of the two sets of estimates is intended to accomplish two
purposes. First, to help data users see what the effect of an improved estimation process is expected
to be. Second, to help data users realize that changes seen in the NSSRN estimates may be due, not
to changes in the underlying population, but rather to an expected increase in the accuracy of the
survey estimates correlated with age.
The second set of analyses compares the 2008 NSSRN estimates of age and race to corresponding
estimates obtained from the American Community Survey (ACS) for the population in nursing
occupations. With different survey methodologies, the estimates are not perfectly comparable.
Nevertheless, such comparisons may help provide some insight into the degree to which the
potential for nonresponse bias may or may not have been reduced for NSSRN estimates.
Potential for Reduction in Bias Due to Nonresponse Adjustments by Age Group:
National Estimates
There has been concern in earlier implementations of the NSSRN that younger RNs were
underrepresented due to undercoverage on State sampling frames. In the 2000 and 2004 NSSRN
administrations, poststratification of the weights of the youngest RNs (those under the age of 26)
was undertaken, adjusting the weights to correspond to estimated control totals that were derived
based on an external data reflecting numbers of people passing nursing licensure exams in the recent
past.
B-31
Appendix B: Survey Methodology
While undercoverage of newly licensed RNs may be an issue, another potential source of bias
associated with low estimates of younger RNs is differential nonresponse by age. This was examined
as part of the 2008 weighting process.
Forty-four States provided date of birth on the sampling frame. Where date of birth was available,
six age groups were formed during sample selection for sorting or implicit stratification purposes.
Examination of response propensities by age for these groups showed that younger RNs responded
at lower rates than older RNs. The weight adjustment processes that had been employed in the past
were essentially global in nature. Poststratification was used to achieve consistency between
responding RNs associated with a given State of licensure and the corresponding control total,
licensed RNs in the State. The control total took into account RNs who were also licensed in what
were characterized as higher priority States. Thus, if older RNs had higher response rates in a State
as they often did, they would be represented at a disproportionately high rate among the population
of RNs licensed in the State. This is a potential source of bias for survey estimates that are correlated
with age. In addition to the general age distribution of the RN population, other variables that could
be affected include those related to education and employment.
As previously described, the 2008 NSSRN final weights included a poststratification adjustment by
age group. Through this process, the sum of the weights of eligible and ineligible respondents was
adjusted by age group to corresponding age group totals for each stratum with States where date of
birth was available. Poststratification adjustments for New York used the age distribution of the RN
population because date of birth was not included on the sample file. This calibration by age served
to adjust for both undercoverage and nonresponse. Thus, nonresponse adjustment reflecting
differential nonresponse by age was not feasible for only six States.
To assess the extent to which survey estimates may have changed after accounting for differential
nonresponse by age group, we developed a separate set of weights using a global approach to
nonresponse adjustment. That is, poststratification of all responding eligible and ineligible RNs to a
single control total for each stratum within a State. This approach simulated the approach to
nonresponse adjustment used in past administrations of NSSRN. This weight is referred to here as
the ―surrogate‖ weight.
Table B5-1 provides the estimated percentage population distributions across the variables of
interest and the corresponding estimated standard errors for each set of weights. Table B5-1 also
presents a ratio designed to serve as a measure of the extent to which there is evidence of practical
significance. This ratio is the difference between the two estimates divided by the standard error of
the ―final weight‖ estimate. We will refer to it here as the ―standardized measure of the difference.‖
B-32
Appendix B: Survey Methodology
Note that the ―final weight‖ estimate and the ―surrogate‖ weight estimates are highly correlated, and
thus one would expect most all the differences to achieve statistical significance, so we are focusing
here on differences that appear to be particularly noteworthy. Under these circumstances, we focus
here on ratios with an absolute value of 3 or more, taking them to represent evidence of a difference
of some consequence.
Consider the variable ―initial nursing education‖ and the estimates based on the final weight and the
surrogate weight for those whose initial nursing education was a ―diploma,‖ the first line of
estimates for Table B5-1. The final weight estimate for those with a diploma is 20.36 percent while
the surrogate weight estimate is 21.62 (the ratio of the former to the latter is .94, while the ratio of
standard errors is .89). The difference between the final weight estimate and the surrogate weight
estimate is -1.26, and the standardize measure of this difference (the ratio of the actual difference to
the standard error corresponding to the ―Final weight‖ estimate, a value of 0.23) is -5.43. This
standardized difference value, developed for use in assessing evidence of practical significance
between the two estimates, is substantially greater than 3. Using the criteria of obtaining an absolute
value of 3 or more, a difference this big can reasonably be interpreted as substantial evidence that
the difference is of consequence. The expectation is that using the weight incorporating a
nonresponse adjustment reflecting differential nonresponse by age results in reduced bias. Other
estimates where large standardized differences arise and thus represent evidence of reduced potential
include: RNs with a bachelor’s degree; RNs employed in nursing; White, non-Hispanic RNs; RNs
employed in a hospital setting; and most of the age group and graduation year categories.
It may be of interest to note that the ratio of standard errors varies by analytical variable. For all age
groups except those under 25, the ratio was substantially lower than 1, suggesting that using the
poststratification cells based on age may have helped reduce the variability of the corresponding
estimates. For the education-related variables, generally the ratios were close to 1. For the race and
ethnicity categories, almost all of the ratios are greater than 1, suggesting that there may be an
interaction between race/ethnicity and age. This could be the result of the larger proportion of older
RNs being White, non-Hispanic. The issue of differential nonresponse by race/ethnicity is
considered in more detail in the next section.
These findings regarding the effects of nonresponse adjustment by age group should be taken into
account when comparing estimates from the 2008 NSSRN to those from previous NSSRNs.
Differences between the 2008 NSSRN estimates and those from prior years for estimates correlated
with age may be due to an improvement in the weighting process rather than a significant change in
the RN population over time.
B-33
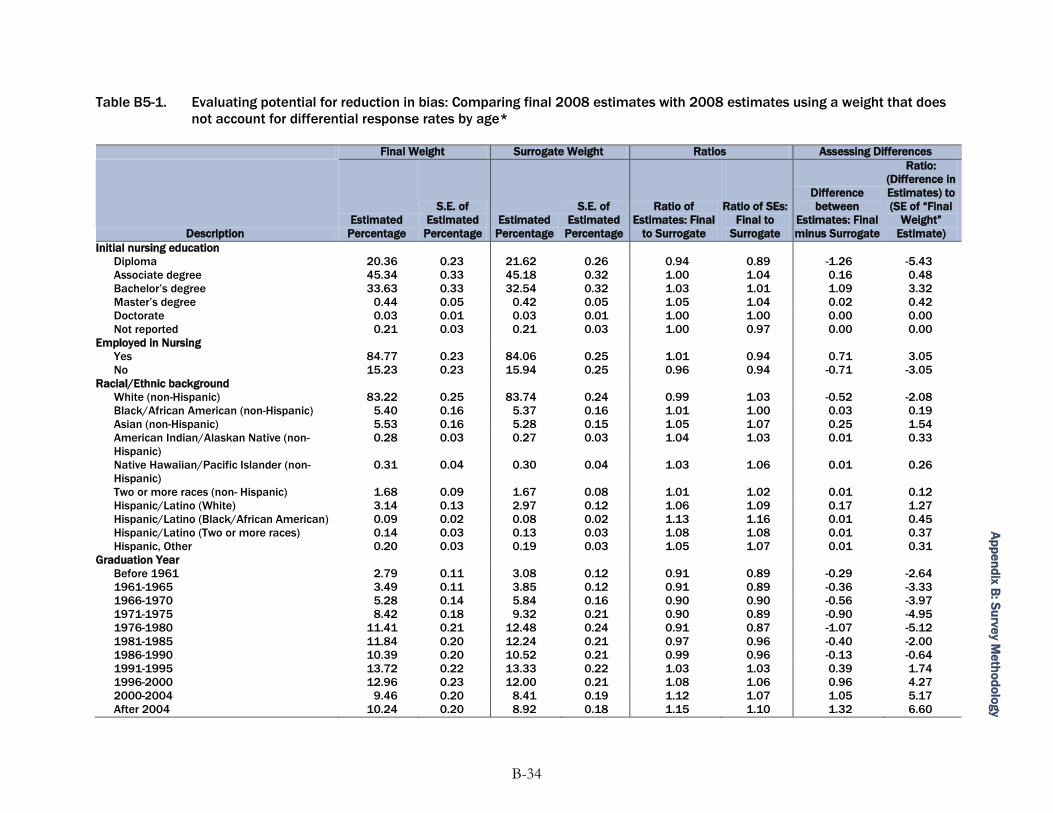
Ap
pe
nd
ix B: S
urve
y Me
tho
do
log
y
Table B5-1. Evaluating potential for reduction in bias: Comparing final 2008 estimates with 2008 estimates using a weight that does
not account for differential response rates by age*
Final Weight Surrogate Weight Ratios Assessing Differences
Description
Estimated
Percentage
S.E. of
Estimated
Percentage
Estimated
Percentage
S.E. of
Estimated
Percentage
Ratio of
Estimates: Final
to Surrogate
Ratio of SEs:
Final to
Surrogate
Difference
between
Estimates: Final
minus Surrogate
Ratio:
(Difference in
Estimates) to
(SE of “Final
Weight”
Estimate)
Initial nursing education
Diploma 20.36 0.23 21.62 0.26 0.94 0.89 -1.26 -5.43
Associate degree 45.34 0.33 45.18 0.32 1.00 1.04 0.16 0.48
Bachelor’s degree 33.63 0.33 32.54 0.32 1.03 1.01 1.09 3.32
Master’s degree 0.44 0.05 0.42 0.05 1.05 1.04 0.02 0.42
Doctorate 0.03 0.01 0.03 0.01 1.00 1.00 0.00 0.00
Not reported 0.21 0.03 0.21 0.03 1.00 0.97 0.00 0.00
Employed in Nursing
Yes 84.77 0.23 84.06 0.25 1.01 0.94 0.71 3.05
No 15.23 0.23 15.94 0.25 0.96 0.94 -0.71 -3.05
Racial/Ethnic background
White (non-Hispanic) 83.22 0.25 83.74 0.24 0.99 1.03 -0.52 -2.08
Black/African American (non-Hispanic) 5.40 0.16 5.37 0.16 1.01 1.00 0.03 0.19
Asian (non-Hispanic) 5.53 0.16 5.28 0.15 1.05 1.07 0.25 1.54
American Indian/Alaskan Native (non-
Hispanic)
0.28 0.03 0.27 0.03 1.04 1.03 0.01 0.33
Native Hawaiian/Pacific Islander (non-
Hispanic)
0.31 0.04 0.30 0.04 1.03 1.06 0.01 0.26
Two or more races (non- Hispanic) 1.68 0.09 1.67 0.08 1.01 1.02 0.01 0.12
Hispanic/Latino (White) 3.14 0.13 2.97 0.12 1.06 1.09 0.17 1.27
Hispanic/Latino (Black/African American) 0.09 0.02 0.08 0.02 1.13 1.16 0.01 0.45
Hispanic/Latino (Two or more races) 0.14 0.03 0.13 0.03 1.08 1.08 0.01 0.37
Hispanic, Other 0.20 0.03 0.19 0.03 1.05 1.07 0.01 0.31
Graduation Year
Before 1961 2.79 0.11 3.08 0.12 0.91 0.89 -0.29 -2.64
1961-1965 3.49 0.11 3.85 0.12 0.91 0.89 -0.36 -3.33
1966-1970 5.28 0.14 5.84 0.16 0.90 0.90 -0.56 -3.97
1971-1975 8.42 0.18 9.32 0.21 0.90 0.89 -0.90 -4.95
1976-1980 11.41 0.21 12.48 0.24 0.91 0.87 -1.07 -5.12
1981-1985 11.84 0.20 12.24 0.21 0.97 0.96 -0.40 -2.00
1986-1990 10.39 0.20 10.52 0.21 0.99 0.96 -0.13 -0.64
1991-1995 13.72 0.22 13.33 0.22 1.03 1.03 0.39 1.74
1996-2000 12.96 0.23 12.00 0.21 1.08 1.06 0.96 4.27
2000-2004 9.46 0.20 8.41 0.19 1.12 1.07 1.05 5.17
After 2004 10.24 0.20 8.92 0.18 1.15 1.10 1.32 6.60
B-34
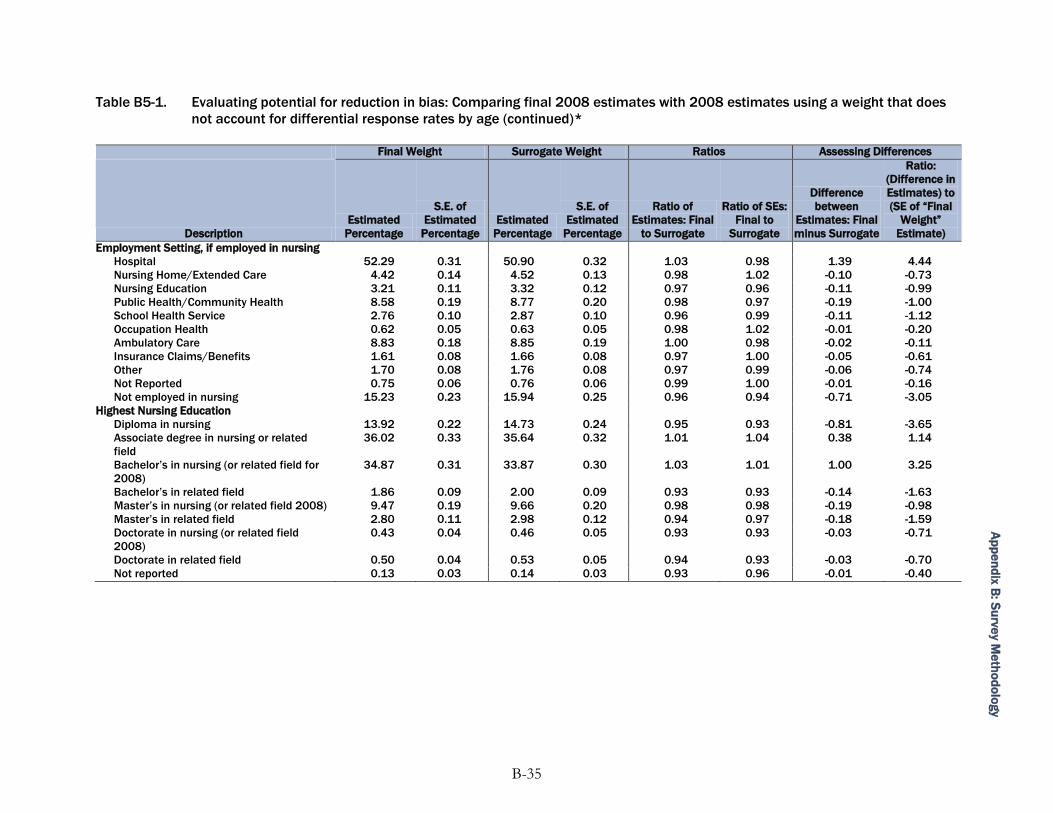
Ap
pe
nd
ix B: S
urve
y Me
tho
do
log
y
Table B5-1. Evaluating potential for reduction in bias: Comparing final 2008 estimates with 2008 estimates using a weight that does
not account for differential response rates by age (continued)*
Final Weight Surrogate Weight Ratios Assessing Differences
Description
Estimated
Percentage
S.E. of
Estimated
Percentage
Estimated
Percentage
S.E. of
Estimated
Percentage
Ratio of
Estimates: Final
to Surrogate
Ratio of SEs:
Final to
Surrogate
Difference
between
Estimates: Final
minus Surrogate
Ratio:
(Difference in
Estimates) to
(SE of “Final
Weight”
Estimate)
Employment Setting, if employed in nursing
Hospital 52.29 0.31 50.90 0.32 1.03 0.98 1.39 4.44
Nursing Home/Extended Care 4.42 0.14 4.52 0.13 0.98 1.02 -0.10 -0.73
Nursing Education 3.21 0.11 3.32 0.12 0.97 0.96 -0.11 -0.99
Public Health/Community Health 8.58 0.19 8.77 0.20 0.98 0.97 -0.19 -1.00
School Health Service 2.76 0.10 2.87 0.10 0.96 0.99 -0.11 -1.12
Occupation Health 0.62 0.05 0.63 0.05 0.98 1.02 -0.01 -0.20
Ambulatory Care 8.83 0.18 8.85 0.19 1.00 0.98 -0.02 -0.11
Insurance Claims/Benefits 1.61 0.08 1.66 0.08 0.97 1.00 -0.05 -0.61
Other 1.70 0.08 1.76 0.08 0.97 0.99 -0.06 -0.74
Not Reported 0.75 0.06 0.76 0.06 0.99 1.00 -0.01 -0.16
Not employed in nursing 15.23 0.23 15.94 0.25 0.96 0.94 -0.71 -3.05
Highest Nursing Education
Diploma in nursing 13.92 0.22 14.73 0.24 0.95 0.93 -0.81 -3.65
Associate degree in nursing or related
field
36.02 0.33 35.64 0.32 1.01 1.04 0.38 1.14
Bachelor’s in nursing (or related field for
2008)
34.87 0.31 33.87 0.30 1.03 1.01 1.00 3.25
Bachelor’s in related field 1.86 0.09 2.00 0.09 0.93 0.93 -0.14 -1.63
Master’s in nursing (or related field 2008) 9.47 0.19 9.66 0.20 0.98 0.98 -0.19 -0.98
Master’s in related field 2.80 0.11 2.98 0.12 0.94 0.97 -0.18 -1.59
Doctorate in nursing (or related field
2008)
0.43 0.04 0.46 0.05 0.93 0.93 -0.03 -0.71
Doctorate in related field 0.50 0.04 0.53 0.05 0.94 0.93 -0.03 -0.70
Not reported 0.13 0.03 0.14 0.03 0.93 0.96 -0.01 -0.40
B-35
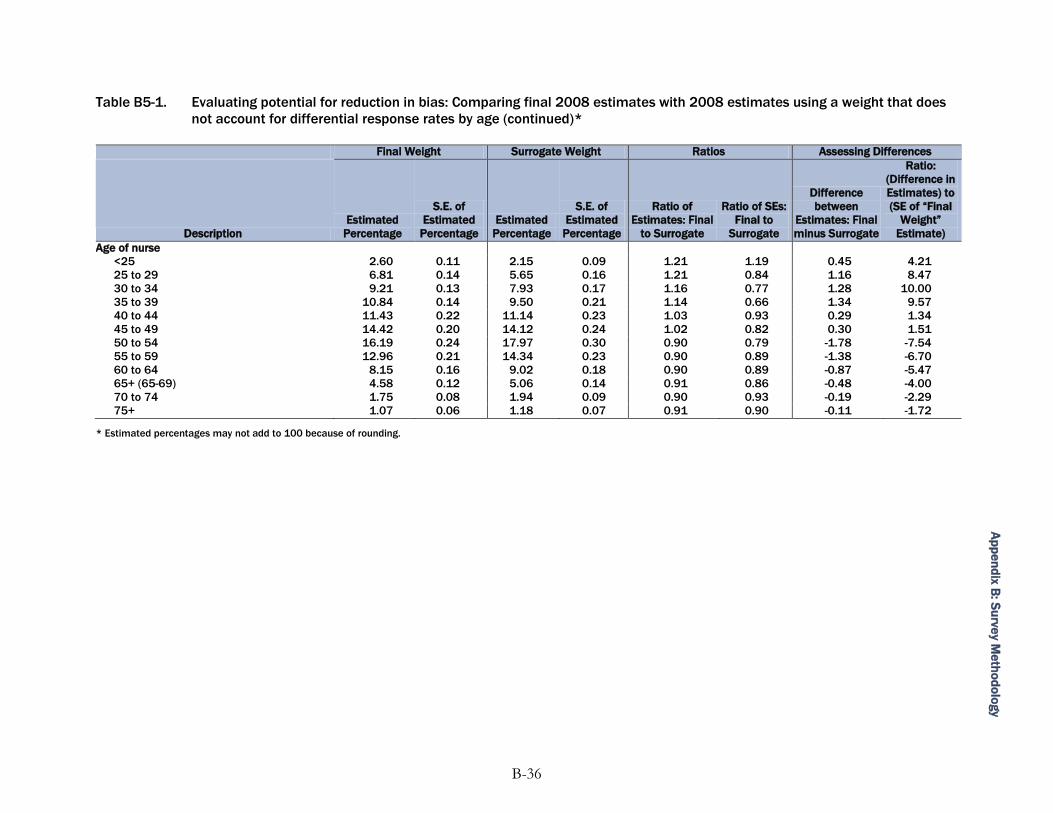
Ap
pe
nd
ix B: S
urve
y Me
tho
do
log
y
Table B5-1. Evaluating potential for reduction in bias: Comparing final 2008 estimates with 2008 estimates using a weight that does
not account for differential response rates by age (continued)*
Final Weight Surrogate Weight Ratios Assessing Differences
Description
Estimated
Percentage
S.E. of
Estimated
Percentage
Estimated
Percentage
S.E. of
Estimated
Percentage
Ratio of
Estimates: Final
to Surrogate
Ratio of SEs:
Final to
Surrogate
Difference
between
Estimates: Final
minus Surrogate
Ratio:
(Difference in
Estimates) to
(SE of “Final
Weight”
Estimate)
Age of nurse
<25 2.60 0.11 2.15 0.09 1.21 1.19 0.45 4.21
25 to 29 6.81 0.14 5.65 0.16 1.21 0.84 1.16 8.47
30 to 34 9.21 0.13 7.93 0.17 1.16 0.77 1.28 10.00
35 to 39 10.84 0.14 9.50 0.21 1.14 0.66 1.34 9.57
40 to 44 11.43 0.22 11.14 0.23 1.03 0.93 0.29 1.34
45 to 49 14.42 0.20 14.12 0.24 1.02 0.82 0.30 1.51
50 to 54 16.19 0.24 17.97 0.30 0.90 0.79 -1.78 -7.54
55 to 59 12.96 0.21 14.34 0.23 0.90 0.89 -1.38 -6.70
60 to 64 8.15 0.16 9.02 0.18 0.90 0.89 -0.87 -5.47
65+ (65-69) 4.58 0.12 5.06 0.14 0.91 0.86 -0.48 -4.00
70 to 74 1.75 0.08 1.94 0.09 0.90 0.93 -0.19 -2.29
75+ 1.07 0.06 1.18 0.07 0.91 0.90 -0.11 -1.72
* Estimated percentages may not add to 100 because of rounding.
B-36
Appendix B: Survey Methodology
Comparing 2008 NSSRN and 2008 American Community Survey Estimates
The American Community Survey (ACS) is a sizeable survey of the U.S. population carried out by
the U.S. Census Bureau and designed primarily to collect data previously obtained from the Census
―Long Form.‖ The ACS data however, are collected continually over the course of each decade
rather than once every 10 years. A single household respondent is asked to provide data on each
member of the household. The ACS is a mail survey that used telephone and in-person follow-up to
help reduce nonresponse. The overall response rate reported for the 2008 ACS was 98 percent.
The ACS collects data about occupation, race/ethnicity, and age. It may be of interest to compare
the 2008 NSSRN estimates on race/ethnicity and age to corresponding 2008 ACS estimates for the
population with an occupation of registered nurse. In making comparisons between the studies, it
should be noted that there are some differences in the way the data have been collected that could
affect the quality or comparability of the estimates. For instance, the ACS categorizes occupation as
the main type of work a person did if the person worked in the previous 5 years. The NSSRN
collects data on RNs with currently active licenses regardless of current or past employment status.
For the ACS data there is also question about the accuracy of the occupation reporting since a
household respondent may be characterizing another household member inaccurately. Points of
possible uncertainty on the part of the ACS household respondent include whether: a member is an
RN or an licensed practical nurse (LPN) (not a member of the target population for the NSSRN); a
member is actually employed as an RN even if he or she has a license; and/or, whether a household
member is currently licensed as an RN in at least one State.
Table B5-2 provides estimates from both the 2008 NSSRN and 2008 ACS data and ratios of these
estimates. It should be noted that these estimates do not represent precisely the same populations, as
the description of the target populations for the various estimates will make clear. Nevertheless,
examining these ratios does seem to provide some insight into the potential for nonresponse bias,
albeit with necessary caveats.
Table B5-2 shows the 2008 national NSSRN estimates for both those RNs with currently active
licenses (3,063,162) and the subset of those employed as an RN (2,596,599). The 2008 ACS estimate
for those employed as an RN some time during the previous 5 years is 3,032,470. Thus, this ACS
estimate is closer to the figure obtained for all RNs with currently active licenses obtained using 2008
NSSRN data. The 2008 ACS estimate of the number of RNs who were members of the labor force
is 2,752,050, closer to the 2008 NSSRN estimate of those employed in nursing.
B-37
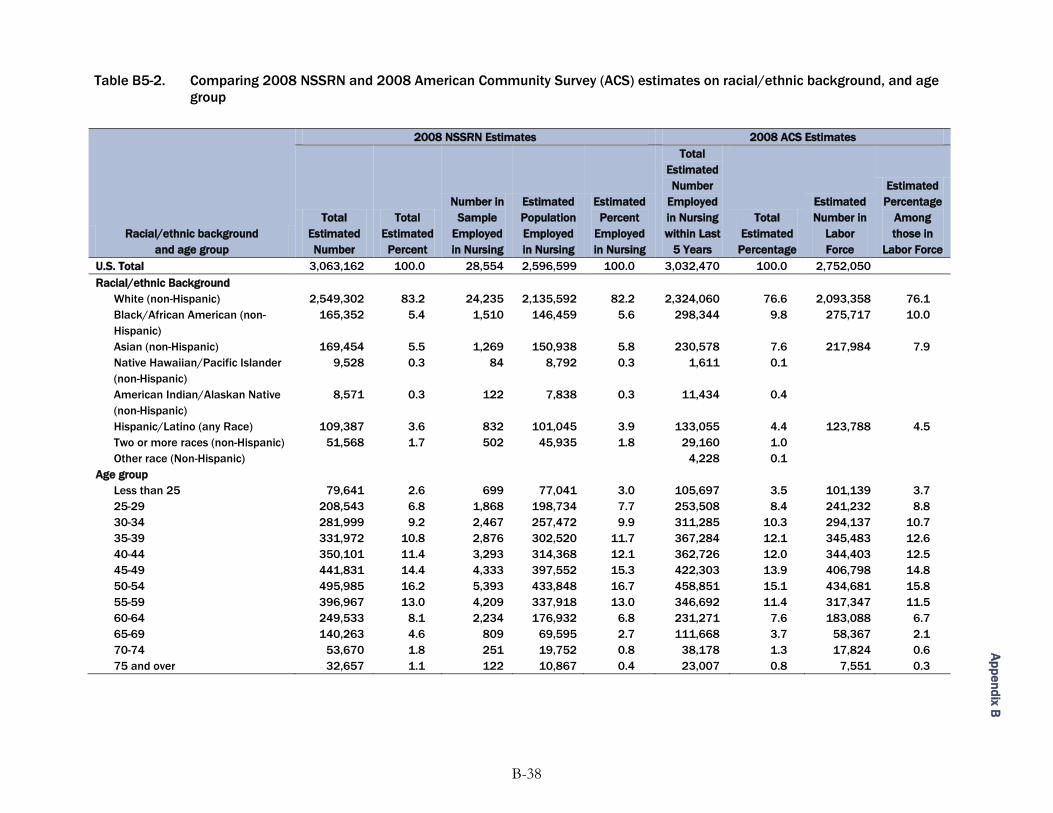
Ap
pe
nd
ix B
Table B5-2. Comparing 2008 NSSRN and 2008 American Community Survey (ACS) estimates on racial/ethnic background, and age
group
Racial/ethnic background
and age group
2008 NSSRN Estimates 2008 ACS Estimates
Total
Estimated
Number
Total
Estimated
Percent
Number in
Sample
Employed
in Nursing
Estimated
Population
Employed
in Nursing
Estimated
Percent
Employed
in Nursing
Total
Estimated
Number
Employed
in Nursing
within Last
5 Years
Total
Estimated
Percentage
Estimated
Number in
Labor
Force
Estimated
Percentage
Among
those in
Labor Force
U.S. Total 3,063,162 100.0 28,554 2,596,599 100.0 3,032,470 100.0 2,752,050
Racial/ethnic Background
White (non-Hispanic) 2,549,302 83.2 24,235 2,135,592 82.2 2,324,060 76.6 2,093,358 76.1
Black/African American (non-
Hispanic)
165,352 5.4 1,510 146,459 5.6 298,344 9.8 275,717 10.0
Asian (non-Hispanic) 169,454 5.5 1,269 150,938 5.8 230,578 7.6 217,984 7.9
Native Hawaiian/Pacific Islander
(non-Hispanic)
9,528 0.3 84 8,792 0.3 1,611 0.1
American Indian/Alaskan Native
(non-Hispanic)
8,571 0.3 122 7,838 0.3 11,434 0.4
Hispanic/Latino (any Race) 109,387 3.6 832 101,045 3.9 133,055 4.4 123,788 4.5
Two or more races (non-Hispanic) 51,568 1.7 502 45,935 1.8 29,160 1.0
Other race (Non-Hispanic) 4,228 0.1
Age group
Less than 25 79,641 2.6 699 77,041 3.0 105,697 3.5 101,139 3.7
25-29 208,543 6.8 1,868 198,734 7.7 253,508 8.4 241,232 8.8
30-34 281,999 9.2 2,467 257,472 9.9 311,285 10.3 294,137 10.7
35-39 331,972 10.8 2,876 302,520 11.7 367,284 12.1 345,483 12.6
40-44 350,101 11.4 3,293 314,368 12.1 362,726 12.0 344,403 12.5
45-49 441,831 14.4 4,333 397,552 15.3 422,303 13.9 406,798 14.8
50-54 495,985 16.2 5,393 433,848 16.7 458,851 15.1 434,681 15.8
55-59 396,967 13.0 4,209 337,918 13.0 346,692 11.4 317,347 11.5
60-64 249,533 8.1 2,234 176,932 6.8 231,271 7.6 183,088 6.7
65-69 140,263 4.6 809 69,595 2.7 111,668 3.7 58,367 2.1
70-74 53,670 1.8 251 19,752 0.8 38,178 1.3 17,824 0.6
75 and over 32,657 1.1 122 10,867 0.4 23,007 0.8 7,551 0.3
B-38
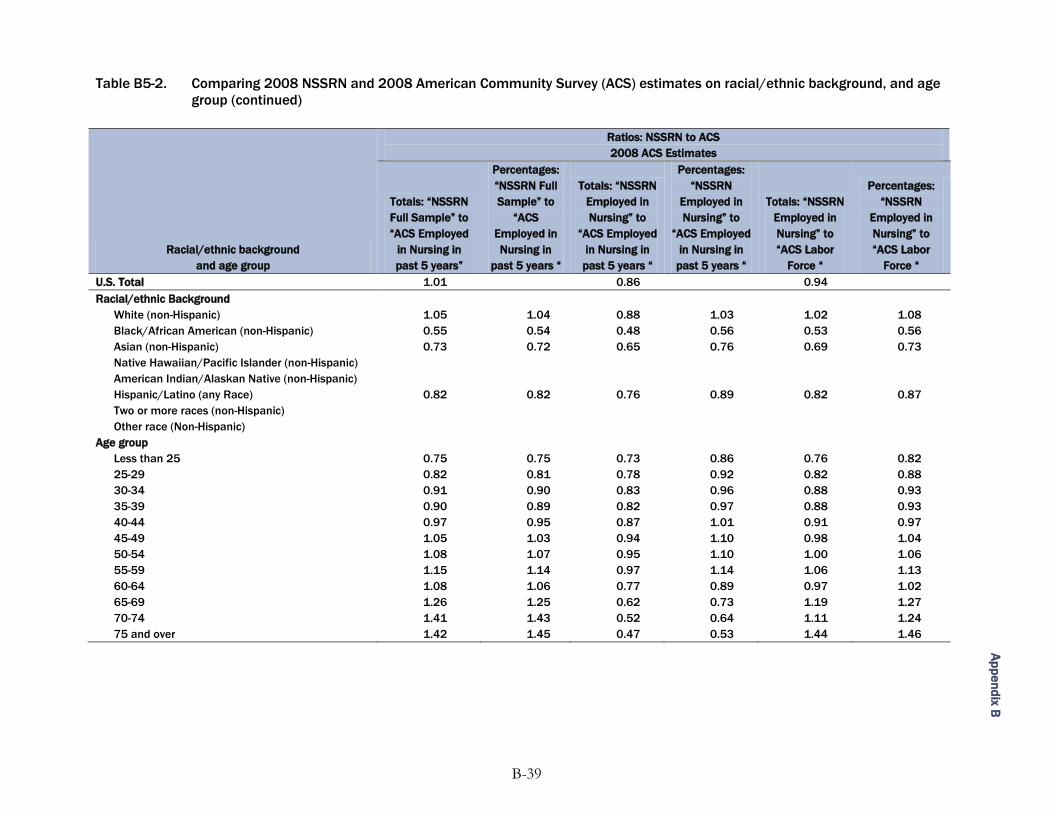
Ap
pe
nd
ix B
Table B5-2. Comparing 2008 NSSRN and 2008 American Community Survey (ACS) estimates on racial/ethnic background, and age
group (continued)
Racial/ethnic background
and age group
Ratios: NSSRN to ACS
2008 ACS Estimates
Totals: “NSSRN
Full Sample” to
“ACS Employed
in Nursing in
past 5 years”
Percentages:
“NSSRN Full
Sample” to
“ACS
Employed in
Nursing in
past 5 years “
Totals: “NSSRN
Employed in
Nursing” to
“ACS Employed
in Nursing in
past 5 years “
Percentages:
“NSSRN
Employed in
Nursing” to
“ACS Employed
in Nursing in
past 5 years “
Totals: “NSSRN
Employed in
Nursing” to
“ACS Labor
Force “
Percentages:
“NSSRN
Employed in
Nursing” to
“ACS Labor
Force “
U.S. Total 1.01 0.86 0.94
Racial/ethnic Background
White (non-Hispanic) 1.05 1.04 0.88 1.03 1.02 1.08
Black/African American (non-Hispanic) 0.55 0.54 0.48 0.56 0.53 0.56
Asian (non-Hispanic) 0.73 0.72 0.65 0.76 0.69 0.73
Native Hawaiian/Pacific Islander (non-Hispanic)
American Indian/Alaskan Native (non-Hispanic)
Hispanic/Latino (any Race) 0.82 0.82 0.76 0.89 0.82 0.87
Two or more races (non-Hispanic)
Other race (Non-Hispanic)
Age group
Less than 25 0.75 0.75 0.73 0.86 0.76 0.82
25-29 0.82 0.81 0.78 0.92 0.82 0.88
30-34 0.91 0.90 0.83 0.96 0.88 0.93
35-39 0.90 0.89 0.82 0.97 0.88 0.93
40-44 0.97 0.95 0.87 1.01 0.91 0.97
45-49 1.05 1.03 0.94 1.10 0.98 1.04
50-54 1.08 1.07 0.95 1.10 1.00 1.06
55-59 1.15 1.14 0.97 1.14 1.06 1.13
60-64 1.08 1.06 0.77 0.89 0.97 1.02
65-69 1.26 1.25 0.62 0.73 1.19 1.27
70-74 1.41 1.43 0.52 0.64 1.11 1.24
75 and over 1.42 1.45 0.47 0.53 1.44 1.46
B-39
Appendix B: Survey Methodology
Ap
pe
nd
ix B
The ratio of the NSSRN national estimate of ―RNs with active licenses‖ to the ACS estimate for
―those whose main work within the past 5 years was as an RN‖ is about 1.01. The ratio of the
NSSRN ―employed as an RN‖ estimate to the same ACS figure is 0.86. The ratio of the NSSRN
―employed as an RN‖ estimate to the ACS estimate for those working as an RN in the past 5 years
who are still in the labor force is 0.94.
Keeping in mind the methodological differences both in terms of the populations represented and
how the data were collected, we examine the ratios for subgroups defined by race/ethnicity and by
age for comparison purposes. Here we focus solely on the ratios for Hispanic nurses and for the
non-Hispanic component of the racial groups White, Black, and Asian. The other subgroups were
left out of this discussion as their numbers were quite small. Most noteworthy is that the various
ratios for White are generally slightly more than 1 while the ratios for Black are generally between
0.5 and 0.6, the ratios for Asian are between 0.65 and 0.76, and the ratios for Hispanic are generally
between 0.8 and 0.9.
Thus, to the extent that the NSSRN and ACS are comparable, these data suggest that there may be
differential nonresponse between race/ethnic groups to the NSSRN with the response rates for
minorities somewhat less than that of nurses who are White, non-Hispanic. Differential
nonresponse among racial/ethnic groups seems particularly likely for Blacks and Asians. Such
differential nonresponse is a potential source of bias.
It should be pointed out that there may be some evidence of the potential for misclassification
affecting the identification of Black RNs in the ACS. A November 2004 report done for the Health
Resources and Services Administration (HRSA) of the U.S. Department of Health and Human
Services (HHS) entitled ―Supply, Demand, and Use of Licensed Practical Nurses‖ provided
estimates of the proportion of LPNs classified by race/ethnicity categories based on CPS data from
1984-2001. Blacks represented roughly 20 percent of LPNs over that time period with Hispanics
about 5 percent and Asians 2-3 percent. Thus, if ACS respondents were prone to mischaracterizing
LPNs as RNs, the minority race/ethnicity group that would seem most likely to be affected is that of
Blacks. Such misclassification might have contributed to the low ratios of NSSRN to ACS estimates
of Blacks who are RNs.
Examination of the ratios of the NSSRN full sample age group distributions to those of the ACS
provides some evidence that the adjustment for differential response rates by age group was
effective in reducing bias for estimates correlated with age. For the groups covering the overall age
range 30-64, the ratios are roughly from 0.9 to 1.15 with those under 45 having ratios under 1 while
B-40
Appendix B: Survey Methodology
Ap
pe
nd
ix B
those from 46-64 exceeding 1. The ratios of estimated totals from Table B5-1 indicate that these
―age‖ ratios in Table B5-2 would have been more extreme without the age-based adjustment since
the estimates without such an adjustment were lower for the younger age ranges and larger for the
older ones.
There do appear to be comparability issues between the NSSRN and the ACS, at least for the three
oldest age ranges. For example the ratio of the NSSRN estimate of the proportion of nurses aged
65-69 who were employed in nursing to the ACS estimate of those RNs working in the past 5 years
who are still in the labor force was 1.27. The corresponding ratios for 70-74 year olds and for those
75 or older are 1.24 and 1.46. It is not clear why an estimate of those actually working in nursing
from one survey would exceed by a considerable margin the estimate from another survey of those
remaining in the labor force. The sample sizes for these age groups are relatively small, so the
corresponding estimates are somewhat unstable which may be one contributing factor to the relative
size of the estimates.
References
Krenzke, T., Judkins, D., and Fan, Z. (2005). Vector imputation at Westat. Presented at Statistical Society of Canada Meetings, Saskatoon, Saskatchewan.
Lee, H., Carlson, E., Lo, A., Norman, G., and Lopdell, J. (2006). Pre-elementary education longitudinal study, final wave3 update to methodology report. Prepared under contract to the Office of Special Education Programs, U.S. Department of Education. Rockville, MD: Westat.
Little, R.J. (1988). Missing-data adjustments in large surveys. Journal of Business and Economic Statistics, 6, 287-296.
Piesse, A., Judkins, D., and Fan, Z. (2005). Item imputation made eEasy. Proceedings of the American Statistical Association Survey Research Methods Section.
Lavallée, P. (2007). Indirect Sampling. Springer, New York
Lohr, S. (2010). Sampling: Design and Analysis. Second edition. Brooks/Cole, Cengage Learning.
Wolter, K.(2007). Introduction to Variance Estimation. Second Edition. Springer.
Brick, J.M., and Kalton, G. (1996). Handling missing data in survey research. Statistical Methods in Medical Research, 5(3), 215-238.
Sample Survey for the National Survey of Registered Nurses, Technical Report (Volume I), and Appendices (Volume II). Westat Inc. and the American Nurses Association, 1976 (unpublished).
B-41
Appendix B: Survey Methodology
Ap
pe
nd
ix B
U.S. Department of Health and Human Services, Health Resources and Services Administration (2001). The Registered Nurse Population: March 2000 Findings from the National Sample Survey of Registered Nurses.
U.S. Department of Health and Human Services, Health Resources and Services Administration (2006). The Registered Nurse Population: Findings from the March 2004 National Sample Survey of Registered Nurses.
U.S. Department of Health and Human Services, Health Resources and Services Administration (2006). 2004 National Sample Survey of Registered Nurses: Technical Report (unpublished).
B-42

Appendix C
NSSRN Questionnaire

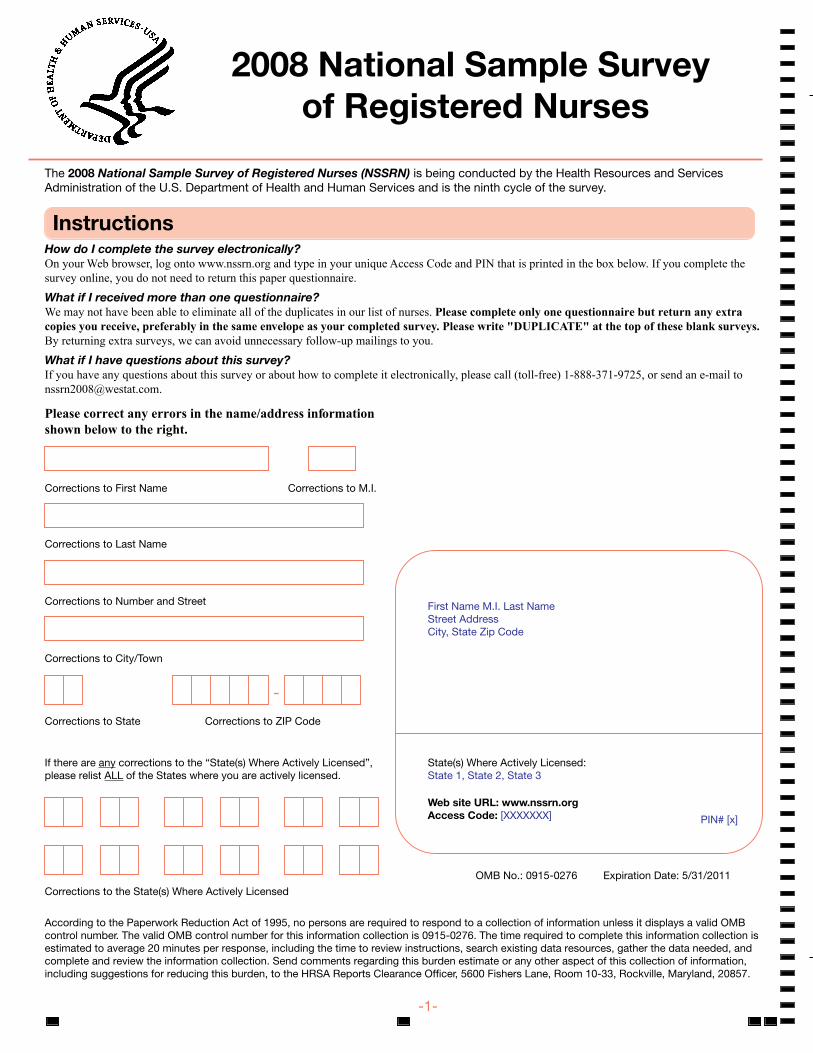
-1
2008 National Sample Survey of Registered Nurses
The 2008 National Sample Survey of Registered Nurses (NSSRN) is being conducted by the Health Resources and Services Administration of the U.S. Department of Health and Human Services and is the ninth cycle of the survey.
Instructions How do I complete the survey electronically? On your Web browser, log onto www.nssrn.org and type in your unique Access Code and PIN that is printed in the box below. If you complete the survey online, you do not need to return this paper questionnaire.
What if I received more than one questionnaire? We may not have been able to eliminate all of the duplicates in our list of nurses. Please complete only one questionnaire but return any extra copies you receive, preferably in the same envelope as your completed survey. Please write "DUPLICATE" at the top of these blank surveys. By returning extra surveys, we can avoid unnecessary follow-up mailings to you.
What if I have questions about this survey? If you have any questions about this survey or about how to complete it electronically, please call (toll-free) 1-888-371-9725, or send an e-mail to [email protected].
Please correct any errors in the name/address information shown below to the right.
Corrections to First Name Corrections to M.I.
Corrections to Last Name
Corrections to Number and Street
Corrections to City/Town
-
Corrections to State Corrections to ZIP Code
If there are any corrections to the “State(s) Where Actively Licensed”, please relist ALL of the States where you are actively licensed.
First Name M.I. Last Name Street Address City, State Zip Code
State(s) Where Actively Licensed: State 1, State 2, State 3
Web site URL: www.nssrn.org Access Code: [XXXXXXX] PIN# [x]
OMB No.: 0915-0276 Expiration Date: 5/31/2011
Corrections to the State(s) Where Actively Licensed
According to the Paperwork Reduction Act of 1995, no persons are required to respond to a collection of information unless it displays a valid OMB control number. The valid OMB control number for this information collection is 0915-0276. The time required to complete this information collection is estimated to average 20 minutes per response, including the time to review instructions, search existing data resources, gather the data needed, and complete and review the information collection. Send comments regarding this burden estimate or any other aspect of this collection of information, including suggestions for reducing this burden, to the HRSA Reports Clearance Officer, 5600 Fishers Lane, Room 10-33, Rockville, Maryland, 20857.
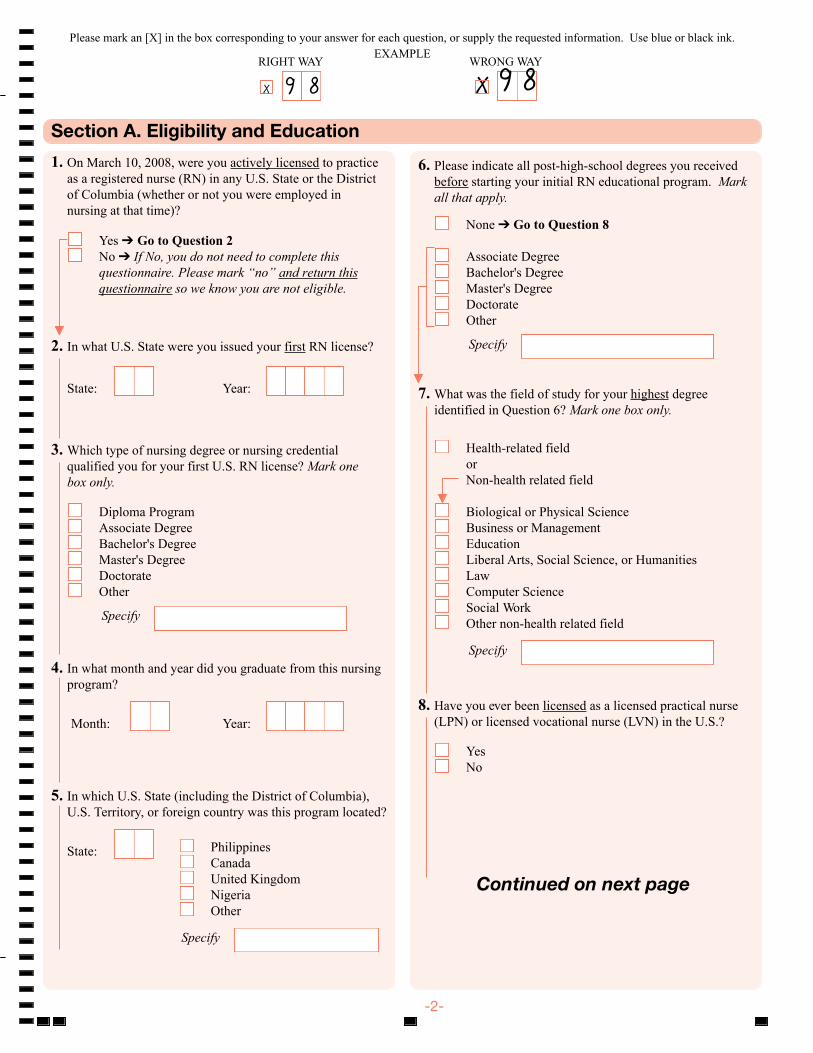
Please mark an [X] in the box corresponding to your answer for each question, or supply the requested information. Use blue or black ink. EXAMPLE
RIGHT WAY
X 9 8 WRONG W
9 8AY
X
Section A. Eligibility and Education
1. On March 10, 2008, were you actively licensed to practice as a registered nurse (RN) in any U.S. State or the District of Columbia (whether or not you were employed in nursing at that time)?
Yes ➔ Go to Question 2 No ➔ If No, you do not need to complete this questionnaire. Please mark “no” and return this questionnaire so we know you are not eligible.
2. In what U.S. State were you issued your first RN license?
State: Year:
3. Which type of nursing degree or nursing credential qualified you for your first U.S. RN license? Mark one box only.
Diploma Program Associate Degree Bachelor's Degree Master's Degree Doctorate Other
Specify
-2
Year:
4. In what month and year did you graduate from this nursing program?
Month:
5. In which U.S. State (including the District of Columbia), U.S. Territory, or foreign country was this program located?
State: Philippines Canada United Kingdom Nigeria Other
Specify
6. Please indicate all post-high-school degrees you received before starting your initial RN educational program. Mark all that apply.
None ➔ Go to Question 8
Associate Degree Bachelor's Degree Master's Degree Doctorate Other
Specify
7. What was the field of study for your highest degree identified in Question 6? Mark one box only.
Health-related field or Non-health related field
Biological or Physical Science Business or Management Education Liberal Arts, Social Science, or Humanities Law Computer Science Social Work Other non-health related field
Specify
8. Have you ever been licensed as a licensed practical nurse (LPN) or licensed vocational nurse (LVN) in the U.S.?
Yes No
Continued on next page
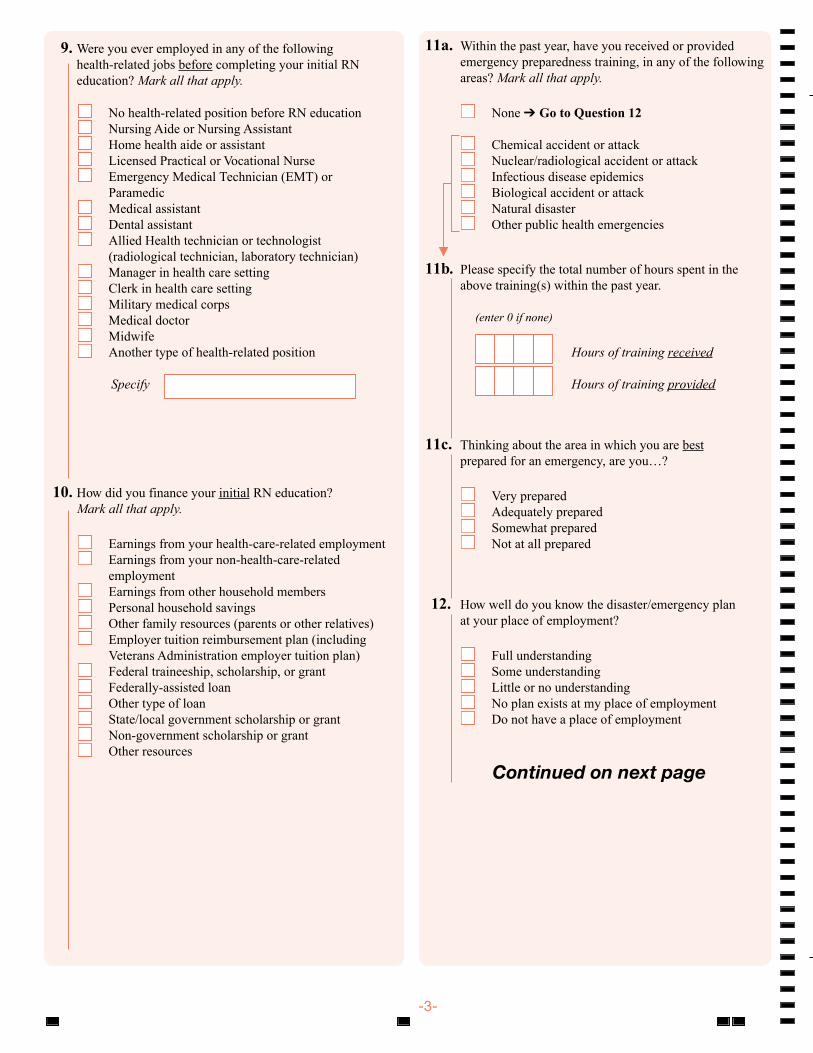
9. Were you ever employed in any of the following health-related jobs before completing your initial RN education? Mark all that apply.
No health-related position before RN education Nursing Aide or Nursing Assistant Home health aide or assistant Licensed Practical or Vocational Nurse Emergency Medical Technician (EMT) or Paramedic Medical assistant Dental assistant Allied Health technician or technologist (radiological technician, laboratory technician) Manager in health care setting Clerk in health care setting Military medical corps Medical doctor Midwife Another type of health-related position
Specify
-3
10. How did you finance your initial RN education? Mark all that apply.
Earnings from your health-care-related employment Earnings from your non-health-care-related employment Earnings from other household members Personal household savings Other family resources (parents or other relatives) Employer tuition reimbursement plan (including Veterans Administration employer tuition plan) Federal traineeship, scholarship, or grant Federally-assisted loan Other type of loan State/local government scholarship or grant Non-government scholarship or grant Other resources
11a. Within the past year, have you received or provided emergency preparedness training, in any of the following areas? Mark all that apply.
None ➔ Go to Question 12
Chemical accident or attack Nuclear/radiological accident or attack Infectious disease epidemics Biological accident or attack Natural disaster Other public health emergencies
11b. Please specify the total number of hours spent in the above training(s) within the past year.
(enter 0 if none)
Hours of training received
Hours of training provided
11c. Thinking about the area in which you are best prepared for an emergency, are you…?
Very prepared Adequately prepared Somewhat prepared Not at all prepared
12. How well do you know the disaster/emergency plan at your place of employment?
Full understanding Some understanding Little or no understanding No plan exists at my place of employment Do not have a place of employment
Continued on next page
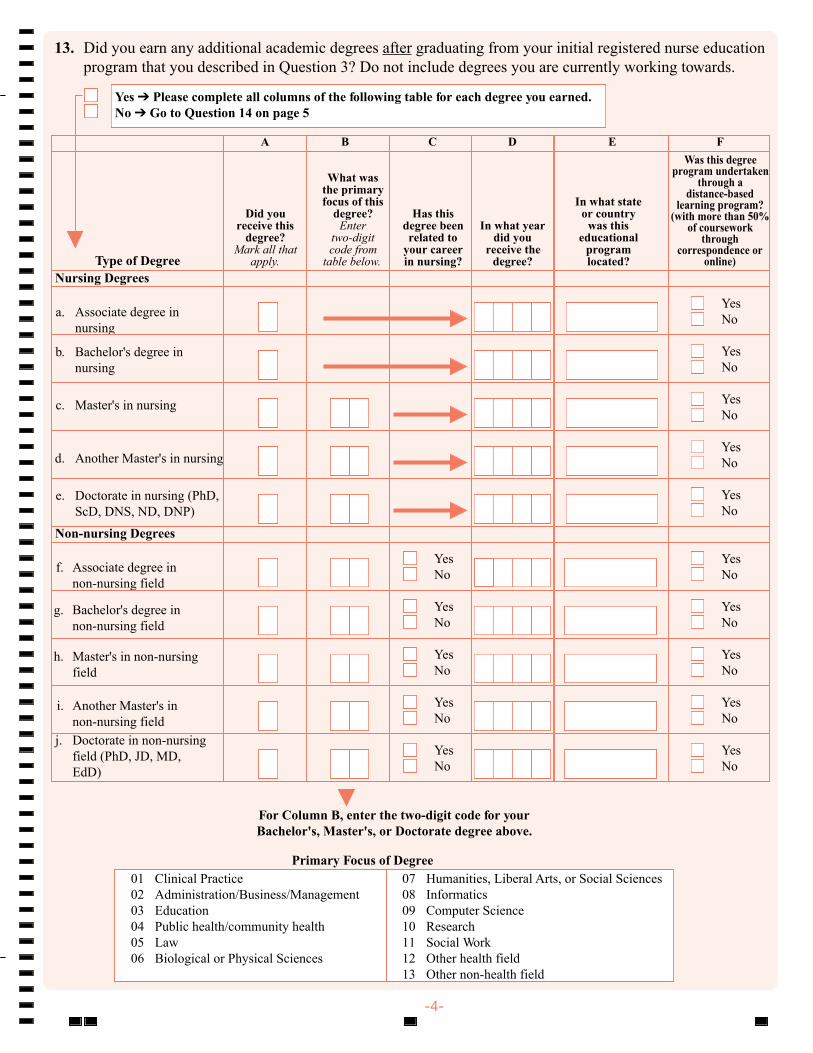
13. Did you earn any additional academic degrees after graduating from your initial registered nurse education program that you described in Question 3? Do not include degrees you are currently working towards.
Yes ➔ Please complete all columns of the following table for each degree you earned. No ➔ Go to Question 14 on page 5
-4
A B C D E F Was this degree
program undertaken through a
distance-based learning program?
(with more than 50% of coursework
through correspondence or
online)
Did you receive this
degree? Mark all that
apply.
What was the primary focus of this
degree? Enter
two-digit code from
table below.
In what state or country
was this educational
program located?
Has this degree been related to
your career in nursing?
In what year did you
receive the degree? Type of Degree
Nursing Degrees
Yes No a. Associate degree in
nursing
b. Bachelor's degree in nursing
Yes No
Yes No
c. Master's in nursing
Yes No d. Another Master's in nursing
e. Doctorate in nursing (PhD, ScD, DNS, ND, DNP)
Yes No
Non-nursing Degrees
Yes No
Yes No f. Associate degree in
non-nursing field
Yes No
Yes No
g. Bachelor's degree in non-nursing field
h. Master's in non-nursing field
Yes No
Yes No
Yes No
Yes No
i. Another Master's in non-nursing field
j. Doctorate in non-nursing field (PhD, JD, MD, EdD)
Yes No
Yes No
For Column B, enter the two-digit code for your Bachelor's, Master's, or Doctorate degree above.
Primary Focus of Degree 01 Clinical Practice 02 Administration/Business/Management 03 Education 04 Public health/community health 05 Law 06 Biological or Physical Sciences
07 Humanities, Liberal Arts, or Social Sciences 08 Informatics 09 Computer Science 10 Research 11 Social Work 12 Other health field 13 Other non-health field
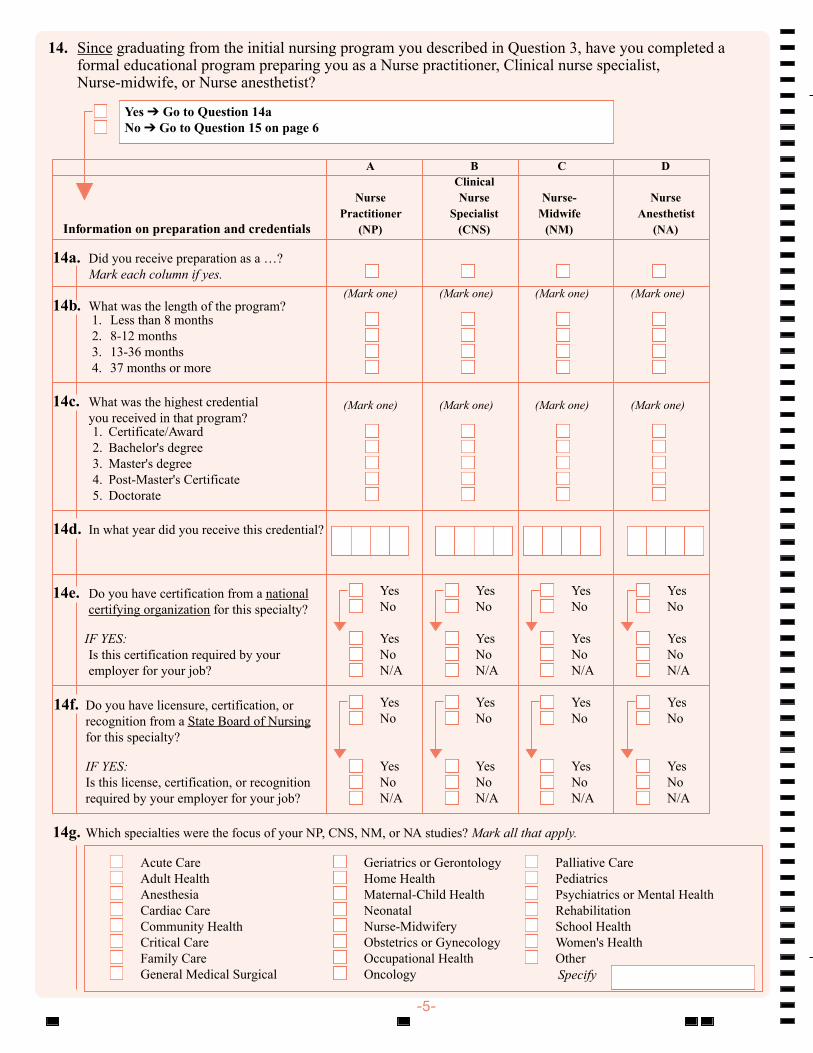
14. Since graduating from the initial nursing program you described in Question 3, have you completed a formal educational program preparing you as a Nurse practitioner, Clinical nurse specialist, Nurse-midwife, or Nurse anesthetist?
Yes ➔ Go to Question 14a No ➔ Go to Question 15 on page 6
A
Nurse Practitioner
(NP)
B Clinical Nurse
Specialist (CNS)
C
Nurse-Midwife
(NM)
D
Nurse Anesthetist
(NA) Information on preparation and credentials
14a. Did you receive preparation as a …? Mark each column if yes.
(Mark one) (Mark one) (Mark one) (Mark one) 14b. What was the length of the program?
1. Less than 8 months 2. 8-12 months 3. 13-36 months 4. 37 months or more
14c. What was the highest credential you received in that program?
(Mark one) (Mark one) (Mark one) (Mark one)
1. Certificate/Award 2. Bachelor's degree 3. Master's degree 4. Post-Master's Certificate 5. Doctorate
14d. In what year did you receive this credential?
14e. Do you have certification from a national certifying organization for this specialty?
Yes No
Yes No
Yes No
Yes No
IF YES: Is this certification required by your employer for your job?
Yes No N/A
Yes No N/A
Yes No N/A
Yes No N/A
14f. Do you have licensure, certification, or recognition from a State Board of Nursing for this specialty?
Yes No
Yes No
Yes No
Yes No
IF YES: Is this license, certification, or recognition required by your employer for your job?
Yes No N/A
Yes No N/A
Yes No N/A
Yes No N/A
14g. Which specialties were the focus of your NP, CNS, NM, or NA studies? Mark all that apply.
Acute Care Adult Health Anesthesia Cardiac Care Community Health Critical Care Family Care General Medical Surgical
Geriatrics or Gerontology Home Health Maternal-Child Health Neonatal Nurse-Midwifery Obstetrics or Gynecology Occupational Health Oncology
Palliative Care Pediatrics Psychiatrics or Mental Health Rehabilitation School Health Women's Health Other Specify
-5
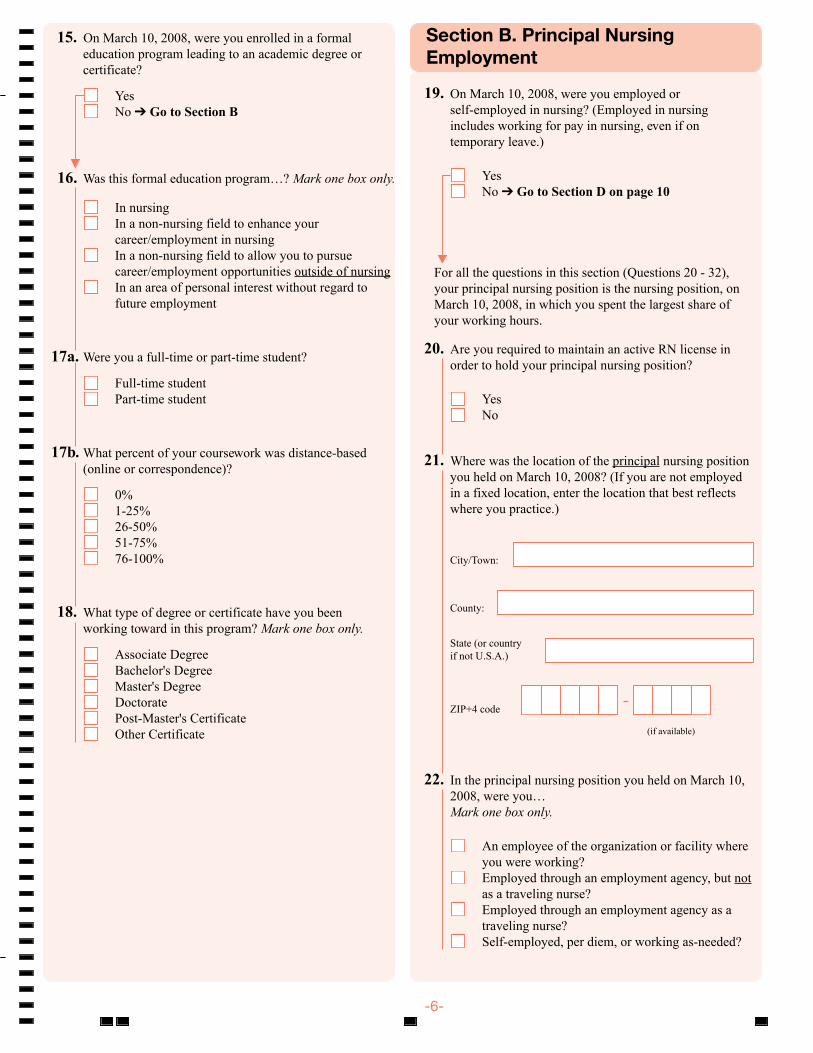
-6
15. On March 10, 2008, were you enrolled in a formal education program leading to an academic degree or certificate?
Yes No ➔ Go to Section B
16. Was this formal education program…? Mark one box only.
In nursing In a non-nursing field to enhance your career/employment in nursing In a non-nursing field to allow you to pursue career/employment opportunities outside of nursing In an area of personal interest without regard to future employment
17a. Were you a full-time or part-time student?
Full-time student Part-time student
17b. What percent of your coursework was distance-based (online or correspondence)?
0% 1-25% 26-50% 51-75% 76-100%
18. What type of degree or certificate have you been working toward in this program? Mark one box only.
Associate Degree Bachelor's Degree Master's Degree Doctorate Post-Master's Certificate Other Certificate
Section B. Principal Nursing Employment
19. On March 10, 2008, were you employed or self-employed in nursing? (Employed in nursing includes working for pay in nursing, even if on temporary leave.)
Yes No ➔ Go to Section D on page 10
For all the questions in this section (Questions 20 - 32), your principal nursing position is the nursing position, on March 10, 2008, in which you spent the largest share of your working hours.
20. Are you required to maintain an active RN license in order to hold your principal nursing position?
Yes No
21. Where was the location of the principal nursing position you held on March 10, 2008? (If you are not employed in a fixed location, enter the location that best reflects where you practice.)
City/Town:
County:
State (or country if not U.S.A.)
ZIP+4 code
(if available)
-
22. In the principal nursing position you held on March 10, 2008, were you… Mark one box only.
An employee of the organization or facility where you were working? Employed through an employment agency, but not as a traveling nurse? Employed through an employment agency as a traveling nurse? Self-employed, per diem, or working as-needed?
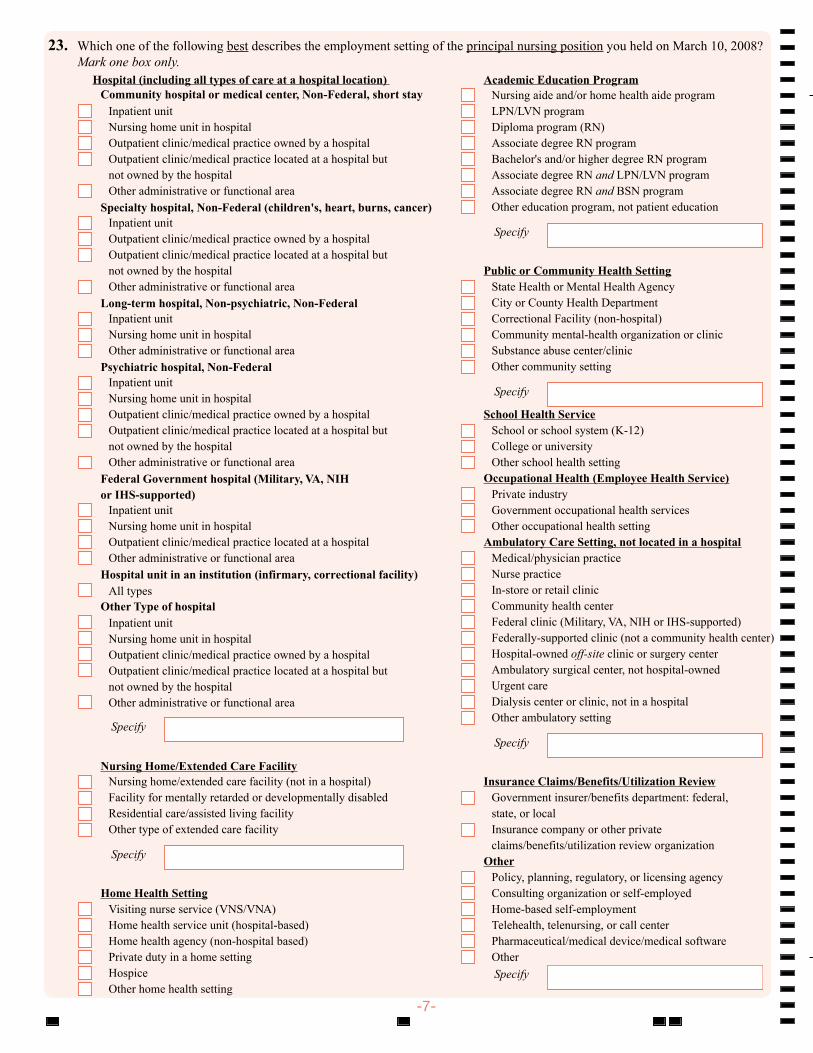
23. Which one of the following best describes the employment setting of the principal nursing position you held on March 10, 2008? Mark one box only.
Hospital (including all types of care at a hospital location) Community hospital or medical center, Non-Federal, short stay
Inpatient unit Nursing home unit in hospital Outpatient clinic/medical practice owned by a hospital Outpatient clinic/medical practice located at a hospital but not owned by the hospital Other administrative or functional area
Specialty hospital, Non-Federal (children's, heart, burns, cancer) Inpatient unit Outpatient clinic/medical practice owned by a hospital Outpatient clinic/medical practice located at a hospital but not owned by the hospital Other administrative or functional area
Long-term hospital, Non-psychiatric, Non-Federal Inpatient unit Nursing home unit in hospital Other administrative or functional area
Psychiatric hospital, Non-Federal Inpatient unit Nursing home unit in hospital Outpatient clinic/medical practice owned by a hospital Outpatient clinic/medical practice located at a hospital but not owned by the hospital Other administrative or functional area
Federal Government hospital (Military, VA, NIH or IHS-supported)
Inpatient unit Nursing home unit in hospital Outpatient clinic/medical practice located at a hospital Other administrative or functional area
Hospital unit in an institution (infirmary, correctional facility) All types
Other Type of hospital Inpatient unit Nursing home unit in hospital Outpatient clinic/medical practice owned by a hospital Outpatient clinic/medical practice located at a hospital but not owned by the hospital Other administrative or functional area
Specify
Nursing Home/Extended Care Facility Nursing home/extended care facility (not in a hospital) Facility for mentally retarded or developmentally disabled Residential care/assisted living facility Other type of extended care facility
Specify
Home Health Setting Visiting nurse service (VNS/VNA) Home health service unit (hospital-based) Home health agency (non-hospital based) Private duty in a home setting Hospice Other home health setting
Academic Education Program Nursing aide and/or home health aide program LPN/LVN program Diploma program (RN) Associate degree RN program Bachelor's and/or higher degree RN program Associate degree RN and LPN/LVN program Associate degree RN and BSN program Other education program, not patient education
Specify
Public or Community Health Setting State Health or Mental Health Agency City or County Health Department Correctional Facility (non-hospital) Community mental-health organization or clinic Substance abuse center/clinic Other community setting
Specify
School Health Service School or school system (K-12) College or university Other school health setting
Occupational Health (Employee Health Service) Private industry Government occupational health services Other occupational health setting
Ambulatory Care Setting, not located in a hospital Medical/physician practice Nurse practice In-store or retail clinic Community health center Federal clinic (Military, VA, NIH or IHS-supported) Federally-supported clinic (not a community health center) Hospital-owned off-site clinic or surgery center Ambulatory surgical center, not hospital-owned Urgent care Dialysis center or clinic, not in a hospital Other ambulatory setting
Specify
Insurance Claims/Benefits/Utilization Review Government insurer/benefits department: federal, state, or local Insurance company or other private claims/benefits/utilization review organization
Other Policy, planning, regulatory, or licensing agency Consulting organization or self-employed Home-based self-employment Telehealth, telenursing, or call center Pharmaceutical/medical device/medical software Other Specify
-7
24. Which one of the following best corresponds to the job title for the principal nursing position you held on March 10, 2008? Mark one box only.
Staff nurse or direct care nurse Charge nurse or team leader First-line management (head nurse, floor supervisor) Middle management/administration (assistant director, house supervisor, associate dean, department head) Senior management/administration (CEO, vice president, nursing executive, dean) Certified Registered Nurse Anesthetist (CRNA) Clinical Nurse Specialist (CNS) Certified Nurse-Midwife (CNM) Nurse practitioner (NP) School nurse Public health nurse Community health nurse Patient educator Staff educator or instructor in clinical setting Staff development director Instructor/lecturer Professor Patient care coordinator, case manager, discharge planner Quality improvement nurse, utilization review nurse Infection control Advice/triage nurse Informatics nurse Consultant Legal nurse Researcher Surveyor/auditor/regulator No position title Other
Specify
25. For the principal nursing position you held on March 10, 2008, did you work…? Mark one box only.
Full-time (including full-time for an academic year) Part-time (including working only part of the calendar or academic year)
26. For the principal position you held on March 10, 2008, how many months would you normally work per year?
months
27. For the principal nursing position you held on March 10, 2008, please provide information about the number of hours you work in a typical week.
Hours (enter 0 if none)
a. Number of hours worked, including all overtime and on-call hours, except on-call hours that were stand-by only
b. Number of hours you stated above in “a” that were worked from on-call duty. Do not include stand-by hours
c. Number of hours you stated above in “a” that were paid as overtime
d. Number of paid overtime hours you stated above in “c” that were mandatory overtime
e. Number of paid or unpaid on-call hours that were stand-by only
f. Number of stand-by hours you stated above in “e” that were paid at an on-call stand-by rate
28. For the principal nursing position you held on March 10, 2008, please estimate the percentage of your time spent in the following activities during a usual workweek. Do not use decimal places.
a. Patient care and charting %
b. Non-nursing tasks (housekeeping, locating supplies) %
c. Consultation with agencies and/or professionals %
d. Supervision and management %
e. Administration %
f. Research %
g. Teaching, precepting or orienting students or new hires (include preparation time)
%
h. Other %
-8
The total should equal 100% 100%
29a. For the principal nursing position you held on March 10, 2008, in what level of care or type of work did you spend the majority of your time? Mark one or more boxes.
General or specialty inpatient Critical/intensive care Step-down, transitional, progressive, telemetry Sub-acute care Emergency Urgent care Rehabilitation Long-term care/nursing home Surgery (including ambulatory, pre-operative, post-operative, post-anesthesia) Ambulatory care (including primary care, outpatient settings, except surgical) Ancillary care (radiology, laboratory) Home health Public health/community health Education Business, administration, review, case management Research Other
Specify
29b. For the principal nursing position you held on March 10, 2008, with what patient population did you spend at least 50% of your patient care time? Mark only one box.
No patient care ➔ Go to Question 30
Adult Geriatric Pre-natal Newborn or neonatal Pediatric and/or Adolescent Multiple age groups (less than 50% time spent with any of the above)
Specify
29c. For the principal nursing position you held on March 10, 2008, in what type of clinical specialty did you spend most of your patient care time? Mark one or more boxes.
No patient care General medical surgical Critical care Cardiac or cardiovascular care Chronic care Dermatology Emergency or trauma care Gastrointestinal Gynecology (women's health) Hospice Infectious/communicable disease Labor and delivery Neurological Obstetrics Occupational health Oncology Primary care Psychiatric or mental health (substance abuse and counseling) Pulmonary/respiratory Radiology (diagnostic or therapeutic) Renal/dialysis No specific area Other specialty for a majority of my time
Specify
30. Please estimate your 2008 pre-tax annual earnings from your principal nursing position. Include overtime and bonuses, but exclude sign-on bonuses.
$ , , .00 per year
31. Were you represented by a labor union or collective bargaining unit in the principal nursing position you held on March 10, 2008?
Yes No
32a. Do you plan to leave or have you left the principal nursing position you held on March 10, 2008?
Yes, have left or will leave within the next 12 months Yes, in 1 year to 3 years
No plans to leave within next 3 years Undecided
32b. Do you plan to work in nursing after you leave that position?
Yes No Unsure
➔ Go to Question 33 on page 10
-9
Section C. Secondary Employment in Nursing
33. Aside from the principal nursing position you just described, did you hold any other positions in nursing for pay on March 10, 2008?
Yes No ➔ Go to Section E on page 11
34. In your other nursing position(s), are you...? Mark all that apply.
An employee of the organization or facility for which you are working? Employed through an employment agency, but not as a traveling nurse? Employed through an employment agency as a traveling nurse? Self-employed, per diem, or working as needed?
35. What type of work settings best describe where you work for your other nursing position(s)? Mark all that apply.
Hospital Nursing home/Extended care facility Academic education program Home health setting Public or community health setting School health service Occupational health Ambulatory care setting Insurance claims/benefits Telehealth, telenursing or call center Other
Specify
36. In your additional nursing position(s), please indicate how much you work, and where the job is located:
Average hours
per week, during weeks
of work
Weeks per year
Locations of where most of work is done
(state, or country)
Additional job #1
Additionaljob #2
All other jobs
N/A
37. Please estimate your 2008 pre-tax annual earnings from all your other nursing position(s). Do not include earnings from your principal nursing position.
$ .00 per year , ,
All go to Section E on page 11
Section D. Nurses Not Working in Nursing
If you were working for pay in nursing on March 10, 2008, please go to Section E on page 11.
38. What are your intentions regarding paid work in registered nursing? Mark one box only.
Have returned to nursing since March 10, 2008 ➔ Go to Section E on page 11 Actively looking for work in nursing Plan to return to nursing in the future, not looking for work now ➔ Go to Question 41 No future intention to work for pay in nursing ➔ Go to Question 42 on page 11 Undecided at this time ➔ Go to Question 42 on page 11
39. How long have you been actively looking for paid work in nursing?
Months (if one or more)
Less than one month
40. Are you looking for a position that is …?
Full-time Part-time Go to Question 42 on page 11 Either
41. When do you plan to return to paid work in nursing?
Years (if one or more)
Less than one year
➔
-10
42. How long has it been since you last were employed or self-employed as a registered nurse?
Years (if one or more)
Less than one year Never worked as a Registered Nurse
43. What are the primary reasons you are not working in a nursing position for pay? Mark all that apply.
Retired Taking care of home and family Burnout Stressful work environment Scheduling/inconvenient hours/too many hours Physical demands of job Disability Illness Inadequate staffing Salaries too low/better pay elsewhere Skills are out-of-date Liability concerns Lack of collaboration/communication between health care professionals Inability to practice nursing on a professional level Lack of advancement opportunities Lack of good management or leadership Career change Difficult to find a nursing position Travel Volunteering in nursing Went back to school Other
Specify
Section E. Employment Outside Nursing
44. On March 10, 2008, were you employed for pay in an occupation other than nursing?
Yes No ➔ Go to Section F on page 12
45. On March 10, 2008, was this non-nursing employment with a health-related organization or in a health-related position?
Yes No
46a. Please select from the list below the item that best describes the field of your principal position outside of nursing. Mark one box only.
Computer services Consulting organization Emergency response (ambulance, fire, police) Financial, accounting, and insurance services Legal Education, elementary and secondary Food services Government Health-related services, outside nursing Pharmaceutical, biotechnology, or medical equipment Real estate Retail sales and services Other
Specify
46b. Which of the following best describes your job title for your principal position outside of nursing? Mark one box only.
Business owner or proprietor Management Sales Instructor or professor Administrative or clerical support Consultant Other type of employee
Specify
47. How many months would you normally work per year in this principal position outside of nursing?
months per year
48. What is the average number of hours you work per week in your principal position outside of nursing?
hours per week
49. Please estimate your 2008, pre-tax annual earnings from your principal position outside of nursing.
$ .00 per year , ,
-11
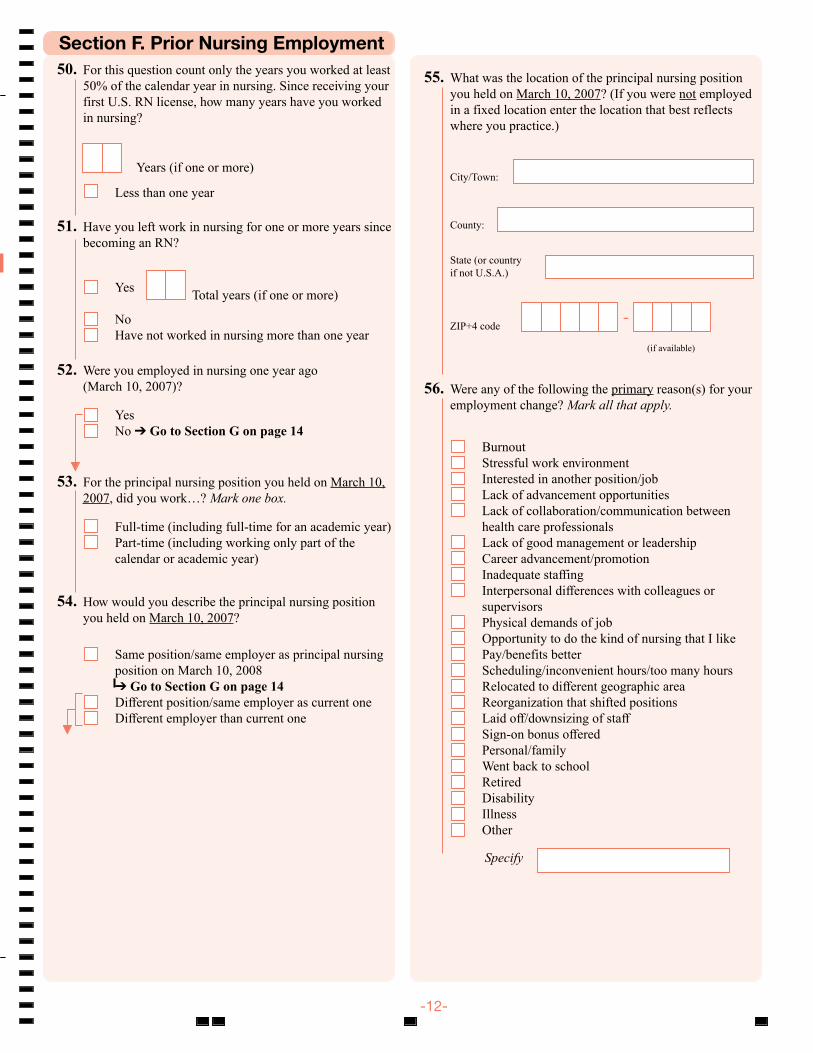
Section F. Prior Nursing Employment 50. For this question count only the years you worked at least
50% of the calendar year in nursing. Since receiving your first U.S. RN license, how many years have you worked in nursing?
Years (if one or more)
Less than one year
51. Have you left work in nursing for one or more years since becoming an RN?
Yes Total years (if one or more)
No Have not worked in nursing more than one year
52. Were you employed in nursing one year ago (March 10, 2007)?
YesNo ➔ Go to Section G on page 14
53. For the principal nursing position you held on March 10, 2007, did you work…? Mark one box.
Full-time (including full-time for an academic year) Part-time (including working only part of the calendar or academic year)
54. How would you describe the principal nursing position you held on March 10, 2007?
Same position/same employer as principal nursing position on March 10, 2008 ➔ Go to Section G on page 14 Different position/same employer as current one Different employer than current one
55. What was the location of the principal nursing position you held on March 10, 2007? (If you were not employed in a fixed location enter the location that best reflects where you practice.)
City/Town:
County:
State (or country if not U.S.A.)
ZIP+4 code
(if available)
56. Were any of the following the primary reason(s) for your employment change? Mark all that apply.
Burnout Stressful work environment Interested in another position/job Lack of advancement opportunities Lack of collaboration/communication between health care professionals Lack of good management or leadership Career advancement/promotion Inadequate staffing Interpersonal differences with colleagues or supervisors Physical demands of job Opportunity to do the kind of nursing that I like Pay/benefits better Scheduling/inconvenient hours/too many hours Relocated to different geographic area Reorganization that shifted positions Laid off/downsizing of staff Sign-on bonus offered Personal/family Went back to school Retired Disability Illness Other
Specify
-12
-
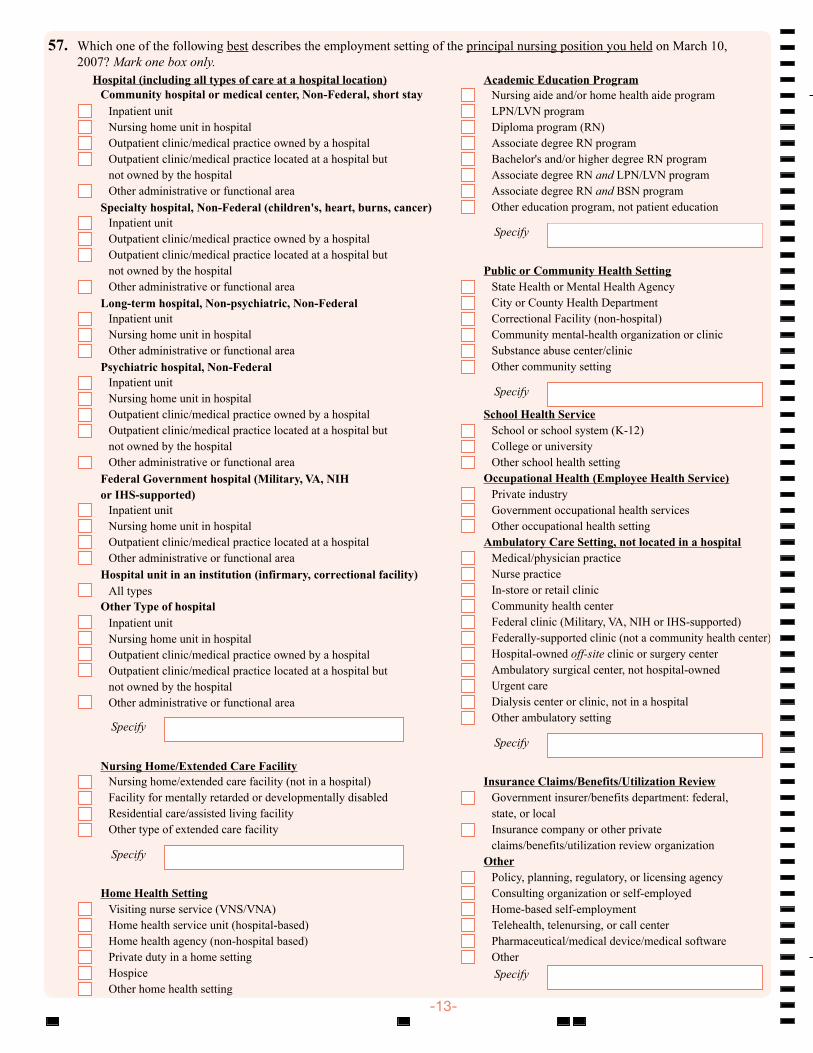
57. Which one of the following best describes the employment setting of the principal nursing position you held on March 10, 2007? Mark one box only.
Hospital (including all types of care at a hospital location) Community hospital or medical center, Non-Federal, short stay
Inpatient unit Nursing home unit in hospital Outpatient clinic/medical practice owned by a hospital Outpatient clinic/medical practice located at a hospital but not owned by the hospital Other administrative or functional area
Specialty hospital, Non-Federal (children's, heart, burns, cancer) Inpatient unit Outpatient clinic/medical practice owned by a hospital Outpatient clinic/medical practice located at a hospital but not owned by the hospital Other administrative or functional area
Long-term hospital, Non-psychiatric, Non-Federal Inpatient unit Nursing home unit in hospital Other administrative or functional area
Psychiatric hospital, Non-Federal Inpatient unit Nursing home unit in hospital Outpatient clinic/medical practice owned by a hospital Outpatient clinic/medical practice located at a hospital but not owned by the hospital Other administrative or functional area
Federal Government hospital (Military, VA, NIH or IHS-supported)
Inpatient unit Nursing home unit in hospital Outpatient clinic/medical practice located at a hospital Other administrative or functional area
Hospital unit in an institution (infirmary, correctional facility) All types
Other Type of hospital Inpatient unit Nursing home unit in hospital Outpatient clinic/medical practice owned by a hospital Outpatient clinic/medical practice located at a hospital but not owned by the hospital Other administrative or functional area
Specify
Nursing Home/Extended Care Facility Nursing home/extended care facility (not in a hospital) Facility for mentally retarded or developmentally disabled Residential care/assisted living facility Other type of extended care facility
Specify
Home Health Setting Visiting nurse service (VNS/VNA) Home health service unit (hospital-based) Home health agency (non-hospital based) Private duty in a home setting Hospice Other home health setting
Academic Education Program Nursing aide and/or home health aide program LPN/LVN program Diploma program (RN) Associate degree RN program Bachelor's and/or higher degree RN program Associate degree RN and LPN/LVN program Associate degree RN and BSN program Other education program, not patient education
Specify
Public or Community Health Setting State Health or Mental Health Agency City or County Health Department Correctional Facility (non-hospital) Community mental-health organization or clinic Substance abuse center/clinic Other community setting
Specify
School Health Service School or school system (K-12) College or university Other school health setting
Occupational Health (Employee Health Service) Private industry Government occupational health services Other occupational health setting
Ambulatory Care Setting, not located in a hospital Medical/physician practice Nurse practice In-store or retail clinic Community health center Federal clinic (Military, VA, NIH or IHS-supported) Federally-supported clinic (not a community health center) Hospital-owned off-site clinic or surgery centerAmbulatory surgical center, not hospital-owned Urgent careDialysis center or clinic, not in a hospital Other ambulatory setting
Specify
Insurance Claims/Benefits/Utilization Review Government insurer/benefits department: federal, state, or local Insurance company or other private claims/benefits/utilization review organization
Other Policy, planning, regulatory, or licensing agency Consulting organization or self-employed Home-based self-employment Telehealth, telenursing, or call center Pharmaceutical/medical device/medical software Other Specify
-13
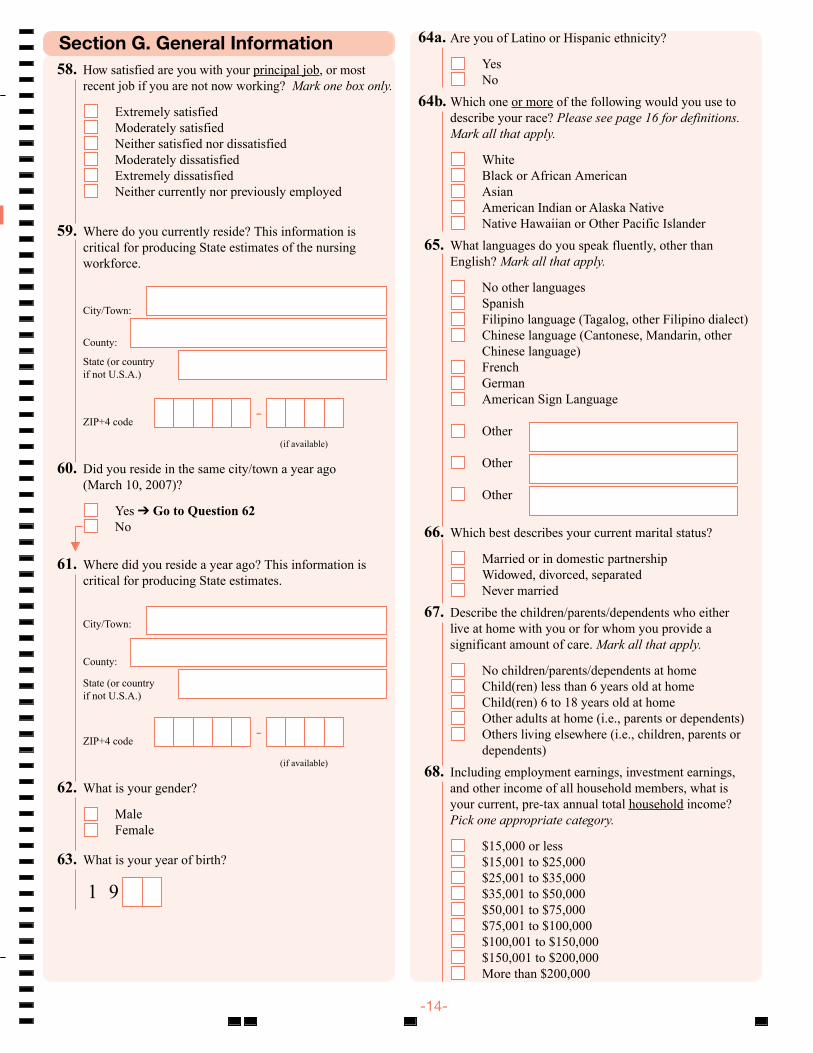
Section G. General Information 58. How satisfied are you with your principal job, or most
recent job if you are not now working? Mark one box only.
Extremely satisfied Moderately satisfied Neither satisfied nor dissatisfied Moderately dissatisfied Extremely dissatisfied Neither currently nor previously employed
59. Where do you currently reside? This information is critical for producing State estimates of the nursing workforce.
City/Town:
County:
State (or country if not U.S.A.)
ZIP+4 code
(if available)
60. Did you reside in the same city/town a year ago (March 10, 2007)?
Yes ➔ Go to Question 62 No
61. Where did you reside a year ago? This information is critical for producing State estimates.
City/Town:
County:
State (or country if not U.S.A.)
ZIP+4 code
(if available)
62. What is your gender?
Male Female
63. What is your year of birth?
1 9
64a. Are you of Latino or Hispanic ethnicity?
Yes No
64b. Which one or more of the following would you use to describe your race? Please see page 16 for definitions. Mark all that apply.
White Black or African AmericanAsian American Indian or Alaska Native Native Hawaiian or Other Pacific Islander
65. What languages do you speak fluently, other than English? Mark all that apply.
No other languages Spanish Filipino language (Tagalog, other Filipino dialect) Chinese language (Cantonese, Mandarin, other Chinese language) French German American Sign Language
Other
Other
Other
66. Which best describes your current marital status?
Married or in domestic partnership Widowed, divorced, separated Never married
67. Describe the children/parents/dependents who either live at home with you or for whom you provide a significant amount of care. Mark all that apply.
No children/parents/dependents at home Child(ren) less than 6 years old at home Child(ren) 6 to 18 years old at home Other adults at home (i.e., parents or dependents) Others living elsewhere (i.e., children, parents or dependents)
68. Including employment earnings, investment earnings, and other income of all household members, what is your current, pre-tax annual total household income? Pick one appropriate category.
$15,000 or less $15,001 to $25,000 $25,001 to $35,000 $35,001 to $50,000 $50,001 to $75,000 $75,001 to $100,000 $100,001 to $150,000 $150,001 to $200,000More than $200,000
-
-
-14
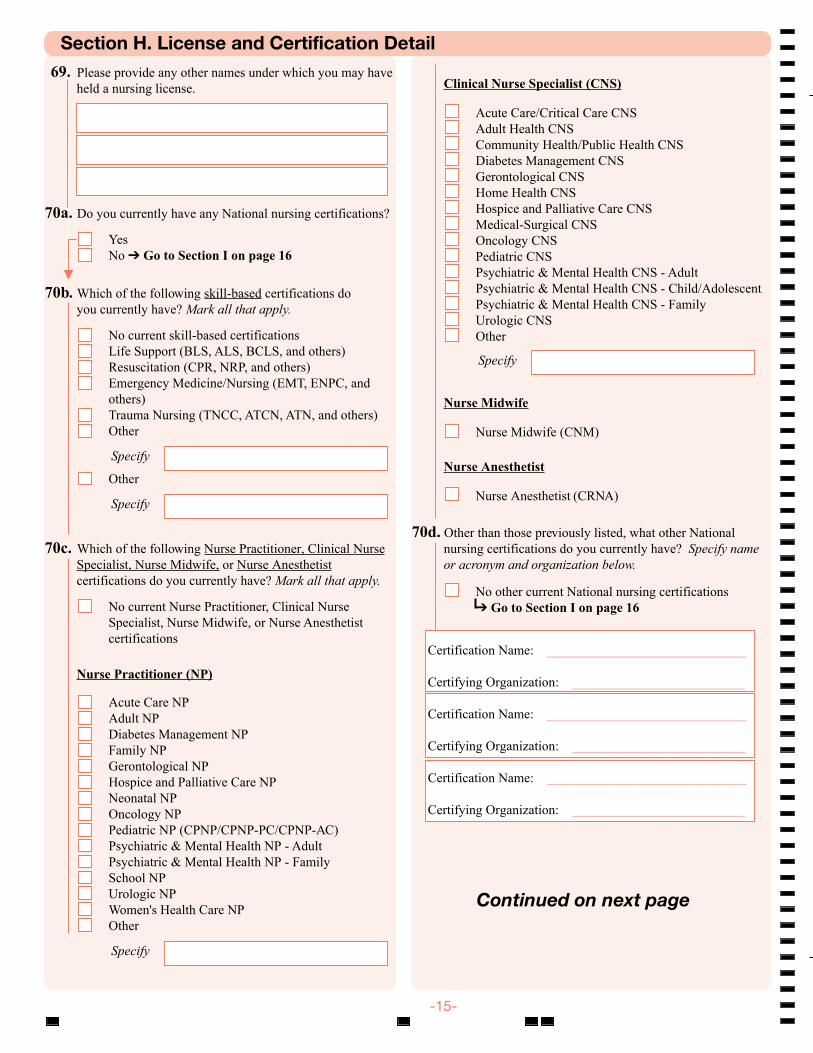
Section H. License and Certification Detail 69. Please provide any other names under which you may have
held a nursing license.
70a. Do you currently have any National nursing certifications?
Yes No ➔ Go to Section I on page 16
70b. Which of the following skill-based certifications do you currently have? Mark all that apply.
No current skill-based certifications Life Support (BLS, ALS, BCLS, and others) Resuscitation (CPR, NRP, and others) Emergency Medicine/Nursing (EMT, ENPC, and others) Trauma Nursing (TNCC, ATCN, ATN, and others) Other
Specify
Other
Specify
70c. Which of the following Nurse Practitioner, Clinical Nurse Specialist, Nurse Midwife, or Nurse Anesthetist certifications do you currently have? Mark all that apply.
No current Nurse Practitioner, Clinical Nurse Specialist, Nurse Midwife, or Nurse Anesthetist certifications
Nurse Practitioner (NP)
Acute Care NP Adult NP Diabetes Management NP Family NP Gerontological NP Hospice and Palliative Care NP Neonatal NP Oncology NP Pediatric NP (CPNP/CPNP-PC/CPNP-AC) Psychiatric & Mental Health NP - Adult Psychiatric & Mental Health NP - Family School NP Urologic NP Women's Health Care NP Other
Specify
Clinical Nurse Specialist (CNS)
Acute Care/Critical Care CNS Adult Health CNS Community Health/Public Health CNS Diabetes Management CNS Gerontological CNS Home Health CNS Hospice and Palliative Care CNS Medical-Surgical CNS Oncology CNS Pediatric CNS Psychiatric & Mental Health CNS - Adult Psychiatric & Mental Health CNS - Child/Adolescent Psychiatric & Mental Health CNS - Family Urologic CNS Other
Specify
Nurse Midwife
Nurse Midwife (CNM)
Nurse Anesthetist
Nurse Anesthetist (CRNA)
70d. Other than those previously listed, what other National nursing certifications do you currently have? Specify name or acronym and organization below.
No other current National nursing certifications ➔ Go to Section I on page 16
Certification Name: ______________________________
Certifying Organization: __________________________
Certification Name: ______________________________
Certifying Organization: __________________________
Certification Name: ______________________________
Certifying Organization: __________________________
Continued on next page
-15

© SCANTRON CORPORATION 2008 ALL RIGHTS RESERVED. -16
de s r m
F O R O F F I C E U S E O N LY
d o
EliteView™ EM-276628-1:654321
Section I. Contact Information/Comments71. If we need to contact you about any of your responses, please provide your e-mail address and telephone number, as well as the
best time of day to reach you.
E-mail address:
Telephone No.: Home Work Cell ( ) -Area Code Telephone Number
Time of day/week best to contact you by phone:
72. Do you have any recommendations for how this survey could be improved? Please print clearly.
Thank You. Please return this survey and any duplicate surveys
in the enclosed, postage-paid envelope.
Definitions for Question 64b White: origins in any of the original peoples of Europe, the Middle East, or North Africa Black or African American: origins in any of the black racial groups of Africa Asian: origins in any of the original peoples of the Far East, Southeast Asia, or the Indian subcontinent including, for example, Cambodia, China, India, Japan, Korea, Malaysia, Pakistan, the Philippine Islands, Thailand, and Vietnam American Indian or Alaska Native: origins in any original peoples of North, Central or South America and who maintains tribal affiliation or community attachment Native Hawaiian or Other Pacific Islander: origins in any of the original peoples of Hawaii, Guam, Samoa, or other Pacific Islands