the rela tionship between two typologies of business
TRANSCRIPT

THE RELA TIONSHIP BETWEEN TWO TYPOLOGIES OF BUSINESS
LEVEL STRATEGIES AND A FIRM'S FINANCIAL
PERFORi'\1ANCE, MAIN ORGANIZATIONAL
ACTIVITIES AND MANAGERS'
CHARACTERISTICS
by
DANIEL MARANTO VARGAS, LA.E., M.C.A.
DISSERT ATION Presented to the Instituto Tecnológico y de
Estudios Superiores de Monterrey Campus Ciudad de México
. in Partial Fulfillment
of the Requirements
for the Degree of
Doctor of Philosophy
I. T. E. S.M. _ c. c. M. BIBLIOTECA
COltCC\ON Dt NtGOCIOS y All ~ DlRtCCION
May 1994

ABSTRACT
THE RELATIONSHIP BETWEEN TWO TYPOLOGIES OF BUSINESS
LEVEL STRATEGIES AND A FIRM'S FINANCIAL
PERFORMANCE, MAL'\f ORGANIZATIONAL
ACTIVITIES AND MANAGER'S
CHARACTERISTICS
by
Daniel Maranto Vargas, L.A.E, M.C.A.
Supervising Professor: Pamela Autrey.
This study has been concerned with empirically testing the relationship between
two typologies of business-leve! strategies with the financia! performance of the
sampled firms, the main activities executed in the organizations, and certain
managerial characteristics.
Data were collected from 184 firms in five industrial sectors. The industries
represented were: the capital goods industry, the metal mechanic industry, the
foundry industry, the construction supply industry, and the chemical industry. The
industries studied account far 16% of the state's GNP. Businesses in the sample
ranged from micro to large-sized. Statistical tools consisted of chi-square analysis,
Pearson 's correlation analysis, t-test analysis. and multiple regression analysis.
Miles and Snow's (1978) and Porter's (1980) typologies were operationalized
using brief descriptions of each category; the respondent was asked to select the
description that most closely resembled his or her firm' s strategy. The tirst authors
proposed the following strategic orientations: defenders, prospectors, analyzers, and
\'I

reactors. Poner suggested three types of generic strategies: overall cost leadership.
overall differentiation, and focus (used in conjunction with either cost leadership or
differentiation). A firm is said to be II stuck in the middle II if it lacks a clear
definition of its generic strategy.
Financial performance indicators were operationalized by using the respondent's
perception of the firm' s net profit margin and market share.
In arder to operationalize the organizational activities, respondents were asked to
rate on a three-point scale the importance of a set of ten activities comrnonJy
performed in a business.
The two managerial characteristics investigated in the research were: whether che
person responsible for the firm' s strategy is the business owner or a professional
manager, and the level of formal education of the person responsible for the firm's
strategy.
This srudy found that Miles and Snow's and Porter's typologies can be used to
characterize the strategies followed by firms in industrial San Luis Potosí.
Descriptive statistics show that most firms in the sample are micro (25. 5 % ) or
small-sized firms (49.5%), that the business owner is usually the person responsible
for the firm' s strategy (72 % ), and that he or she holds at least one bachelor' s degree
(58%).
A number of associations were found between Miles and Snow' s categories and
the financia! performance of the firm. For example, prospectar firms appear to
obtain higher net profit margins compared to the industry's average and higher
market share over the last three years, while defenders appear to have experienced
the opposite results.
VII

/
Sorne organizacional accivicies can be associated with Miles and Snow' s
cacegories. For example, prospectors are more likely to emphasize marketing and
sales, market research. produce research and developmenc. and basic and applied
engineering as opposed to defenders which do not emphasize the latter three.
Poner' s strategies showed a number of significanc associations with certain
financia! performance indicators. It appears that firms following a general
differenciacion strategy increased their market share compared to chac market share
attained under their previous strategy. Stuck-in-che-middle firms have reduced their
markec share and nec profic margin compared to cheir previous strategy. Finally,
firms following a focus differenciacion stracegy obtained a below-average nec profic
margin for the industry. Very few significanc associacions were found between
Poner' s strategies and che organizational activities of the firm.
No significant associacion was found between che strategy (Miles and Snow's and
Porter's) implemented and whecher che person responsible for che firm's scrategy
was che business owner or a professional manager, or between che strategy
implemented and the level of formal educacion.
In conclusion. major findings indicare sorne associations becween chese
typologies and the financia! performance as well as certain organizational accivities
of che firm. This srudy provides managers wich further understanding regarding
possible strategies and academicians wich support for addicional research.
Suggestions for further research include examining additional variables thac may
contribute to explaining che variance in financia! performance, and che replication of
chis srudy in ocher states of che councry in order to find similarities and differences.
viii

Acknowledgements Abstract List of Illustrations
TABLE O F CO NTENTS
I. INTRODUCTION.
11.
111.
LA. I.B. I.C.
Purpose of the research. Problem to be studied. Scope of the study.
REVIEW OF RELA TED LITERA TURE. 11.A. Definition of strategy. II.B. Literature related to Miles and Snow's typology of
11.C.
11.D.
II.E.
11.F.
strategic orientations. Literature related to Porter's generic competitive strategies. Literature related to testing both Miles and Snow' s and Porter' s typologies. Literature related to the business owner or professional manager status. Literature related to the influence of managerial characteristics on strategy.
HYPOTHESES OF THE RESEARCH. 111.A. Propositions related to Miles and Snow's strategic
IV
VI
Xlll
2 3
5 5
11
18
22
23
24
30
orientations. 30
IV.
v.
VI.
111.B. Propositions related to Porter's generic competitive strategies.
METHODOLOGY.
DESCRIPTIVE STATISTICS.
MILES AND SNOW'S TYPOLOGY IN EACH INDUSTRIAL SECTOR. VI.A. VI.B. VI.C. VI.O. VI.E.
The capital goods industry. The metal mechanic industry. The foundry industry. The construction supply industry. The chemical industry.
IX
33
39
45
56 57 58 58 59 60

VII. FINANCIAL PERFORMANCE UNOER MILES ANO SNOW'S TYPOLOGY. 62 VII.A. The capital goods industry. 67 VII.B. The metal mechanic industry. 69 VII.C. The foundry industry. 74 VII.D. The construction supply industry. 76 VII.E. The chemical industry. 78
VIII. MAIN ORGANIZATIONAL ACTIVITIES UNOER EACH STRATEGIC ORIENTATION. 83 VIII.A. The capital goods industry. 85 VIII.E. The metal mechanic industry. 86 VIII.C. The foundry industry. 88 VIII.O. The construction suppl y industry. 90 VIII.E. The chemical industry. 92
IX. GENERAL MANAGER'S STRATEGY IMPLEMENTATION UNDER MILES AND SNOW'S TYPOLOGY. 95 IX.A. The capital goods industry. 96 IX.B. The metal mechanic industry. 97 IX.C. The foundry industry. 98 IX.D. The construction supply industry. 98 IX.E. The chemical industry. 99
X. GENERAL MANAGER'S EDUCATIONAL LEVEL UNDER MILES AND SNOW'S TYPOLOGY. 101 X.A. The capital goods industry. 103 X.B. The metal mechanic industry. 103 X.C. The foundry industry. 104 X.D. The construction suppl y industry. 105 X.E. The chernical industry. 105
XI. PORTER'S TYPOLOGY IN EACH INDUSTRIAL SECTOR. 107 XI.A. The capital goods industry. 107 XI.B. The metal mechanic industry. 108 XI.C. The foundry industry. 109 XI.O. The construction suppl y industry. 110 XI.E. The chernical industry. 1 11
X

XII. FINANCIAL PERFORMANCE UNOER PORTER'S TYPOLOGY. 112 XII.A. The capital goods industry. 118 XII.B. The metal mechanic induscry. 120 XII.C. The foundry industry. 126 XII.D. The construction supply industry. 129 XII.E. The chemical industry. 135
XIII. MAIN ORGANIZATIONAL ACTIVITIES UNOER EACH COMPETITIVE STRATEGY. 142 XIII.A. The capital goods industry. 144 XIII. B. The metal mechanic industry. 146 XIII.C. The foundry industry. 148 XIII.O. The construction supply industry. 151 XIII.E. The chemical industry. 153
XIV. GENERAL MANAGER'S STRATEGY IMPLEMENTATION UNOER PORTER'S TYPOLOGY. 156 XIV.A. The capital goods industry. 157 XIV.B. The metal mechanic industry. 158 XIV.C. The foundry industry. 159 XIV.D. The construction supply industry. 160 XIV.E. The chemical industry. 161
XV. GENERAL MANAGER'S EDUCATIONAL LEVEL UNDER PORTER'S TYPOLOGY. 163 XV.A The capital goods industry. 165 XV.B. The metal mechanic industry. 166 XV.C. The foundry industry. 167 XV.O. The construction supply industry. 168 XV.E. The chemical industry. 168
XVI. CONCLUSIONS AND IMPLICATIONS. 170 XVI.A. Conclusions and implications of the general findings. 171 XVI.B. Conclusions and implications of Miles and Snow's
typology. 172 XVI.C. Conclusions and implications of Porter' s typology. 179 XVI.O. Final comments on conclusions and implications. 184
XI
XVII. LIMITATIONS OF THE STUDY ANO SPECULATIONS FOR FUTURE RESEARCH. XVII.A. Limitations of the study. XVII.B. Speculations for future research.
BIBLIOGRAPHY.
APPENDICES. A. Survey questionnaire. B. Presentation letter.
VITA
XII
186 186 187
190
195 196 210
211
LIST OF ILLUSTRA TIONS
Graph LA. l. Conceptual framework of the research.
Graph LB. l. Classification of the transformation industry in
San Luis Potosí. 4
Table 11.A. l. Sorne typologies of strategy, authors and major
characteristics. 8
Table IV. l. Criteria for size classification. 40
Table IV.2. Sample firms studied. 40
Table V. l. Frequency of Miles and Snow' s categories of
business-leve! strategy. 45
Table V.2. Frequency of Porter' s categories categories of
business-leve] strategy. 46
Table V.3. Size of the businesses in the sample. 46
Table V.4. Firm's net profit margin compared to the industry's
average. 47
Table V.5 Financia! results compared to the previous strategy' s
results. 47
Table V.6. Financia! results over the last three years. 48
Table V.7. Leve] of emphasis placed on the firm' s organizational
activities. 49 Table V.8. Status of the person responsible for the firm 's strategy. 50
Table V.9. Education of the person responsible for the business'
strategy. 51
Table V.10. Miles and Snow's categories and business size as
explanation of financia] performance. 52
Table V.11. Porter' s categories and business size as
explanation of financia] performance. 53
Table VI. l. Miles and Snow's typology by firm size in the sample. 56
Table VI.A. l. Miles and Snow's typology by firm size in the capital goods industry. 57
XIII

Table VI.B. l Miles and Snow's typology by firm size in the metal
mechanic industry. 58
Table VI.C. l. Miles and Snow's typology by firm size in the foundry
industry. 59
Table VI.O. l. Miles and Snow's typology by fi.rm size in the construction
suppl y industry. 59
Table VI.E. l. Miles and Snow's typology by firm size in the chemical
industry. 60
Table VII. l. Miles and Snow' s typology correlated wi th financia!
performance indicators. 63
Table VII.A. l. Miles and Snow's typology correlated with financia!
performance indicators in the capital goods industry. 68
Table VII.B. l Miles and Snow's typology correlated with financia!
performance indicators in the metal mechanic industry. 70
Table VII.C.1. Miles and Snow's typology correlated with financia!
performance indicators in the foundry industry. 75
Table VII.O. l. Miles and Snow's typology correlated with financia!
performance indicators in the constructíon supply industry. 77
Table VII.E. l. Miles and Snow's typology correlated with financia!
performance indicators in the chemical industry. 79 Table VIII. l. Miles and Snow' s typology correlated with main
organizational activíties. 83
Table VIII.A. l. Miles and Snow's typology correlated with main
organizational activíties in the capital goods industry. 85
Table VIII.B. l. Miles and Snow's typology correlated with main
organizational activities in the metal mechanic industry. 87
Table VIII.C.1. Miles and Snow's typology correlated with main
organizational activities in the foundry industry. 89
Table VIII.O. l. Miles and Snow's typology correlated with main
organizational activíties in the construction supply industry. 91
Table VIII. E. l. Miles and Snow' s typology correlated with main
organizational activitíes in the chemical industry. 93
XI\.
Table IX. l. Strategy vis-a-vis person responsible for its implementation. 95
Table IX.A. l. Strategy vis-a-vis person responsible for its implementation
in the capital goods industry. 96 Table IX.B. l. Strategy vis-a-vis person responsible for its implementation
in the metal mechanic industry. 97
Table IX.C. l. Strategy vis-a-vis person responsible for its implementation
in the foundry industry. 98 Table IX.D. l. Strategy vis-a-vis person responsible for its implementation
in the construction supply industry. 99 Table IX.E. l. Strategy vis-a-vis person responsible for its implementation
in the chemical industry. 100 Table X. l. Strategy by educational leve! of the person responsible
for its implementation. 101 Table X.2. Strategy by grouped educational level of the person
responsible for its implementation. 102 Table X.A. l Strategy by educational leve! of the person responsible for
its implementation in the capital goods industry. 103 Table X.B.l. Strategy by educational leve! of the person responsible for
its implementation in the metal mechanic industry. 103 Table X.C. l. Strategy by educational leve! of the person responsible for
its implementaiton in the foundry industry. 104
Table X.D. l. Strategy by educational leve] of the person responsible for
its implementation in the construction supply industry. 105 Table X.E.l. Strategy by educational leve! of the person responsible for
its implementation in the chemical industry. 106
Table XI. l. Categories of strategy by firm size. 107
Table XI.A. l. Categories of strategy by firm size in the capital goods
industry. 108
Table XI.B. l. Categories of strategy by firm size in the metal mechanic
industry. 108
Table XI.C. l. Categories of strategy by firm size in the foundry industry. 109
X\"

Table XI.D. l. Categories of strategy by firm size in the construction
supply industry. 110
Table XI. E. l. Categories of strategy by firm size in the chemical industry. 111
Table XII. l. Porter' s categories oc' strategy correlated with financia!
performance indicators. 113
Table XII.A.!. Porter's categories of strategy correlated with financia!
performance indicators in the capital goods industry. 119
Table XII. B. l. Porter' s categories of strategy correlated with financia!
performance indicators in the metal mechanic industry. 121
Table XII. C. l. Porter' s categories of strategy correlated with financia!
performance indicators in the foundry industry. 128
Table XII.D. l. Porter's categories of strategy correlated with financia!
performance indicators in the construction supply
industry. 130
Table XII. E. l. Porter' s categories of strategy correlated with financia!
performance indicators in the chemical industry. 136
Table XIII. l. Porter' s categories of strategy correlated with main
organizational activities. 142
Table XIII.A. l. Porter's categories of strategy correlated with main
organizational activities in the capital goods industry. 145
Table XIII.B. l. Porter's categories of strategy correlated with main
organizational activities in the metal mechanic industry. 146
Table XIII.C. l. Porter's categories of strategy correlated with main
organizational activities in the foundry industry. 148
Table XIII.D. l. Porter's categories of strategy correlated with main
organizational activities in the construction
supply industry. 151
Table XIII. E. l. Porter' s categories of strategy correlated with main
organizational activities in the chemical industry. 153
Table XIV. l. Strategy vis-a-vis person responsible for its implementation. 156
Table XIV.A. l. Strategy vis-a-vis person responsible for its implementation
in the capital goods industry. 157

Table XIV. B. l Strategy vis-a-vis person responsible for its implementation
in the metal mechanic industry. 158
Table XIV. C. 1 Strategy vis-a-vis person responsible for its implementation
in the foundry industry. 159
Table XIV .D. l. Strategy vis-a-vis person responsible for its implementation
in the construction supply industry.
Table XIV.E. l. Strategy vis-a-vis person responsible for its implementation
in the chemical industry.
Table XV. l. Strategy by educational leve! of the person responsible
for its implementation.
Table XV.2. Strategy by grouped educational leve! of the person
160
162
163
responsible for its implementation. 164
Table XV .A. l. Strategy by educational level of the person responsible
for its implementation in the capital goods industry. 165
Table XV.B. l. Strategy by educational leve! of the person responsible
for its implementation in the metal mechanic industry. 166
Table XV. C. l. Strategy by educational leve! of the person responsible
for its implementation in the foundry industry. 167
Table XV.O. l. Strategy by educational level of the person responsible
for its implementation in the construction supply industry. 168
Table XV.E. l. Strategy by educational level of the person responsible
for its implementation in the chemical industry. 169
X\'11

l. INTRODUCTION.
I.A. Purpose of the research.
This research is aimed at finding the existence of significant relationships
between a firm 's competitive strategy, certain characteristics of the firm and general
manager (see Graph I.A.1).
Gra h I.A.1. Conce tual framework of the research.
Financia! performance
Strategy typology
Organizational activities
Manager's characteristics
The fundamental research question which follows is: To what extent are Miles
and Snow's (1978) and Porter's (1980) categories of strategies applicable to the
manufacturing sector of San Luis Potosí?
Miles and Snow's (1978) and Porter's (1980) typologies of strategy were
selected for the study for two major reasons: first, because of their widespread use
in the literature on strategy (Snow and Hambrick, 1980; Snow and Hrebiniak,
1980; Hambrick, I 983; Dess and Da vis, 1984; Smith et al. 1986; Miller, 1988;
Shortell and Zajac, 1990), and second, because both provide a methodological
framework for studying the industrial sector of San Luis Potosí.
2
I.B. Problem to be studied.
This study seeks to contribute to the understanding of the industrial setting
where it was conducted. To the author' s knowledge, little has been researched
related to strategies followed by general managers in San Luis Potosí in terms of
financia! performance, major organizational activities, the influence of ownership or
professional management status on the strategy selected, or the relationship of the
strategy selected to the degree of formal education.
A clearer understanding of the strategies followed by the firms classified in the
industries under study is important because businesses are facing both increasing
competition and changing environments, which require accurate decisions in order
to break the competitive environment and reestablish it under improved conditions
for the firm.
SpecificaJl y, the problem to be studied is whether Miles and Snow' s (1978) and
Porter' s (1980) typologies of business strategy are useful as a framework to study
strategy-making in San Luis Potosí.
This seems to be an important research problem because much knowledge is
needed among practitioners and academicians related to competitive strategy
implementation. On the one hand, the answers found in this research should provide
managers with a reference framework for strategic planning. It is expected that this
research will contribute to their knowledge of how strategy categories relate to
financia! performance, the firm' s major organizational activities, the professional or
general management status, and the decision maker' s educational leve!. On the
other hand, this research may serve academicians as a basis for further research in

3
the field of strategic planning in Mexico' s rnanufacturing context, which m turn
will assist managers in rnaking wiser decisions for their tirrns.
I.C. Scope of the study.
The study was conducted in five industrial sectors of the city of San Luis Potosí
and its metropolitan area. These sectors were: the capital goods industry, the metal
mechanic industry, the foundry industry, the construction supply industry, and the
chemical industry. They were selected for the study because they are more
developed in terms of technology, managerial capabilities and industrial
organization than other manufacturing sectors such as the food, beverage and
tobacco, or the furniture and wood-processing industries which are--for the most
part--more fragmented, domestic shops (ITESM-SLP-CEE, 1993). The sample
included micro, small, medium and large businesses. Other sectors that belong to
the manufacturing industry are the textile sector, and the paper production and
printing sector (see Graph I.C. l). The manufacturing industry accounts for 30% of
the state's GNP (ITESM-SLP-CEE, 1992, p.27), and the sectors of interest for this
research account for 56.12% of the state's manufacturing industry (or 16.84% of
the states' GNP). Manufacturing industry as a whole accounts for 80% of
production of the state' s transformation industry, which also includes construction
( 18 % ) and generation of electricity (2 % ).
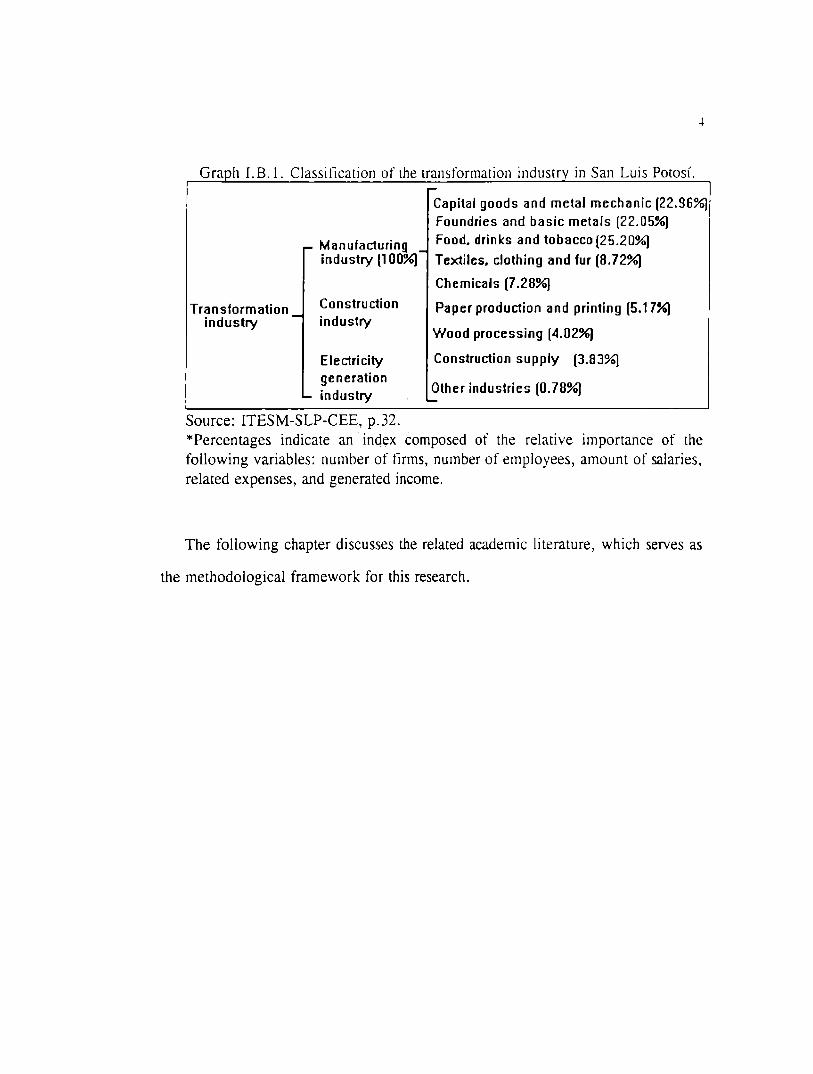
Graph I.B. l. Classification of the transformation industrv in San Luis Potosí.
Transformation _ industry
- Manufacturing _ industry (100%)
Construction industry
Electricity generation
-- industry
Source: ITESM-SLP-CEE, p.32.
-Capital goods and metal mechanic (22.96%) Foundries and basic metals (22.05%) Food. drinks and tobacco (25.20%)
Textiles. clothing and fur (8.72%)
Chemicals (7.28%)
Paper production and printing (5.17%)
Wood processing (4.02%)
Construction supply (3.83%)
Other industries (0.78%) -*Percentages indicate an index composed of the relative importance of the following variables: number of firms, number of employees, amount of salaries. related expenses, and generated income.
The following chapter discusses the related academic literature, which serves as
the methodological framework for this research.

11. REVIEW OF RELATED LITERATURE.
U.A. Definition of strategy.
The term srrategy has been defined in a variety of ways. Most definitions
include a deliberate and conscious set of guidelines that determines future decisions
into the future (Mintzberg, 1978). Mintzberg distinguishes between inrended
strategy and realized strategy. The former is an a priori conceptualization of the
term and more closely resembles a plan to be followed. The latter is defined by
Mintzberg as a pattern in a stream of decisions.
Chandler (1962, p.13) defined strategy as " ... the determination of the basic
long-term goals and objectives of the enterprise and the adoption of courses of
action and the allocation of resources necessary for carrying out these goals."
These two definitions underline a factor common to strategy which is of interest
to this research: strategy is what administrators do, or at least intend to do, to
achieve results perceived as positive for the organization they manage.
Ansoff (1988) propases that strategy consists of severa! sets of decision-making
rules for the guidance of organizational behavior. These are:
l. Yardsticks by which the present and future performance of the firm is
measured. The quality of these yardsticks is usually termed objectives, and the
desired quantity goals.
2. Rules for developing the firm' s relationship with its exrernal environment: what
products-technology the firm will develop, where and ro whom products are to
be sold, and how the firm will gain advantage over competitors. This set of
rules is called the product-market or business strategy.
5

6
3. Rules for establishing the internal relations and processes wirhin the
organization; this is frequently called administrative strategy.
4. The rules by which the firm conducts its day-to-day business, called maJor
operating policies.
Ansoff ( 1988) defines several distinguishing characteristics of a business strategy:
1. The process of business strategy formulation results in no immediare acrion.
Rather, it sets the general directions in which the firm will grow and develop.
2. Therefore, strategy must next be used to generate strategic projects through a
search process. The role of strategy in this search is, first, to focus on areas
defined by strategy, and second, to filrer out the uncovered possibilities which
are inconsistent with the strategy.
3. Thus, strategy becomes unnecessary whenever the hisrorical dynamics of an
organization will take it where it wanrs to go; this is to say, when the search
process is already focused on preferred areas.
4. At the time of strategy formulation, it is not possible to enumerate ali the
project possibilities which will be uncovered. Therefore, strategy formulation
must be based on highly aggregared, incomplere and uncerrain informarion
about classes of alternatives.
5. When the search uncovers specific alternatives, the more precise, less
aggregated information which becomes available may cast doubts on the wisdom

7
of the original strategy choice. Thus, successful use of strategy requ1res
strategic feedback.
6. Since both strategy and objectives are used to filter projects, they appear to be
similar. Yet they are distinct. Objecrives represent rhe ends which the firm is
seeking to attain, while the straregy is rhe means ro rhese ends. The objectives
are higher-level decision rules. A strategy which is valid under one set of
objectives may lose its validity when the objectives of the organization are
changed.
7. Finally, strategy and objecti ves are interchangeable; both at different points in
time and at different levels of organization. Thus, sorne attributes of
performance (such as, for example, market share) can be an objective of the
firm at one time and its strategy at another. Further, as objectives and strategy
are elaborated throughout an organization, a typical hierarchical relationship
results: elements of strategy at a higher managerial leve! become objectives at a
lower one.
Also, Ansoff makes an important distinction between two related types of
strategy used to characterize the thrust of the firm' s strategic development. The first
is called the straregic pon/olio srraregy and the second the comperitive srraregy.
The portfolio strategy conceives the firm as an assembly of distinctive srraregic
business areas (SBA 's), each of which offers different future growth/profitability
opportunities and/or will require different competitive approaches. Competitive

8
strategy, on the other hand, specifies the distinctive approach which the firm
intends to use in order to succeed in each of the strategic business areas.
This research focuses on the comperilive srraregy of the firm and assumes that
the pon/olio srrategy is determined by corporative managers not by the top
managers of the SBA.
Severa! typologies of strategy exist in the academic literature (Buzzell et al.
1975; Uterback and Abernathy, 1975; Hofer and Achendel, 1987; Yesper, 1979;
Wissema et al. 1980; Porter, 1980; Miles, 1982). All of them are aimed at finding
common patterns in strategy selection among firms competing in a specific
industry. Galbraith and Schendel (1983) provide a summary of the major
characteristics of each of them (see Table II.A. l).
Table II.A. l. Sorne tv olo0 ies of strate0 , authors and ma·or characteristics.
Author and strategy !abe!
Buzell et al. ( 1975)
( 1) Building
(2) Holding
(3) Harvesting
Characteristics of strategy type
High investment to increase market share
Investment at market share norms to maintain
market share
Low investment allowing market share to decrease,
cost controls to generate cash flows and
profitability

')
Table II.A.1. (Continued)
Utterback and Abernathy ( 1975)
(1) Performance maximizing Emphasis on product and/or service performance,
technology, and product R&D emphasized
(2) Sales maximizing
(3) Cost minimizing
Hoffer and Schendel ( 1978)
( 1) Share increasing
(2) Growth
(3) Profit
(4) Market concentration
and asset reduction
(5) Turnaround
(6) Liquidation
Vesper (1979)
(1) Multiplication
(2) Monopolizing
(3) Specialization
( 4) Liquidation
Market emphasis to increase total sales and market
share of firm
Emphasis placed on processes, technology, and
R&D to decrease total cost of production
High investment to increase market share
Maintain position m expanding markets,
investment at industry norms
Investment at industry norms, cost controls to 11 throw off cash 11
Realignment of resources to focused, smaller
segments
Improve strategic posture, may require investment
Generate cash while withdrawing from market
Expansion of market share by multiplying present
market structures
Eliminate competition, establish entry barriers, and
control resources
Specialize in products and/or production process
Give up business and market position
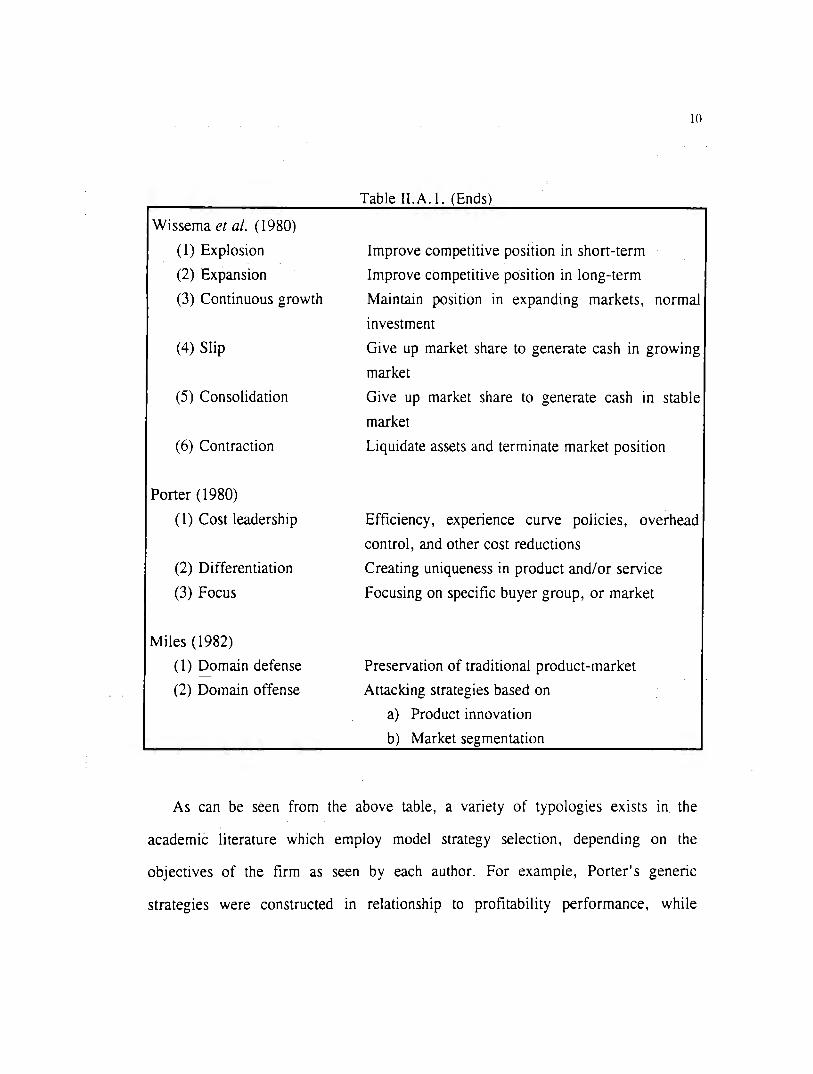
Wissema et al. ( 1980)
( 1) Explosion
(2) Expansion
(3) Continuous growth
(4) Slip
(5) Consolidation
(6) Contraction
Porter ( 1980)
(1) Cost leadership
(2) Differentiation
(3) Focus
Miles ( 1982)
( 1) Domain defense
(2) Domain offense
Table II.A. l. (Ends)
Improve competitive position in short-term
Improve competitive position in long-term
lO
Maintain position in expanding markets, normal
investment
Give up market share to generate cash in growing
market
Give up market share to generate cash in stable
market
Liquidate assets and terminate market position
Efficiency, expenence curve policies, overhead
control, and other cost reductions
Creating uniqueness in product and/or service
Focusing on specific buyer group, or market
Preservation of traditional product-market
Attacking strategies based on
a) Product innovation
b) Market segmentation
As can be seen from the above table, a variety of typologies exists rn the
academic literature which employ model strategy selection, depending on the
objectives of the firm as seen by each author. For example, Porter' s genenc
strategies were constructed in relationship to profitability performance, while

11
Buzzels' gen ene strategies are directl y related to market share performance
(Galbraith and Schendel, 1983).
The following three sections address the rev1ew of the literature specifically
related to Miles and Snow' s (1978) and Porter' s ( 1980) typologies of strategy sin ce
both comprise the core methodological framework of this research.
11.B. Literature related to Miles and Snow's typology of strategic orientations.
Miles and Snow (1978) identified three problems of organizational adaptation (the
adaptive cycle): the entrepreneurial, engineering, and administrative problems. The
entrepreneurial problem refers to the selection of a specific product or service and a
target market, or market segment which the firm selects to serve. The engineering
problem in vol ves the creation of a system which puts management' s solution to the
entrepreneurial problem into actual operation. The administrative problem is
primarily that of rationalizing and stabilizing those activities which successfully
solve problems faced by the organization during the entrepreneurial and engineering
phases. Miles and Snow proposed four types of paradigms by which organizations
frame the three problems described. The authors, based on their own research and
review of the literature, propase that firms can be classified within one of the
following four types of organizational adaptation: defenders, prospectors, analyzers
and reactors.
Defenders are organizations which have narrow product market domains. Top
mz: .Jgers m this type of organization are highly expert in their organization' s
li ,. ed area of operation but do not sr,arch outside of their domains for new

12
opportunities. As a result of this narrow focus. these organizations seldom need to
make major adjustments in their technology, structure, or methods of operation.
Ir.stead, they devote primary attention to improving the efficiency of the existing
operations.
Prospectors are defined as organizations which almost continually search for
market opportunities and which regularly experiment with potential responses to
emerging environmental trends. Thus, these organizations are the creators of change
and uncertainty to which their competitors must respond. However, because of their
strong concern for product and market innovation, they usually are not completely
efficient.
Analyzers are organizations which operate in two types of product market
domains: one relatively stable, the other changing. In their stable areas, these
organizations operate routinely and efficiently through the use of formalized
structures and processes. In their more turbulent areas, top managers watch their
competitors closely for new ideas and then rapidly adopt those which appear to be
the most promising.
Reactors are the organizations m which top managers frequently perce1ve
change and uncertainty occurring in their organizational environments but are
unable to respond effectively. Because this type of organization lacks a consistent
strategy-structure relationship, it seldom makes adjustments of any sort until forced
to do so by environmental pressures.

13
Strategy researchers have elaborated on Miles and Snow's work. Hambrick
(1983) tested and extended the Miles and Snow typology. In particular, he was
interested in researching: 1) how the industry environment influences the
effectiveness of Miles and Snow's strategic types, and 2) how the strategic types
differ in their functional tendencies. Based on a sample of businesses in the PIMS
(Profit Impact of Marketing Strategy) data base, the study explored the
effectiveness of the strategic types in the different environments and the ways in
which defenders and prospectors differed in their functional attributes. The author
reported that defenders and prospectors differed in their performance tendencies
depending on the nature of the environment and the performance measure used.
Defenders outperformed prospectors in terms of current profitability and cash flow
in every type of environment examined: growth industry, mature industry,
noninnovative industry, and innovative industry. Prospectors outperformed
defenders in terms of market share gains, but only in innovative industries. In such
industries, prospectors were rewarded for their adaptive stance. In noninnovative
industries, prospectors engaged in "unnecessary" adaptation, thus receiving no share
reward while incurring low profits and cash flows.
Shortell and Zajac (1990) conducted a study that sought to test the reliability
and validity of Miles and Snow's typology. Based on data from a sample of 400
organizations in the hospital industry (collected at two points in time), the authors
examined dimensions of the typology using both perceptual self-typing and archiva}
data from multiple sources. The authors were interested in testing the following
hypotheses:
14
1. Organizations classified as prospectors are likely to: (a) place greater emphasis
on new service and new market development strategies, (b) offer more
diversified services, (e) have more diversified new services initiated in recent
years, (d) have a higher ratio of diversified to nondiversified services, (e) offer
more high-technology services, and (f) have a greater number of new diversified
services planned for the future than organizations classified as analyzers.
Analyzers are more likely than defenders to have the higher levels noted.
2. Organizations classified as defenders will have the lowest percentage of their
services in high-growth areas, and prospectors will have the highest percentage
in high-growth areas. Analyzers will occupy an intermediate position.
3. Organizations classified as prospectors will emphasize new market and new
service development strategies in their core business more than analyzers who,
in turn, will emphasize such strategies more than defenders.
4. Organizations classified as prospectors are likely to: (a) offer a greater number
of diversified services two years after data are first collected, and (b) initiate
more new diversified services over a two-year period than analyzers. Analyzers
will have higher levels than defenders.
5. Organizations classified as defenders will score the highest on planning process
formality of the three types studied, followed by analyzers and prospectors.
6. Organizations classified as prospectors will score the highest on planning
innovativenness of the three types studied , followed by analyzers and
defenders.

15
7. Organizations classified as prospectors will make the strongest market research
efforts of the three types studied, followed by analyzers and defenders.
Reactor firms were not included in the study because they lack a consistent
strategy; thus no a priori predictions could be made regarding their behavior.
The results found by Shortell and Zajac ( 1990) provide strong support for the
measurement validity of Miles and Snow's (1978) strategic types. Of the 26
analyses of variance, 24 were significant in the predicted ordering. For one of the
exceptions--the number of new diversified services offered in the two years
preceding the second set of data--results were in the predicted direction, but the
overall differences were not statistically significant. The second exception involved
planning process formality in which, contrary to prediction, prospectors and
analyzers scored higher than defenders. According to Shortell and Zajac (1990),
this finding suggests that prospectors may require a more formal planning system
than other strategic types to improve their responses to new market opportunities.
Snow and Hrebiniak ( 1980) examined the relationships among strategy,
distinctive competence, and organizational performance in four industries: plastics,
semiconductors, automotive, and air transportation. The following hypotheses were
tested in the Snow and Hrebiniak study:
1. Top managers will report that ali four strategies are being pursued in their
industry with defenders, prospectors, and analyzers distributed about equally
and far outnumbering reactors.
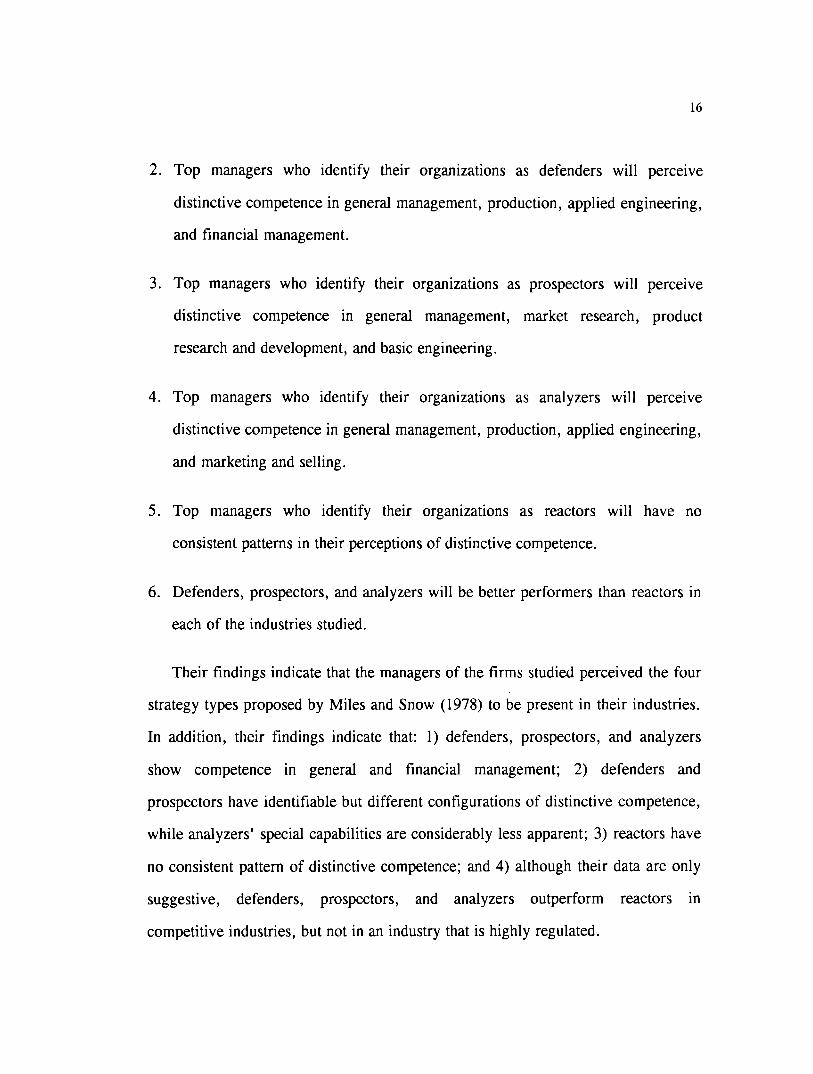
16
2. Top managers who identify their organizations as defenders will perce1ve
distinctive competence in general management, production, applied engineering,
and financia! management.
3. Top managers who identify their organizations as prospectors will perceive
distinctive competence in general management, market research, product
research and development, and basic engineering.
4. Top managers who identify their organizations as analyzers will perce1ve
distinctive competence in general management, production, applied engineering,
and marketing and selling.
5. Top managers who identify their organizations as reactors will have no
consistent patterns in their perceptions of distinctive competence.
6. Defenders, prospectors, and analyzers will be better performers than reactors in
each of the industries studied.
Their findings indicate that the managers of the firms studied perceived the four
strategy types proposed by Miles and Snow (1978) to be present in their industries.
In addition, their findings indicate that: 1) defenders, prospectors, and analyzers
show competence in general and financia! management; 2) defenders and
prospectors have identifiable but different configurations of distinctive competence,
while analyzers' special capabilities are considerably less apparent; 3) reactors have
no consistent pattern of distinctive competence; and 4) although their data are only
suggestive, defenders, prospectors, and analyzers outperform reactors m
competitive industries, but not in an industry that is highly regulated.

17
Smith, Guthrie and Chen (1986) conducted a study in 47 electronic
manufacturing firms that investigated Miles and Snow' s typology, and its
relationship with organizational size and organizational performance. Specifically,
the study investigated:
l. Miles and Snow's typology using a multivariate approach. The objective was to
determine the extent to which four clusters found in the study resembled the
prospector, analyzer, defender and reactor strategies described by Miles and
Snow.
2. The relationship between Miles and Snow's four strategies and organizational
performance.
3. The relationship between strategy, organizational size, and performance.
The authors reported in their study:
l. Four different strategies resembling Miles and Snow's typology.
2. That defenders, analyzers and prospectors perform equally well and consistently
outperform reactors.
3. That there is a significant interaction between strategy and size on performance.
The three strategies--reactors were eliminated from the study--do not perform
equally well under different size conditions. Generally, defenders perform better
than analyzers as small firms, prospectors perform better than defenders and
analyzers as medium to large firms, and analyzers perform better as very large
firms.
Golden (1992) conducted a study in the hospital service industry based on Miles
and Snow's methodology. His study focused on proposing and testing which
decisions and activities should be controlled by the individual strategic business unit

18
(SBU). The study suggests that the link between an SBU strategy and performance
is moderated by the SBU's relationship to corporate management. The results of the
study indicate that SBU performance is enhanced when: 1) SBU's with an external
strategic orientation control environmental monitoring activities and strategic
decision analysis, and 2) SBU's with an intraorganizational orientation control those
activities relating to operation. Weaker SBU performance is associated with SBU
control over those functions and activities not central to the SBU's business
strategy.
11.C. Literature related to Porter's generic competitive strategies.
Porter ( 1980) suggested three types of generic strategies for creating a
defensible position and outperforming competitors in a given industry. These
strategies are: overall cost leadership, differentiation, and focus. A firm achieves
overall cost leadership in the industry through a relatively high market share or
through other advantages, such as favorable access to raw material. A firm will
adopt a strategy of aggressive construction of efficient-scale facilities, tight costs
and overhead controls, avoidance of marginal customer accounts, and cost
minimization in areas such as research and development, service, sales force and
advertising. These measures result in above average returns--even in the face of
strong competitive forces--which are reinvested in new equipment and modern
facilities in order to maintain leadership.
A firm is considered to have an advantage in terms of differentiation when it
offers a productor service that is perceived industrywide to be unique along several
dimensions, such as design or brand image, technology, features, customer service,

19
and dealer network. Customers are often willing to pay higher prices for this
uniqueness. Differentiation provides for brand loyalty by customers, lower
sensitivity to price, increased margins, and entry barriers.
A focus strategy exits when a firm, by focusing on a particular consumer group,
a segment of a particular product line, or a geographic market--each functional
policy being developed accordingly--is able to serve its chosen narrow strategic
target more effectively and efficiently than competitors who are competing more
broadly. A focus strategy is used in conjunction with either cost leadership or
differentiation in order to achieve higher-than-average industry profitability.
These generic strategies represent three broad types of strategic groups, and thus
the choice of strategy "can be viewed as the choice of which strategic group to
compete in" (Porter, 1980, p.149).
Porter ( 1980) also includes the possibility of a low-profit alternative that, by
definition, should be avoided. A firm is said to be "stuck in the middle" if it lacks a
clear definition of its generic strategy. Top managers make a less-than-optimum
combination of two of the three of them without successful results. Firms oriented
toward specific strategies should outperform firms characterized by Porteras "stuck
in the middle."
Porter (1980) recognizes that the strategies firms use to compete in an industry
can differ in a wide variety of ways, and he proposes a number of "strategic
dimensions" which can capture the possible differences among the strategic options
of firms in a given industry. These dimensions are comprised of competitive

20
methods that include: brand identification, channel selection, technological
leadership, cost position, service and leverage, among others.
Researchers have elaborated on Porter's competitive strategies. Miller (1988)
investigated the relationships of Porter' s business strategies to the structures and
environments of 89 undiversified firms. Specifically, the Miller study aimed at
testing the following hypotheses:
l. The strategy of innovation will be positively associated with environmental
uncertainty (unpredictability and dynamism).
2. Marketing differentiation will be positively associated with environmental
uncertainty (unpredictability and dynamism).
3. The strategy of cost leadership will be inversely associated with environmental
uncertainty (unpredictability and instability).
4. Strategic breadth will be positively associated with market heterogeneity.
5. The strategy of innovative differentiation will be positively associated with the
use of liaison devices, technocrats, and delegation.
6. The marketing differentiation strategy will not be associated with the use of
technocrats, liaison devices, or delegation of authority.
7. The cost leadership strategy will be inversely associated with the use of
technocrats, liaison devices, and delegation, and positively associated with the
use of formal controls.

21
8. Strategic breadth will be associated with the use of technocrats, delegation,
liaison devices, and formal controls.
9. The association predicted by hypotheses 1 through 8 will be stronger in groups
of high performers than in groups of low performers.
10. The associations of strategy and structure with performance will not be
significan t.
11. The associations between environment and structure will not differ between
successful and unsuccessful groups of firms.
12. The associations between environment and structure will not be significant.
The results of this study show that strategies must be matched with
complementary environments and structures to promote success. The strategy of
innovative differentiation is most likely to be pursued in uncertain environments and
correlates with the use of technocrats and liaison devices. The strategy of cost
leadership is associated with stable and predictable environments and correlates with
the use of controls. Unfocused strategies make much use of liaison devices. These
relationships were more likely to be significant in groups of high-performing firms
than in groups of poor performers. The results of the paper suggest that sorne of
Porter's strategies will probably be found in sorne industries while not in others,
depending on the industries' environmental characteristics.
Dess and Davis (1984) demonstrated the viability and usefulness of categorizing
firms within an industry into strategic groups based on their intended strategies.

22
Their underlying proposition is that variations m intraindustry profitability and
growth may be explained by strategic group membership. Their study was
composed of three phases. Phase 1 consisted of a field study that examined the
relationship between a firm's "intended" strategy--represented by the competitive
methods considered most important by the firm' s top management team--and the
presence of strategic orientations within an industry. These strategic orientations
were classified based on which of the three alternative generic strategies--focus, low
cost, or differentiation--they appear to represent most closely. Phase 2 of Dess and
Davis' study consisted of a panel of experts who assessed the importance of each of
the identified competitive methods for each generic strategy. The use of that panel
served to corroborate the researchers' inferences drawn from the field study. Phase
3 used the perceptions of the CEO's to cluster firms that exhibited a similar
strategic orientation into distinct groups. Dess and Da vis' study indicates that
variations in intraindustry profitability and growth are found to be related to
strategic group membership.
11.D. Literature related to testing both Miles and Snow's and Porter's typologies.
A study by Segev (1989) evaluated, analyzed and compared Porter's overall
cost leadership, differentiation, focus, and "stuck in the middle" generic
competitive strategies, and Miles and Snow's types of organizational adaptation.
Thirty-one strategic variables in the context of environment, strategy content,
strategy-making process, organizational structure, performance, and organizational
characteristics were evaluated by a board of judges for each strategy, within its
typology. A synthesis of the two typologies was suggested. The outcome of this

23
synthesis is a typology incorporating the relevant components lacking in Porter' s
typology, i.e., the environmental components of uncertainty, dynamism, and
complexity; level of risk; and the size of the strategy-making team. At the same
time, certain information missing from Miles and Snow's typology on liquidity
rates is provided. The author notes that Porter's typology focuses mainly on more
concentrated industries with larger business units, while Miles and Snow's typology
focuses on industries with more competitors.
11.E. Literature related to the business owner or professional manager status.
Sorne answers to the question of why sorne firms are managed by their owner
while others are managed by a professional manager can be found in the body of
literature related to agency costs. Total agency costs are made up of 1) monitoring
expenditures made by the principal to regulate and monitor the behavior of the
agent, 2) bonding expenditures made by the agent to reassure principals, and 3)
residual agency costs, or costs due to unresolved conflicts of interest between agent
and principals (Jensen and Meckling, 1976).
In general, an agency relationship is a contract under which one or more
persons (the principal or principals) engage another person (the agent) to perform
sorne service on their behalf which involves delegating sorne decision-making
authority to the agent. One example is the relationship between a firm 's outside
investors and managers. In this case, outside investors may turn over day-to-day
managing of their investment to managers in the firm who may or may not hold a
debt or equity position in the firm. Barney and Ouchi (1986) report that Jensen and
Meckling (1976) explore the implications of agency relations by focusing on the
incentives that motivate managers who hold less than 100 percent debt or equity

24
interest in a firm. They show that, in a wide variety of circumstances, these
managers have incentives to make decisions that are inconsistent with the interest of
"outsiders" (such as outside stockholders) in order to maximize their personal
wealth and utility. Outside investors may engage in a wide variety of activities to
monitor the activities and decisions of managers. In principle, such monitoring
increases the likelihood that the managers will make decisions consistent with the
self-interest of outside investors. Managers can bond themselves to outside investors
by designing arrangements that will penalize them as individuals should they make
decisions that violate the interests of outside investors. However, according to
Jensen and Meckling, no matter what monitoring and bonding mechanisms are
employed, at least sorne conflict of interest between outside investors and managers
will generally continue.
Berle and Means (1967) state that as the ownership of corporate wealth has
become more widely dispersed, ownership and control over it have come to lie less
in the same hands. Under the corporate system, control over industrial wealth can
be and is being exercised without any such interest. Ownership of wealth, without
appreciable control, and control of wealth, without appreciable ownership, appear
to be the logical outcomes of corporate development.
11.F. Literature related to the influence of managerial characteristics on strategy.
Gupta and Govindarajan (1984) investigated the impact of certain managerial
characteristics on the firm's effectiveness in strategy implementation. These
characteristics are: experience in marketing and sales, willingness to take risks, and
tolerance for ambiguity.

25
The authors, arguing that the scope of research on strategy implementation has
remained quite narrow, propose this study aimed at contributing to fill that gap.
The Gupta and Govindarajan study was based on the MacMillan (1982) typology of
business-leve! strategy: aggressive build, gradual build, aggressive maintain,
selective maintain, competitive harasser, prove viability, and divest. They
emphasize the claim that their study focuses on strategy implementation for ongoing
businesses only. Thus, its focus is on the continuum from 11 pure build II to 11 pure
harvest11 and does not deal with the implications of a 11 divest 11 strategy.
Their research hypotheses are:
1. Experience in marketing and sales on the part of the general manager will make
a greater contribution to effectiveness strategy implementation in the case of
strategic business units at the 11 build II end of the strategy spectrum than in the
case of strategic business units at the 11 harvest 11 end.
2. Willingness to take risks on the part of the general manager will make a grater
contribution to effectiveness in strategy implementation in the case of strategic
business units at the 11 build 11 end of the strategy spectrum than in the case of
strategic business units at the 11 harvest 11 end.
3. Tolerance for ambiguity on the part of the general manager will make a greater
contribution to effectiveness in strategy implementation in the case of strategic
business units at the 11 build 11 of the strategy spectrum than in the case of strategic
business units at the 11 harvest 11 end.
The authors' findings are: greater marketing and sales experience, greater
willingness to take risks, and greater tolerance for ambiguity contribute to
effectiveness in the case of 11 build 11 strategic business units but hamper it in the case

26
of "harvest" strategic business units. In practice, these findings hold relevance for
those executives responsible for selection, development, and appointment of
middle-level general managers in diversified corporations. On the other hand, in
theory, the primary relevance of the Gupta and Govindarajan study lies in its
extension of the contingency theory of organization from the interfirm to the
intrafirm context.
A study conducted by Miller and Toulouse (1986) investigated the relationship
that three components of the chief executive officers' personality (flexibility, need
for achievement, and locus of control) have with the strategies, structures, decision
making methods, and performance of their firms. The authors argue that early work
in the area indicates CEO personality will be most closely related to strategy and
structure in organizations that are small and have centralized power. In this type of
firm, the general manager can make the greatest impact on his organization; thus,
their study concentrated on smaller firms (average number of employees was 100).
The results showed that flexibility is associated with intuitively formulated, risk
embracing, reactive, niche strategies, and extremely informal organizational
structures. Flexibility seems to have the most positive implications for performance
in smaller firms and stable environments, settings in which simplicity and
informality are more likely to be virtues. The chief executive officer's need for
achievement was related to a more analytical, proactive, marketing-oriented
strategy with broad focus, and with a more sophisticated, centralized and
bureaucratic structure. This personality dimension was not related to performance,
perhaps because it is suitable for larger firms. Locus of control correlated with a
27
strategy of future-oriented innovation, which enjoyed particular success in dynamic
environments.
Resenos (1980) investigated the relationship between the following variables:
age, educational level (i.e. Ph.D. or no formal level of education), leadership style
(autocratic or participative), job satisfaction (i.e. self-respect, prestige), and
productivity (in terms of time and accomplishment of results) of 270 executives in
22 firms located in metropolitan Mexico City. The research proposed the following
hypotheses.
1. The leadership style that encourages more participation from the subordinates
achieves higher productivity.
2. More participative leadership styles produce higher job satisfaction among the
employees.
3. The managers who achieve a high level of job satisfaction tend to be more
productive than those who do not.
4. Senior managers tend to have more participative leadership styles than junior
managers.
5. Senior middle-line managers and executives tend to experience more job
satisfaction than junior executives.
6. Senior managers tend to be more productive than junior managers.
7. Senior managers tend to achieve higher levels of formal education than junior
executives.
8. Highly educated managers tend to practice participative leadership.
9. Highly educated middle-line managers and executives tend to experience higher
job satisfaction than those who have a lower level of education.

28
10. Highly educated managers tend to be more productive than those who are less
educated managers.
This study showed that sampled managers are on average 38 years old, their
educational level is high, and their leadership styles tend to be participative. Also,
their job satisfaction and their productivity is high. Correlation analyses showed
positive associations between leadership styles (more participative), job satisfaction,
and productivity. No significant associations were found between these variables
with the level of education and age.
This chapter has discussed previous research done in several areas in the field of
business strategy. Presented were: 1) a sum mary of different typologies of business
level strategies, 2) Miles and Snow's typology of strategy and its contribution to
match their so called "adaptive cycle," 3) Porter's generic strategies and a
discussion of how these strategies can contribute to attain superior performance in
the firm, 4) commentary on a study that proposes a synthesis of Miles and Snow's
and Porter' s typologies of strategy, 5) studies investigating the influence of
ownership or professional management status on the administration of the firm, and
6) studies investigating the influence of certain managerial characteristics on the
strategy, structure, and performance of the firm. Based on this body of literature, a
number of questions seem appropriate. 1) Are Miles and Snow's and Porter's
typologies of strategy applicable in industrial San Luis Potosí? 2) Can the categories
of strategy proposed in these typologies be related to certain financia! performance
indicators? 3) To which organizational activities can these typologies be associated?
4) Is there any association between the business owner or professional manager
status and the strategy implemented? 5) Is there any association between the

29
business strategy and the level of formal education of the person responsible for its
implementation?
The answers found to these questions will be important contributors to the
advancement of our knowledge of business-leve} strategy in industrial San Luis
Potosí as managers need to make better decisions for their firms and academicians
need to conduct research that helps managers improve the quality of their decisions.
The following chapter operationalizes these questions in testable research
hypotheses.

111. HYPOTHESES OF THE RESEARCH.
In order to operationalize the fundamental research question of the study
regarding the relationship between the strategy selected in terms of Miles and Snow
(1978) and Porter (1980) with certain financia! performance indicators of the firm,
the business' major organizational activities, and sorne of the general manager' s
characteristics, the following propositions are presented.
111.A. Propositions related to Miles and Snow's strategic orientations.
1. Top managers will report that all four strategies are being pursued m their
industrial sector.
la. The hypothesis underlying this proposition is that, in each industry sector
studied, at least one each of Miles and Snow's (1978) strategic orientations
will be present.
2. In each industrial sector under study, prospector firms will be better performers
than reactor firms.
This proposition can be broken down into the following testable hypotheses
based on defined financia! indicators.
2a. Compared to the industry's average performance, prospector firms will
obtain higher net profit margins than reactor firms.
2b. Compared to the firm' s net profit mar gin under the previous strategic
orientation, the current net profit margin will be higher under the prospector
strategy than under the reactor strategy.
2c. Compared to the firm' s market share under the prev1ous strategic
orientation, the current market share will be higher under the prospector
strategy than under the reactor strategy.
30

31
2d. Prospector firms have increased their net profit margin more than reactor
firms over the last three years.
2e. Prospector firms have increased their market share more than reactor firms
over the last three years.
3. In each industrial sector under study, analyzers will be better performers than
reactors.
This proposition can be broken down into the following testable hypotheses
based on defined financia! indicators.
3a. Compared to the industry's average performance, analyzer firms will obtain
higher net profit margins than reactor firms.
3b. Compared to the firm' s net profit margin under the prev1ous strategic
orientation, current net profit margin will be higher under the analyzer
strategy than under the reactor strategy.
3c. Compared to the firm 's market share under the prev1ous strategic
orientation, current market share will be higher under the analyzer strategy
than under the reactor strategy.
3d. Analyzer firms have increased their net profit margm more than reactor
firms over the last three years.
3e. Analyzer firms have increased their market share more than reactor firms
over the last three years.
4. In ea~h industrial sector under study, defenders will be better performers than
reactors.
This proposition can be broken down into the following testable hypotheses
based on defined financia! indicators.

32
4a. Compared to the industry's average performance, defender firms will obtain
higher net profit margins than reactor firms.
4b. Compared to the firm 's net profit margin under the prev1ous strategic
orientation, the current net profit margin will be higher under the defender
strategy than under the reactor strategy.
4c. Compared to the firm' s market share under the prevmus strategic
orientation, the current market share will be higher under the defender
strategy than under the reactor strategy.
4d. Defender firms have increased their net profit margm more than reactor
firms over the last three years.
4e. Defender firms have increased their market share more than reactor firms
over the last three years.
5. Different organizational activities will characterize each strategic orientation.
The following hypotheses derived from Snow and Hrebiniak (1980)
operationalize the above proposition.
5a. Prospectors will emphasize the following organizational activities: general
management, product research and development, market research, and basic
and applied engineering.
5b. Analyzers will emphasize the following organizational activities: general
management, production, basic and applied engineering, and marketing and
sales.
5c. Defenders will emphasize the following organizational activities: general
management, financial management, production, and basic and applied
engmeenng.
33
5d. Reactors will make no emphasis on any organizational activity.
6. The strategic orientation pursued will be different depending on whether the
person responsible for its implementation is the business owner or a professional
general manager.
This proposition can be broken down into the following hypotheses:
6a. The professional general manager will implement a prospector strategy,
while the business owner will implement a defender strategy.
6b. The professional general manager will implement an analyzer strategy,
while the business owner will implement a defender strategy.
7. The strategic orientation of the firm will be different depending on the academic
education of the person responsible for its implementation
The hypotheses operationalizing the above proposition are stated as follows:
7a. Highly educated--having at least bachelor's degree--decision makers will
implement a prospector strategy, while less educated--having at most a high
school diploma--decision makers will implement a defender strategy.
7b. Highly educated--having at least bachelor's degree--decision makers will
implement an analyzer strategy, while less educated--having at most a high
school diploma--decision makers will implement a defender strategy.
111.B. Propositions related to Porter's generic competitive strategies.
1. Top managers will report that all four strategies are being pursued in their
industrial sector.
The hypothesis that operationalizes this proposition follows:
la. In each industry sector studied, at least one of each of Porter's (1980)
competitive strategies will be present.

34
2. Firms pursuing a general cost leadership strategy will be better performers than
"stuck in the middle" firms.
This proposition can be broken down into the following testable hypotheses
based on defined financia! indicators.
2a. Compared to the industry' s average performance, firms following a general
cost leadership strategy obtain higher net profit margins than "stuck in the
middle" firms.
2b. Compared to the firm's net profit margin under the previous competitive
strategy, the current net profit margin is higher under the general cost
leadership strategy than under the "stuck in the middle" position.
2c. Compared to the firm' s market share under the previous competitive
strategy, the current market share is higher under the general cost leadership
strategy than under the "stuck in the middle" position.
2d. Firms following a general cost leadership strategy have increased their net
profit margin more than "stuck in the middle" firms over the last three
years.
2e. Firms following a general cost leadership strategy have increased their
market share more than "stuck in the middle" firms over the last three years.
3. Firms pursuing a differentiation strategy will be better performers than "stuck in
the middle" firms.
This proposition can be broken down into the following testable hypotheses
based on defined financia! indicators.
35
3a. Compared to the industry's average performance, firms following a
differentiation strategy obtain higher net profit margins than II stuck in the
middle 11 firms.
3b. Compared to the firm's net profit margin under the previous competitive
strategy, the current net profit margin is higher under the differentiation
strategy than under the "stuck in the middle" position.
3c. Compared to the firm' s market share under the prev1ous competitive
strategy, the current market share is higher under the differentiation strategy
than under the "stuck in the middle II position.
3d. Firms following a differentiation strategy have increased their net profit
margin more than 11 stuck in the middle11 firms over the last three years.
3e. Firms following a differentiation strategy have increased their market share
more than 11 stuck in the middle 11 firms over the last three years.
4. Firms pursuing a cost leadership focus strategy will be better performers than
11 stuck in the middle" firms.
This proposition can be broken down into the following testable hypotheses
based on defined financia} indicators.
4a. Compared to the industry's average performance, firms following a cost
leadership focus strategy obtain higher net profit margins than "stuck in the
middle 11 firms.
4b. Compared to the firm's net profit margin under the previous competitive
strategy, the current net profit margin is higher under the cost leadership
focus strategy than under the 11 stuck in the middle 11 position.

36
4c. Compared to the firm's market share under the previous competitive
strategy, the current market share is higher under the cost leadership focus
strategy than under the 11 stuck in the middle11 position.
4d. Firms following a cost leadership focus strategy have increased their net
profit margin more than II stuck in the middle II firms o ver the last three
years.
4e. Firms following a cost leadership focus strategy have increased their market
share more than "stuck in the middle 11 firms over the last three years.
5. Firms pursuing a differentiation focus strategy will be better performers than
11 stuck in the middle 11 firms.
This proposition can be broken down into the following testable hypotheses
based on defined financia! indicators.
Sa. Compared to the industry's average performance, firms following a
differentiation focus strategy obtain higher net profit margins than II stuck in
the middle 11 firms.
Sb. Compared to the firm 's net profit margin under the previous competitive
strategy, the current net profit margin is higher under the differentiation
focus strategy than under the "stuck in the middle 11 position.
Se. Compared to the firm' s market share under the previous competitive
strategy, the current market share is higher under the differentiation focus
strategy than under the 11 stuck in the middle 11 position.
Sd. Firms following a differentiation focus strategy have increased their net
profit margin more than 11 stuck in the middle 11 firms over the last three
years.

37
Se. Firms following a differentiation focus strategy have increased their market
share more than "stuck in the middle" firms over the last three years.
6. Different organizational activities will characterize each strategic orientation.
The following hypotheses, which operationalize the above proposition, were
adapted from Snow and Hrebiniak (1980) who selected these organizational
activities and applied them to Miles and Snow' s typology. U sing these
organizational activities to operationalize each of Porter' s categories appeared
reasonable given that sorne studies have found sorne similarity between Miles
and Snow's and Porter's categories (i.e. Segev, 1989).
6a. Firms pursuing a general cost leadership strategy will emphasize: general
management, financial management, basic and applied engineering,
production, and distribution.
6b. Firms following a differentiation strategy will emphasize: marketing and
sales, market research, product research and development, and personnel.
6c. Firms following a focus cost leadership strategy will emphasize: general
management, financial management, basic and applied engmeenng,
production, marketing and sales, and market research.
6d. Firms following a differentiation focus strategy will emphasize: marketing
and sales, market research, product research and development, basic and
applied engineering, and personnel.
6e. "Stuck in fe middle" firms will emphasize no organizational activity.
7. The competitive strategy pursued will be different depending on whether the
person responsible for its implementation is the business owner ora professional
general manager.

38
This proposition can be broken down into the following hypotheses:
7a. A professional manager will implement a general differentiation strategy,
while the business owner will implement a general cost leadership strategy.
7b. A professional manager will implement a focus differentiation strategy,
while the business owner will implement a focus cost strategy.
8. The competitive strategy implemented will be different depending on the
academic education of the person responsible for its implementation.
The hypotheses operationalizing the above proposition are stated as follows:
8a. Highly educated--having at least a bachelor' s degree--decision makers will
implementa general differentiation strategy, while less educated--having at
most a high school diploma--decision makers will implement a general cost
leadership strategy.
8b. Highly educated--having at least a bachelor's degree--decision makers will
implement a focus differentiation strategy, while less educated--having at
most a high school diploma--decision makers will implement a focus cost
strategy.
The above stated hypotheses will be tested throughout the following chapters
using the statistical tools described in the methodology section of this study.

IV. METHODOWGY.
A closed-ended questionnaire (see Appendix A) consisting of five sections was
designed as the data collection instrument. Section 1 of the questionnaire identified
the business by the industry in which it competed. Section 2, provided a description
for each of Miles and Snow's strategic orientations with tailored examples for each
industry in order to help the respondent select the description that best described the
firm' s current strategy. Section 3 provided a description for each of Porter' s
competitive strategies with tailored examples for each industry in order to help the
respondent select the description that best described the firm' s current. Section 4
gathered information related to the firm' s characteristics, such as size (see Table
IV .1), financia! performance indicators (i.e., market share and net profit margin),
time since the current strategy was implemented, person having final responsibility
for implementing the firm' s current strategy (i.e., the business owner or a
professional manager), and organizational activi ties (i. e., distribution, financia!
management, or marketing and sales). Finally, section 5 asked the respondent to
select the highest degree of formal education of the person with the final
responsibility for implementing the firm' s current competitive strategy (i.e.,
master's or bachelor's degree).
39

40
Table IV .1. Criteria for size classification. Number of employees on the Annual sales range (N$)* Size** payroll Fewer than 15 Up to 572,940.50 Micro Between 16 and 100 572,940 and 5,807,533.25 Small Between 101 and 250 5,807,533.25 and Medium
10,469,185.50 More than 250 Above 10,469,185.50 Large
* Divide by 3.1 to obtain U.S. dollars. ** Firms are classified according to the criterium (number of employees or annual sales) in which the highest rate was obtained. Source: Secretary of Commerce (SECOFI), San Luis Potosí office.
The questionnaire was administered in a total of 184 firms in the city of San
Luis Potosí and its metropolitan area over a five-week period (see Table IV. 2).
Since the information requested for this study required a comprehensive view of the
firm' s strategy, the person responding to the questionnaire was usually the general
manager; in fact, 92 % of the interviews were held with him or her. When this was
not possible, a member of the top management team responded to the questionnaire.
a e .. T bl IV 2 S 1 ti amp e trms s u 1 t d'ed
Number of firms in the Questionnaires Industry CANACINTRA directory completed
Capital goods 47 11
Metal mechanic 123 76
Foundry 19 14
Construction supply 43 36
Chemical 56 47
%
23
62
74
84
84

41
The hypotheses discussed in Chapter 111 will be examined for the whole sample
and according to industry. This is important for the following reasons. First, the
audience of this research can be interested in having the "broad picture" of the
industrial sectors studied, and from it make comparisons by industry. Second,
results of this research may not be the same for all sectors studied. Even though
examining similarities or differences among sectors does not form part of this
research, it is assumed that sorne differences may exist. Third, studying all
industries together as well as industry sectors separately provides more knowledge
than studying either one separately.
Data from the firms--addresses, telephone numbers, and contact persons--were
taken from the CANACINTRA directory of San Luis Potosí. CANACINTRA
stands for the National Chamber of the Transformation Industry and is an
association of businesspersons whose major purpose is to foment the development
of that industry nationwide.
A pilot test of five interviews with general managers was undertaken by the
researcher in order to target areas of improvement within the questionnaire. An
additional pilot test of ten interviews was done by a group of students and an
assistant professor previously trained by the researcher. Field work was conducted
by a group of six students from the business administration' s undergraduate
program who were coordinated by an assistant professor.
Initial contact with the sample firms was made by telephone to obtain an
appointment with the general manager; in most cases, general managers kindly
accepted the offer to participate in the study. A letter which explained the purpose
of the research and emphasized the confidentiality of the information to be solicited

42
was given to each member of the interviewing team. This provided the respondent
with confidence and formally introduced the interviewer to the firm.
Interviews lasted an average of forty minutes. In sorne cases they took longer
because the respondent showed interest in the research and, after completing the
questionnaire, he or she offered additional comments related to the firm' s plans or
operations. Other interviews also took longer than average because the general
manager was somewhat reluctant to answer financia} performance issues or did not
clearly understand certain questions. In this cases, interviewers had to devote more
time to building rapport or explaining concepts.
The response rate was high (95 % ) and no major problems were found with the
exception of five general managers who refused to answer the questionnaire and
seven firms which were no longer in business or had changed addresses or
telephone numbers.
The database was processed using the Statistical Package for the Social Sciences
(SPSS). Descriptive statistics such as tables of frequencies and crosstabulations
were first obtained in order to understand how data broke down in terms of: 1) size
of sample firms in each sector studied, 2) Miles and Snow's (1978) and Porter's
(1980) categories of strategy, 3) financial performance indicators, 4) the status of
the person responsible for the firm 's strategy--either professional manager or owner
and, 5) degree of formal education of the person responsible for implementing the
firm' s strategy.
Correlation analysis was performed by associating the variables identifying
strategy categories with the financia} performance indicator variables,
organizational activities variables, and manager' s characteristics variables.

43
Statistical significance was determined if the observed significance level was 0.05
or less. In order to test the dependence of financia! performance, organizational
activities, and manager's characteristics upon the strategy type, chi-square and t-test
analyses were performed. For these statistics, a significance of 0.05 or less was
accepted.
Findings from these analyses and their implications for each of the hypotheses
of interest are discussed in the following chapters for each sector under study, each
chapter discusses one hypothesis.
Chapter V presents descriptive statistics with the purpose of providing the
reader with a general overview of the industries studied. In chapter VI, the database
was broken down by categories according to Miles and Snow's typology (1978) to
learn whether all strategic orientations were present in each sector under study. In
chapter VII, financial performance indicators were related to Miles and Snow's
( 1978) categories of strategy. Chapter VIII presents findings related to
organizational functions using Miles and Snow's (1978) strategic orientations.
Chapter IX reports findings on strategic orientation implementation depending on
whether the person responsible for its implementation was the owner of the business
or a professional manager. Chapter X presents findings conceming the general
manager's formal education and its relationship to Miles and Snow's (1978)
strategic categories. Chapter XI presents how firms are classified within each of
Porter's (1980) generic strategies, while in chapter XII, financia! performance
indicators are related to Porter' s competitive strategies. Chapter XIII reports
findings related to organizational activities using Porter' s (1980) competitive
strategies, and chapter XIV reports findings on generic strategy implementation
44
depending on whether the person responsible for its implementation was a
professional general manager or the owner of the business. Chapter XV presents
findings on the general manager' s formal education and its relationship to Porter' s
(1980) competitive strategies. Chapter XVI presents the study's conclusions along
with its academic and managerial implications, while chapter XVII discusses its
limitations and proposes priorities for future research.

V. DESCRIPTIVE STATISTICS.
This chapter provides the reader with information describing industrial San Luis
Potosí. lts purpose is to help the reader achieve better understanding of the
variables investigated.
As the reader may remember, the two typologies of business-leve! strategy used
in this research are Miles and Snow's (1978) and Porter's (1980). The categories of
strategy show the following distribution of responses for each typology (see Tables
V.1 and V.2).
Table V. l. Frequency of Miles and Snow' s categories of business-¡ 1 eve strategy.
Category of strategy Number of firms classified in that category*
Reactor 22 Defender 60 Analyzer 44 Prospector 55
* Three firms could not be classified into any of Miles and Snow's categories.
The above table shows that most firms are either defenders (33 % ) or
prospectors (30% ). This issue will have interesting implications when correlated to
financia! performance indicators, as the reader will see in the following chapters.
The Table V.2 shows how the firms were classified according to Porter's typology.
45

T bl V 2 F a e .. requency o f p t I t or er s ca egones o usmess- eve strateg J fb . 1 1 Category of strategy Number of firms classified in that
category* General cost leadership 50 General differentiation 86 Focus cost leadership 16 Focus differentiation 19 "Stuck in the middle" 10
* Two firms could not be class1fied m any of Porter's categories, and one case is missing.
46
From the above table, the reader can observe that 86 of the 181 firms ( 48 % )
follow a general differentiation strategy and 50 of the 181 firms (27 % ) were
classified as general cost leadership. This finding will have important implications
when related to financia! performance indicators and other variables studied
throughout this research.
In the industrial sectors investigated, 26% are micro (fewer than 15 employees
or annual sales up to N$572,940.5) and 50% are small-sized businesses (between
16 and 100 employees or annual sales between N$572,950.50 and
N$5,807,533.25). Table V.3 presents this breakdown.
T bl V 3 s· a e .. 1ze o e usmesses m f th b . . th e samp e. Size Number of firms % Micro 47 25.5 Small 91 49.5 Medium 26 14.1 Large 20 10.9

47
This provides a good idea as to the average size of the firms in the
manufacturing industry in San Luis Potosí. Remember that the industries
investigated account for 56% of the state's manufacturing activity and that the
manufacturing industry as a whole accounts for 80% of production of the state's
transformation industry.
The variables measuring the financia! performance of the business show the
following distribution of responses (see Tables V.4 to V.6).
Table V.4. Firm's net profit margin compared to h . d tem ustry s average.
Financia! result Number of firms* Below-average 35 Average 123 Above-average 25 * One case missing.
From the above table the reader can observe that most firms (67%) have
obtained average results for the industry.
The following table presents the distribution of responses for the variables
measuring changes in net profit margin and market participation from the previous
to the current firm's strategy (see Table V.5).
T bl V 5 F a e .. manc1a . 1 resu ts compar ed h to t e prev1ous strategy s resu ts.
Financia! result Net profit margin changes* Market share changes* Increased considerably 14 16 Increased 59 61 Remained constant 92 83 Decreased 16 20 Decreased considerably 2 3 * One case missing.

48
The reader can observe that most managers perceive that the firm' s net profit
margin and market share remained constant after a change in strategy was
implemented. However, for both financia! performance indicators there are more
firms that have improved their financia! position than firms whose financia! results
have worsened. This finding leads to the conclusion that, inn most cases, a change
in the strategy followed will at least leave the firm in the same financia! position.
Table V .6 presents the distribution of responses for the variables measuring
changes in net profit margin and market participation over the last three years.
a e .. maneta resu s over T bl V 6 F" . l lt th 1 t th e as ree vears.
Financial result Net profit margin Market share changes* changes*
Decreased 35 32 Remained constant 101 86 Increased 46 64 * Two cases missing.
As can be seen, in most cases net profit margin and market share has remain
constant over the last three years. Also, there are more firms in which net profit
margin and market share have increased than firms in which these financial
performance indicators have worsened.
The level of emphasis placed on the main organizational activities of the firm
will also be investigated in this research. For each organizational activity, Table
V. 7 shows the frequency of firms in each level of emphasis placed.

T bl V 7 Le 1 f h . 1 ed a e .. ve o emp as1s p ac h fi on t e irm s orgamzat1ona act1v1t1es Organizational Much emphasis Average emphasis Not much
activities* placed (1) placed (2) emphasis placed (3)
General 105 58 9 management Financia! 111 53 8 management Marketing and 82 63 27 sales Market 38 79 55 research Product 53 65 54 research and development Engineering, 56 74 41 basic and applied Production 127 38 7 Distribution 85 63 24 Legal aff airs 40 62 70 Personnel 12 75 28
* Numbers do not add up to 184 in each category because sorne cases are missing.
49
It is interesting to note that sorne firms place heavy emphasis on general
management, financia! management, marketing and sales, production, and
distribution. These activities seem to be related to the day-to-day operation of the
business. Average emphasis is placed on activities that may change the way firms
do business. These activities may be product research and development, basic and
applied engineering, market research, and personnel; they are more oriented
towards finding new alternatives for improving the product, developing human

50
resources, and finding (or creating) new market needs. Finally, note that little
emphasis is placed on legal affairs, which includes activities related to union
conflict resolution. In industrial San Luis Potosí, firms do not have major problems
with labor unions. In chapters VIII and XIII, the above organizational activities will
be associated with Miles and Snow's and Porter's categories of strategy
respectively. By doing so, the reader will have a clearer picture of the
organizational activities that operationalize the business strategy, with the
assumption that sorne organizational activities will be emphasized more in a
company following one strategy and other activities will be emphasized more in an
organization following a different strategy.
In relation to the person having the responsibility for the firm 's strategy,
statistics show that in most cases (72 % ) the business owner makes that decision (see
Table V.8).
Table V.8. Status of the Res onsible for the strate Business owner Professional mana er 46 Mana erial team 5 * Two cases missing.
For the purposes of this research, the level of formal education of the person
responsible for the business' strategy is considered important information. Table
V.9 shows the distribution of firms in each category of formal education.

51
T bl V 9 Ed a e .. ucation o f h t e person respons1 le or the busmess' strateev. Level of formal education Person' s responsible for the firm' s strateev Doctoral degree 2 U nfinished doctoral degree o Master' s degree 35 Unfinished master's degree 11 Bachelor' s degree 106 Unfinished bachelor's degree 15 High school 8 Unfinished high school o Junior high or elementary 6 school No formal education 1
The above table shows that most top managers (58 % ) have at least one
bachelor's degree and that 20% have either a master's or doctoral degree. This
means that general managers in industrial San Luis Potosí are well-educated
professionals.
Regression analysis was done with strategy and size of the business as
independent variables and each financia! performance indicator as dependent
variable. This was done to understand how important these dependent variables
were in explaining financial performance. Table V .10 (for Miles and Snow' s
categories) and Table V .11 (for Porter' s categories) show which independent
variable was included in the regression equation using three different procedures for
selecting variables.

Table V .10. Miles and Snow' s categories and business size as explanation of fi ·1 fi mancia per ormance.
Stepwise Backward Forward Firm' s net profit MS* MS TE** MS margin compared to Adj. R-square Adj. R-square Adj. R-square the industry's (DF) =.06306 =.07672 =.06306 Firm' s net profit MS MS MS margin compared to Adj. R-square Adj. R-square Adj. R-square the previous strategy =.01874 =.01874 =.01874 (UN) Firm' s market share MSTE MSTE MSTE compared to the Adj. R-square Adj. R-square Adj. R-square previous strategy = .06116 =.06116 =.06116 (PM) Firm' s net profit TE TE TE margin for the last Adj. R-square Adj. R-square Adj. R-square three years (MC) =.01603 =.01603 =.01603 Firm' s market share MSTE MSTE MSTE for the last three years Adj. R-square Adj. R-square Adj. R-square (PG) =.07771 =.07771 =.07771 *MS= Miles and Snow's typology **TE= Size of the business. The cells indicate variables entered in the regression equation and its adjusted coefficient of determination. A low adjusted coefficient of determination reflects that a number of other variables (not included in this research) may also contribute to explaining financia! performance. Categories of financia! performance ranged between three and five (regression analysis is more appropriate for continuous data); this can also cause a low R-square.
52
The table above highlights the importance of Miles and Snow's typology in
explaining the financia! performance of the firm. Miles and Snow's typology
appears to explain, at least partially, all but one of the financia! performance
indicators. Even though the size of the business also contributes to explaining its

53
financia! results, the appearance of strategy as explanation of the financia! results
was encouraging.
Similar analysis was done for the Porter's categories and the size of the
business. Table V .11 shows which variables were entered in the equation under
three different selection methods.
Table V .11. Porter' s categories and business size as explanation of financial i per ormance.
Stepwise Backward Forward Firm' s net profit P* P TE** p
margin compared to Adj. R-square Adj. R-square Adj. R-square the industrv's (DF) = .02178 =.03307 =.02178 Firm' s net profit No variables No variables No variables margin compared to entered in the entered in the entered in the the previous strategy equation equation equation (UN)
Firm' s market share TE TE TE compared to the Adj. R-square Adj. R-square Adj. R-square previous strategy =.05720 =.05720 =.05720 (PM) Firm' s net profit No variables TE No variables margin for the last entered in the Adj. R-square entered in the three years (MC) equation =. 01205 equation Firm' s market share TE TE TE for the last three years Adj. R-square Adj. R-square Adj. R-square (PG) =.04883 =.04883 =.04883 *P= Porter's typology **TE=Size of the business. The cells indicate the variables entered in the equation and its adjusted coefficient of determination. A low adjusted coefficient of determination reflects that a number of other variables (not included in this research) may also contribute to explaining financia! performance. Categories of financia! performance ranged between three and five (regression analysis is more appropriate for continuous data); this can also cause a low R-square.
54
From the table above, the reader can observe that Porter' s typology con tributes
to explaining the firm's net profit margin compared to the industry's average.
Changes in market share compared to market participation under the prev1ous
strategy and changes in market share over the last three years appear to be better
explained by the size of the business. Changes in net profit margin compared to net
profit margin under the previous strategy and net profit margin over the last three
years appear not to be explained by Porter' s typology or size of the business--except
for changes in net profit margin over the last three years evaluated by the backward
selection method.
In conclusion, it appears that strategies followed by the firms in the sample
resemble the strategies proposed by Miles and Snow and Porter. In terms of
financia! performance, most firms indicated average results for the industry, when
compared to results under the previous strategy and over the last three-year period.
However, there are more firms that indicated their financial results have improved
than firms which claiming their results have worsened.
Interestingly, organizational activities appear to be grouped into three consistent
categories: 1) those activities strongly emphasized and related to the day-to-day
operation of the business, such as general management, production, marketing and
sales, and financial management, 2) those activities that appear to be more related
to improving the position of the business in the marketplace, such as product
research and development, basic and applied engineering, market research, and
personnel (in these activities, average emphasis is placed), and 3) the only activity
in which little emphasis is placed: legal issues.

55
In most cases, the business owner is the person responsible for the firm' s
strategy and that person usually has a bachelor' s degree.
Finally, Miles and Snow's and Porter's categories of strategy appear to
con tribute to explaining the financia! performance of a business. However, the
influence of other variables in explaining the variance of a firm 's financia! results is
also recognized.

VI. MILES AND SNOW'S TYPOLOGY IN EACH INDUSTRIAL SECTOR.
This chapter provides an overview of the manner in which Miles and Snow's
strategic orientations break down in each sector of activity. The chapter also serves
as a point of departure for the following chapters in which financia! performance,
major organizational activities and general managers' variables are studied. In
addition, in order to provide the reader with a general overview of the sectors
studied, hypothesis 1 is tested regardless of the industrial sector (see Table V.1).
T bl VI 1 Mºl a e .. 1 es an dS now s typo ogy 1y irm s1ze rn t e samp e. b fi h 1 MICRO SMALL MEDIUM LARGE TOTAL
NONE 1 1 1 3 REACTOR 8 10 2 2 22 DEFENDER 17 31 6 6 60 ANALYZER 11 25 4 4 44 PROSPECTOR 10 24 14 7 55 TOTAL 47 91 26 20 184
As can be seen from the above table, only three firms from the entire sample
reported not to follow strategies similar to those proposed by Miles and Snow, Thus
providing support for hypothesis l. Additionally, most firms fall into the small-size
category (between 16 and 100 employees or annual sales ranging from
N$572,940.50 to N$5,807,533.25). This pattern is consistent throughout all sectors
studied and, in general, provides a clear idea of industry size in San Luis Potosí.
56

57
VI.A. The capital goods industry.
This section of the report presents information aimed at providing support for
hypothesis 1 in the study of the capital goods industry which proposes that all
strategic orientations are present in the industrial sector.
In order to provide the reader with a clearer understanding of the capital goods
sector in the city of San Luis Potosí, data was broken down into size categories
(see Table VI.A.1).
Table VI.A. l. Miles and Snow's typology by firm size in the capital goods . d t m us ry.
MICRO SMALL MEDIUM LARG TOTAL E
NONE 1 I REACTOR 1 1 DEFENDER 1 1 ANALYZER 1 2 3 PROSPECTOR 3 1 1 5 TOTAL 1 7 1 2 11
Table VI.A. l. shows that the four strategic orientations (including reactors)
proposed by Miles and Snow (1978) are being pursued in the capital goods sector.
Furthermore, most the firms are small, having between 16 and 100 employees and
sales ranging between N$572,940.50 and N$5,807,533.25. One firm did not
identify itself with the typology under study, meaning that the firm' s general
manager considers the business to be pursuing a different strategy.

58
VI.B. The metal mechanic industry.
All four of Miles and Snow's (1978) typologies are also present in the metal
mechanic (see Table VI.B.1).
Table VI.B.1. Miles and Snow's typology by firm size in the metal mechanic . d t m us rv.
MICRO SMALL MEDIUM LARGE TOTAL REACTOR 7 6 1 2 16 DEFENDER 9 11 3 23 ANALYZER 7 7 3 17 PROSPECTOR 7 6 5 2 20 TOTAL 30 30 6 10 76
Hypothesis 1 is also confirmed for this industry. As Table VI.B.1 shows, most
firms in the sample fall into the category of micro (fewer than 15 employees, or
sales up to N$572,940.50) and small-size categories (between 16 and 100
employees, or annual sales ranging from N$572,940.50 to N$5,807,533.25).
Notice also that in this sector, all firms in the sample identified with one of the
strategic orientations (including reactor) as opposed to the capital goods sector in
which one firm claimed to follow a different strategy.
VI.C. The foundry industry.
As with the previous two industrial sectors, the foundry industry also shows the
presence of the four strategic orientations (see Table VI.C. l).

59
T bl VI C 1 Mºl a e ... 1 es an dS 1 now s typo ogy 1y 1rm s1ze m t e oun r ' m ustry. b ti h fi d . d
MICRO SMALL MEDIUM LARGE TOTAL NONE 1 1 REACTOR 1 I DEFENDER 2 2 4 ANALYZER 2 1 3 PROSPECTOR 1 2 2 5 TOTAL 3 8 o 3 14
Hypothesis I is also supported by the sample firms in the foundry sector. In
addition, Table VI.C.1 reveals that most firms in the industry belong in the small
size category (between 16 and 100 employees, or more than N$572,940.50 but less
than N$5,807,533.25 annual sales).
VI.D. The construction supply industry.
In contrast to the capital goods, metal mechanic and foundry industries, the
construction supply industry does not present all four strategic orientations (see
Table VI.D. l).
Table VI.D.1. Miles and Snow's typology by firm size in the construction supply . d t m us ry.
MICRO SMALL MEDIUM LARGE TOTAL NONE 1 1 REACTOR o DEFENDER 2 13 4 1 20 ANALYZER 1 1 2 PROSPECTOR 1 5 6 1 13 TOTAL 4 19 11 2 36
None of the firms in the sample indicated displayed characteristics similar to
those of Miles and Snow's reactor firms. On the one hand, this has positive

60
implications since it appears that firms in this industry have a clear strategy to
pursue; on the other hand, it means that hypothesis 1 does not have support. As
with other sectors, most businesses fall into the small-size category (between 16 and
100 employees, or annual sales ranging from N$572,940.50 to N$5,807,533.25).
VI.E. The chemical industry.
Hypothesis 1 finds support in the chemical industry as all four strategies are
followed in this sector. Similar to the previous sections, data is presented by size
category (see Table VI.E. l).
Table VI.E. l. Miles and Snow's typology by firm size . h h . 1. d m t e c em1ca m ustrv.
MICRO SMALL MEDIUM LARGE TOTAL REACTOR 1 2 1 o 4 DEFENDER 4 4 2 2 12 ANALYZER 3 13 3 o 19 PROSPECTOR 1 8 2 1 12 TOTAL 9 27 8 3 47
From the table above, the reader can observe that all categories of strategy are
present in the chemical industry sector (including reactors). Additionally, it can be
observed that most firms in the sector are small size businesses (between 16 and
100 employees, or N$572,940.50 to N$5,807,533.25 annual sales).
In conclusion, top managers reported that reactor, defender, analyzer, and
prospector strategic orientations are followed in four of the five sectors studied; the
construction supply industry, where no firm indicated to be a reactor, was the only
exception. This means that hypothesis 1 finds support in the capital goods, metal
mechanic, foundry, and chemical industries. In other words, it appears that Miles

61
and Snow's (1978) typology of strategies is useful as a general framework for the
study of the strategies followed by top managers in the manufacturing sector of San
Luis Potosí.

VII. FINANCIAL PERFORMANCE UNDER MILES AND SNOW'S TYPOLOGY.
Miles and Snow's (1978) typology of strategy was correlated with financia!
performance indicators, although establishing causal relationship was not the
purpose. The association between categories of strategies and financia! performance
was aimed at finding identifiable patterns that suggested better financia!
performance under the prospector, analyzer or defender categories of strategy than
under the reactor strategy within each industrial sector studied.
This section reports findings for propositions 2, 3 and 4 for the 184 firms
sampled. Chi-square analysis was initially done to identify associations between the
categories of strategy and financia! performance indicators. The findings are: A
firm' s net profit margin compared to the industry' s average (DF) appears to be
significantly associated with the strategies employed (chi-square= 15.73948,
p =. O 152 < . 05); a firm' s net profit margin compared to the net profit margin under
the former strategic orientation (UN) appears to be significantly associated with the
firm 's current strategic orientation (chi-square=25.30805, p= .0134 < .05); a firm 's
market share compared to the market share under the firm' s previous strategic
orientation (PM) appears to be independent of the firm 's current strategy ( chi
square = 18.17416, p=.1105<.05); a firm's net profit margin over the last three
years (MC) appears to be independent of the firm's strategy (chi-square=8.15922,
p =. 2267 > . 05); and a firm 's market share changes during the last three years (PG)
appear to be significantly associated with the firm's current strategy (chi
square= 14.63835, p= .0233).
Correlation analysis was also done in order to gain sorne knowledge of the
strength of the association among the variables of interest (see Table VII.1).
62

Table VII. l. Miles and Snow's typology correlated with financia! t . d' per ormance m 1cators.
Prospectors Analyzers Firm' s net profit margin .2733*** -.0368 compared to the industry's (DF) Firm' s net profit margin -.1051 -.0216 compared to the previous strategv (UN) Firm 's market share -.1540* -.0353 compared to the previous stratee:v (PM) Firm' s net profit margin for .0659 .0855 the last three vears (MC) Firm' s market share for the .1805** .0855 last three vears (PG) 11
• 11 is printed if a coefficient cannot be computed.
* prob <0.05 ** prob<0.01 ***prob<0.001.
Defenders Reactors -.1798** -.0822
.0076 .1710*
.1451* .0598
-.0457 -.1355
-.2194*** -.0664
63
From the above table, the reader can observe several significant relationships.
Prospector firms tend to have experienced: 1) higher net profit margins compared
to the industry's average (p=.000), 2) an increased market participation compared
to the firm's previous strategic orientation (p=.019< .05), and 3) an increased
market share for the last three years (p =. 008 < . O 1). Defender firms appear to have
experienced: 1) lower net profit margins compared to the industry's average
(p= .008 < .05), 2) a decreased market share compared to the previous strategic
orientation (p=.026< .05), and 3) a decreased market share over the last three
years (p =.001). Reactor firms appear experienced a decreased net profit margin
compared to the firm' s previous strategy.

64
In order to test each hypothesis, t-test statistics were obtained. The findings are
presented in the following paragraphs.
Hypothesis 2a proposes that, compared to the industry's average performance,
prospector firms will obtain higher net profit margins than reactor firms (DF). The
t-test analysis (F= 1.16, pooled variance t-value=5.58, p= .006 < .01) supports this
hypothesis.
Hypothesis 2b suggests, that comparing the firm 's net profit margm to that
under the previous strategic orientation, the current net profit margin will be higher
under the prospector strategy than under the reactor strategy (UN). The t-test
analysis (F=l.06, separate variance t-value=2.14, p=.0175<.05) supports this
hypothesis.
Hypothesis 2c proposes that, compared to the firm's market share under the
previous strategic orientation, the current market share is higher under the
prospector strategy than under the reactor strategy (PM). The t-test analysis
(F=l.87, pooled variance t-value=l.47, p=.072>.05) does not support this
hypothesis.
Hypothesis 2d proposes that prospector firms have increased their net profit
margin more than reactor firms over the last three years (MC). T-test analysis
(F= 1.11, pooled variance t-value= l. 74, p= .043 < .05) supports this hypothesis.
Hypothesis 2e suggests that prospector firms have increased their market share
more than reactor firms over the last three years (PG). T-test analysis (F= 1.47,
pooled variance t-value= 1.83, p= .0355 < .05) supports this hypothesis.
Hypothesis 3a proposes that, compared to the industry's average performance
analyzer firms will obtain higher net profit margins than reactor firms (DF). T-test

65
analysis (F= 1.25, poolecl variance t-value= .62, p= .2695 > .05) does not support
this hypothesis.
H ypothesis 3b suggests that, comparecl to the firm' s net profit margin under the
previous strategic orientation, the current net profit margin will be higher under the
analyzer strategy than under the reactor position (UN). T-test analysis (F=l.80,
separate variance t-value= 1. 73, p = .0465 < .05) supports this hypothesis.
H ypothesis 3c postula tes that, comparecl to the firm' s market share under the
previous strategic orientation, current market share is higher under the analyzer
strategy than under the reactor category (PM). T-test analysis (F= 1.98, poolecl
variance t-value= .86, p= .1995 > .05) does not support this hypothesis.
Hypothesis 3d proposes that analyzer firms have increased their net profit
margin more than reactor firms over the last three years (MC). T-test analysis
(F=l.16, pooled vanance t-value=l.87, p=.0330<.05) suggests that this
hypothesis can be sustained.
Hypothesis 3e suggests that analyzer firms have increased their market share
more than reactor firms over the last three years (PG). T-test analysis (F=l.15,
pooled variance t-value=l.17, p=.1035>.05) reveals that no evidence exists to
support this hypothesis.
Hypothesis 4a postulates that, compared to the industry's average performance,
defender firms will obtain higher net profit margins than reactor firms (DF). T-test
analysis (F=l.16, pooled variance t-value=.13, p=.4480>.05) does not support
this hypothesis.
H ypothesis 4b proposes that, compared to the firm' s net profit margin under the
previous strategic orientation, current net profit margin will be higher under the

66
defender strategy than under the reactor strategy (UN). T-test analysis (F=l.81,
pooled variance t-value= 1.94, p=.0280< .05) supports this hypothesis.
H ypothesis 4c postulates that, compared to the firm' s market share under the
previous strategic orientation, current market share will be higher under the
defender strategy than under the reactor category (PM). T-test analysis (F= 1.86,
pooled variance t-value=.20, p=.4225> .05) does not support this hypothesis.
Hypothesis 4d proposes that defender firms have increased their net profit
margin more than reactor firms over the last three years (MC). T-test analysis
(F=l.48, pooled variance t-value=l.25, p=.1085>.05) does not support this
hypothesis.
Hypothesis 4e proposes that defender firms have increased their market share
more than reactor firms over the last three years (PG). T-test analysis (F= 1.44,
pooled variance t-value= .56, p= .2895 > .05) does not support this hypothesis .
As a result of this analysis, evidence exists to conclude that severa! significant
associations exists between the financia! performance indicators and the strategic
orientations proposed by Miles and Snow. Specifically prospectors have obtained
favorable results in net profit margins compared to the industry's, market share
compared to the firm' s previous strategy, and market share over the last three
years. Interestingly, defender firms have experienced the opposite effect for those
indicators. Prospectors outperform reactors in 4 of the 5 financia! indicators. When
compared to reactors, analyzers obtained better financia! results in 3 of the 5
financia! indicators, while defenders obtained better results in only 1 indicator. This
means that the prospector strategy provides more consistent and better financia!
results than those of other strategies.
67
VII.A. The capital goods industry.
Section VII.A tests and reports findings for propositions 2, 3 and 4 for the
capital goods industry. Chi-square analysis was done first to identify significant
associations between strategy financia! performance indicators under study. The
findings are: A firm 's net profit margin compared to the industry' s average (DF)
appears to be independent of the strategy selected (chi-square= 12.22222,
p =. 1416 > . 05); a firm' s net profit margin compared to the net profit under the
previous strategy (UN) appears to be independent of the firm' s current strategy
(chi-square=5.81429, p= .2135 > .05); a firm's market share compared to the
market share under the previous strategy (PM) appears to be independent of the
firm's current strategy (chi-square=6.60000, p=.5803>.05); a firm's net profit
margin over the last three years (MC) appears to be independent of the firm 's
strategy chi-square=6.57143, p=.3623> .05); anda firm's market share changes
over the last three years (PG) appear to be associated with the strategies employed
(chi-square= 14.85714, p=.0214 < .05).
Correlation analysis was also done in order to gain knowledge of the strength of
the association among the variables of interest (see Table VII.A.1).
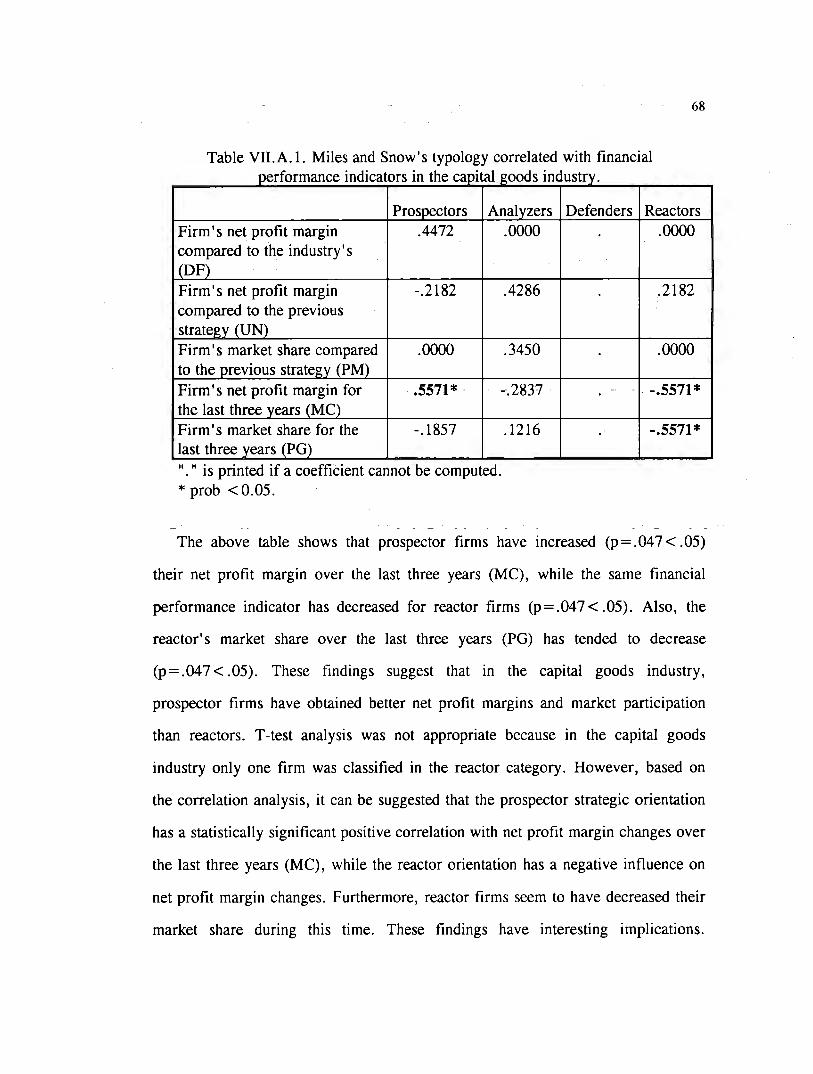
68
Table VII.A. l. Miles and Snow's typology correlated with financia] fi . dº . h ºtal d . d per ormance m 1cators m t e cap1 goo s m
Prospectors Analvzers Firm' s net profit margin .4472 .0000 compared to the industry's (DF)
Firm' s net profit margin -.2182 .4286 compared to the previous stratee:v (UN) Firm 's market share compared .0000 .3450 to the previous strategv (PM) Firm' s net profit margin for .5571 * -.2837 the last three vears (MC) Firm' s market share for the -.1857 .1216 last three years (PG) 11
• 11 is printed if a coefficient cannot be computed.
* prob <0.05.
ustrv.
Defenders Reactors .0000
.2182
.0000
-.5571 *
-.5571 *
The above table shows that prospector firms have increased (p =. 04 7 < . 05)
their net profit margin over the last three years (MC), while the same financia]
performance indicator has decreased for reactor firms (p =. 04 7 < . 05). Also, the
reactor' s market share over the last three years (PG) has tended to decrease
(p= .047 < .05). These findings suggest that in the capital goods industry,
prospector firms have obtained better net profit margins and market participation
than reactors. T-test analysis was not appropriate because in the capital goods
industry onl y one firm was classified in the reactor category. However, based on
the correlation analysis, it can be suggested that the prospector strategic orientation
has a statistically significant positive correlation with net profit margin changes over
the last three years (MC), while the reactor orientation has a negative influence on
net profit margin changes. Furthermore, reactor firms seem to have decreased their
market share during this time. These findings have interesting implications.

69
Knowledge has been gained about the impact of the prospector strategic orientation
in profit generation in the capital goods industry sector in contrast to the reactor
position which has resulted in market share and net profit margin decreases over the
last three years.
VII.B. The metal mechanic industry.
Section VII.B tests and reports findings for propositions 2, 3 and 4 for the
metal mechanic industry. Chi-square analysis was initially done to identify
associations between the categories of strategy and financia} performance indicators.
The findings are: a firm' s net profit margin compared to the industry' s average
(DF) seems to be independent of the strategies employed (chi-square=7.11280,
p =. 3105 > . 05); a firm' s net profit margin compared to the net profit margin under
the former strategic orientation (UN) appears to be independent of the firm' s
current strategic orientation ( chi-square =20. 26624, p = .0622 > .05); a firm 's
market share compared to the market share under the firm 's previous strategic
orientation (PM) appears to be significantly associated with firm 's current strategy
(chi-square=24.19947, p=.0191<.05); a firm's net profit margin over the last
three years (MC) appears to be independent of the firm' s strategy (chi
square = 6. 69092, p =. 3504 > . 05); and a firm' s market share changes during the
last three years (chi-square=9.53345, p=.1457) appear to be independent of the
firm 's strategic orientation.
Correlation analysis was also done in order to gam sorne knowledge of the
strength of the association among the variables of interest (see Table VII.B.1).
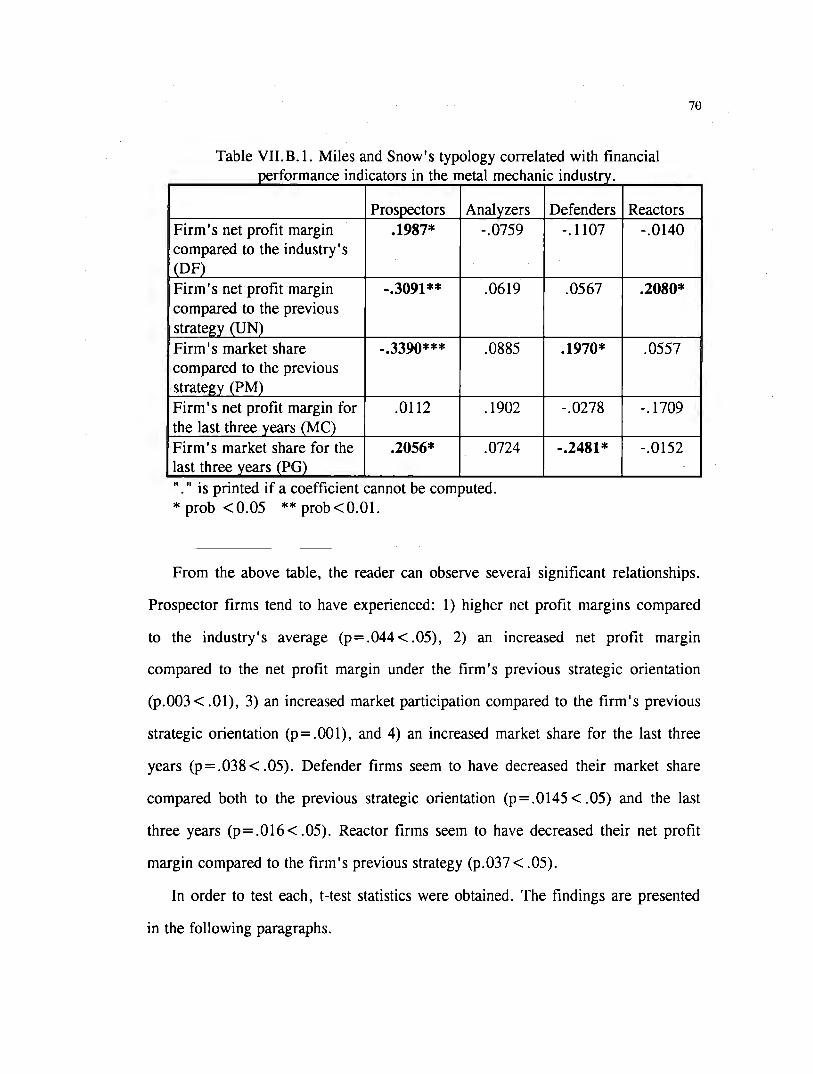
Table VII.B.1. Miles and Snow's typology correlated with financia! ti . d" . h 1 h . . d per ormance m 1cators m t e meta mee ame m ustry.
Prospectors Analyzers Firm' s net profit margin .1987* -.0759 compared to the industry' s (DF) Firm' s net profit margin -.3091 ** .0619 compared to the previous strategv (UN) Firm' s market share -.3390*** .0885 compared to the previous strategv (PM) Firm' s net profit margin for .0112 .1902 the last three years (MC) Firm' s market share for the .2056* .0724 last three vears (PG) 11
• 11 is printed if a coefficient cannot be computed.
* prob <0.05 ** prob<0.01.
Defenders -.1107
.0567
.1970*
-.0278
-.2481*
Reactors -.0140
.2080*
.0557
-.1709
-.0152
70
From the above table, the reader can observe several significant relationships.
Prospector firms tend to have experienced: 1) higher net profit margins compared
to the industry' s average (p =. 044 < . 05), 2) an increased net profit margin
compared to the net profit margin under the firm 's previous strategic orientation
(p.003 < .01), 3) an increased market participation compared to the firm's previous
strategic orientation (p= .001), and 4) an increased market share for the last three
years (p=.038 < .05). Defender firms seem to have decreased their market share
compared both to the previous strategic orientation (p =. O 145 < . 05) and the last
three years (p= .016 < .05). Reactor firms seem to have decreased their net profit
margin compared to the firm 's previous strategy (p. 037 < . 05).
In order to test each, t-test statistics were obtained. The findings are presented
in the following paragraphs.

71
Hypothesis 2a proposes that, compared to the industry's average performance,
prospector firms will obtain higher net profit margins than reactor firms (DF). The
t-test analysis (F=l.09, pooled variance t-value=.77, p=.224>.05) does not
support for this hypotheses .
Hypothesis 2b suggests, that comparing the firm's net profit margin to that
under the previous strategic orientation, the current net profit margin will be higher
under the prospector strategy than under the reactor strategy (UN). The t-test
analysis (F= 1.14, separate variance t-value=2.33, p= .014 < .05) supports this
hypothesis.
Hypothesis 2c proposes that, compared to the firm's market share under the
previous strategic orientation, the current market share is higher under the
prospector strategy than under the reactor strategy (PM). The t-test analysis
(F=2.10, pooled variance t-value=l.77, p=.044<.05) provides evidence to
suggest that this hypothesis can be sustained.
Hypothesis 2d proposes that prospector firms have increased their net profit
margin more than reactor firms over the last three years (MC). T-test analysis
(F=l.24, separate variance t-value=l.07, p=.148>.05) does not support this
hypothesis.
Hypothesis 2e suggests that prospector firms have increased their market share
more than reactor firms over the last three years (PG). T-test analysis (F= 1.06,
separate variance t-value= 1.04, p= .155 > .05) does not seem support this
hypothesis.
Hypothesis 3a proposes that, compared to the industry's average performance
analyzer firms will obtain higher net profit margins than reactor firms (DF). T-test

72
analysis (F=l.56, separate variance t-value=.36, p=.361>.05) does not support
this hypothesis.
H ypothesis 3b suggests that, compared to the firm' s net profit margin under the
previous strategic orientation, the current net profit margin will be higher under the
analyzer strategy than under the reactor position (UN). T-test analysis (F=2.60,
pooled variance t-value= .87, p= .195 > .05) does not support this hypothesis.
Hypothesis 3c postulates that, compared to the firm's market share under the
previous strategic orientation, current market share is higher under the analyzer
strategy than under the reactor category (PM). T-test analysis (F=2.19, pooled
variance t-value=.32, p=.377> .05) does not support this hypothesis.
Hypothesis 3d proposes that analyzer firms have increased their net profit
margin more than reactor firms over the last three years (MC). T-test analysis
(F=l.34, separate variance t-value=l.90, p=.035<.05) suggests that this
hypothesis can be sustained.
Hypothesis 3e suggests that analyzer firms have increased their market share
more than reactor firms over the last three years (PG). T-test analysis (F= 1.04,
separate variance t-value= .69, p= .249 > .05) reveals that no evidence exists to
support this hypothesis.
Hypothesis 4a postulates that, compared to the industry's average performance,
defender firms will obtain higher net profit margins than reactor firms (DF). T-test
analysis (F=l.63, pooled variance t-value=.32, p=.374>.05) does not support
this hypothesis.
H ypothesis 4b proposes that, compared to the firm' s net profit margin under the
previous strategic orientation, current net profit margin will be higher under the

73
defender strategy than under the reactor strategy (UN). T-test analysis (F=2.04,
pooled variance t-value=.64, p=.263) does not support this hypothesis.
H ypothesis 4c postula tes that, compared to the firm' s market share under the
previous strategic orientation, current market share will be higher under the
defender strategy than under the reactor category (PM). T-test (F=5.05, pooled
variance t-value= 1.04, p=.155 > .05) analysis does not support this hypothesis.
Hypothesis 4d proposes that defender firms have increased their net profit
margin more than reactor firms over the last three years (MC). T-test analysis
(F= 1.87, pooled variance t-value= .62, p=.272 > .05) does not support this
hypothesis.
Hypothesis 4e proposes that defender firms have increased their market share
more than reactor firms over the last three years (PG). T-test analysis (F=2.75,
pooled variance t-value= 1.47, p= .077 > .05) does not support for hypothesis .
As a result of this analysis, evidence exists to conclude that prospector firms
tend to increase their net profit margins in relation to the industry's average.
Compared to the results obtained from the previous strategy, prospectors have also
improved their financia] performance. Additionally, prospector firms have
increased their market participation over the last three years. Analyzer firms do not
show clear associations with financia] performance; however, these firms appear
have improved their market share, compared to their previous strategic orientation,
more that reactor firms. Defender firms seem to have decreased their market share
compared to their former strategy and over the last three years. Reactor firms have
worsened financia} performance compared to that under their previous strategy.

74
VII.e. The foundry industry.
This section reports findings related to financia} performance indicators for
companies in the foundry industry under each category of strategy proposed by
Miles and Snow (1978). Chi-square analysis was first obtained to identify
significant associations between the categories of strategy and the financial
performance indicators under study. The findings are: a firm' s net profit margin
compared to the industry's (DF) appears to be independent of firm's strategic
orientation (chi-square=9.17000, p=.3282>.05); a firm's net profit margin
compared to the net profit margin under the previous strategic orientation (UN)
appears to be independent of the current strategic orientation (chi-square=6.08111,
p =. 7318 > . 05); a firm' s market share compared to the market share under the
former strategy (PM) appear to be independent of the current strategic orientation
(chi-square=6.50000, p= .8888 > .05); a firm 's net profit margin changes over the
last three years (MC) appear to be independent of the firm' s current strategy ( chi
square = 7 .07778, p=.3137> .05); and a firm's market share over the last three
years (PG) appears to be independent of the firm' s strategic ( chi-square = 3 .17778,
p=.7862> .05).
Correlation analysis was also done in order to understand how categories of
strategy are related to financia} performance (see Table VII.C. l)
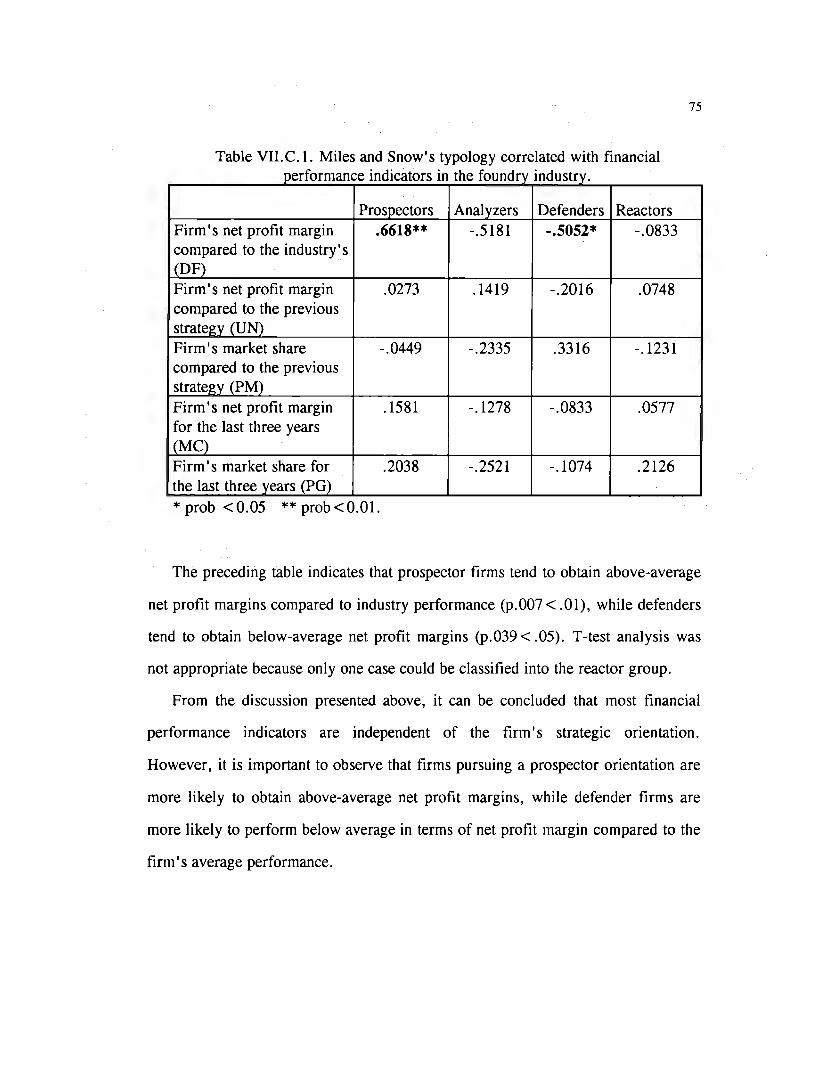
75
Table VII. C. l. Miles and Snow' s typology correlated with financia! ti . d" . h ti d . d per ormance m 1cators m t e oun ry m ustry.
Prospectors Analyzers Defenders Reactors Firm' s net profit margin .6618** -.5181 -.5052* -.0833 compared to the industry's (DF) Firm' s net profit margin .0273 .1419 -.2016 .0748 compared to the previous strategv (UN) Firm' s market share -.0449 -.2335 .3316 -.1231 compared to the previous strategv (PM) Firm' s net profit margin .1581 -.1278 -.0833 .0577 for the last three years (MC) Firm' s market share for .2038 -.2521 -.1074 .2126 the last three years (PG) *prob <0.05 **prob<0.01.
The preceding table indicates that prospector firms tend to obtain above-average
net profit margins compared to industry performance (p.007 < .01), while defenders
tend to obtain below-average net profit margins (p.039 < .05). T-test analysis was
not appropriate because only one case could be classified into the reactor group.
From the discussion presented above, it can be concluded that most financia!
performance indicators are independent of the firm 's strategic orientation.
However, it is important to observe that firms pursuing a prospector orientation are
more likely to obtain above-average net profit margins, while defender firms are
more likely to perform below average in terms of net profit margin compared to the
firm' s average performance.

76
VII.O. The construction supply industry.
Section VII.O tests and reports findings for propositions 2, 3 and 4 for the
construction supply industry. Chi-square analysis was initially done to identify
significant associations between the categories of strategy and the financia!
performance indicator under study. The findings are: a firm' s net profit margin
compared to the industry's average (DF) appears to be strongly associated with
strategy (chi-square= 15.83090, p=.0147 < .05); a firm's net profit margin
compared to the net profit margin under the previous strategic orientation (UN)
does not appear to be associated with the firm's current strategic orientation (chi
square=7.01748, p= .3192 > .05); a firm's market share compared to the market
share under the former strategic orientation (PM) does not appear to be associated
with the firm's current strategy (chi-square=6.96568, p=.6407); a firm's net profit
margin compared to the market share under the firm' s previous strategic orientation
(MC) appears to be independent of the current strategic orientation of the firm (chi
square= 10. 73473, p=.0969); anda firm's market share over the last three years
(PG) appears to be associated significantly with firm' s strategic orientation (chi
square= 18.93544, p= .0043).
Correlation analysis was done in order to gain sorne knowledge of the strength
of the association among the variables of interest (see Table VII.D.1).

VII.D.1. Miles and Snow's typology correlated with financial performance . d" . h . l . d m 1cators m t e construction supp cY m ustry.
Prospectors Analyzers Firm' s net profit margin .2205 .2589 compared to the industry' s (DF) Firm' s net profit margin -.0330 -.2896* compared to the previous stratel:!:v (UN) Firm 's market share -.2863* -.1072 compared to the previous strate~v (PM) Firm' s net profit margin .1286 .3986** for the last three years (MC) Firm' s market share for .4305** .3986** the last three years (PG) "." is printed if a coefficient cannot be computed. * prob < 0.05 **prob < 0.01 ***prob < 0.001.
Defenders -.4433
.1277
.3063*
-.3026***
-.5945***
Reactors
77
As the reader can observe from the above table, prospector firms in the
construction supply industry appear to have increased: 1) market participation
compared to that under the previous strategic orientation (p=.045 < .05), and 2)
market share over last three years (.004 < .01). Analyzer firms appear to have
increased: 1) net profit margin compared to those under the previous strategy
(p= .043 < .05), 2) net profit margin over the last three years (p= .008 < .01) and 3)
market share over the last three years (p =. 008 < . O 1). Defender firms in this
industry seem to have experienced: 1) below-average net profit margins
(p =. 003 < . O 1), 2) decreased market participation compared to that under their
former strategic orientation (p =. 035 < . 05), 3) decreased net profit margins over

78
the last three years (p =. 036 < . 05), and 4) decreased market share o ver the last
three years (p=.000< .001).
In this industrial sector, no firm was classified as a reactor, thus group
comparisons among the prospector, analyzer and defender categories and the reactor
position could not be obtained.
In conclusion, evidence exists to suggest that prospector and analyzer firms
obtain better financia} results than defender firms in the construction supply
industry. Although comparisons with the reactor category were not possible in this
industry, it is important to know that two categories of strategic orientation-
prospector and analyzer--provide better financia} results than does the defender
strategy.
VII.E. The chemical industry.
Section VI.E tests and reports findings for propositions 2, 3 and 4 for the
chemical industry. Chi-square was first obtained in order to identify significant
associations between the categories of strategy and the financia! performance
indicators of interest. The findings are: A firm' s net profit margin compared to the
industry's average (DF) appears to be independent of the firm's strategic category
(chi-square=6.90379, p= .3298 < .05); a firm's net profit margin compared to the
net profit margin under the firm' s previous strategy (UN) appears to be independent
of the firm's current strategic category (chi-square=9.19823, p=.4192<.05); a
firm' s market share compared to the market share under the previous strategic
orientation (PM) appears to be independent of the firm 's current strategic category
(15.57852, p=.0762<.05); a firm's net profit margin over the last three year
(MC) appears to be independent of the firm's current strategy (2.83136,

79
p =. 8297 < . 05); and a firm 's market share over the last three years (PG) appears to
be independent of the firm's strategic orientation (6.17489, p=.4039).
Correlation analysis was done in order to gain sorne knowledge of the strength
of the association among the variables of interest (see Table VII.E.1).
VII.E.1 Miles and Snow's typology correlated with financia} performance . d' t . th h . 1 . d t m 1ca ors m e c em1ca m us ry.
Prospectors Analyzers Defenders Reactors Firm 's net profit margin .3002* -.1754 -.0016 -.1580 compared to the industry's (DF) Firm' s net profit margin .1463 -.1033 -.0993 .1082 compared to the previous strategy (UN) Firm' s market share .1840 -.0868 -.1987 .1756 compared to the previous strategy (PM) Firm' s net profit margin for .0580 -.1708 .1433 -.0142 the last three years (MC) Firm 's market share for the .1021 .0217 .0305 -.2452* last three years (PG)
* prob <0.05.
Although correlation analysis does not show many significant relationships,
two significant correlations are revealing. Prospector firms tend to generate above
average net profit margins compared to the industry' s performance (p =. 020 < . 05),
while reactors appear to have decreased market participation during the last three
years (p= .048 < .05). This implies that a prospector strategic orientation is likely to
produce better results than a reactor.
T-test analysis was performed with the purpose of testing the research
hypotheses. The findings are reported in the following paragraphs.

80
Hypothesis 2a proposes that, compared to the industry's average performance,
prospector firms will obtain higher net profit margins than reactor firms (DF). T
test analysis (F=l.06, separate variance t-value=2.29, p=.034< .05) supports this
hypothesis.
H ypothesis 2b postulates that, compared to the firm 's net profit margin under
the previous strategic orientation, the current net profit margins will be higher
under the prospector strategy than under the reactor category (UN). T-test analysis
(F=l.06, separate variance t-value=.15, p=.444>.05) does not support this
hypothesis.
H ypothesis 2c proposes that, compared to the firm' s market share under the
previous strategic orientation, the current market share will be higher under the
prospector strategy than under the reactor position (PM). T-test analysis (F=3.46.
pooled variance t-value=.45, p=.329> .05) does not support this hypothesis.
Hypothesis 2d proposes that prospector firms have increased their net profit
margins more than reactor firms over the last three years (MC). T-test analysis
(F=l.70, pooled variance t-value=.23, p=.410) does not sustain this hypothesis.
Hypothesis 2e suggests that prospector firms have increased their market share
more than reactor firms over the last three years (PG). T-test analysis (F= 1.06,
separate variance t-value=2.29, p=.034 < .05) suggests that this hypothesis can be
sustained.
Hypothesis 3a proposes that, compared to the industry's average performance,
analyzer firms will obtain higher net profit margins than reactor firms (DF). T-test
analysis (F=l.54, pooled variance t-value=.59, p=.280>.05) does not support
this hypothesis.

81
Hypothesis 3b postulates that, compared to the firm 's net profit margin under
the previous strategic orientation, the current net profit margin will be higher under
the analyzer strategy than under the reactor orientation (UN). T-test analysis
(F=l.96, pooled vanance t-value=.95, p=.176>.05) does not supports this
hypothesis.
H ypothesis 3c suggests that, compared to the firm 's market share under the
previous strategic orientation, the current market share will be higher under the
analyzer strategy than under the reactor category (PM). T-test analysis (F=2.70,
pooled variance t-value= 1.22, p=.119 > .05) does not support this hypothesis.
Hypothesis 3d suggests that analyzer firms have increased their net profit
margin more than reactor firms over the last three years (MC). T-test analysis
(F= 1.45, separate variance t-value=.28, p=.390) does not sustain this hypothesis.
Hypothesis 3e suggests that analyzer firms have increased their market share
more than reactor firms over the Iast three years (PG). T-test analysis (F=2.25,
pooled variance t-value= 1.43, p= .084 > .05) does not support this hypothesis.
Hypothesis 4a propases that, compared to the industry's average performance,
defender firms will obtain higher net profit margins than reactor firms (DF). T-test
analysis (F=2.52, pooled variance t-value=.78, p=.224> .05) does not sustain
this hypothesis.
H ypothesis 4b suggests that, compared to the firm' s net profit margin under the
previous strategic orientation, the current net profit margin will be higher under the
defender strategy than under the reactor category (UN). T-test analysis (F=l.51,
separate variance t-value=.79, p=.236) does not support this hypothesis.

82
H ypothesis 4c postulates that, compared to the firm' s market share under the
previous strategic orientation, the current market share will be higher under the
defender strategy than under the reactor position (PM). T-test analysis (F= 1.78,
separate variance t-value= 1.12, p= .162 > .05) does not sustain this hypothesis.
Hypothesis 4d suggests that defender firms have increased their net profit
margin more than reactor firms over the last three years (MC). T-test analysis
(F=l.06, separate variance t-value=.57, p=.295>.05) does not support this
hypothesis.
Hypothesis 4e proposes that defender firms have increased their market share
more than reactor firms over the last three years (PG). T-test analysis (F=2.42,
pooled variance t-value= 1.39, p= .094 > .05) does not support this hypothesis.
In conclusion, it can be noted that sorne evidence was found to suggest that
prospector firms have generated net profit margins above the industry's average.
Also, evidence was found to suggest that market share for prospectors over the last
three years has increased more than reactors' over the same time period. Finally,
correlation analysis suggests that reactor firms have reduced their market share
during the last three years.

VIII. MAIN ORGANIZATIONAL ACTIVITIES UNDER EACH STRATEGIC ORIENTATION.
In this chapter, associations between ten organizational activities and each
strategic orientation proposed by Miles and Snow ( 1978) are sought, and findings
are reported. Expected validity of the strategy type was though by correlating them
with organizational activities. For example, Table VIII.1 indicates that prospectors
emphasize marketing, engineering and product research and development activities.
These findings are consistent with Snow and Hrebiniak (1980) who found that
prospectors' strengths are general management, product research and development,
market research, and basic engineering. Also, if managers emphasize activities
which support their self-reported strategies, this helps to validate the strategy
implemented. This section reports associations between the categories of strategy
and the main organizational activities performed in the firm, hypotheses were tested
for the whole database. (see Table VIII.1).
Table VIII. l. Miles and Snow's typology correlated with main organizational activities.
Prospectors Analyzers Defenders Reactors General mana.e;ement (F AG) .0228 -.0484 -.0175 .0382 Financial management -.0562 -.0524 .0160 .1339* (FAF) Marketing/sales (FMV) -.1307* -.0184 .0718 .0956 Market research (FIM) -.2299*** .0169 .1655* .0670 Product research and -.1980** -.0042 .1383* .0855 development (FIDP) Engineering, basic -.1942** .0133 .1645* -.0014 and applied (FIBA) Production (FP) .0257 -.0644 .0112 .0087 Distribution (FD) .0242 -.0294 -.0520 .0678 Le.e;al affairs (F AL) -.0795 .0704 .0289 .0055 Personnel (FRH) -.0730 -.0888 .0602 .1243 * prob <0.05 ** prob <0.01.
83
84
Hypothesis 5a proposes that prospector's major organizational activities will be:
general management, product research and development, market research, and basic
and applied engineering. Correlation analysis shows that prospectors appear to
emphasize marketing and sales, market research, product research and
development, and basic and applied engineering. These findings are consistent to
this strategy.
Hypothesis 5b postulates that analyzer's major organizational activities will be:
general management, production, basic and applied engineering, and marketing and
sales. Correlation analysis does not show associations significant enough to support
this hypothesis.
Hypothesis 5c proposes that defender's major organizational activities will be:
general management, financia! management, production, and basic and applied
engineering. Correlation analysis shows that defenders do not emphasize market
research, product research and development, and basic and applied engineering.
Hypothesis 5d proposes that reactor firms will not show statistically significant
organizational activities. Since only one significant correlation was found,
hypothesis 5d is supported. Moreover, a significant correlation (p < .05) was found
to suggest that reactors tend not to emphasize financia! management.
Sorne evidence exists to suggest that prospector firms are more likely to
emphasize marketing and sales, market research, product research and
development, and basic and applied engineering; as opposed to defenders which do
not emphasize market research, product research and development, and basic and
applied engineering.

85
VIII.A. The capital goods industry.
Correlation analysis was utilized to measure the strength and direction between
the categories of strategy and the organizational activities under study (see Table
VIII.A. l).
Table VIII.A. l. Miles and Snow's typology correlated with main .. 1 "h ·1 d"d organ1zat1ona act1v1t1es m t e cap1ta goo s m ustry.
Prospectors Analyzer Defenders Reactors
s General management (FAG) -.0913 -.4000 .6455 Financia! management -.4714 .6455 -.1667 (FAF) Marketing/ sales (FMV) -.0913 -.4000 .6455 Market research (FIM) .0913 -.3000 .2582 Product research and -.1667 -.0913 .3536 development (FIDP) Engineering, basic .1667 -.5477 .4714 and applied (FIBA) Production (FP) .4167 -.7303* .3536 Distribution (FD) .3536 -.2582 -.1667 Legal affairs (F AL) -.2582 .3536 -.0913 Personnel (FRH) -.7100* .3536 .5477 * prob <0.05. 11
• 11 is printed if a coefficient cannot be printed.
Hypothesis 5a proposes that prospector's major organizational activities will be:
general management, product research and development, market research, and basic
and applied engineering; however correlation analysis does not support this
hypothesis. Nevertheless, an unexpected association showed significance: evidence
was found to suggest that prospector firms make emphasis on personnel activities.

86
Hypothesis Sb suggests that analyzers' major organizational activities will be:
general management, production, basic and applied engineering, and marketing and
sales. However, the only significant association found was with production, thereby
providing modest support for hypothesis Sb. Financia! activities show an indirect
and limited relationship with the analyzer orientation (p= .059), yet analyzers
appear not to emphasize financia! activities--a result that was not hypothesized.
Hypothesis Se postulates that defender's major organizational activities will be:
general management, financia! management, production, and basic and applied
engineering. Unfortunately a correlation coefficient could not be computed because
only one firm classified in this category.
Hypothesis Sd suggests that reactor firms will not show statistically significant
organizational activities. According to what was hypothesized, no distinctive
organizational activities showed significant associations. Two observed significant
levels (p> .059) are slightly the above accepted significance level (p=.05).
lnterestingly, reactors do not appear to emphasize general management (p =. 059) or
marketing and sales activities (p =. 059). The lack of emphasis on general
management can be interpreted as failure to control the basic functional areas of the
firm, marketing being one of them.
VIII.B. The metal mechanic industry.
This chapter reports associations between the categories of strategy and the
major organizational activities under study (see Table VIII.B. l).

87
Table VIII.B. l. Miles and Snow's typology correlated with main . . 1 . h tal h . . d organ1zat1ona act1v1t1es m t e me mee ame m ustry.
Prospectors Analyzers Defenders Reactors General management .0351 .0303 -.0395 -.0250 (FAG) Financia! management -.0426 .0058 -.0660 .1123 (FAF) Marketing/ sales (FMV) -.2617* -.0145 .1526 .1295 Market research (FIM) -.3193* .1227 .1358 .0729 Product research and -.3753* .0684 .1227 .2020* development (FIDP) Engineering, basic -.0595 -.0609 .1262 -.0131 and applied (FIBA) Production (FP) .1138 -.1110 .0909 -.1110 Distribution (FD) -.0435 .0854 -.0731 .0415 Legal affairs (FAL) -.1277 .0918 .0000 .0459 Personnel (FRH) -.2786** .0907 .1508 .0447
* prob <0.05 ** prob <0.01.
Hypothesis 5a. proposes that prospector 's major organizational activities will
be: general management, product research and development, market research, and
basic and applied engineering. As expected, prospector firms emphasize market
research (p < .05) and product research and development (p < .01). They do not
emphasize basic and applied engineering or general management. Marketing and
sales showed a significant association (p < .05) with the prospector strategic
orientation. This finding appears consistent with the two organizational activities
which also showed significant correlations.
Hypothesis 5b postulates that analyzer's major organizational activities will be:
general management, production, basic and applied engineering, and marketing and
sales. Correlation analysis does not show associations significant enough to support
this hypothesis.

88
Hypothesis Se proposes that defender's major organizational activities will be:
general management, financia! management, production, and basic and applied
engineering. Correlation analysis does not show significant relationships between
these organizational activities and the categories of strategy under study.
Hypothesis Sd proposes that reactor firms will not show statistically significant
organizational activities. Since only one significant correlation was found,
hypothesis Sd is supported. Moreover, a significant correlation (p < .05) was found
to suggest that reactors tend not to emphasize product research and development, as
opposed to prospectors which do tend to emphasize this area (p < . O 1).
Although few significant correlations were found, sorne evidence exists to
suggest that prospector firms are more likely to emphasize the following
organizational activities: marketing and sales, market research, and product
research and development.
VIII.C. The foundry industry.
This chapter reports the organizational activities that characterize each strategic
orientation under study (see Table VIII.C. l).

89
Table VIII.C.1. Miles and Snow's typology correlated with mam . al h i d . d orgamzat10n actlv1tles m t e oun ry m ustry.
Prospectors Analyzers Defenders Reactors General management (FAG) -.0667 .7454* -.4472 -.2928 Financia! management -.6000 .7454* -.4472 .4880 (FAF) Marketing/ sales (FMV) -.2067 .2774 .4623 .0605 Market research (FIM) -.1240 -.0925 .2774 -.0605 Product research and .2981 .0000 .0000 -.4364 development (FIDP) Engineering, basic -.6956* -.1037 .7259* .2037 and applied (FIBA) Production (FP) -.2928 .6547* -.2182 -.1429 Distribution (FD) -.3246 .3111 -.1037 .2037 Legal affairs (F AL) -.8563* .5222 .5222 -.1140 Personnel (FRH) .2928 .302 -.6547* .1429 *prob < .05.
Hypothesis 5a suggests that prospectors' major organizational activities will be:
general management, product research and development, market research, and basic
and applied engineering. Only modest support is found for this hypothesis. In the
foundry industry, prospectar firms appear to emphasize basic and applied
engineering (p < .05) and legal affairs (p < .05), an organizational activity not
expected to be related to prospector firms.
Hypothesis 5b suggests that analyzers' major organizational activities will be:
general management, production, basic and applied engineering, and marketing and
sales. Contrary to what was hypothesized, correlation analysis shows that analyzer
firms do not appear to emphasize general management or production (p < .05). No
support was found to suggest that analyzers emphasize make emphasis basic and
applied engineering or marketing and sales. A significant correlation (p < .05) was
found to propose that analyzers do not emphasize financia! management.
90
Hypothesis 5c postulates that defender's organizational activities will be: general
management, financial management, production, and basic and applied engineering.
Contrary to what was hypothesized, correlation analysis (p < .05) shows that
defenders do not emphasize basic and applied engineering. Defenders do (p < .05),
however, emphasize personnel activities, an association not expected to occur.
Hypothesis 5d suggest that reactor firms will not show statistically significant
organizational activities, and in fact, correlation analysis suggests this to be true
(p > .05).
Although no strong support was found for the hypotheses under analysis, an
interesting comparison can be made. Prospector firms tend to emphasize basic and
applied engineering, while defender firms tend not to emphasize make that activity.
VIII.D. The construction supply industry.
This section reports findings related to the organizational activities that
characterize the strategic categories in the construction supply industry (see Table
VIII.D. l).

91
Table VIII.D. l. Miles and Snow's typology correlated with main 1 h 1 . d orgamzallona act1v1t1es m t e construct10n supply m ustry.
Prospectors Analyzers Defenders Reactors General management (F AG) -.1820 .3223* -.0026 Financia! management .0461 -.1920 .0895 (FAF) Marketin~Jsales (FMV) -.0811 .1161 -.0025 Market research (FIM) -.4342* .2037 .3826* Product research and -.3331 * .2277 .2483 development (FIDP) Engineering, basic -.3584* -.1148 .3343* and applied (FIBA) Production (FP) .0035 -.1165 -.0407 Distribution (FD) -.0159 -.0497 .0052 Legal affairs (FAL) -.0586 -.0051 .1848 Personnel (FRH) .0815 -.0754 -.0263
* prob < .05. 11
• 11 is printed if a coefficient cannot be computed.
Hypothesis 5a suggests that prospectors' major organizational activities will be:
general management, product research and development, market research, and basic
and applied engineering. Correlation analysis shows expected associations with
market research (p < .05), product research and development (p < .05) and basic and
applied engineering {p < .05). Only general management failed to show a significant
relationship (p > .05).
Hypothesis 5b proposes that analyzers' major organizational activities will be:
general management, production, basic and applied engineering, and marketing and
sales. Only one of the expected associations--general management--was significant
(p < .05). Interestingly, correlation analysis shows that analyzer firms tend not place
much emphasis on general management.

92
Hypothesis 5c postulates that defender's major organizational activities will be:
general management, financial management, production, and basic and applied
engineering. No significant association (p> .05) was found for general or financial
management. Contrary to what was hypothesized, defender firms do not make
emphasis on basic and applied engineering (p < .05). Market research became
significant at a .05 level, meaning that defenders tend not emphasize on market
research.
Hypothesis 5d suggests that reactor firms will not show statistically significant
distinctive organizational activities. Correlation analysis was not possible to
calculate because no firm within this industry could be classified into the reactor
category; therefore, conclusions regarding organizational activities cannot be
derived.
The following conclusions result from the above discussion. Prospector firms
tend to emphasize market research while defenders tend not to emphasize this
organizational activity. Similarly, prospectors tend to emphasize on basic and
applied engineering while defenders demonstrate the opposite relationship.
VIII.E. The chemical industry.
This section reports significant associations between organizational activities
and the prospector, analyzer, defender and reactor categories of strategy (see Table
VIII.E.1).

93
Table VIII.E. l. Miles and Snow's typology correlated with main organizational f 'f . th h . 1 . d t ac 1v11es m e e em1ca m us rv.
Prospectors Analyzers Defenders Reactors General management (F AG) .1801 -.1530 -.1920 .2876* Financia! management -.0065 -.1664 .0947 .1547 (FAF) Marketing/sales (FMV) .0475 -.0289 -.0700 .0859 Market research (FIM) -.1787 .1737 -.1787 .2532* Product research and -.0273 -.0095 -.0831 .1893 development (FIDP) Engineering, basic -.2764* .2797* -.1599 .1898 and applied (FIBA) Production (FP) -.1002 -.0172 .0517 .1060 Distribution (FD) .2834* -.1788 -.1307 .0757 Legal affairs (F AL) .0544 .0892 -.2866* .2060 Personnel (FRH) .0182 -.0377 .2665* .4544** * p< .05 **p< .01.
Hypothesis 5a suggests that prospectors' major organizational activities will be:
general management, product research and development, market research, and basic
and applied engineering. Correlation analysis reveals that prospector firms in the
chemical industry tend to emphasize basic and applied engineering (p < .05). Other
expected correlations were not significant (p > .05). Propectors in the chemical
industry tend not to make emphasize on distribution activities.
Hypothesis 5b proposes that analyzers' organizational activities will be: general
management, production, basic and applied engineering, and marketing and sales.
Correlation analysis reveals that analyzer firms tend not to emphasize basic and
applied engineering. Other expected associations proved insignificant.
Hypothesis 5c proposes that defenders' major organizational activities will be:
general management, financia] management, production, and basic and applied

94
engineering. None of the expected associations prove significant at a .05 level.
Interestingly, defender firms tend to emphasize on legal affairs and personnel.
Hypothesis 5d postulates that reactor firms will not show statistically significant
organizational activities. However, three organizational activities did show
significant associations: general management, market research, and personnel.
Reactor firms tend not to emphasize these three activities, thus making for an
interesting finding. These firms do not control fundamental activities such as
general management, nor they sean market information. Finally, reactor firms do
not emphasize the personnel function.
From the discussion above, evidence is found to suggest that prospector firms
tend to emphasize basic and applied engineering while analyzers tend not to
emphasize on this activity. Also, defender firms tend to emphasize on personnel
activities while reactors do not.

IX. GENERAL MANAGER'S STRATEGY IMPLEMENTATION UNDER MILES AND SNOW'S TYPOLOGY.
This chapter seeks to identify the association between the strategic orientation
implemented and the category of the person responsible for its implementation i.e.,
the owner of the business or a professional general manager. Specifically,
proposition 6 states: The strategic orientation pursued differs depending on whether
the person responsible for its implementation is the business owner or a professional
general manager. This proposition has been operationalized through the following
hypotheses:
6a. The professional general manager will implement a prospector strategy,
while the business owner will implement a defender strategy.
6b. The professional general manager will implement an analyzer strategy,
while the business owner will implement a defender strategy.
Chi-square and t-test statistics were calculated in order to define whether or not
the categories of strategy are independent of the person finally responsible for
implementing the firm' s strategy.
In this section findings related to hypothesis 6 are reported usmg the whole
database. From table IX.1 the reader can observe how strategies break down into
the categories "business owner," "professional manager," or "managerial team".
Table IX.1. Strategy vis-a-vis person responsible for its . 1 . 1mp ementation.
Reactor Defender Analyzer Prospector Business owner 20 38 33 39 Professional mana~er 2 20 11 12 Mana~erial team o 2 o 3
95

96
The above table shows that in 130 of 180 (72 % ) cases the business owner is also
the person responsible for implementing the firm' s strategy. Five firms in the
sample reported that strategy implementation is a responsibility of a team formed by
the owner and the general manager. Chi-square analysis (9.22774, p= .1612 > .05)
does not support the hypothesis that an association exists between the person
responsible for the firm's strategy and the strategy implemented. The t-test analysis
(F=l.25, pooled variance t-value=l.25, p>0.05) does not support the hypothesis
that a professional general manager will implement a prospector strategy, while the
business owner will implement a defender strategy (6a). Hypothesis 6b which
proposed that a professional general manager will implement an analyzer strategy,
while the business owner will implement a defender strategy could not be sustained
either (F = 1.20 pooled variance t-value= 1.03, p > 0.5).
IX.A. The capital goods industry.
This section addresses proposition 6 for the capital goods industry. Table
IX.A.1 shows the distribution of strategic orientations in relation to the person
responsible for their implementation.
Table IX.A. l. Strategy vis-a-vis person responsible for its implementation in h "tal d . d t e cao1 goo s m ustry.
None Reactor Defender Analyzer Prospector Business owner 1 1 3 3 Professional manager 1 2
From the above table the reader can observe that the implementation of the
strategic orientation is responsibility of the owner in 8 out of the 11 cases
considered. This finding reveals that firms competing in the capital goods industry

97
are primarily managed by the business owner who plays the role of the top
decision-maker. Chi-square anal y sis ( 4. 9500 p =. 2925) suggests that the category of
strategy selected is independent of the person responsible for its implementation.
The t-test analysis could not be obtained because the analyzer and the defender
categories showed no variance around their means, making comparisons with the
prospector category unfeasible.
IX.B. The metal mechanic industry.
Here are reported findings related to the hypothesized association between the
person responsible for implementing the firm' s strategy and strategy itself. From
table IX.B. l the reader can observe how strategies break down into the categories
"business owner," "professional manager," or "managerial team".
Table IX.B.1. Strategy vis-a-vis person responsible for its . l f "th tal h"'dt 1mp ementa 10n m e me mee ame m us r,.
Reactor Defender Analyzer Prospector Business owner 14 20 14 14 Prof essional manager 2 2 3 3 Managerial team 1 2
The above table shows that in 62 of 75 cases the business owner is also the
person responsible for implementing the firm' s strategy. Three firms in the sample
reported that strategy implementation is a responsibility of a team formed by the
owner and the general manager. Chi-square analysis (4.33475 p= .6315) does not
provide support to suggest that an association exists between the person responsible
for the firm's strategy and the strategy implemented. The t-test analysis (F= 1.78,
pooled variance t-val ue =. 78, p =. 22 > . 05) does not provide support for the
hypothesis that a professional general manager will implement a prospector

98
strategy, while the business owner will implement a defender strategy (hypothesis
6a). Support was not found for hypothesis 6b which suggested that a professional
general manager will implement an analyzer strategy, while the business owner will
implemen t a defender strategy (F = 1. 78, pooled variance t-val ue = . 78, p = > . 05).
IX.C. The foundry industry.
This section discusses the findings related to the foundry industry. Almost ali
firms in the sample ( one case is missing) reported that the strategic orientation is the
responsibility of the business owner (see Table IX.C.1). This may be dueto the fact
that 11 of the 14 firms are classified as either micro or small so that the owner
performs most general management responsibilities.
Table IX.C. l. Strategy vis-a-vis person responsible for its 1m lementation in the foundr industr .
Owner 3 5
Since statistics cannot be computed when the number of non-empty rows
or columns is 1, chi-square analysis and t-test are not appropriate for the foundry
industry.
IX.O. The construction supply industry.
This section reports findings on the construction supply industry regarding the
association between the person responsible for the firm' s strategy and the strategy
implemented (see Table IX.D. l).

99
Table IX.D.1. Strategy vis-a-vis person responsible for its . 1 . . h . 1 . d 1mp ementat1on m t e construct10n supp y m ustrv.
None Defender Analyzer Prospector Owner 1 6 2 9 Professional mana~er 13 3 Mana~erial team 1 1
The reader can observe that none of the firms in the sample were classified in
the reactor category and that one firm could not be identified with the typology of
strategy under study. Also, it should be noted that the responsibility for the firm' s
implementation in two cases belongs to a managerial team formed by the business
owner and a general manager. Chi-square (8. 91635, p = .1783) reveals that
strategies and the person responsible for their implementation are independent of
each other. In this industry, it seems that the professional general manager is more
likely to be a defender, while the business owner tends to be a prospector (F= 1.12,
separate variance t-value=2.55, p=.005 < .05). This argument is opposed to that
suggested by hypothesis 6a. Since no professional manager in the sample selected
an analyzer strategy, hypothesis 6b cannot be tested.
IX.E. The chemical industry.
In this section, findings regarding strategic orientations and their association
with the person responsible for thcir implementation are reported. Table IX.E.1
shows how strategies break down into the categories of "business owner" and
"professional manager."

100
Table IX.E.1. Strategy vis-a-vis person responsible for its . 1 .. h h . 1· d 1mp ementallon m t e e em1ca m ustry.
Reactor Defender Analyzer Prospector Business owner 4 7 11 8 Professional mana~er 5 8 4
Chi-square was computed to find support for the hypotheses that a significant
association exists between the position of the person responsible for the strategy
implementation and strategy implemented. A chi-square of 2. 75541 was found
(p = .4309), which suggests that the strategy implemented is independent of who the
person responsible for its implementation is. The t-test analysis does not provide
support for hypothesis 6a. (F= 1.09, pooled variance t-value= .41, p > .05) or
hypothesis 6b. (F= 1.03, pooled variance t-value= .02, p > .05).
Based on the agency-cost theory, it was originally assumed that sorne
differences would exist in the strategy implemented given who the person
responsible for its implementation was (the business owner or a professional general
manager. However, it appears that no significant associations exist between the
category of strategy and the strategy implemented. A potential explanation for this
finding may come from the fact that the business owner is responsible for the firm 's
strategy most of the time (72 % of the cases in the sample). In other words, there is
not much variance between the strategy and the business owner or professional
management status.

X. GENERAL MANAGER 'S EDUCATIONAL LEVEL UNDER MILES AND SNOW'S TYPOLOGY.
This chapter addresses the question of whether the level of formal education of
the person responsible for the firm's strategy influences strategy implementation.
This research question has been formally stated in the following hypotheses
Hypothesis 7a: highly educated decision-makers, having at least a bachelor's
degree, will implement a prospector strategy, while less educated decision-makers,
having at most a high school diploma, will implement a defender strategy.
Hypothesis 7b: highly educated decision-makers, having a bachelor's degree,
will implement an analyzer strategy, while less educated decision makers, having at
most a high school diploma will implement a defender strategy.
Table X.1 presents the reader with a framework of reference for how formal
education breaks down into the categories of strategic orientation under study and
covers all the categories of formal education ascertained through the questionnaire.
These categories were classified into two broader groups as explained in the
research hypotheses.
Table X.1. Strategy by educational level of the person responsible for its . 1 . 1mp ementatlon.
None Reactor Defender Analyzer Prospector Doctoral degree 2 Unfinished doctoral degree Master' s degree 1 2 11 8 13 Unfinished master's degree 3 2 6 ~achelor's 1 13 38 26 28 Unfinished bachelor's degree 4 5 4 2 High school 1 2 3 2 Unfinished high school ~unior high or elementary 1 1 1 1 2 school No level of education 1
101

102
The above table shows that 154 of the sample's 184 top decision-makers hold at
least one college degree. The highest frequency belongs to the bachelor' s degree
category; only two top decision-makers hold a Ph.D. None of the managers in the
sample were classified in the "unfinished doctoral degree" or "unfinished high
school" categories.
Specifically, this section reports findings on whether the level of formal
education of the person responsible for the firm' s strategy influences strategy
implementation (hypotheses 7a and 7b). Table X.1 shows that 153 of 181 top
managers hold at least one bachelor' s degree.
Table X.2. Strategy by grouped educational level of the person "bl ti 1 . respons1 e or 1ts 1mp ementation. Reactor Defender Analyzer Prospector
High formal education 15 53 36 49 Low formal education 7 7 8 6
Chi-square was computed to test for the degree of association between the two
categories of interest. A value of 6.28255 (p = .0986) suggests independence
between the level of formal education of the top decision-maker and the strategy
implemented. The t-test analyses do not provide support for hypothesis 7a
(F=l.78, pooled variance t-value=l.12, p>.05) and hypothesis 7b (F=l.22,
pooled variance t-value= .47, p > .05).

103
X.A. The capital goods industry.
In this section of the report an answer is sought for hypotheses 7a and 7b in the
capital goods industry. Table X.A.1 shows that there are no firms in the sample
whose top decision-maker has at most a high school diploma.
Table X.A. l. Strategy by educational level of the person responsible for its . 1 . . h 'tal d . d 1mp ementatlon m t e cap1 _goo s m ustry.
None Reactor Defender Analyzer Prospector Highly educated 1 1 1 3 5
From the table above the reader can also observe that 5 of the 11 firms in the
sample were classified in the prospectar category. Unfortunately, statistics cannot
be computed when the number of non-empty rows or columns is 1. Thus no
statistical conclusions can be derived for the capital goods industry.
X.B. The metal mechanic industry.
This section reports findings on whether the degree of formal education of the
person responsible for the firm' s strategy influences strategy implementation in the
metal mechanic industry. Table IX.B. l shows that 56 of the 76 top managers in the
sample hold at least a bachelor' s degree.
Table X.B.1. Strategy by educational level of the person responsible i . t . 1 tat' . th tal h . . d t or 1 s 1mp emen 10n m e me mee ame m us rv.
Reactor Defender Analyzer Prospectar High formal 11 17 13 15 education Low formal 5 6 4 5 education
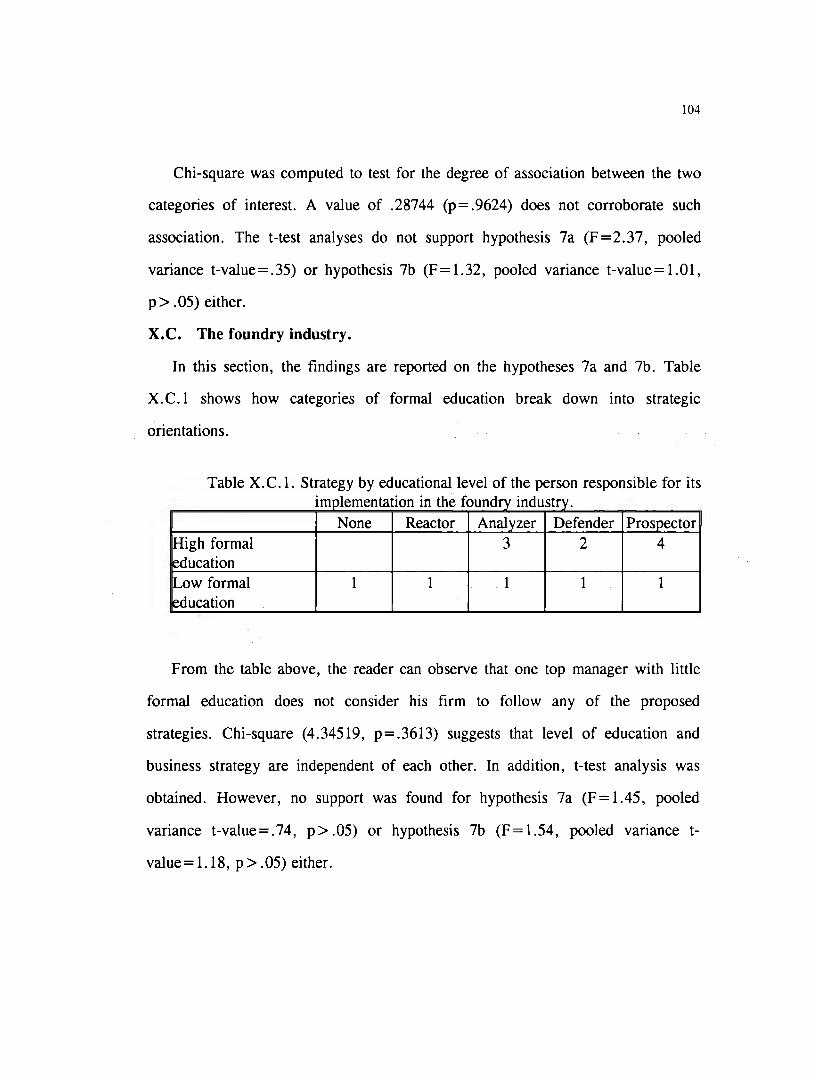
104
Chi-square was computed to test for the degree of association between the two
categories of interest. A value of .28744 (p=.9624) does not corroborate such
association. The t-test analyses do not support hypothesis 7a (F=2.37, pooled
variance t-value=.35) or hypothesis 7b (F= 1.32, pooled variance t-value= 1.01,
p > .05) either.
X.C. The foundry industry.
In this section, the findings are reported on the hypotheses 7a and 7b. Table
X.C.1 shows how categories of formal education break down into strategic
orientations.
Table X.C.1. Strategy by educational level of the person responsible for its . 1 .. h ~ d 'd 1mp ementat1on m t e oun 1ry m ustry.
None Reactor Analyzer Defender Prospector High formal 3 2 4 bducation ILow formal 1 1 1 1 1 bducation
From the table above, the reader can observe that one top manager with little
formal education does not consider his firm to follow any of the proposed
strategies. Chi-square (4.34519, p=.3613) suggests that level of education and
business strategy are independent of each other. In addition, t-test analysis was
obtained. However, no support was found for hypothesis 7a (F= 1.45, pooled
variance t-value=.74, p>.05) or hypothesis 7b (F=l.54, pooled variance t
value= 1.18, p > .05) either.

105
X.D. The construction supply industry.
This section attempts to determine the plausibility of hypotheses 7a and 7b by
finding support for the suggestion that the degree of formal education influences
strategy implementation. Unfortunately, ali respondents were classified as having a
high degree of formal education, thus providing no possibility for statistical analysis
(see Table X.D.1) .
High formal ucation
As can be seen from this table, one respondent considered his firm to be
pursuing a strategy different from those proposed by Miles and Snow, and only 2
out of 36 firms in the sample have implemented an analyzer strategy. Since no
decision-maker could be classified in the "low formal education" category, neither
chi-square or t-test analysis were possible to obtain.
X.E. The chemical industry.
This section test hypotheses 7a and 7b and reports findings for the chemical
industry. The analysis attempts to provide evidence suggesting that a difference
exists in the strategic orientation depending on the category of education of the
person responsible for its implementation. Table X.E.1 reveals how the data break
down into the categories of interest.
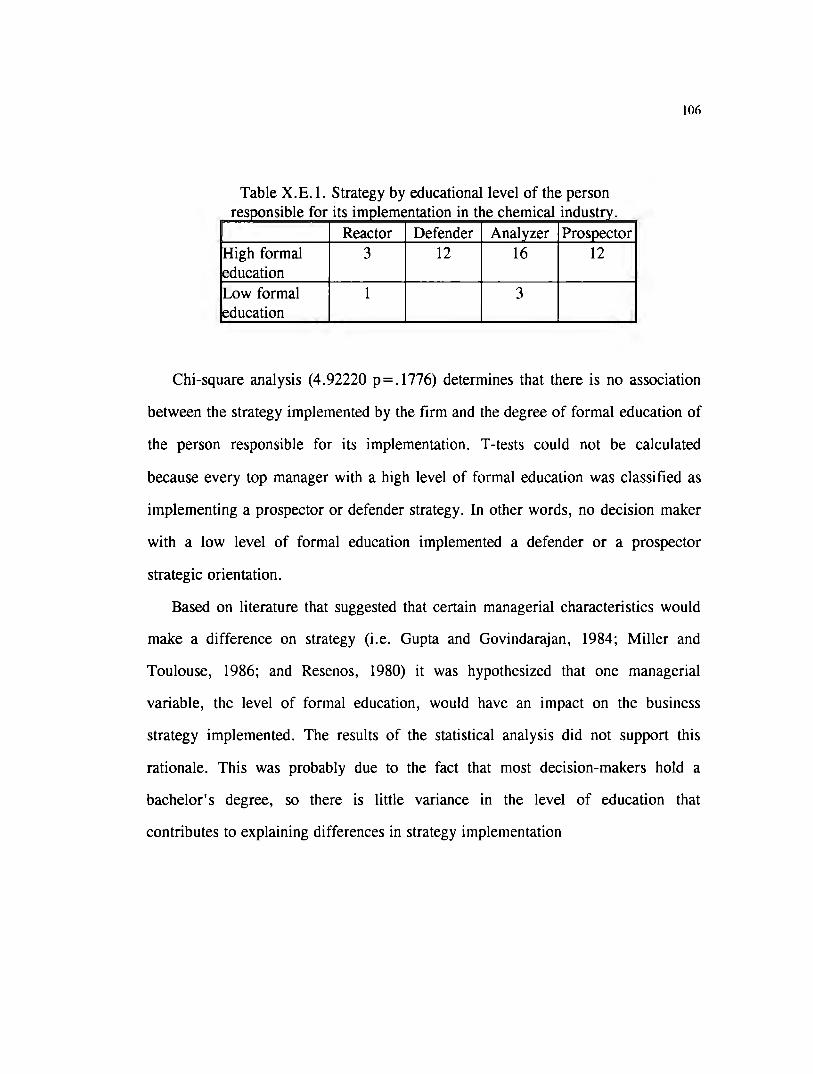
106
Table X. E. 1. Strategy by educational level of the person "bl ti "t . 1 taf . th h . al . d t respons1 e or 1 s 1mp emen 10nm e e em1c m us:rv.
Reactor Defender Analyzer Prospector High formal 3 12 16 12 education Low formal 1 3 education
Chi-square analysis (4.92220 p= .1776) determines that there is no association
between the strategy implemented by the firm and the degree of formal education of
the person responsible for its implementation. T-tests could not be calculated
because every top manager with a high level of formal education was classified as
implementing a prospector or defender strategy. In other words, no decision maker
with a low level of formal education implemented a defender or a prospector
strategic orientation.
Based on literature that suggested that certain managerial characteristics would
mal<:e a difference on strategy (i.e. Gupta and Govindarajan, 1984; Miller and
Toulouse, 1986; and Resenos, 1980) it was hypothesized that one managerial
variable, the level of formal education, would have an impact on the business
strategy implemented. The results of the statistical analysis did not support this
rationale. This was probably due to the fact that most decision-makers hold a
bachelor' s degree, so there is little variance in the level of education that
contributes to explaining differences in strategy implementation

XI. PORTER'S TYPOLOGY IN EACH INDUSTRIAL SECTOR.
This chapter provides a general overview of how Porter' s generic competitive
strategies break down into each sector of activity. It also serves as a departure point
for the following chapters in which distinctive competences, financia! performance,
and general manager variables are studied. Furthermore, in order to provide an
overview of the sectors studied, hypothesis la is tested, regardless of the industry
(see Table XI.1).
T bl XI 1 C a e ategones o strategy 1y 1rm s1ze. f b fi
Micro Small Medium Large Total None o 1 o 1 2 Cost leadership 12 29 4 5 50 Differentiation 18 41 18 9 86 Focus cost leadership 4 8 3 1 16 Focus differentiation 11 6 1 1 19 Stuck in the middle 2 6 o 2 10 Total 47 91 26 19 183*
* One large firm missing.
As the reader can observe from the above table, only two firms from the
sample reported not to follow strategies similar to those proposed by Porter, thus
providing support for hypothesis la. Additionally, most firms fall into the small
size category (between 16 and 100 employees, or annual sales ranging from
N$572,940.50 to N$5,807,533.25). This pattern is consistent throughout all sectors
studied, and in general, provides a clear idea as to industry size in San Luis Potosí.
XI.A. The capital goods industry.
This section presents information aimed at substantiating hypothesis la of the
capital goods industry study. Hypothesis la proposes that all of Porter's generic
strategies will be present in this industrial sector.
107

108
In order to provide the reader a clearer understanding of the structure of the
capital goods sector in San Luis Potosí, data was broken down into size categories
(see Table XI.A. l).
T bl XI A 1 C a e .. ategones o strategy 1y 1rm s1ze m t e cap1 f b fi h 'tal goo d . d s m ustry.
Micro Small Medium Large Total Cost leadership o 4 1 o 5 Differentiation 1 3 o 2 6 Total 1 7 1 2 11
As can be observed, only two generic strategies--cost leadership and
differentiation--are being pursued in the capital goods industry, which does not
provide support for hypothesis 1. However, it is interesting to note that the two
strategies followed are broad in scope: they do not focus on a market niche, and
neither is "stuck in the middle." This implies that firms in this industrial sector
follow clearly identifiable strategy patterns.
XI.B The metal mechanic industry.
In the metal mechanic industry, all of Porter's categories ("stuck in the middle"
included) are present (see Table XI.B. l).
T bl XI B 1 C a e .. ategones o strategy 1y um s1ze m t e meta mee ame m ustry. f b fi h h .. d
Micro Small Medium Large Total None 1 1 Cost leadership 6 11 o 2 19 Differentiation 12 11 5 5 33 Focus cost leadership 3 2 1 1 7 Focus differentiation 7 3 o 1 11 Stuck in the middle 2 3 o o 5 Total 30 30 6 10 76

109
The above table provides support for hypothesis la it can be observed that most
firms fall either in the micro size category (fewer than 15 employees and sales up to
N$572,940.50) or in the small-size category (between 16 and 100 employees, or
annual sales of N$572,940.50 and N$5,807,533.25). The reader can also observe
that only one firm reported following a strategy other than those proposed by
Porter.
XI.C. The foundry industry.
The focus cost leadership strategy is not present in the foundry industry (see
Table XI.C. l). Thus hypothesis la, which proposes that all of Porter's generic
strategies will be present in each industry sector, is not supported.
T bl XI C 1 C a e .. ategones o stratee:v "' um s1ze m t e oun rv m ustrv. f b fi h ~ d . d
Micro Small Large Total None o 1 o 1 Cost leadership o 2 1 3 Differentiation 2 4 1 7 Focus differentiation 1 1 o 2 Stuck in the middle o o 1 1 Total 3 8 3 14
The reader can observe that no medium-sized firms are present in the sample
and that most firms fall in the small size category. Additionally, only one firm
reported that its strategy is different from those proposed by Porter.

110
XI.O. The construction supply industry.
In the construction supply industry, ali of Porter' s generic strategies are present
(see Table XI.D.1). This supports hypothesis la which proposes that generic
strategies will be present in each industrial sector.
Table XI.O. l. Categories of strategy by firm size in the construction supply . d rn ustry.
Micro Small Medium Large Total Cost leadership o 6 3 o 9 Differentiation 2 11 7 o 20 Focus cost o 1 1 o 2 leadership Focus differentiation 2 o o o 2 Stuck in the middle o 1 o 1 2 Total 4 19 11 1 35
From the table above, it can observed that all firms in the sample were
classified in one of Porter' s generic strategies, i.e., each reported to follow one of
them. In addition, the reader can observe that most firms fall into the small size
category (between 16 and 100 employees, or annual sales between N$572,940.5
and N$5,807,533.25).

l l l
XI.E. The chemical industry.
As predicted by hypothesis la, the five generic strategies are present in the
chemical industry (see Table XI.E. l).
T bl XI E 1 C a e .. ategones o strategy ,y 1rms s1ze m t e c em1ca m f b fi h h . 1. d ustry. Micro Small Medium Large Total
Cost leadership 6 6 o 2 14 Differentiation 1 12 6 1 20 Focus cost leadership 1 5 1 o 7 Focus differentiation 1 2 1 o 4 Stuck in the middle o 2 o o 2 Total 9 27 8 3 47
Furthermore, the reader can observe that all firms in the sample were classified
in one of Porter' s categories of strategy and that most firms in the sample are small
businesses (between 16 and 100 employees, or annual sales between N$572,940.5
and N$5,807,533.25).
To conclude Chapter XI, hypothesis 1 received support in the metal mechanic,
construction supply, and chemical industries. In the capital goods industry, only the
general cost leadership and general differentiation categories of strategies were
present. In the foundry industry, only the focus cost leadership strategy was not
present. From this discussion, it appears that Porter' s generic strategies are useful
as a framework for studying the strategies followed by top managers in the
industrial sectors analyzed in this research.

XII. FINANCIAL PERFORMANCE UNDER PORTER'S TYPOLOGY.
Porter's typology of competitive strategy (1980) was correlated with financia!
performance indicators in each industry studied. Though establishing causal
relationships was not the purpose, the association between categories of strategies
and financia! performance was indeed aimed at finding identifiable patterns that
suggested improved financia! performance under the general cost leadership,
general differentiation, focus cost leadership or focus differentiation strategies than
under the "stuck in the middle".
This section of Chapter XII reports findings for propositions 2, 3, 4, and 5
using the whole database (184 cases). Chi-square analysis was done in order to find
significant associations between the categories of strategy proposed by Porter
(1980) and the financia! performance indicators studied in this research. The
analysis revealed the following: 1) there does not appear to be an association (chi
square= 13.10893, p=.1082) between the firm's net profit margin compared to that
of the industry and the category of strategy selected (DF); 2) a strong significant
association (chi-square=40.12388, p=.0007) appears to exist between the strategy
employed and the firm' s curren t net profit margin compared to the financial results
under the previous competitive strategy (UN); 3) a strong association (chi
square=39.96573, p=.0008) exists between strategies and the firm's current
market share compared to the previous strategy (PM). No significant associations
were found between strategy and net profit margin increases (chi-square=9.82426,
p= .2776) over the last three years (MC) or market share increases (Chi
square=9.78567, p=.6088) over the last three-year period (PG). Additionally,
correlation analysis was performed in order to ascertain the strength and direction
of the existing associations (see Table XIl.1).
112

113
Table XII. l. Porter's categories of strategy correlated with financial i . d" per ormance m 1cators.
Cost Differentiation Focus Focus Stuck Leadership cost differentiation in the
leadership middle Firm's net .0587 .0932 -.0376 -.1240* -.1031 profit margin compared to the industry' s (DF) Firm's net -.0048 -.0742 -.0270 .0456 .1431 * profit margin compared to the previous strate2v (UN) Firm's .0838 -.1602* -.0480 .0847 .1329* market share compared to the previous strate2v (PM) Firm's net .0439 .0369 .0325 -.0833 -.0934 profit margin for the last three years (MC) Firm's -.0723 .1045 .0088 -.0562 -.0233 market share for the last three years (PG)
*p< .05.
From the table above, the reader can observe that general differentiator firms
have increased market share (p < .05) compared to that under the previous strategy,
and "stuck in the middle" firms have decreased theirs. Also "stuck in the middle"
firms have decreased their net profit margin compared to that of the firm' s previous

114
strategy (p < .05). Finally firms following a focus differentiation strategy have
obtained below-average net profit margins for the industry (p < . 05).
The following paragraphs report the results of t-test analysis done to find
additional support for the research hypotheses.
Hypothesis 2a predicts that, compared to the industry's average performance,
firms following a general cost leadership strategy will obtain higher net profit
margins than "stuck in the middle" firms (DF). T-test analysis does not support this
hypothesis (F = 1.82, pooled variance t-value= 1.63, p= .0545 > .05).
H ypothesis 2b suggests that, compared to the firm' s net profit margin under the
previous competitive strategy, the current net profit margin will be higher under the
general cost leadership strategy than under the "stuck in the middle" position (UN).
This hypothesis cannot be supported (F=2.21, separate variance t-value=l.21,
p= .1255).
H ypothesis 2c postulates that, compared to the firm' s market share under the
previous competitive strategy, the current market share will be higher under the
general cost leadership strategy than under the "stuck in the middle" position (PM).
T-test analysis does not support this hypothesis (F=4.26, separate variance t
value=.81, p=.2180>.05).
Hypothesis 2d suggests that firms following a general cost leadership strategy
have increased their net profit margin more than "stuck in the middle" firms over
the last three years (MC). T-test analysis does not support this hypothesis (F=2.19,
pooled variance t-value= 1.29, p= .1015 > .05).
Hypothesis 2e predicts that firms following a general cost leadership strategy
have increased their market share more than "stuck in the middle" firms over the
115
last three years (PG). Evidence was not found to support this hypothesis (F = l. 79,
pooled variance t-value=.01, p=.4970> .05).
Hypothesis 3a postulates that, compared to the industry's average performance,
firms following a general differentiation strategy will obtain higher net profit
margins than "stuck in the middle" firms (DF). T-test analysis does not support this
hypothesis (F=l.38, pooled variance t-value=l.54, p=.0640> .05).
H ypothesis 3b predicts that, compared to the firm' s net profit margin under the
previous competitive strategy, the current net profit margin will be higher under the
general differentiation strategy than under the "stuck in the middle" position (UN).
T-test analysis does not support this hypothesis (F=2.48, separate variance t
value= 1.37, p= .1005 > .05).
Hypothesis 3c predicts that, compared to the firm's market share under the
previous competitive strategy, the current market share will be higher under the
general differentiation strategy than under the "stuck in the middle" position (PM).
Evidence does not sustain this hypothesis (F=2.44, separate variance t-value= 1.38,
p=.0990> .05).
Hypothesis 3d proposes that firms following a general differentiation strategy
have increased their net profit margin more than "stuck in the middle" firms over
the last three years (MC). T-test analysis does not support this hypothesis (F= 1.97,
pooled variance t-value= 1.23, p= .1110 > .05).
Hypothesis 3e proposes that firms following a general differentiation strategy
have increased their market share more than "stuck in the middle" firms over the
last three years (PG). Evidence does not support this hypothesis (F=2.22, pooled
variance t-value= .61, p= .2710 > .05).

116
Hypothesis 4a predicts that compared to the industry's average performance,
firms following a focus cost leadership strategy obtain higher net profit margins
than "stuck in the middle" firms (DF). There is insufficient evidence to support this
hypothesis (F= 1.82, pooled variance t-value=.76, p=.2275 > .05).
H ypothesis 4b suggests that, compared to the firm' s net profit margin under the
previous competitive strategy, the current net profit margin is higher under the
focus cost leadership strategy than under the "stuck in the middle" position (UN).
Evidence supporting this hypothesis is lacking (f =2.16, pooled variance t
value= 1.37, p= .0920 > .05).
H ypothesis 4c proposes that, compared to the firm 's market share under the
previous competitive strategy, the current market share is higher under the focus
cost leadership strategy than under the "stuck in the middle" position (PM).
Evidence does not exist to support this hypothesis (f =3.52, separate variance t
value= 1.46, p=.1130>.05).
Hypothesis 4d predicts that firms following a focus cost leadership strategy have
increased their net profit margin more than "stuck in the middle" firms over the last
three years (MC). Evidence for sustaining this hypothesis is insufficient (F = l. 63,
pooled variance t-value= 1.01, p= .1615 > .05).
Hypothesis 4e postulates that firms following a focus cost leadership strategy
have increased their market share more than "stuck in the middle" firms over the
last three years (PG). No evidence is found to support this hypothesis (f =2.30,
pooled variance t-value=.27, p=.3940> .05).
Hypothesis 5a suggests that, compared to the industry's average performance,
firms following a focus differentiation strategy will obtain higher net profit margins

117
than "stuck in the middle" firms (DF). There is insufficient evidence to sustain this
hypothesis (F=l.18, pooled variance t-value=.13, p=.4480>05).
Hypothesis 5b predicts that, compared to the firm's net profit margin under the
previous competitive strategy, the current net profit margin will be higher under the
focus differentiation strategy than under the "stuck in the middle" position (UN).
Evidence does not support this hypothesis {F=3.36, separate variance t-value=.89,
p=.1950> .05).
Hypothesis 5c suggests that, compared to the firm's market share under the
previous competitive strategy, the current market share will be higher under the
focus differentiation strategy than under the "stuck in the middle" position (PM).
Evidence is not found to support this hypothesis {F=2.33, pooled variance t
test=.61, p=.273>.05).
Hypothesis 5d proposes that firms following a focus differentiation strategy
have increased their net profit margin more than "stuck in the middle" firms over
the last three years (MC). No evidence is found to support this hypothesis
(F= 1.95, pooled variance t-value= .32, p= .3755 > .05).
Hypothesis 5e proposes that firms following a focus differentiation strategy have
increased their market share more than "stuck in the middle" firms over the last
three years (PG). No evidence is found to sustain this hypothesis {F= 1.99, pooled
variance t-value= .15, p= .4415 > .05).
Although a few significant associations were found, correlation analysis
provides sorne evidence to suggest that firms following a general differentiation
strategy obtain better financia! results, as measured by market share increases
compared to those obtained under the firm' s previous strategy, than "stuck in the
118
middle" firms. It is worth mentioning that in 2 of the 5 financia! performance
indicators used--net profit margin and market share compared to the previous
strategy--, "stuck in the middle" firms have obtained unfavorable financia! results.
XII.A. The capital goods industry.
Section XII.A. reports findings for propositions 2, 3, 4 and 5 for the capital
goods industry. Chi-square analysis was done first identify associations between
strategy and financia! performance. This analysis reveals that: 1) a firm' s net profit
margin compared to the industry's average (DF) is independent of the strategy
followed (2.03704 p=.3611); 2) a firm's market share compared to the results
obtained under the previous strategy (PM) is independent of the current strategy
(5.23809 p=.0729); 3) a firm's net profit margin increases over the last three years
(MC) is independent of the strategy pursued (. 77381, p =. 6792); and 4) a firm' s
market share increases over the last three years (PG) is independent of the cost
leadership strategies (.77381 p=.6792). Since the crosstabulation of Porter's
categories of strategy by the variable measuring the firm' s net profit margin
compared to the previous strategy (UN) resulted in a 2-by-2 matrix, Fisher's exact
test was calculated (one-tail = .34848); it indicates independence between the
variables of interest. Although no strong associations were found, sorne insights-
discussed in the following paragraphs--are observable from the correlation analysis
(see Table XII.A. l). T-test analysis was not possible because, in the capital good
industry sector, no firms were classified in the "stuck in the middle position," the
group with which the categories of strategy is compared.

119
Table XII.A. l. Porter's categories of strategy correlated with financial ~ . d' . h . 1 d . d per ormance m 1cators m t e cap1ta goo s m ustry.
Cost Differentiation Focus Focus Stuck Leadership cost differentiation in the
leadership middle Firm's net .0000 .0000 profit margin compared to the industry' s (DF)
Firm's net .5345 -.5345 profit margin compared to the previous strategy (UN) Firm' s market .000 .0000 share compared to the previous strategy (PM) Firm's net -.2274 .2274 profit margin for the last three years (MC) Firm' s market -.2274 .2274 share for the last three years (PG) 11
• 11 is printed if a coefficient cannot be computed.
In conclusion, an in-depth analysis of the proposed hypotheses in the capital
goods industry was not possible because firms in the sample reported following
only the general cost leadership and the general differentiation strategies. However,
this reveals that competitive strategies in the capital goods industry are broad in
scope. Furthermore, when correlated with financia] performance, moderate support
120
suggests that firms following a general differentiation strategy have increased their
net profit margin compared to their previous strategy, while firms pursuing a
general cost leadership strategy have tended to decrease their net profit margin
compared to their former strategic orientation.
XII.B. The metal mechanic industry.
This section of Chapter XII reports findings for proposition 2, 3, 4, and 5 for
the metal mechanic industry. Chi-square analysis was done in order to find
significant associations between the categories of strategy proposed by Porter
( 1980) and the financial performance indicators studied in this research. The
analysis revealed the following: 1) there appears to be a moderate association (chi
square= 17. 77632, p=.0589) between the firm's net profit margin compared to that
of the industry and the category of strategy selected (DF); 2) a significant
association (chi-square=36.20972, p=.0145) appears to exist between the strategy
employed and the firm' s current net profit margin compared to the financial results
under the previous competitive strategy (UN); 3) a strong association (chi
square=48.52986, p=.0004) exists between strategies and the firm's current
market share compared to the previous strategy (PM). No significant associations
were found between strategy and net profit margin in creases (p =. 2520) over the
last three years (MC) or market share increases (p =. 6088) over the last three-year
period (PG). Additionally, correlation analysis was performed in order to ascertain
the strength and direction of the existing associations (see Table XII.B. l).

121
Table XII.B. l. Porter's categories of strategy correlated with financia] ti . dº . h 1 h . . d per ormance m 1cators m t e meta mee ame m ustry.
*p< .05 Cost Di ff eren tiation Focus Focus Stuck in **p< .01 Leadership cost differentiation the ***p< .001 leadership middle Firm's net .0071 .2921 ** .0186 -.2933** -.2168* profit margm compared to the industry's (DF)
Firm's net .0448 -.2207* .0027 .0096 .3279** profit margm compared to the prev1ous strategy (UN) Firm's .1034 -.3071 ** -.0438 .0847 .3491 *** market share compared to the previous strategy (PM) Firm's net .1403 .0536 .0059 -.0969 -.2175* profit margin for the last three years (MC) Firm's -.0689 .1866 .0601 -.0819 -.1967* market share for the last three years (PG)

122
From the table above, the reader can observe a number of significant
relationships. Sorne evidence exists to suggest that firms following a general
differentiation strategy tend to obtain: 1) above-average net profit margins for the
industry (p < .01), 2) higher net profit margins compared to their previous strategy
(p < .05), 3) a higher market share compared to their previous strategy (p < .01).
Evidence also exists to suggest that firms following a focus differentiation strategy
(p < .01) or classified as "stuck in the middle" position (p < .05) tend to obtain
below-average the industry' s net profit margins for the industry. "Stuck in the
middle" firms also show unfavorable relationships with: 1) net profit margin
in creases compared to their previous strategy (p < . O 1), 2) market share increases
compared to their previous strategy (p < .01), 3) net profit margin increases over
the last three years (p< .05), and 4) market share increases over the last three-year
period (p < .05).
The following paragraphs report on the results of t-test analysis done to find
additional support for the research hypotheses.
Hypothesis 2a predicts that, compared to the industry's average performance,
firms following a general cost leadership strategy will obtain higher net profit
margins than "stuck in the middle" firms (DF). Sorne evidence (F=2.04, pooled
variance t-value=2.04, p= .027 < .05) exists to support this hypothesis.
Hypothesis 2b suggests that, compared to the firm's net profit margin under the
previous competitive strategy, the current net profit margin will be higher under the
general cost leadership strategy than under the "stuck in the middle" position (UN).
Evidence (F=2.33, pooled variance t-value=2.11, p=.023<.05) exists to support
this hypothesis.

123
H ypothesis 2c postulates that, compared to the firm' s market share under the
previous competitive strategy, the current market share will be higher under the
general cost leadership strategy than under the 11 stuck in the middle 11 position (PM).
Evidence {F=2.57, pooled variance t-value=2.66, p=.007 < .05) exists to support
this hypothesis.
Hypothesis 2d suggests that firms following a general cost leadership strategy
have increased their net profit margin more than 11 stuck in the middle 11 firms over
the last three years (MC). Evidence (F=2.21, pooled variance t-value=2.27,
p=.017< .05) exists to support this hypothesis.
Hypothesis 2e predicts that firms following a general cost leadership strategy
have increased their market share more than 11 stuck in the middle 11 firms over the
last three years (PG). Evidence was not found to support this hypothesis {F= 1.47,
separate variance t-value= 1.16, p= .146 > .05).
Hypothesis 3a postulates that, compared to the industry's average performance,
firms following a general differentiation strategy will obtain higher net profit
margins than II stuck in the middle II firms (D F). Evidence (F = l. 04, separa te
variance t-value=2.28, p=.034<0.5) tends to support this hypothesis.
H ypothesis 3b predicts that, compared to the firm' s net profit margin under the
previous competitive strategy, the current net profit margin will be higher under the
general differentiation strategy than under the 11 stuck in the middle 11 position (UN).
Evidence {F=2.45, pooled variance t-value=3.05, p=.002< .05) exists to support
this hypothesis.
H ypothesis 3c predicts that, compared to the firm' s market share under the
previous competitive strategy, the current market share will be higher under the

124
general differentiation strategy than under the "stuck in the middle" position (PM).
Evidence (F= 1.35, separate variance t-value=2.83, p= .019 < .05) sustains this
hypothesis.
Hypothesis 3d proposes that firms following a general differentiation strategy
have increased their net profit margin more than "stuck in the middle" firms over
the last three years (MC). There exists sorne evidence (F = 1.51, pooled variance t
value= l. 75, p=.044<.05) to support this hypothesis.
Hypothesis 3e proposes that firms following a general differentiation strategy
have increased their market share more than "stuck in the middle" firms over the
last three years (PG). Evidence is found to support this hypothesis (F = 1.51, pooled
variance t-value= 1.96, p= .029 < .05).
Hypothesis 4a predicts that compared to the industry's average performance,
firms following a focus cost leadership strategy obtain higher net profit margins
than "stuck in the middle" firms (DF). There is insufficient evidence to support this
hypothesis (F=2.10, pooled variance t-value= 1.72, p= .058 > .05).
Hypothesis 4b suggests that, compared to the firm' s net profit margin under the
previous competitive strategy, the current net profit margin is higher under the
focus cost leadership strategy than under the "stuck in the middle" position (UN).
Evidence supporting this hypothesis is lacking (F=l.88, pooled variance t
value= 1.68, p=.063 > .05).
Hypothesis 4c proposes that, compared to the firm's market share under the
previous competitive strategy, the current market share is higher under the focus
cost leadership strategy than under the "stuck in the middle" position (PM).

125
Evidence exists to support this hypothesis (F=5.25, pooled variance t-value=2.78,
p=.010< .05).
Hypothesis 4d predicts that firms following a focus.cost leadership strategy have
increased their net profit margin more than "stuck in the middle" firms over the last
three years (MC). Evidence for sustaining this hypothesis is insufficient (F= 1.20,
separate variance t-value= 1.19, p= .134 > .05).
Hypothesis 4e postulates that firms following a focus cost leadership strategy
have increased their market share more than "stuck in the middle" firms over the
last three years (PG). No evidence is found to support this hypothesis (F= 1.40,
separated variance t-value=l.39, p=.101 > .05).
Hypothesis 5a suggests that, compared to the industry's average performance,
firms following a focus differentiation strategy will obtain higher net profit margins
than "stuck in the middle" firms (DF). There is insufficient evidence to sustain this
hypothesis (F=l.10, separate variance t-value=0.19, p=.428>05).
Hypothesis 5b predicts that, compared to the firm's net profit margin under the
previous competitive strategy, the current net profit margin will be higher under the
focus differentiation strategy than under the "stuck in the middle" position (UN).
Evidence is found to support this hypothesis (F=4.07, pooled variance t
value=2.25, p=.021 < .05).
H ypothesis 5c suggests that, compared to the firm' s market share under the
previous competitive strategy, the current market share will be higher under the
focus differentiation strategy than under the "stuck in the middle" position.
Evidence is found to support this hypothesis (F =2.17, pooled variance t-test=2.11,
p= .027 < .05).
126
Hypothesis 5d proposes that firms following a focus differentiation strategy
have increased their net profit margin more than "stuck in the middle" firms over
the last three years (MC). No evidence is found to support this hypothesis
(F= 1.42, separate variance t-value= .98, p= .197 > .05).
Hypothesis Se proposes that firms following a focus differentiation strategy have
increased their market share more than "stuck in the middle" firms over the last
three years (PG). No evidence is found to sustain this hypothesis (F= 1.33, separate
variance t-value= .86, p= .208 > .05).
The discussion presented in this chapter provides support for most of the
proposed hypotheses in the metal mechanic industry. A significant association
appears to exist between generic strategies and financial performance indicators
studied. Firms pursuing a general differentiation strategy appear to obtain
significant favorable results in 3 of the 5 financial performance indicators. Firms
pursuing a focus differentiation strategy appear to perform below the industry's net
profit average, and "stuck in the middle" firms obtained unfavorable results in all
five financia] performance indicators. Also, most t-test analyses provided support
for the research hypotheses. Especially in the cost leadership, and differentiation
categories.
XII.e. The foundry industry.
This section of Chapter XII presents findings for the foundry industry in relation
to financia! performance within each strategy proposed by Porter (1980). Chi
square analysis was done in order to identify significant associations between the
generic strategies and financia! performance indicators. No significant associations
were found. A firm's net profit margin compared to the industry's average (DF)

127
seems to be independent of the strategy selected (chi-square=7.58889, p= .4746); a
firm's current net profit margin, compared to the results under the previous strategy
(UN) appears to be independent of the strategy pursued (chi-square=4. 70992,
p=.8588); a firm's current market share, compared to the results under the
previous strategy (PM) appears to be independent of the firm' s current strategy
( chi-square = 15. 94048, p =. 1940); a firm' s net profit mar gin in creases o ver the last
three years (MC) appears to be independent of the firrn' s current strategy ( chi
square =4.41587, p=.6206); and a firrn's market share increases over the last
three-year period (PG) also appear to be independent of the firm's strategy (chi
square=3.26290, p=.7752). Correlation analysis shows only one significant
relationship (see Table XII.C.1).

128
Table XII.C.1. Porter's categories of strategy correlated with financial fi . d. t . th fi d . d per ormance m 1ca ors m e oun ry m ustry.
Cost Differen tiation Focus Focus Leadership cost differentiation
leadership Firm's net .1845 .2673 -.5231 * profit margin compared to the industry' s (DF)
Firm's net .1419 .1066 -.1289 profi t margin compared to the previous stratej?;y (UN)
Firm's .1038 -.1755 .4091 market share compared to the previous strategv (PM) Firm's net .1095 -.1852 -.1919 profit margin for the last three years (MC)
Firm's -.0336 .0568 -.1963 market share for the last three years (PG) 11
• 11 is printed if a coefficient cannot be computed.
*p< .05.
Stuck in the middle -.0833
-.2494
-.3898
.4330
.2126
In the foundry industry, firms utilizing a focus differentiation strategy obtain
below-average net profit margins for the industry (p< .05). T-test analysis was not
possible because only one firm was classified as 11 stuck in the middle. 11 This implies

129
that the mean and variance of the "stuck in the middle" group lacks statistical
signi ficance.
In conclusion, m the foundry industry financia! performance appears to be
independent of the competitive strategy implemented as no significant associations
were revealed by chi-square analysis. However, correlation analysis indicates that
firms pursuing a focus differentiation strategy perform below the industry's average
in terms of generating a net profit margin.
XII.O. The construction supply industry.
This section discusses the findings for the construction supply industry in terms
of the financia! performance indicators under study. Chi-square analysis was
completed in order to identify any significant associations between strategies and
financia! performance indicators of interest. The findings reveal: strong association
(chi-square=23.29745, p=.0030) between strategies and the variable measuring the
firm' s net profit margin compared to the previous strategy (D F). Other findings
are: a firm' s current net profit margin, compared to the performance under the
previous strategy (UN), appears to be independent of the current strategy (chi
square=2.35 l 78, p=.9683); current market share, compared to market share under
the former strategy (PM) appears to be independent of the present strategy (chi
square=S.30315, p=.9471); a firm's net profit margin over the last three years
(MC) appears to be independent of the strategy pursued (chi-square=8.00301
p = .4332); and a firm' s market share over the last three years (PG) appears to be
independent of the firm's strategy (chi-square= 12.23542, p= .1410).
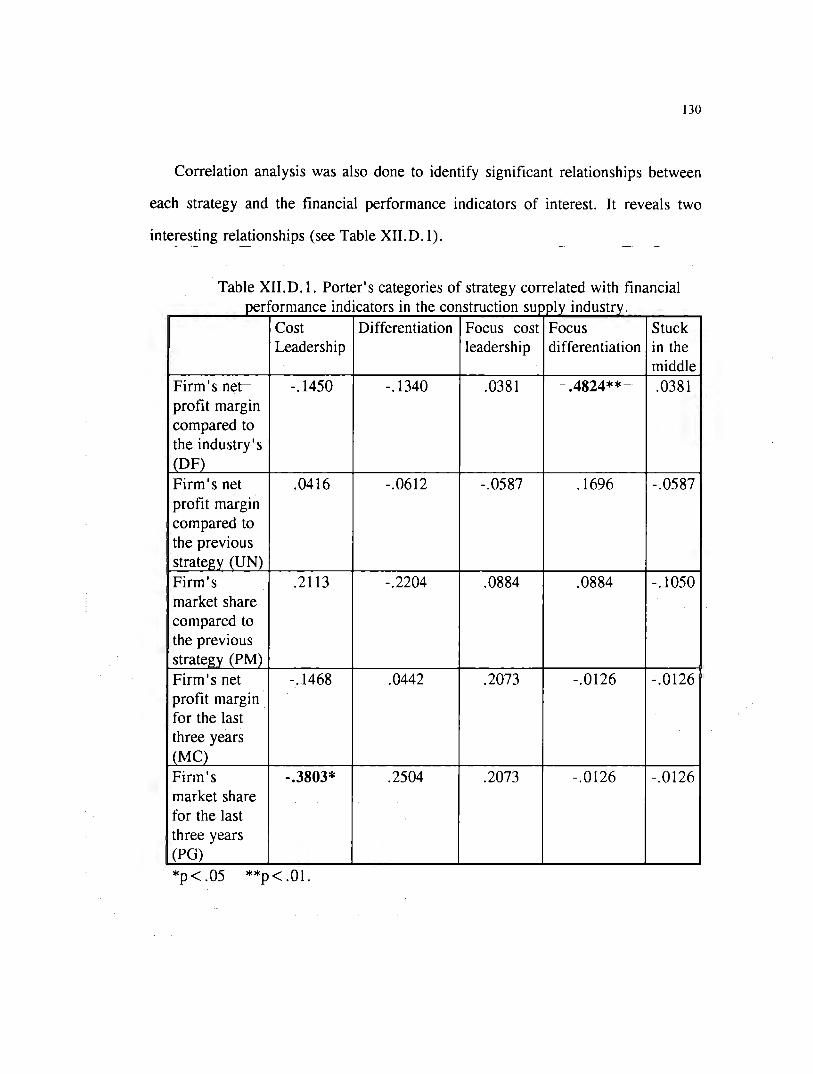
130
Correlation analysis was also done to identify significant relationships between
each strategy and the financia} performance indicators of interest. It reveals two
interesting relationships (see Table XII.D. l).
Table XII.O. l. Porter's categories of strategy correlated with financia} i . d" t . th t t" 1 . d t per ormance m 1ca ors m e cons ruc 10n supp y m us ry.
Cost Differentiation Focus cost Focus Stuck Leadership leadership differentiation in the
middle Firm's net -.1450 -.1340 .0381 .4824** .0381 profit margin compared to the industry' s (DF)
Firm's net .0416 -.0612 -.0587 .1696 -.0587 profit margin compared to the previous strategy (UN) Firm's .2113 -.2204 .0884 .0884 -.1050 market share compared to the previous strategv (PM) Firm's net -.1468 .0442 .2073 -.0126 -.0126 profit margin for the last three years (MC) Firm's -.3803* .2504 .2073 -.0126 -.0126 market share for the last three years (PG)
*p< .05 **p< .01.
131
Firms that compete under a focus differentiation strategy tend to obtain above
average net profit margins for the industry (p=.002< .01). Furthermore firms that
compete on a cost leadership basis appear to have lost market share over the last
three years (p=.012< .05).
In order to find support for the hypotheses, t-test statistics were obtained. The
findings are discussed in the following paragraphs.
Hypothesis 2a proposes that, compared to the industry's average performance,
firms following a general cost leadership strategy will obtain higher net profit
margins than "stuck in the middle" firms (DF). T-test analysis (F= 10.29, pooled
variance t-value=.45, p=.331 > .05) does not support this hypothesis.
H ypothesis 2b predicts that, compared to the firm' s net profit margin under the
previous competitive strategy, the current net profit margin will be higher under the
general cost leadership strategy than under the "stuck in the middle" position (UN).
T-test analysis (F=2.00, pooled variance t-value=.40, p=.348>.05) does not
support this hypothesis.
H ypothesis 2c postulates that, compared to the firm' s market share under the
previous competiti ve strategy, the current market share will be higher under the
general cost leadership strategy than under the "stuck in the middle" position (PM).
T-test analysis (F=2.00, pooled variance t-value= 1.21, p= .128 > .05) does not
support this hypothesis.
Hypothesis 2d predicts that firms following a general cost leadership strategy
have increased their net profit margin more than "stuck in the middle" firms over
the last three years (MC). T-test analysis (F=5.54, pooled variance t-value=. 19,
p=.426> .05) does not support this hypothesis.

132
Hypothesis 2e suggests that firms following a general cost leadership strategy
have increased their market share more than "stuck in the middle" firms over the
last three years (PG). T-test analysis (F=8.00, pooled variance t-value=.64,
p=.269> .05) does not support this hypothesis.
Hypothesis 3a proposes that, compared to the industry's average performance,
firms following a general differentiation strategy will obtain higher net profit
margins than "stuck in the middle" firms (DF). T-test analysis (F=8.35, pooled
variance t-value= .35, p= .364 > .05) does not sustain this hypothesis.
Hypothesis 3b predicts that, compared to the firm' s net profit margin under the
previous competitive strategy, the current net profit margin will be higher under the
general differentiation strategy than under the "stuck in the middle" position (UN).
T-test analysis (F=l.40, separate variance t-value=.19, p=.438>.05) does not
provide support for this hypothesis.
H ypothesis 3c suggests that, compared to the firm' s market share under the
previous competitive strategy, the current market share will be higher under the
general differentiation strategy than under the "stuck in the middle" strategy (PM).
T-test analysis (F= 1.11, separate variance t-value= .28, p= .408 > .05) does not
support this hypothesis.
Hypothesis 3d predicts that firms following a general differentiation strategy
have increased their net profit margin more than "stuck in the middle" firms over
the last three years (MC). T-test analysis (F=7.68, pooled variance t-value= .11,
p = .455 > 05) does not sustain this hypothesis.
Hypothesis 3e postulates that firms following a general differentiation strategy
have increased their market share more than "stuck in the middle" firms over the

133
last three years (PG). T-test analysis {F=8.35, pooled vanance t-value=.35,
p= .364 > .05) does not support this hypothesis.
Hypothesis 4a proposes that, compared to the industry's average firms following
a focus cost leadership strategy will obtain higher net profit margins than "stuck in
the middle" firms (DF). T-test analysis could not be obtained because focus cost
leadership showed no variance surrounding its mean value.
Hypothesis 4b predicts that, compared to the firm 's net profit margin under the
previous competitive strategy, the current net profit margin will be higher under the
focus cost leadership strategy than under the "stuck in the middle" position (UN).
T-test analysis presented showed a value of O since the two groups showed the same
mean and the same variance. This indicates that both focus cost leadership and
"stuck in the middle" groups obtain the same results.
H ypothesis 4c suggests that, compared to the firm' s market share under the
previous competitive strategy, the current market share will be higher under the
focus cost leadership strategy than under the "stuck in the middle" category (PM).
T-test analysis could not be obtained because the focus cost leadership group
showed no variance around its mean value.
Hypothesis 4d predicts that firms following a focus cost leadership strategy have
increased their net profit margin more than "stuck in the middle" firms over the last
three years (MC). T-test analysis {F=4.00, pooled variance t-value=.45,
p =. 349 > . 05) does not support this hypothesis.
Hypothesis 4e postulates that firms following a focus cost leadership strategy
have increased their market share more than "stuck in the middle" firms over the

134
last three years (PG). T-test analysis {F=4.00, pooled variance t-value=.45,
p=.349> .05) does not support this hypothesis.
Hypothesis 5a postulates that, compared to the industry's average performance,
firms following a focus differentiation strategy will obtain higher net profit margins
than "stuck in the middle" firms (DF). T-test analysis could not be obtained because
the group competing under a focus differentiation strategy showed no variance
around its mean value.
Hypothesis 5b predicts that, compared to the firm's net profit margin under the
previous competitive strategy, the current net profit margin will be higher under the
focus differentiation strategy than under the "stuck in the middle" category (UN).
T-test analysis could not be obtained because the focus differentiation group showed
no variance around its mean value.
Hypothesis 5c postulates that, compared to the firm' s market share under the
previous competitive strategy, the current market share will be higher under the
focus differentiation strategy than under the "stuck in the middle" position (PM). T
test analysis could not be obtained because the focus differentiation group showed
no variance around its mean value.
Hypothesis 5d predicts that firms following a focus differentiation strategy have
increased their net profit margin more than "stuck in the middle" firms over the last
three years (MC). T-test analysis could not be obtained because the focus
differentiation group showed no variance around its mean value.
Hypothesis Se suggests that firms following a focus differentiation strategy have
increased their market share more than "stuck in the middle" firms over the last

135
three years (PG). T-test analysis could not be obtained because the focus
differentiation group showed no variance around its mean value.
In conclusion, although only one significant association was found in the chi
square analysis and none of the proposed research hypotheses could be sustained,
two correlations provide relevant information. Firms that compete under a focus
differentiation strategy tend to obtain a net profit margin above the industry's
average, while firms that compete on a cost leadership basis appear to have lost
market share over the last three years (p= .012 < .05).
XII.E. The chemical industry.
This section reports findings in the chemical industry. Chi-square analysis was
performed to identify any significant associations between the competitive strategies
and financial performance indicators studied. The results of the analysis reveal that.
a firm's net profit margin compared to the industry's (DF) appears to be
independent of the firms competitive strategy (chi-square=4.06432,
p=.85130> .05); a firm's net profit margin, compared to the net profit margin
under the previous competitive strategy (UN), appears to be independent of the
firm's competitive strategy (chi-square=S.15951, p=.7725); a firm's market share,
compared to the firm' s market share under the previous strategy (PM) appears to be
independent of the firm's current strategy (15.14543, p=.2336); a firm's net profit
margin changes over the last three years (MC) appear to be independent of the
firm's current strategy (chi-square=2.99845, p=.9345); anda firm's market share
changes over the last three years (PG) appear to be independent of the firm' s
competitive strategy (chi-square=S.41923, p=.3936).

136
Correlation analysis was also performed in order to identify significant
relationships between each strategy and the financia! performance indicators (see
Table XII.E. l).
Table XII.E. l. Porter's categories of strategy correlated with financia! i . dº . h h . al . d oer ormance m 1cators m t e c em1c m ustry.
Cost Differentiation Focus Focus Stuck Leadership cost differentiation in the
leadership middle Firm's net .2020 -.0467 -.1475 -.0401 -.0277 profit margin compared to the industry' s (DF)
Firm's net -.2079 .1428 -.0208 .1082 .0085 profit margin compared to the previous strategv (UN) Firm's -.0264 .0905 -.0638 -.0636 .0387 market share compared to the previous stratee:v (PM) Firm's net .0104 .1104 -.0977 -.0142 -.1019 profit margin for the last three years (MC) Firm's .1249 -.0605 -.1828 .0214 .2172 market share for the last three years (PG)

137
Since neither correlation nor chi-square analysis showed significant associations,
it can be assumed that in the chemical industry, a firin' s financial performance is
independent of the competitive strategy selected. Finally T-test statistics were
obtained with the purpose of testing the research hypotheses.
Hypothesis 2a proposes that, compared to the industry's average performance,
firms following a general cost leadership strategy will obtain higher net profit
margins than "stuck in the middle" firms (DF). T-test analysis could not be
obtained because the "stuck in the middle" group showed no variance around its
mean.
H ypothesis 2b predicts that, compared to the firm' s net profit margin under the
previous competitive strategy, the current net profit margin will be higher under the
general cost leadership strategy than under the "stuck in the middle" position (UN).
T-test analysis (F= 1.59, pooled variance t-value= .43, p= .337 > .05) does not
support this hypothesis.
H ypothesis 2c suggests that, compared to the firm 's market share under the
previous competitive strategy, the current market share will be higher under the
general cost leadership strategy than under the "stuck in the middle" position (PM).
T-test analysis (F= 1.25, separate variance t-value= .30, p= .386 > .05) does not
support this hypothesis .
Hypothesis 2d predicts that firms following a general cost leadership strategy
have increased their net profit margin more than "stuck in the middle" firms over
the last three years (MC). T-test analysis could not be obtained because the "stuck
in the middle" group showed no variance around its mean value.

138
Hypothesis 2e predicts that firms following a general cost leadership strategy
have increased their market share more than "stuck in the middle" firms over the
last three years (PG). T-test analysis could not be obtained because the "stuck in the
middle" group showed no variance around its mean value.
Hypothesis 3a suggests that, compared to the industry's average performance,
firms following a general differentiation strategy will obtain higher net profit
margins than "stuck in the middle" firms (DF). T-test analysis could not calculated
because the "stuck in the middle" group showed no variance around its mean.
Hypothesis 3b predicts that, compared to the firm' s net profit margin under the
previous competitive strategy, the current net profit margin will be higher under the
general differentiation strategy than under the "stuck in the middle" category (UN).
T-test (F= 1.14, separate variance t-value= .19, p= .438) analysis does not provide
support for this hypothesis
Hypothesis 3c postulates that, compared to the firm's market share under the
previous competitive strategy, the current market share will be higher under the
general differentiation strategy than under the "stuck in the middle" category (PM).
T-test (F=l.37, separate variance t-value=.11, p=.457) analysis does not support
this hypothesis .
Hypothesis 3d postulates that firms following a general differentiation strategy
have increased their net profit margin more than "stuck in the middle" firms over
the last three years (MC). T-test analysis could not be obtained because the "stuck
in the middle" group showed no variance around its mean.
Hypothesis 3e predicts that firms following a general differentiation strategy
have increased their market share more than "stuck in the middle" firms over the

139
last three years (PG). T-test analysis could not be obtained because the "stuck in the
middle" group showed no variance around its mean.
Hypothesis 4a predicts that, compared to the industry's average performance,
firms following a focus cost leadership strategy will obtain higher net profit margins
than "stuck in the middle" firms (DF). T-test analysis could not be obtained because
the "stuck in the middle" group showed no variance around its mean.
Hypothesis 4b. suggests that, compared to the firm's net profit margin under the
previous competitive strategy, the current net profit margin will be higher under the
focus cost leadership strategy than under the "stuck in the middle" category (UN).
T-test analysis (F=l.24, separate variance t-value=.12, p=.456>.05) does not
support this hypothesis.
H ypothesis 4c predicts that, compared to the firm' s market share under the
previous competitive strategy, the current market share will be higher under the
focus cost leadership strategy than under the "stuck in the middle" position (PM).
T-test analysis (F=l.81, pooled variance t-value=.29, p=.390> .05) does not
support this hypothesis.
Hypothesis 4d predicts that firms following a focus cost leadership strategy have
increased their net profit margin more than "stuck in the middle" firms over the last
three years (MC). T-test analysis could not be obtained because the "stuck in the
middle" group showed no variance around its mean.
Hypothesis 4e predicts that firms following a focus cost leadership strategy have
increased their market share more than "stuck in the middle" firms over the last
three years (PG). T-test analysis could not obtained because the "stuck in the
middle" group showed no variance around its mean.

140
Hypothesis Sa predicts that, compared to the industry's average performance,
firms following a focus differentiation strategy will obtain higher net profit margins
than "stuck in the middle" firms (DF). T-test analysis could not be obtained because
the "stuck in the middle" group showed no variance around its mean.
H ypothesis Sb suggests that compared to the firm' s net profit margin under the
previous competitive strategy, the current net profit margin will be higher under the
focus differentiation strategy than under the "stuck in the middle" position (UN). T
test analysis (F= 1.83, pooled variance t-value= .32, p= .383) does not support this
hypothesis .
H ypothesis Se suggests that, compared to the firm' s market share under the
previous competitive strategy, the current market share will be higher under the
focus differentiation strategy than under the "stuck in the middle" position (PM). T
test analysis (F=2.00. pooled variance t-value=.S2, p=.317) does not support this
hypothesis.
Hypothesis Sd predicts that firms following a focus differentiation strategy have
increased their net profit margin more than "stuck in the middle" firms over the last
three years (MC). T-test analysis could not be obtained because the "stuck in the
middle" group showed no variance around its mean.
Hypothesis Se proposes that firms following a focus differentiation strategy have
increased their market share more than "stuck in the middle" firms over the last
three years (PG). T-test analysis could not be obtained because the "stuck in the
middle" group showed no variance around its mean value.
In conclusion, none of the statistics calculated--either by chi-square, Pearson' s
correlation, or the t-test--provides support to suggest that the generic competitive

141
strategies of cost leadership, differentiation, focus cost leadership, or focus
differentiation provide better financial results than does the "stuck in the middle"
position within the chemical industry. Only moderate support was found to suggest
that general differentiators obtain better financia} results in terms net profit margin.
This implies that, even though the firms in the sample indicated that their
competitive strategy resembles one of those proposed by Porter, their financial
results does not correlate with these strategies.

XIII. MAIN ORGANIZATIONAL ACTIVITIES UNDER EACH COMPETITIVE STRATEGY.
One of the purposes of this research 1s the identification of significant
relationships between the categories of strategy proposed by Porter ( 1980) and the
main organizational activities of the firm. In other words, it is important to know
whether the categories of strategy can be associated with specific functional
activities within the organization. Expected validity of the strategy type was though
by correlating them with organizational activities. For example, Table XIII. l
(correlation analysis was used for the 184 cases) does not indicate significant
associations between the organizational strategies and the self-reported strategy.
This implies that although the manager indicated that the firm 's strategy resembles
one of the categories proposed in this research, such strategy cannot be associated
with any specific organizational activity. Thus, giving low validity to Porter's
strategy-types.
Table XIII. l. Porter' s categories of strategy correlated with main organizational activities.
Cost Differen tiation Focus Focus Stuck leadership cost di fferentiation in the
leadership middle General .1529* -.0380 -.1023 .0338 -.1005 management (FAG) Financia} -.0044 .0831 -.0802 -.0445 .0042 management (FAF) Marketing .0747 .0194 .0031 -.0521 -.0960 and selling (FMV)
142

143
Table XIII.1. (Continued) Market .1390* -.0684 -.1268* .0382 -.0002 research (FIM) Product .0511 -.1046 .0510 .0255 .0633 research and development (FIDP) Engineering, -.0734 -.1058 .0919 .1993** .0296 basic and applied (FIBA) Production -.0381 -.0921 .0400 .1143 .0887 (FP) Distribution .0117 .0019 -.1219 .0756 .0193 (FD) Legal aff airs .0122 .0214 -.0944 -.0168 .0751 (PAL) Personnel .0842 -.0601 -.0918 -.0061 .0839 (FRH)
*prob < .05 **prob < .010.
H ypothesis 6a proposes that firms pursuing a general cost leadership strategy
will show the following main organizational activities: general management,
financia] management, basic and applied engineering, production, and distribution.
Correlation analysis did not support any of the expected relationships. The only
significant relationship indicates that firms following a general cost leadership
strategy do not emphasize market research.
Hypothesis 6b suggests that firms following a differentiation strategy will show
the following organizational activities: in marketing and sales, market research,
product research and development, and personnel. None of the expected
correlations was significant ata .05 level.
144
Hypothesis 6c proposes that firms following a focus cost leadership strategy will
the show the following organizational activities: general management, financia!
management, basic and applied engineering, production, marketing and sales, and
market research. Only the market research function was statistically significant
(p = . 05), it occurred in the predicted direction.
Hypothesis 6d suggests that firms following a focus differentiation strategy will
show the following organizational activities: marketing and sales, market research,
product research and development, basic and applied engineering, and personnel.
Only the basic and applied engineering function was significant (p=.005 < .01), but
in the opposite direction.
Hypothesis 6e predicts that "stuck in the middle" firms will not show
statistically significant distinctive competencies. In fact none organizational activity
was statistically significant.
In conclusion, no clear relationships were found between strategy and the
organizational functions predicted to be associated with the implemented strategy. A
possible explanation for this is that the firms in the industrial sectors sampled have
not clearly identified their key organizational activities.
XIII.A. The capital goods industry.
Correlation analysis was used to measure the strength and direction between the
categories of strategy and the organizational activities in the capital goods industry
(see Table XIII.A.1).

145
Table XIII.A. l. Porter's categories of strategy correlated with main .. 1 "h ·1 d"d orgamzatlona act1v1t1es m t e cap1ta goo s m ustry.
Cost Diff eren tiation Focus Focus Stuck leadership cost differentiation in the
leadership middle General .3000 -.3000 management (FAG) Financial -.2582 .2582 management (FAF)
Marketing .3000 -.3000 and selling (FMV) Market .4000 -.4000 research (FIM) Product .5477 -.5477 research and development (FIDP) Engineering, -. 7303* .7303* basic and applied (FIBA) Production -.5477 .5477 (FP) Distribution -.2582 .2582 (FD) Legal affairs -.6364 .6364 (FAL) Personnel -.1414 .1414 (FRH)
*prob. < .05
Only hypotheses 6a and 6b could be tested because all firms in the capital good
industry were classified either in the general cost leadership or general
differentiation categories.

146
Hypothesis 6a proposes that firms pursuing a general cost leadership strategy
will show the following main organizational activities: general management,
financia! management, basic and applied engineering, production, and distribution.
Firms competing under this strategy do not appear to emphasize on basic and
applied engineering (p=.031 < .05). Other expected relationships and associations
were not significant ata .05 level.
Hypothesis 6b suggests that firms following a differentiation strategy will show
the following main organizational activities: marketing and sales, market research,
product research and development, and personnel. None of the expected
relationships showed significant associations. Differentiator firms appear to
emphasize basic and applied engineering, presumably to differentiate their product.
XIII.B. The metal mechanic industry.
Correlation analysis was used to measure the strength and direction between the
categories of strategy and the main organizational activities performed in the firm
(see Table XIII.B. l).
Table XIII.B.1. Porter's categories of strategy correlated with main organizational . h 1 h .. d act1v1t1es m t e meta mee ame m ustry.
Cost Differentiation Focus Focus Stuck leadership cost differentiation in the
leadership middle General .1127 .1209 -.1756 .0228 -management .2110* (FAG) Financia! -.0200 .1649 -.1086 -.0597 -.0406 management (FAF)

147
Table XIII.B.1 (Continued) Marketing and .1435 .0700 -.1016 -.1408 -.0172 selling (FMV) Market research .1154 .0346 -.2567* .0025 .0424 (FIM) Product research .0275 -.0680 -.0832 .1050 .1079 and development (FIDP) Engineering, -.0487 -.0920 -.0248 .2489* .0129 basic and applied (FIBA) Production (FP) .0605 .1384 .1384 .0345 -.0836 Distribution (FD) .0082 .0415 -.1402 .0774 -.0551 Legal aff airs .353 -.0763 -.0645 .1104 .0000 (FAL) Personnel (FRH) .0043 -.1120 .0557 .0129 .1217
*prob < .05
H ypothesis 6a proposes that firms pursuing a general cost leadership strategy
will show the following main organizational activities: general management,
financia! management, basic and applied engineering, production, and distribution.
Correlation analysis did not support any of the expected relationships.
Hypothesis 6b suggests that firms following a differentiation strategy will show
the following organizational activities: in marketing and sales, market research,
product research and development, and personnel. None of the expected
correlations was significant ata .05 level.
Hypothesis 6c proposes that firms following a focus cost leadership strategy will
the show the following organizational activities: general management, financia!
management, basic and applied engineering, production, marketing and sales, and
market research. Only the market research function was statistically significant
(p=.014< .05), it occurred in the predicted direction.

148
Hypothesis 6d suggests that firms following a focus differentiation strategy will
show the following organizational activities: marketing and sales, market research,
product research and development, basic and applied engineering, and personnel.
Only the basic and applied engineering function was significant (p= .017 < .05), but
in the opposite direction. This means that firms in the metal mechanic industry tend
not to emphasize basic and applied engineering.
Hypothesis 6e predicts that "stuck in the middle" firms will not show
statistically significant distinctive competencies. Firms in this situation appear to
emphasize general management (p= .037 < .05), an unexpected outcome
In conclusion, no clear relationships were found between strategy and the
organizational functions predicted to be associated with the implemented strategy. A
possible explanation for this is that firms in the metal mechanic industry have not
clearly identified their key organizational activities.
XIII.C. The foundry industry.
Correlation analysis was used to measure the strength and direction between the
categories of strategy and the main organizational under study (see Table XIII.C. l).
Table XIII.C.1. Porter's categories of strategy correlated with main . f 1 f 'f . th ~ d . d t organiza tona ac 1v1 1es m e oun rv m us rv.
Cost Differentiation Focus Focus Stuck in leadership cost differentiation the
leadership middle General .1491 -.4667 .4880 management (FAG) Financia! -.4472 .0667 .4880 management (FAF)

149
Table XIII.C.1. (Continued) Marketing and .0925 .2067 -.4237 sales (FMV) Market .2774 .1240 -.5447 research (FIM) Product .6667* .2981 -.4364 research and development (FIDP) Engineering, -.5185 .6956* -.3394 basic and applied (FIBA) Production -.2182 -.4880 1.00*** (FP) Distribution -.1037 -.4174 .7467 (FD) Legal affairs -.8704** .5449 .3419 (FAL) Personnel .2182 -.2928 .1429 (FRH)
*prob. < .05 **prob < .01 ***prob < .001
Hypothesis 6a proposes that firms pursuing a general cost leadership strategy
will show the following organizational activities: general management, financia}
management, basic and applied engineering, production, and distribution. None of
the expected associations was significant at a .05 level. However, two unexpected
relationships were significant. Firms competing under the cost leadership strategy
appear not to emphasize basic and applied engineering (p =. 035 < . 05) but to focus
on legal issues (p=.002< .02). These two relationships appear not to have obvious
explanations.
Hypothesis 6b suggests that firms following a differentiation strategy will show
the following organizational activities: marketing and sales, market research,
product research and development, and personnel. None of the expected

150
associations was significant at a .05 level. Only one significant association
(p.028 < .05) indicates that firms in the foundry industry competing under the
general differentiation strategy appear not to emphasize basic and applied
engineering.
H ypothesis 6c proposes that firms following a focus cost leadership strategy will
show the following organizational activities: general management, financia!
management, basic and applied engineering, production, marketing and sales, and
market research. No firm in the foundry industry was classified in strategy.
Hypothesis 6d suggests that firms following a focus differentiation strategy will
show the following organizational activities: marketing and sales, market research,
product research and development, basic and applied engineering, and personnel.
Since no firms were classified in this category of strategy, no conclusions can be
derived.
Hypothesis 6e predicts that "stuck in the middle" firms will not show
statistically significant organizational activities. Two significant associations were
found. "Stuck in the middle" businesses appear not to emphasize production
(p= .000 < .001) or distribution functions (p= .017 < .05). This finding indicates
that "stuck in the middle" firms are unable to control two basic organizational
functions.
In conclusion, most of the hypothesized relationships were not sustained by
correlation analysis. This means that no clear patterns characterize the competitive
strategies with key organizational activities.

151
XIII.O. The construction supply industry.
Correlation analysis was used to measure the strength and direction between the
categories of strategy and the main organizational activities under study (see Table
XIII.D. l). Table XIII.D.1. Porter's categories of strategy correlated with main
. . 1 . h . 1 . d orgamzatlona act1v1t1es m t e construct10n supp y m ustry. Cost Differentiation Focus Focus Stuck leadership cost diff eren tiation in the
leadership middle General .0967 -.2688 .3274* .1286 -.0702 management (FAG) Financial -.0858 .3429* -.1876 -.1876 -.1876 management (FAF) Marketing -.1077 -.0750 .3055* .1200 -.0655 and sales (FMV) Market .1171 -.1734 .1996 -.2528 .1996 research (FIM) Product -.0173 -.0614 .0540 -.1296 .2376 research and development (FIDP) Engineering, .0380 -.1518 .0831 .2847 -.1186 basic and applied (FIBA) Production .0161 -.1783 -.1204 .3913* .1354 (FP) Distribution .3571 * -.3444* -.0458 .1488 -.0458 (FD) Legal affairs .2392 -.0425 .1794 -.5383*** .0000 (FAL) Personnel .2034 -.0856 -.0669 -.0669 -.0669 (FRH) *prob. < .05 **prob. < .01 ***prob < .001

152
Hypothesis 6a proposes that firms pursuing a general cost leadership strategy
will show the following organizational activities: general management, financia!
management, basic and applied engineering, production, and distribution. Only one
of the expected relationships was significant at a .05 level, but in the opposite
direction. This means that firms in the construction supply industry competing
under the cost leadership strategy tend not to emphasize distribution as an
organizational activity.
Hypothesis 6b suggests that firms following a differentiation strategy will show
the following organizational activities: marketing and sales, market research,
product research and development, and personnel. None of the expected
associations was statistically significant. One unexpected significant association
(p.024 < .05) suggests that firms in the construction supply industry tend not to
emphasize the financia! function.
Hypothesis 6c proposes that firms following a focus cost leadership strategy will
show the following organizational activities: general management, financial
management, basic and applied engineering, production, marketing and sales, and
market research. Only two expected associations were significant, but in the
opposite direction. Businesses in the construction supply industry competing under
the focus cost leadership strategy tend not emphasize general management activities
(.029 < .05) or on marketing and sales activities (p= .039 < .05).
Hypothesis 6d suggests that firms following a focus differentiation strategy will
show distinctive competence in marketing and sales, market research, product
research and development, basic and applied engineering, and personnel. None of
the expected associations was statistically significan t. However, two relationships

153
were significant. Firms competing under the focus differentiation strategy appear
not to emphasize the production function (p= .011 < .05) yet they do appear to
emphasize the personnel activity (p=.001).
Hypothesis 6e predicts that "stuck in the middle" firms will not statistically
significant organizational activities. In fact, none of the organizational activities was
significant for the "stuck in the middle" position. This finding is consistent with the
research hypothesis.
The above conclusions leads the researcher to suggest that, in the construction
supply industry businesses have a general framework of reference or a competitive
strategy but top managers do not show a pattern of organizational activities that
clearly distinguish one competitive strategy from another.
XIII.E. The chemical industry.
Correlation analysis was used to measure the strength and direction between the
categories of strategy and the main organizational activities of the firm (see Table
XIII.E.1).
Table XIII.E. l. Porter's categories of strategy correlated with main . f 1 f "f . th h . 1 . d t organiza 10na ac 1v1 1es m e e em1ca m us rv.
Cost Differentiation Focus Focus Stuck leadership cost differentiation in the
leadership middle General .3038 -.0908 -.2036 -.0031 -.1026 management (FAG) Financia! .2339 -.2771 * .0264 -.0034 .1069 management (FAF) Marketing .0715 .0353 -.0260 -.0059 -.1944 and sales (FMV)

154
Table XIII.E.1 (Continued) Market .1949 -.2449* -.0598 .2532* -.0861 research (FIM) Product -.0215 -.1550 .2255 .0148 .0103 research and development (FIDP) Basic and -.2056 -.1836 .2247 .1898 .2570* applied engmeenng (FIBA) Production -.2080 .0313 .0059 .1060 .2374 (FP) Distribution -.1344 .2746* -.1709 -.0321 -.0222 (FD) Legal affairs .0334 -.203 -.2222 .1172 .2038 (FAL) Personnel .3369 -.2244 -.1904 .0095 .1090 (FRH)
*prob. < .05
Hypothesis 6a proposes that firms pursuing a general cost leadership strategy
will show the following organizational activities: general management, financial
management, basic and applied engineering, production, and distribution. Only one
of the expected associations was significant, but in the opposite direction. It shows
that firms in this industry appear seem not emphasize general management
(p =. O 19 < . 05). Additionall y, one unexpected association was found: firms appear
not to emphasize personnel functions (p =. O 10 < . 05).
Hypothesis 6b suggests that firms following a differentiation strategy will show
distinctive competence in marketing and sales, market research, product research
and development, and personnel. Only one expected association was significant. It
occurred in the hypothesized direction and indicates that firms in the chemical

155
industry competing under the general differentiation strategy emphasizes market
research activities (p=.049< .05). They also appear to focus on financia!
management (p=.030< .05), yet do not appear to emphasize distribution
(p= .031 < .05).
Hypothesis 6c proposes that firms following a focus cost leadership strategy will
show the following organizational activities: general management, financia!
management, basic and applied engineering, production, marketing and sales, and
market research. None of the expected associations was significant ata .05 level.
Hypothesis 6d suggests that firms following a focus differentiation strategy will
show the following organizational activities: marketing and sales, market research,
product research and development, basic and applied engineering, and personnel.
Only one expected association was significant, but in the opposite direction. Firms
in this industry appear not to emphasize market research.
Hypothesis 6e. predicts that "stuck in the middle" firms will not show
statistically significant organizational activities. One organizational activity was
significant: firms in the chemical industry appear not to emphasize basic and
applied engineering (p =. 041 < . 05).
In conclusion, no strong pattern which significantly associates organizational
activities with strategies was identified in the chemical industry.

XIV. GENERAL MANAGER'S STRATEGY IMPLEMENTATION UNDER PORTER'S TYPOLOGY.
One of the major questions of this research addresses the issue of whether being
a business owner or a professional general manager influences strategy
implementation.
For the purpose of this research, it is important to know whether in the
industries studied the person responsible for a strategy made a difference in the
strategy implemented. In the table below, the reader can observe how the database
breaks down into categories of persons responsible for strategy implementation.
T bl XIV 1 S a e .. trategv v1s-a-v1s person respons1 e or 1ts 1mp ementatlon. 'bl ~ 1
Business owner Prof essional manager Managerial Team
General cost 34 12 3 leadership General 60 24 2 differentiation Focus cost 11 5 o leadership Focus 17 2 o diff eren tiation "Stuck in the 8 2 o middle" None of the 1 o o above
* 3 cases are missing from the 184-firm sample.
As Table XIV.1 shows in 130 of 181 (71 %) firms in the sample, the business
owner is also the person responsible for the implementation of the company' s
competitive strategy. It is important to note that three firms reported that the
decision regarding the firm' s competitive strategy is made jointl y by the
156

157
professional manager and the business owner, i.e., by a managerial team. This
category was not considered when designing the questionnaire initially; however, it
was later included as an additional category.
Chi-square analysis was used to determine whether a significant association
exists between the variables of interest. A value of 6.54425 (p= .5865 > .05) was
obtained which means that strategy and the person responsible for its
implementation are independent of each other. In addition, t-test analysis was
obtained. Neither hypothesis 7a, which anticipated that a professional manager
would implement a differentiation strategy and the business owner would implement
a general cost leadership strategy (F = l. 05, pooled variance t-val ue =. 30, p > . 05)
or hypothesis 7b, which suggested that a professional manager would implement a
focus differentiation strategy while the business owner would implement a focus
cost strategy (F =2.31, pooled variance t-value= 1.53, p > .05), could be sustained .
XIV .A. The capital goods industry.
This section addresses proposition 7 for the capital goods industry. The table
below shows how strategies are broken down by person responsible for their
implementation.
Table XIV. A. l. Strategy vis-a-vis person responsible for its . I . 'h ·1 d'd 1mp ementation m t e cap1ta goo s m ustry.
Business owner Professional general manager General cost 5 o leadership General 3 3 differentiation

158
As the reader can observe, in most (8 of 11) the business owner is responsible
for the implementation of the competitive strategy. Since crosstabulation of the
variables of interest resulted in a two-by-two matrix, Fisher's exact test was used.
Based on the value obtained for the Fisher statistic (p= .12121 > .05) there appears
to be no association between competitive strategy and person responsible for its
implementation. T-test analysis could not be obtained because no professional
general manager indicated that he was implementing a general cost strategy, and no
firm in this industry indicated following a focus strategy.
XIV .B. The metal mechanic industry.
For the purpose of this research, it is important to know whether in the metal
mechanic industry the person responsible for a strategy made a difference in the
strategy implemented. In the table below, the reader can observe how the data
break down into categories of person responsible for strategy implementation.
Table XIV .B.1. Strategy vis-a-vis person responsible for its implementation in the me tal h''dt mee ame m us ry.
Business owner Professional manager Managerial Team
General cost 14 2 2 leadership General 26 6 1 differentiation Focus cost 5 2 o leadership Focus 11 o o differentiation "Stuck in the 5 o o middle" None of the 1 o o above

159
As Table XIV. B. 1 shows in 62 of the 75 firms in the sample the business owner
is also the person responsible for the implementation of the company's competitive
strategy. It is important to note that one firm reported that the decision regarding
the firm' s competitive strategy of the firm is made jointly by the professional
manager and the business owner, i.e., by a managerial team. This category was not
considered when designing the questionnaire initially; however, it was later
included as an additional category.
Chi-square analysis was used to determine whether a significant association
exists between the variables of interest. A value of 8.28422 (p.6011 > .05) was
obtained which means that strategy and the person responsible for its
implementation are independent of each other. T-test analysis does not support
hypothesis 7a (F=l.35, pooled variance t-value=.54, p> .05). T-tests could not be
obtained for hypothesis 7b because no professional general manager indicated that
he was following a focus differentiation strategy.
XIV.e. The foundry industry.
It is interesting to note that in the foundry industry all firms sampled reported
that the person responsible for the firm' s strategy was the business owner (see Table
XIV.C. l).
Table XIV .C.1. Strategy vis-a-vis person responsible for its . 1 . "ht d 'd 1mp ementat10n m t e oun ry m ustry.
Business owner General cost leadership 3 General differentiation 7 Focus differentiation 2 Stuck in the middle 1

160
The fact that only one category of person responsible for strategy was present in
the foundry industry leads the researcher to the suggestion that, in this industry, the
responsibility for business strategy belongs to the business owner and that most
firms pursue a general differentiation competitive strategy. The reader should
remember that data were collected from 14 of the 19 (7 4 % ) firms registered in the
foundry industry, thus providing a relatively high level of generality. T-test analysis
could not be used because no firm indicated that a professional general manager
was responsible for the business strategy.
XIV .D. The construction supply industry.
The hypothesis that the position of the person responsible for a firm 's strategy
influences strategy implementation was also tested for the construction supply
industry (see Table XIV. D .1).
Table XIV .D. l. Strategy vis-a-vis person responsible for its implementation in h . 1 . d t e construction suppLy m ustry.
Business owner Professional manager Managerial team
General cost 2 6 1 leadership General 12 7 1 differentiation Focus cost 1 1 o leadership Focus 2 o o differentiation "Stuck in the 1 1 o middle"
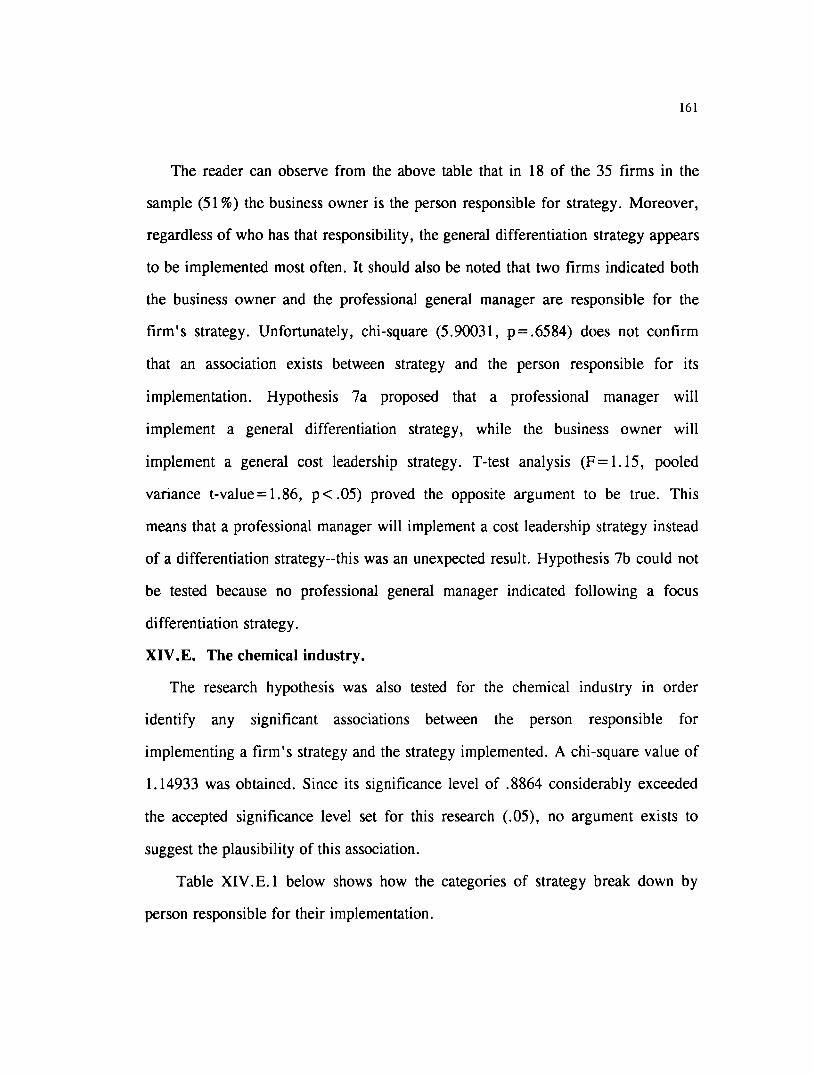
161
The reader can observe from the above table that in 18 of the 35 firms in the
sample (51 % ) the business owner is the person responsible for strategy. Moreover,
regardless of who has that responsibility, the general differentiation strategy appears
to be implemented most often. It should also be noted that two firms indicated both
the business owner and the professional general manager are responsible for the
firm's strategy. Unfortunately, chi-square (5.90031, p=.6584) does not confirm
that an association exists between strategy and the person responsible for its
implementation. Hypothesis 7a proposed that a professional manager will
implement a general differentiation strategy, while the business owner will
implement a general cost leadership strategy. T-test analysis (F= 1.15, pooled
variance t-value=l.86, p< .05) proved the opposite argument to be true. This
means that a professional manager will implement a cost leadership strategy instead
of a differentiation strategy--this was an unexpected result. Hypothesis 7b could not
be tested because no professional general manager indicated following a focus
differentiation strategy.
XIV.E. The chemical industry.
The research hypothesis was also tested for the chemical industry in order
identify any significant associations between the person responsible for
implementing a firm 's strategy and the strategy implemented. A chi-square value of
1.14933 was obtained. Since its significance level of .8864 considerably exceeded
the accepted significance level set for this research (.05), no argument exists to
suggest the plausibility of this association.
Table XIV.E.1 below shows how the categories of strategy break down by
person responsible for their implementation.
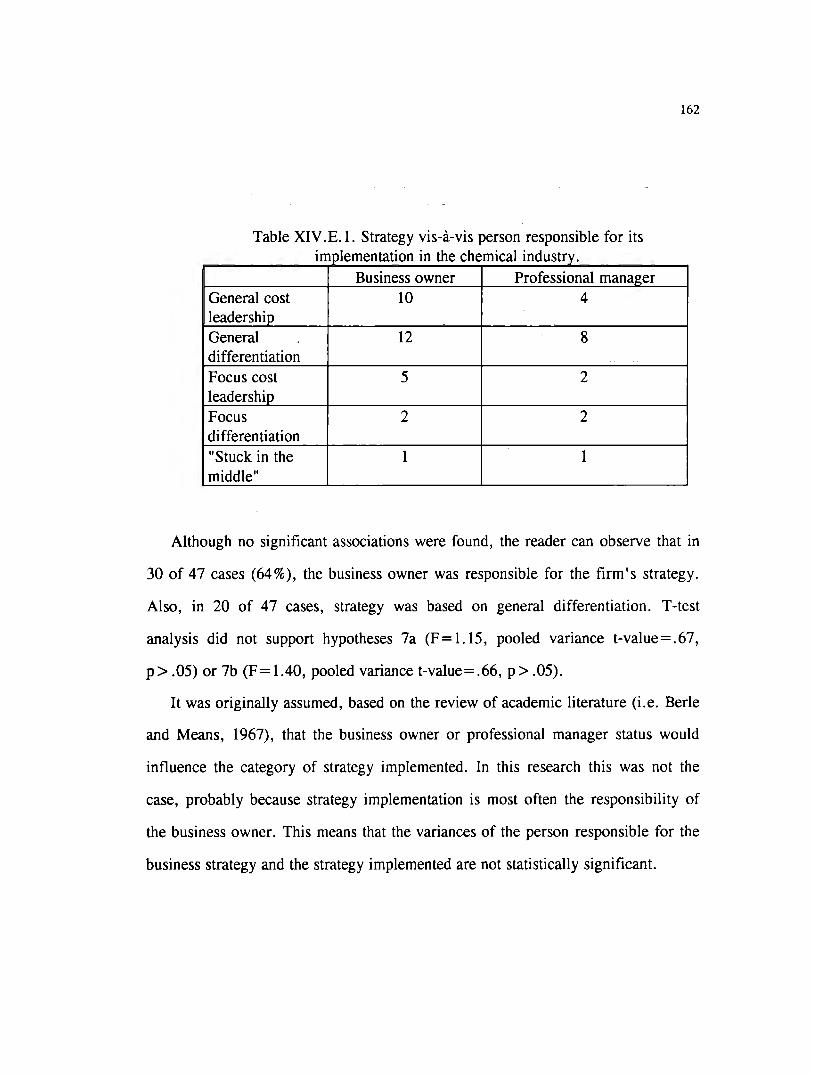
162
Table XIV .E.1. Strategy vis-a-vis person responsible for its . 1 .. h h ·a1·d 1mp ementation m t e c em1c m ustrv.
Business owner Prof essional manager General cost 10 4 leadership General 12 8 differentiation Focus cost 5 2 leadership Focus 2 2 differentiation "Stuck in the 1 1 middle"
Although no significant associations were found, the reader can observe that in
30 of 4 7 cases ( 64 % ) , the business owner was responsible for the firm' s strategy.
Also, in 20 of 47 cases, strategy was based on general differentiation. T-test
analysis did not support hypotheses 7a (F=l.15, pooled variance t-value=.67,
p > .05) or 7b (F = 1.40, pooled variance t-value= .66, p > .05).
It was originally assumed, based on the review of academic literature (i.e. Berle
and Means, 1967), that the business owner or professional manager status would
influence the category of strategy implemented. In this research this was not the
case, probably because strategy implementation is most often the responsibility of
the business owner. This means that the variances of the person responsible for the
business strategy and the strategy implemented are not statistically significant.

XV. GENERAL MANAGER'S EDUCATIONAL LEVEL UNDER PORTER'S TYPOLOGY.
This chapter addresses the question of whether the degree of formal education of
the person responsible for the firm' s competitive strategy influences strategy
implementation. This question will be answer through the following hypotheses.
Hypothesis 8a suggests that: highly educated decision-makers, having at least a
bachelor' s degree, will implement a general differentiation strategy, while less
educated decision makers, with at most a high school diploma, will implement a
general cost strategy.
Hypothesis 8b proposes that highly educated (having at least a bachelor's
degree) decision-makers will implement a focus differentiation strategy, while less
educated (having at most a high school diploma) decision-makers will implement a
focus cost strategy.
In order to provide a clearer idea of how the data broke down into categories
of formal education, Table XV.1 shows a crosstabulation of competitive strategies
by level of formal education using the whole database.
Table XV .1. Strategy by educational level of the person responsible for its . 1 f 1mp. ementa 10n.
Cost Differentiation Focus cost Focus Stuck None leadership leadership differentiation in the
middle Doctoral degree 1 1 o o o o Unfinished o o o o o o !doctoral degree Master' s degree 7 20 5 2 1 o Unfinished 5 3 2 o 1 o master' s degree
163
164
Table XV .1 (Continued) Bachelor' s de~ree 30 48 8 13 5 1 Unfinished 4 9 o o 2 o oachelor' s degree High school 3 3 1 1 o Unfinished high o o o o o school Tunior high or o 2 o 3 1 ~lementary school [No formal o o o o 1 o leducation
As can be observed, 86 of the 183 (47%) firms in the sample follow a general
differentiation strategy and 105 of the 183 (57 % ) top decision-makers have one
bachelor' s degree. In the following table, educational level was grouped by the
categories of low and high levels of formal education.
Table XV.2. Strategy by grouped educational level of the person "bl t l . respons1 e or 1ts 1mp ementatlon.
High level of formal Low level of formal education education
General cost leadership 43 7 General differentiation 73 13 Focus cost leadership 15 1 Focus differentiation 15 4 "Stuck in the middle" 7 3 None of the above 1 1
As the reader can observe, both categories of managers--those with high and
low levels of education--implemented a general differentiation strategy most
frequently. Even though a chi-square value of 3.19833 and a significance level of

165
.5252, far above the standard of .05, do not support the suggestion that level of
education and strategy implement are associated, is interesting to note that most
firms compete under the general differentiation category regardless of decision
maker' s education. T-test analysis leads to the rejection of hypothesis 8a (F= 1.36,
pooled variance t-value= .09, p > .05). T-tests supported the argument opposed to
that stated in hypothesis 8b, that is, support was found to suggest that less educated
decision-makers will implement a focus differentiation strategy instead of a focus
cost strategy. This finding was unexpected and potential explanations would be on
the line of industry knowledge or managerial expertise, instead of level of formal
education.
XV.A. The capital goods industry.
In the capital goods industry, every person responsible for the business strategy
reported having at least a bachelor' s degree (see Table XV. A .1).
Table XV .A.1. Strategy by educational level of the person responsible i·· 1 . "h ·1 d'd or 1ts 1mp ementat10n m t e cap1ta goo s m ustry.
Hi~h level of education General cost leadership 5 General differentiation 6
Chi-square analysis or other statistics were not appropriate because all
individuals responsible for the firms' strategies were classified in the highl y
educated category. However, this in itself is revealing. Every top manager in the
sample--23 % of the population--has at least one college degree. Moreover, even
though in this case the association was not significant, the general differentiation

166
strategy was implemented in 6 of 11 cases (55 % ) which is consistent with the entire
sample, regardless of industry sector.
XV .B. The metal mechanic industry.
The hypothesis suggesting that a difference exists in strategy depending on the
level of formal education of the person responsible for its implementation, was also
tested in the metal mechanic industry. The findings are reported in the table below.
Table XV .B.1. Strategy by educational level of the person responsible fi . . I . . h I h . . d or 1ts 1mp ementation m t e meta mee ame m ustry.
High level of formal Low level of formal education education
General cost leadership 14 5 General differentiation 25 8 Focus cost leadership 6 1 Focus differentiation 8 3 "Stuck in the middle" 2 3 None of the above 1 o
As the reader can observe, both categories of managers--those with high and
low levels of education--implemented a general differentiation strategy most
frequently. E ven though a chi-square value of 3. 88366 and a significance level of
.5663, far above the standard of .05, lead to the rejection of the hypothesis, is
interesting to note that most firms compete under the general differentiation
category regardless of decision-maker's education. T-test analysis did not support
hypothesis 8a (F=2.14, pooled variance t-value=.65, p> .95) and hypothesis 8b
{F=4.22, pooled variance t-value=.77, p> .05).
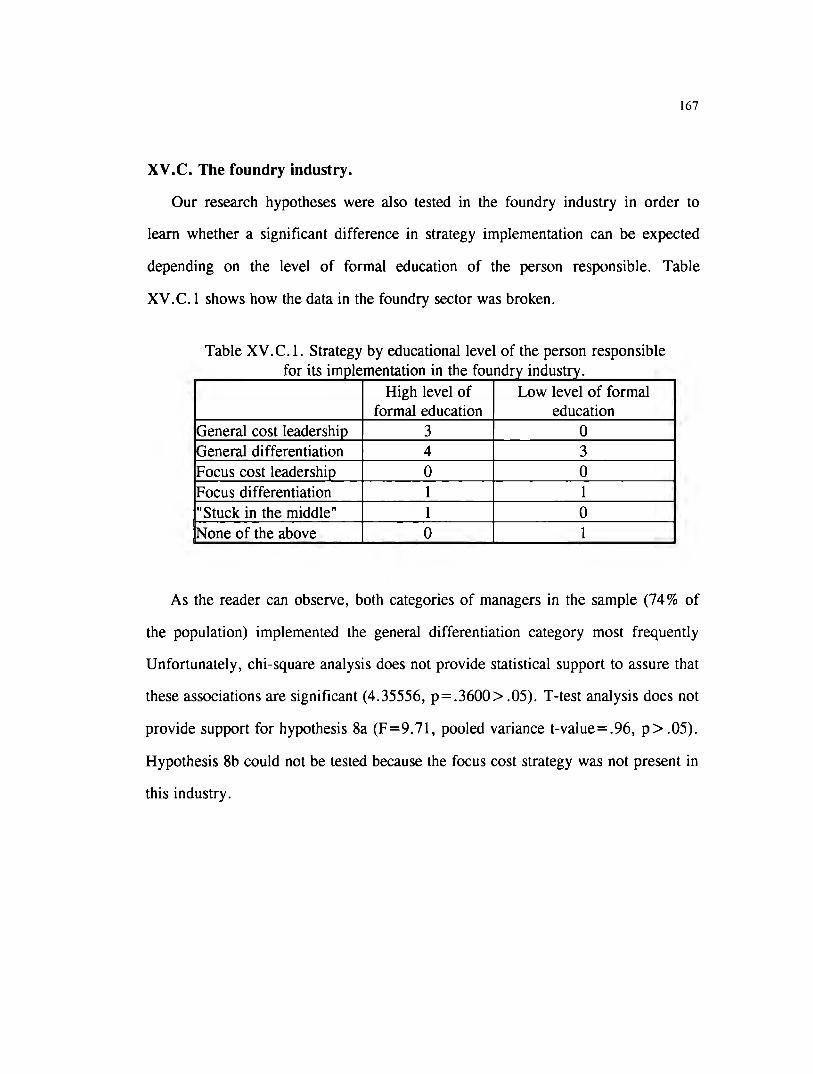
167
XV.C. The foundry industry.
Our research hypotheses were also testecl in the foundry industry in order to
learn whether a significant difference in strategy implementation can be expectecl
depending on the level of formal eclucation of the person responsible. Table
XV.C. l shows how the data in the foundry sector was broken.
Table XV .C. l. Strategy by eclucational level of the person responsible fi . . 1 . . h fi d . d or 1ts 1mp ementatlon m t e oun ry m ustry.
High level of Low level of formal formal eclucation eclucation
General cost leadership 3 o General differentiation 4 3 Focus cost leadership o o Focus differentiation 1 1 "Stuck in the middle" 1 o ~one of the above o 1
As the reader can observe, both categories of managers in the sample (74% of
the population) implemented the general differentiation category most frequently
Unfortunately, chi-square analysis does not provide statistical support to assure that
these associations are significant (4.35556, p=.3600> .05). T-test analysis does not
provide support for hypothesis 8a (F=9.71, poolecl variance t-value=.96, p> .05).
Hypothesis 8b could not be testecl because the focus cost strategy was not present in
this industry.

168
XV .D. The construction supply industry.
The hypotheses suggesting that a difference m competitive strategy exists
depending on the general manager' s level of formal education were tested m the
construction supply industry. Table XV.D.1 shows how the data broke down.
Table XV. D. 1. Strategy by educational level of the person responsible t . t . 1 taf . th t f 1 . d t or 1 s 1mp emen 10n m e cons ruc 10n supp1y m us ry.
Hil!:h level of formal education General cost leadership 9 General differentiation 20 Focus cost leadership 2 Focus differentiation 2 "Stuck in the middle" 2
As the reader can observe, the category "low level of formal education" is not
present in this industry, indicating that every top decision-maker has at least one
college degree. lt should also be noted that the most highly educated managers
correspond to the "general differentiation" category. Since the crosstabulation of
educational level by competitive strategies categories resulted in a 1-by-5 matrix,
chi-square and t-test analyses could not be obtained. However, the high frequency
of the "general differentiation category" is consistent with that found when
strategies were crosstabulated with the education variable for sectors combined.
XV .E. The chemical industry.
The hypotheses that predicted a difference strategy depending on the level of
formal education of the person responsible for its implementation was tested using

169
chi-square and t-test analysis. Table XV .E.1 shows a crosstabulation of the
strategies by level of formal education.
Table XV. E.1. Strategy by educational level of the person responsible fi . . 1 . . h h . l . d or 1ts 1mp ementatlon m t e e em1ca m ustry.
High level of formal Low level of formal education education
General cost leadership 12 2 General differentiation 18 2 Focus cost leadership 7 o Focus differentiation 4 o "Stuck in the middle" 2 o
Chi-square analysis does not indicate significant associations between the
categories of strategy and formal education (l.86595, p=.7604> .05), meaning that
educational level does not influence strategy implementation. T-tests do not support
hypothesis 8a (F=l.84, pooled variance t-value=.12, p>.05) or 8b (F=l.05,
pooled variance t-value= 1.51, p> .05).
Based on sorne studies (i.e. Gupta and Govindarajan, 1984; Miller and
Toulouse, 1986; and Resenos, 1980) that report associations between certain
managerial characteristics and the business strategy, it was anticipated in this
research that the level of formal education of the top decision-maker would be
associated with the strategy implemented. However, statistical analyses do not
support this rationale. This is probably dueto the fact that not much variance exists
in the level of formal education. In other words, variance exists in the category of
strategy implemented but not in the level of formal education categories.

XVI. CONCLUSIONS AND IMPLICATIONS.
Research was conducted in order to advance our knowledge in the field of
business-leve! strategy in five sectors of the manufacturing industry of the San Luis
Potosí metropolitan area. The capital goods, metal mechanic, foundry, construction
supply, and chemical industries were selected because they account for roughly
56% of the m~nufacturing industry gross production within the state of San Luis
Potosí. Furthermore, the state exhibits strong competitive advantages for the
consolidation of a well-developed manufacturing industry (ITESM-SLP-CEE-1993).
Thus, an in-depth understanding of the business strategies followed by the top
decision-makers was particularly appealing.
Two well-accepted typologies of strategy--those of Miles and Snow (1978) and
Porter ( 1980)--were selected to provide the conceptual framework for investigating
the relationship between a firm' s strategy and its financia! performance, main
organizational activities, and the characteristics of the general manager (degree of
formal education and status as business owner or professional manager). The
literature review chapter provided the foundations from which the research was
designed, and hypotheses were developed in order to operationalize the proposed
conceptual model.
A questionnaire was personally administered to the general managers of 184
businesses overa five-week period; data was processed using the Statistical Package
for the Social Sciences (SPSS), and findings have been reported throughout these
chapters. The following sections also report findings and discuss the implications of
those considered most significant.
170

171
XVI.A. Conclusions and implications of general flndings.
An important initial result indicates that 75 % of the sampled firms are either
micro or small-sized. One implication of this has to do with the concept of
economies of scale. This theory indicates that if fixed costs can be divided by a
larger number of units produced, total unitary cost will be reduced, thus giving the
product an additional competitive advantage. Also, it is interesting to note that the
sectors studied contribute 56% to the GNP of the manufacturing industry of San
Luis Potosí. This provides a good characterization of the manufacturing setting of
metropolitan San Luis Potosí.
Another interesting finding relates to the educational level of the top decision
maker. Most top managers (57%) hold one bachelor's degree and 26% have at least
a master' s degree. This is encouraging because it reveals that industrial San Luis
Potosí is managed by educated executives and implies that potential exists--at least
in terms of level of formal education--to improve the competitive position of the
firms.
In industrial San Luis Potosí, the business owner is responsible for its strategy
(71 % of the cases), which can be explained in terms of agency cost theory. This
theory proposes that the principal-agent relationship incurs sorne costs: monitoring
costs, bonding costs, and deadweight losses associated with any relationship
between agents and principals. The key point here is that, given the average size of
the businesses in San Luis Potosí, there is no reason to engage an agent to manage a
firm. This implies that, as long as most firms are small, the strategic apex will by
formed by the business owner and members of his or her family.

172
In relation to financia} performance, most managers sampled indicated that their
firms obtain average or constant results, and when this is not the case, more firms
indicated that their financia! performance has improved compared to those claiming
theirs has worsened. This finding increases in importance when related to strategies.
For example, it was found that prospectors or general differentiators obtain better
results (in terms of net profit margin and market share) than do other categories of
strategy.
The frequency with which organizational activities appeared also shed sorne
light on our effort to understand firms in industrial San Luis Potosí. Activities such
as marketing and sales, production, distribution, and general and financia}
management were strongly emphasized. These activities, however, appear to be
more oriented towards the day-to-day operation of the business. Other activities
such as market research, product research and development, basic and applied
engineering, and human resources received average emphasis, these activities
appear to be more strategic-oriented. This has important implications for both the
academic and practitioner audiences. Activities such as market research were found
to be related to prospector or general differentiator strategies, which happen to
provide better financia! results. Even though establishing causality was not the
purpose, sorne indication of relationship was found in this research.
XVI.B. Conclusions and implications of Miles and Snow's typology.
Evidence was found to suggest that Miles and Snow' s typology of strategic
orientation is a useful framework for categorizing the strategies followed by
businesses in the sectors studied. Onl y three firms ( l. 63 % ) from the sample
reported to have strategies different from those proposed by Miles and Snow. All
173
but one sector--the construction supply industry--reported having at least one firm
within each category of strategic orientation. This provided support for the
hypothesis that predicted all strategic orientations would be present in each
industrial sector. In the construction supply industry, the reactor position failed to
be present. It is important to note that 60 of the 184 firms (33 % ) pursue a defender
orientation and 55 (30%) follow a prospector strategic orientation.
When the entire database was analyzed, severa! associations were found to
suggest that prospector firms have obtained better net profit margins compared to
the industry's average. Also, prospectors have increased their market share
compared to the results from the previous strategy, and they have increased their
market share over the last three-year period. In contrast, defenders have decreased
their net profit margins compared to the industry's average, and they have
decreased their market share compared to the results from the previous strategy and
over the last three-year period. Defenders, analyzers, and prospectors outperform
reactors in all financia! indicators: net profit margin compared to the industry's
average, net profit margin and market participation over the last three years, and
net profit margin and market share compared to the results obtained under the
previous strategy. These findings have the following important managerial
implication: managers will be better off should they follow prospector strategies as
opposed to defender strategies.
In relation to the emphasis placed on the mam organizational activities,
prospectors emphasize marketing and sales, market research, product research and
development, and basic and applied engineering, while defenders do not emphasize
any of those organizational activities. Interestingly, prospectors emphasize certain
174
activities that allow them to be first in the industry, and they are obtaining better
financia! results than other categories. This implies that managers now rely on
organizational activities that support a prospector orientation.
No significant relationships were found between the influence of ownership or
professional management status (business owner or professional manager) or level
of formal education and the strategy implemented. However, we have learned that
most top managers are highly educated individuals, and the size of most businesses
(micro or small-sized) does not justify bearing the agency costs discussed in
previous chapters.
We have also learned that in the capital goods industry, firms pursumg a
prospector orientation have increased their net profit margin over the last three
years, while reactor firms have decreased their net profit margin and lost market
share over the same period. Although few significant associations were found, sorne
support exists for the argument that prospector firms obtain better financia} results
than reactors.
Similar to the capital goods industry, the metal mechanic industry showed
favorable financia} performance under the prospector strategy. Prospector firms
reported having obtained higher net profit margins than the industry' s average, and
compared to their previous strategic orientation, prospectors also reported having
improved both their net profit margin and market participation. Prospectors' market
share over the last three years has also increased. Defenders have decreased their
market share, and reactors have obtained unfavorable results in their net profit
margin. These findings lead the researcher to argue that prospector firms tend to
obtain favorable financia! results in the metal mechanic industry.
175
In the foundry industry, both prospector and defenders showed significant
associations with the variable measuring the firm' s net profit margin compared to
the industry's. Interestingly prospectors appear to obtain above-average net profit
margin for the industry, while defenders perform below average.
As previously mentioned, the reactor position was not present m the
construction supply industry. However, sorne significant associations were found
for the strategies which were present. Prospectors have increased their market
participation when compared to their previous strategy and to market changes over
the last three years. Defender firms have not only experienced the opposite effect,
they have also decreased their net profit margin over the same period. Analyzer
firms have obtained favorable results in net profit margins compared to their
previous strategy, and in net profit margins and market participation over the last
three years.
In the chemical industry, prospector firms have also obtained above-average net
profit margins, and reactor firms have lost market participation over the last three
years. Although few significant associations were found in the chemical sector, it
should be noted that a prospector orientation provides better financia] results than
does a reactor position.
In conclusion, in relation to Miles and Snow's (1978) categories of strategy and
financia! performance, this research has found that the prospector and anal yzer
orientations tend to render favorable results as measured by market share and net
profit margin. Significant associations were found which suggests that defender and
reactors tend to obtain unfavorable financia! results. These findings have important
implications for both managers and scientists. For the former, they now have a

176
substantiated argument for pursuing more proactive strategies (such as prospector or
anal yzer). Por the latter, the conceptual framework relating Miles and Snow' s
( 1978) typologies of strategic orientations to certain financia! performance
indicators proposed in this research has proved to be a useful paradigm for the
study of business-leve! strategies and financia! performance.
The relationship between each strategy and certain organizational activities was
also investigated in order to learn whether, in the industries studied, a strategy
could be characterized by one or more organizational activities.
In the capital goods industry, no significant associations were found to suggest
that a clear pattern exists between strategy and organizational activities selected.
Prospector firms competing in the metal mechanic industry tend to emphasize
market research, product research and development, and marketing and sales. This
finding is encouraging because these activities appear to be in accordance with an
orientation that can be labeled as proactive, thus implying market orientation. The
analyzer and defender categories in the metal mechanic sector did not show
significant associations. However, an interesting comparison can be made between
prospectors and reactors: prospectors appear to emphasize product research and
development, while reactors do not.
In the foundry industry, prospector firms tend to emphasize basic and applied
engineering and legal affairs. Interestingly, defenders tend not to emphasize those
activities. Clearly identifiable organizational activities were not ascertained in the
foundry industry; only the prospector category showed a significant association.
In the construction supply industry, prospector firms appear to emphasize
product research and development, market research, and basic and applied
177
engmeenng. This is in contrast to defenders who do not emphasize basic and
applied engineering or market research.
Similar to the foundry industry, prospectors in the chemical sector tend to
emphasize basic and applied engineering, while analyzers do not. Defender firms
tend to emphasize legal affairs and personnel. In the chemical sector, it was found
that reactors do not control the fundamental activities of a business, i.e., they do
not emphasize general management, market research or personnel.
In conclusion, although only a few of the expected groupings of the
organizational activities under the different categories of strategic orientation held
up, prospector firms in the five sectors studied appear to have more clearly defined
organizational activities than those with other strategic orientations. It was found,
for example, that while prospectors emphasize a specific activity, other categories
tended not to emphasize it. This means that prospectors more clearly define their
main organizational activities than firms with other strategic orientations. Also,
these organizational activities tend to fall into two complementary areas: market
research and engineering. This is not surprising if we take into account that, with
the first organizational activity, the firm scans the potential market which, in turn,
influences the manufacturing activity. Managerial implications of these findings are:
1) managers should be encouraged to clarify the main organizational activities of
their firms, 2) managers should place special emphasis on market research, product
research and development, and marketing and sales (note again that market and
engineering-related activities are emphasized), and 3) managers should be
encouraged to pursue prospector-type (more aggressive) strategies which appear to
provide better financia! results and are more clearly associated with strategic-

178
oriented organizational activities, such as market research and product research and
development.
The person responsible for a firm' s strategy--the business owner or professional
manager--was also studied. It was found that in ali five sectors, the business owner
is the person responsible. This indicates that, in industrial San Luis Potosí, most
businesses are family-owned. Although we know that the business owner is
responsible for the firm' s strategy, a significant association between owner and a
specific strategic orientation was not found. This means that the owner of the
business may implement any of the proposed strategies or take a reactor position.
Finall y, it is worth noting that in sorne firms, the responsibility for strategy
implementation is not left to the business owner or professional manager; strategic
decisions are made by a II managerial team II composed of both the owner and
professional manager.
The last variable studied in this research was the level of formal education of
the person responsible for deciding strategy. It was important to learn whether the
educational level of this individual was significantly associated with the strategy
implemented. In the five sectors considered, most top decision makers were
classified as 11 highly educated. 11 This is dueto the fact that 11 bachelor's degree 11 --the
academic degree held by most decision makers--was considered a high level of
formal education for the purpose of this research. Nonetheless, no significant
associations were found between top decision maker' s level of formal education and
a firm 's strategic orientation.

179
XVI.C. Conclusions and implications of Porter's typology.
Porter' s typology of competitive strategies appears to be applicable in the
industrial sectors studied throughout this research. Only two firms from a sample of
184 (1 % ) did not identify with Porter' s typology. This means that Porter' s generic
strategies can serve as a general framework for the study of business strategy in San
Luis Potosí.
It is important to note also that 50 of 184 firms (27 % ) pursue a cost leadership
strategy and 86 ( 4 7 % ) pursue a general differentiation strategy. In the capital goods
industry, only two categories of strategy--general cost leadership and general
differentiation--are present. The reader should note that these categories are broad
in scope, meaning that firms in the capital goods sector tend to serve a wide market
base through two different approaches. In the metal mechanic industry, ali five
categories are present, including the "stuck-in-the-middle" position. Only one firm
in this sector could not be classified into any of Porter' s strategies. In the foundry
industry, focus cost leadership was not present, and one firm reported not following
any of Porter' s generic strategies. In the construction suppl y industry, all of
Porter' s categories are present. Finally, in the chemical sector all of Porter' s
categories are presentas well, including "stuck-in-the-middle." Since we now know
that Porter' s competitive strategies are useful as a framework for the study of
business-leve) strategies, it is important to relate the competitive strategies to the
financial performance indicators, main organizational activities, top decision
makers' educational level and status as business owner or professional manager.
The following paragraphs discuss the corresponding conclusions and implications.

180
The entire database was analyzed in order to capture the "broad picture" before
examining the details of each industry. It was found that firms pursuing a general
differentiation strategy have increased their market share compared to the results
obtained under the previous strategy. This is in sharp contrast with firms following
a focus differentiation strategy, which have decreased theirs. "Stuck-in-the-middle"
firms have reduced their net profit margin and their market participation compared
to their previous strategy. These findings have important managerial implications:
1) managers should be encouraged to follow strategies that differentiate their
product from the products of their competitors and try to capture a broad market
base, instead of a narrow market segment, and 2) a lack of strategic definition is by
no means recommendable.
Unfortunately, no clear relationships were found between Porter's strategies and
the main organizational activities. A possible explanation may be that sampled firms
have been able to characterize their competitive strategy, but have not been able to
operationalize their strategy in organizational tasks. At this point, managers are
encouraged to think about the key organizational activities that better match the
chosen strategy.
In relation to the influence of business owner or professional manager status on
the strategy implemented, it was found that most times (72 % ) the business owner is
the person having the responsibility for the firm' s strategy. This issue has its
explanation in the agency-cost theory. Most firms in industrial San Luis Potosí are
either micro or small-sized, thus there is no reason that justifies having to pay those
costs and engage in a principal-agent relationship.

181
It was also found that the general differentiation strategy is usually chosen
(47% of the time). This should be of interest to managers as it was found that the
general differentiation strategy appears to render better financia! results (as
discussed above). However, no clear organizational strategies were identified that
support this strategy. Finally, it was found that regardless of the level of formal
education, the general differentiation strategy was most often chosen.
In the capital goods industry, no clear patterns can be identified. Only moderate
support (the observed significance was slightly above the accepted significance
leve!) exists to suggest that firms following a general differentiation strategy have
increased their net profit margin compared to their previous strategy, while firms
competing under a general cost leadership strategy have tended to decrease theirs.
In the metal mechanic industry, firms pursuing a general differentiation
strategy appear to obtain better financia! results than those following a focus
differentiation strategy or classified as 11 stuck in the middle. 11 Further analyses in
the metal mechanic industry reveal that, as expected, a general cost leadership
strategy provides better financia! results than does the 11 stuck-in-the-middle11
position. Firms pursuing a general differentiation strategy also appear to obtain
better financia! results than those firms which are II stuck in the middle. 11 In four of
the five financia! indicators, evidence was not found to suggest that firms competing
under a focus cost leadership strategy perform better than 11 stuck-in-the-middle 11
firms and in three of the five financia! indicators, evidence was not found to suggest
that the focus cost leadership strategy provided better results than did the 11 stuck-in
the-middle 11 position. This seems to imply that the general competitive strategies
provide more desirable results than do the focused competitive strategies.

182
In the foundry industry, only one significant association was determined. lt
appears that firms competing under a focus differentiation strategy perform below
the industry's average. This result is similar to the one found in the metal mechanic
industry.
Interestingly, m the construction supply industry, firms following a focus
differentiation strategy have obtained better net profit margins compared to the
industry's average, and firms competing under a cost leadership strategy have lost
market share over the last three years. This may imply that the firms in this
industry obtain better results if they select a market niche (e.g., housing for high
income families) than if they choose to compete on a cost basis covering a wide
range of customers.
In the chemical industry, financial performance appears to be independent from
the strategy selected.
In conclusion, in the sectors studied a differentiation strategy appears to provide
more desirable results than do others. In the construction supply industry, it is clear
that a focus differentiation strategy provides better financia} results than a cost
leadership strategy. From the discussion above, arguments can be made to suggest
that a differentiated or outwards-oriented strategy provides better results than a
conservative or inwards-oriented competitive position.
The relationship between competitive strategy and a firm' s organizational
activities was also investigated, and implications of the major findings are discussed
here. In the capital goods industry, no clear relationships between the general cost
leadership strategy anda firm's organizational activities were identified. We know,
however, that firms competing under this strategy tend not to emphasize basic and

183
applied engineering. This finding becomes relevant when compared to the only
significant relationship under the differentiation strategy. General differentiator
firms tend to emphasize basic and applied engineering, as opposed to general cost
leadership firms, which do not. This may imply that general differentiator firms
pursue this strategy dueto their own engineering activities.
In the metal mechanic industry, no clear association between the severa!
organizational activities and a firrn's strategy appears to exist. We only know that
firms competing under a focus cost leadership strategy tend to emphasize market
research activities, an expected result which implies that these firrns sean and search
for market ni ches through research.
Similar to the metal rnechanic industry, in the foundry, construction supply and
chemical industries, there are no identifiable organizational activities that clearly
characterize a competitive strategy.
In conclusion, the reader can observe the lack of a consistent pattern of
organizational activities in the sectors studied. This may imply that the
corresponding firms have not been able to identify the fundamental organizational
activities that support the strategy implemented. In other words, firms in San Luis
Potosí may have been able to identify their generic competitive strategy, but they
may not have been able to identify the critica! organizational activities which
characterize it.
The relationship between the person responsible for a firm' s strategy and the
strategy itself was also investigated. It was found that in most cases the person
responsible is the business owner. As discussed in the section on Miles and Snow,
the fact that the owner is responsible for the firrn 's strategy offers a good idea as to

184
organization within the manufacturing industry in San Luis Potosí. In other words,
firms tend to consist of small to medium-sized, family-owned businesses in which
decisions are usually made by the senior family member. In most cases, general
differentiation was the strategy implemented. This was also true in the cases where
a professional general manager was responsible for strategy. This finding implies
that, whoever the individual responsible for strategy, there is a tendency to select
general differentiation.
The last variable investigated was the possible association between the top
manager's level of formal education and the strategy implemented. Most top
managers hold a bachelor' s degree and tend to implement a general differentiation
strategy. However, managers who were classified as having a low level of formal
education (a high school diploma at most) also tend to implement a general
differentiation strategy. This finding implies that, regardless of top manager' s
educational level, a tendency exists to pursue a general differentiation strategy.
XVI.O. Final comments on conclusions and implications.
This research has shed sorne light on our effort to advance knowledge in the
field of competitive strategy. Managers and academicians now have two typologies
of business-leve! strategies that promise positive outcomes. For the former, Miles
and Snow's and Porter's typologies can serve as a scheme or frame of reference for
strategic planning. For the latter, these two typologies have proved useful for
conducting research.
These typologies can be associated with financia! performance results. It appears
that prospectar or differentiator strategies render better financia! outcomes. At this

185
point, managers are encouraged to question their firm' s current strategy and see if a
better match between strategy and financia! results can be found.
This research has also determined that certain organizational activities are
associated with a firm 's strategy. For example, prospectors emphasize market
research or product research and development. This should encourage managers to
think about the organizational activities they are emphasizing and whether these
activities match the most appropriate strategy.
Finally, this study should encourage academicians to conduct additional research
in the field of business strategy in order to assist managers in industrial San Luis
Potosí in making better decisions for their firms. Answers to important questions
have been found here. Yet at the same time, this research opens new questions
deserving answers. Sorne of these questions will be discussed in the following
chapter.

XVII. LIMITATIONS OF THE STUDY AND SPECULATIONS FOR FUTURE RESEARCH.
XVII.A. Limitations of the study.
It must be acknowledged that the present study has certain limitations.
Perfection is the goal towards which many of us strive, yet it is an impossible goal
to reach. However, if we focus our efforts on that goal, chances are that we will
come closer to attaining it than if we do not.
One limitation of this study is that the researcher used the self-typing method to
characterize an organization' s strategy. Snow and Hambrick ( 1980) found two
advantages in this method: 1) the top manager's perceptions and opinions largely
determine the organization' s strategy (at least its intended strategy), and 2)
relatively large databases can be generated for hypothesis testing. However, Snow
and Hambrick also recognize that this method has severa! shortcomings, one of
them is that many managers believe that their organization is unique, and therefore
they resist attempts to classify it.
Snow and Hambrick also report that Hambrick (1979) found executives
generally report their organizations' intended strategies, as opposed to emergent or
realized strategies. In instances when no intended strategy exists, an executive may
create one for the benefit of the researcher.
Additional limitations of this research come from the fact that the researcher
asked managers to assess strategy, thus externa! or objective confirmation of their
answers is not possible. Also, managers were asked to compare the present financia!
performance of the firm with that obtained under past business strategy. However,
no information was obtained about the past strategy of the firm. This makes it
186

187
impossible to know whether the past strategy influenced somehow the current
business strategy.
Even though the questionnaire provided descriptions of the categories of
strategy and not the name of the strategy, sorne managers indicated that one
typology resembled that proposed by Porter. To an extent, this fact could have
biased their answers. This probably explains why only a few significant results were
obtained with this typology.
In the capital goods industry, a low percentage of responses was obtained
(23 % ) . This issue limits the externa! validity of the findings.
Even though this research has shed sorne light about business strategy in
manufacturing San Luis Potosí, the validity and generalizability of these results
should be taken with caution and in the context of an exploratory research because,
on average, measures of associations such as chi-square and correlation coefficients
have low correlation coefficients.
Finally, it should be noted that the firm's strategy and financia! performance,
main organizational activities, and categories of ownership and education were
linked primarily through correlation analysis and cannot be interpreted as causally
related. However, these relationships have provided an initial step for the study of
strategy in the manufacturing sector of San Luis Potosí.
XVII.B. Speculations for future research.
As expressed in the introductory chapters of this report, research in the area of
business strategy in San Luis Potosí is, at most, scarce. Thus, this study has
contributed to the much-needed knowledge among practitioners and academicians

188
on how strategic frameworks relate to financia) performance and other variables of
interest in that city. It is true that businessmen are aware of typologies of strategy;
Porter' s generic strategies seem to be especial! y familiar to top managers. However,
no previous study had been done in the manufacturing setting of San Luis Potosí
that empirically applies two typologies of generic strategy.
The research reported here is an initial step that may serve as a foundation for
additional studies in the area of business strategy. Suggestions for future research
that may contribute to advancing our knowledge and assists decision makers in the
implementation of business strategies are presented here.
1. This study can be replicated in other sectors of the manufacturing industry in
San Luis Potosí, such as the textile, food processing and furniture industries
since these three sectors are of major importance to the state's economy.
2. This study can also be replicated in other manufacturing settings of México. A
study recently finished at ITESM-SLP (ITESM, 1993) compared San Luis
Potosí' s industrial development to that of two other states: Aguascalientes and
Nuevo León. In that study, it was reported that only fifteen years ago San Luis
Potosí had a much healthier economy than Aguascalientes; however, the
opposite is true toda y. Obviously, a number of factors--political issues, resource
availability, cultural issues, education, etc. --may explain this difference. One
factor, however, may be the strategies implemented by the top decision makers.
It would be of interest to undertake the same type of research in the state of
Aguascalientes in order to find similarities and differences. Because the state of
Nuevo León is one of México's most industrialized, other states can learn from
its business sector. If this study were replicated in Nuevo Leon' s manufacturing

189
sector, San Luis Potosí's business professionals could learn what strategies the
top managers there are implementing.
3. This stud y can include additional variables related to the categories of strategy.
For example, a researcher could investigate whether the existence of an
entrepreneurial background of the top decision maker is associated with
strategy.
4. The research reported here has related the strategy of the firm to its financia!
performance. However, a number of other variables can contribute to explaining
the variance in firm 's financia! performance and the strategy implemented.
Future studies can include additional variables, such as those related to
managerial characteristics (i.e., locus of control or need for achievement) and
business-specific factors, such as technology employed and business size.
5. Since correlation analysis was used to measure the degree association between
variables, nothing can be concluded about causality, However, regression
analysis can be used to identify which variables contribute to explaining the
variance in the firm' s financia! performance, one of these variables can be the
category of business strategy implemented. By doing this, the researcher would
be in an stronger position to suggest which variables contribute to better
explaining the firm' s financia! performance.
As the reader can observe, the areas of study that this research opens is wide
ranging and can assist practitioners in improving their firms' performance.
BIBLIOGRAPHY.
Ansoff, H. Igor assisted by Edward J. McDonnell. New Corporate Strategy. New
York: John Wiley and Sons, 1988.
Barney, Jay B. and Ouchi, William G. Organizational Economics. San Francisco:
Jossey-Bass Inc., 1986.
Berle, A.A. and Means Gardiner, C. The Modern Corporation and Private
Property. New York: Harcourt, Brace and World, Inc., 1967 (revised edition).
Buzzell, R.D., Gale, B.T., and Sultan, R.G.M. 11 Market share: A key to
profitability, 11 Harvard Business Review, Jan-Feb (1975), pp. 97-106.
CANACINTRA (Cámara Nacional de la Industria de la Transformación)
Delegación San Luis Potosí. Directorio Industrial /991-1992
Conant, J.S., Mokwa, M.P. and Varadarajan, P.R. 11 Strategic types, distinctive
marketing competencies and organizational performance: A multiple measures
based study, 11 Strategic Management Journal, Vol. 11 (1990), pp.365-383.
Chaganti, R. and Sambharya, Rakesh. 11 Strategic Orientation and Characteristics of
Upper Management, " Strategic Management Journal, Vol. 8 (1987), pp. 393-401.
Chandler, A.D. Jr. Strategy and Structure. Garden City, N.Y: Doubleday, 1962.
Dov, D., Segev, E. and Shenhar, A. "Technology' s varying impact on the success
of stratregic business units within the Miles and Snow typology, 11 Strategic
Management Journal, Vol. 14 (1993), pp. 155-162.
Dess, G.G. and Davis, P.S. 11 Porter's (1980) generic strategies as determinants of
strategic group membership and organizational performance, 11 Academy of
Management Journal, Vol. 27, No.3 (1984), pp. 467-488.
190

191
Dess, G.G. and Robinson, R.B. Jr. "Measuring organizational performance in the
absence of objective measures: The case of the privately-held firm and
conglomerate business unit," Strategic Management Journal, Vol. 5 (1984), pp.
265-273.
Galbraith, C. and Schendel, D. "An empirical analysis of strategy types," Strategic
Management Journal, Vol. 4 (1983), pp. 173-173.
Golden, B.R. "SBU strategy and performance: The moderating effects of the
corporate-SBU relationship," Strategic Management Journal, Vol. 13 (1992), pp.
145-158.
Gupta, Anil K. and Govindarajan, V. "Business unit strategy, managerial
characteristics, and business unit effectiveness at strategy implementation,"
Academy of Management Journal, Vol. 27, No. 1 (1984), pp. 25-41.
Hambrick, D.C. "Operationalizing the concept of business-leve! strategy m
research." Academy of Management Review, Vol.5 (1980), pp. 567-576.
Hambrick, D.C. "Sorne tests of the effectiveness and functional attributes of Miles
and Snow's strategic types," Academy of Management Journal, Vol. 26, No.1
(1983), pp. 5-26.
Harvard Business School. "Note on financia! contracting: deals", No.9-288-014,
Rev. 6/89.
Hofer, C. W. and Schendel, D. E. Strategy formulation: Analytical concepts, St
Paul: West Publishing, 1978.
Instituto Nacional de Estadística, Geografía e Informática (INEGI, S.L.P.
Estructura Económica) 1986.

192
Instituto Nacional de Estadística, Geografía e Informática (INEGI, Censo General
de Población) 1990.
Instituto Tecnológico y de Estudios Superiores de Monterrey, campus San Luis
Potosí, Centro de Estudios Estratégicos. Los Sectores Claves de la Economía de
San Luis Potosi. Unpublished study, 1992.
Instituto Tecnológico y de Estudios Superiores de Monterrey, campus San Luis
Potosí, Centro de Estudios Estratégicos. San Luis Potosi: Diseño de Oportunidades
para el nuevo siglo. Unpublished study, 1993.
Jensen, Michael C. and Meckling, William H. "Theory of the Firm: Managerial
behavior, agency costs, and ownership structure," Journal of Financia! Economics,
Vol. 3, No. 4 (1976) pp. 305-360. Also in Barney and Ouchi (1986) pp. 214-275.
Keeley, Robert H. and Roure, Juan B. "Management, strategy, and industry
structure as influences on the success of new firms: A structural model,"
Management Science, Vol. 36 (1990), No. 10, pp. 1256-1267.
Miles, R. and Snow, C. Organizational Strategy, Structure, and Process. New
York: McGraw-Hill, 1978.
Miles. R. and Snow, C. "The role of strategy in the development of a general
theory of organizations", Advances in Strategic Management, Vol. 2 (1983), pp.
231-259
Miles, R., Snow, C., Meyer, A.D. and Coleman, H.J. Jr. "Organizational
strategy, structure and process", Academy of Management Review, Vol. 3 (1978),
pp. 546-562.
Miller, Danny. "Relating Porter's business strategies to environments and structure:
Analysis and performance implications," Academy of Management Journal, Vol.
31, No. 2 (1978) pp. 280-308.

193
Miller, Danny. and Toulouse, Jean-Marie. "Chief executive personality and
corporate strategy and structure in small firms," Management Science, Vol. 32,
No.11 (1986) pp. 1389-1409.
Mintzberg, H. "Patterns in strategy formation," Management Science, Vol. 34, No.
9 (1978), pp. 934-948.
Ochoa Setzer, G. A. Administración Financiera l. México: Alhambra, 1993.
Porter, M.E. Competitive Srrategy. New York: The Free Press, 1980.
Resenos Díaz, E. "Observaciones acerca de la conducta de los administradores en lo
relativo a los estilos de liderazgo, satisfacción en el trabajo y productividad",
Instituto Politécnico Nacional, Escuela Superior de Comercio y Administración,
Sección de Graduados, Centro de Investigación en Ciencias Administrativas (1980).
Ciudad de México.
Rumelt, R. P. "How much does industry matter?" Srraregic Management Journal,
Vol.12 (1991), pp.167-185.
Segev, Eli. "A systematic comparative analysis and synthesis of two business-level
strategic typologies, "Srraregic Management Journal, Vol. 10 (1989), pp. 487-505.
Secretaria de Comercio y Fomento Industrial (SECOFI). Delegación San Luis
Potosí.
Shortell, S.M. and Zajac, E.J. "Perceptual and archiva} measures of Miles and
Snow' s strategic types: A comprehensive assessment of reliability and validity,"
Academy of Management Journal, Vol. 33, No.4 (1990), pp. 917-832.
Smith, K,G. Guthrie, J.P. and Chen, M. "Miles and Snow's typology of strategy,
organizational size and organizational performance," Academy of Management Best
Papers Proceedings, (1986), pp. 45-49.

194
Snow, e.e. and Hambrick, D.e. 11 Measuring organizational strategies: Sorne
theoretical and methodological problems 11, Academy of Management Review, Vol.
5, No. 4 (1980), pp 527-538.
Snow, e.e. and Hrebiniak, L.G. 11 Strategy, distinctive competence, and
organizational performance, 11 Administrative Science Quarterly, Vol. 25 (1980), pp.
317- 336.
Utterback, J.M. and Abernathy. W.J. 11 A dynamic model of process and product
innovation, 11 OMEGA, Vol. 3 (1975), pp. 639-656.
Venkatraman, N. and Ramanujam, V. 11 Measurement of Business econom1c
performance: An examination of method convergence, 11 Journal of Management,
Vol. 13 (1987), No.1, pp. 109-122.
Vesper, K. 11 Strategic mapping--a tool for corporate planners, 11 Long-Range
Planning, December (1979), pp. 75-92.
White, R. E. 11 Generic Business strategies, organizational context and performance:
An empirical investigation, 11 Strategic Management Journal, Vol. 7 (1986), pp.217-
231.
Wissema, J.G., Van del Pol, H.W. and Messer, H.M. 11 Strategic Management
Archetypes," Strategic Management Journal, Vol. 1 (1980), pp. 37-47.

APPENDICES
195
196
APPENDIX A.- SURVEY QUESTIONNAIRE
MONTERREY TECH
SAN LUIS POTOSI CAMPUS
The purpose of this questionnaire is to collect information related to the
strategic orientation of your firm. There are no correct or incorrect answers, and
the confidentiality of your responses is assured.
I very much appreciate the time you take to complete this instrument. The
results of this field study will be reported in the researcher' s doctoral dissertation.
The name of the respondent, and the name and telephone number of the firm are
requested solely for control purposes of control.
Name of the respondent: ----------------------
Position: ---------------------------
Name of the firm: ------------------------
Telephone number: ______________________ _
Name of the interviewer: ----------------------
l. INFORMATION RELATED TO THE INDUSTRY YOUR FIRM
COMPETES IN (SELECT ONLY THE OPTION THAT CORRESPONDS
TO THE ACTIVITY REPORTEO TO CANACINTRA):
1) Capital goods
2) Metal mechanic
3) Foundries
4) Construction supply
5) Chemical

197
11. STRATEGIC ORGANIZATION:
Which one of the following descriptions most closely fits your organization
compared to other firms in the industry? Please read ali the descriptions and the
examples provided before selecting the corresponding alternative. None of the
descriptions provided may be exactly like your business, but please look for
similarities. Also, consider your business as a whole and note that none of the types
listed is inherently "good" or "bad. ")
__ Type A. This type of organization attempts to locate and maintain a secure
niche in a relatively stable productor service area. The organization tends to offer a
more limited range of products or services than its competitors. Often this type of
organization is not at the forefront of developments within the industry. It tends to
ignore industry changes that have no direct influence on current areas of operation
and concentrates instead on doing the best job possible in a limited area.
Following are examples of this type of strategic orientation for each kind of
industry. The examples provided are in tended to serve as illustrations for this kind
of strategic orientation and may not exactly be representative of your firm' s specific
activity within its industry. It is recommended that you read only the example
related to the industry your firm competes in.
Capital goods industry: We only have three lines of forklifts to serve a very
specialized niche. Our priority is to keep on serving our current market base instead
of trying to widen our product lines.
Metal mechanic industry: In this business we try to maintain our customer
base. We do not make continuous improvements in our product lines nor try to be
the first to introduce innovations. Efficiency in operations and administrative
processes are critica} activities in this organization.

198
Steel foundry industry: Our core strategy dictates that we keep servmg our
current customers on an on-time delivery and quality basis. We do not make much
improvement m production processes except for substantially reducing
manufacturing costs. Our product line is fairly stable, but not as wide as our
competitors'. We offer rods in three calibers only to medium-sized construction
companies, while our competitors offer a much broader range of calibers to a wider
customer base. We want to keep on serving our existing customers, and we are not
interested in new ones if that implies widening our existing product line.
Construction supply industry: In this business we try to maintain a stable
product line and offer a more limited one as compared to our competitors. In
general, we are not "first-in" in technological developments unless they are related
to improving efficiency of operations.
Chemical industry: The strategy of this business centers on maintaining the
business' customer base. Our product lines are relatively stable, and offer a
narrower product line compared to our competitors. We do our job as well as
possible within a limited business base.
__ Type B. This type of organization typically operates within a broad product
market domain that undergoes periodic redefinition. The organization values are
"first in" in new product and market areas even if not all of these efforts prove to
be highly profitable. The organization responds rapidly to early signals concerning
areas of opportunity, and these responses often lead to a new round of competitive
actions. However, this type of organization may not maintain market strength in ali
of the areas it enters.
Following are examples of this type of strategic orientation for each kind of
industry. The examples provided are intended to serve as illustrations for this kind
of strategic orientation and may not be exactly representative of your firm's specific
activity within its industry. It is recommended that you read only the example
related to the industry your firm competes in.

199
Capital goods industry: We continually display our equipment in expositions
and change models as soon as innovations can be incorporated.
Metal mechanic industry: Last year we launched five new products into the
market, more than any of our competitors. Not all of them were successful, but we
gained considerable market share and recognition among our customers.
Steel foundry industry: We constantly seek to develop new technologies in our
manufacturing process. Development engineering is always trying to come up with
new manufacturing processes to better serve our customer base. Last year we
improved our heating process and reduced production time by 10%. This gave us
an additional advantage over our competitors.
Construction supply industry: In this business we try to be "first in" m new
product design. We have a wide customer base. We constantly seek for business
opportunities and quickly respond to business opportunities.
Chemical industry: We try to be the first among our competitors in launching
new products into the market. It is very important to the firm to be the first in the
market, even though we are not always successful, it usually proves advantageous
to be the first in the market.
__ Type C. This type of organization attempts to maintain a stable, limited line of
products or services, while at the same time moving out quickly to follow a
carefully selected set of more promising new developments in the industry. The
organization is seldom "first in" with new products or services. However, by
carefully monitoring the actions of major competitors in areas compatible with its
stable product-market base, the organization can frequently be "second in" with a
more cost-efficient productor service.
Following are examples of this type of strategic orientation for each kind of
industry. The examples provided are in tended to serve as illustrations for this kind
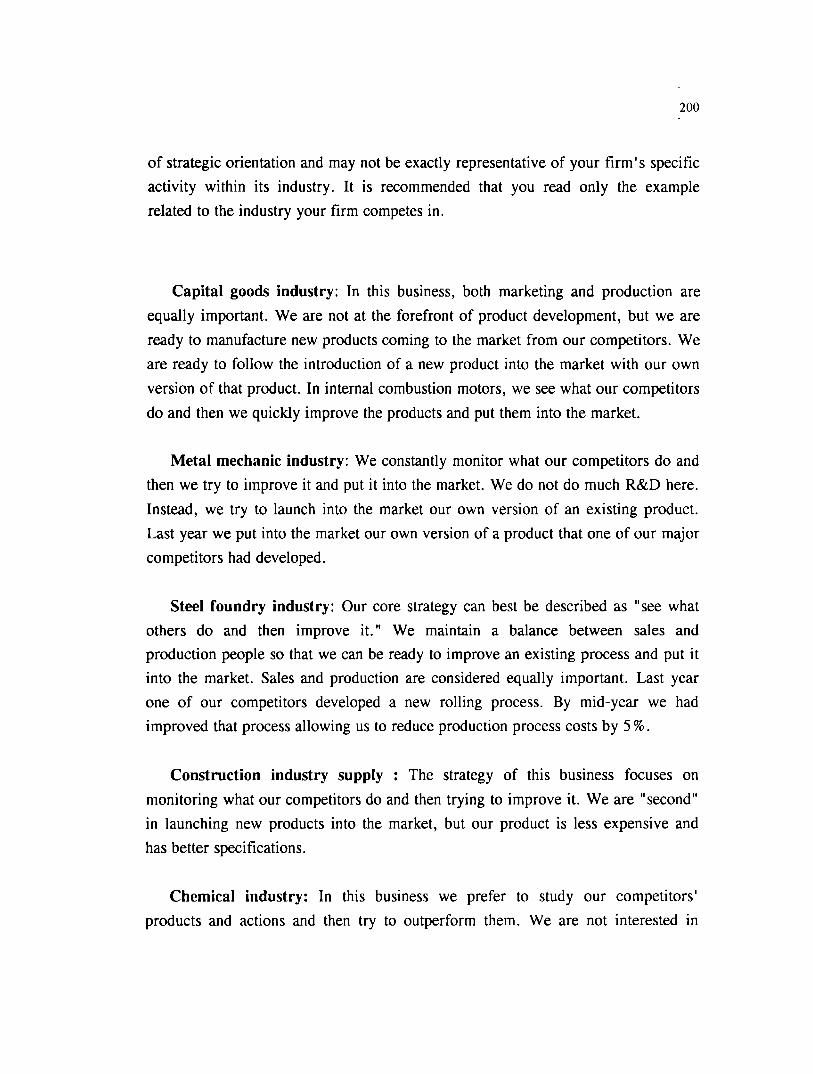
200
of strategic orientation and may not be exactly representative of your firm' s specific
activity within its industry. lt is recommended that you read only the example
related to the industry your firm competes in.
Capital goods industry: In this business, both marketing and production are
equally important. We are not at the forefront of product development, but we are
ready to manufacture new products coming to the market from our competitors. We
are ready to follow the introduction of a new product into the market with our own
version of that product. In internal combustion motors, we see what our competitors
do and then we quickly improve the products and put them into the market.
Metal mechanic industry: We constantly monitor what our competitors do and
then we try to improve it and put it into the market. We do not do much R&D here.
Instead, we try to launch into the market our own version of an existing product.
Last year we put into the market our own version of a product that one of our major
competitors had developed.
Steel foundry industry: Our core strategy can best be described as "see what
others do and then improve it." We maintain a balance between sales and
production people so that we can be ready to improve an existing process and put it
into the market. Sales and production are considered equally important. Last year
one of our competitors developed a new rolling process. By mid-year we had
improved that process allowing us to reduce production process costs by 5 % .
Construction industry supply : The strategy of this business focuses on
monitoring what our competitors do and then trying to improve it. We are "second"
in launching new products into the market, but our product is less expensive and
has better specifications.
Chemical industry: In this business we prefer to study our competitors'
products and actions and then try to outperform them. We are not interested in

201
being first in the market. Instead, we try to improve our competitors' products.
__ Type D. This type of organization does not appear to have a consistent
product-market orientation. The organization is usually not as aggressive in
maintaining established products and markets as sorne of its competitors, nor is it
willing to take as many risks as other competitors. Rather, the organization
responds to those areas where it is forced to by environmental pressures.
Following are examples of this type of strategic orientation for each kind of
industry. The examples provided are intended to serve as illustrations for this kind
of strategic orientation and may not be exactly representative of your firm' s specific
activity within its industry. It is recommended that you read only the example
related to the industry your firm competes in.
Capital goods industry: In this business we do not have a clearly articulated
organizational strategy. Current organizational structure does not seem to
encompass the firm's strategy. We have opened three new business lines--forklifts,
heavy machine equipment and machine tools--without really mastering any of them.
Metal mechanic industry: There does not seem to be a clearly defined strategy
in this business. We are more oriented towards a "see what comes out" focus.
Sometimes we design our products, and sometimes we put into the market our own
version of an existing one.
Steel foundry industry: In this company we try to respond to changes in our
externa! environment rather than control them. Sometimes we act in advance of our
competitors without really knowing how. Last year our major competitor reduced
the price of a type of wrought iron we also produced so we had to cut our selling
price at the expense of margin in order to avoid being driven out of the market for
that product.
Construction supply industry: We do not have a clearly articulated strategy in

202
this business. Sometimes we try to be first in the market. At other times, we focus
on maintaining our product line and customer base.
Chemical industry: In this business we do not have a clear strategy. However,
it seems that we respond to events that occur in the marketplace.
__ My firm does not seem to fit any of the above-mentioned characteristics.
111. STRATEGIC FOCUS:
Choose the generic strategy that best identifies the strategic orientation of your
firm. Remember to read each alternative and its corresponding example before
answering it, and do not forget that there are no "good" or "bad" answers.
__ Type A. In this business we pay great attention to asset use, employee
productivity, and discretionary expenses. Our customers buy our products primarily
because they cost less than our competitors' equivalent products.
Following are examples of this type of strategic orientation for each kind of
industry. The examples provided are in tended to serve as illustrations for this kind
of strategic orientation and may not be exactly representative of your firm' s specific
activity within its industry. lt is recommended that you read only the example
related to the industry your firm competes in.
Capital goods industry: In this business we have tight cost controls, allowing
us to sell at the lowest cost available in the market.
Metal mechanic industry: This business places strong emphasis on cost
reduction. Our design engineers are always trying to come up with a more efficient
process or product that allows to us reduce production costs so that we can sell at
the lowest price.
Steel foundry industry. We are always trying to offer the lowest pnce m
comparison to our competitors'. Overhead and production costs are closely

203
monitored so that deviations from the budget are promptly identified. In addition,
production process engineers are always trying to attain more efficiency so that
unnecessary costs are eliminated.
Construction industry: Our core strategy clearly dictates offering the lowest
cost available in the market compared to similar products offered by our
competitors. We achieve this strategy through efficiency in operations and tight cost
control.
Chemical industry: Our business strategy focuses on offering the lowest cost
compared to similar products offered by our competitors.
__ Type B. In this business we are always trying to create value perceived as
unique by our customers. This takes many forms, including image, service,
distribution, quality, and product attributes. Costs are important to us, but they are
not our major concern.
Following are examples of this type of strategic orientation for each kind of
industry. The examples provided are in tended to serve as illustrations for this kind
of strategic orientation and may not be exactly representative of your firm's specific
activity within its industry. It is recommended that you read only the example
related to the industry the your firm competes in.
Capital goods industry: In this business, we continually try to come up with a
product that is clearly distinguishable us from our competitors' products.
Metal mechanic industry: Competition in this industry is intense. We have
decided that our products and the services we provide must be perceived as unique
by our customers. Customers must find something that clearly distinguishes our
products and that provides additional value for them.
Steel foundry industry: Quality and variety of specifications are perceived as
unique by our customers. This added value increases our costs somewhat, but our

204
customers are willing to pay for that.
Construction supply industry: We try to offer additional value to our
customers. As a matter of fact, our customers are willing to pay premium prices for
our products because the service we offer is valuable to them.
Chemical industry: Our business strategy dictates offering an additional service
to our customers. They are willing to pay more for this service.
__ Type C. We compete in a narrow segment and we have chosen to target a
very specific market niche based on low sale prices. We are not interested in
serving a broad base of customers. Instead, we want to be the least costly providers
to a very narrow customer base.
Following are examples of this type of strategic orientation for each kind of
industry. The examples provided are in tended to serve as illustrations for this kind
of strategic orientation and may not be exactly representative of your firm' s specific
activity within its industry. It is recommended that you read only the example
related to the industry your firm competes in.
Capital goods industry: We have decided to serve a very narrow customer
base. We manufacture forklifts for heavy use only whose sale price is the lowest on
the market.
Metal mechanic industry: We have a very specific target market: construction
companies specializing in building apartments for medium-income families. We sell
iron structures which are affordable to these construction companies.
Steel foundry industry: We have identified a specific market niche: we
produce iron rods for small construction companies that cannot afford to buy large
volume. They buy our products because they get the lowest price available.
Construction supply industry: Our business strategy clearly dictates that we

205
select a market niche--we are not interested in a wide customer base. Instead, we
focus on a market niche in which offer the lowest cost available compared to
similar products offered by our competitors.
Chemical industry: The strategy followed m this business dictates that we
select a market niche--we are not interested in a wide market base. The selected
market niche is offered the lowest cost possible for similar products.
__ Type D. We compete in a narrow market niche. We have chosen to target this
very specific market area based on products that are perceived as especially unique
to our customers. We are not interested in serving a broad base of customers.
Instead, we want to provide a very specific product to a very specific.
Following are examples of this type of strategic orientation for each kind of
industry. The examples provided are in tended to serve as illustrations for this kind
of strategic orientation and may not be exactly representative of your firm' s specific
activity within its industry. It is recommended that you read only the example
related to the industry your firm competes in.
Capital goods industry: We have decided to serve a very narrow customer
base. We manufacture forklifts for heavy use only whose performance
characteristics are perceived as unique to our target market segment.
Metal mechanic industry: We have a very specific target market: construction
companies specializing in building highly engineered constructions. We sell them
iron structures according to their requirements, and they value our service highly.
Steel foundry industry: We have identified a specific market niche: we
produce iron rods for specialized construction companies which require iron rod
calibers that are uncommon in the market.
Construction supply industry: The strategy followed in this firm dictates
offering an exclusive product line in terms of service and quality to a very specific

206
customer base. We do not offer our products to a wide market segment; instead, we
focus on a small, clearly identified market niche.
Chemical industry: Our strategy requires selecting a market niche--a small part
of the market--and offering it a product with an added value compared to our
competitors' product. Our market niche pays for that value in the product we sell.
__ Type E. This business seems to follow ali of the above strategies at the same
time, none in particular. Sometimes we try to keep cost to a mínimum, sometimes
we try to have a clearly unique product, and sometimes we try to focus on a
specific kind of customer.
__ Type F. This business does not follow any of the above strategies. We clearly
follow other strategies in order to compete.
IV. INFORMATION RELATED TO THE FIRM'S CHARACTERISTICS:
1) Indicate the range of blue-collar and white-collar employees that work in the
firm (include all employees on the payroll):
1) Fewer than 15
2) Between 16 and 100
3) Between 101 and 250
4) More than 250
2) Indicate the range of your firm' s annual sales:
1) Up to 572,940.50 nuevos pesos
2) Between 572,940.50 and 5,807,533.25 nuevos pesos
3) Between 5,807,533.25 and 10,469,185.50 nuevos pesos
4) Above 10,469,185.50 nuevos pesos

207
3) As compared to the average performance of the industry your business competes
in, the financia! performance of the your firm (as measured by net profit margin-
net profit/annual sales) is:
1) Below average
2) On average
3) Above average
4) In general, since the current strategy of the firm was implemented, how has the
firm's net profit margin (profit margin/sales) been compared to the results from the
previous strategy?
1) It has increased considerably.
2) It has increased.
3) lt has remained constant.
4) lt has decreased.
5) lt has decreased considerably.
5) In general, sin ce the firm' s current strategy was implemented, how has market
share changed as compared to the results from the firm 's previous strategy?
1) lt has increased considerabl y.
2) lt has increased.
3) lt has remained constant.
4) lt has decreased.
5) lt has considerably decreased.
6) How man y years ago was the firm' s current strategy implemented?
1) One year ago or less
2) Between 1 and 3 years ago
3) Between 4 and 6 years ago

208
4) More than 6 years ago
7) In general, business net profit margin for the last three years has:
1) Decreased
2) Remained constant
3) Increased
8) In general, the firm' s market share for the last three years has:
1) Decreased
2) Remained constant
3) Increased
9) The final responsibility for implementing the firm' s current strategy belonged to:
1) The owner of the business
2) A professional manager (who is not the owner of the business)
10) For each of the following organizational functions, assign a score of 1 if much emphasis is placed on that function, a score of 2 if average emphasis is placed on it, and a score of 3 if not much emphasis is placed on that organizational function.
a) General management
b) Financia! management
c) Marketing/selling

209
d) Market research
e) Product research and development
t) Engineering, basic and applied
g) Production
h) Distribution
i) Legal Affairs
j) Personnel
V. INFORMATION RELATED TO THE PERSON HAVING THE FINAL
RESPONSIBILITY FOR IMPLEMENTING THE FIRM'S CURRENT
COMPETITIVE STRATEGY:
Check the appropriate space for your maximum leve) of formal education:
1) Doctoral degree
2) Unfinished doctoral studies
3) Master' s degree
4) Unfinished master's studies
5) Bachelor' s degree
6) Unfinished bachelor studies
7) High school
8) U nfinished high school
9) Junior high school or elementary school __
10) No formal level of education

APPENDIX B: PRESENTATION LETTER
San Luis Potosí, S.L.P., June of 1993.
Dear Mr.
This letter is to formally introduce Mr./Ms. , a student of the business
management undergraduate program at ITESM-SLP, who is collaborating in a
research project aimed at relating two typologies of business-level strategies with
certain characteristics of the organization and top decision-maker.
The information that you so kindly provide is necessary to achieve the purpose
of this research, and its treatment is completely confidential.
' I sincerely appreciate the time that you devote in answering the attached
questionnaire.
Y ours trul y,
Daniel Maranto Vargas Researcher
210