the relation between equity incentives and earnings ... (2)_315695.docx · web viewthis shows the...
TRANSCRIPT

2010
[EQUITY INCENTIVES AND EARNINGS MANAGEMENTIN THE UNITED KINGDOM]

Equity incentives
and earnings management
in the United Kingdom
Erasmus University RotterdamErasmus School of EconomicsRotterdam, 2010
Author L.J.P. (John) de Vos (315695)Coach Dr. Y. WangCo-reader Drs. R. van der Wal RA
5
10
15
20
25
30
35

Equity incentives and earnings management in the U.K.
Preface
This thesis is written as the final assignment of my study Accounting, Auditing &
Control at the Erasmus University of Rotterdam. While writing this thesis earnings
management and the incentives for CEO’s to engage in earnings management were
of special interest to me. This period has come to an end with the conclusion of this
thesis. First of all I want to thank my family and friends for their support during my
master study. Secondly I would like to thank N. El-Haloush and R. van der Linden for
their support and comments on my thesis. Finally I would like to thank Dr. Y. Wang
for her support and critical review while writing this thesis.
John de Vos
Rotterdam, 2010
[]
5
10
Equity incentives and earnings management in the U.K.
Abstract
The past two decades have shown an enormous increase in stock-based
compensation. In the light of the credit crunch, the global financial crisis and the
following economic recession, variable compensation was a eyesore for a lot of
people. Some companies even asked their employees to hand in their bonuses. This
shows the importance of variable compensation in today’s world.
The use of stock-based compensation should make managers pay more attention to
share price and should provide better alignment between the stakeholders and the
managers of a company. However, recent studies (e.g. O’Connell and Brendan
2004) show that the incentives coming from variable compensation are not always
the right ones. A possible issue is their incentive to engage in earnings management.
This paper examines the relation between equity incentives and earnings
management in the United Kingdom (U.K.). Three types of compensation (i.e. fixed
salary, bonus and stock-based) are distinguished. Hypothesized is that fixed salary
has a negative relation and that bonus and stock-based compensation have a
positive relation with discretionary accruals as a tool for earnings management. To
test this, accrual and compensation data from FTSE listed firms is used. The accrual
approach will be used in measuring earnings management and the relative size of
the compensation types will be used to measure the compensation variables.
The results from this research show that fixed salary has a positive relationship with
discretionary accruals. For bonus compensation no linear relationship with
discretionary accruals is found and for stock-based compensation a negative
relationship with discretionary accruals is found. Moreover, this research has proven
that low equity incentive CEO’s have significant higher mean scores of discretionary
accruals than high equity incentive CEO’s. Therefore, the results seem to oppose the
results of studies from Bergstresser and Philippon (2006), Cheng and Warfield
(2005) and Gao and Shrieves (2002) who all found evidence that high equity
incentive CEO’s engage more in earnings management (through the use of
discretionary accruals) than low equity incentive CEO’s.
[]
5
10
15
20
25
30
Equity incentives and earnings management in the U.K.
[]
Equity incentives and earnings management in the U.K.
Table of Contents
Preface........................................................................................................................3Abstract......................................................................................................................4
1 Introduction.........................................................................................................71.1 Problem statement..........................................................................................7
1.2 Research question..........................................................................................8
1.3 Contribution....................................................................................................9
1.4 Literature........................................................................................................9
1.5 Sample and methods....................................................................................10
1.6 Results..........................................................................................................11
2 Literature review...............................................................................................122.1 Earnings management..................................................................................13
2.1.1 What is earnings management?............................................................13
2.1.2 How are earnings managed?.................................................................14
2.1.3 Why do firms engage in earnings management?...................................16
2.1.4 How to detect earnings management?...................................................18
2.2 Compensation contracts...............................................................................23
2.2.1 Fixed salaries.........................................................................................24
2.2.2 Short-term incentives.............................................................................24
2.2.3 Long-term incentives..............................................................................25
2.2.4 Why do managers receive stock compensation?...................................25
2.3 Earnings management and equity compensation.........................................26
3 Hypotheses.......................................................................................................28
4 Research design...............................................................................................314.1 Data and sample...........................................................................................31
4.2 Dependant variable.......................................................................................32
4.3 Independent variable....................................................................................32
[]
5
10
15
20
25
30
Equity incentives and earnings management in the U.K.
5 Data analysis and results.................................................................................325.1 Discretionary accruals and descriptive statistics...........................................32
5.2 Results..........................................................................................................32
5.2.1 Correlation testing..................................................................................32
5.2.2 Independent-Samples T-Test.................................................................32
6 Conclusion, limitations and future research..................................................326.1 Research question........................................................................................32
6.2 Theoretical and empirical conclusions..........................................................32
6.3 Limitations and directions for future research...............................................32
References...............................................................................................................32
Appendix A...............................................................................................................32Appendix B...............................................................................................................32
[]
5
10
15
Equity incentives and earnings management in the U.K.
1 Introduction
1.1 Problem statement
Stock-based compensation, like stock options and shares for example, has been
frequently in the news the last couple of years. Despite the credit crunch, the global
financial crisis and the following economic recession, a lot of companies, also
financial institutions, gave their executives big bonuses. There were people who even
argued that executives should hand in their bonuses, because they thought
executives are responsible for the bad performances. Moreover here were
companies who asked their employees to hand in their bonuses, and in the United
States, the House passed legislation that significantly controls bonuses for
employees of financial institutions who received support from the government’s
financial rescue program1. For employees who earn more than $ 250,000, a 90%
surtax is granted on their bonuses. This example shows the importance of variable
compensation, and especially stock-based compensation, in today’s world.
The past two decades have shown an enormous increase in stock-based
compensation. The most important reason why managers nowadays have relatively
large stock-based compensation packages is that it should align managers’ aims with
the aims of stakeholders.
After two decades it seems however, that stock-based compensation has a short-
term perspective. Remuneration systems are working as they were designed to do.
Therefore they do not manage to align the interest of management with shareholders
(O’Connell and Brendan 2004). O’Connell and Brendan argue that, in a society
where CEO’s on average work four years for the same company, managers try to
appease the market through a variety of devices that ensure rising short-term stock
prices. With these devices they mean, among other thing, earnings management
practices to ensure steadily rising earnings that appease forecasts of the market.
On the other hand, Ronen and Yaari (2008) say it is difficult to make a profit in the
future when the market price is only rising. Therefore, Ronen and Yaari say long-term
1 http://online.wsj.com/article/SB123745823318182841.html[]
5
10
15
20
25

Equity incentives and earnings management in the U.K.
earnings management should aim at deflating earnings. Although the opinions differ,
it is, in regard to this study, assumed that equity-based compensation creates short-
term incentives for managers to manage earnings.
Literature divides compensation contracts for managers into three categories; fixed
salaries, bonuses and stock-based compensation (Merchant and Van der Stede
2007). Gao and Shrieves (2002) say that, in contrast to salary, the size of stock
options and bonuses is positively related to the use discretionary accruals as a tool
for earnings management. According to Murphy (1999) in the eighties and nineties of
the last century the main development in executive compensation was stock-based
compensation.
1.2 Research question
The purpose of this thesis is to provide more insight into the relation between equity
incentives (stock-based compensation) and earnings management. Besides the
relation of stock-based compensation and earnings management, also the relation of
fixed salary and (cash) bonus with earnings management will be investigated.
While prior research on the relation between equity incentives and earnings
management, which will be elaborated on more in chapter 2, mostly used United
States (U.S.) data, this research investigates the situation in the European Union
(E.U.). Within the E.U. this study focuses on companies based in the United Kingdom
(U.K.). European countries require companies to disclose detailed information on
executive compensation practices in the disclosures of the annual report. The U.K.
was the first country within the E.U. where these duties were introduced (Praag
2005). Therefore, most data is available for the U.K. This leads to the following
research question:
What is the relation between equity incentives and earnings management in the U.K.?
1.3 Contribution
During the past years, compensation for managers and earnings management have
been important topics in many debates. This research and its results are interesting
[]
5
10
15
20
25
30
Equity incentives and earnings management in the U.K.
for two groups. First, for the Board of Directors of firms, because they provide the
compensation contracts to their top-managers. While stock-based compensation can
yield positive incentives effects, prior research has already shown that equity-
incentives have a negative effect on earnings management. Secondly, this study is
interesting for financial reporting regulators, because they criticize managers for their
focus on the short-term targets. It is expected that, with the results of this research,
financial reporting regulators can respond better to earnings management and its
incentives.
Moreover this thesis is a contribution to the knowledge on earnings management and
its relation with compensation for the academic world. It extends the growing
literature that examines the relation between equity incentives and earnings
management. Therefore this thesis may extent existing academic researches for
stock-based compensation outside the U.S.
1.4 Literature
This thesis is related to other papers on the subject of earnings management (e.g.
Daniel et al. 2008; Healy and Wahlen 1999; Stein 1989; Dechow et al. 1995). This
thesis is also related to studies on compensation contracts (e.g. Merchant and Van
der Stede 2007; Murphy 1999; Gao and Shrieves 2002). These studies have shown
what the different types of compensation are and how they are related to earnings
management.
Furthermore this thesis complements extant studies on the incentives for earnings
management (e.g. Cheng and Warfield 2005; Bergstresser and Philippon 2006;
Jensen and Murphy 1990; Bauman and Shaw 2006). These studies have shown that,
in general, the self-interest motivation of management is a great cause of earnings
management. Bergstresser and Philippon (2006) found evidence that earnings are
more manipulated through discretionary accruals when CEO’s total compensation is
more closely tied to the value of the shares. Cheng and Warfield (2005) examined
the relation between managers’ equity incentives and earnings management. They
found that high equity incentive managers are more likely to sell shares in the future.
This motivates these managers to engage in earnings management to increase the
value of the shares to be sold. Moreover, Gao and Shrieves (2002) examined how
the different types of compensation (i.e. fixed salary, bonuses, stock option, restricted
[]
5
10
15
20
25
30
Equity incentives and earnings management in the U.K.
stock, and long-term incentive plans) influence earnings management behaviour.
This research extends and complements those researches by examining the relation
between equity incentives and earnings management.
1.5 Sample and methods
As mentioned earlier, most research done until now, focuses on companies in the
U.S. This research will focus on companies based in the U.K. because that was the
first country in the E.U. where companies were required to disclose detailed
information on executive compensation. Therefore most data is available for the U.K.
As the sample for this thesis the FTSE 100 index is used. This is a share index of the
100 most highly capitalised U.K. companies, listed on the London Stock Exchange.
This data provides a sample of about 176 entries and is spread out over two years,
i.e. 2005 and 2006. Financial data that is needed of the earnings management
component, and compensation data from the CEO’s that is needed for the
compensation component, will be gathered from the annual reports of the
companies.
Like other studies (Dechow et al. 1995; Bergstresser and Philippon 2006; Gao and
Shrieves 2002) the accrual approach will be used in measuring earnings
management. To measure earnings management the Modified Jones Model
(Dechow et al. 1995) is selected.
As explained earlier, this research distinguishes three components in compensation
contracts; fixed salary, bonuses and stock-based compensation (e.g. stock-options,
shares). It focuses on the relation between equity incentives and earnings
management, but it also tests the relation of the other two components (i.e. fixed
salary and bonus) with earnings management. Because relative figures are better
comparable with each other, the relative size of the compensation type will be used
to measure compensation.
1.6 Results
The results from this research show that fixed salary has a positive relationship with
discretionary accruals. For bonus compensation no linear relationship with
[]
5
10
15
20
25
30
Equity incentives and earnings management in the U.K.
discretionary accruals is found and for stock-based compensation a negative
relationship with discretionary accruals is found.
Regarding the mean scores of discretionary accruals, no significant difference is
found for CEO’s with a relative high size and CEO’s with a relative low size of bonus
compensation. For fixed salary a small significant difference is found between the
mean scores of discretionary accruals for CEO’s with a relative high size and CEO’s
with a relative low size of fixed salary. Moreover, regarding stock-based
compensation, this research has proven that low equity incentive CEO’s have
significant higher mean scores of discretionary accruals than high equity incentive
CEO’s. Therefore, the results seem to oppose the results of studies from
Bergstresser and Philippon (2006), Cheng and Warfield (2005) and Gao and
Shrieves (2002) who all found evidence that high equity incentive CEO’s engage
more in earnings management (through the use of discretionary accruals) than low
equity incentive CEO’s.
Although the results in this thesis provide an indication on the relation between
earnings management and equity incentives additional research is needed to provide
a complete answer in the case of earnings management.
The thesis proceeds in five chapters. The next chapter provides background
information and the literature study. It describes the relevant academic literature on
earnings management, compensation contracts, and the link between these two
components. In chapter 3 the hypotheses are developed. The fourth chapter
discusses the research design. The research design describes the sample selection
and research method. In chapter 5 the results of the research are explained. In the
final chapter, chapter 6, the conclusions, limitations and directions for future research
are presented.
[]
5
10
15
20
25
Equity incentives and earnings management in the U.K.
2 Literature review
This section describes the background information and literature review on earnings
management and compensation contracts. Paragraph 2.1 elaborates on earnings
management. This paragraph will describe what earnings management is, how
earnings are managed, what activity manipulation is and why firms engage in
earnings management. The second paragraph will be about compensation contracts.
It describes fixed salaries, short-term incentives, and long-term incentives.
Furthermore it will elaborate on the fact why managers receive stock-based
compensation. In the last paragraph, paragraph 2.3, the link between earnings
management and equity compensation will be described.
Inefficient MarketThroughout this thesis, the asymmetric information gap between the principal and the
agent is discussed. This supports the notion that markets are not efficient in the
strong form2. According to the Efficient Market Theory (EMT) the strong form states
that all information (public and private) is included in the market price. This includes
that insider information (information known to management) is reflected in the share
price. If this is true, the reported information would not affect the stock price, because
the stock price already would reflect this information. In this scenario there would be
no incentive for management to manipulate earnings. If the market was efficient in
the strong form and managers reported manipulated earnings, the market would not
be fooled. Managers would therefore not be able to effect their compensation (Levy
and Post 2005).
2.1 Earnings management
In the light of past accounting scandals and the current world economics, the credit
crunch, the subject of earnings management has been receiving great attention. In
2 The three forms of the Efficient Market Theory (EMT) are: weak, semi-strong and strong. In the weak
form only historical data reflects the price of a share. In the semi-strong form all relevant public
information is reflected in the share price. The strong form states that all information (public and
private) is reflected in the stock prices.[]
5
10
15
20
25
Equity incentives and earnings management in the U.K.
2001 the investment world was shocked when the smartest guys in the room3 were
caught manipulating accounts. The Enron affair bought to daylight the significant
effects of earnings manipulation. Unfortunately, the Enron affair does not stand on its
own. Since 2002 there has been a number of accounting scandal were earnings
have been manipulated (Royal Ahold, Parmalat and more recently Satyam Computer
Services4).
It is not always clear if firms operate outside the boundaries set by regulators. As Van
der Bauwhede (2003) sais the one form of earnings manipulation is considered fraud,
the other is misleading and based on misjudgements by managers. The corrupt view
on the issue is revealed by managers that operate outside the boundaries set by
regulators. However, earnings management operates more than often within the
guidelines set by the reporting authorities. This thesis will concentrate on the later
form of earnings management.
2.1.1 What is earnings management?
Healy and Wahlen (1999) state earnings management as follows:
“Earnings management occurs when managers use judgment in financial
reporting and in structuring transactions to alter financial reports to either
mislead some stakeholders about the underlying economic performance of the
company or to influence contractual outcomes that depend on reported
accounting numbers.” (Healy and Wahlen 1999, 368)
In this definition Healy and Wahlen use a judgement criterion, as well as the goal of
earnings management.
The judgement criterion implies that earnings management is an activity that is
purposely undertaken by management. This judgement criterion is cited in a number
of articles as moving within the boundaries set by regulators (e.g. Daniel et al. 2008;
Benish 2001). This criterion implies that management does not intentionally
manipulate accounts. However, it implies the use of professional discernment used
by management. This discernment addresses the main challenge researches face 3 A documentary about the Enron corporation, its faulty and corrupt business practices (source:
www.imdb.com)4 (Source: http://en.wikipedia.org/wiki/Accounting_fraud)
[]
5
10
15
20
25
30
Equity incentives and earnings management in the U.K.
(Beneish 2001). According to Bergstresser and Philoppon (2006) earnings
management occurs, when reported income includes cash flows and changes in firm
value. Cash flows are not difficult to establish, but changes in firm value requires a
greater deal of management discernment.
Healy and Wahlen also state the goal of earnings management. On the one hand
misleading stakeholders, and on the other hand influencing contractual outcomes. In
general earnings management is aimed at transferring wealth (Stolowy and Breton
2004).
2.1.2 How are earnings managed?
Financial reports convey earnings that have occurred throughout the past period.
These earnings are based on cash flow plus changes in firm value (Bergstresser and
Philippon 2006). Whilst cash flows are easily determined, changes in firm value are
more challenging. It is in determining this change in firm value that managers are
granted some freedom by regulators and standard setters. The accrual account,
designed by standard setters, is a common account used to manipulate earnings.
Benish (2001) states that it is like that earnings management takes place in the
accrual account. However the aim of standard setters was not to provide managers
with a possibility for earnings management. Accruals were designed to express
valuation changes that had not yet related in cash flows (Gao and Shrieves 2002).
This poses the problem that not all accruals are related to earnings management.
With regards to earnings management, only the discretionary component of accruals
is important (Benish 2001).
Based on their sales and value of assets, all firms are expected to have a certain
level of accruals (Van der Bauwhede 2003). However when these accruals exceed
non-discretionary levels, they could indicate to tend to manage earnings.
Over the years there have been a number of methods developed to detect earnings
management. Healy (1985) and DeAngelo (1986)5 developed methods that were
very dependent on years were no earnings management was suspected. This was
the biggest weakness for these models.
5 Cited from Van der Bauwheden (2003)[]
5
10
15
20
25
30
Equity incentives and earnings management in the U.K.
The Jones model (Jones 1991) and the modified Jones model (Dechow et al. 1995)
were created to try to eliminate the discretionary element of the accruals, by taking
into consideration changes in the economic environment (Benish 2001). However like
most models these models have various limitations (read for further details on the
models paragraph 2.1.4). Studies have shown that changes in inventory, and
accounts receivables can resemble earnings manipulation (Roychowdhury 2006;
Stowley and Berton 2004).
Rational minds would suggest that investors, being able to detect earnings
management, would punish firms that violate the freedom granted to them by
standard setters. Studies carried out by Teoh et al. (1998a, b) and Teoh and Wong
(2002) suggest that investors are “naïve” in detecting earnings manipulations, due to
the asymmetric information gap. Although there are models that can predict the
possibilities of earnings management, an accurate forecast remains difficult.
It should be said that most researches that are carried out assume that the market is
not aware of the tendency by managers to alter earnings. However according to a
study by Stein (1989) investors rationally expect managers to manage earnings. As a
result, in pricing stock analysts’ expect managers to manipulate earnings. The market
knows it cannot prevent earnings manipulation from happening so it anticipates that
earnings have been managed (Cheng and Warfield 2005). This would be consistent
with the efficient market hypothesis. The share price reflexes all information, i.e.
public and private. The share price therefore portrays a true view of the firm, where
managed earnings are processed in the market price.
Coles et al. (2006) suggest that investors are well informed and sophisticated in there
awareness of earnings manipulation. Nevertheless, the transparency into incentives
and account manipulation is limited. Even though models might be available, these
models face limitations and can only indicate the possible use of earnings
management.
Activity manipulationMost studies carried out focus on account manipulation, however Roychowdhury
(2006) suggest that the effects of direct account manipulation are relatively lower in
comparison to activity manipulation. Activity manipulation can be characterized as a
[]
5
10
15
20
25
30
Equity incentives and earnings management in the U.K.
difference from normal operation with the objective to meet certain earnings targets
(Roychowdhury 2006). One might argue that activities that increase earnings are
only good for the firm. Roychowdhury mentions an increase in sales by means of
temporary discounts. This cannot harm the interest of a firm and investors might
even appreciate a certain degree of entrepreneurship to sell products that might have
not been sold without a discount. However earnings manipulation is known for its
short-term perspective. Therefore managers might mislead stakeholders (Stolowy
and Berton 2004). Activity manipulation doesn’t support this notion because it does
not mislead investors. Reported earnings by management are not incorrectly stated
and do not present an untrue view of the value of the company. Earnings
management through account manipulation does not always materialize and produce
cash flows, therefore not benefiting investors. Cash flows change the capacity of
firms to pay out dividend. DeAngelo and DeAngelo (2006) research suggests that
dividend payouts are important to investors. Further research has shown that
dividend cuts are punished at the stock market (Pettit 1972; Aharnoy and Swary
1980; Gullon et al. 2002). Therefore earnings that do not materialise into cash flow,
damage the cash position of the firm.
2.1.3 Why do firms engage in earnings management?
Although throughout the literature different forms of compensation are given for the
existence of earnings management, Stolowy and Berton (2004) state that the why
earnings management exist is to profit from the possibilities of wealth transfer.
Benish (2001) distinguished between four possible motives for earnings
management:
1. Debt contracts;
2. Compensation Agreements;
3. Equity Offerings;
4. Insider trading.
Firms’ performance are often regulated in debt covenants. Moreover dividend
restrictions are incorporated in them (Bradley and Roberts 2004). This is because the
position of the debt providers is weaken by dividends that exit the firm. Through
dividend payout, less cash remains in the firm to pay back the debt providers (Daniel
et al. 2008). Benish (2001) summarizes studies that reveal mixed results for the use
[]
5
10
15
20
25
30
Equity incentives and earnings management in the U.K.
of earnings management to avoid defaults on loans. Influence debt covenants by
using earnings management to avoid defaults, might have the opposite effect that
firms eventually default. Some firms profit from a relatively cheap form of capital,
although they may not default on their loans (Stolowy and Breton 2004). Due to
higher earnings, companies could seem more profitable than in reality.
Compensation contracts seem to provide more evidence for the existence of
earnings management than debt contract. Extensive studies (e.g. Healy 1985;
Bergstresser and Philippon 2006; Bauman and Shaw 2006; Ronen et al. 2006; Gao
and Shrieves 2002) have shown that in general that the greatest cause of earnings
management is the self-interest motivation of management. This subject will be
addressed more in depth in the next paragraph.
Equity offerings also offer a great opportunity to manage earnings. Managers are
known to inflate earnings to receive a better price for new equity (Benish 2001). This
is possible due to the information asymmetry and is consistent with the notion that
management aspire to receive a relatively low cost of capital.
Insider trading has also been documented (Benish 1999; Ronen et al. 2006). Benish6
even argues that it is expected for managers to use their insider information about
earnings overstatements, to trade for their own benefit. Ronen et al. (2006) study
supports recommendation to ban insider trading.
2.1.4 How to detect earnings management?
The accrual approach will be used in measuring the dependant variable, earnings
management (Dechow et al. 1995; Bergstresser and Philippon 2006; Gao and
Shrieves 2002). Like Dechow et al. (1995), five models will be described that are
used in the extant earnings management literature. These five models are the Healy
Model, the DeAngelo Model, the Jones Model, the Modified Jones Model and the
Industry Model. In this paragraph the models will be described.
6 Benish, 2001, page 10. []
5
10
15
20
25
30
Equity incentives and earnings management in the U.K.
The models make use of accruals. Accruals are revenues and costs that make the
difference between the profit and the cash flow of a company. They depend on
accounting choices of managers, and it is therefore important to examine whether the
accruals are in line with expectations. Total accruals need to be decomposed into a
discretionary and a non-discretionary component. Discretionary accruals are those
which cannot be explained from normal activities. Managers can influence these
accruals. Non-discretionary accruals can be explained from normal activities of the
company and managers can not influence them.
The starting point of most models is the total accruals. The models then try to find the
non-discretionary element so they can divide the accruals in the non-discretionary
and the discretionary part.
1. The Healy ModelHealy (1985) uses total accruals to determine discretionary accruals. The
discretionary accruals are equal to the difference of total accruals in two successive
years. The assumptions Healy (1985) makes, is that non-discretionary accruals are
constant. Further is assumed that systematic earnings management is occurring in
every period. In this last assumptions it is that Healy’s study differs from most other
earnings management studies.
The sample is divided into three groups, in one is predicted that earnings are
managed upwards, and downward in the other two groups. Then a comparison of the
mean total accruals is made between the three groups.
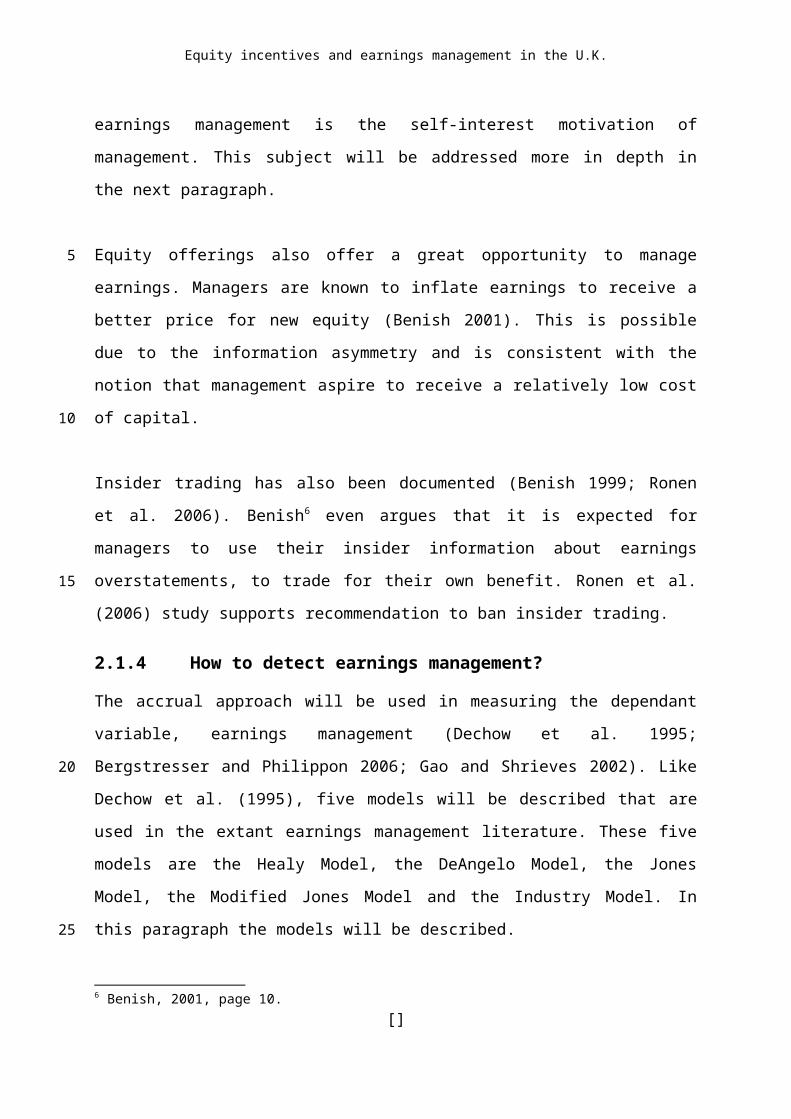
The model Healy uses is:
NDA τ=∑t
❑TA t
T (2-1)
Where:
NDA Estimated non-discretionary accruals;
TA Total accruals scaled by lagged total assets;[]
5
10
15
20
25
30
Equity incentives and earnings management in the U.K.
t 1,2,..T is a year subscript for years included in the estimation
period;
τ A year subscript indicating a year in the event period.
2. The DeAngelo ModelDeAngelo (1986) also uses total accruals to determine discretionary accruals. The
DeAngelo Model can be viewed as an expansion of the Healy Model, in which the
estimation period for non-discretionary accruals is restricted to the previous year’s
observation. In the DeAngelo Model first is assumed that differences in total accruals
have an expected value of zero under the null hypothesis of no earnings
management (Dechow et al 1985).
DeAngelo’s model further assumes that total accruals will move in the same direction
as the balance total of a company. For example, when a company invest in fixed
assets, this ultimately leads to an increase in total assets and therefore to an
increase in the balance total. The fixed asset (investment) has to be depreciated.
This will lead to an increase in (non-discretionary) accruals and therefore also to an
increase in total accruals. But if an increase in total accruals not directly comes from
an increase in assets then this increase is caused by discretionary accruals. This
could indicate earnings management.
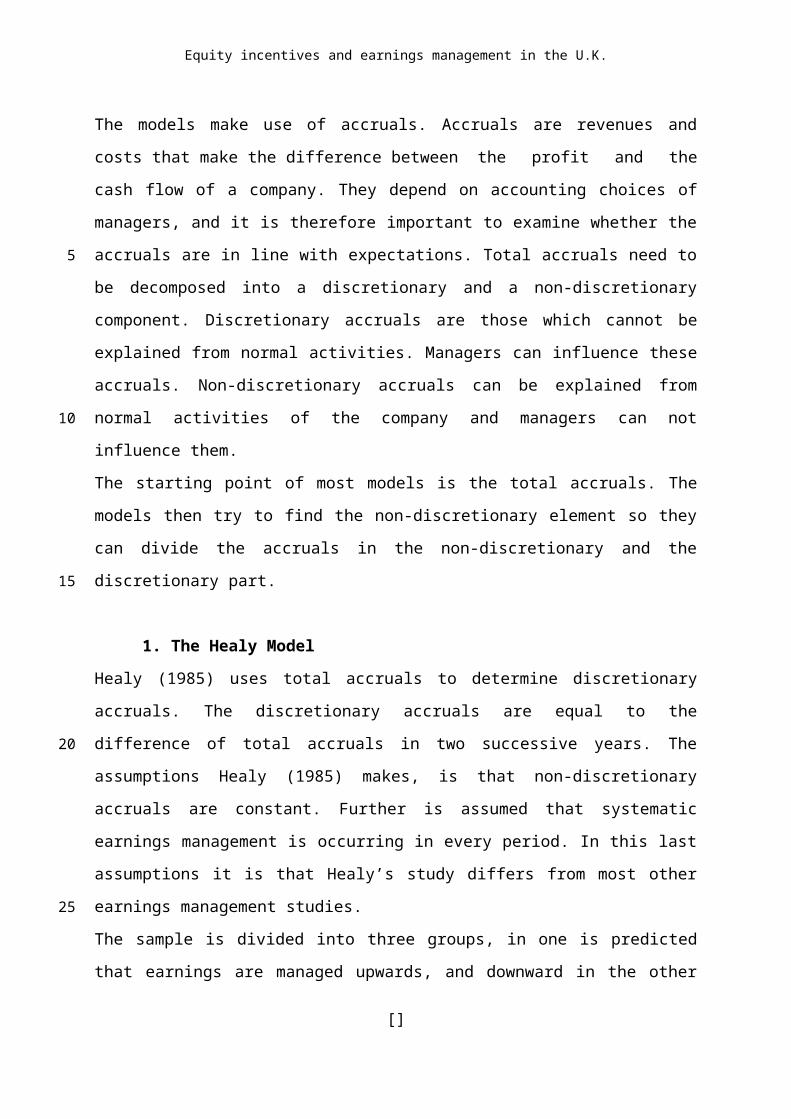
DeAngelo’s Model is:
NDA τ=TA τ−1(2-2)
Where:
NDA Estimated non-discretionary accruals;
TA Last period total accruals (scaled by lagged total assets);
τ A year subscript indicating a year in the event period.
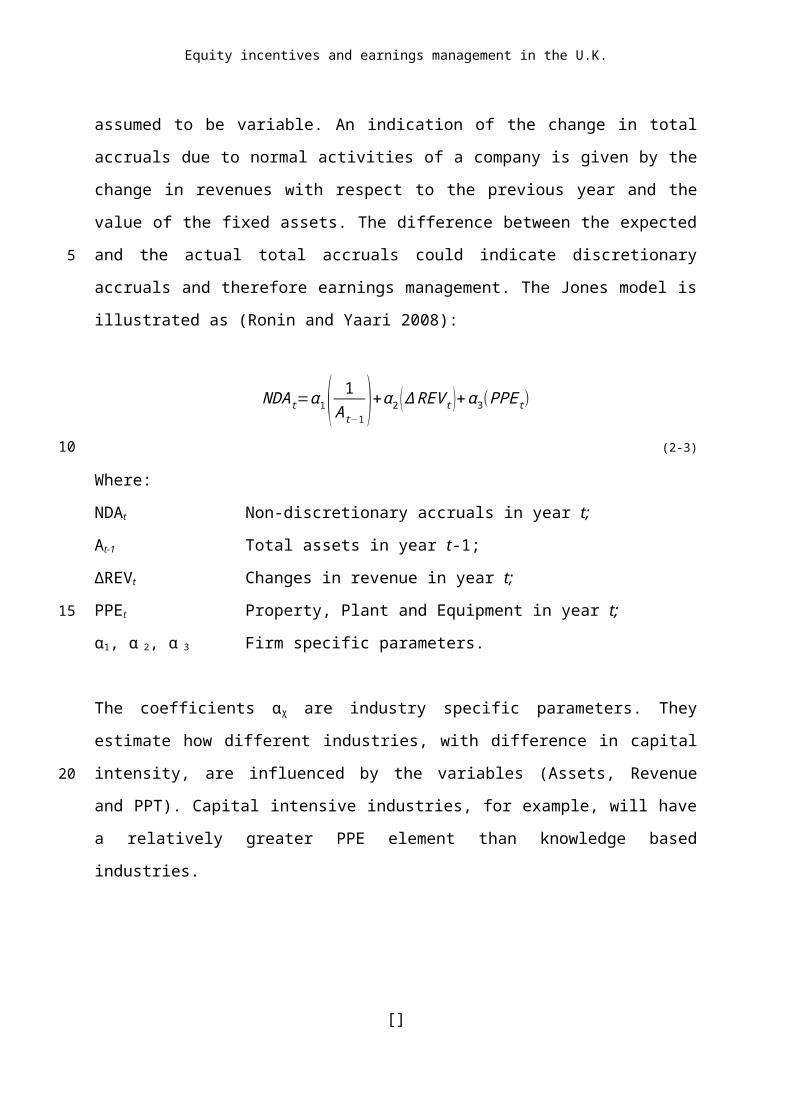
3. The Jones ModelIn comparison to Healy’s and DeAngelo’s Model, the non-discretionary accruals in
the Jones Model (Jones 1991) are assumed to be variable. An indication of the
[]
5
10
15
20
25
30
Equity incentives and earnings management in the U.K.
change in total accruals due to normal activities of a company is given by the change
in revenues with respect to the previous year and the value of the fixed assets. The
difference between the expected and the actual total accruals could indicate
discretionary accruals and therefore earnings management. The Jones model is
illustrated as (Ronin and Yaari 2008):
NDA t=α1( 1At−1 )+α2 (∆ REV t )+α3(PPE t)
(2-3)
Where:
NDAt Non-discretionary accruals in year t;
At-1 Total assets in year t-1;
∆REVt Changes in revenue in year t;
PPEt Property, Plant and Equipment in year t;
α1, α 2, α 3 Firm specific parameters.
The coefficients αχ are industry specific parameters. They estimate how different
industries, with difference in capital intensity, are influenced by the variables (Assets,
Revenue and PPT). Capital intensive industries, for example, will have a relatively
greater PPE element than knowledge based industries.
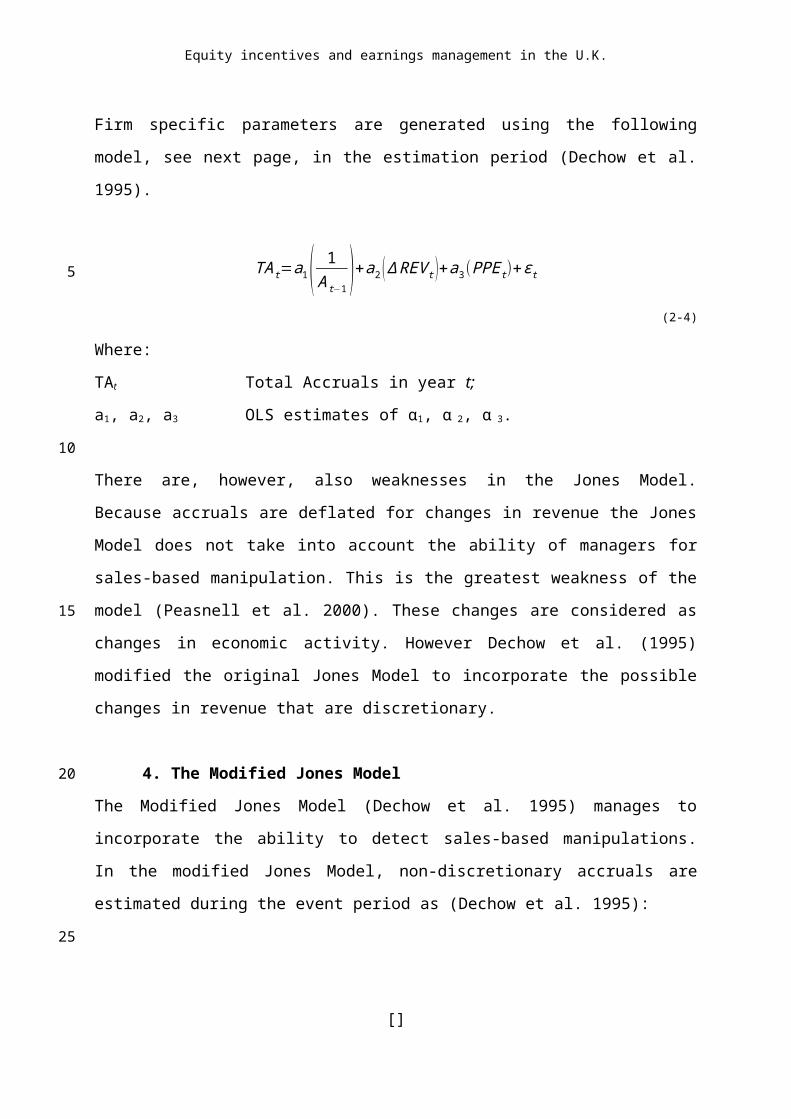
Firm specific parameters are generated using the following model, see next page, in
the estimation period (Dechow et al. 1995).
TAt=a1( 1A t−1 )+a2 (∆REV t )+a3(PPE t)+εt
(2-4)
Where:
TAt Total Accruals in year t;
a1, a2, a3 OLS estimates of α1, α 2, α 3.
There are, however, also weaknesses in the Jones Model. Because accruals are
deflated for changes in revenue the Jones Model does not take into account the
[]
5
10
15
20
25
30
Equity incentives and earnings management in the U.K.
ability of managers for sales-based manipulation. This is the greatest weakness of
the model (Peasnell et al. 2000). These changes are considered as changes in
economic activity. However Dechow et al. (1995) modified the original Jones Model
to incorporate the possible changes in revenue that are discretionary.
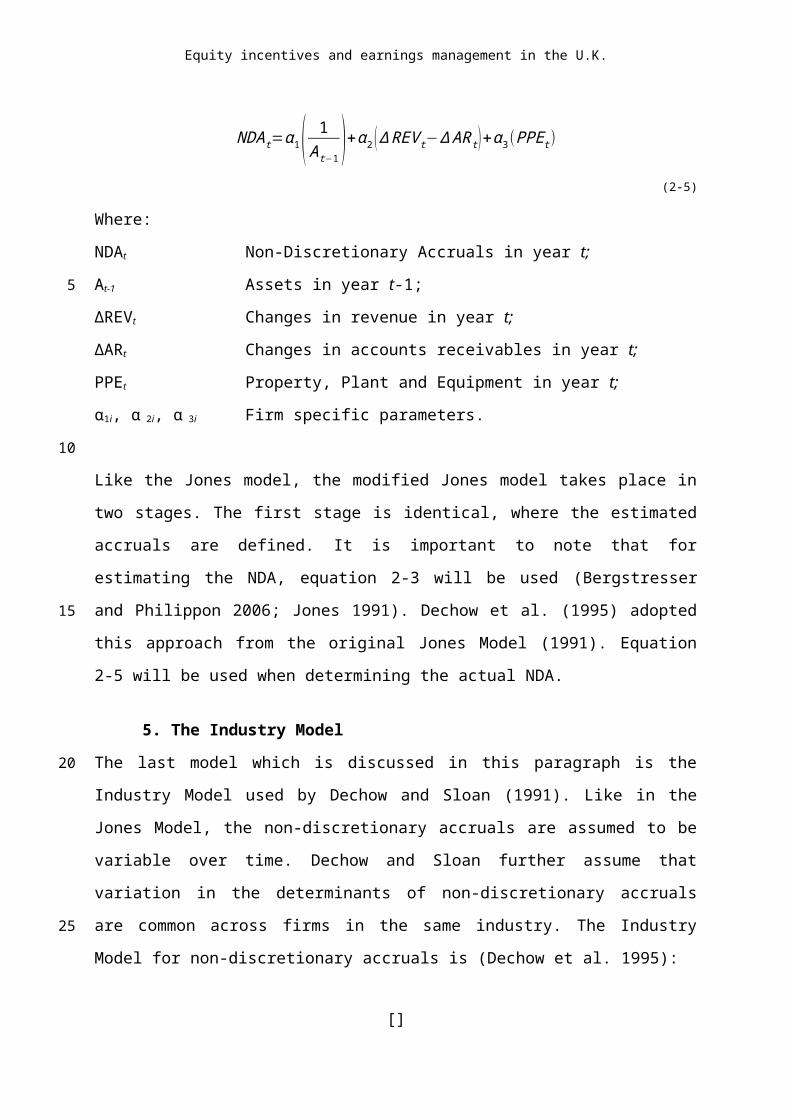
4. The Modified Jones ModelThe Modified Jones Model (Dechow et al. 1995) manages to incorporate the ability to
detect sales-based manipulations. In the modified Jones Model, non-discretionary
accruals are estimated during the event period as (Dechow et al. 1995):
NDA t=α1( 1At−1 )+α2 (∆ REV t−∆ AR t )+α 3(PPE t)
(2-5)
Where:
NDAt Non-Discretionary Accruals in year t;
At-1 Assets in year t-1;
∆REVt Changes in revenue in year t;
∆ARt Changes in accounts receivables in year t;
PPEt Property, Plant and Equipment in year t;
α1i, α 2i, α 3i Firm specific parameters.
Like the Jones model, the modified Jones model takes place in two stages. The first
stage is identical, where the estimated accruals are defined. It is important to note
that for estimating the NDA, equation 2-3 will be used (Bergstresser and Philippon
2006; Jones 1991). Dechow et al. (1995) adopted this approach from the original
Jones Model (1991). Equation 2-5 will be used when determining the actual NDA.
5. The Industry ModelThe last model which is discussed in this paragraph is the Industry Model used by
Dechow and Sloan (1991). Like in the Jones Model, the non-discretionary accruals
are assumed to be variable over time. Dechow and Sloan further assume that
variation in the determinants of non-discretionary accruals are common across firms
[]
5
10
15
20
25
30
Equity incentives and earnings management in the U.K.
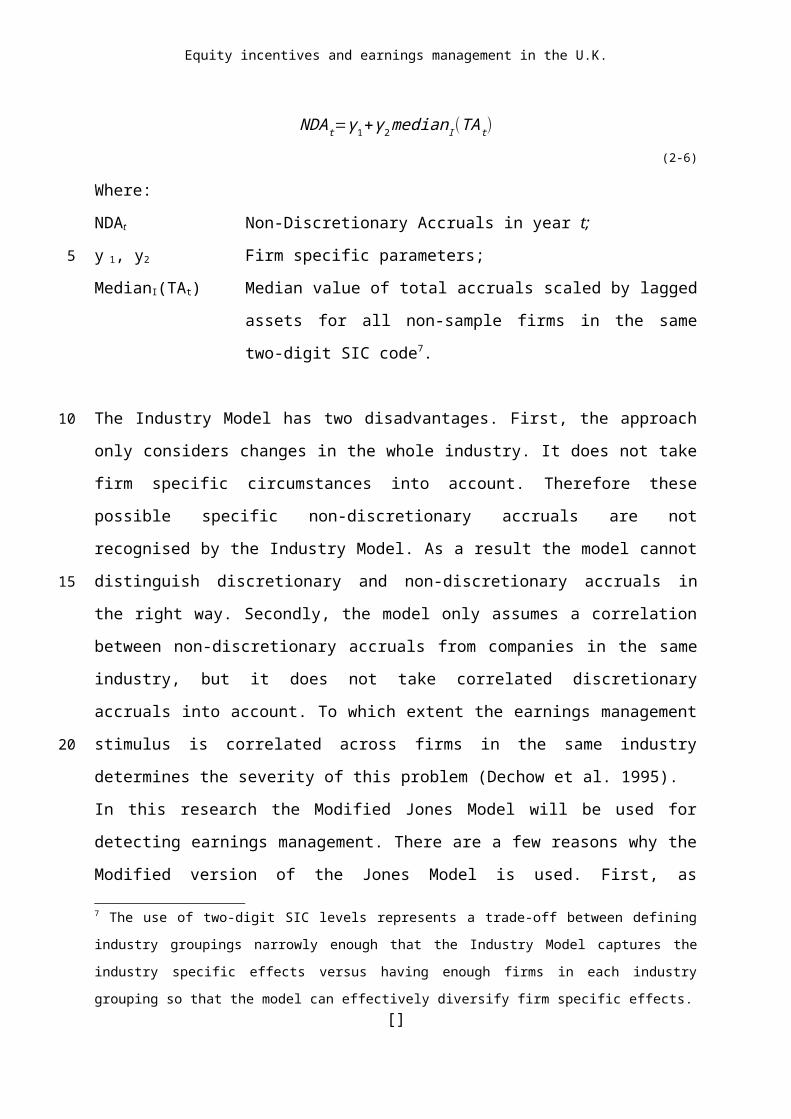
in the same industry. The Industry Model for non-discretionary accruals is (Dechow
et al. 1995):
NDA t=γ1+γ2median I (TAt)
(2-6)
Where:
NDAt Non-Discretionary Accruals in year t;
y 1, y2 Firm specific parameters;
MedianI(TAt) Median value of total accruals scaled by lagged assets for all
non-sample firms in the same two-digit SIC code7.
The Industry Model has two disadvantages. First, the approach only considers
changes in the whole industry. It does not take firm specific circumstances into
account. Therefore these possible specific non-discretionary accruals are not
recognised by the Industry Model. As a result the model cannot distinguish
discretionary and non-discretionary accruals in the right way. Secondly, the model
only assumes a correlation between non-discretionary accruals from companies in
the same industry, but it does not take correlated discretionary accruals into account.
To which extent the earnings management stimulus is correlated across firms in the
same industry determines the severity of this problem (Dechow et al. 1995).
In this research the Modified Jones Model will be used for detecting earnings
management. There are a few reasons why the Modified version of the Jones Model
is used. First, as mentioned before, Dechow, Sloan, and Sweeny (1995) evaluated
the ability of the models described above to detect earnings management. Their most
important result was that the Modified version of the model developed by Jones
(1991) provides the best test to detect earnings management. It generated the fewest
type II errors, which represents cases in which earnings are managed, but are
identified as not. Guay et al. (1996) also evaluated the same five models. Their
findings suggest that the Jones Model and the Modified Jones Model are the most
effective models.
7 The use of two-digit SIC levels represents a trade-off between defining industry groupings narrowly
enough that the Industry Model captures the industry specific effects versus having enough firms in
each industry grouping so that the model can effectively diversify firm specific effects.[]
5
10
15
20
25
30
Equity incentives and earnings management in the U.K.
Second, the most popular and best accepted model in the academic literature seems
to be the Modified Jones Model. Therefore the results of this research will be better
comparable to other studies when the Modified Jones Model is used.
2.2 Compensation contracts
As mentioned in the previous paragraph, compensation contracts are one of the main
reasons for earnings management. The contracts are derived from the issues around
the agency theory. The agency theory is concerned with two problems. The first
problem is that the aims of the agent (financial reporters of the company) are not in
line with those of the principal (stakeholder). Secondly, it is impracticable for the
principal to assess the work of the agent efficiently (Eisenhardt, 1989).
Both agent and principal want to increase their wealth. The principal’s wealth
increases when that of the firms increases. The wealth of the agent increases when it
receives the maximum return for its input (i.e. labour). The problem occurs when the
incentives for the agent to increase the value of the firm are absent, and the agent is
primarily aimed at increasing its value. However, the principal can alter this problem
by adding incentives to the agent in their compensation contract. These incentives
can better align the ambitions of agent and principal.
Before 1986 is was unusual for managers to receive stock-based compensation
(Bergstresser and Philippon 2006). Between 1974-1986 shareholders wealth
increased with $ 1,000 for every $ 3 increase in wealth for the CEO’s (Jensen and
Murphy 1990). During these years therefore, CEO’s had no incentive to increase the
wealth of the firm.
Incentive contracts are designed to eliminate this problem and to align the personal
interests of financial reporters (managers) with those of the stakeholders (investors).
Investors try to increase their return on investment, by increasing earnings within
their investment. Therefore financial reporters should also try to increase true
company earnings.
According to Murphy (1999) compensation contract are designed to align executive
interest with those of the shareholder. Literature divides compensation contracts for
managers into three categories (Merchant and Van der Stede 2007):
1. Fixed salaries;
[]
5
10
15
20
25
30
Equity incentives and earnings management in the U.K.
2. Short-term incentives; and
3. Long-term incentives
2.2.1 Fixed salaries
Although fixed salaries do not have much relation to management performance, most
incentives are based on fixed salary. Other elements within the compensation
contract increase when salary increases (Murphy 1999). Managers that are risk
obverse have a relatively larger part of fixed salary as part of their total remuneration
(Murphy 1999).
2.2.2 Short-term incentives
An example of a short-term incentive is the annual (cash) bonus. Although bonus
plan take many forms, most manager nowadays have a personal bonus plan that
contains a individual performance portion (Murphy 1999). These bonus then can be
achieved through predetermined targets and objectives, that can be both financial
and nonfinancial measurements. In a Towers Perrin survey, 65 of the 68 sample
companies using single performance measurement used accounting indicators as
performance measurement. 62% of companies using multiple performance
measurements used accounting indicators. Performance can be measured in a
number of ways from total earnings to growth rates.
2.2.3 Long-term incentives
Long term incentives are in particular stock options. These options are offered to
management as an incentive for long term earnings at the company. In most cases
these options can be exercised only over a period of time (Murphy 1999; Cheng and
Warfield 2005). More importantly executive options are non-tradable. Considering
these restrictions, managerial compensation contracts involve an increasingly higher
degree of stock compensation. Murphy (1999) even states that stock-based
compensation was most important development in executive compensation in the
1980s and 1990s.
Short-term and long-term compensation are the general compensation that is spoken
about when talking about earnings management. As proved in the Towers Perrin
survey, a large majority of companies (91% of the total sample of 177 companies)
[]
5
10
15
20
25
30
Equity incentives and earnings management in the U.K.
use accounting information to measure performance. Apart from stock-based
compensation managers can obtain shares by purchasing them on the open market.
Core and Larcker (2002) say that some firms expect managers to own a unknown
number of shares of their own company (Core and Larcker 2002).
2.2.4 Why do managers receive stock compensation?
As explained before, there is an information asymmetry between investors and
managers. Managers know the truth about the (financial) performance and the
situation of the company. Investors must rely on the information that is granted to
them by the managers. To add value to the publicized information audit reports are
designed. However, Ronen et al. (2006) claim that audit technology seems to be
imperfect and managers can move within the boundaries set by regulators. Because
regulators leave managers some space in the accounting rules, this creates an
incentive for managers to engage in earnings management.
In an extensive study on equity incentives, Cheng and Warfield (2005) examine the
actions of managers that are compensated through stock options. Due to the
increasing stock-based compensation in the last decades, a managers compensation
largely consists of shares. This is consistent with the incentive alignment investors
want to create. If stock-based compensation increase, a greater portion of manager’s
wealth is invested in a relatively risky asset, i.e. company shares. Managers will
adapt their remuneration package to their to an acceptable risk level, selling shares
at short-term prices. Under the capital asset pricing assumptions, returns on stocks
are positive and stock prices rise under normal economic circumstances. This
causes short-term trading because managers need to constantly adapt their risk
profile (Sivakumar and Waymire 1994; Noe 1999).
As managers have relatively short-term personal incentives and investors often have
a long-term incentive, this could lead financial reporter to report short-term high
earnings. This short-term view could damage long-term interest for the firm and
investors. This phenomenon has been researched in numerous studies (e.g. Jensen
and Meckling 1976; Rajgopal and Shevlin 2002).
[]
5
10
15
20
25
30
Equity incentives and earnings management in the U.K.
2.3 Earnings management and equity compensation
It is clear that extensive studies have been conducted on the subject earnings
management and compensation contracts. Compensation contract are often blamed
for their steer towards earnings management. However Gao and Shrieves (2002) say
that it is not the only incentive for managers to engage in earnings management. In
spite of the fact that there are more incentives, the incentive coming from
compensation contracts is the only form of earnings management that extracts
wealth from the company (Stolowy and Breton 2004).
Currently stock compensation is the biggest component in the executive
compensation package. The primary reason for the introduction of this form of
compensation was to eliminate the short-term orientation of executives. However in
eliminating this short-term awareness, does this form of compensation create a
greater incentive for managers to creatively report earnings? With managers
compensation coupled to firm performance – in a form of earnings –, and current
company earnings linked to stock prices, reporting managers have a seemingly
increased incentive to report colourful earnings.
Current earnings are based on past activities. Why are markets so possessed with
passed activities? Share prices are a reflection of the present value of future cash
flow. Therefore past earnings should have a very small impact on share prices.
Under normal economic situations share prices increase, because analysts’ expect
firms to increase their profit over the years. Put another way, if current earnings are
disappointing, future revenues will be lower than expected, effecting current share
prices. Therefore, current earnings give a good indication of future firm profits (Stein
1989).
Studies have shown that managers are more likely to report earnings greater than
the expectation of the market (investors and analyst’s), when they have a large
portion of stock-based compensation. (Bauman and Shaw 2006). Share prices
increase when firms beat the forecasts of analyst’s.This gives managers an incentive
to increase earnings. However this study does not imply earnings management as a
possible cause for these continuous surprises. Shaw nevertheless, does mention that
firms have even a greater incentive to beat analysts’ forecast by small amounts. This []
5
10
15
20
25
30
Equity incentives and earnings management in the U.K.
could indicate a certain level of income smoothing. These small surprises are also
documented by Cheng and Warfield (2006). Their research has shown that
managers with high equity incentives, are less prone to show large positive earnings
surprises.
Gao and Shrieves (2002) note that income smoothing is a matter of timing. Managers
that receive Long Term Incentive Plans (LTIP) have no profit in managing earnings.
Gao and Shrieves found no positive nor negative relation between LTIP and earning
management. This is because firms cannot manage earnings upwards continuously.
This would result in exorbitant accruals, and could bring the firm into discredit.
However, ensuring that higher earnings (greater than analysts’ expect) come at an
optimal time for the manager, is a timing choice. Gao and Shrieves find that it is very
dependent on the forms of compensation in the contract.
Even though markets expect earnings to be managed, managers caught in the act,
are punished by investors. Palmrose et al. (2004) say that firms lost 10% of the share
price at the announcement of restatements of their earnings. Moreover, monetary
fines and reputation losses are also important risk factors for firms who engage in
earnings management (Karpoff et al. 2008). Disciplinary actions taken by the market
towards managers is not possible, due to limited ability to withdraw past
compensation. However post-restatement compensation plans are significantly lower
(Cheng and Farber 2008).
[]
5
10
15
20
Equity incentives and earnings management in the U.K.
3 Hypotheses
As explained in paragraph 2.2, this research considers that compensation contracts
nowadays consist of three elements; fixed salary, bonus and stock-based
compensation (e.g. stock options). However, the main focus will be on the relation
between equity incentives and earnings management. The relation of earnings
management with the other two components of compensation contracts (i.e. fixed
salary and bonuses) will also be tested. By testing the relation of earnings
management with all three elements of compensation data, the results for the
different elements can be compared among each other. Therefore the relation of
equity incentives and earnings management can be understand better.
In the extant literature there is already a lot of research done on the subject earnings
management. Some of these researches investigated the relation of earnings
management with equity incentives. Gao and Shrieves (2002) say in their study that
equity incentives gives managers an incentive that may lead to earnings
management strategies for maximizing their compensation.
CEO salaries are usually set on an annual basis. In a static setting, salary’s
sensitivity to price movement is zero. Therefore, it seems unlikely that salaries are
positively related to earnings management. Moreover, earnings management seems
to be costly. As explained in the last paragraph of Chapter 2, firms lost 10% of the
share price at the announcement of restatements of their earnings (Palmrose et al.
2004), and earnings management also may result in monetary fines and reputation
loss. Moreover, Gao and Shrieves (2002) find in their study that salaries are
negatively related to earnings management. Therefore, both logic and empirical
evidence suggest that earnings management is a costly activity. It therefore seems
reasonable that a manager with a relatively large amount of fixed salary, compared to
the other two components (i.e. bonus and stock-based), would have an incentive to
reduce the extent of earnings management, and so reduce the costs. This leads to
the following hypothesis:
H1: Fixed salary is negatively related to the use of
[]
5
10
15
20
25
30
Equity incentives and earnings management in the U.K.
discretionary accruals as a tool for earnings management.
Bonus compensation might also create incentives to engage in earnings
management, because some bonus plans might contain nonlinearities (Healy 1985;
Gaver 1995). Gao and Shrieves (2002) found in their study, that bonuses are
positively related to earnings management. On the other hand, bonus plans are
highly firm-specific, because of the structure and the pay-performance relation. This
makes it difficult to predict the magnitude of the relation between bonuses and
earnings management, but the expectation is a positive relation between bonus
compensation and discretionary accruals. This leads to the second hypothesis:
H2: Bonus compensation is positively related to the use of
discretionary accruals as a tool for earnings management.
Managerial compensation frequently contains stock-based compensation to align the
interest of managers and outside shareholders and reduce agency problems. The
results of Bergstresser and Philippon (2006) suggest that high equity incentive CEO’s
engage more in earnings management than low equity incentive CEO’s. They find
that CEO’s whose overall compensation is more sensitive to company share prices,
lead firms with higher levels of earnings management. Cheng and Warfield (2005)
examined the link between managers’ equity incentives, arising from stock-based
compensation, and earnings management. First they find high incentive managers
are more likely to sell shares a year after earnings announcements. Furthermore they
find that managers with high equity incentives are more likely to report earnings that
meet or just beat analysts’ forecasts. Their results indicate that equity incentives lead
to incentives for earnings management. Also, Gao and Shrieves (2002) find results
that indicate that the extent of stock-based compensation are positively related to
earnings management. Now that the incentives for managers are so closely tied to
the stock price of a firm it may have the perverse effect of stimulating managers to
manipulate their earnings (Bergstresser and Philippon 2006).
This thesis extends the previous cited studies by examining how stock-based
compensation relates to earnings management. The predicted linkage between
stock-based compensation and earnings management is as follows. Assume that a
[]
5
10
15
20
25
30
Equity incentives and earnings management in the U.K.
manager receives a large component of his/her remuneration in the form of stock-
based compensation. He/she can increase the value of that component of stock-
based compensation by taking actions to reduce the exercise price. This prediction
suggests an incentive for managers to engage in earnings management. If, for
example, a manager expects to receive stock options, he/she can reduce current
earnings through discretionary accruals. The effect could be a reduction in the
exercise price of the stock options on the award date. By doing this, the manager
increases the chance that the options are ‘in the money’. Therefore, the third
hypothesis is:
H3: Stock-based compensation is positively related to the use of
discretionary accruals as a tool for earnings management.
In the next chapter the research design is described.
4 Research design
In this chapter the variables used for this research will be discussed. The approach
will be similar to that of Bergstresser and Philippon (2006) and Gao and Shrieves
(2002). In conformity with other papers that investigate earnings management, this
research will make use of a field study. For this study four main variables will be
used. The expectation is that the relative size of stock-based compensation will
determine the extent of earnings management. Furthermore the relative size of
salary and bonus will be used to see whether these variables can also determine the
extent of earnings management. Therefore earnings management will be the
dependant variable, and stock-based compensation, salary, and bonus will be the
independent variables.
First the data and sample will be outlined in paragraph 4.1. In the second paragraph
the dependant variable will be described. Finally the independent variables will be
discussed in paragraph 4.3.
[]
5
10
15
20
25
Equity incentives and earnings management in the U.K.
4.1 Data and sample
As mentioned earlier in this thesis, most research done until now, focuses on
companies in the U.S. This research investigates the European situation. The U.K.
was one of the first countries in Europe where companies were required to report on
the remunerations of their directors. Therefore this research will focus on companies
based in the U.K.
Listed companies on the FTSE 100 index from the period 2005 - 2006 will be used as
the sample for this research. The FTSE 100 index from April 13 th 2009 is used as the
start of the sample selection. From the 100 listed firms on that date, 8 firms are
excluded because they did not exist in 2005 and/or 2006, or because they were not
listed in 2005 and/or 2006 on the FTSE 100 index. Furthermore 4 firms are excluded
because there is not enough information regarding the compensation data available
in the annual reports. Therefore the actual sample consists of 88 firms and 176
entries. Appendix B contains a list of all the listed firms on the FTSE that are taken
into account in this study.
This research focuses on 2005 and 2006 and not on more recent years because of
two main reasons. First of all because the global financial crisis started in 2007. So
the figures from 2007 until now are less comparable with those of 2005 and 2006.
Second, there is more data available for 2005 and 2006. When the writing process
regarding this thesis started, the annual reports for 2008 for most companies were
not available yet.
Because of these complications in more recent years, the data sample is from 2005
to 2006. All the financial data that is needed for the earnings management
component, and compensation data from the CEO’s that is needed for the
compensation component, will be gathered from the annual reports of the
companies.
4.2 Dependant variable
The dependant variable in this study is earnings management. An accruals model
(the Modified Jones Model) will be used as a measure of earnings management. The
Modified Jones Model takes place in two stages. The first stage of the Modified
[]
5
10
15
20
25
30
Equity incentives and earnings management in the U.K.
Jones Model is identical to the original Jones Model, therefore they both are
described in this paragraph.
The Jones ModelThe Jones model (Jones 1991) assumes that differences between cash flow and
earnings are caused by the accruals. First the total accruals must be separated into a
discretionary and a non-discretionary component (Bergstresser and Philippon 2006).
See equation 4-1 below:
DAi ,t=TA i ,t+NDA i ,t
(4-2)
Where:
DAi,t Discretionary Accruals for firm i in year t;
TAi,t Total Accruals for firm i in year t;
NDAi,t Non-Discretionary Accruals for firm i in year t.
Jones, in contradiction to prior research8, keeps into account that accruals might
change (increase of decrease) due to normal activities (non-discretionary accruals).
The Jones model is preformed in two stages. In the first stage the total accruals are
regressed against the changes in revenue and level of Property, Plant and
Equipment (PPE). This estimates the normal accruals. The next stage, stage two,
estimated regression is combined with the total accruals, changes in revenue and
PPE over the event year. Deviations from the estimated regression depict the non-
discretionary accruals9. The Jones model is illustrated as (Ronin and Yaari 2008):
NDA i , t
Ai ,t−1=
TAi , t
A i ,t−1=α1 i[ 1
Ai , t−1 ]+α 2i[ ∆ REV i , t
A i ,t−1 ]+α 3 i[ PPE i ,t
A i ,t−1 ]+εi ,t(4-3)
Where:
NDAi,t Non-Discretionary Accruals for firm i in year t;
Ai,t-1 Assets for firm i in year t-1;
TAi,t Total Accruals for firm i in year t;
8 See Ronin and Yaari (2008) Chapter 10 for historical overview of accrual based Methodology. 9 Total accrual = Normal Accruals (estimated in stage 1) + Discretionary accruals
[]
5
10
15
20
25
30
Equity incentives and earnings management in the U.K.
∆REVi,t Changes in revenue for firm i in year t;
PPEi,t Property, Plant and Equipment for firm i in year t;
εi,t Error term for firm i in year t;
α1i, α 2i, α 3i Coefficients for firm i.
Total accruals are calculated by the difference between earnings and operational
cash flow (Dechow et al. 1995):
TAi , t=Earningsi , t+CFOi , t
(4-4)
Where:
TAi,t Total Accruals for firms i period t;
Earningsi,t Earnings before extra ordinary income for firm i in year t;
CFOi,t Cash flow from operation for firm i in year t.
When measuring earnings management, | TA it | will be used. The Jones model
deflates all variables (ΔREV and PPT) with total assets from t-1 (beginning-of-the-
year). This overcomes hetroskedasticity10 (Ronin and Yaari 2008).
The coefficients αχ are industry specific parameters. They estimate how different
industries, with difference in capital intensity, are influenced by the variables (Assets,
Revenue and PPT). Capital intensive industries will have a relatively greater PPE
element than knowledge based industries.
Using only the standard Jones model would be short-sighted. The greatest weakness
lies in the fact that the Jones model does not take into account the ability of
managers for sales-based manipulation (Peasnell et al. 2000), because accruals are
deflated for changes in revenue. Jones considers these changes, as changes in
economic activity. Therefore Dechow et al. (1995) modified the original Jones model
to incorporate the possible changes in revenue that are discretionary.
The Modified Jones Model
10 “... when residuals at each end of the [dependant] variable(s) have unequal variances.” Therefore
the spread in the data is different. Source: Fields (2002)[]
5
10
15
20
25
30
Equity incentives and earnings management in the U.K.
The model that will be used to determine the non-discretionary accruals is the
modified Jones model (Dechow et al. 1995). The model finds its origin in the
standard Jones Model. However, Dechow et al. (1995) have managed to incorporate
the ability to detect sales-based manipulations.
The modified Jones model is illustrated as (Ronin and Yaari 2008):
NDA¿
A¿−1=
TA¿
A¿−1=α1[ 1
A ¿−1 ]+α 2 i[ (∆ REV ¿−∆ AR¿ )A ¿−1 ]+α3 i[ PPE¿
A ¿−1 ]+ε¿
(4-5)
Where:NDAit Non-Discretionary Accruals for firm i in year t;
Ait-1 Assets for firm i in year t-1;
TAit Total Accruals for firm i in year t;
∆REVit Changes in revenue for firm i in year t;
∆ARit Changes in accounts Receivables for firm i in year t;
PPEit Property, Plant and Equipment for firm i in year t;
εit Error term for firm i in year t;
α1i, α 2i, α 3i Coefficients for firm i.
Like the Jones model, the modified Jones model takes place in two stages. The first
stage is identical, where the estimated accruals are defined. It is important to note
that for estimating the NDA, equation 4-2 will be used (Bergstresser and Philippon
2006; Jones 1991). Dechow et al. (1995) adopted this approach from the original
Jones Model (1991). Equation 4-4 will be used when determining the actual NDA.
4.3 Independent variable
The independent variables will be the type of compensation, for the different
hypotheses. For this research, the relative size of the compensation type will be used
to measure compensation. Relative figures are better comparable with each other. It
is generally accepted that absolute compensation differences between managers are
caused by firm characteristics.
To measure the relative power of the different compensation types (i.e. stock-based,
fixed salary, and bonus) an approach used by Bergstresser and Philippon (2006) will []
5
10
15
20
25
30
Equity incentives and earnings management in the U.K.
be adopted.
EquityFirst the EQUITY_RATIOi,t will be constructed. This ratio measures the relative size
of stock-based compensation in the overall compensation of the CEO of firm i in year
t, as shown below:
EQUITY RATIOi ,t=STOCK i ,t
(STOCK i ,t+SALARY i ,t+BONUSi , t )(4-5)
Where:
STOCKi,t Stock-based compensation of the CEO of firm i in year t;
SALARYi,t Fixed salary of the CEO of firm i in year t;
BONUSi,t Bonus compensation of the CEO of firm i in year t.
SalarySecond, the salary element of compensation will be measured. This ratio measures
the relative size of fixed salary in the overall compensation of the CEO of firm i in
year t:
SALARY RATIOi ,t=SALARY i ,t
(STOCK i , t+SALARY i, t+BONUSi ,t ) (4-6)
BonusFinally, a measure for the bonus-incentives is constructed. This measure calculates
the relative size of bonus compensation in the overall compensation of the CEO of
firm i in year t:
BONUSRATIOi ,t=BONUSi ,t
(STOCK i , t+SALARY i ,t+BONUSi ,t ) (4-7)
When these equations are applied to the data, it defines for the different types of
compensation what their relative size is. Then the relative sizes can be compared
[]
5
10
15
20
25
30
Equity incentives and earnings management in the U.K.
with the results of the Modified Jones Model to see how the compensation types are
related discretionary accruals.
In chapter 5 the results are outlined.
[]
5
Equity incentives and earnings management in the U.K.
5 Data analysis and results
The previous chapter explained the selection procedures in constructing a sample to
test the hypotheses. The total collected sample consists of 88 FTSE 100 index listed
firms and contains data over 2005 and 2006.
In this chapter the results from the research will be described. Paragraph 5.1 will
elaborate on the descriptive statistics and how the discretionary accruals by means
of the Modified Jones Model are computed. Next the hypotheses will be tested using
correlation testing and the independent-samples t-test. The results of these tests will
be outlined in paragraph 5.2.
5.1 Discretionary accruals and descriptive statistics
This paragraph will elaborate on the discretionary accruals and descriptive statistics.
First the discretionary accruals are determined. In the Modified Jones Model, the
error term is the discretionary accrual for a firm. On page 34 the modified Jones
model is illustrated as:
NDA¿
A¿−1=
TA¿
A¿−1=α1[ 1
A ¿−1 ]+α 2 i[ (∆ REV ¿−∆ AR¿ )A ¿−1 ]+α3 i[ PPE¿
A ¿−1 ]+ε¿
(4-4)
Where:
NDAit Non-Discretionary Accruals for firm i in year t;
Ait-1 Assets for firm i in year t-1;
TAit Total Accruals for firm i in year t;
∆REVit Changes in revenue for firm i in year t;
∆ARit Changes in accounts Receivables for firm i in year t;
PPEit Property, Plant and Equipment for firm i in year t;
εit Error term for firm i in year t;
α1i, α 2i, α 3i Coefficients for firm i.
To calculate the error term (ε ¿), first the coefficients (α 1 , α 2 i∧α 3 i¿ have to be
calculated. By means of a linear regression model the coefficients are calculated with
[]
5
10
15
20
25
Equity incentives and earnings management in the U.K.
SPSS. See table 1 below for the coefficients collected from the output of the
regression model.
Coefficient Unstandardized coefficients (B)
α 1 1,23
α 2 i 0,03
α 3 i 0,34
Table 1 Coefficients
The unstandardized coefficients are used and not the standardized coefficients
because the standardized coefficients are converted to the same scale so that they
can be compared. This research does not compare the different variables so
therefore the unstandardized coefficients are used.
The output from SPSS further shows the adjusted R Square. The adjusted R Square
measures the proportion of the variation in the dependent variable (total accruals
scaled by assets) accounted for by the explanatory variables. For this model the
Adjusted R Square is 0,485 (48,5%), which is a reasonable percentage.
Now all variables are available, the error term (ε ¿) for each of the 176 companies is
determined. For the error terms (discretionary accruals) see appendix B on page 62.
The error terms in appendix B only concern absolute values. Even though earnings
management involves both positive and negative values of accruals, it does not
matter whether the value of the error term is positive or negative for this study. This is
because the magnitude of discretionary accruals is important, not whether the effect
is positive or negative. Now that the error terms (discretionary accruals) are
determined, the descriptive statistics over the data that is used in this research can
be computed.
From the 1st of January 2005 all listed European Union companies are required to
comply to the International Financial Reporting Standards (IFRS). Therefore the data
from 2005 and 2006, which is used in this research, is comparable. For this reason
the descriptive statistics for the data of 2005 and 2006 are calculated and presented
as one dataset.[]
5
10
15
20
25
Equity incentives and earnings management in the U.K.
For the descriptive statistics the mean, median, standard deviation, minimum and
maximum for the years 2005 and 2006 together are computed. The descriptive
statistics are computed for the error term (discretionary accruals), the accrual data
and for the compensation data. The compensation data consist of three different
types of compensation; fixed salary, stock-based compensation and bonus. For the
descriptive statistics, see table 2 on the next page.
The statistics in table 2 show that, concerning the compensation data, fixed salary
has the highest mean (0,41) with respect to stock-based compensation (0,31) and
bonus compensation (0,28). Further stock-based compensation has the largest
standard deviation (0,23). See table 2 on the next page for detailed information about
the descriptive statistics.
5.2 Results
As described in Chapter 3, the hypotheses in this research is are:
1. Fixed salary is negatively related to the use of discretionary accruals as a tool for earnings management.
2. Bonus compensation is positively related to the use of discretionary accruals
as a tool for earnings management.
3. Stock-based compensation is positively related to the use of discretionary
accruals as a tool for earnings management.
To test the hypotheses, first a correlation test will be performed in paragraph 5.2.1 to
obtain understanding about the strength of the relationship between the different
types of compensation and discretionary accruals. Furthermore an independent-
samples t-test will be performed, see paragraph 5.2.2, to test whether there is a
significant difference in mean scores of discretionary accruals for each of the
compensation types.
[]
5
10
15
20
25
Equity incentives and earnings management in the U.K.
Statistics Error term Accrual data Compensation dataDiscretionary accruals (1) (2) (3) Fixed salary Stock-based Bonus
Mean 0,16 0,24 0,10 0,33 0,41 0,31 0,28
Median 0,11 0,19 0,06 0,20 0,37 0,35 0,26
Std. deviation 0,17 0,21 0,28 0,39 0,21 0,23 0,17
Minimum 0,01 -0,19 -0,45 0,00 0,04 0,00 0,00
Maximum 1,10 1,36 3,13 2,94 1,00 0,88 0,82
Table 2 Descriptive statistics
(1) = Total accruals (earnings before extraordinary income + cash flow from operation) divided by total assets
(2) = (Changes in revenue minus changes in accounts receivable) divided by total assets
(3) = Property, plant and equipment divided by total assets
[]
5
Equity incentives and earnings management in the U.K.
5.2.1 Correlation testing
Through correlation testing the strength and the direction of the linear relationship
between two variables can be determined. The Pearson Product-Moment Coefficient
(Pearson’s r) is used to determine the correlation. It can take on values from -1 to +1.
The sign out the front indicates whether there is a positive or a negative correlation.
A positive correlation means that as one variable increases, so does the other and a
negative correlation means that as one variable increases the other decreases. The
size of the absolute value provides an indication of the strength of the relationship.
Pearson’s r is +1 or -1 in the case of a perfect positive (increasing) or negative
(decreasing) linear relationship. If Pearson’s r is 0, then there is no linear relationship
(uncorrelated). Different authors suggest different interpretations for the outcome
from the correlations test. Cohen (1988) suggests the following guidelines:
Weak correlation: r = 0,10 to 0,29
Moderate correlation: r = 0,30 to 0,49
Strong correlation: r = 0,50 to 1,00
This rule of thumb is widely used in the extant literature. Therefore these guidelines
are used as a guidance for the interpretation of the results in this research. Caution
needs to be exercised in interpretation of the results from correlation testing. A
correlation test only determines the strength of the linear relationship, not whether
there is a causal relationship or not.
As explained in paragraph 4.3, the compensation variable consists of three types of
compensation; fixed salary, bonus compensation and stock-based compensation.
The different types of compensation are compared for their correlation with
discretionary accruals. For the 88 companies that are subject in this research, the
compensation data consists of these three types of compensation for the years 2005
and 2006. That means 176 data entries. See table 3 on the next page for an
overview of the results of the Pearson Product-Moment Correlations Test.
[]
5
10
15
20
25
30
Equity incentives and earnings management in the U.K.
Group Pearson’s r Sign. (1-tailed) N
Fixed salary 0,14 0,03 176
Bonus compensation 0,03 0,37 176
Stock-based compensation - 0,15 0,02 176
Table 3 Correlation test overall results
First, the Pearson’s r is analyzed. The results in table 3 show a positive weak
correlation (between 0,10 and 0,29) with discretionary accruals for fixed salary.
Regarding bonus compensation almost no linear relationship with discretionary
accruals is found. These two variables seem uncorrelated. Furthermore, table 3
shows a negative weak correlation with discretionary accruals for stock-based
compensation. This means that when stock-based compensation increases,
discretionary accruals decreases.
Next, the significance level (one-tailed) is assessed. The significance level indicates
how much confidence can be obtained from the results. As a cut-off for this research
results below 0,01 are considered highly significant, results between 0,01 and 0,05
are considered significant, results between 0,05 and 0,10 are considered less
significant and results above 0,10 are considered insignificant.
The correlation test is performed one-tailed, because the direction of the relationship
is predicted in the hypothesis (positive or negative relation). In this case therefore,
the results for fixed salary and stock-based compensation are statistical significant
because the p-values are below 0,05. The results for bonus compensation however
are insignificant (p-value of 0,37).
In summary, the results seem to make clear that there is a positive linear relationship
for fixed salary and a negative linear relationship for stock-based compensation. The
more CEO’s remuneration package consists of fixed salary, the larger (positive linear
relation) the discretionary accruals in the annual reports. Further, the more CEO’s
remuneration package consists of stock-based compensation, the smaller (negative
linear relation) the discretionary accruals in the annual reports. Yet, the strength of
both correlations is weak.
The results therefore reject H1 and H3 because it was suspected that fixed salary
would have a negative relation and stock-based compensation would have a positive
[]
5
10
15
20
25
Equity incentives and earnings management in the U.K.
relation with discretionary accruals. For bonus compensation a positive correlation
with discretionary accruals was hypothesized. However no linear relationship with
discretionary accruals is found, therefore H2 is also rejected.
Nevertheless, caution should be exercised in the interpretation of the results.
Correlation provides an indication that there is a linear relationship between two
variables. It does not indicate that one variable causes the other. The correlation
between two variables (A and B for example) could be due to the fact that A causes
B, that B causes A, or that an additional variable (C) causes both A and B. Even
when there seems to be a clear cause and effect relationship, a correlation alone is
not sufficient evidence for a causal relationship. So from the results in this paragraph
only conclusions about the strength and the direction of the correlation are justified.
5.2.2 Independent-Samples T-Test
The second test in this research about the relation between earnings management
and variable compensation is the t-test. A t-test is used to examine whether the
mean for two groups deviate from each other. There are two t-tests to compare the
group means:
1. Independent-Samples T-Test, for comparison of two independent groups;
2. Dependent-Samples T-Test, for comparison of two dependent groups.
In this research the independent-samples t-test is used because the research is
about two independent groups. For this purpose the data for each type of
compensation is subdivided into three groups. On the one hand group 1 (CEO’s with
a relative large size of fixed salary, bonus compensation or stock-based
compensation), and on the other hand group 2 (CEO’s with a relative small size of
fixed salary, bonus compensation or stock-based compensation). Group 1 and group
2 both consist of data for 60 CEO’s. For example group 1 from fixed salary consists
of the 60 CEO’s with the largest relative size of fixed salary, and group 2 of the 60
CEO’s with the smallest relative size of fixed salary. The 56 CEO’s in between those
2 groups are excluded for the independent-samples t-test. This group of CEO’s is
excluded because in this research the group with the highest relative size of the
different types of compensation is compared to the group with the lowest relative
[]
5
10
15
20
25
30
Equity incentives and earnings management in the U.K.
size. Therefore the ‘middle’ group has no function and it is excluded from this
research.
The independent-samples t-test will examine whether there is a statistically
significant difference in the mean scores of discretionary accruals between the two
groups. In this research this means whether there is a statistically significant
difference in the mean scores of discretionary accruals between group 1 and group 2
for each of the three different compensation types. For example the independent-
samples t-test examines whether there is a statistically significant difference in the
mean scores of discretionary accruals between group 1 and group 2 for fixed salary.
Two important assumptions are made regarding the results. The first assumption is
about the results of Levene’s test of equality of variances. This tests whether the
variance of scores for the two groups is the same. The outcome determines which of
the t-values SPSS provides is the correct one to use. If Levene’s p is above 0,05,
then equality of variance is assumed. The top row of the output from SPSS will be
used. If Levene’s p is below 0,05, then it is assumed there is not equality of variance.
In this case the results from the second row of the output will be used.
Secondly, SPSS’s output shows the significance level two-tailed. For this research
one-tailed significant levels should be determined because the direction of the
relationship is predicted in the hypotheses. Therefore the two-tailed significance level
from the output of SPSS is divided by two to compute the one-tailed significance
level. Like for the correlation test the same assumption about significance is being
made for the t-test. Results below 0,01 are considered highly significant, results
between 0,01 and 0,05 are considered significant, results between 0,05 and 0,10 are
considered less significant and above 0,10 results are considered insignificant.
In the next sections the results of the independent-samples t-test will be presented.
Independent-Samples T-Test for fixed salaryFirst the independent-samples t-test regarding fixed salary is conducted to compare
the mean scores of discretionary accruals for CEO’s in group 1 and CEO’s in group
2.
[]
5
10
15
20
25
30
Equity incentives and earnings management in the U.K.
The output from SPSS shows a significance level of 0,02 for the Levene’s test of
equality of variances. Because this is below the cut-off of 0,05, as explained on the
previous page, the results from the second line in the table, ‘equal variances not
assumed’, are used. For the results of the independent-samples t-test for fixed
salary, see table 4 below.
Fixed salary Results
Mean Group 1 (high) 0,17
Mean Group 2 (low) 0,13
Std. deviation group 1 (high) 0,20
Std. deviation group 2 (low) 0,10
T-value 1,351
Significance (1-tailed) 0,09
Table 4 T-test fixed salary
The results show there is a small significant difference in the mean scores for group
1 (median = 0,17, SD = 0,20) and group 2 (median = 0,13, SD = 0,10); t = 1,351, df
= 88, p = 0,09 (one-tailed). This is because the significance level (0,09) is between
the cut-off of 0,05 and 0,10, mentioned on the previous page.
This means a small significant difference is found in the mean scores of discretionary
accruals for CEO’s with the highest relative size of fixed salary and CEO’s with the
lowest relative size of fixed salary. In fact, the results make clear that for the
magnitude of discretionary accruals, it does matter to which proportion a CEO is
remunerated through fixed salary. The more a remuneration package consists of
fixed salary, the more discretionary accruals are distinguished in the annual report.
Independent-Samples T-Test for bonus compensationNext the t-test is conducted for bonus compensation. The significance level of
Levene’s test of equality of variances, showed in the output from SPSS, is 0,55. This
is above the cut-off of 0,05, mentioned on the previous page. This means the
assumption of equal variances has not been violated. Therefore, the results from the
first line of the table, ‘equal variances assumed’, are used. See table 5 on the next
page for the results.
[]
5
10
15
20
25
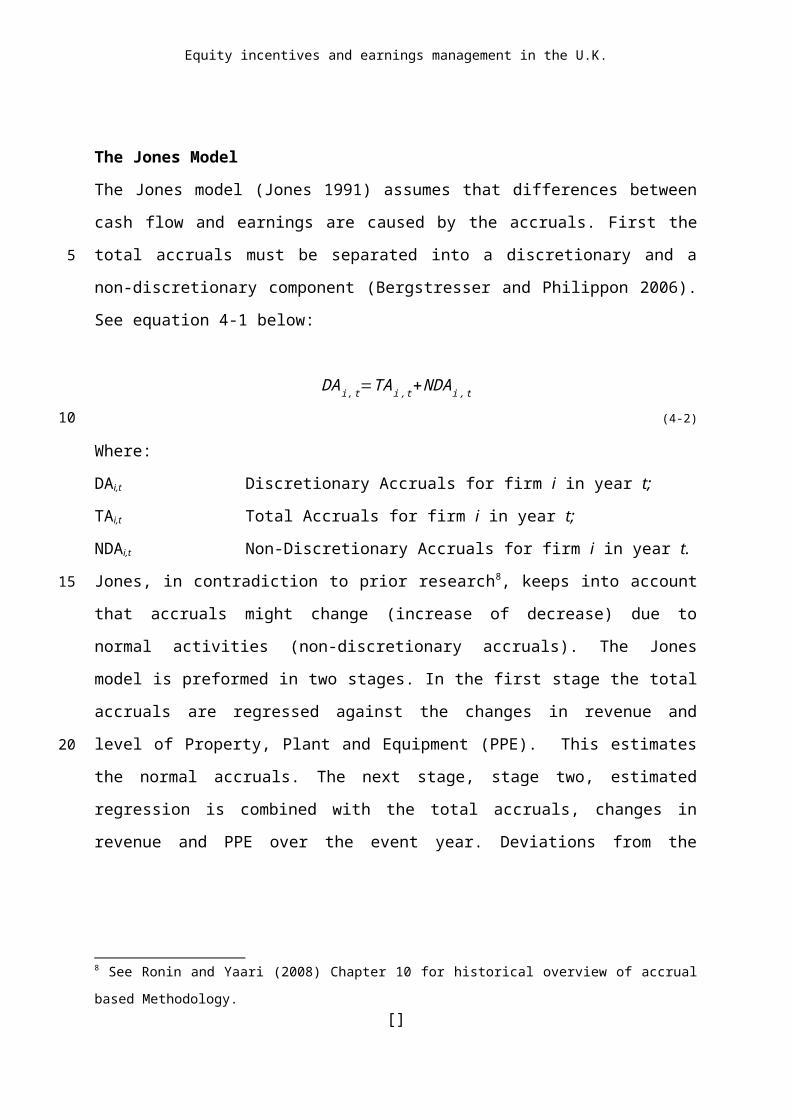
Equity incentives and earnings management in the U.K.
Bonus compensation Results
Mean Group 1 (high) 0,17
Mean Group 2 (low) 0,17
Std. deviation group 1 (high) 0,17
Std. deviation group 2 (low) 0,19
T-value 0,138
Significance (1-tailed) 0,45
Table 5 T-test bonus compensation
The independent t-test shows no significant difference in the mean scores of
discretionary accruals between group 1 (median = 0,17, SD = 0,17) and group 2
(median = 0,17, SD = 0,19); t = 0,138, df = 118, p = 0,45 (one-tailed). This is because
the significance level (0,45) is well above the cut-off of 0,10 , explained on page 44.
Therefore, no significant difference in the mean scores for discretionary accruals
between CEO’s with the highest relative size of bonus compensation and CEO’s with
the lowest relative size of bonus compensation is ascertained. This means that for
the magnitude of discretionary accruals, it does not matter to which proportion a
CEO’s remuneration package consists of bonus compensation.
Independent-Samples T-Test for stock-based compensationFinally a t-test is conducted to compare the mean scores regarding discretionary
accruals for CEO’s in group 1 and group 2 of stock-based compensation. The output
from SPSS shows a significance level of 0,003 for the Levene’s test of equality of
variances. This is below the cut-off of 0,05, mentioned on page 44. It means the
variances for the two groups are not the same. Therefore the results from the second
line of the table, ‘equal variances not assumed’, are used. For the results of the t-test,
see table 6 on the next page.
The results in table 6 show a highly significant difference in the mean scores of
discretionary accruals between group 1 (median = 0,13, SD = 0,13) and group 2
(median = 0,20, SD = 0,22); t = -2,26, df = 98, p = 0,01 (one-tailed). In other words,
CEO’s from group 2 (low equity incentive CEO’s) have a statistically significant
higher mean score of discretionary accruals than CEO’s from group 1 (high equity
incentive CEO’s).
[]
5
10
15
20
25
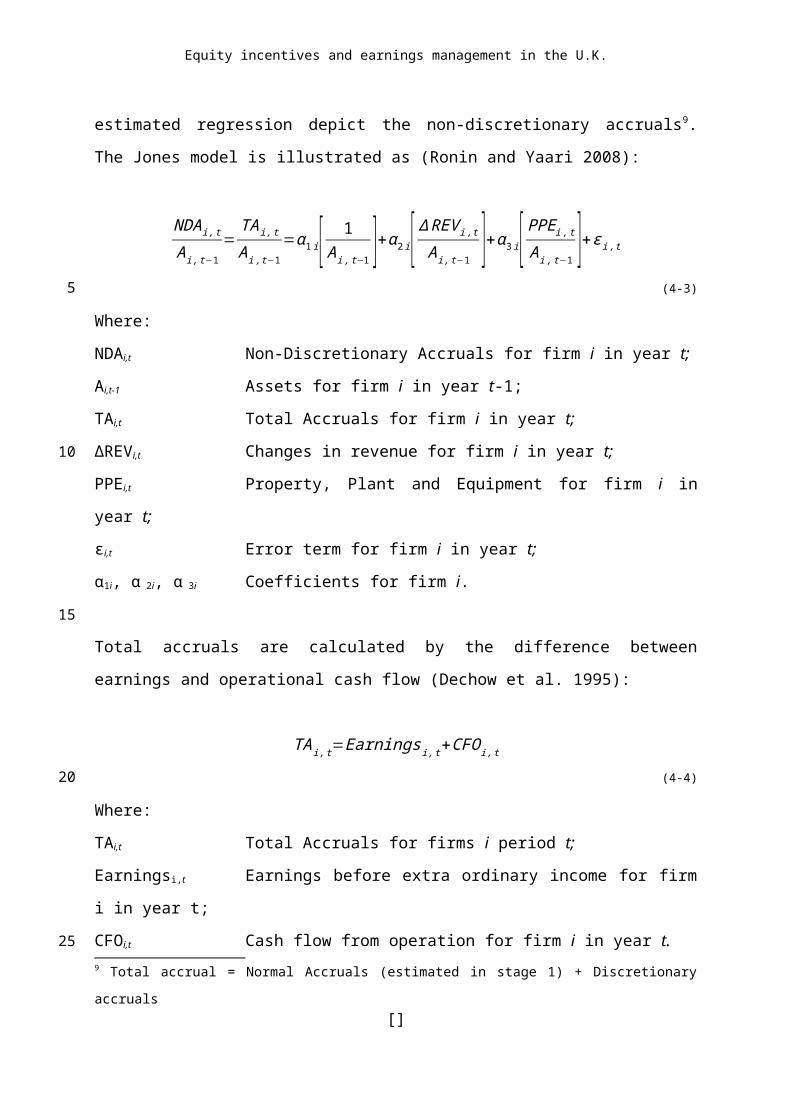
Equity incentives and earnings management in the U.K.
Stock-based compensation Results
Mean Group 1 (high) 0,13
Mean Group 2 (low) 0,20
Std. deviation group 1 (high) 0,13
Std. deviation group 2 (low) 0,22
T-value -2,26
Significance (1-tailed) 0,01
Table 6 T-test stock-based compensation
Because there is a highly significant difference in discretionary accruals between
CEO’s with the highest relative size (group 1) and the lowest relative size (group 2) of
stock-based compensation, the results seem to indicate that the extent of stock-
based compensation has impact on the magnitude of discretionary accruals.
In summary it appears that for fixed salary there is a small significant difference in the
mean scores of discretionary accruals between CEO’s from group 1 and CEO’s from
group 2. The more a remuneration package consists of fixed salary, the more
discretionary accruals are distinguished in the annual report. These results therefore
seem to reject H1 that fixed salary is negatively related to discretionary accruals.
Also for bonus compensation the results reject the hypothesis (H2). It was assumed
that bonus compensation is positively related to discretionary accruals. The results
however show no significant difference in the mean scores of discretionary accruals
for CEO’s with a relative high and CEO’s with a relative low bonus compensation
package. Therefore H2 is rejected.
Regarding stock-based compensated the results show that there is a highly
significant difference in the mean scores of discretionary accruals between CEO’s
from group 1 and CEO’s from group 2. However, the observed relation is negative.
Low equity incentive CEO’s have a significant higher mean score of discretionary
accruals than high equity incentive CEO’s. Therefore the hypothesis (H3) that stock-
based compensation is positively related to discretionary accruals is rejected.
In the next chapter the conclusion and the limitations from this research and
directions for future research are described.
[]
5
10
15
20
25
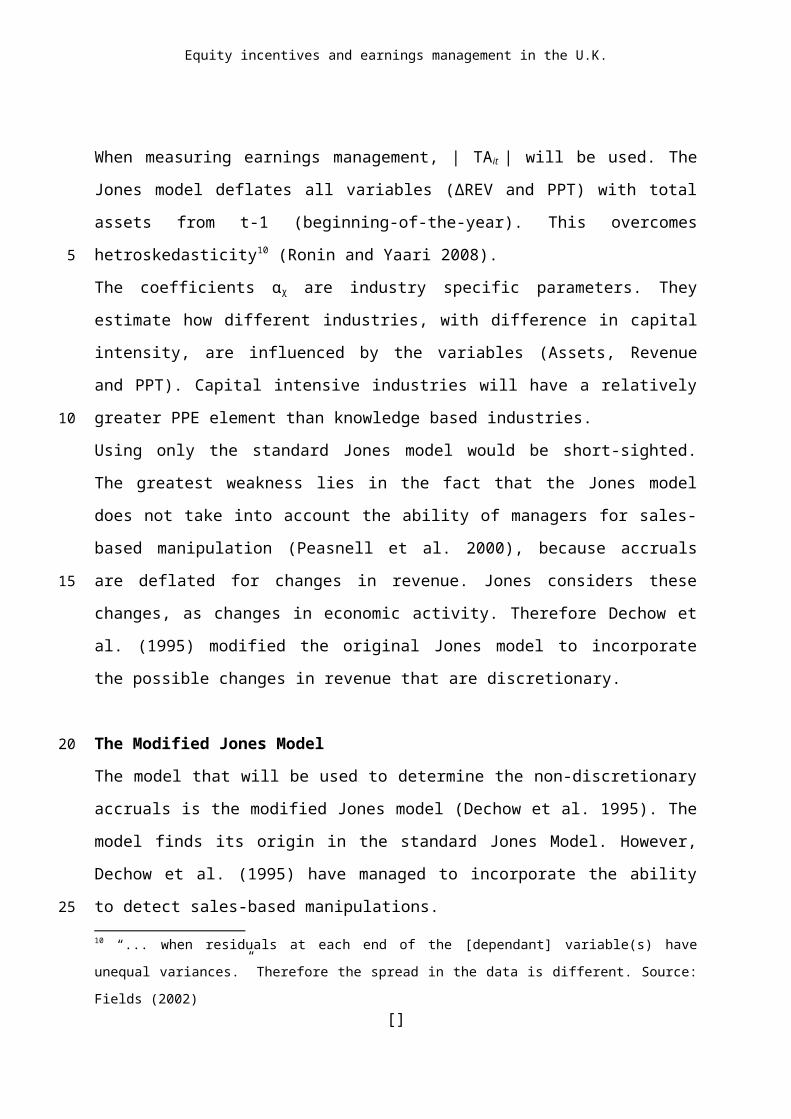
Equity incentives and earnings management in the U.K.
6 Conclusion, limitations and future research
In this final chapter the conclusions to the thesis are described. To provide an answer
to the research question as formulated in the introduction to this thesis, several
hypotheses were developed in chapter 3. In the first paragraph of this chapter the
research question is answered. Secondly, in paragraph 6.2 the theoretical and
empirical conclusions to the thesis are described. The final paragraph, paragraph
6.3, discusses the most important limitations of the methodology used and gives
directions for future research.
6.1 Research question
In this thesis the relative size of fixed salary, (cash) bonus compensation and stock-
based compensation on the use of discretionary accruals as a tool for earnings
management is examined. The purpose of this thesis is to give insight into the
relation between equity incentives (stock-based compensation) and earnings
management. The findings enhance the understanding of the relationship between
equity incentives and earnings management.
After introducing the topic, formulating the purpose of this research and the research
question, the relevant academic literature on earnings management, compensation
contracts and the relation between earnings management and stock-based
compensation is reviewed. Subsequently, three hypotheses were formulated, which
were empirically tested in order to come to an answer on the research question:
What is the relation between equity incentives and earnings management in the U.K.?
In summary, it can be concluded that, based on this research, evidence is found that
stock-based compensation has a negative relationship with discretionary accruals.
Further this research has proven that low equity incentive CEO’s have significant
higher mean scores of discretionary accruals than high equity incentive CEO’s. This
[]
5
10
15
20
25
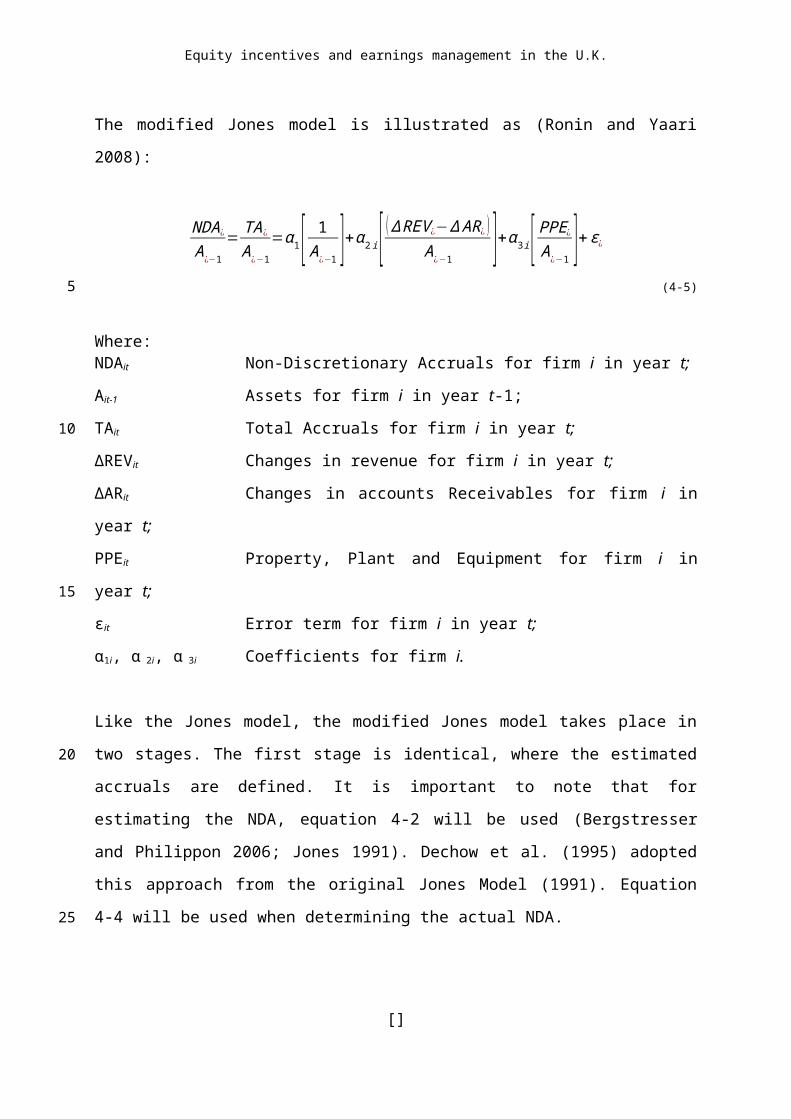
Equity incentives and earnings management in the U.K.
rejects the hypothesis that stock-based compensation is positively related to
discretionary accruals.
6.2 Theoretical and empirical conclusions
There are three hypotheses, based on the review of the relevant academic literature,
which are tested in this research. Some results of this research support findings in
the academic literature, most findings however oppose the academic literature. The
first hypothesis states that fixed salary is negatively related to the use of discretionary
accruals as a tool for earnings management. Gao and Shrieves (2002) found in their
study that salary is significantly negatively associated with the absolute value of
discretionary accruals (scaled by asset size). The results in this research seem to be
oppose the findings of Gao and Shrieves. From the results it appears that fixed
salary has a weak positive relationship with discretionary accruals. Furthermore it
appears that there is a small significant difference in the mean scores of discretionary
accruals between CEO’s with a relative high and CEO’s with a relative low size of
fixed salary as part of their total remuneration package. The more a remuneration
package consists of fixed salary, the more discretionary accruals are distinguished in
the annual report. Therefore the first hypothesis is rejected.
The second hypothesis states that bonus compensation is positively related to the
use of discretionary accruals as a tool for earnings management. Healy (1985) and
Gaver (1995) found that bonus compensation might also create incentives to engage
in earnings management. Further Gao and Shrieves (2002) found that bonuses are
positively related to earnings management intensity. The results in this thesis oppose
the findings in the academic literature because no (or a very weak) positive
relationship between bonus compensation and discretionary accruals is found.
Moreover, no significant difference in the mean scores of discretionary accruals is
found for CEO’s with a relative high and CEO’s with a relative low size of bonus
compensation. Therefore the second hypothesis is also rejected.
The final hypothesis states that stock-based compensation is positively related to the
use of discretionary accruals as a tool for earnings management. The results show a
weak negative relationship between stock-based compensation and discretionary
accruals. Moreover, it appears from the results that low equity incentive CEO’s have
significant higher mean scores of discretionary accruals than high equity incentive
[]
5
10
15
20
25
30
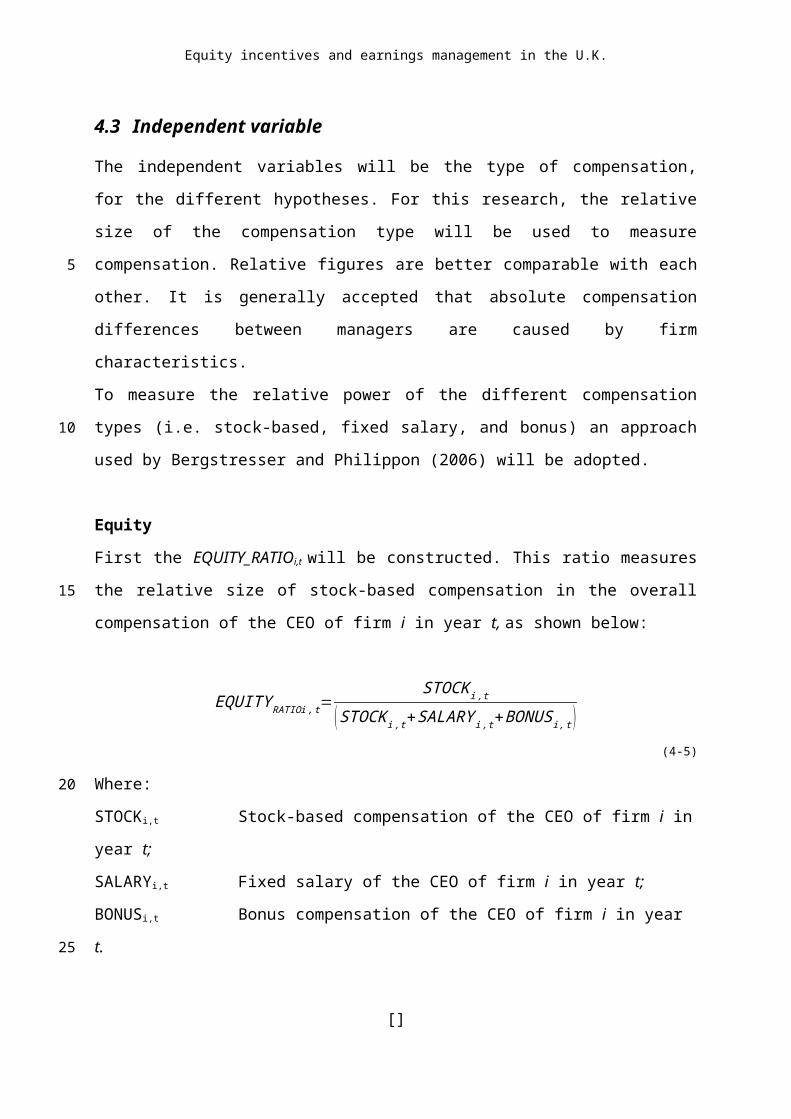
Equity incentives and earnings management in the U.K.
CEO’s. Therefore, the results seem to oppose the results from studies from
Bergstresser and Philippon (2006), Cheng and Warfield (2005) and Gao and
Shrieves (2002). These studies all found evidence that high equity incentive CEO’s
engage more in earnings management (through the use of discretionary accruals)
than low equity incentive CEO’s. The findings in this research suggest the opposite
and therefore the third hypothesis is rejected as well.
Further research is needed to test to which extent fixed salary, bonus compensation,
stock-based compensation and the use of discretionary accruals are really related to
earnings management.
6.3 Limitations and directions for future research
There are various limitations to this research that should be taken into account. The
first limitation to this study lies in the use of the Modified Jones Model, which was
presented by Dechow et al. (1995). Some studies have criticized the predictive
accuracy of the modified Jones model (e.g. Guay et al. 1996). It is possible that the
model is misspecified and imperfectly distinguish discretionary from non-discretionary
accruals. The dependent variable can contain a non-discretionary component as a
possible consequence of this measurement error, although the approach seems to
be consistent with standard practice in the earnings management literature.
Secondly, the research focuses on listed firms in the United Kingdom. Non-listed
firms, which in general are smaller firms, have also incentives to manage earnings.
Therefore it is a limitation that the results might not be generalized to non-listed firms
and to other countries.
Finally the data that is used in this research is from 2005 and 2006. This could be a
limitation because it is a short period of time in which the firms are investigated. The
results could be influenced by other factors (e.g. changes in laws and regulations)
than earnings management only.
The limitations mentioned above form directions for future research. First, the study
could be extended by controlling for firm specific parameters (e.g. firm size, industry).
Secondly, this study focussed on the relationship between different types of
compensation and discretionary accruals. However, no assurance is provided on the
[]
5
10
15
20
25
30
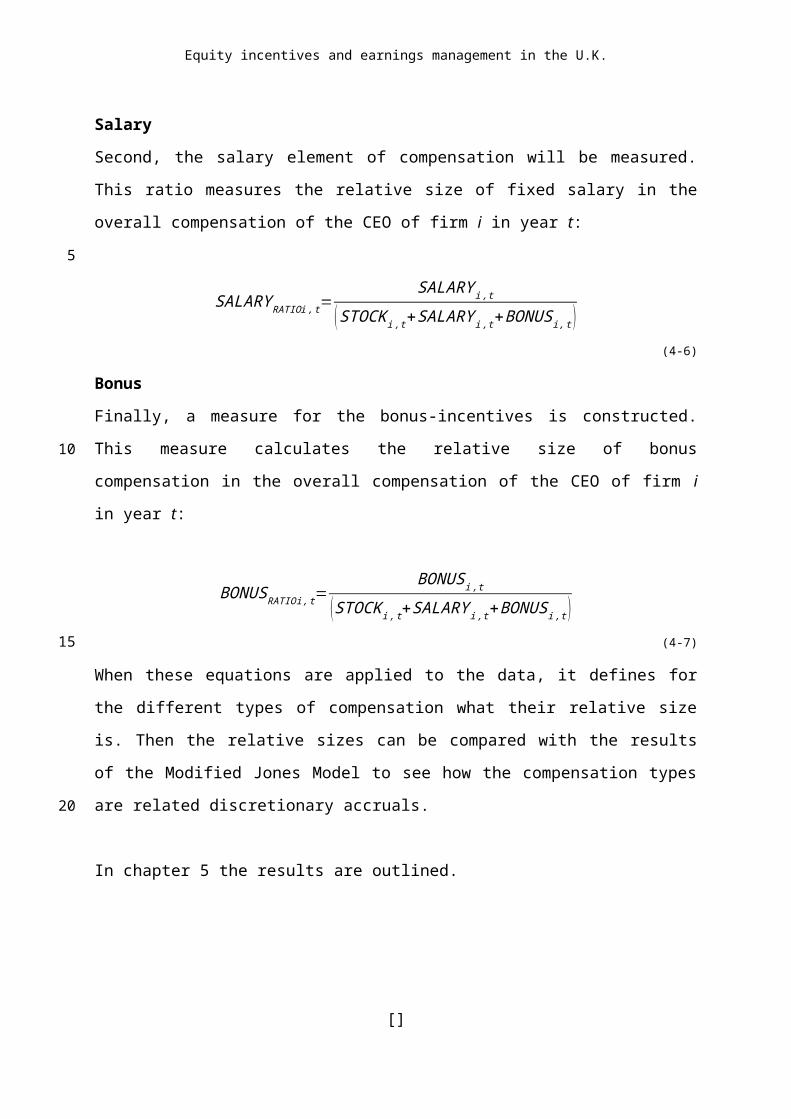
Equity incentives and earnings management in the U.K.
extent of earnings management. Future research is needed to determine to which
extent the results in this study can be explained as a result of earnings management.
[]

Equity incentives and earnings management in the U.K.
ReferencesAharony, J., and I. Swary. 1980. Quarterly dividend and earnings announcements
and stockholders’ returns: an empirical analysis. Journal of Finance, 35, 1–12.
Bauman, M.P., and K.W. Shaw. 2006. Stock option compensation and the likelihood
of meeting analysts’ quarterly earnings targets. Review of quantitative finance
and accounting, 26, 301-319.
Beneish, M.D. 2001. Earnings management: a perspective. Managerial Finance, 27,
3–17.
Bergstresser, D., and T. Philippon. 2006. CEO incentives and earnings management.
Journal of Financial Economics, 80 (3), 511–529.
Bradley, M., and M. Roberts. 2004. The structure and pricing of bond covenants.
Working Paper, Duke University and University of Pennsylvania.
Cheng, Q., and D.B. Farber. 2008. Earnings restatements, Changes in CEO
compensation, and Firm Performance. The Accounting Review, 83 (5), 1217-
1250.
Cheng, Q., and T. Warfield. 2005. Equity incentives and earnings management.
Accounting Review, 80, 441–476.
Cohen, J. 1988. Statistical power analysis for the behavioural sciences. Lawrence
Erlbaum Associates, second edition.
Coles, J.L., M. Hertzel, and S. Kalpathy. 2006. Earnings management around
employee stock option reissues. Journal of Accounting and Economics, 41, 1-2
(April): 173–200.
Core, J.E., and D.F. Larcker. 2002. Performance consequences for mandatory
increases in executive stock ownership. Journal of Financial Economics, 64(3),
317-340.
Daniel, N.D., D.J. Denis, and L. Naveen. 2008. Do firms manage earnings to meet
dividend thresholds?. Journal for Accounting and Economics, 45, 2-26
Dechow, P.M., and R.G. Sloan. 1991. Executive incentives and the horizon problem:
an empirical investigation. Journal of Accounting and Economics, 14, 51-89.
Dechow, P.M., R.G. Sloan, and A.P. Sweeney. 1995. Detecting earnings
management. The Accounting Review, 70, 193–225.
Eisenhardt, K. 1989. Agency Theory: An Asset or Review. Academy of Management
Review, 14 (1), 57-74.[]
5
10
15
20
25
30
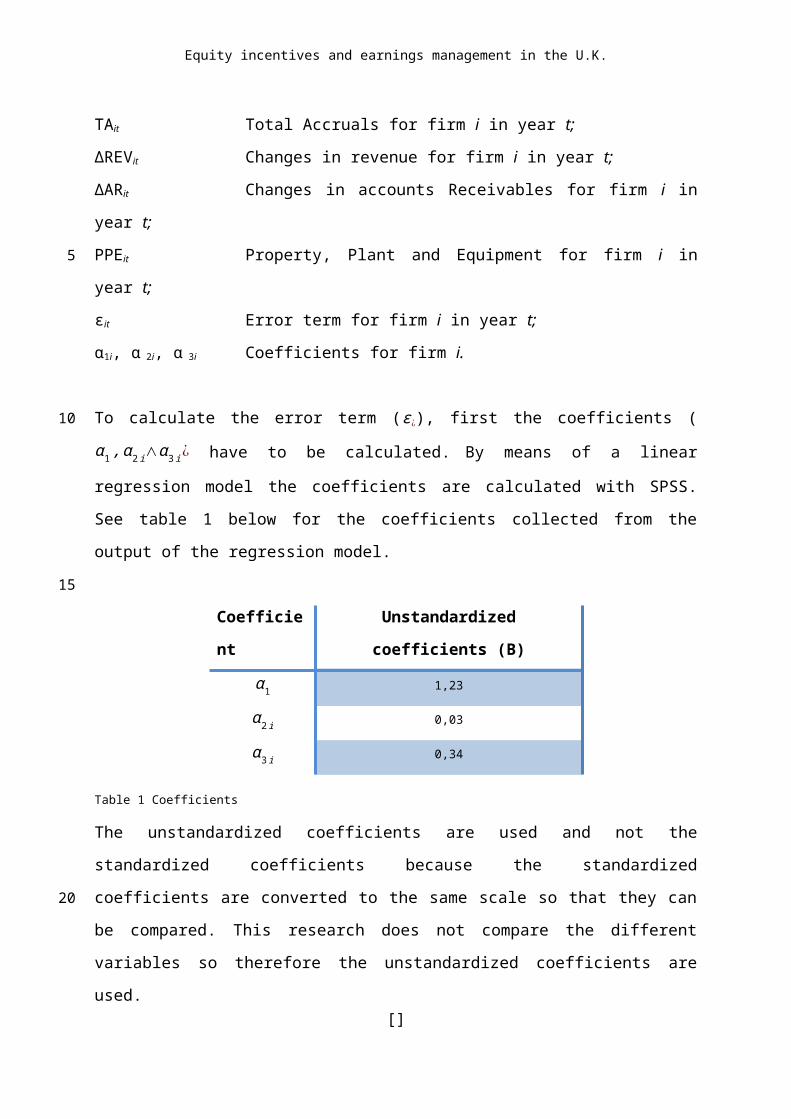
Equity incentives and earnings management in the U.K.
Gao, P., and R. Shrieves. 2002. Earnings Management and Executive
Compensation: A Case of Overdose of Option and Underdose of Salary?
Working paper, Northwestern University, University of Tennessee at Knoxville.
Gaver, J.J., K.M. Gaver, and J. Austin. 1995. Additional evidence on bonus plans
and income management. Journal of Accounting and Economics, 3 – 28
Grotenhuis, te M., and A. Matthijssen. 2009. Basiscursus SPSS. Assen: Van
Gorcum, third edition.
Grullon, G., R. Michaely, and B. Swaminathan. 2002. Are dividend changes a sign of
firm maturity? Journal of Business, 75, 387–424.
Guay, W., S.P. Kothari, and R. Watts. 1996. A Market-Based Evaluation of
Discretionary Accrual Models. Journal of Accounting Research, 34
(Supplement): 83-105.
Healy, P. 1985. The impact of bonus schemes on the selection of accounting
principles. Journal of Accounting and Economics, 7 (April): 85-107.
Healy, P. M., and J.M. Wahlen. 1999. A Review of the earnings management
literature and its implications for standard setting. Accounting Horizons, 13, no.
4, 355-383.
Jensen, M. C., and W.H. Meckling. 1976. Theory of the firm: Managerial behaviour,
agency costs and ownership structure. Journal of Financial Economics, 3, 4
(October): 305–360.
Jensen, M. C., and K.J. Murphy. 1990a. CEO incentives: It’s not how much you pay.
It’s how. Journal of Applied Corporate Finance, 3, 3 (Fall): 36–49.
Jensen, M. C., and K.J. Murphy. 1990b. Performance pay and top-management
incentives. Journal of Political Economy, 98, 2 (April): 225–264.
Jones, J. 1991. Earnings management during import relief investigations. Journal of
Accounting Research, 29, 193–228.
Karpoff, J., D. Lee, and G. Martin. 2008. The cost of firms for cooking the books.
Journal of Financial and Quantitative Analysis, 43(3), 581-611.
Levy, H., and T. Post. 2005. Investments (1st ed.). Harlow: Pearson Education
Limited.
Merchant, K. A., and W.A. van der Stede. 2007. Management control systems:
performance measurement, evaluation and incentives. Prentice Hall, second
edition.
[]
5
10
15
20
25
30
Equity incentives and earnings management in the U.K.
Murphy, K. J. 1999. Executive Compensation. Working paper, University of Southern
California.
Noe, C.F. 1999. Voluntary disclosures and insider transactions. Journal for
Accounting and Economics, 27(3), 305-326.
O’Connell, B.T. 2004. Enron.Con: “He that filches from me my good name…makes
me poor indeed.” Critical Perspectives on Accounting, 15, 6-7 (August): 733–
749.
Pallant, J. 2007. SPSS survival manual, a step by step guide to data analysis using
SPSS for windows. Berkshire: McGraw-Hill Education, third edition.
Praag, van C.M. 2005. Literatuuronderzoek “Relatie beloning van topbestuurders en
bedrijfsprestaties – in opdracht van de Monitoring Commissie Corporate
Governance Code.
Peasnell, K., P. Pope, and S. Young. 2000. Detecting earnings management using
cross-sectional abnormal accruals models. Accounting and Business Research,
30, 313–326.
Palmrose, Z.V., V. Richardson, and S. Scholz. 2004. Determinants of market
reactions to restatement announcements. Journal of Accounting and
Economics, 37, 1 (February): 59–89.
Pettit, R. 1972. Dividend announcements, security performance, and capital market
efficiency. Journal of Finance, 27, 993–1007
Rajgopal, S., and T. Shevlin. 2002. Empirical evidence on the relation between stock
option compensation and risk taking. Journal of Accounting and Economics, 33,
2 (June): 145–171.
Ronen, J., J. Tzur, and V.L. Yaari. 2006. The effect of directors’ equity incentives on
earnings management. Journal of Accounting and Public Policy, 25, 359-389.
Ronen, J., and V.L. Yaari. 2008. Earnings Management: Emerging insights in theory,
practice, and research. Springer, first edition.
Roychowdhury, S. 2006. Earnings management through real activities manipulation.
Journal of Accounting and Economics, 42, 3 (December): 335–370.
Sivakumar, K., and G. Waymire. 1994. Insider trading following material news
events: evidence for earnings. Financial Management, 23(1), 23-32.
Stein, J.C. 1989. Efficient capital markets, inefficient firms: A model of myopic
corporate behaviour. Quarterly Journal of Economics, 104, 4 (November): 655–
[]
5
10
15
20
25
30
Equity incentives and earnings management in the U.K.
669.
Stolowy, H., and G. Breton. 2004. Accounts manipulation: A literature review and
proposed conceptual framework. Review of Accounting and Finance, 3, 1: 5–
66.
Teoh, S.H., I. Welch, and T.J. Wong. 1998a. Earnings management and the long-
term under performance of initial public offerings. Journal of Finance, 53, 1935-
1974.
Teoh, S.H., I. Welch, and T.J. Wong. 1998b. Earnings management and the
underperformance of seasoned equity offerings. Journal of Financial
Economics, 50, 63-99.
Teoh, S.H., and T.J. Wong. 2002. Why new issues and high-accrual firms
underperform: The role of analysts’ credulity. The Review of Financial Studies,
15, 3 (July), 869–900.
Van der Bauwhede, H. 2003. Resultaatsturing en kapitaalmarkten: een overzicht van
de academische literatuur. Maandblad voor Accountancy en Bedrijfseconomie,
mei 2003: 196-204.
[]
5
10
15
Equity incentives and earnings management in the U.K.
Appendix A
Summarization of the empirical findings of prior research.
Author(s) Year Title paper Journal Object of study Sample (sample size, country, research
period)
Methodology Results
#1 Cheng Q., D.B. Farber
2008 Earnings restatements, changes in CEO compensation, and firm performance
The Accounting Review
Compensation contracts of CEO’s following an earnings restatement.
The sample size of this study is 289 restatements from the period of 1997 to 2001 from companies who are listed at the NYSE, the AMEX or the Nasdag.
For each restatement firm compensation data is collected. First the pre- and post-restatement levels of restatement firms' CEO option grants is compared to calculate the change in option grants around restatements. Then this change is compared to the change in option grants for control group over the same period. Furthermore, there is examined whether the reducting in option-based compensation leads to improved performance.
Restatement firms, compared to control firms, reduce the proportion of CEO’s total compensation that is option-based following a restatement. Thus, restatements firms are likely to view reducing option-based compensation as an important means of reducing their agency problems. Furthermore, the authors find evidence of improved operating performance following the reduction in option-based compensation.
#2 McAnally M.L., A. Srivastava, C.D. Weaver
2008 Executive stock options, missed earnings targets, and earnings management
The Accounting Review
Why managers miss earnings targets.
This paper uses two distinct samples: one with quarterly data and one with annual data. The quarterly dataset includes 54,934 firm-quarter observations from 1992 to 2005 and the annual
To test whether missed earnings targets are unassociated with subsequent stock-option grants, there is determined whether the value of option grants following a missed quarterly earnings target is different from the
Firms that miss earnings targets have larger and more valuable subsequent grants and firms are more likely to miss earnings targets just before large CEO option grants. Furthermore, the likelihood of missing earnings targets for firms that manage
[]
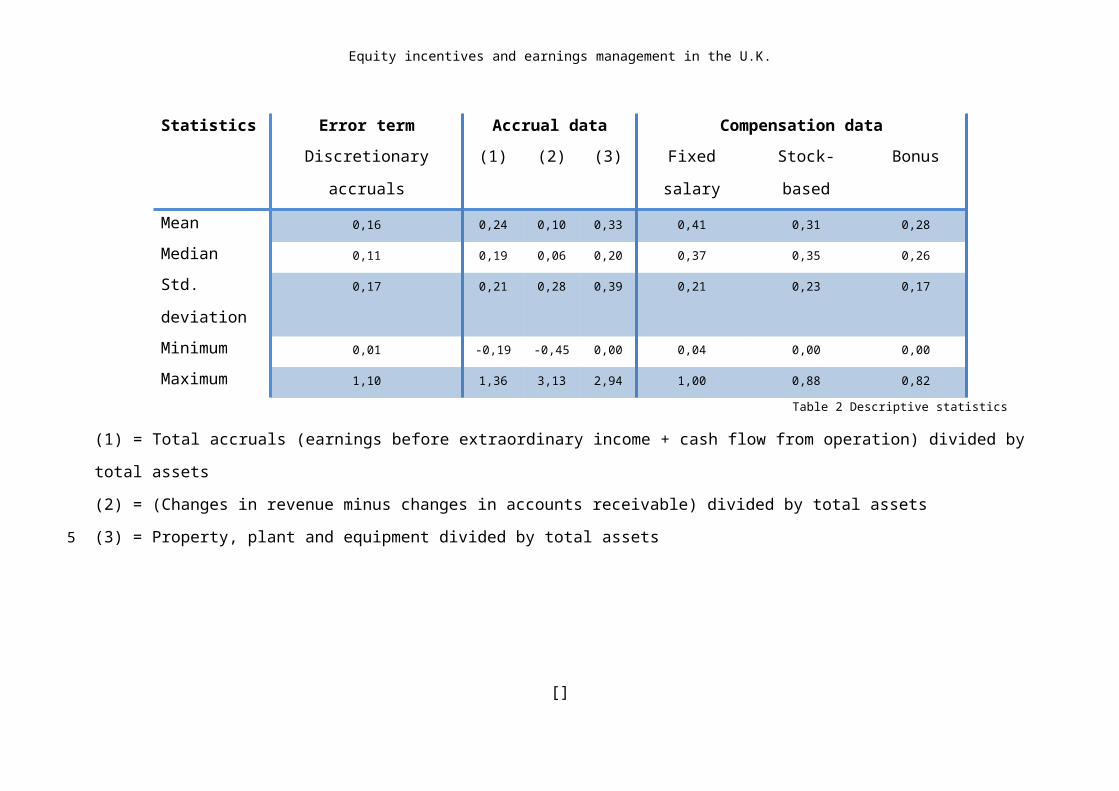
Equity incentives and earnings management in the U.K.
dataset includes 7,916 firm-years from the same period.
value of grants that follow no misses.
earnings downwards increases with stock-option grants.
#3 Cheng Q., T.D. Warfield
2005 Equity incentives and earnings management
The Accounting Review
The relation between equity incentives and earnings management.
All firm-years with data on CEO's stock-based compensation and ownership available from the Standard & Poor's ExecuComp database for the period 1993 to 2000.
First the relation between equity incentives and future trading is reported. Second results on the impact of equity incentives on the probability of meeting or just beating analysts' forecasts are investigated. Last, there is investigated whether managers sell more after earnings management.
High equity incentive managers are more likely to sell shares in the year after earnings announcements and have a higher incidence of meeting or just beating analysts' forecasts. Overall, the study suggest that stock-based compensation can lead to incentives for earnings management.
#4 Barton J. 2001 Does the use of financial derivatives affect earnings management decisions?
The Accounting Review
Assess the extent to which managers trade off derivatives and discretionary accruals to control earnings volatility.
The sample consists of 304 nonfinancial, nonregulated Fortune 500 firm's from 1994 to 1996.
A set of simultaneous equations that captures management’ incentives to maintain a desired level of earnings volatility through hedging and managing accruals are estimated. Derivatives are measured using notional amounts and discretionary accruals using the modified Jones model.
Firms holding derivative portfolios with large notional amounts have lower absolute level of discretionary accruals. The results suggest that the magnitude of notional amounts and discretionary accruals are endogenous. Managers smooth their firms’ earnings by adjusting the volatilities of cash flow and accruals.
#5 Daniel N.D., D.J. Denis, L. Naveen
2008 Do firms manage earnings to meet dividend thresholds?
Journal of Accounting and Economics
Whether firms manage earnings to meet dividend thresholds.
The sample consists of 1500 firm's listed in the Standard & Poor's ExecuComp database for the period 1992 to 2005.
First, the non-discretionary and discretionary components of total accruals are estimated. Second, regressions are estimated separately for each two-digit SIC industry for each year. Finally, the dollar valuesof discretionary and non-discretionary components
Dividend-paying firms tend to manage earnings upward when their earnings would otherwise fall short of expected dividend levels. This earnings management behavior appears to significantly impact the likelihood of a dividend cut. The findings imply that managers
[]
Equity incentives and earnings management in the U.K.
are obtained by multiplying the values calculated aboveby the firm’s lagged assets.
treat expected dividend levels as an important earnings threshold.
#6 Bartov E., P. Mohanram
2004 Private information, earnings manipulations, and executive stock-option exercises
The Accounting Review
To determine whether the ability of top-level executives to time stock-option exercises exist.
The sample consist of 1,322 firm-years (1,218 firms) over a period from 1992 to 2001 from the Standard & Poor's ExecuComp database.
The matched pair design is used to match a firm-year with abnormally high exercise with a firm that in the exercise year has normal exercises but is otherwise similar.
Abnormally positive stock price changes in the pre-exercise year turn abnormally negative after the exercise. Overall, the private information used by top-level executives to time abnormally large exercises follows from earnings management so as to increase the cash payout of exercises.
#7 Ashley A.S., S.S.M. Yang
2004 Executive Compensation and Earnings Persistence
Journal of Business Ethics
Investigates the effect of earnings persistence on the type or form of executive compensation
Firms followed in time from 1993-1998. In total 6,924 firm years. Additional control variables are size, tenure horizon, age and industry effects.
Total accruals scaled by total assets as a measure of earnings persistence. Firms with a high earnings persistence are expected to use earnings for management compensation. Firms with a low earnings persistence are expected to use cash flow from operations for management compensation.
Firms with high earnings persistence tend to be larger in size, report higher earnings, lower stock returns and use more cash compensation to reward executives. This in accordance with expectations. Reason, high earnings persistence firms are larger and therefore can afford to diversify activities, making them less vulnerable to market changes. Firms with smaller earnings persistence tend to reward management with equity -based compensation, i.e. stock options.
#8 Bauman M.P., K.W. Shaw
2006 Stock option compensation and the likelihood of meeting analysts'
Review of quantitative finance and accounting
The relation between stock options employed in a firm's executive pay plan and the
2,513 firms top 5 executives from the years 1992-2002.
Earnings per share is set off against analyst forecast (MEET) and if difference is between 0 and 1 cent per share (SHARE).
Firms that employ higher amounts of stock option compensation in their top executive pay schemes more frequently meet or beat analysts' quarterly earnings targets, and
[]
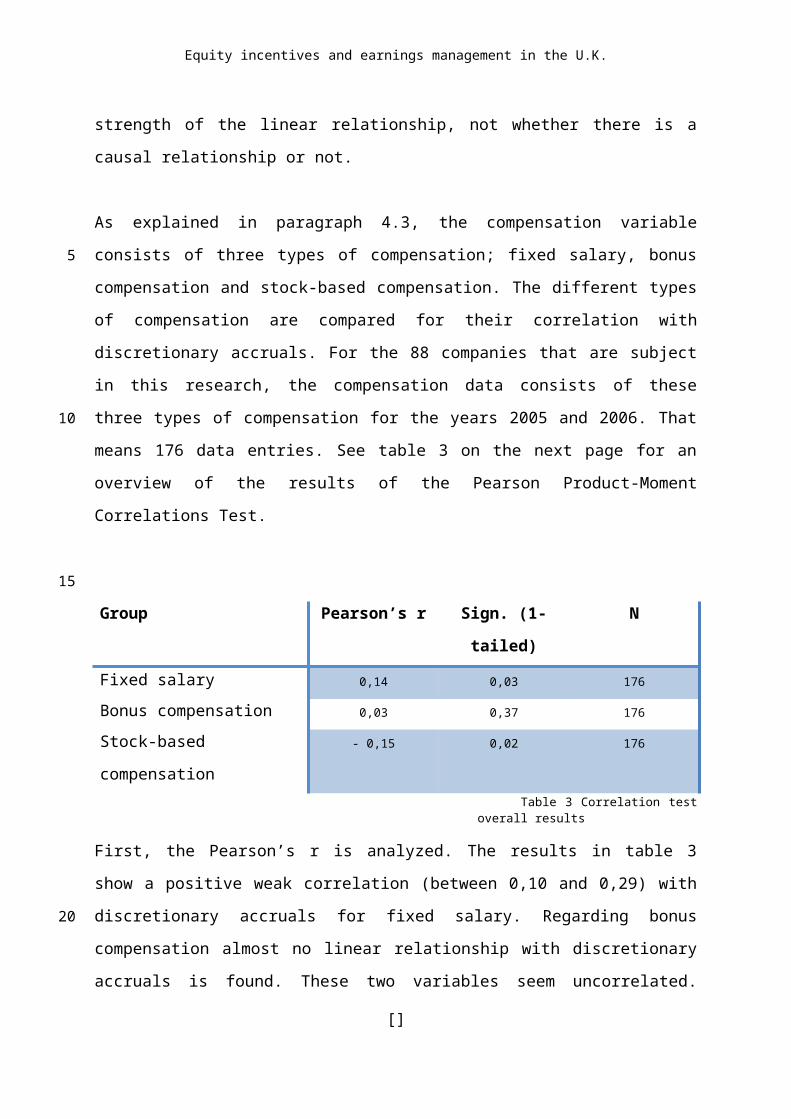
Equity incentives and earnings management in the U.K.
quarterly earnings targets
firm's propensity to meet or beat analysts' earnings forecasts.
more frequently report small earnings surprises, than firms with lower stock-based compensation.
#9 Roychowdhury,S.
2006 Earnings management through real activities manipulation
Journal for Accounting and Economics
Contributes to the literature on earnings management by presenting evidence on the management of operational activities. Prior literature focuses more on detecting abnormal accruals.
All firms in COMPUSTAT between 1987 and 2001 that have sufficient data available for the calculations needed. Data is analyzed is taken from annual figures. In total 17,338 firms year spread over 3,672 firms
Based on the model of Dechow, normal levels for CFO, production costs and discretionary expenses are attained for each firm. Deviations from normal levels are termed abnormal. These firms are stated suspect firms. The three different categories are to establish weather or not there in differences in the managerial decisions or operational activities, rather that reported activities.
The results complement existing literature on earnings management. Methods have been developed to detect real activity manipulation in large samples. The paper also detects activity manipulation around earnings threshold, particularly the zero threshold. Furthermore, insights are given into the factors of activity manipulation.
#10 Coles J.L., M. Hertzel, S. Kalpathy
2006 Earnings management around employee stock option reissues
Journal for Accounting and Economics
Examines earnings management around the cancellation and subsequent reissue of executive (and other employee) stock options.
159 firms that undertook an option exchange program over the period 2001 through the second quarter of 2002. 54 made an public announcement of the exchange program.
To establish earnings management, the standard Jones model has been used. To ensure that earnings changes are not due to actual firm performance. Total accruals and discretionary accruals are examined prior to reset date.
Evidence of abnormally low discretionary accruals leading up to the option reissue date is evident. Thus, even in a setting where investors are aware of the incentives to manipulate stock price, it appears that managers still attempt to manage accruals to their own benefit. The market doesn't seem to respond to abnormally low discretionary accruals.
#11 Kothari S.P., A.J. Leone, C.E. Wasley
2005 Performance matched discretionary accrual measures
Journal for Accounting and Economics
Test whether a performance-matcheddiscretionary-accrual approach
All firm-year observations from the COMPUSTAT Industrial Annual, and Research files from 1962 through 1999. All firms
Estimate for the performance-matched Jones model discretionary accrual is made. Similarly estimates for the performance-matched
Compared to the standard model used to find earnings management, the discretionary accrual approach seems to have a better effect. However the writes
[]
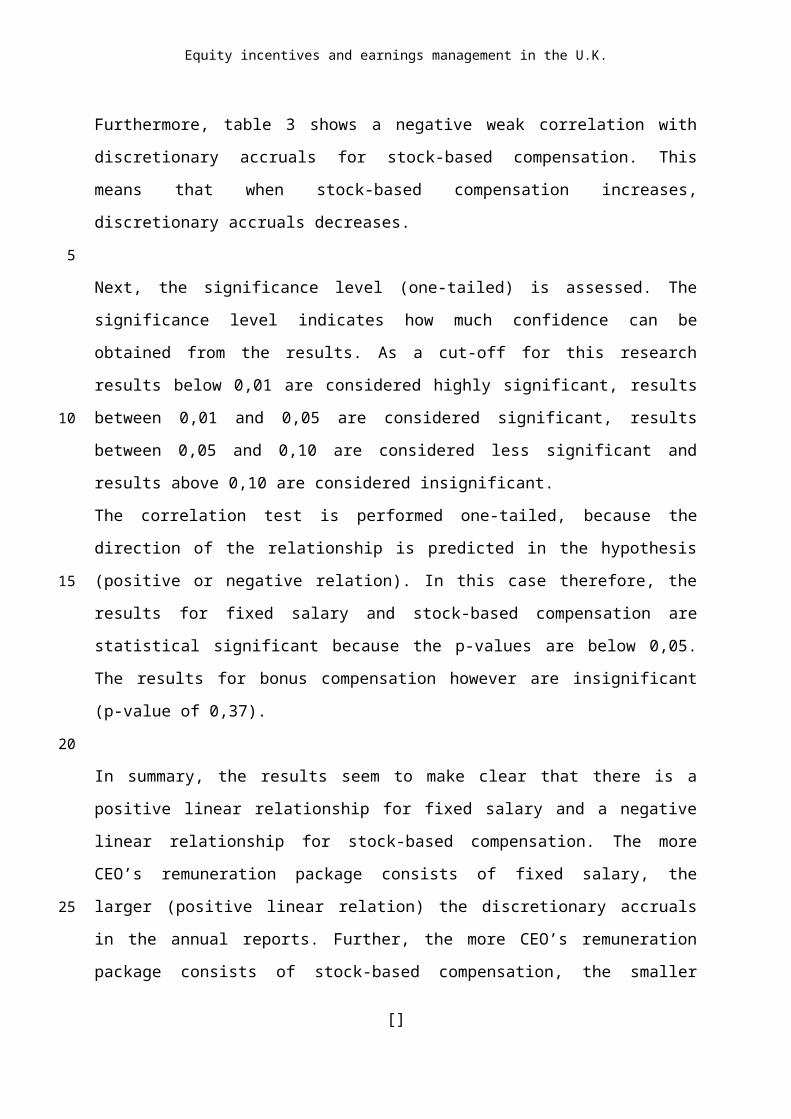
Equity incentives and earnings management in the U.K.
is well specified and powerful at estimating discretionary accruals.
that don't have sufficient data to compute the Jones model are excluded.
modified-Jones model discretionary accrual is done. Both estimates are compared.
do state that it is not possible to uses this method in all circumstances. This in mind the Jones and modified Jones model are easier and more practical.
#12 Balachandran B., K. Chalmers, J. Haman
2008 On-market share buybacks, exercisable share options and earnings management
Accounting and Finance
The association between earnings management and exercisable option holdings for buyback firms.
138 Australian on-market buy-back firms from 1996 to 2003.
Earnings management is analyzed using a variation of the cross-sectional modified Jones model. Discretionary current accruals is used as the measure for earnings management. Multiple regression analysis is used to test the association between discretionary current accruals and exercisable options and option exercises.
Findings suggest that firms’ motivations for announcing share buybacks are related to firms’ compensation policies. Overall, the evidence provides support for the proposition that earnings management and on-market buyback announcements are mechanisms to ‘drive up’ share prices to increase the cash payout of share option exercises.
#13 Ronen J., J. Tzur, V. Yaari
2006 The effect of directors’ equity incentives on earnings management
Journal of Accounting and Public Policy
Examines the effect of insider trading by directors on the likelihood of earnings management, on the value of the firm and on the stock price.
Not applicable Not applicable Incentive packages contribute to motivating directors to tailor incentives for effort-averse managers. At the same time, they also induce directors to tacitly collude with managers in pernicious earnings management.
#14 Erickson M., M. Hanon, E.L. Maydew
2006 Is There a Link between Executive Equity Incentives and Accounting Fraud?
Journal of Accounting Research
Examines whether the empirical evidence supports the claim that equity incentives are positively
50 firms that are both accused of fraud by the SEC and for which compensation data is available from 1996 to 2003. Further, 100 matched sample firms who
A variety of equity incentive measures is estimated to compare accused firms with matched and unmatched samples of firms that are not accused of fraud.
The analysis reveals no consistent evidence to support the conclusion that the probability of accounting fraud is increasing in the sensitivityof executives’ total equity or vested stock and stock option-
[]
Equity incentives and earnings management in the U.K.
associated with the probability of accounting fraud
are not accused of fraud and an unmatched sample which contains 13,033 firm-year observations on ExecuComp.
based wealth to changes in stock prices. Also, managerial exercises of stock options and managerial stock sales are not significantly higher for fraud firms than for nonfraud firms.
#15 Core, J.E., W.R. Guay, D.F. Larcker
2003 Executive equity compensation and incentives: a survey
Economic Policy Review
To synthesize the broad literature on equity compensation and executive incentives.
Not applicable - literature review
Not applicable - literature review
Not applicable - literature review
#16 Bergstresser D., T. Philippon
2006 CEO incentives and earnings management
Journal of Financial Economics
Examines whether firms with CEO's whose overall compensation is more sensitive to company share prices have higher levels of earnings management.
Data from the Compustat and and Compustat Executive Compensationdatasets.
Overall accruals measures is derived from the income statements of the firms. Both the Jones model and the Modified Jones model are used to estimate nondiscretionary accruals. Finally, the relation between earnings manipulation and the power of CEO equity-based incentives is calculated.
Managers whose overall compensation is more sensitive to company share prices lead companies with higher levels of earnings management. Periods of high accruals coincide with unusually significant option exercises by CEOs and unloading of shares by CEOs and other top executives.
#17 Baker T., D. Collins, A. Reitenga
2003 Stock Option Compensation and Earnings Management Incentives
Journal of Accounting, Auditing & Finance
Examines whether the use of stock options relative to other forms of pay influences discretionaryaccrual choices around option award dates.
168 firms with 1,100 firm-year observations from 1992 to 1998 from The Wall Street Journal annual compensation survey.
Earnings management is modeled as a function of relative option pay and several control variables. For the earnings management construct, discretionary accruals are computed using the modified Jones model on cross-sectional data. Finally, a number of control variables are included.
The analysis provides strong evidence that the discretionary accruals component of annual earnings is influenced by relative option compensation. Managers who receive large option awards appear to make income-decreasing accrual choices as a means of decreasing the exercise price of their awards.
#18 Gao, P., R.E. 2002 Earnings Journal of Identify firm The executive The authors use an estimate of The amounts of current year
[]
Equity incentives and earnings management in the U.K.
Shrieves Management and Executive Compensation: a Case of Overdose of Option and Underdose of Salary?
Financial Economics
specific factors that influence the extent of earnings management, with a focus on managerial contracts.
compensation information is obtained from the Standard and Poor’sExecuComp database, which reports components of compensation for CEOs of 1,500 U.S. firms from 1992 to 1999.
discretionary current accruals as a proxy for earnings management. A modified version of Jones model is used to distinguish between discretionary and nondiscretionary components. The role of eachof the major compensation components: salary, bonus, restricted stock, options and long-term incentive plans is considered in this study.
stock option grants are reliably positively related to earningsmanagement intensity. The most important result of this study is that compensation contract design does influence earnings management.
[]
Equity incentives and earnings management in the U.K.
Appendix B
A list of firms from the FTSE 100 index that are taken into account in this study and the
corresponding error-terms (discretionary accruals) for 2005 and 2006 for each company.
FTSE 100 index on April 9th, 2009:
# Company name Error-term 2005 Error-term 20061 Admiral Group 0,153588572 0,2425391312 Alliance Trust (The) 0,077352662 0,2125363113 Amec 0,021706024 0,0722938864 Amlin 0,088185772 0,038420775 Anglo American 0,023868141 0,1857964936 Antofagasta 0,651701382 1,1039862427 Associated British Foods 0,046576313 0,0217862328 AstraZeneca 0,422265554 0,5442855079 Autonomy Corporation 0,518379936 0,05469284310 Aviva 0,018656866 0,01648794611 BAE Systems 0,107622556 0,02361097112 BG Group 0,237446657 0,29910400713 BHP Billiton 0,283337719 0,33035317714 BP 0,142309623 0,14871040115 BT Group 0,102016036 0,07283499816 Balfour Beatty 0,039096635 0,04965089317 Barclays 0,014594324 0,01785802218 British Airways 0,106931328 0,07398714819 British American Tobacco 0,240256653 0,22106314620 British Land Co 0,105662168 0,12785502521 British Sky Broadcasting Group 0,546239425 0,55733224822 Bunzl 0,091257976 0,12764117123 Cable & Wireless 0,027285018 0,0970462524 Cadbury 0,132115182 0,05785243825 Cairn Energy 0,046835236 0,12963437526 Capita Group 0,169620679 0,19550731827 Centrica 0,157085556 0,05258705828 Cobham 0,070710615 0,09537228629 Compass Group 0,041058643 0,05361544730 Diageo 0,221764514 0,21072035131 Foreign & Col Invest Trust 0,188082363 0,07471096332 Friends Provident 0,015557684 0,03501509433 G4S PLC 0,020006356 0,04503237334 GlaxoSmithKline 0,448012639 0,35380675# Company name Error-term 2005 Error-term 2006
[]
5
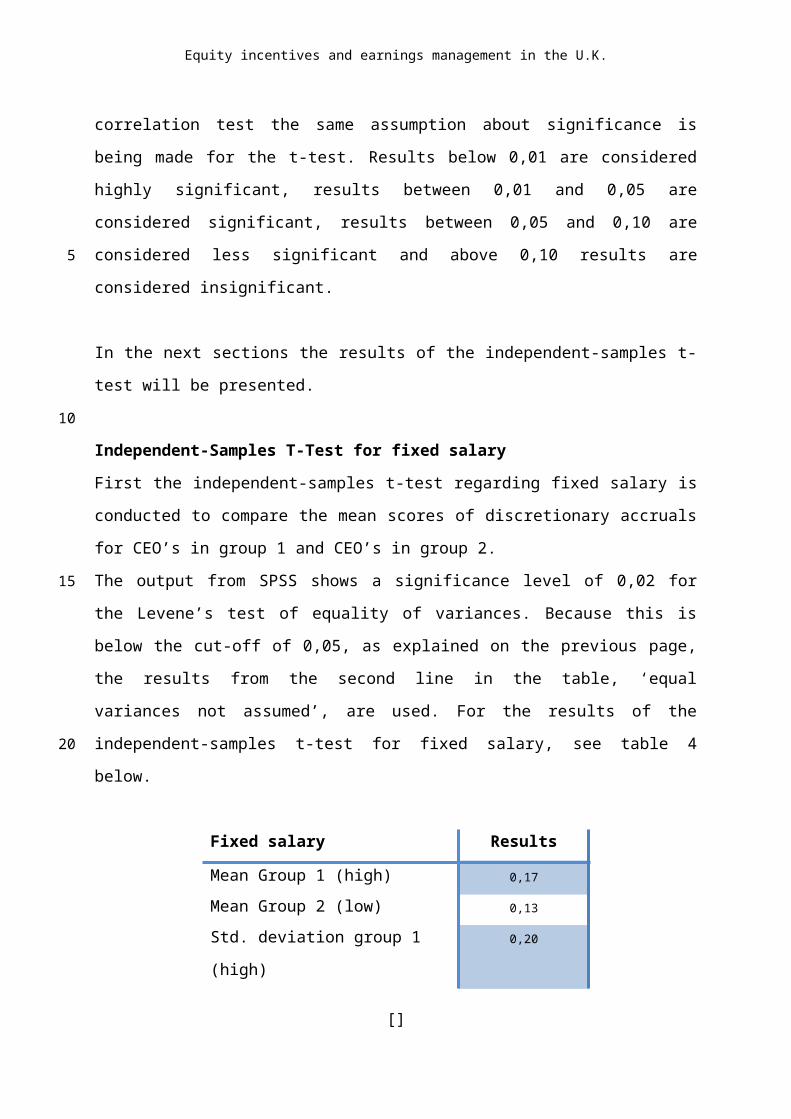
Equity incentives and earnings management in the U.K.
35 HSBC Holdings plc 0,019042252 0,06885862336 Hammerson 0,246810151 0,26992234937 ICAP 0,152894216 0,09834313938 Imperial Tobacco Group 0,29398569 0,29727886539 InterContinental Hotels Group 0,00161693 0,01722486340 International Power 0,126861985 0,06568248441 Intertek Group 0,039790964 0,04051519742 Invensys 0,262918699 0,12003348243 Johnson Matthey 0,014812083 0,0431965544 Kazakhmys 0,286007199 0,83095786645 Kingfisher 0,022902267 0,09113368546 Land Securities Group 0,303457517 0,14164440347 Legal & General Group 0,011695923 0,01804968148 Liberty International 0,078909473 0,12271832349 Lonmin 0,069047894 0,3287410850 Man Group 0,150258697 0,10952416651 Marks & Spencer Group 0,135097396 0,10049411452 Morrison (Wm) Supermarkets 0,829662154 0,29319844253 National Grid 0,089179553 0,06752866554 Next 0,592417732 0,4194154255 Old Mutual 0,029271139 0,09535093256 Pearson 0,135523259 0,08778184257 Pennon Group 0,213585676 0,29345301758 Petrofac 0,018502204 0,29477696459 Prudential 0,008647134 0,01798581760 RSA Insurance Group 0,026024905 0,02029365261 Randgold Resources 0,441298937 0,13935255462 Reckitt Benckiser Group 0,364050363 0,38043864263 Reed Elsevier 0,173649396 0,16032606664 Rexam 0,052332637 0,02947811465 Rio Tinto 0,35214832 0,45726967166 Rolls-Royce Group 0,101023909 0,18839682467 Royal Bank Of Scotland Group 0,022516641 0,02866458668 Royal Dutch Shell A 0,236862307 0,18779994269 SABMiller 0,241859265 0,14086163570 Sage Group 0,210226131 0,16024175871 Sainsbury (J) 0,129359399 0,15479996672 Schroders 0,079701571 0,11169743273 Scottish & Southern Energy 0,00847627 0,0378820274 Serco Group 0,032983457 0,04189196175 Severn Trent 0,163763406 0,18863826276 Shire 0,01211122 0,08941547277 Smith & Nephew 0,094908016 0,19412701678 Smiths Group 0,118617784 0,053819397# Company name Error-term 2005 Error-term 2006
[]
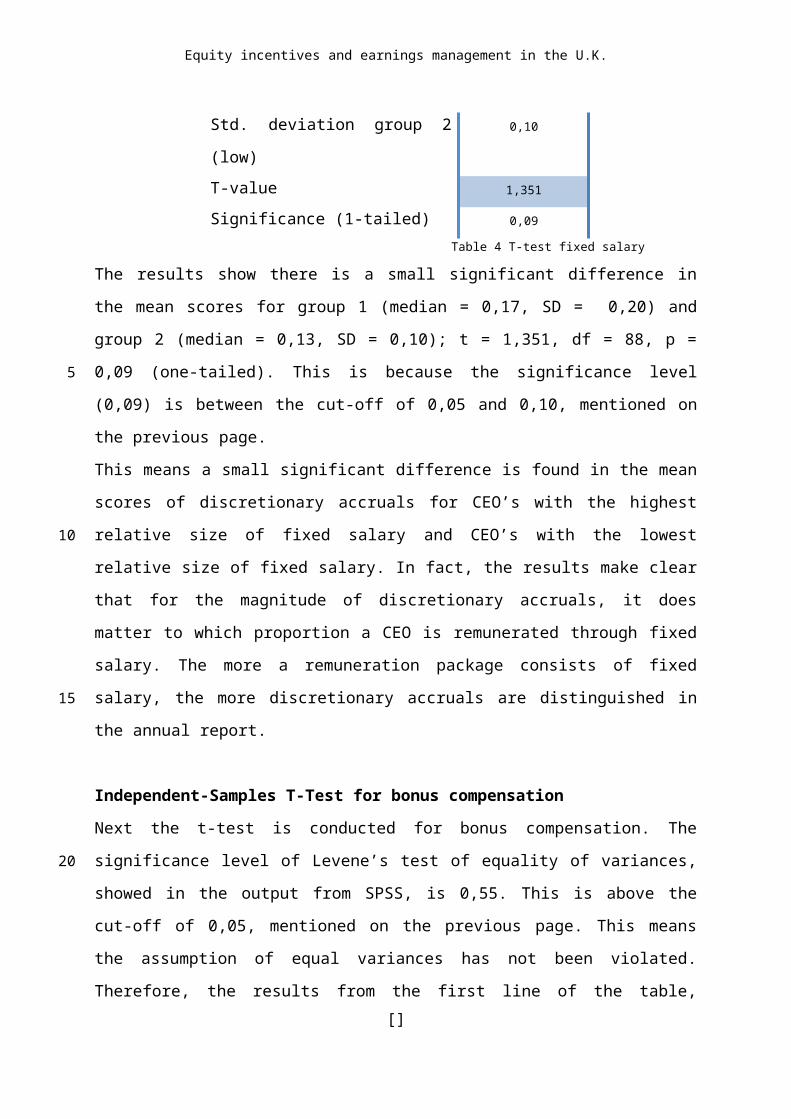
Equity incentives and earnings management in the U.K.
79 Standard Chartered 0,090235298 0,05369454680 Tesco 0,02842635 0,0423909781 Tullow Oil 0,059856083 0,15156821182 Unilever 0,183367247 0,17786379783 United Utilities Group 0,191640713 0,18553255984 Vedanta Resources 0,091502944 0,09863646785 Vodafone Group 0,011150501 0,05368484486 WPP PLC 0,093395051 0,06712653387 Whitbread 0,187783051 0,20270675788 Xstrata 0,156310706 0,095739119
[]