the relationship between absenteeism and employer
TRANSCRIPT

21 Southern African Business Review Volume 15 Number 3 2011
The relationship between absenteeism and employer-sponsored child care
B. Anderson & D.J. Geldenhuys
2A B S T R A C T3Given the high loss of revenue due to absenteeism, exploring different
ways of managing absenteeism in South African companies, such as
family-friendly practices, has become important. Establishing on-
site employer-sponsored child-care facilities is an example of such
practices.
4The purpose of this article is, firstly, to report on exploratory research
that was done to examine the relationship between absenteeism and
on-site employer-sponsored child care. The following dimensions
of absenteeism were examined over a period of one year: absence
frequency, absence severity, attitudinal absence and medical
absence. The results of two companies, one with a facility and one
without a facility, were then compared in order to establish the
relationship between absenteeism and an on-site facility. Secondly,
this article also reports on the relationship between demographic
variables and absenteeism.
5The results indicate a significant negative relationship between on-
site employer-sponsored child care and absenteeism. Regarding
the influence of demographical variables, significant differences
were found with respect to absenteeism-based marital status and
age, while no significant difference was found with respect to
absenteeism based on gender and race.
6This article makes a specific contribution to studies on the use
of on-site employer-sponsored child-care facilities for managing
absenteeism, specifically in the South African context, and also
Ms B. Anderson is a student in the Department of Industrial and Organisational Psychology, University of South Africa. Prof. D.J. Geldenhuys is an Associate Professor in the Department of Industrial and Organisational Psychology, University of South Africa. E-mail: [email protected]

B. Anderson & D.J. Geldenhuys
22
sheds new light on the influence of demographical variables on
absenteeism.
7Key words: absenteeism, child care, types of absenteeism, family-friendly practices,
employer-sponsored child care
Introduction
1About 4.5% of the South African workforce are absent on any given day, and in certain companies this figure is as high as 18% (Vaida 2005). In the light of these statistics, Robbins, Judge, Odendaal and Roodt (2009) indicate that South African managers regard absenteeism as their most serious discipline problem. If not managed and controlled, absenteeism can “spread like an epidemic, creating a range of disciplinary problems for organisations” (Hoque & Islam 2003: 81).
However, it is highly unlikely that organisations will completely eradicate absenteeism. Ericson (2001) maintains that organisations should look at ways in which they can accommodate the needs of their diverse workforce in order to attract and retain the best employees. Ericson (2001: 91) further states, “if people were only absent from their jobs when they needed to be, such as for family commitments, or when they are truly ill, absenteeism would not be the major problem that it is today”.
One strategy used by a small but growing number of firms to assist with absenteeism is to provide employer-sponsored child care (ESCC) (Connelly, DeGraff & Willis 2004). According to Kelly (2003), the capacity of an organisation to provide ESCC is dependent on the organisation’s size, age and sector. Larger organisations have economies of scale that make it easier and more reasonable to investigate and offer child care. According to Kelly (2003), older organisations have more difficulty in changing their structures and practices, suggesting that younger organisations are more likely to adopt ESCC. Private sector organisations face a further challenge in justifying the benefits of ESCC both internally and to investors due to the fact that childcare programmes are relatively new, and have not been shown to be crucial for meeting financial goals (Kelly 2003).
According to Connelly et al. (2004), measuring the benefits of ESCC programmes for employers is challenging given the complex interactions between various working conditions. Hence, even companies with ESCC programmes find it difficult to quantify the value of child-care benefits.
Although there has been growing enthusiasm for ESCC, assertions that child care lowers absenteeism rates have been mixed (Kossek, Dass & DeMarr 1994; Kossek & Nichol 1992). On the one hand, Milkovich and Gomez (1976), for instance, found

The relationship between absenteeism and employer-sponsored child care
23
a positive significant difference between users and non-users, and Friedman (2001) a decrease in absenteeism after the implementation of an ESCC centre, while Goff, Mount and Jamison (1990), on the other hand, could not find similar results.
While results about the effects of ESCC on absenteeism remain mixed, it also appears that not being able to use the centres may even result in frustration (Kossek & Nichol 1992) or resentment, which is then manifested in negative attitudes about the benefits and the organisation (Rothausen, Gonzalez, Clarke & O’Dell 1998). According to Rothausen et al. (1998), the phenomenon of “family-friendly backlash” is occurring, with childless workers becoming resentful about the family benefits that other workers enjoy.
As child-care and domestic responsibilities are traditionally ascribed to women, it might also be valuable to examine the influence of biographical information, such as gender, marital status, race and age on absenteeism.
Considering these factors, the aim of this article is to determine the relationship between absenteeism and ESCC. Research was conducted among the employees of two similar services institutions in South Africa, one with an ESCC facility and one without such a facility. Absence frequency, absence severity, attitudinal absence and medical absence were examined over a period of one year. The results of the two companies were then compared in order to establish the relationship between absenteeism and an ESCC facility. Furthermore, the demographical determinants of gender, marital status, age and race were also analysed to determine possible relationships between absenteeism and demographical determinants.
Absenteeism
1Absenteeism can firstly be defined in terms of causes, and secondly in terms of physical presence. In terms of causes, the most common theories proposed that absenteeism is largely a behavioural response to dissatisfaction with certain aspects of one’s job (Goldberg & Waldman 2000). A second stream of literature rejects the role of job satisfaction as a cause of absenteeism, focusing instead on the role of demographics as well as work- and non-work-related constraints in influencing absenteeism (Goldberg & Waldman 2000).
De Boer, Bakker, Syroit and Schaufeli (2002) provide further definitions of absenteeism in terms of causes. The first theory, the withdrawal theory, regards absenteeism as withdrawing from adverse working conditions. The second explanation is based on so-called ‘stress’ theories, which assume that employees are unable to cope with certain work conditions and therefore develop stress symptoms.

B. Anderson & D.J. Geldenhuys
24
Instead of viewing absenteeism in terms of cause, the following definitions view absenteeism in terms of physical presence:
• Patton and Johns (2007) define absenteeism as an individual’s lack of physical presence at a given location and time when there is a social expectation for him or her to be there.
• Martochhio and Jimeno (2003) define absenteeism as a single day of missed work.• Absences occur whenever a person chooses to allocate time to activities that
compete with scheduled work, either to satisfy the waxing or waning of underlying motivational rhythms or to maximise personal utility (Harrison & Martocchio 1998).
• Absenteeism can be defined as the failure of an employee to report for work as scheduled, regardless of the reason (Robbins, Odendaal, & Roodt 2001).
In this article, absence is defined as the absence of an employee on any given day during pre-scheduled working hours in order to meet non-work-related needs. This definition refers to all forms of absenteeism, including vacation leave and absenteeism due to illness.
Regarding models of absenteeism, the Rhodes and Steers (1990) model is considered one of the most influential and often-cited models in the absenteeism literature (Burton, Lee & Holtom 2002). In this model, employee attendance is primarily determined by the interaction of an employee’s perceived ability to attend and motivation to attend. Ability to attend moderates the motivation to attend, while motivation to attend is influenced by job satisfaction and various pressures to attend (Burton et al. 2002). Although not explicitly stated, attendance motivation appears to relate to ‘voluntary’ absenteeism, whereas the ability to attend appears to relate to ‘involuntary’ absenteeism (Brooke 1986). Brooke (1986) places voluntary and involuntary absenteeism on a continuum, with the voluntary end representing instances in which the employee chooses between work and non-work alternatives, and ‘decides to go fishing’. Absences of this sort are typically of short duration. The involuntary end point refers to instances such as illness of self or a family member in which there is little or no choice associated with the absence event.
According to Huse and Taylor (1962), four indices can be used to measure the dimensions of absenteeism empirically:
• Absence frequency: total number of times absent• Absence intensity: total number of days absent• Attitudinal absences: frequency of one day absences• Medical absences: frequency of absences of three days or longer.

The relationship between absenteeism and employer-sponsored child care
25
In attitudinal absence, the employee avoids coming to work, and in medical absence the employee is sufficiently ill that he or she is unable to come to work (Huse & Taylor 1962).
Muchinsky (1977) commented that, owing to the complex nature of absenteeism, and complexities in the measurement thereof, careful consideration should be exercised in comparing studies, because many of them use different definitions of absenteeism. In addition, the issue of accurate record-keeping of absenteeism exacerbates the problem of studying absenteeism effectively (Harrison & Hulin 1989).
Further compounding the problem of measuring absenteeism is the fact that the various measures used in empirical studies are not typically related to one another. Harrison and Martocchio (1998) indicated that researchers should clearly describe their rationale for the timing of their measurements, and the length of absence aggregation periods. These authors outlined the idea that absenteeism accumulated over any period is most likely to reflect variables that are defined and relatively stable over that period. They focused on three time periods as a source of variance in absenteeism, namely short-term, medium-term and long-term absenteeism.
According to the authors, short-term absence is defined as having a time span of a few days to three months. This covers the range of most decision-based studies, as well as the so-called ‘attendance spell’ approach used in predicting the length of time until someone takes his or her next absence. Variance due to attendance-decision parameters, acute work and life stressors or relative dissatisfaction can be highlighted in a short-term aggregation period.
Medium-term absence refers to absenteeism that can be deemed to have a time span of between three months and one year. This period includes quarters and single years, which are common intervals for absenteeism records and attendance patterning. According to Harrison and Martocchio (1998), medium-term sources of variance are considered to provide stable correlations.
Long-term absence is defined as a time span of more than one year. As in all definitions, a one-year dividing line is somewhat arbitrary. However, the one-year interval period for absenteeism does have a degree of ecological validity, in other words, in addition to yearly rhythms being strong external ‘pacers’ of behaviour patterns, many organisations use a fiscal or calendar year as their absence accounting period – determining when sanctions kick in and how strong they will be (Harrison & Martocchio 1998). Individuals themselves use such annual periods to regulate their absence-taking.
A useful way to view this entire set of ideas is a cascade of time-based effects. Long-term influences flow into medium-term ones. In turn, medium-term influences pour into short-term ones.

B. Anderson & D.J. Geldenhuys
26
In this article, the four indices identified by Huse and Taylor (1962) are used for the measurement of the dimensions of absenteeism, while absenteeism spanning a one-year period (medium-term absence) is used with regard to the frequency of absenteeism to ensure the validity of the findings.
On-site employee-sponsored child care
1An on-site ESCC facility can be regarded as one type of ‘family-friendly’ practice (Friedman 2001). A family-friendly practice is defined by Arthur and Cook (2004) as any programme designed to alleviate individual conflict between work and family, and includes flexible work scheduling, family leave policies and child-care assistance.
Day care is generally considered to be “a system of services for children in families who need supplementary care outside of their home for part of the day, the care being provided by adults who nurture the children; responding to their educational, social and physical needs” (Milkovich & Gomez 1976: 111). According to the Department of Social Development’s Guidelines for Day Care (April 2001), the most important purpose of a place of care is to provide care to children in the temporary absence of their parents. Such places of care have a responsibility to enhance the development of the child physically, mentally, psychologically, emotionally, morally, culturally and socially. Advocates of day care argue that a well-designed and well-run programme can positively influence parents’ work behaviours by relieving their concerns about their child’s safety and development (Friedman 2001; Milkovich & Gomez 1976).
An on-site ESCC centre is defined in this article as a child-care facility on the premises of the employer, which meets the educational, social, physical and emotional needs of the employees’ children.
ESCC centres assume many forms, but generally have the following characteristics in common:
• Accepting only children whose parents are employed by the organisation• Accepting children between three months of age and preschool age (6 years old)• Some type of educational curriculum (for example, Montessori).
Various factors have come to play a role in the adoption of ESCC, including changing perceptions, workforce demographics and altered family norms (Kossek et al. 1994), as well as employers’ initiatives to promote productivity (Morrissey & Warner 2009). As an ESCC is regarded as one of the most expensive options for employers (Mitchell, Stoney & Dichter 2001), the increasing employer interest in child care can more easily be attributed to growing views that work and family issues are a business concern than to empirical evidence demonstrating economic benefits (Kossek et al.
The relationship between absenteeism and employer-sponsored child care
27
1994). Employees are, for instance, expecting more recognition and support from their employers with respect to creating and maintaining family-friendly workplaces (Landy & Conte 2004). Many married employees are part of a dual-career couple, making it increasingly difficult to find the time to fulfil commitments to home and family. Therefore, it is argued that organisations that do not help their employees achieve work–life balance will find it increasingly difficult to attract and retain the most capable and motivated employees (Robbins et al. 2009). Previous research suggests that employees who have difficulties managing their work and non-work lives may experience productivity losses, including increased absences, turnover and reduced outputs (Sutton & Noe 2005).
Research design
1The research was done as a quantitative, descriptive study, attempting to provide an explanation of, firstly, the relationship between on-site ESCC centres and employee absenteeism and, secondly, between demographical determinants and absenteeism. The research was based on an analysis of secondary data in the form of absenteeism records obtained from the human resources departments of two similar services organisations.
Method
Population and sample
1The research was conducted among the employees of two similar service-related institutions in South Africa. One service provider had a total employee complement of 850 people and the other had a complement of 1 300 employees. The research population consisted of 2 150 people and the research sample of 216 people. In a number of instances, demographic information was not available for the respondents. Hence, listwise procedures to control for missing data were utilised for all analysis methods.
Procedure
1Stratified random sampling was used, whereby the population was first divided into strata, and then random samples were drawn from each stratum. Stratified sampling usually reduces both the amount of variability and the costs of data collection and analysis. It also adds control to the sampling process by decreasing the amount
B. Anderson & D.J. Geldenhuys
28
of sampling error. Randomised stratified sampling allows one to study stratum differences (Kerlinger & Lee 2000).
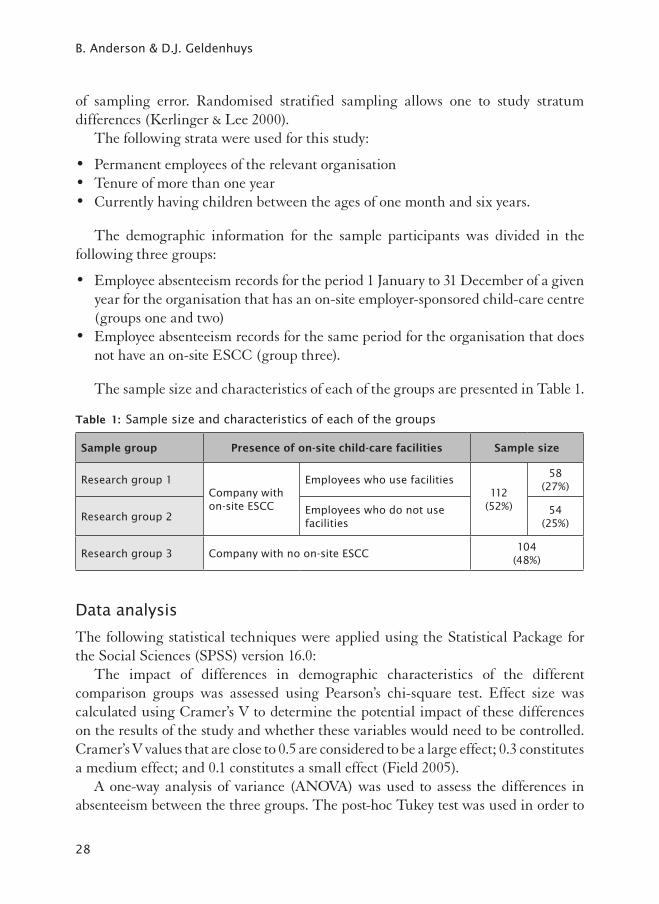
The following strata were used for this study:
• Permanent employees of the relevant organisation• Tenure of more than one year• Currently having children between the ages of one month and six years.
The demographic information for the sample participants was divided in the following three groups:
• Employee absenteeism records for the period 1 January to 31 December of a given year for the organisation that has an on-site employer-sponsored child-care centre (groups one and two)
• Employee absenteeism records for the same period for the organisation that does not have an on-site ESCC (group three).
The sample size and characteristics of each of the groups are presented in Table 1.
Table 1: Sample size and characteristics of each of the groups
Sample group Presence of on-site child-care facilities Sample size
Research group 1Company with on-site ESCC
Employees who use facilities112
(52%)
58(27%)
Research group 2Employees who do not use facilities
54(25%)
Research group 3 Company with no on-site ESCC104
(48%)
Data analysis
1The following statistical techniques were applied using the Statistical Package for the Social Sciences (SPSS) version 16.0:
The impact of differences in demographic characteristics of the different comparison groups was assessed using Pearson’s chi-square test. Effect size was calculated using Cramer’s V to determine the potential impact of these differences on the results of the study and whether these variables would need to be controlled. Cramer’s V values that are close to 0.5 are considered to be a large effect; 0.3 constitutes a medium effect; and 0.1 constitutes a small effect (Field 2005).
A one-way analysis of variance (ANOVA) was used to assess the differences in absenteeism between the three groups. The post-hoc Tukey test was used in order to
The relationship between absenteeism and employer-sponsored child care
29
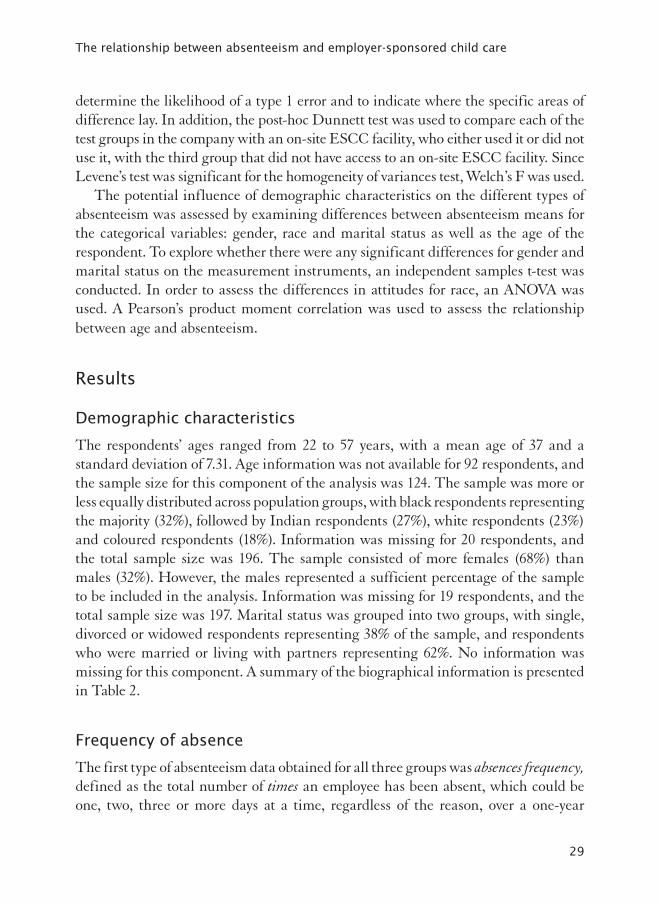
determine the likelihood of a type 1 error and to indicate where the specific areas of difference lay. In addition, the post-hoc Dunnett test was used to compare each of the test groups in the company with an on-site ESCC facility, who either used it or did not use it, with the third group that did not have access to an on-site ESCC facility. Since Levene’s test was significant for the homogeneity of variances test, Welch’s F was used.
The potential influence of demographic characteristics on the different types of absenteeism was assessed by examining differences between absenteeism means for the categorical variables: gender, race and marital status as well as the age of the respondent. To explore whether there were any significant differences for gender and marital status on the measurement instruments, an independent samples t-test was conducted. In order to assess the differences in attitudes for race, an ANOVA was used. A Pearson’s product moment correlation was used to assess the relationship between age and absenteeism.
Results
Demographic characteristics
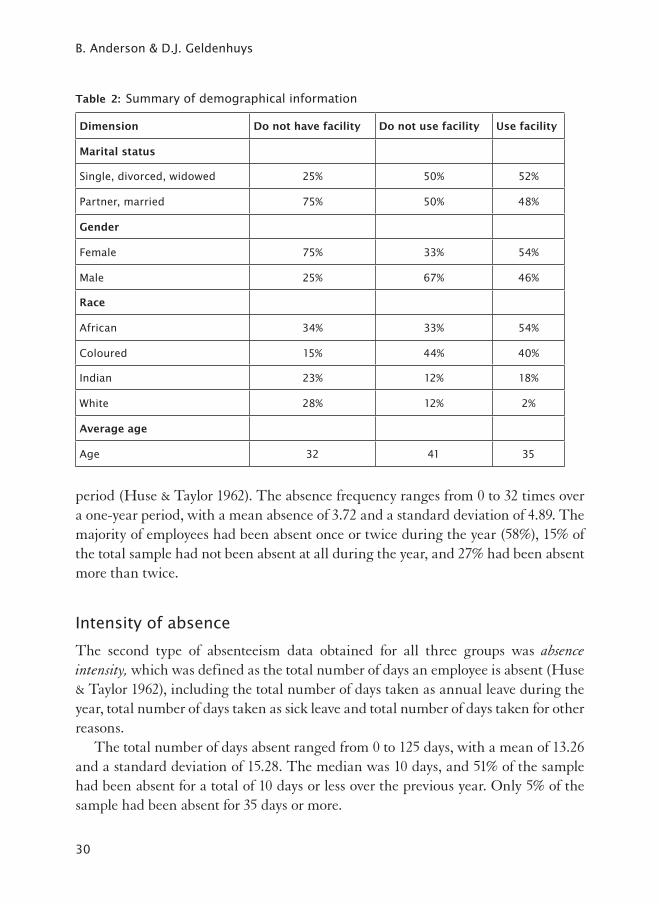
1The respondents’ ages ranged from 22 to 57 years, with a mean age of 37 and a standard deviation of 7.31. Age information was not available for 92 respondents, and the sample size for this component of the analysis was 124. The sample was more or less equally distributed across population groups, with black respondents representing the majority (32%), followed by Indian respondents (27%), white respondents (23%) and coloured respondents (18%). Information was missing for 20 respondents, and the total sample size was 196. The sample consisted of more females (68%) than males (32%). However, the males represented a sufficient percentage of the sample to be included in the analysis. Information was missing for 19 respondents, and the total sample size was 197. Marital status was grouped into two groups, with single, divorced or widowed respondents representing 38% of the sample, and respondents who were married or living with partners representing 62%. No information was missing for this component. A summary of the biographical information is presented in Table 2.
Frequency of absence
1The first type of absenteeism data obtained for all three groups was absences frequency, defined as the total number of times an employee has been absent, which could be one, two, three or more days at a time, regardless of the reason, over a one-year
B. Anderson & D.J. Geldenhuys
30
Table 2: Summary of demographical information
Dimension Do not have facility Do not use facility Use facility
Marital status
Single, divorced, widowed 25% 50% 52%
Partner, married 75% 50% 48%
Gender
Female 75% 33% 54%
Male 25% 67% 46%
Race
African 34% 33% 54%
Coloured 15% 44% 40%
Indian 23% 12% 18%
White 28% 12% 2%
Average age
Age 32 41 35
1
1period (Huse & Taylor 1962). The absence frequency ranges from 0 to 32 times over a one-year period, with a mean absence of 3.72 and a standard deviation of 4.89. The majority of employees had been absent once or twice during the year (58%), 15% of the total sample had not been absent at all during the year, and 27% had been absent more than twice.
Intensity of absence
1The second type of absenteeism data obtained for all three groups was absence intensity, which was defined as the total number of days an employee is absent (Huse & Taylor 1962), including the total number of days taken as annual leave during the year, total number of days taken as sick leave and total number of days taken for other reasons.
The total number of days absent ranged from 0 to 125 days, with a mean of 13.26 and a standard deviation of 15.28. The median was 10 days, and 51% of the sample had been absent for a total of 10 days or less over the previous year. Only 5% of the sample had been absent for 35 days or more.

The relationship between absenteeism and employer-sponsored child care
31
The number of annual days of leave taken by the total sample ranged from a minimum of 0 to a maximum of 48 days, with a mean of 9.27 and a standard deviation of 9.75. Only 7% had not taken any sick leave, and 35% had taken up to seven days, which is the median number of annual sick days. The number of days of sick leave taken ranged from 0 to 28 days, with a mean of 1.80 and a standard deviation of 3.6. Slightly less than half of the sample (45%) had not taken sick leave, while 44% had taken two days or less. Twenty-four respondents constituted the 11% of the sample that had taken more than two days’ sick leave throughout the year. Other leave taken (such as family responsibility leave and overtime leave) ranged from 0 to a maximum of 103 days, with a mean of 1.34 and a standard deviation of 9.28. Only 30% of the sample had recorded this type of leave, and of that percentage, 27% had been absent from 0.5 to two days in total.
Attitudinal absence
1The third type of absenteeism data obtained for all three research groups was attitudinal absence, which was defined as the frequency of ‘one day’ absences (Huse & Taylor 1962). The frequency of attitudinal absence in the total sample ranged from 0 to 23 times, with a mean of 1.76 and a standard deviation of 2.98. The median incidence was once, with 42% of the respondents having been absent for one day once and 28% not having been absent for one day at all. One in three employees in the total sample, however, had been recorded as being absent twice or more for one day at a time.
Medical absence
1The final type of absenteeism data collected were medical absences, defined as the frequency of absences of three days or longer that are attributed to sick leave (Huse & Taylor 1962). The frequency of medical absences in the total sample was low, and only 21% of employees had been recorded as being medically absent. Of the respondents, 78% had never taken sick leave for more than three days, and only 1% had taken medical absences more than twice. The analysis conducted on this type of absenteeism was therefore limited.
A summary of the descriptive information for the different types of absenteeism present in the total research sample is shown in Table 3.

B. Anderson & D.J. Geldenhuys
32
Table 3: Summary of the descriptive information for the different types of absenteeism present in the total research sample
Mean Standard deviation Median Minimum Maximum
Absence frequency 3.72 4.88 2.00 0.00 32.00
Absence intensity
Total days absent 13.26 15.28 9.75 0.00 125.00
Annual days absent 9.27 9.75 7.00 0.00 48.00
Number of sick days absent 1.80 3.63 1.00 0.00 28.00
Number of other days absent 1.34 9.28 0.00 0.00 103.00
Attitudinal absence 1.76 2.98 1.00 0.00 23.00
Medical absence 0.21 0.42 0.00 0.00 2.00
The impact of an on-site ESCC facility on the frequency of absenteeism
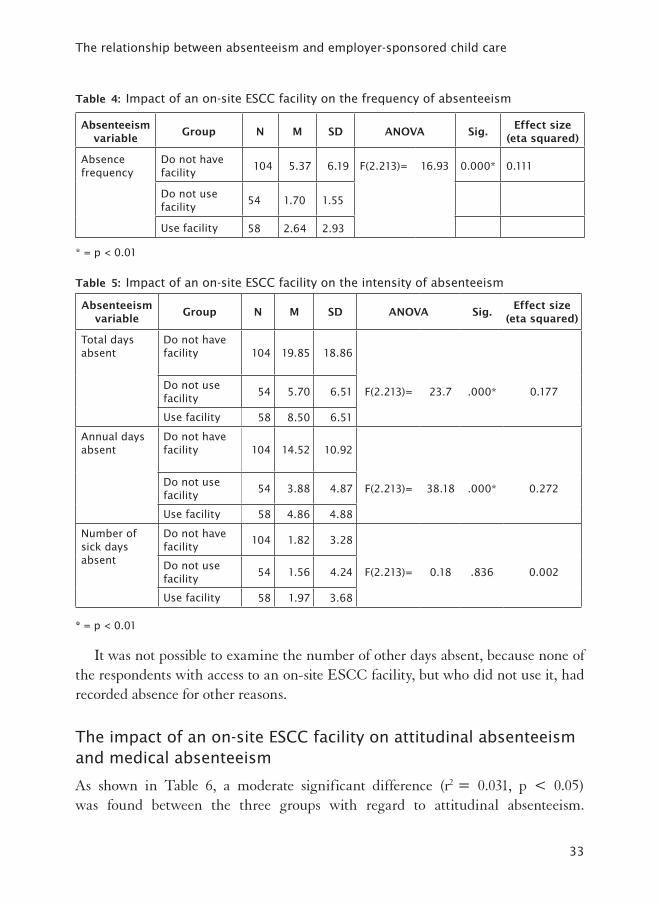
1As shown in Table 4, significant differences were found between the three groups with regard to the frequency of absenteeism. The effect size was strong (r2 = 0.111, p < 0.01), and comparisons using the Tukey and Dunnet post-hoc tests indicated that the mean frequency of absenteeism for respondents without access to an on-site ESCC facility was significantly higher than respondents with access to an on-site ESCC facility, regardless of whether they use it or not. There were no significant differences between employees with access to an on-site ESCC facility who use the facility and those who do not.
Impact of an on-site ESCC facility on the intensity of absenteeism
1As shown in Table 5, a statistically significant difference was found between the three groups with regard to total days absent as well as number of annual days absent, but not for number of sick days absent. The effect size was strong (r2 = 0.177, p < 0.01) for both total days absent and annual days absent (r2 = 0.272, p < 0.01), and comparisons using the Tukey and Dunnett post-hoc tests indicated that the mean frequency of absenteeism for respondents without access to an on-site ESCC facility was significantly higher than for respondents with access to an on-site ESCC facility, regardless of whether they use it or not. There were no significant differences between employees who use the facility and those who do not.
The relationship between absenteeism and employer-sponsored child care
33
Table 4: Impact of an on-site ESCC facility on the frequency of absenteeism
Absenteeism variable
Group N M SD ANOVA Sig.Effect size
(eta squared)
Absence frequency
Do not have facility
104 5.37 6.19 F(2.213)= 16.93 0.000* 0.111
Do not use facility
54 1.70 1.55 Use facility 58 2.64 2.93
* = p < 0.01
Table 5: Impact of an on-site ESCC facility on the intensity of absenteeism
Absenteeism variable
Group N M SD ANOVA Sig.Effect size
(eta squared)
Total days absent
Do not have facility 104 19.85 18.86
Do not use facility
54 5.70 6.51 F(2.213)= 23.7 .000* 0.177
Use facility 58 8.50 6.51
Annual days absent
Do not have facility 104 14.52 10.92
Do not use facility
54 3.88 4.87 F(2.213)= 38.18 .000* 0.272
Use facility 58 4.86 4.88
Number of sick days absent
Do not have facility
104 1.82 3.28
Do not use facility
54 1.56 4.24 F(2.213)= 0.18 .836 0.002
Use facility 58 1.97 3.68
* = p < 0.01
It was not possible to examine the number of other days absent, because none of the respondents with access to an on-site ESCC facility, but who did not use it, had recorded absence for other reasons.
The impact of an on-site ESCC facility on attitudinal absenteeism and medical absenteeism
1As shown in Table 6, a moderate significant difference (r2 = 0.031, p < 0.05) was found between the three groups with regard to attitudinal absenteeism.

B. Anderson & D.J. Geldenhuys
34
Comparisons using the Tukey and Dunnett post-hoc tests indicated that the mean frequency of absenteeism for respondents without access to an on-site ESCC facility was significantly higher than for respondents with access to it, but who did not use it. There were no differences between employees with access to an on-site ESCC facility, but who either used it or did not use it, nor was there a difference between employees without an on-site ESCC facility and employees who used an on-site ESCC facility. No significant differences were found between groups with regard to medical absences.
Table 6: Impact of an on-site ESCC facility on attitudinal absenteeism and medical absenteeism
Absenteeism variable
Group N M SD ANOVA Sig.Effect size
(eta squared)
Attitudinal absence
Do not have facility
104 2.28 3.96
F(2.213) = 4.75
.036*
0.031
Do not use facility
54 1.06 1.16
Use facility 58 1.50 1.72
Medical absence
Do not have facility
104 0.23 0.45
F(2.213) 1.05
.424
0.008
Do not use facility
54 0.15 0.36
Use facility 58 0.24 0.43
* = p < 0.05
A summary of the results regarding the impact of on-site ESCC facilities on absenteeism is presented in Figure 1.
In summary, those with access to an on-site ESCC facility, regardless of whether or not they use it, showed reduced absence in terms of total days absent, annual days absent and absence frequency. In terms of sick absence, no significant differences were found between those employees with access to an on-site ESCC facility and those without it.
Influence of demographic variables on absenteeism
1The potential influence of demographic characteristics on the different types of absenteeism was assessed by examining differences between absenteeism in terms

The relationship between absenteeism and employer-sponsored child care
35
1
AF = Absence frequency; TDA = Total days absent; ADA = Annual days absent; NSDA = Number of sick days absent; NODA = Number of other days absent; AA = Attitudinal absence; MA = Medical absence
Figure 1: Absenteeism trends for each of the research groups
1of the categorical variables: gender, race and marital status as well as the age of the respondent.
Gender
1The research sample under study (female 68% and male 32%) showed no significant difference between males and females in terms of overall absenteeism. The results showed that the average total days absent for females participants was 15.16 and for male participants, 11.62 over an interval of a year. Table 7 presents the means and standard deviations of absenteeism by gender.
Marital status
1Three significant differences were found for types of absenteeism between respondents who had partners or were married and respondents who were single, divorced or widowed. Employees who had partners or were married were absent with greater frequency (r2 = 0.020, p < 0.05) and had a larger number of total days absent

B. Anderson & D.J. Geldenhuys
36
Table 7: Absenteeism means and standard deviations by gender
Count MeanStandard Deviation
Median Minimum Maximum
Absence frequency
Female 132 4.28 4.97 2.00 0.00 20.00
Male 63 3.08 5.18 1.00 0.00 32.00
Total days absent Female 132 15.16 17.97 11.25 0.00 125.00
Male 63 11.62 9.45 9.00 0.00 33.00
Annual days absent
Female 132 10.16 10.57 7.00 0.00 48.00
Male 63 8.82 8.80 6.50 0.00 29.00
Number of sick days absent
Female 132 2.02 3.77 1.00 0.00 28.00
Male 63 1.65 3.66 0.00 0.00 17.00
Number of other days absent
Female 132 2.01 11.82 0.00 0.00 103.00
Male 63 0.36 1.08 0.00 0.00 8.00
Attitudinal absence
Female 132 1.82 2.64 1.00 0.00 13.00
Male 63 1.89 3.91 1.00 0.00 23.00
Medical absence Female 132 0.24 0.45 0.00 0.00 2.00
Male 63 0.19 0.40 0.00 0.00 1.00
T-test Sig.
Absence frequency t(118)= 1.534 .128
Total days absent t(191)= 1.803 .073
Annual days absent t(193)= .876 .382
Number of sick days absent
t(193)= .651 .516
Number of other days absent
t(193)= 1.105 .271
Attitudinal absence t(193)= -.149 .882
Medical absence t(193)= .786 .433
1
1(r2 = 0.022, p < 0.05) than those who were single. The study shows that the average absence frequency for single, divorced or widowed respondents was 2.90, in contrast with the average absence frequency for partner or married respondents at 4.23. In terms of total number of days absent, single, divorced or widowed respondents on average were absent for 10.34 days per annum, and partnered or married respondents were absent on average for 15.09 days per annum. The effect sizes for these differences were small, however. A moderate effect size (r2 = 0.050, p < 0.05) was found for annual leave taken by employees with partners or who were married, who took significantly more annual leave than employees who were single. Table 8 presents the means and standard deviations for absenteeism by marital status.

The relationship between absenteeism and employer-sponsored child care
37
Table 8: Absenteeism means and standard deviations by marital status
Count Mean
Standard deviation Median Minimum Maximum
Absence frequency
Single, divorced, widowed
83 2.90 3.82 1.00 0.00 19.00
Partner, married 133 4.23 5.39 2.00 0.00 32.00
Total days absent
Single, divorced, Widowed
83 10.34 15.34 7.00 0.00 125.00
Partner, married 133 15.09 15.02 13.00 0.00 109.00
Annual days absent
Single, divorced, widowed
83 6.67 7.51 2.00 0.00 28.00
Partner, married 133 10.89 10.63 8.00 0.00 48.00
Number of sick days absent
Single, divorced, widowed
83 1.48 3.79 0.00 0.00 28.00
Partner, married 133 1.99 3.53 1.00 0.00 17.00
Number of other days absent
Single, divorced, widowed
83 1.54 11.29 0.00 0.00 103.00
Partner, married 133 1.23 7.82 0.00 0.00 87.00
Attitudinal absence
Single, divorced, widowed
83 1.78 2.90 1.00 0.00 19.00
Partner, married 133 1.75 3.05 1.00 0.00 23.00
Medical absence
Single, divorced, widowed
83 0.17 0.38 0.00 0.00 1.00
Partner, married 133 0.24 0.45 0.00 0.00 2.00
T-test Sig.
Effect size
(eta squared)
Absence frequency t(214)= -2.103 .037* 0.020
Total days absent t(210)= -2.244 .026* 0.022
Annual days absent t(214)= -3.412 .001* 0.050
Number of sick days absent
t(211)= -1.005 .316 0.005
Number of other days absent
t(214)= .239 .812 0.000
Attitudinal absence t(214)= .075 .941 0.000
Medical absence t(195)= -1.270 .223 0.007
* = p < 0.05
Race
1As shown in Table 9, no significant differences were found for race and the different types of absenteeism.

B. Anderson & D.J. Geldenhuys
38
Table 9: Absenteeism means and standard deviations by race
Count MeanStandard deviation
Median Minimum Maximum
Absence frequency African 64 4.36 5.43 2.00 0.00 32.00
Coloured 35 3.97 5.33 1.00 0.00 20.00
Indian 52 3.83 4.98 2.00 0.00 20.00
White 45 3.18 4.37 1.00 0.00 16.00
Total days absent African 64 12.88 17.11 9.50 0.00 125.00
Coloured 35 16.13 19.60 14.00 0.00 109.00
Indian 52 13.47 14.51 9.50 0.00 59.00
White 45 14.34 11.70 15.00 0.00 36.00
Annual days absent African 64 8.38 8.55 2.75 0.00 29.00
Coloured 35 9.14 9.68 6.50 0.00 30.00
Indian 52 9.52 11.45 6.75 0.00 48.00
White 45 12.14 10.34 9.50 0.00 33.00
Number of sick days absent
African 64 1.45 2.29 1.00 0.00 12.00
Coloured 35 2.99 6.24 0.50 0.00 28.00
Indian 52 2.07 3.46 1.00 0.00 16.00
White 45 1.47 2.90 0.00 0.00 12.00
Number of other days absent
African 64 2.02 12.83 0.00 0.00 103.00
Coloured 35 3.11 14.66 0.00 0.00 87.00
Indian 52 0.79 3.34 0.00 0.00 24.00
White 45 0.18 0.49 0.00 0.00 2.00
Attitudinal absence African 64 2.11 3.81 1.00 0.00 23.00
Coloured 35 1.86 2.80 1.00 0.00 12.00
Indian 52 1.69 2.62 1.00 0.00 13.00
White 45 1.60 2.69 1.00 0.00 13.00
Medical absence African 64 0.22 0.42 0.00 0.00 1.00
Coloured 35 0.29 0.52 0.00 0.00 2.00
Indian 52 0.27 0.45 0.00 0.00 1.00
White 45 0.13 0.34 0.00 0.00 1.00
ANOVA Sig.
Absence frequency F(3.192)= .485 .693
Total days absent F(3.192)= .343 .794
Annual days absent F(3.192)= 1.309 .273
Number of sick days absent F(3.192)= 1.553 .202
Number of other days absent F(3.192)= .748 .525
Attitudinal absence F(3.192)= .290 .833
Medical absence F(3.192)= 1.102 .350

The relationship between absenteeism and employer-sponsored child care
39
Age
1A significant relationship was found between age as a continuous variable and three of the absenteeism measures. Age was found to display a weak negative correlation (r = -.198, p < 0.05) with number of annual days absent, indicating that younger respondents are more inclined to take annual leave. Moderate negative correlations (r = -.269, p < 0.01) were also found with frequency of absence and attitudinal absence, which implies that younger respondents are more inclined to take off one day at a time, and do so more frequently (r = -.276, p < 0.01). Table 10 presents the means and standard deviations for absenteeism by age.
Table 10: Correlations between absenteeism and age
Number of other days absentPearson correlation -.052**
Sig. (2-tailed) .565**
Number of sick days absentPearson correlation -.035**
Sig. (2-tailed) .702**
Annual days absentPearson correlation -.198**
Sig. (2-tailed) .028**
Total days absentPearson correlation -.175**
Sig. (2-tailed) .053**
Absence frequencyPearson correlation -.276**
Sig. (2-tailed) .002**
Attitudinal absencePearson correlation -.269**
Sig. (2-tailed) .003**
Medical absencePearson correlation -.058**
Sig. (2-tailed) .519**
* Correlation is significant at the 0.05 level (2-tailed).
** Correlation is significant at the 0.01 level (2-tailed).
Listwise N=124
Discussion
1The aim of the current research was to establish the relationship between absenteeism and an on-site ESCC. The research also endeavoured to determine whether there is a relationship between absenteeism and biographical variables.
The study demonstrated that there were significant differences between the three groups with regard to the frequency of absenteeism, the total number of days absent, as well as the annual number of days absent. In all three findings, those respondents

B. Anderson & D.J. Geldenhuys
40
without access to an on-site facility showed significantly higher absenteeism rates than respondents with access to an on-site facility, regardless of whether or not they used it.
A significant difference was also reported for attitudinal absence and medical absence, with the respondents without access once again recording higher levels of absenteeism.
The results of the current study support the results of previous studies. Milkovich and Gomez (1976) found that day-care participants’ average monthly rates of turnover and absenteeism were significantly lower than those of non-participants. In other words, lower employee absenteeism and turnover rates were related to enrolment in the on-site employer-sponsored day-care centre. In a similar study by Youngblood and Chambers-Cook (in Neal, Chapman, Ingersoll-Dayton and Emlen 1993), there was a significant reduction in both turnover and absenteeism after on-site child care was introduced in a textile firm. In a more recent study, Friedman (2001) indicated that centre-using parents had missed 259 work days over the 12-month period before Honeywell had opened an on-site child-care centre, but had missed only 30 days in the 12 months after they had started using the centre.
A possible explanation for not finding a difference between those who use the available facilities and those who do not could be that employees might experience the employer as taking care of employees by making provision for child-care, even if they do not make use of the benefit. This might be evidence of the overall attitude of the employer towards employees. Landy and Conte (2004) refer to research findings indicating that supportive supervision is closely related to work–life balance. According to these findings, employees were less concerned about on-site child care than about the employer’s realisation that child care was an important value for its employees. This is also in line with Rhoades and Eisenberger (2002), who refer to studies indicating that a lack of managerial support relates to withdrawal behaviour.
The implications of these findings are that, although it is highly unlikely that organisations will completely eradicate absenteeism, the introduction of ESCC facilities can assist in managing one of South Africa’s most serious discipline problems, namely absenteeism.
Regarding the influence of biographical variables, no significant difference was found with respect to absenteeism based on gender. This finding is in contrast with a large body of research indicating that absenteeism is higher among women than among men (Fried, Melamed & Ben-David 2002; Johnson, Croghan & Crawford 2003; Siu 2002). Various factors could have contributed to these disparate findings, including the continuously changing perceptions of women and their roles both within the world of work as well as their domestic role (Robbins et al. 2009. The

The relationship between absenteeism and employer-sponsored child care
41
implication of the finding of this current study is that the need for the provision of child care in future might also be experienced by male workers.
Regarding marital status, it was found that employees who were married or who were involved in a relationship were more absent than their single counterparts. This finding is in contrast with previous studies (Hogue & Islam 2003; Lau, Au & Ho 2003) that have found that marital status is not a significant factor in determining the proneness of an employee to absenteeism. A possible argument to explain these findings could be that married employees are more likely to have children and hence more family responsibilities. These employees may also take more annual leave than their counterparts, for instance during school holidays; these employees would thus probably benefit most from ESCC centres or programmes.
According to Robbins et al. (2001), the literature indicates that married employees have fewer absences than their unmarried co-workers. The authors postulate that marriage imposes increased responsibilities that make a job more valuable and important, and that married employees will therefore be less likely to miss work. The question of causation, however, remains unclear, as it is possible that unmarried employees might also report low levels of absenteeism, given that absenteeism is dependent on different factors. The effect of marital status on absenteeism is thus mixed, and there is room for further investigation. The impact of this demographic variable on absenteeism remains open.
No significant differences were found on the basis of race. This finding is in contrast with previous studies (McKay & McDaniel 2006; Roth, Huffcutt & Bobko 2003) that have found that black employees are more likely to be absent from work than white employees. Avery, McKay, Wilson and Tonidandel (2007) found that this difference was more pronounced when employees were of the opinion that their employers place little value on diversity. In their study, Avery et al. viewed valuing diversity as an indicator of organisational support. The implication of the finding of the current study is that different race groups might benefit equally from ESCC centres or programmes.
Although weak, a negative relationship was found between age and absenteeism. Currently, the literature posits that absenteeism is negatively related to age (Johnson et al. 2003; Lau et al. 2003; Voss, Floderus & Diderichsen 2001). This implies that absenteeism is higher among younger employees. Furthermore, Siu (2002) and Voss et al. (2001) found that short periods of sick leave are more common among younger employees, probably because older employees usually occupy positions of higher responsibility at work and will not request sick leave for minor illnesses. In cases where a positive relationship was found between absenteeism and age, the reasons cited were health deterioration of older employees and longer recovery when injured

B. Anderson & D.J. Geldenhuys
42
(Peiro et al. in Siu 2002; Robbins et al. 2009). The implication is that older employees will not benefit as much as younger employees from ESCC centres, probably because their children are older than the children of younger employees and therefore need less care.
Conclusion
1In summary, the results of this study indicate a significant negative relationship between on-site employer-sponsored childcare and absenteeism. Regarding the influence of demographical variables, significant differences were found with respect to absenteeism-based marital status and age, while no significant difference was found with respect to absenteeism based on gender and race.
The study had certain shortcomings. Only two companies were compared. It is uncertain whether the annual number of days’ leave granted to each group of respondents as per company policy differed or whether they were the same.
It is therefore recommended that more companies be compared, that the real return on investment be determined, as well as the long-term effect of an on-site ESCC facility on absenteeism, turnover and employee engagement. Lastly, alternatives to the implementation of an on-site ESCC facility, such as backup or emergency centres, could also be investigated.
It can be concluded that, despite the shortcomings of this study, a contribution was made regarding the use of ESCC for managing absenteeism in the South African work context. The cost involved in implementing ESCC might well be covered by the savings of reducing the high absenteeism rates of employees.
References
Arthur, M.M. & Cook, A. 2004. ‘Taking stock of work–family initiatives: How announcements of ‘family-friendly’ human resource decisions affect shareholder value’, Industrial and Labor Relations Review, 57: 559–613.
Avery, D.R., McKay, P.F., Wilson, D.C. & Tonidandel, S. 2007. Personnel Psychology, 60: 875–902.
Brooke, P.P. 1986. ‘Beyond the Steers and Rhodes model of employee attendance’, Academy of Management Review, 11: 345–361.
Burton, J.P., Lee. T.W. & Holtom, B.C. 2002. ‘The influence of motivation to attend, ability to attend, and organisational commitment on different types of absence behaviours’, Journal of Managerial Issues, 14, 181–197.
Connelly, R., DeGraff, D.S. & Willis, R.A. 2004. ‘The value of employer sponsored child care to employees’, Industrial Relations, 43: 759–792.

The relationship between absenteeism and employer-sponsored child care
43
De Boer, E.M., Bakker, A.B., Syroit, J.E. & Schaufeli, W.B. 2002. ‘Unfairness at work as a predictor of absenteeism’, Journal of Organisational Behaviour, 23: 181–191.
Department of Social Development. 2001. Guidelines for Day Care. April 2001. [Online] Available at: http://www.info.gov.za/aboutgovt/contacts/dept/socialdevelopment.htm.
Ericson, D. 2001. ‘Lessons in absenteeism management’, Benefits Canada, 25: 89–91.Field, A. 2005. Discovering Statistics Using SPSS Mind (2nd edition). London: Sage.Fried, Y., Melamed, S. & Ben-David, H. 2002. ‘The joint effects of noise, job complexity,
and gender on employee sickness absence: Exploratory study across 21 organisations – the CORDIS study’, Journal of Occupational and Organisational Psychology, 75: 131–144.
Friedman, D.E. 2001. ‘Employer supports for parents with young children’, The Future for Children, 11: 63–77.
Goff, S.J., Mount, M.K. & Jamison, R.L. 1990. ‘Employer supported child care, work/family conflict, and absenteeism: A field study’, Personnel Psychology, 43: 793–809.
Goldberg, C.B. & Waldman, D.A. 2000. ‘Modelling employee absenteeism: Testing alternative measures and mediated effects on job satisfaction’, Journal of Organisational Behaviour, 21: 665–666.
Harrison, D.A. & Hulin, C.L. 1989. ‘Investigations of absenteeism: Using event history models to study the absence-taking process’, Journal of Applied Psychology, 74: 300–316.
Harrison, D.A., & Martocchio, J.J. 1998. ‘Time for absenteeism: A 20-year review of origins, offshoots, and outcomes’, Journal of Management, 24: 305–350.
Hoque, E. & Islam, M. 2003. ‘Contribution of some behavioural factors to absenteeism of manufacturing workers in Bangladesh’, Pakistan Journal of Psychological Research, 18: 81–95.
Huse, E.F. & Taylor, E.K. 1962. ‘Reliability of absence measures’, Journal of Applied Psychology, 46: 159–160.
Johnson, C.J., Croghan, E. & Crawford, J. 2003. ‘The problem and management of sickness absence in the National Health Service’, Journal of Nursing Management, 11: 336–342.
Kelly, E.L. 2003. ‘The strange history of employer-sponsored childcare: Interested actors, uncertainty, and the transformation of law on organisational fields’, American Journal of Sociology, 2002: 606– 649.
Kerlinger, F.N. & Lee, H.B. 2000. Foundations of Behavioural Research. New York: Harcourt College.
Kossek, E.E. & Nichol, V. 1992. ‘The effects of on-site child care on employee attitudes and performance’, Personnel Psychology, 45: 485–509.
Kossek, E.E., Dass, P. & DeMarr, B. 1994. ‘The dominant logic of employer sponsored work and family initiatives: Human resource managers’ institutional role’, Human Relations, 47: 1121–1149.
Landy, F.J. & Conte, J.M. 2004. Work in the 21st century: An Introduction to Industrial and Organisational Psychology. New York: McGraw-Hill.

B. Anderson & D.J. Geldenhuys
44
Lau, V.C., Au, W.T., & Ho, J.M. 2003. ‘A qualitative and quantitative review of antecedents of counterproductive behaviour in organisations’, Journal of Business and Psychology, 18: 73–93.
Martocchio, J.J & Jimeno, D. 2003. ‘Employee absenteeism as an affective event’, Human Resource Management Review. Special Issue: Methodological Issues in Absenteeism Research and Human Resource Management and Entrepreneurship, 13: 227–241.
McKay, P.F & McDaniel, M.A. 2006. ‘A re-examination of black–white mean differences in work performance: More data, more moderators’, Journal of Applied Psychology, 31(3): 538–554.
Milkovich, G.T. & Gomez, L.R. 1976. ‘Day care and selected employee work behaviours’, Academy of Management Journal, 19: 111–115.
Mitchell, A., Stoney, L. & Dichter, H. 2001. Financing child care in the United States: An expanded catalog of current strategies. [Online] Available at: http://www.kauffman.org/pdf/childcare2001.pdf. Accessed: 1 October 2011.
Morrissey, T.W. & Warner, M.E. 2009. ‘Employer-supported child care: Who participates’, Journal of Marriage and Family, 71: 1340–1348.
Muchinsky, P.M. 1977. Psychology Applied to Work: An Introduction to Industrial and Organisational Psychology. Chicago: Dorsey Press.
Neal, M.B., Chapman, N.J., Ingersoll-Dayton, B. & Emlen, A.C. 1993. Balancing Work and Caregiving for Children, Adults and Elders. London: Sage.
Patton, E. & Johns, G. 2007. ‘Women’s absenteeism in the popular press: Evidence for a gender specific absence culture’, Human Relations, 60: 1579–1612.
Rhoades, L & Eisenberger. 2002. ‘Perceived organizational support: A review of the literature’, Journal of Applied Psychology, 87: 698–714.
Rhodes, S. & Steers, R.M. 1990. Managing Employee Absenteeism. New York: Addison-Wesley.
Robbins, S., Odendaal, A. & Roodt, G. 2001. Organisational Behaviour: Global and Southern African Perspectives. Johannesburg: Pearson Education.
Robbins, S., Judge, T.A., Odendaal, A. & Roodt, G. 2009. Organisational Behaviour: Global and Southern African Perspectives. Johannesburg: Pearson Education.
Roth, P.L. Huffcutt, A.I. & Bobko, P. 2003. ‘Ethnic group differences in measures of job performance: A new meta-analysis’, Journal of Applied Psychology, 87: 698–714.
Rothausen, T.J., Gonzales, J.A., Clarke, N.E. & O’Dell, L.L. 1998. ‘Family friendly backlash – fact or fiction? The case of organisations’ on site child care centres’, Personnel Psychology, 51: 685–706.
Siu, O. 2002. ‘Predictors of job satisfaction and absenteeism in two samples of Hong Kong nurses’, Journal of Advanced Nursing, 40: 218–229.
Sutton, K.L. & Noe, R.A. 2005. Family-friendly Programs and Work–Life Integration: More Myth than Magic. New Jersey. Lawrence Erlbaum Associates.
Vaida, G. 2005 Sick leave costs SA millions. Sunday Times, 25 August, 12.

45
Commonality between the preparer and the user of financial information
Voss, M., Floderus, B. & Diderichsen, F. 2001. ‘Changes in sickness absenteeism following the introduction of a qualifying day for sickness benefit: Findings from Sweden Post’, Journal of Public Health, 29: 166–174.