the relationship between early life stress and microstructural
TRANSCRIPT

© 2008 Dove Medical Press Limited. All rights reservedNeuropsychiatric Disease and Treatment 2008:4(1) 193–201 193
O R I G I N A L R E S E A R C H
The relationship between early life stressand microstructural integrity of the corpus callosum in a non-clinical population
Robert Paul1
Lorrie Henry2
Stuart M Grieve3
Thomas J Guilmette2,4
Raymond Niaura4
Richard Bryant5
Steven Bruce1
Leanne M Williams3,6
Clark C Richard7
Ronald A Cohen4
Evian Gordon3,7
1University of Missouri, St. Louis, St. Louis, MO, USA; 2Providence College, Providence, RI, USA; 3The Brain Resource International Database,The Brain Resource Company, Ultimo, NSW, Australia; 4Brown Medical School, Department of Psychiatry, Providence, RI, USA; 5School of Psychology, University of New South Wales, Sydney, NSW, Australia; 6Brain Dynamics Centre, Westmead Millennium Institute, Westmead Hospital, Westmead, NSW, Australia; 7Cognitive Neuroscience Laboratory and School of Psychology, Flinders University, Adelaide, SA, Australia
Correspondence: Robert PaulUniversity of Missouri, St. Louis, Department of Psychology, Divisionof Behavioral Neuroscience, Stadler Hall 412, One University Blvd, St. Louis,MO, USA
Background: Previous studies have examined the impact of early life stress (ELS) on the
gross morphometry of brain regions, including the corpus callosum. However, studies have not
examined the relationship between ELS and the microstructural integrity of the brain.
Methods: In the present study we evaluated this relationship in healthy non-clinical participants
using diffusion tensor imaging (DTI) and self-reported history of ELS.
Results: Regression analyses revealed signifi cant reductions in fractional anisotropy (FA)
within the genu of the corpus callosum among those exposed to the greatest number of early
life stressors, suggesting reduced microstructural integrity associated with increased ELS. These
effects were most pronounced in the genu of the corpus callosum compared to the body and
splenium, and were evident for females rather than males despite no differences in total ELS
exposure between the sexes. In addition, a further comparison of those participants who were
exposed to no ELS vs. three or more ELS events revealed lower FA in the genu of the corpus
callosum among the ELS-exposed group, with trends of FA reduction in the body and the
whole corpus callosum. By contrast, there were no relationships between ELS and volumetric
analysis of the CC regions. The two group did not differ signifi cantly on measures of current
depression, stress or anxiety.
Conclusion: Our results reveal that greater exposure to ELS is associated with microstructural
alterations in the white matter in the absence of signifi cant volumetric changes. Importantly,
our results indicate that exposure to ELS is associated with abnormalities on DTI despite the
absence of clinically signifi cant psychiatric symptoms. Future studies are needed to determine
whether specifi c types of ELS are more likely to impact brain structure and function.
IntroductionSustained stress early in life has been shown to increase the amount of adrenal steroid
hormones in the body and these hormones in turn have a negative impact on brain
structure (Sapolsky 1999). Numerous studies have revealed that psychological stress
greatly affects brain structure, function, and volume. The hippocampus, in particular,
appears to be highly vulnerable to stress (Huot et al 2002). Studies have revealed that
exposure to glucocorticoid (GC) hydrocortisone adversely affects the hippocampus
in rodent brains (McEwen et al 1992) and Sheline et al (1996) reported signifi cant
correlations between the duration of depression and the extent of hippocampal atrophy
in human adults as measured by magnetic resonance imaging (MRI).
The effects of early life stress (ELS) on brain structure are not limited to the
hippocampal system. DeBellis et al (1999) reported that maltreated children and
adolescents had reduced volume of the corpus callosum (CC). Similarly, Teicher et al
(2004) revealed a signifi cant reduction in CC volume among children with a history of
abuse or neglect compared to healthy control subjects. Importantly, these effects held
after controlling for current symptoms of psychiatric health. The results revealed that

Neuropsychiatric Disease and Treatment 2008:4(1)194
Paul et al
early traumatic experience, rather than psychiatric illness,
was associated with decreased CC size. Recently members
of our group have reported that otherwise healthy individu-
als exposed to ELS have smaller volumes of the anterior
cingulate cortex and caudate nuclei compared to individuals
without exposure to ELS. Collectively these fi ndings suggest
that exposure to ELS is associated with alterations in brain
structure independent of major psychopathology.
While the previous studies have generally revealed a
relationship between gross morphometry of the CC and
ELS, few studies have examined the microstructural integrity
of the brain white matter. Diffusion tensor imaging (DTI)
is a relatively new method of examining microstructural
integrity of the brain. DTI measures the rate and directionality
of water diffusion within specifi c anatomic regions of inter-
est and there is some evidence that DTI is more sensitive to
structural brain abnormalities compared to traditional MRI
morphometry (Neil et al 2002). Fractional anisotropy (FA) is
a common scalar metric employed in DTI studies, and lower
FA is generally believed to refl ect reduced integrity of white
matter structures. Previous studies have demonstrated altera-
tions in FA in a number of psychiatric conditions including
obsessive-compulsive disorder (Szeszko et al 2005) and in
early onset schizophrenia (Kumra et al 2005).
To our knowledge no study has examined the relationships
between exposure to ELS and alterations in the microstructural
integrity of the brain as measured by DTI. In the present study
we examined these relationships among otherwise healthy
adults who reported ELS and healthy individuals without
exposure to any ELS. We examined the overall relationship
between total ELS exposure (ie, number of events) and both
FA and gross volume of the genu, body and splenium of the
CC. We focused this study on the CC because of the previous
work described by Teicher et al (2004) demonstrating signifi -
cant reductions in the volume of the CC among individuals
with histories of childhood neglect. In the present study we
were interested if the alterations in the macrostructral integrity
of the CC described by Teicher et al (2004) would be evident
at the microscopic level in an otherwise healthy sample.
Consistent with previous studies (McFarlane et al 2005) we
subdivided our sample by ELS exposure, and compared indi-
viduals with high exposure (3 or more events) to individuals
with no exposure on FA and regional volumetrics in the CC.
We hypothesized that total ELS exposure would be associated
with lower FA of the CC and lower volume of the CC, and
individuals classifi ed as ELS-high would exhibit signifi cantly
reduced FA in the CC and volume of the CC compared to
individuals classifi ed in the ELS-none group.
MethodParticipantsThe participants in this study were 116 healthy subjects
participating in the Brain Resource International Database
(BRID) (Gordon 2003; Gordon et al 2005). The BRID is a
comprehensive database of brain function containing data
from subjects recruited at six primary sites throughout the
world (two sites in the US, two sites in Australia, one site in
The Netherlands, and one site in the United Kingdom). For
the purpose of the present study, only individuals recruited
from one site in Australia were included; these were the
only individuals among the BRID cohort to complete the
DTI imaging protocol. Participants were excluded if they
reported a history of mental illness as assessed by the Somatic
and Psychological Health Report (SPHERE) (Hickie et al
2001), physical brain injury, neurological disorder or other
serious medical condition and/or a personal history of drug
or alcohol addiction. Participants were further excluded if
they reported a family history of attention defi cit hyperac-
tivity disorder (ADHD), schizophrenia, bipolar disorder, or
genetic disorder. Each site involved in collecting data for the
database completed obtained approval from a local Institu-
tional Review Board and all participants in the study signed
a written informed consent to participate in the database.
For the purpose of the present study we selected only
individuals from the BRID who were older than 18 years of
age to avoid confounding alterations in white matter associ-
ated with ELS and ongoing neurodevelopment of children
and adolescents. Demographic information for the samples
are provided in Table 1.
Tasks, materials, and proceduresEach participant completed a web-based questionnaire to
retrospectively assess exposure to early life stress based
on (Sanders and Becker-Lausen 1995). This questionnaire
consisted of 19 items that ascertained whether or not the
participant had experienced physical, emotional, or sexual
Table 1
ELS total ELS high ELS none
Age 38.5 (16.1) 41.0 (16.5) 38.1 (17.2)Education 13.8 (2.7) 14.6 (2.7) 13.6 (2.6)Handedness R (91%), L (9%) 100% R (93%), L (7%)Gender 54% female, 60% female, 53% female, 46% male 40% male 47% maleDASS depression 4.9 (9.6) 3.3 (3.0) 2.2 (3.0)DASS anxiety 2.6 (3.6) 1.7 (1.8) 1.1 (1.8)DASS stress 7.0 (6.4) 4.6 (4.2) 3.3 (2.9)
Neuropsychiatric Disease and Treatment 2008:4(1) 195
ELS and white matter
abuse as well as other traumatic experiences such as sustained
bullying in school, poverty, divorce, illness, or domestic
violence. The participant responded either yes (the particular
stressor was present) or no (the particular stressor was not
present), and when present the participants identifi ed the
age of onset (0–12 years of age). The questionnaire was
developed for use in the BRID, and the questionnaire has
been employed in previous studies (McFarlane et al 2005;
Cohen et al 2006). The ELS questionnaire is based on the
Child Abuse and Trauma Scale (Sanders and Becker-Lausen
1995) and as noted by Cohen et al (2006), the items from the
questionnaire are consistent with other reports of childhood
trauma estimates (McGee et al 1995).
All participants completed the 21-item short version of
the Depression, Anxiety and Stress Scale (DASS) (Lovibond
and Lovibond 1995). The DASS is a brief self-report inven-
tory consisting of questions regarding current symptoms of
depression, anxiety and stress. Individuals are required to
rate their degree of agreement with the individual questions
using a Likert scale. Individual scores were generated for the
three subscales (ie, depression, anxiety, stress). The DASS
was administered to characterize the current psychological
health of the sample.
Image acquisitionNeuroimaging was conducted using a 1.5 Tesla Siemens
(Erlangen, Germany) Sonata at Perrett Imaging, Flinders
University, Australia. 3D T1-weighted images (T1W)
were acquired in the sagittal plane using a 3D MPRAGE
sequence (TR = 9.7 ms; TE = 4 ms; Echo train: 7; Flip
Angle = 12°; TI = 200 ms; NEX = 1). A total of 180
contiguous 1 mm slices were acquired with a 256 × 256
matrix with an in-plane resolution of 1 mm × 1 mm resulting
in isotropic voxels. Proton density and T2-weighted (T2W)
images were acquired using a dual echo sequence (TR:
7530 ms; TE: 15/105 ms; Echo train: 7; Flip Angle: 180°;
NEX: 1). 45 contiguous 1 mm slices were acquired in an
axial orientation with an in-plane matrix of 256 × 256 at
a resolution of 0.86 mm × 0.86 mm. DTI was acquired
using a DTI-EPI sequence (TR: 160 ms; TE: 88 ms; Fat
Saturation; NEX: 4). A baseline image (b = 0) and 12 different
diffusion orientations were acquired with a b-value of 1250.
32 contiguous slices of 6.5 mm were acquired with an in-plane
matrix of 128 × 128 at a resolution of 1.72 mm × 1.72 mm.
Diffusion tensor analysisDTI data were processed using a customized routine (by
SMG) in MATLAB 6.5 (MathWorks, Natick, USA). Trace
apparent diffusion co-effi cient TrADC and FA images were
calculated in native space from the b = 0 image and 12 dif-
fusion weighted imaged images (b = 1250 s cm−2). FA was
defi ned according to Pierpaoli and Basser (1996).
Corpus callosum parcellationA hand-drawn region of interest was drawn using a normal-
ized, averaged and high resolution (1 mm3) smoothed white
matter image created from 223 individuals from the BRID
dataset (Grieve 2005). The division between the genu and
frontal pericallosal tissue, and between the postero-lateral
extent of the splenium and parietal pericallosal tissue was
defi ned by a pair of planes positioned at the medial 30%
of the brain diameter at the level of the genu or splenium
as described by Pfefferbaum et al (2000). The anterior and
posterior extent of the body of the corpus callosum were
defi ned by the MNI coordinates y = +17 to −18 mm. The
genu and splenium were defi ned as the remaining anterior
and posterior components of the whole CC region of interest
(ROI) respectively.
Segmentation of T1 MRI dataSegmentation, co-registration and normalization of the T1W
datasets was performed using Statistical Parametric Mapping
(SPM2) (Wellcome Department of Imaging Neuroscience,
London; http://www.fi l.ion.ucl.ac.uk/spm), running under
MATLAB 6.5 using an optimized VBM protocol at a reso-
lution of 1 mm3. The details of this procedure have been
previously described (Ashburner 2000; Good 2001; Grieve
2005). Customized gray matter (GM), white matter (WM)
and CSF template images were created from the averaged
T1W images of 223 individuals in the BRID database (Grieve
2005). The fi nal step of this protocol involved normalizing
segmented WM data to a target high resolution, smoothed
WM template.
Creation of custom CC masks for FAand volume analysisFollowing segmentation and normalization of the WM of
each subject image to MNI space, the standard CC ROI
masks were masked using a threshold of WM probability
� 0.4, so as to only include WM voxels. The WM data and the
modifi ed CC ROI masks were transformed back into “native”
T1W image space using the inverse of the deformation fi elds
created through the normalization process (Deformation
Toolbox, SPM2, John Ashburner). At this point WM volume
was calculated for each CC ROI using the segmented WM
data in native space and the CC masks. The native T1W

Neuropsychiatric Disease and Treatment 2008:4(1)196
Paul et al
image was then co-registered to the T2W dataset, in the
process re-sampling to the 3 mm slice thickness of the T2W
data. The T2W data was then co-registered to the calculated
TrADC image – this image pair was chosen for this spatial
transform as best results were obtained in iterative testing
(data not shown). Figure 1 shows a T2W image with both the
FA (Figure 1a) and TrADC image (Figure 1b) superimposed.
The transforms from these two steps were then used to
morph both the segmented WM data and the CC masks to
the native space of the DTI dataset. These steps resulted
in individualized WM masks and ROIs for each subject,
permitting quantitative analysis of the FA and TrADC data in
native space. Figure 1c shows the CC ROI superimposed over
the T2W image following this transform. Note some overlap
between CC ROI and the trigone of the lateral ventricle was
present – an important detail as the high FA of the CC could
easily be contaminated by the low FA present in the CSF
structure. The WM map is also superimposed on the T2W
Figure 1 An axial slice from the T2-weighted (T2W) image of a representative individual. The slice position was chosen to cut through both the trigone of the lateral ventricles and the genu and splenium of the corpus callosum (CC). The T2W image shown has been co-registered to native “DTI-data” space. (a) The T2W image with FA data superimposed in color. (b) The T2W image with the apparent diffusion coeffi cient image superimposed in color. The T2W image and the ADC map were chosen as the image pair to perform the co-registration procedure. (c)The T2W image with the CC ROI superimposed in color. Note that there is no overlap between the ROI and the CSF (bright in the T2W image). (d) The T2W image with the WM map generated from the T1-weighted data superimposed.
Neuropsychiatric Disease and Treatment 2008:4(1) 197
ELS and white matter
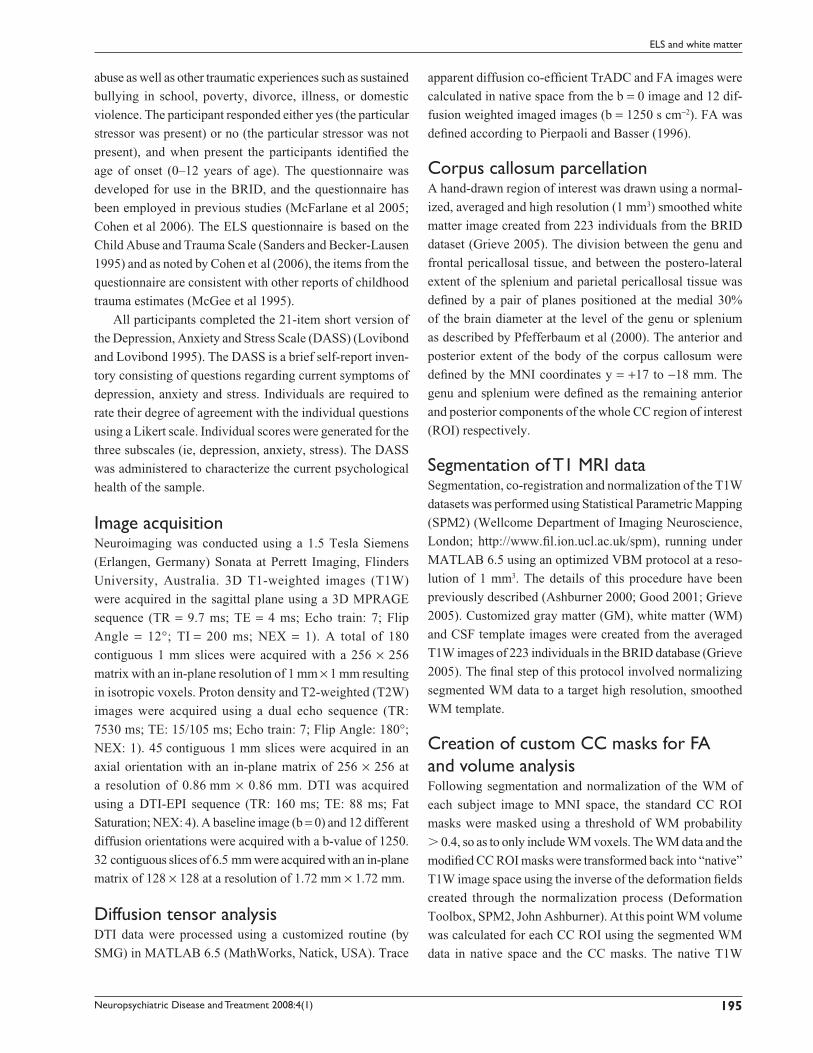
image and shows clear defi nition of the WM from both CSF
and GM structures. Figures 2a–2d show a series of axial slices
showing CC ROI superimposed on the FA map.
Statistical analysisFour separate hierarchical regression analyses were con-
ducted to examine the relationship between DTI metrics and
ELS. In each regression, age was entered in the fi rst block and
FA and total number of ELS events per participant entered as
in the second block as independent variables; FA in the spe-
cifi c brain region served as the dependent variable. A similar
series of analyses were completed to examine the relationship
between ELS and volume of the CC subregions. In order to
compare our results with a previous report from this cohort
(McFarlane et al 2005) we also subdivided the ELS sample
into a high exposed group (3 or more ELS events) and an
unexposed group (0 ELS events). To control for Type 1 error,
we completed two MANOVAs. One MANOVA included
the DTI CC subregions and the second MANOVA included
the volumetric indices of the CC. Univariates were only
examined when the omnibus MANOVA was statistically
signifi cant.
Figure 2 A series of axial slices from the FA data of a representative individual. Slices are presented in inferior to superior order from (a – d). The corpus callosum (CC) region of interest is superimposed in yellow.
Neuropsychiatric Disease and Treatment 2008:4(1)198
Paul et al
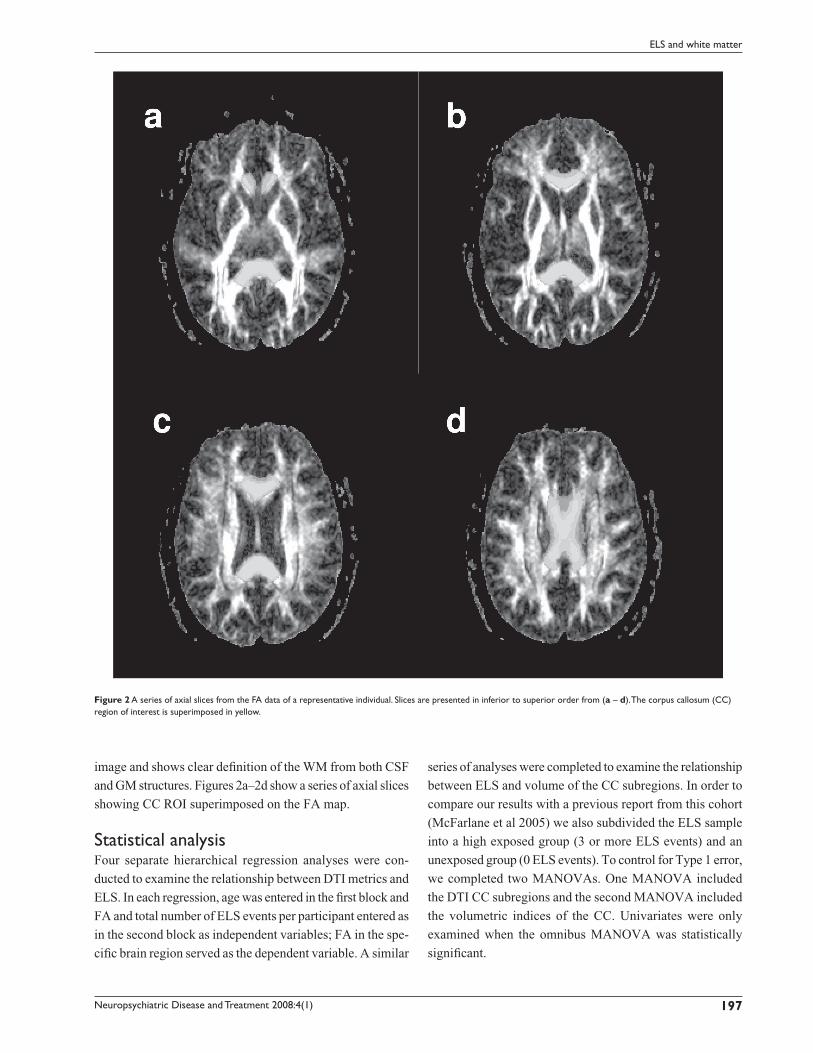
ResultsThe mean number of stressors for the overall sample was
5.4 (2.0). Table 2 lists the frequency of participants report-
ing a specifi c ELS event. As a group, individuals reported
scores on the DASS that fell within the expected range for
healthy controls (consistent with the inclusion criteria for
the sample).
Regression analyses were conducted to examine the degree
of shared variance between total ELS exposure and FA in the
three regions of the CC above and beyond the relationship
between age and FA. In these analyses, all individuals were
included in the regression, and age and total ELS score (sum
of all ELS events per subject) was entered into the regres-
sion as the independent variables in separate blocks. FA in
each region of the CC was entered as the dependent variable.
Results of each of these regressions revealed that age was
signifi cantly negatively associated with FA in each CC sub-
region. ELS contributed above and beyond that relationship in
the genu (beta = −0.39 for age and −0.17 for ELS, cumulative
R = 0.44) but not in the other subregions. Interestingly, when
males and females were considered in separate regressions,
the effect of total ELS on FA in the genu was evident only
among females, and again this relationship above and beyond
the relationship between age and FA (beta = −0.33 for age
and −0.26 for ELS, cumulative R = 0.41).
Consistent with previous work (McFarlane et al 2005),
we conducted between-group independent-group t-tests to
examine the effect of ELS (exposed vs. unexposed) on DTI
values. The exposed group consisted of individuals with
three or more ELS events, whereas the non-exposed group
consisted of individuals with no history of ELS. Preliminary
analyses revealed no signifi cant differences between these
subgroups in terms of age, education, or gender distribution.
In addition, the two groups did not differ on the individual
scores from the DASS (ps � 0.05), though the ELS-high
group on average scored higher than the ELS-none group
on each index.
Results of the MANOVAs contrasting imaging indi-
ces between the ELS-none and ELS-high group revealed
that the ELS-exposed group exhibited lower FA indices
compared to the ELS-none group (F(4,111) = 3.8, Wilks’
Lambda = 0.87, p � 0.006). The mean difference between
FA value was signifi cantly different in the genu (p � 0.05),
while a trend was evident in the body of the CC (p � 0.02)
and the whole CC (p � 0.05). There was no signifi cant dif-
ference in FA values between the two groups in the splenium
(p = 0.24). The overall MANOVA contrasting the volumes
of the CC was not statistically signifi cant (F(4,111) = 0.41,
Wilks’ Lambda = 0.98, p � 0.05). See Table 3 for means
and standard deviations.
DiscussionThis study sought to determine if ELS is associated with
altered brain integrity in a healthy population using a highly
sensitive DTI protocol. Our results indicate that exposure to
ELS is related to reduced integrity of the genu region of the
CC. These fi ndings are noteworthy given that our sample
was rigorously screened for both medical and psychiatric
symptoms, and therefore represented a very healthy group
of individuals. Our fi ndings suggest that exposure to stress
early in life impacts the microstructural integrity of the white
matter and these effects are evident in the absence of current
psychopathology in adulthood.
McFarlane et al (2005) utilized the same ELS question-
naire as used in this current study in order to analyze the
global effects of ELS in non-clinical participants. Participants
in the study qualifi ed as ELS-exposed if they acknowledged
having experienced 3 out of any 19 stressors on the ELS
survey (eg, sustained bullying, sexual or physical abuse,
divorce, illness, poverty, or neglect). ELS-unexposed
participants were those who had not experienced any ELS
(responded no to all questions). Results revealed that ELS
was associated with signifi cantly decreased power across the
EEG spectrum as well as a positive correlation between the
number of stressors experienced and scores on the Depression
Anxiety Stress Scale (McFarlane et al 2005). Also using this
ELS questionnaire, Cohen et al (2006) recently identifi ed
Table 2 Frequencies of ELS events for the entire sample
ELS Event Frequency
Premature Birth 0Natural Disaster 4Adoption 1Surgery 7Life Threatening Illness 8Bullying 7Physical Abuse 5Sexual Abuse 4Emotional Abuse 5Poverty 0House destroyed by disaster 0War 3Divorce 8Separated from family 7Sustained Confl ict 11Death of loved one 1Illness 4Violence 7Witness other traumatic event 0

Neuropsychiatric Disease and Treatment 2008:4(1) 199
ELS and white matter
strong relationships between reduced size of the anterior
cingulate cortex (ACC) on MRI and higher levels of ELS.
Our sample from the international database was largely inde-
pendent of the two previous samples studied by Cohen and
McFarlane, suggesting a consistent impact of ELS on brain
integrity across cohorts. Taken collectively it appears that
ELS impacts brain development in non-clinical participants.
This study extends these observations by demonstrating that
ELS may affect the microstructural integrity of the CC as
evidenced by DTI.
In the present study FA values were signifi cantly reduced
in the genu of the CC among individuals exposed to ELS, with
trends evident in the body and whole CC. The splenium also
showed reduced FA values, but to a lesser degree. This would
indicate that the effect of ELS on the CC may be directed
rostrally. This fi nding is consistent with previous observations
that have identifi ed the more rostral regions of the CC as most
vulnerable to the effects of ELS. For example, Teicher et al
(2004) reported an association between early maltreatment and
reductions in the size of the amygdala, hippocampus, and other
areas that are located in more anterior regions of the brain as
defi ned by MRI volumetrics, though other studies have also
implicated posterior brain regions (Teicher et al 2003).
Given the associational nature of our data we cannot
infer a causal relationship between ELS and microstructural
abnormalities of the white matter. One alternative is that
evidence of reduced FA among adults with histories of ELS
represents a degenerative effect of stress hormones on brain
tissue. However, it is important to note that reduced volume
of the CC as described by Teicher et al (2004) in children
with histories of neglect argues that the impact of ELS is
more likely occurring during developmental windows when
the white matter is still maturing rather than a degenerative
effect occurring within a fully developed system. Studies
that employ DTI in longitudinal studies among children can
help to clarify this issue with greater certainty.
Interestingly, ELS associated more strongly with FA values
in the CC among females but not males in the current study.
This fi nding is interesting as males and females experienced
a similar number of total ELS events, and therefore the differ-
ences on brain integrity cannot be attributed to total ELS expo-
sure. It is possible that qualitative differences in ELS events
between males and females (eg, more bullying experienced by
males, sexual trauma experienced by females) could account
for the differences and more comprehensive studies are needed
to address this issue. The fi ndings do, however, raise the ques-
tion as to whether interactions between stress during early life
and biological systems during a period of brain development
could interact in a differential manner between females and
males. Prospective studies with well defi ned clinical cohorts
would help address this question more thoroughly.
Although the present fi ndings are intriguing, several meth-
odological limitations should be considered. First, the overall
number of individuals with signifi cant histories of ELS (3 or
more events) was relatively small and this was exacerbated
when we subdivided the group into a high vs. low ELS density.
Relatedly our questionnaire included a broad range of ELS
subtypes (premature birth, emotional abuse, bullying, etc), and
we were not able to subtype the ELS exposure to determine
whether specifi c ELS events are more likely to be associated
with alterations in microstructural integrity of the brain. In
our study this limitation was driven by the high degree of
multiple ELS events among those exposed to any ELS. That
is, individuals that reported at least one stressor typically
reported multiple stressors and this limited our ability to dif-
ferentiate the unique impact of any given stressor. With these
points noted, our results are best interpreted as preliminary
evidence of microsturctural alterations in the white matter
among individuals exposed to multiple ELS events.
Also of importance would be to examine the impact
of different developmental windows in which the stressor
may have occurred. If activation of biological systems
Table 3 FA values and gross morphometry for the whole group and ELS-high vs. ELS-none
Variable Whole group ELS-High ELS-None
Mean FA Value – Whole CC 0.54 (0.09) 0.49 (0.13) 0.54 (0.08)Mean FA Value – Genu* 0.45 (0.09) 0.39 (0.13) 0.45 (0.07).Mean FA Value – Body 0.56 (0.11) 0.50 (0.16) 0.57 (0.09)Mean FA Value – Splenium 0.58 (0.10) 0.55 (0.12) 0.58 (0.10)
Mean volume – Whole CC 18.3 (2.9) 17.8 (3.5) 18.3 (2.7)Mean Volume – Genu 5.6 (1.0) 5.5 (1.3) 5.5 (0.95)Mean Volume – Body 4.4 (0.71) 4.3 (0.77) 4.3 (0.71)Mean Volume – Splenium 8.4 (1.3) 8.0 (1.7) 8.4 (1.2)
* = Signifi cant differences (p � .05); FA = fractional anisotropy

Neuropsychiatric Disease and Treatment 2008:4(1)200
Paul et al
(eg, glucocorticoids) by exposure to ELS occurs during
periods of maximum white matter development, then the
effect of the stressful event could produce more signifi cant
deleterious effects on brain integrity than if neurodevelop-
ment had been completed at the time of exposure. Studies
that include individuals with different onset periods during
development (childhood, early adolescence, late adolescence,
etc) are critical to addressing this issue.
Our sample was healthy in terms of psychological and
psychiatric symptoms, and few studies have examined DTI
parameters among patients with anxiety-related disorders.
In one recent study Abe et al (2006) reported increased FA
in the cingulum among patients with post-traumatic stress
disorder, and while these results seem counterintuitive to our
fi ndings, the different regions of interest (white matter vs.
gray matter) is noteworthy and therefore direct comparisons
between the studies cannot be completed. Further, and per-
haps more importantly, the individuals examined in the Abe
et al (2006) study were exposed to the stressor in adulthood
(age range = 24–64), after completion of brain development,
whereas all of our participants were exposed during child-
hood when the brain was still actively undergoing myelina-
tion. Nevertheless, future studies will need to examine DTI
metrics in gray matter regions of the brain among individuals
exposed to ELS in order to determine the impact of exposure
across multiple brain circuits.
Finally, it would be critical to determine whether ELS
lowers a particular threshold of brain integrity, whereby
exposure to subsequent events in adulthood or increased
vulnerability from genetics, results in the expression of
psychiatric symptoms. The absence of gross morphometric
fi ndings in our sample, and the observation that our cohort did
not exhibit any current psychiatric symptoms, hints towards
such a threshold model, where the clinical signifi cance of
the DTI alterations evident in this study do not emerge in
the absence of more severe or subsequent psychological
traumas. New advances in the fi eld of imaging genomics
offer exceptional opportunities to investigate these possible
interactions and potentially identify cohorts of individuals
that could be directed towards treatment options to offset any
putative disruption in “brain reserve” prior to the develop-
ment of signifi cant psychological dysfunction. In summary
this study represents the fi rst preliminary evidence of micro-
structural alterations in the white matter observed using in
vivo imaging among individuals exposed to high levels of
aversive life events during childhood. Additional studies
are needed to identify characteristics of both the individuals
and the aversive events associated with these fi ndings, and
opportunities for intervention to minimize the expression of
clinically signifi cant symptoms.
AcknowledgmentsWe acknowledge the support of the Brain Resource Interna-
tional Database (under the auspices of The Brain Resource
Company – http://www.brainresource.com) for use of data.
We also thank the individuals who gave their time to par-
ticipate in the database. Access to the database for scientifi c
purposes is overseen by a scientifi c network (BRAINnet;
http://www.brainnet.org.au), which is coordinated inde-
pendently of the commercial operations of BRC. L.M.W is
supported by a Pfi zer Senior Research fellowship.
ReferencesAbe O, Yamasue H, Kasai K, et al. 2006. Voxel-based diffusion tensor
analysis reveals aberrant anterior cingulum integrity in posttraumatic stress disorder due to terrorism. Psychiatry Res, 146:231–42.
Ashburner J, Friston KJ. 2000. Voxel-based morphometry – the methods. Neuroimage, 11:805–21.
Bremner JD. 1999. Does stress damage the brain? Soc Biol Psychiatry, 45:797–805.
Cohen RA, Grieve S, Hoth KF, et al. 2006. Early life stress and morphom-etry of the adult anterior cingulate cortex and caudate nuclei. Biol Psychiatry, 59:975–82.
Debellis MD, Keshavan MS, Clark DB, et al. 1999. Developmental trauma-tology Part II: Brain development. Biol Psychiatry, 45:1271–84.
Friston KJ, Holmes A, Poline JB, et al. 1996. Detecting activations in PET and fMRI: levels of inference and power. Neuroimage, 4:223–35.
Gordon E, Cooper N, Rennie C, et al. 2005. Integrative neuroscience: the role of a standardized database. Clin EEG Neurosci, 36:64–75.
Grieve SM, Clark CR, Williams LM, et al. 2005. Preservation of limbic and paralimbic structures in aging. Hum Brain Mapp, 25:391–401.
Hickie I, Davenport T, Hadzi-Pavlovic D, et al. 2001. SPHERE: national depression project. SPHERE National Scretariat. Med J Aust, 175 Suppl:S4–5.
Huot RL, Plotskyt PM, Lenox RH, et al. 2002. Neonatal maternal separa-tion reduces hippocampal mossy fi ber density in adult Long Evans rats. Brain Res, 950:52–63.
Kumra S, Ashtari M, Cervellione K, et al. 2005. White matter abnormalities in early onset schizophrenia.. J Am Acad Child Adolesc Psychiatry, 44:934–41.
Lovibond P, Lovibond S. 1995. The structure of negative emotional states: comparison of the Depression Anxiety Stress Scales (DASS) with the Beck Depression and Anxiety Inventories. Behav Res Ther, 33:335–43.
McEwen BS, Gould EA, Sakai RR. 1992. The vulnerability of the hip-pocampus to protective and destructive effects of glucocorticoids in relation to stress. Br J Psychiatry, 160:18–24.
McGee RA, Wolfe DA, Yuen SA, et al. 1995. The measurement of maltreat-ment: a comparison of approaches. Child Abuse Negl, 19:233–49.
McFarlane A, Clark CR, Bryant RA, et al. 2005. Impact of ELS on psychophysiological personality and behavioral measures. J Integ Neuroscience, 4:27–40.
Neil J, Miller J, Mukherjee P, et al. 2002. Diffusion tensor imaging of normal and injured developing human brain- a technical review. NMR Biomedicine, 15:543–52.
Pfefferbaum A, Sullivan EV, Hedehus M, et al. 2000. Age-related decline in brain white matter anisotropy measured with spatially corrected echo-planar diffusion tensor imaging. Magnetic Resonance in Medicine, 44:259–68.

Neuropsychiatric Disease and Treatment 2008:4(1) 201
ELS and white matter
Pierpaoli C, Basser PJ. 1996. Toward a quantitative assessment of diffusion anisotropy. Magn Reson Med, 36:893–906.
Sanders B, Becker-Lausen E. 1995. The measurement of psychological maltreatment. Child Abuse Negl, 19:315–23.
Sapolsky RM. 1999. Why stress is bad for your brain. Science, 12:330–2.Sheline Y, Wang P, Gado M, et al. 1996. Hippocampal atrophy in major
depression. Proc Natl Acad Science USA, 93:3908–13.Szeszko PR, Ardekani BA, Ashtari M, et al. 2005. White matter abnormali-
ties in obsessive compulsive disorder: a diffusion tensor imaging study. Arch Gen Psychiatry, 62:782–90.
Teicher MH, Andersen SL, Polcari A, et al. 2003. The neurobiological consequences of early stress and childhood maltreatment. Neurosci Biobehav Rev, 27:33–44.
Teicher MH, Dumont NL, Ito Y, et al. 2004. Childhood neglect is associated with reduced corpus callosum area. Biol Psychiatry, 56:80–5.
Tzourio-Mazoyer N, Landeau B, Papathanassiou D, et al. 2002. Automated anatomical labeling of activations in SPM using a macroscopic ana-tomical parcellation of the MNI MRI single-subject brain. Neuroimage, 15:273–89.
