the relationship between entrepreneurship and innovation
TRANSCRIPT
ESKİŞEHİR OSMANGAZİ ÜNİVERSİTESİ İİBF DERGİSİ, ARALIK 2016, 11(3), 7- 20
7
The Relationship between Entrepreneurship and Innovation: A
Dynamic Panel Data Analysis H. Bayram IŞIK
Prof. Dr., Kırıkkale Üniversitesi İİBF, İktisat Bölümü
Nihat IŞIK Prof. Dr., Kırıkkale Üniversitesi
İİBF, Ekonometri Bölümü [email protected]
Efe Can KILINÇ Arş. Gör.. Dr., Kırıkkale Üniversitesi
İİBF, Ekonometri Bölümü [email protected]
Girişimcilik ve İnovasyon Arasındaki İlişki: Bir Dinamik Panel Veri Analizi
Özet
Girişimcilik ve inovasyon çağımızın popüler kavramları arasındadır. İnovasyon ve girişimcilik, firmaların ve dolaylı olarak ülkelerin ekonomik ve sosyal dönüşümleri gerçekleştirmelerini ve rekabet avantajı elde etmelerini sağlayan faktörler arasında yer almaktadır. Bu çalışmada girişimcilik ve inovasyon arasındaki ilişki OECD ülkeleri özelinde 1990-2011 dönemi için dinamik panel veri yöntemi kullanılarak analiz edilmiştir. Sonuçlar, girişimcilik ile inovasyon arasında uzun dönemli bir ilişkinin olduğunu, buna karşın kısa dönemde bir ilişki olmadığını göstermektedir. Elde edilen bulgular, uzun dönemde işletme sahipliği oranındaki %1’lik artışın özel sektör Ar-Ge harcamalarını yaklaşık olarak %5.9 oranında artıracağına işaret etmektedir. Analiz sonuçları ayrıca; Belçika, Kanada, Çek Cumhuriyeti, Finlandiya, Fransa, Almanya, İrlanda, İtalya, Meksika, Polonya, Slovakya, Hollanda, İngiltere ve ABD’nin hata düzeltme parametrelerine ait katsayıların anlamlı göstermekte, dolayısıyla bu ülkelerde girişimcilik ile inovasyon arasında uzun dönemli bir ilişki olduğunu ortaya koymaktadır.
Anahtar Kelimeler: Girişimcilik, İnovasyon, Dinamik Panel Veri Analizi
Jel Kodları: L26, 031, C33
The Relationship between Entrepreneurship and Innovation: A Dynamic Panel Data Analysis
Abstract
Entrepreneurship and innovation are two of the most pervasive concepts of our times. Innovation and entrepreneurship have been one of the factors that provide developing countries to reach higher development stages as well as developed countries and to perform economic and social transformations and will continue. In this study, the relationship between innovation and entrepreneurship were examined for OECD countries for the period of 1990-2011 using dynamic panel data models. Results showed that the innovation and entrepreneurship have a long-term relationship, whereas in the short term there was no such indication. Accordingly, 1% increase in business ownership rate would increase the private sector R&D expenditures by 5.9%. Analysis results also showed that; the coefficients of error correction parameters of Belgium, Canada, Czech Republic, Finland, France, Germany, Ireland, Italy, South Korea, Mexico, Poland, Slovakia, the Netherlands, the United Kingdom and the United States were meaningful and revealed a long term relationship in these countries.
Keywords: Entrepreneurship, Innovation, Dynamic Panel Data Analysis
Jel Codes: L26, 031, C33
ESKİŞEHİR OSMANGAZİ ÜNİVERSİTESİ İİBF DERGİSİ
8
1. Introduction
Entrepreneurship, innovation and technology have been the main driving forces of development processes in high-income countries. Innovation and entrepreneurial activities are two most important dynamics of long-run economic growth. Entrepreneurs can commercialize their innovative new products and so dynamize the economy. In order to maintain long-run economic growth, the companies in the economy need to have motivation for product and process innovation and for entrepreneurial activities. Market economy and strong property rights create incentives for innovation and entrepreneurship (Hill, 2005; Demircan, 2006).
After 1980s, entrepreneurship, innovation and technology have contributed immensely to the process of fast development and transition of newly industrialized countries. Especially in recent years BRICS (Brazil, Russia, India, China and South Korea) countries have experienced high growth rates and affected/shaped global economic growth rates by means of knowledge-intensive industries, innovation and entrepreneurship. They serve as a model from this aspect.
The innovation capabilities of companies are the main source of sustainable competitive advantage. Companies which carry out the innovation activities intensively can minimize uncertainties about future, and can increase their competitive power and enable to be pioneer technologically in the field of activity. Entrepreneurs who take initiative in carrying out the innovative activities in firms can bring out new products, processes and services.
Challenges (such as not fully protected property rights, excessive government intervention to the market, and restriction of freedom) faced by entrepreneurs during and after the formation process of innovative activities must be minimized. This matter is one of the important components of entrepreneurship orientation, as well. When having strong the entrepreneurship orientation defined as strategy developing processes and applications used for determining and forming new opportunities leads to an innovative process by means of research and firm activities, which might provide a significant advantage for firms.
Policy planners in both the public and private sectors have growing interest about entrepreneurship, innovation and technological change, as a result of the shift towards a knowledge-based economy, the substantial increase in public investment in knowledge-based institutions, knowledge-generating public programs, and knowledge-sharing activities (Link, 2007: 1).
In recent years, there have been many attempts to combine entrepreneurship and innovation in a model. With this view, the some of the cornerstone models developed can be mentioned as Brazeal and Herbert (1999), Zhao (2005), McFadzean et al. (2005) and Shaw et al. (2005). Apart from these models, other models developed are Morris and Kuratko (2002), De Klerk and Kruger (2003) and Bygrave
ARALIK 2016
9
(2004) although these models did not cover the entrepreneurship and innovation relationship comprehensively. In addition, many studies have explored the relation among entrepreneurship, innovation and economic growth (e.g. Tang and Koveos 2004, Wong et al. 2005, Margaret 2008, Rooks et al. 2009, Hussain et al. 2011, Setyanti et al. 2013).
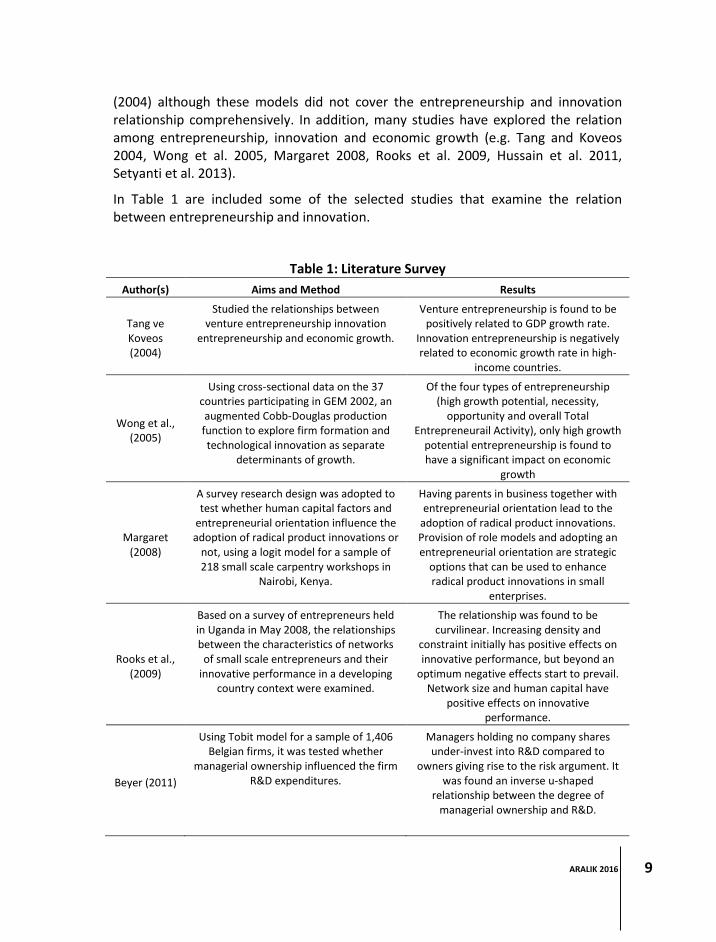
In Table 1 are included some of the selected studies that examine the relation between entrepreneurship and innovation.
Table 1: Literature Survey
Author(s) Aims and Method Results
Tang ve Koveos (2004)
Studied the relationships between venture entrepreneurship innovation
entrepreneurship and economic growth.
Venture entrepreneurship is found to be positively related to GDP growth rate.
Innovation entrepreneurship is negatively related to economic growth rate in high-
income countries.
Wong et al., (2005)
Using cross-sectional data on the 37 countries participating in GEM 2002, an augmented Cobb-Douglas production
function to explore firm formation and technological innovation as separate
determinants of growth.
Of the four types of entrepreneurship (high growth potential, necessity,
opportunity and overall Total Entrepreneurail Activity), only high growth
potential entrepreneurship is found to have a significant impact on economic
growth
Margaret (2008)
A survey research design was adopted to test whether human capital factors and
entrepreneurial orientation influence the adoption of radical product innovations or
not, using a logit model for a sample of 218 small scale carpentry workshops in
Nairobi, Kenya.
Having parents in business together with entrepreneurial orientation lead to the
adoption of radical product innovations. Provision of role models and adopting an entrepreneurial orientation are strategic
options that can be used to enhance radical product innovations in small
enterprises.
Rooks et al., (2009)
Based on a survey of entrepreneurs held in Uganda in May 2008, the relationships between the characteristics of networks
of small scale entrepreneurs and their innovative performance in a developing
country context were examined.
The relationship was found to be curvilinear. Increasing density and
constraint initially has positive effects on innovative performance, but beyond an
optimum negative effects start to prevail. Network size and human capital have
positive effects on innovative performance.
Beyer (2011)
Using Tobit model for a sample of 1,406 Belgian firms, it was tested whether
managerial ownership influenced the firm R&D expenditures.
Managers holding no company shares under-invest into R&D compared to
owners giving rise to the risk argument. It was found an inverse u-shaped
relationship between the degree of managerial ownership and R&D.
ESKİŞEHİR OSMANGAZİ ÜNİVERSİTESİ İİBF DERGİSİ
10
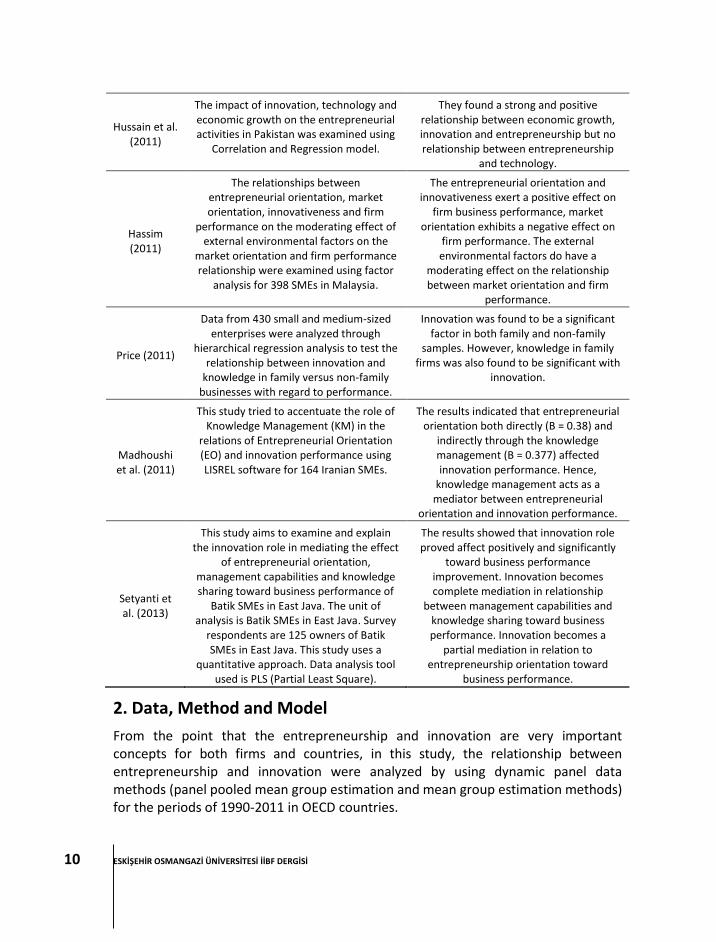
Hussain et al. (2011)
The impact of innovation, technology and economic growth on the entrepreneurial activities in Pakistan was examined using
Correlation and Regression model.
They found a strong and positive relationship between economic growth, innovation and entrepreneurship but no relationship between entrepreneurship
and technology.
Hassim (2011)
The relationships between entrepreneurial orientation, market orientation, innovativeness and firm
performance on the moderating effect of external environmental factors on the
market orientation and firm performance relationship were examined using factor
analysis for 398 SMEs in Malaysia.
The entrepreneurial orientation and innovativeness exert a positive effect on
firm business performance, market orientation exhibits a negative effect on
firm performance. The external environmental factors do have a
moderating effect on the relationship between market orientation and firm
performance.
Price (2011)
Data from 430 small and medium-sized enterprises were analyzed through
hierarchical regression analysis to test the relationship between innovation and
knowledge in family versus non-family businesses with regard to performance.
Innovation was found to be a significant factor in both family and non-family
samples. However, knowledge in family firms was also found to be significant with
innovation.
Madhoushi et al. (2011)
This study tried to accentuate the role of Knowledge Management (KM) in the
relations of Entrepreneurial Orientation (EO) and innovation performance using LISREL software for 164 Iranian SMEs.
The results indicated that entrepreneurial orientation both directly (B = 0.38) and
indirectly through the knowledge management (B = 0.377) affected innovation performance. Hence,
knowledge management acts as a mediator between entrepreneurial
orientation and innovation performance.
Setyanti et al. (2013)
This study aims to examine and explain the innovation role in mediating the effect
of entrepreneurial orientation, management capabilities and knowledge sharing toward business performance of
Batik SMEs in East Java. The unit of analysis is Batik SMEs in East Java. Survey
respondents are 125 owners of Batik SMEs in East Java. This study uses a
quantitative approach. Data analysis tool used is PLS (Partial Least Square).
The results showed that innovation role proved affect positively and significantly
toward business performance improvement. Innovation becomes complete mediation in relationship
between management capabilities and knowledge sharing toward business performance. Innovation becomes a
partial mediation in relation to entrepreneurship orientation toward
business performance.
2. Data, Method and Model
From the point that the entrepreneurship and innovation are very important concepts for both firms and countries, in this study, the relationship between entrepreneurship and innovation were analyzed by using dynamic panel data methods (panel pooled mean group estimation and mean group estimation methods) for the periods of 1990-2011 in OECD countries.
ARALIK 2016
11
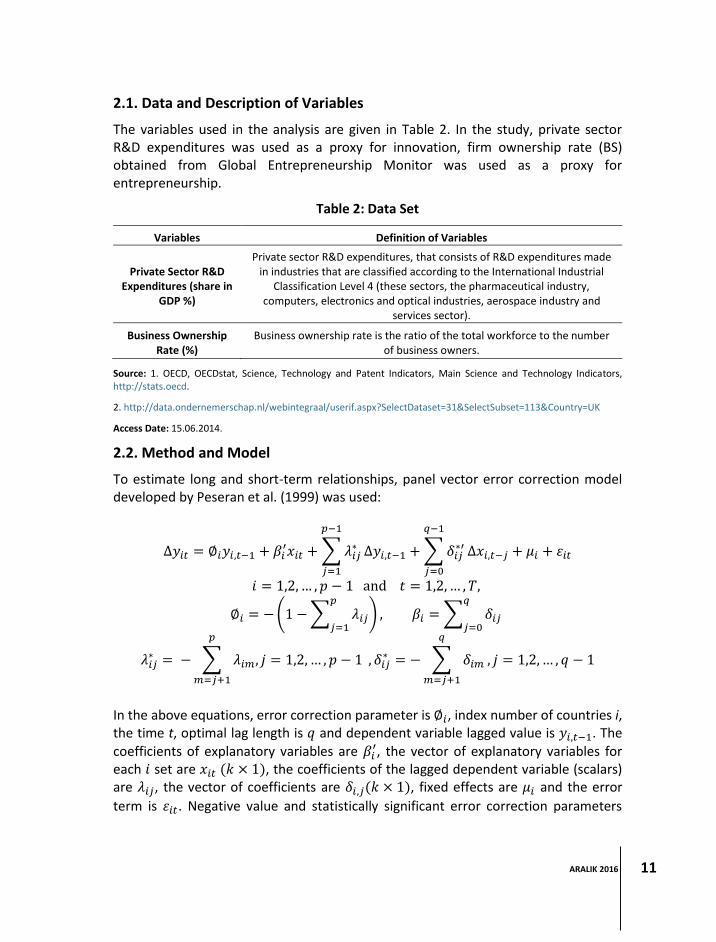
2.1. Data and Description of Variables
The variables used in the analysis are given in Table 2. In the study, private sector R&D expenditures was used as a proxy for innovation, firm ownership rate (BS) obtained from Global Entrepreneurship Monitor was used as a proxy for entrepreneurship.
Table 2: Data Set
Variables Definition of Variables
Private Sector R&D Expenditures (share in
GDP %)
Private sector R&D expenditures, that consists of R&D expenditures made in industries that are classified according to the International Industrial
Classification Level 4 (these sectors, the pharmaceutical industry, computers, electronics and optical industries, aerospace industry and
services sector).
Business Ownership Rate (%)
Business ownership rate is the ratio of the total workforce to the number of business owners.
Source: 1. OECD, OECDstat, Science, Technology and Patent Indicators, Main Science and Technology Indicators, http://stats.oecd.
2. http://data.ondernemerschap.nl/webintegraal/userif.aspx?SelectDataset=31&SelectSubset=113&Country=UK
Access Date: 15.06.2014.
2.2. Method and Model
To estimate long and short-term relationships, panel vector error correction model developed by Peseran et al. (1999) was used:
∆𝑦𝑖𝑡 = ∅𝑖𝑦𝑖,𝑡−1 + 𝛽𝑖′𝑥𝑖𝑡 + ∑ 𝜆𝑖𝑗
∗
𝑝−1
𝑗=1
∆𝑦𝑖,𝑡−1 + ∑ 𝛿𝑖𝑗∗′
𝑞−1
𝑗=0
∆𝑥𝑖,𝑡−𝑗 + 𝜇𝑖 + 휀𝑖𝑡
𝑖 = 1,2, … , 𝑝 − 1 and 𝑡 = 1,2, … , 𝑇,
∅𝑖 = − (1 − ∑ 𝜆𝑖𝑗
𝑝
𝑗=1) , 𝛽𝑖 = ∑ 𝛿𝑖𝑗
𝑞
𝑗=0
𝜆𝑖𝑗∗ = − ∑ 𝜆𝑖𝑚, 𝑗 = 1,2, … , 𝑝 − 1
𝑝
𝑚=𝑗+1
, 𝛿𝑖𝑗∗ = − ∑ 𝛿𝑖𝑚
𝑞
𝑚=𝑗+1
, 𝑗 = 1,2, … , 𝑞 − 1
In the above equations, error correction parameter is ∅𝑖, index number of countries i, the time t, optimal lag length is 𝑞 and dependent variable lagged value is 𝑦𝑖,𝑡−1. The
coefficients of explanatory variables are 𝛽𝑖′, the vector of explanatory variables for
each 𝑖 set are 𝑥𝑖𝑡 (𝑘 × 1), the coefficients of the lagged dependent variable (scalars) are 𝜆𝑖𝑗, the vector of coefficients are 𝛿𝑖,𝑗(𝑘 × 1), fixed effects are 𝜇𝑖 and the error
term is 휀𝑖𝑡. Negative value and statistically significant error correction parameters
ESKİŞEHİR OSMANGAZİ ÜNİVERSİTESİ İİBF DERGİSİ
12
show that short-term deviations between the cointegrated series will disappear and series will come to equilibrium in long term (Pesaran etc., 1999: 623).
Using the equations above, the model used in the analysis of economic liberalization and economic growth relationship can be formulated as follows:
∆𝑅𝐷𝑖𝑡 = ∅𝑖𝑅𝐷𝑖𝑡−1 + 𝛽𝑖1′ 𝐵𝑆 + ∑ 𝜆𝑖,𝑗
𝑝−1
𝑗=1
∆𝑅𝐷𝑖𝑡−1 + ∑ 𝛿𝑖,𝑗
𝑞−1
𝑗=0
∆𝐵𝑆𝑖𝑡−𝑗 + 𝜇𝑖 + 휀𝑖𝑡
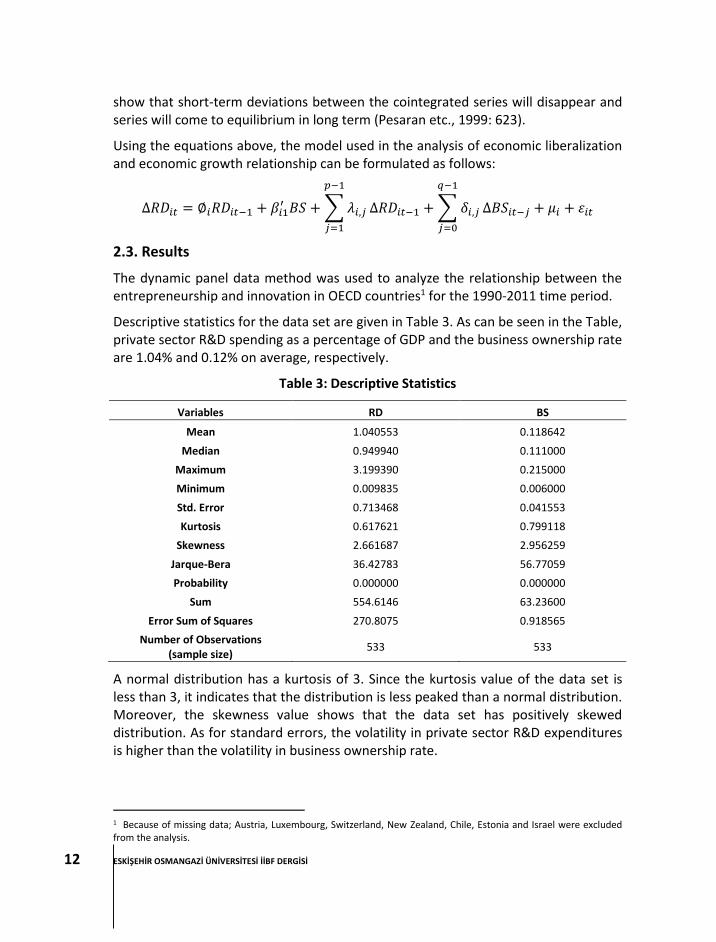
2.3. Results
The dynamic panel data method was used to analyze the relationship between the entrepreneurship and innovation in OECD countries1 for the 1990-2011 time period.
Descriptive statistics for the data set are given in Table 3. As can be seen in the Table, private sector R&D spending as a percentage of GDP and the business ownership rate are 1.04% and 0.12% on average, respectively.
Table 3: Descriptive Statistics
Variables RD BS
Mean 1.040553 0.118642
Median 0.949940 0.111000
Maximum 3.199390 0.215000
Minimum 0.009835 0.006000
Std. Error 0.713468 0.041553
Kurtosis 0.617621 0.799118
Skewness 2.661687 2.956259
Jarque-Bera 36.42783 56.77059
Probability 0.000000 0.000000
Sum 554.6146 63.23600
Error Sum of Squares 270.8075 0.918565
Number of Observations (sample size)
533 533
A normal distribution has a kurtosis of 3. Since the kurtosis value of the data set is less than 3, it indicates that the distribution is less peaked than a normal distribution. Moreover, the skewness value shows that the data set has positively skewed distribution. As for standard errors, the volatility in private sector R&D expenditures is higher than the volatility in business ownership rate.
1 Because of missing data; Austria, Luxembourg, Switzerland, New Zealand, Chile, Estonia and Israel were excluded from the analysis.
ARALIK 2016
13
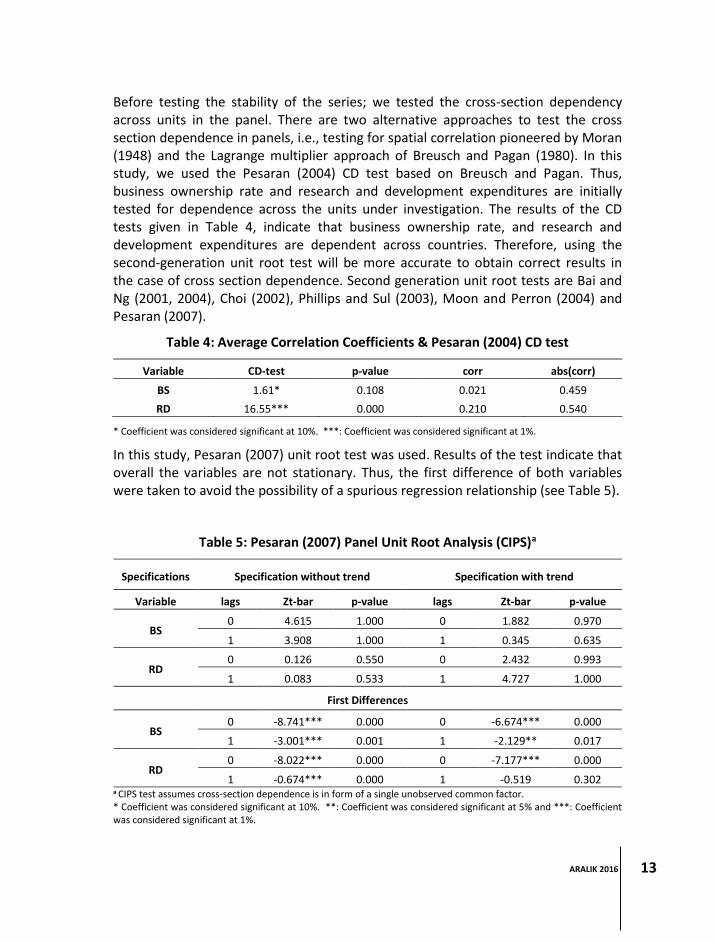
Before testing the stability of the series; we tested the cross-section dependency across units in the panel. There are two alternative approaches to test the cross section dependence in panels, i.e., testing for spatial correlation pioneered by Moran (1948) and the Lagrange multiplier approach of Breusch and Pagan (1980). In this study, we used the Pesaran (2004) CD test based on Breusch and Pagan. Thus, business ownership rate and research and development expenditures are initially tested for dependence across the units under investigation. The results of the CD tests given in Table 4, indicate that business ownership rate, and research and development expenditures are dependent across countries. Therefore, using the second-generation unit root test will be more accurate to obtain correct results in the case of cross section dependence. Second generation unit root tests are Bai and Ng (2001, 2004), Choi (2002), Phillips and Sul (2003), Moon and Perron (2004) and Pesaran (2007).
Table 4: Average Correlation Coefficients & Pesaran (2004) CD test
Variable CD-test p-value corr abs(corr)
BS 1.61* 0.108 0.021 0.459
RD 16.55*** 0.000 0.210 0.540
* Coefficient was considered significant at 10%. ***: Coefficient was considered significant at 1%.
In this study, Pesaran (2007) unit root test was used. Results of the test indicate that overall the variables are not stationary. Thus, the first difference of both variables were taken to avoid the possibility of a spurious regression relationship (see Table 5).
Table 5: Pesaran (2007) Panel Unit Root Analysis (CIPS)a
Specifications Specification without trend Specification with trend
Variable lags Zt-bar p-value lags Zt-bar p-value
BS 0 4.615 1.000 0 1.882 0.970
1 3.908 1.000 1 0.345 0.635
RD 0 0.126 0.550 0 2.432 0.993
1 0.083 0.533 1 4.727 1.000
First Differences
BS 0 -8.741*** 0.000 0 -6.674*** 0.000
1 -3.001*** 0.001 1 -2.129** 0.017
RD 0 -8.022*** 0.000 0 -7.177*** 0.000
1 -0.674*** 0.000 1 -0.519 0.302 a CIPS test assumes cross-section dependence is in form of a single unobserved common factor. * Coefficient was considered significant at 10%. **: Coefficient was considered significant at 5% and ***: Coefficient was considered significant at 1%.
ESKİŞEHİR OSMANGAZİ ÜNİVERSİTESİ İİBF DERGİSİ
14
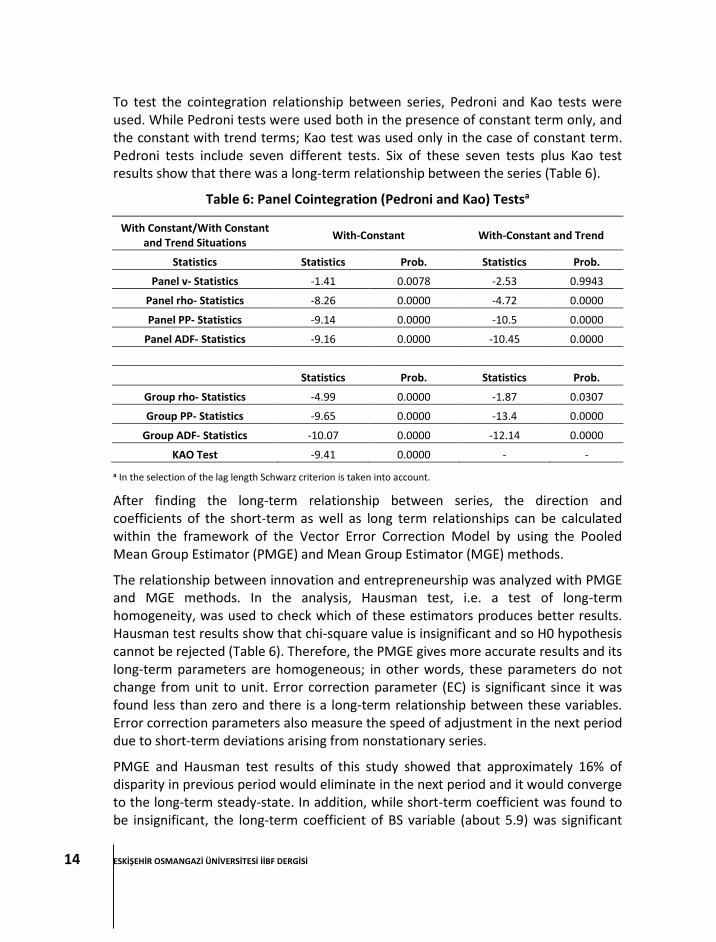
To test the cointegration relationship between series, Pedroni and Kao tests were used. While Pedroni tests were used both in the presence of constant term only, and the constant with trend terms; Kao test was used only in the case of constant term. Pedroni tests include seven different tests. Six of these seven tests plus Kao test results show that there was a long-term relationship between the series (Table 6).
Table 6: Panel Cointegration (Pedroni and Kao) Testsa
With Constant/With Constant and Trend Situations
With-Constant With-Constant and Trend
Statistics Statistics Prob. Statistics Prob.
Panel v- Statistics -1.41 0.0078 -2.53 0.9943
Panel rho- Statistics -8.26 0.0000 -4.72 0.0000
Panel PP- Statistics -9.14 0.0000 -10.5 0.0000
Panel ADF- Statistics -9.16 0.0000 -10.45 0.0000
Statistics Prob. Statistics Prob.
Group rho- Statistics -4.99 0.0000 -1.87 0.0307
Group PP- Statistics -9.65 0.0000 -13.4 0.0000
Group ADF- Statistics -10.07 0.0000 -12.14 0.0000
KAO Test -9.41 0.0000 - -
a In the selection of the lag length Schwarz criterion is taken into account.
After finding the long-term relationship between series, the direction and coefficients of the short-term as well as long term relationships can be calculated within the framework of the Vector Error Correction Model by using the Pooled Mean Group Estimator (PMGE) and Mean Group Estimator (MGE) methods.
The relationship between innovation and entrepreneurship was analyzed with PMGE and MGE methods. In the analysis, Hausman test, i.e. a test of long-term homogeneity, was used to check which of these estimators produces better results. Hausman test results show that chi-square value is insignificant and so H0 hypothesis cannot be rejected (Table 6). Therefore, the PMGE gives more accurate results and its long-term parameters are homogeneous; in other words, these parameters do not change from unit to unit. Error correction parameter (EC) is significant since it was found less than zero and there is a long-term relationship between these variables. Error correction parameters also measure the speed of adjustment in the next period due to short-term deviations arising from nonstationary series.
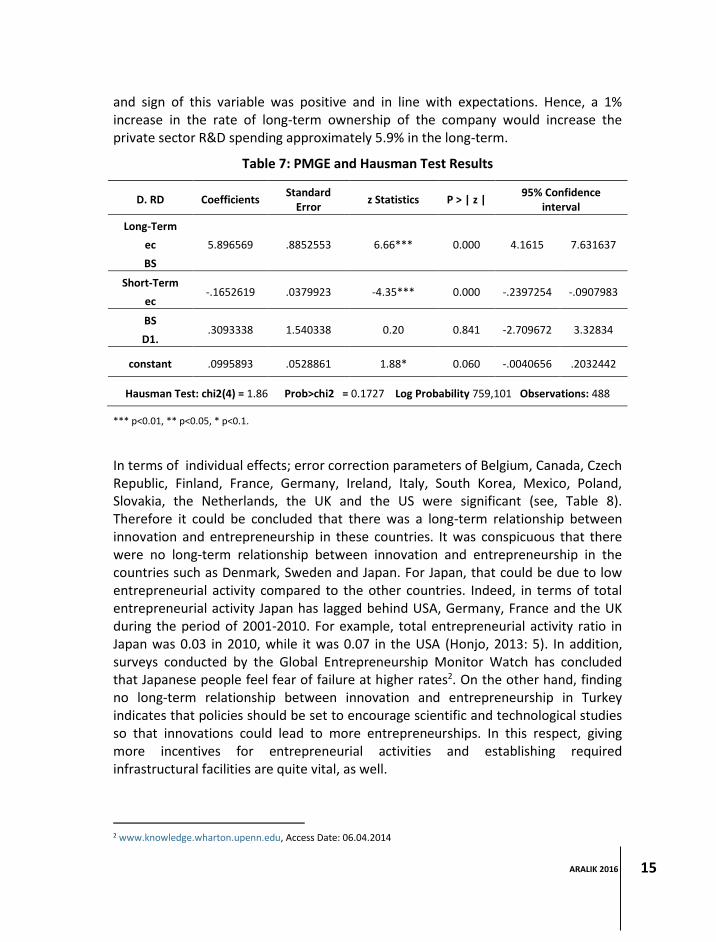
PMGE and Hausman test results of this study showed that approximately 16% of disparity in previous period would eliminate in the next period and it would converge to the long-term steady-state. In addition, while short-term coefficient was found to be insignificant, the long-term coefficient of BS variable (about 5.9) was significant
ARALIK 2016
15
and sign of this variable was positive and in line with expectations. Hence, a 1% increase in the rate of long-term ownership of the company would increase the private sector R&D spending approximately 5.9% in the long-term.
Table 7: PMGE and Hausman Test Results
D. RD Coefficients Standard
Error z Statistics P > | z |
95% Confidence interval
Long-Term
ec
BS
5.896569 .8852553 6.66*** 0.000 4.1615 7.631637
Short-Term
ec -.1652619 .0379923 -4.35*** 0.000 -.2397254 -.0907983
BS
D1. .3093338 1.540338 0.20 0.841 -2.709672 3.32834
constant .0995893 .0528861 1.88* 0.060 -.0040656 .2032442
Hausman Test: chi2(4) = 1.86 Prob>chi2 = 0.1727 Log Probability 759,101 Observations: 488
*** p<0.01, ** p<0.05, * p<0.1.
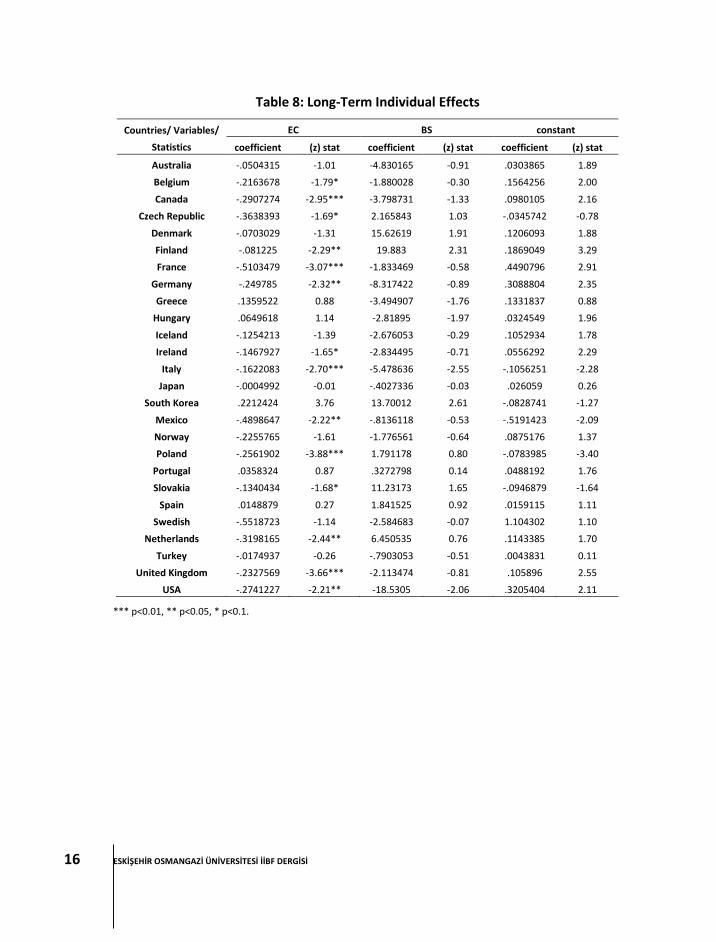
In terms of individual effects; error correction parameters of Belgium, Canada, Czech Republic, Finland, France, Germany, Ireland, Italy, South Korea, Mexico, Poland, Slovakia, the Netherlands, the UK and the US were significant (see, Table 8). Therefore it could be concluded that there was a long-term relationship between innovation and entrepreneurship in these countries. It was conspicuous that there were no long-term relationship between innovation and entrepreneurship in the countries such as Denmark, Sweden and Japan. For Japan, that could be due to low entrepreneurial activity compared to the other countries. Indeed, in terms of total entrepreneurial activity Japan has lagged behind USA, Germany, France and the UK during the period of 2001-2010. For example, total entrepreneurial activity ratio in Japan was 0.03 in 2010, while it was 0.07 in the USA (Honjo, 2013: 5). In addition, surveys conducted by the Global Entrepreneurship Monitor Watch has concluded that Japanese people feel fear of failure at higher rates2. On the other hand, finding no long-term relationship between innovation and entrepreneurship in Turkey indicates that policies should be set to encourage scientific and technological studies so that innovations could lead to more entrepreneurships. In this respect, giving more incentives for entrepreneurial activities and establishing required infrastructural facilities are quite vital, as well.
2 www.knowledge.wharton.upenn.edu, Access Date: 06.04.2014
ESKİŞEHİR OSMANGAZİ ÜNİVERSİTESİ İİBF DERGİSİ
16
Table 8: Long-Term Individual Effects
Countries/ Variables/
Statistics
EC BS constant
coefficient (z) stat coefficient (z) stat coefficient (z) stat
Australia -.0504315 -1.01 -4.830165 -0.91 .0303865 1.89
Belgium -.2163678 -1.79* -1.880028 -0.30 .1564256 2.00
Canada -.2907274 -2.95*** -3.798731 -1.33 .0980105 2.16
Czech Republic -.3638393 -1.69* 2.165843 1.03 -.0345742 -0.78
Denmark -.0703029 -1.31 15.62619 1.91 .1206093 1.88
Finland -.081225 -2.29** 19.883 2.31 .1869049 3.29
France -.5103479 -3.07*** -1.833469 -0.58 .4490796 2.91
Germany -.249785 -2.32** -8.317422 -0.89 .3088804 2.35
Greece .1359522 0.88 -3.494907 -1.76 .1331837 0.88
Hungary .0649618 1.14 -2.81895 -1.97 .0324549 1.96
Iceland -.1254213 -1.39 -2.676053 -0.29 .1052934 1.78
Ireland -.1467927 -1.65* -2.834495 -0.71 .0556292 2.29
Italy -.1622083 -2.70*** -5.478636 -2.55 -.1056251 -2.28
Japan -.0004992 -0.01 -.4027336 -0.03 .026059 0.26
South Korea .2212424 3.76 13.70012 2.61 -.0828741 -1.27
Mexico -.4898647 -2.22** -.8136118 -0.53 -.5191423 -2.09
Norway -.2255765 -1.61 -1.776561 -0.64 .0875176 1.37
Poland -.2561902 -3.88*** 1.791178 0.80 -.0783985 -3.40
Portugal .0358324 0.87 .3272798 0.14 .0488192 1.76
Slovakia -.1340434 -1.68* 11.23173 1.65 -.0946879 -1.64
Spain .0148879 0.27 1.841525 0.92 .0159115 1.11
Swedish -.5518723 -1.14 -2.584683 -0.07 1.104302 1.10
Netherlands -.3198165 -2.44** 6.450535 0.76 .1143385 1.70
Turkey -.0174937 -0.26 -.7903053 -0.51 .0043831 0.11
United Kingdom -.2327569 -3.66*** -2.113474 -0.81 .105896 2.55
USA -.2741227 -2.21** -18.5305 -2.06 .3205404 2.11
*** p<0.01, ** p<0.05, * p<0.1.
ARALIK 2016
17
3. Conclusion
Countries (e.g., the USA, Germany, Finland, Canada, South Korea etc.) keeping pace with the trends of innovation and entrepreneurship, the most important factors contributing to their economic growths, have managed to create wealth and prosperity in the last century. It was also a milestone of entrepreneurs’ taking initiative actions to accelerate innovative activities to get competitive advantages of those firms which operates in these countries.
In this study, the relationship between entrepreneurship and innovation were analyzed by using dynamic panel data methods (panel pooled mean group estimation - PMGE method) for the periods of 1990-2011 in OECD countries. Study results showed that there was a long term relationship between innovation and entrepreneurship but without a sign for the short term relationship. According to the results, 1% increase in business ownership rate would increase the private sector R&D expenditures by 5.9%.
On a country basis, the coefficients of error correction parameters of Belgium, Canada, Czech Republic, Finland, France, Germany, Ireland, Italy, South Korea, Mexico, Poland, Slovakia, the Netherlands, the United Kingdom and the United States were meaningful, indicating a long term relationship for these countries.
As can be figured out from the evidences indicating a relationship between innovation and entrepreneurship, expediting the entrepreneurship activities will lead to an innovative development. In this respect, to encourage the entrepreneurship activities, well established business climate should be provided; property rights should be guaranteed by law, the government incentives should be well designed and extended, and last but not least, more investment should be made on human capital.
ESKİŞEHİR OSMANGAZİ ÜNİVERSİTESİ İİBF DERGİSİ
18
References
Bai, J., & Ng, S., (2004). A PANIC Attack on Unit Roots and Cointegration. Econometrica, 1127-1177.
Beyer, M., Czarnitzki, D., & Kraft, K. (2011). Managerial Ownership, Entrenchment and Innovation. Economics of Innovation and New Technology, 21(7), 679-699.
Brazeal, D. V., & Herbert, T., T., (1999). The Genesis of Entrepreneurship. Entrepreneurship Theory and Practice, 23, 29-46.
Breusch, T. S., & Pagan, A. R. (1980). The Lagrange Multiplier Test and Its Applications to Model Specification in Econometrics. The Review of Economic Studies, 239-253.
Bygrave, W. D. (2004). The Entrepreneurial Process. In W. D. Bygrave & A. Zacharakis (Eds.). The portable MBA in entrepreneurship. Hoboken, NJ: John Wiley & Sons.
Choi, I., (2002), Instrumental Variables Estimation of a Nearly Nonstationary, Heterogeneous Error Component Model. Journal of Econometrics 109: 1–32.
Demircan, K., (2006), The Role of R&D and Innovation In Us Economy as a Benchmark For Turkish Economy, http://www.ekonomi.gov.tr/upload/BF09AE98-D8D3-8566-4520B0D124E5614D/Koray_Demircan.pdf Access Date: 07.03.2014.
Hassim, A., A., Nizam, A., Talib, A., and Bakar, A. R., A., (2011), The Effects of Entrepreneurial Orientation on Firm Organisational Innovation and Market Orientation Towards Firm Business Performance, 2011 International Conference on Sociality and Economics Development IPEDR vol.10, IACSIT Press, Singapore.
Hill, Charles W. L., (2005), International Business: Competing in the Global Marketplace, McGraw Hill: Boston.
Honjo, Y., (2013), Why is the Rate of Entrepreneurship So Low in Japan?, http://www.rieti.go.jp/jp/events/13012101/pdf/honjo.pdf Access Date: 08.12.2014.
Hussain, M., F., Afzal, A., Asif, M., Ahmed, N., Bilal, R., M., (2011), Impact of Innovation, Technology and Economic Growth on Entrepreneurship, American International Journal of Contemporary Research, 1(1), 45-51.
Klerk, D., and Kruger, S., (2003), Entrepreneurship: Towards a New Definition, http://sbaer.uca.edu/research/icsb/2003/188.doc Access Date: 07.01.2014.
Link, A., N., (2007), Entrepreneurship, Innovation, and Technological Change, the Center for Applied Economics, Technical Report, 07-0716.
Madhoushi, M., Sadati, A., Delavari, H., Mehdivand, M., and Mihandost, R., (2011), Entrepreneurial Orientation and Innovation Performance: The Mediating Role of Knowledge Management, Asian Journal of Business Management 3(4): 310-316.
ARALIK 2016
19
Margaret, M., (2008), The Role of Human Capital and Entrepreneurial Orientation on Radical Product Innovations in Small Scale Carpentry Workshops in Nairobi, http://www.africa-platform.org/sites/default/files/resources/kenya_role_of_human_capital_and_entrepreneurial_orientation_onproduct_innovations_in_carpentry_workshops.pdf Access Date: 07.11.2014.
McFadzean, E., O'Loughlin, A., Tang E., (2005), Corporate Entrepreneurship and Innovation Part 1: the Missing Link, European Journal of Innovation Management, 8(3), 350-372.
Moon, H., R., Perron B., (2003). Testing for a Unit Root in Panels with Dynamic Factors, Mimeo, University of Southern California Law School.
Morris, M. H., & Kuratko, D. F. (2002). Corporate Entrepreneurship: Entrepreneurial Development within Organizations. South-Western Pub.
Pesaran, M. H., Y. Shin, and R. P. Smith., (1999), Pooled Mean Group Estimation of Dynamic Heterogeneous Panels. Journal of the American Statistical Association, 94: 621–634.
Pesaran, M. H., (2004), General Diagnostic Tests for Cross Section Dependence in Panels, http://repec.iza.org/dp1240.pdf Access Date: 07.11.2015.
Pesaran, M. H. (2007). A Simple Panel Unit Root Test in The Presence of Cross‐Section Dependence. Journal of Applied Econometrics, 22(2), 265-312.
Phillips, P.C.B., Sul, D. (2003). Dynamic Panel Estimation and Homogeneity Testing under Cross-Section Dependence, Econometrics Journal, 6, 217-259.
Price, D., P., Stoica, M., Boncella, R., J., (2011), the Relationship between Innovation, Knowledge, and Performance in Family and Non-Family Firms: an Analysis of SMEs, Journal of Innovation and Entrepreneurship, 2(14), 1-20.
Rooks, G., Szirmai, A., and Serwanga, S., (2009), Social Capital and Innovative Performance in Developing Countries The Case of Ugandan Entrepreneurs, 7th GLOBELICS conference on Inclusive Growth, Innovation and Technological Change Dakar, Senegal, 6-8 October 2009.
Setyanti, S., W., L., H., Troena, E. A., Nimran, U., and Rahayu, M., (2013), Innovation Role in Mediating the Effect of Entrepreneurship Orientation, Management Capabilities and Knowledge Sharing Toward Business Performance: Study at Batik SMEs in East Java Indonesia, Journal of Business and Management, 8(4),16-27.
Shaw, E., O'Loughlin, A., McFadzean, E., (2005), Corporate Entrepreneurship and Innovation part 2: a Role‐and Process‐Based Approach, European Journal of Innovation Management, 8(4), 393-408.
ESKİŞEHİR OSMANGAZİ ÜNİVERSİTESİ İİBF DERGİSİ
20
Tang, L., and Koveos, E., P., (2004), Venture Entrepreneurship, Innovation Entrepreneurship, and Economic Growth, Jouurnal of Developmental Entrepreneurship, 9(2), 61-171.
Wong, K., P., Ho, Y., P., and Autio, E., (2005), Entrepreneurship, Innovation and Economic Growth: Evidence from GEM data, Small Business Economics, 24, 335–350.
Zhao, F. (2005). Exploring the Synergy between Entrepreneurship and Innovation. International Journal of Entrepreneurial Behavior & Research, 11(1), 25-41.
Web References
OECD, OECDstat, Science, Technolgy and Patent Indicators, Main Science and Technology Indicators, http://stats.oecd.org/ Access Date: 06.15. 2014.
Knowledge Web on SMEs and Entrepreneurship, Entrepreneurs International (Compendia), http://data.ondernemerschap.nl/webintegraal/userif.aspx?SelectDataset=31&SelectSubset=113&Country=UK Access Date: 06.15.2014.
http://www.gemconsortium.org/What-is-GEM Access Date: 08. 28.2014.
http://knowledge.wharton.upenn.edu/article/the-entrepreneurship-vacuum-in-japan-why-it-matters-and-how-to-address-it/ Access Date: 08.28.2014.