the relationship between investor materiality and the
TRANSCRIPT

sustainability
Article
The Relationship between Investor Materialityand the Sustainable Development Goals:A Methodological Framework
Gianni Betti 1, Costanza Consolandi 2,* and Robert G. Eccles 3
1 Department of Economics and Statistics, University of Siena, 53100 Siena, Italy; [email protected] Department of Business and Law, University of Siena, 53100 Siena, Italy3 Said Business School, University of Oxford, Oxford OX1 1HP, UK; [email protected]* Correspondence: [email protected]; Tel.: +39-0577-2324099
Received: 11 May 2018; Accepted: 27 June 2018; Published: 29 June 2018�����������������
Abstract: The world has great expectations for how the private sector, both companies and investors,can support the 17 Sustainable Development Goals (SDGs). In fact, it is generally believed thatthese goals cannot be achieved without strong support from the private sector. But will making theworld a better place hurt financial returns? The answer is “No” if companies focus on the SDGsand their associated targets that benefit from strong performance on the material environmental,social, and governance (ESG) issues that matter to investors. In this paper we map the 30 genericESG issues identified by the Sustainability Accounting Standards Board (SASB) to the SDGs and theirtargets. We show that some SASB issues are more material for a given SDG than others. We alsoshow that some SASB issues are more important to the SDGs in general than others. We also map thematerial ESG issues for each of SASB’s 79 industries to the SDGs and to their targets. For each sector,there are particular SDGs where it has high impact and for each SDG there are particular sectors thathave a high impact on it, and some sectors are more important to the SDGs in aggregate than others.The same is true at the target level. This mapping can be used as a guide for both companies andinvestors who want to understand how value-creating ESG performance can contribute to the SDGs.This paper is divided into four parts. Part I explains the motivation for this study. Part II explainsour methodology and Part III the results. Part IV concludes with a summary of our results and somereflections on how our mapping methodology can be improved.
Keywords: sustainability; Sustainable Development Goals; SDG; materiality; financial performance;impact; Sustainability Accounting Standard Board; SASB
1. Introduction
The 17 Sustainable Development Goals (SDGs), ratified by the United Nations on 15 September 2015,have been described as “the closestthing the Earth has to a strategy” [1]. It is also widely acknowledgedthat the goals set for 2030 cannot be achieved by the public sector alone. Indeed, the greater burdenfalls on the private sector with estimates that it will have to close the funding gap of $2.5 trillion peryear and to ensure that the private sector provides the expected 50% of the total $115 trillion costof funding the SDGs [2] Fortunately, the investment community is increasingly seeing the SDGs ascreating investment opportunities and corporations are looking for the business opportunities theycreate. The current discussion on the role of the private sector in the achievement of the goals isintense [3–5], especially at the institutional level. In May 2018, the European Commission, on thebasis of the Recommendations of the High-Level Expert Group on Sustainable Finance [6], adopteda package of measures that set out a comprehensive strategy to connect finance to sustainability
Sustainability 2018, 10, 2248; doi:10.3390/su10072248 www.mdpi.com/journal/sustainability

Sustainability 2018, 10, 2248 2 of 23
through reorienting capital flows towards sustainable investments, managing financial risk connectedto climate change, social issues and environmental degradation and fostering long-termism in financialand economic activities [7].Besides measures on SDG implementations at a country level, such as theSDG Index and Dashboard of UN Sustainable Development Solutions Network (UN-SDSN), in orderto track progress towards the goals and their associated 169 targets at a company level, a large numberof tools and “business indicators” have been proposed. The World Business Council for SustainableDevelopment (WBCSD) together with Global Reporting Initiative (GRI) and the UN Global Compact(Global Compact) have created SDG Compass, a guide with associated tools and knowledge resourcesto help companies align their business strategies with the SDGs and to measuring and managingtheir contribution, including an inventory that maps more than 1500 existing business indicatorsagainst the 17 SDGs and their respective 169 targets. GRI and the Global Compact have also publisheda document [8] to help companies understand the SDGs and their targets. Also, consulting firmssuch as EY, KPMG, and PricewaterhouseCoopers have developed their own tools to help companiesinterested in understanding how their strategies can support the SDGs. The SDGs are about “impact”,and in these measures the unit of analysis is not the company, but something outside of the companywhose operations affect it, such as reduced gender inequality in a community or replenishment offishing stocks. However, many of the metrics are about a company’s operations and the impact mustbe inferred or further calculated, often based on data that lies outside the company’s control. On thistopic, Vörösmarty et al. [9] propose a new approach to evaluate corporate products and serviceswithin broader environmental or human beneficiary settings, but true impact measurement is stillat an early stage of development. Ideally, an impact measure can be linked to actions in order toshow differences, both positive and negative, had the action not taken place. In this paper, we presenta framework which will enable investors and companies to contribute to the SDGs by identifying thematerial ESG issues (what investors care about) by sector that also contribute to the SDGs (what theworld cares about). Within the broader framework of the performance implications of sustainabilityinvestments [10–14] and starting from the evidence of how ESG materiality positively affects financialperformance [15,16], we aim at providing a new framing able to answer to the long-standing questionof “Can a company do well by doing good?” In particular, will contributing to the SDGs be good fora company’s financial performance or will creating these positive externalities actually hurt financialperformance? The somewhat unsatisfying but honest answer is “It depends.” Our thesis is that goodperformance on ESG issues which are material from the perspective of the Sustainability AccountingStandards Board (SASB) but which also have impact on one or more SDGs will be a situation wheredoing good means doing well.
We chose SASB’s framework as the basis for mapping to the SDGs for two reasons. First, it isfocused on investors, not multiple stakeholders, which is the case for the SDGs. This captures thetension companies feel in trying to be responsive to both audiences. Second, it is the only frameworkthat has identified the material ESG issues at the sector and industry level. This is essential since whichof the 30 generic ESG issues are material varies substantially by industry.
2. Methodology
The concept of materiality we adopt in this paper is the one used by SASB that was established toidentify the material ESG issues at an industry level that are financially relevant for investors, as theyaffect financial performance [17]. SASB is a San Francisco-based nonprofit organization established in2011. SASB’s mission is to develop measurement standards for reporting on material environmental,social, and governance (ESG) issues—often called “non-financial information”—that are of the samerelevance and reliability as accounting standards for financial information. Because the materialityof sustainability issues varies across industries [18], SASB has established the Sustainable IndustryClassification System™ [19] (SICS) comprised of 10 sectors subdivided into 79 industries. Companiesare grouped in terms of similar resource intensity, as well as sustainability risks and opportunities.

Sustainability 2018, 10, 2248 3 of 23
Industry working groups comprised of companies, investors, and industry experts of variouskinds work to identify the material issues for each industry and the appropriate key performanceindicator for measuring and reporting on them. It has issued a set of provisional standards for which ithas received public comment and is now working on incorporating this feedback into them. FollowingPhadke and DeMates [20], we started with a mapping of SASB’s 30 generic ESG issues organized interms of the categories of environment, social capital, human capital, business model and innovation,and leadership and governance to the SDGs. In our analysis, we didn’t consider SDG 17 since this isan overarching one covering all SDGs. Furthermore, as it is intuitive that different issues might havea different degree of impact on the SDGs, we increased the detail of our analysis by mapping SASB’s30 generic ESG issues to the target level for each SDG. Table 1 describes the 17 SDGs and Table 2presents the description of the targets of SDG 8 as an example.
Table 1. The UN Sustainable Development Goals.
SDG Description
SDG 1 End poverty in all its forms everywhere
SDG 2 End hunger, achieve food security and improved nutrition and promote sustainable agriculture
SDG 3 Ensure healthy lives and promote wellbeing for all at all ages
SDG 4 Ensure inclusive and equitable quality education and promote lifelong learning opportunities for all
SDG 5 Achieve gender equality and empower all women and girls
SDG 6 Ensure availability and sustainable management of water and sanitation for all
SDG 7 Ensure access to affordable reliable sustainable and modern energy for all
SDG 8 Promote sustained, inclusive and sustainable economic growth, full and productive employment and decentwork for all
SDG 9 Build resilient infrastructure promote inclusive and sustainable industrialization and foster innovation
SDG 10 Reduce inequality within and among countries
SDG 11 Make cities and human settlements inclusive, safe, resilient and sustainable
SDG 12 Ensure sustainable consumption and production patterns
SDG 13 Take urgent action to combat climate change and impacts
SDG 14 Conserve and sustainably use the oceans seas and marine resources for sustainable development
SDG 15 Protect restore and promote sustainable use of terrestrial ecosystems sustainably manage forests combatdesertification and halt and reverse land degradation and halt biodiversity loss
SDG 16 Promote peaceful and inclusive societies for sustainable development, provide access to justice for all andbuild effective accountable and inclusive institutions at all levels
SDG 17 Strengthen the means of implementation and revitalize the global partnership for sustainable development
Table 2. Targets of SDG 8.
SDG 8Targets Description
8.1 Sustain per capita economic growth in accordance with national circumstances and, in particular, at least7 per cent gross domestic product growth per annum in the least developed countries
8.2 Achieve higher levels of economic productivity through diversification, technological upgrading andinnovation, including through a focus on high-value added and labor-intensive sectors
8.3Promote development-oriented policies that support productive activities, decent job creation,entrepreneurship, creativity and innovation, and encourage the formalization and growth of micro-,small- and medium-sized enterprises, including through access to financial services
8.4Improve progressively, through 2030, global resource efficiency in consumption and production and endeavorto decouple economic growth from environmental degradation, in accordance with the 10-year framework ofprograms on sustainable consumption and production, with developed countries taking the lead

Sustainability 2018, 10, 2248 4 of 23
Table 2. Cont.
SDG 8Targets Description
8.5 By 2030, achieve full and productive employment and decent work for all women and men, including foryoung people and persons with disabilities, and equal pay for work of equal value
8.6 By 2020, substantially reduce the proportion of youth not in employment, education or training
8.7Take immediate and effective measures to eradicate forced labor, end modern slavery and human traffickingand secure the prohibition and elimination of the worst forms of child labor, including recruitment and use ofchild soldiers, and by 2025 end child labor in all its forms
8.8 Protect labor rights and promote safe and secure working environments for all workers, including migrantworkers, in particular women migrants, and those in precarious employment
8.9 By 2030, devise and implement policies to promote sustainable tourism that creates jobs and promotes localculture and products
8.1 Strengthen the capacity of domestic financial institutions to encourage and expand access to banking,insurance and financial services for all
8.aIncrease Aid for Trade support for developing countries, in particular least developed countries,including through the Enhanced Integrated Framework for Trade-Related Technical Assistance to LeastDeveloped Countries
8.b By 2020, develop and operationalize a global strategy for youth employment and implement the Global JobsPact of the International Labour Organization
These mappings represent the basis of our framework as they allowed us to calculate two differentsets of indices (both at a goal and a target level):
(a) a set of indices that measure the ability of SASB’s issues to impact the SDGs and the relevance ofSASB’s issues to the SDGs;
(b) a set of indices that measure the ability of each industry and each sector to impact the SDGs.
Moreover, mapping at the target level allowed us to calculate, for each of the abovementionedsets, secondary indices that measure the intensity of impact on a given SDG of each SASB’s issue.In our analysis, we considered 107 targets. The 169 targets also include means of implementation targetsto facilitate outcomes. SDG17, which covers global partnership, comprises 19 such targets, and thereis a total of 43 more under SDGs 1–16 (where they are separately identified using small letters afterthe goal number, e.g., 16.b: Promote and enforce non-discriminatory laws and policies for sustainabledevelopment) [21]. Target selection is shown in Table 3.
Table 3. SDG targets in the analysis.
Original SDG targets: 169Less: targets of SDG 17: 19
Less: “resources” targets: 43Number of targets included in the analysis: 107
For the first group of indices, at a goal level for each SASB issue i (i: 1 to 30) we identifiedthe number (G) of SDG(s) impacted; in other words, a generic SDG j could be impacted (impi,j = 1)and a generic SDG l could not be (impi,l = 0). We then calculated for each SASB issue the SDG RelevanceIndex (SRI) as the ratio between the number of SDGs impacted by a specific material issue to the totalnumber—16—of SDGs:
SRIi =∑16
j=1 impi,j
16. (1)
At a target level, for each SASB issue i (i: 1 to 30) we identified the number (Tj) of targets impactedin a specific SDG j; in other words, a generic target t in SDG j (t: 1 to Tj) could be impacted (impi,j,t = 1)and a generic target s in the same SDG j could be not (impi,j,s = 0).

Sustainability 2018, 10, 2248 5 of 23
We then computed for each SASB issue the Target Relevance Index (TRI) as the ratio between thenumber of targets impacted by a specific material issue on the total number of targets, that showsthe ability of each SASB’s issue to impact targets. This could be written by generalizing Equation (1),in the following way:
TRIi =∑16
j1 ∑Tjt=1 impi,j,t
107. (2)
To measure the intensity of impact on a given SDG of each issue, for each SASB issue and foreach SDGj we calculated, as a secondary index, the Target Specific Relevance Index (TSRI). If a SASBissue i impacts on a generic SDGj (i.e., impi,j = 1), then the TSRI is the ratio between the number ofSDGj targets impacted by a specific material issue to the total number of targets of SDGj. The TSRI isdefined as:
TSRIi,j =∑
Tjt=1 impi,j,t
Tj. (3)
By symmetry with the previous step, we also look at the number of SASB’s generic ESG issuesthat impact each of the SDGs (MI) and calculate an ESG Relevance Index (ERI) for each SDG j to measurethe extent to which the SDG is impacted by the 30 SASB issues:
ERIj =∑30
i=1 impj,i
30=
MI30
. (4)
At target level, to measure the extent to which the single target is impacted by the 30 SASB’sissues, we looked at the number of SASB’s issues affecting each target and calculated an ESG TargetRelevance Index (TERI):
TERIj =∑30
i=1 impj,i
30. (5)
In this case, as a secondary index for each SDG we calculated an ESG Target Specific RelevanceIndex (TSERI) averaging the TERIs related to each SDG:
TSERIi,j =∑
Tji=1 TERIj
Tj. (6)
However, we should add a caveat to this first set of measures. Our proposal is based simplyon counts of various kinds. It does not take into account the fact that a material SASB issue in onesector could be more important than another due to the absolute value of the topic (for example,the total amount of GHG emissions is likely to vary across sectors). If we had a credible weightingscheme, we could propose a more refined methodology based on fuzzy set theory, and the resultscould be different. We make an attempt to present such advanced methodology later in this paper inSection 4. This same caveat applies to our analysis at the target level. From a company perspective,and investors in the company, the critical question is which SDGs are impacted by the material ESGissues determined by SASB for its industry and how a focus on ESG material issues can contribute tothe SDGs; we calculated a second set of indices that provide a measure of the ability of each industryand sector to impact the SDGs. For each SDGj and for each industry nk (nk: 1 to Nk) in a given sectork (k: 1 to 10), we counted the number of industry-specific material issues impacting the SDG (MIk) andcalculated the SDG Industry Impact Index (ISII) as the ratio (multiplied by 100) between the number ofindustry-specific material issues and the total number of SASB general ESG issues (above defined asMI) affecting the single SDG j; in the formula:
ISI Ij,nk =∑30
i=1 impj,i,nk
∑30i=1 impj,i
100 =MIkMI
100. (7)

Sustainability 2018, 10, 2248 6 of 23
At the target level, for each industry nk (nk: 1 to Nk) in a given sector k (k: 1 to 10), we counted thenumber of industry-specific material issues impacting each target tj in each SDG j (TMIk) and for eachtarget we calculate the Industry Target Impact Index (ITII) as the ratio (multiplied by 100) between TMIkand the total number of SASB general ESG issues (defines as TMI) affecting the single target tj in SDGj;in formula:
ITI Ij,Tj ,nk =∑30
i=1 impj,Tj ,i,nk
∑30i=1 impj,Tj ,i
100 =TMIkTMI
100. (8)
Also, in this case, as a secondary index, for each SDG we calculated an Industry SDG Target ImpactIndex (ISTII), as the ratio (multiplied by 100) between the sum over targets in SDG j of the numberof industry-specific material issues impacting each target tj in each SDG (TMIk), and the sum overtargets in SDGj of the total number of SASB general ESG issues affecting the single Target tj in SDG j;in formula:
ISTI Ij,nk =∑
Tjt=1 ∑30
i=1 impj,Tj ,i,nk
∑Tjt=1 ∑30
i=1 impj,Tj ,i
100. (9)
At a sector level k and at a goal level, the Sector SDG Impact Index was computed averaging thesingle ISIIs:
SSIIj,k =∑Nk
nk=1 ISI Ij,nk
Nk. (10)
At a target level, for each sector k, the target tj in SDG j Impact Index (STII) was computedaveraging the single ITIIs:
STIIj,Tj ,k =∑Nk
nk=1 ITI Ij,Tj ,nk
Nk. (11)
The corresponding secondary index, for each sector k, is the Sector SDG j Target Impact Index(SSTII), computed averaging the single ISTIIs:
SSTIIj,k =∑Nk
nk=1 ISTI Ij,nk
Nk. (12)
An Average SDG Impact Index was finally computed both at industry (AISII) and sector (ASSII)level, averaging the ISIIs and SSIIs, respectively:
AISI Ink =∑16
j=1 ISI Ij,nk
16, (13)
ASSIInk =∑16
j=1 SSIIj,nk
16. (14)
An Average SDG Target Impact Index was finally computed both at the industry (AISTII) and sector(ASSTII) level, averaging the single ITIIs and SSTIIs:
AISTII,nk =∑16
j=1 ∑Tjt=1 ∑30
i=1 impj,Tj ,i,nk
∑16j=1 ∑
Tjt=1 ∑30
i=1 impj,Tj ,i
100, (15)
ASSTII,nk =∑16
j=1 ∑Tjt=1 ∑30
i=1 impj,Tj ,i,nk
∑16j=1 ∑
Tjt=1 ∑30
i=1 impj,Tj ,i
100. (16)
A synthesis of the calculated indices is presented in Table 4.

Sustainability 2018, 10, 2248 7 of 23
Table 4. Definitions of the calculated indices *.
SDG Mapping Target Mapping
Acronym Full name Measured for DescriptionNumber of
RelatedFormula
Acronym Full name Measured for DescriptionNumber of
RelatedFormula
SRI SDG relevanceIndex
Each SASB’sissue
Number of SDG impacted byeach SASB’s issue/16 (1) TRI Target Relevance
IndexEach SASB’s
issuesNumber of targets the SDGs
impacted by each SASB’s issues /107 (2)
TSRI Target SpecificRelevance Index
Each SDGimpacted byeach SASB’s
issues
Number of targets impacted in thesingle SDG / total number of targets in
the SDG(3)
ERI ESG RelevanceIndex Each SDG Number of SASB’s issue
impacting the SDG/30 (4) TERI ESG TargetRelevance Index Each target Number of SASB’s issue impacting
the target/30 (5)
TSERI Target Specific ESGRelevance Index Each SDG Average of the single TERIs (6)
ISII Industry SDGImpact Index
Each SDG ineach industry
Ratio (multiplied by 100)between the number of
industry-specific material issuesimpacting the SDG and the total
number of SASB issuesimpacting the SDG
(7) ITII Industry TargetImpact Index
Each target ineach industry
Ratio (multiplied by 100) betweenthe number of industry specific
material issues impacting the targeton the total number of SASB issues
impacting the target
(8)
ISTII Industry SDGTarget Impact Index
Each SDG andin each
industry
Ratio (multiplied by 100) between thenumber of industry specific materialissues impacting each target in eachSDG and the total number of SASB
general ESG issues affecting the singleTarget tj in SDG j
(9)
SSII Sector SDGImpact Index
Each SDG ineach sector
Average of ISIIs across industriesin the sector (10) STII Sector Target
Impact IndexEach target in
each sectorAverage of ITIIs across industries in
the sector (11)
SSTII Sector SDG TargetImpact Index
Each SDG ineach sector
Average of the ISTIIs across industriesin the sector (12)
AISIIAverage
Industry SDGImpact Index
All SDGs ineach industry Average of ISIIs of all SDGs (13) AISTII Average Industry
SDG Target IndexAll SDGs in
each industry Average of the ISTIIs (14)
ASSIIAverage Sector
SDG ImpactIndex
All SDGs ineach Sector Average of SSIIs of all SDGs (15) ASSTII Average Sector
SDG Target IndexAll SDGs ineach sector Average of the SSTIIs (16)
* The secondary indices are in italics.

Sustainability 2018, 10, 2248 8 of 23
3. Results and Discussion
3.1. The SDG Relevance Indices and the ESG Relevance Indices
Table 5 presents the values of the SDG Relevance Indices obtained mapping SASB sustainabilityissues to the SDGs both at a goal (SRI) and a target (TRI) level defined by (1) and (2) in the methodologysection, respectively.
Table 5. SDG Relevance Index (SRI) and Target Relevance Index (TRI).
SASB General Issue Category # of SDGsImpacted
#of TargetsImpacted SRI TRI
Environment
GHG emissions 3 4 18.75% 3.74%Air quality 3 7 18.75% 6.54%
Energy management 5 13 31.25% 12.15%Fuel management 4 11 25.00% 10.28%
Water and wastewater management 7 24 43.75% 22.43%Waste and hazardous materials management 7 20 43.75% 18.69%
Biodiversity impacts 6 17 37.50% 15.89%
Social Capital
Human rights and community relations 6 24 37.50% 22.43%Access and affordability 9 18 56.25% 16.82%
Customer welfare 5 12 31.25% 11.21%Data security and customer privacy 1 1 6.25% 0.93%
Fair disclosure and labeling 4 8 25.00% 7.48%Fair marketing and advertising 4 10 25.00% 9.35%
Human Capital
Labor relations 4 16 25.00% 14.95%Fair labor practices 7 18 43.75% 16.82%
Employee health safety and wellbeing 3 13 18.75% 12.15%Diversity and inclusion 4 17 25.00% 15.89%
Compensation and benefits 3 8 18.75% 7.48%Recruitment development and retention 5 14 31.25% 13.08%
Business Model and Innovation
Lifecycle impacts of products and services 11 27 68.75% 25.23%Environmental social impacts on assets & operations 19 56.25% 17.76%
Product packaging 6 10 37.50% 9.35%Product quality and safety 4 9 25.00% 8.41%
Leadership and Governance
Systemic risk management 5 7 31.25% 6.54%Accident and safety management 7 13 43.75% 12.15%
Business ethics and transparency of payments 1 2 6.25% 1.87%Competitive behavior 4 9 25.00% 8.41%
Regulatory capture and political influence 5 12 31.25% 11.21%Materials sourcing 8 17 50.00% 15.89%
Supply chain management 14 36 87.50% 33.64%
We can observe a substantial variation in the ability of the SASB issues to impact the SDGs.On a goal level, the SRI ranges from 6.3% to 87.5% with a mean of 34.2% and a standard deviation of17%; business ethics and transparency of payments and data security and privacy are only relevantto SDG 16 (peace, justice and strong institutions) whereas supply chain management impacts 14 ofthe SDGs (the exceptions are SDG 2 on ending hunger, and SDG 4 on inclusive and equitable quality

Sustainability 2018, 10, 2248 9 of 23
education). This shows that some SASB issues are much important to the SDGs in terms of scope thanothers but also that the SASB issues are in general relevant to the SDGs.
At a target level, values of the TRI range from 0.93% to 33.64% with an average value of 12.95%and a standard deviation of 7%; data security and privacy is relevant only for target 16.4 (by 2030,significantly reduce illicit financial and arms flows, strengthen the recovery and return of stolen assetsand combat all forms of organized crime) whereas supply chain management is relevant for 36 out ofthe 107 targets considered in our analysis.
When we consider the aggregate values for each SASB dimension, we find that business modeland innovation present the highest values for both indices, with an SRI of 46.88% and a TRI of15.98% (Table 6).
Table 6. SDG Relevance Index and Target Relevance Index for each SASB dimension.
Environment Social Capital HumanCapital
Business Model andInnovation
Leadership andGovernance
SRI 31.25% 30.21% 27.08% 46.88% 39.29%TRI 12.82% 11.37% 13.40% 15.19% 12.82%
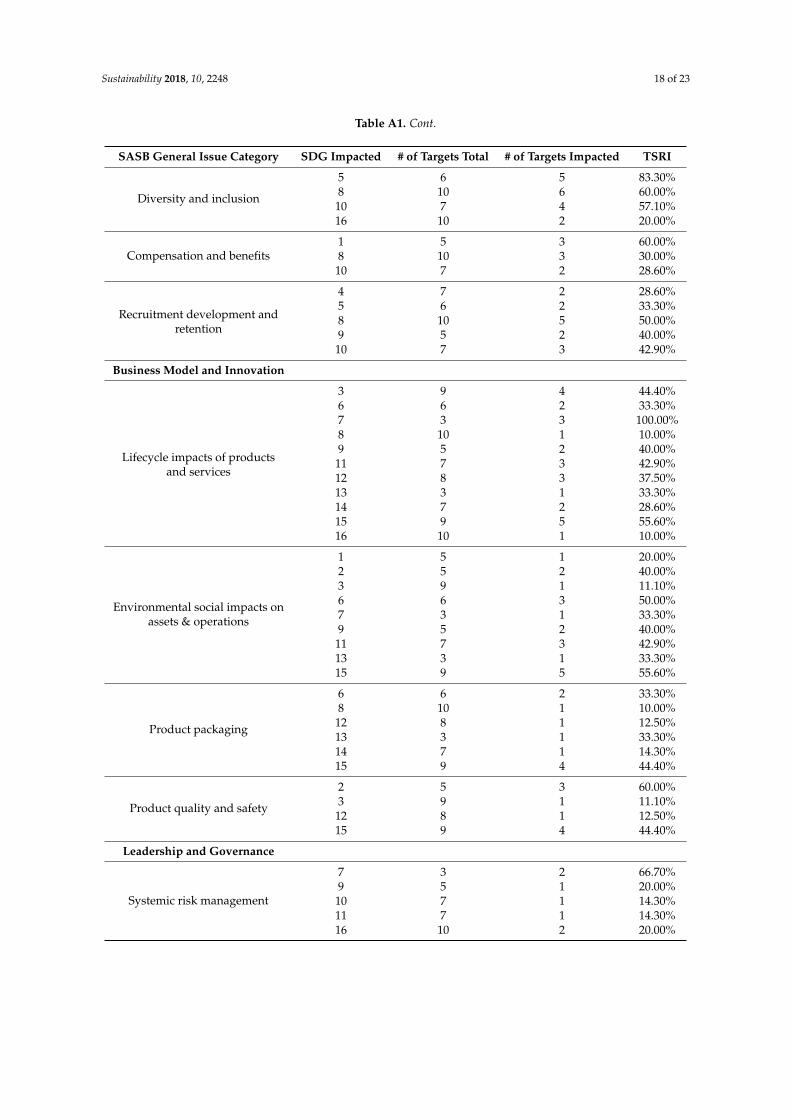
The intensity of impact on a given SDG of each issue is provided by the Target Specific RelevanceIndex (TSRI), as defined in (3). Detailed results are reported in Table A1 in Appendix A. The TSRIranges from 10% to 100% with a mean of 39.1% and a standard deviation of 21.4%. If on a goal level,our analysis shows that not all the SDGs are impacted by the same SASB issues, on a target level wecan add that not all SASB issues that impact the same SDG do it with the same intensity. For example,SDG 7 (affordable and clean energy) has three targets. Supply chain management impacts all of them(100%), GHG emissions two of them (66.67%), and access and affordability only one of them (33.33%).In this regard, it is important to notice that the number of targets varies across the SDGs, ranging fromthree in SDG 7 and SDG 13 (climate action) to 10 in SDG 8 (decent work and economic growth) and SDG16 (peace, justice and strong institutions).
The extent to which each SDG is impacted by the 30 SASB issues, is measured, at a goal level,by the ESG Relevance Index (ERI), as defined in (4). Values of the ERI presented in Table 5 show that alsofor this index we have a variation similar to the SRI. The number of SASB issues impacting single SDGranges from four for SDG 4 (quality education) to eighteen for SDG 3 (good health and well-being)and consequently the ERI ranges from 13% to 60% with a mean of 36%. This shows that, on a simplecount basis, doing well on material issues will be more important for some SDGs than for others whichsuggests that the private sector can make more contributions to some SDGs than others.
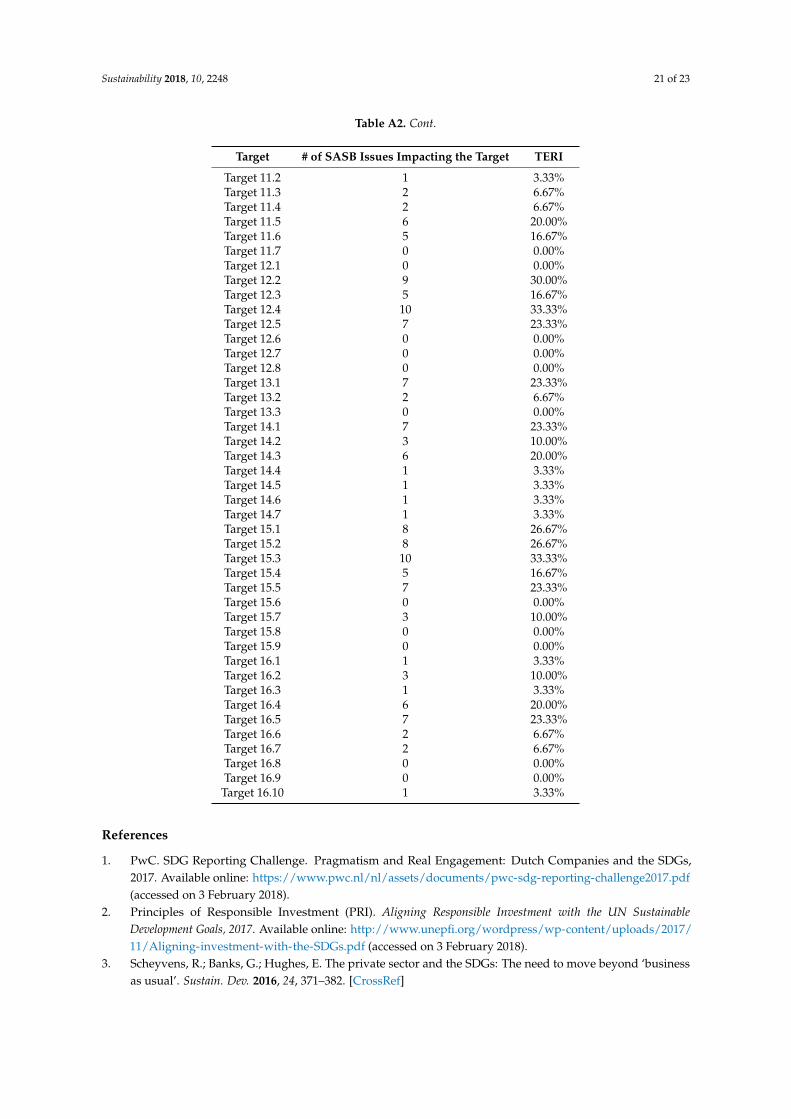
At a target level, the corresponding index we calculated is the Target ESG Relevance Index (TERI),defined in (5). Detailed values of the index are reported in Table A2 in the Appendix A. The TERIranges from 46.7% for Target 3.9 (by 2030, substantially reduce the number of deaths and illnessesfrom hazardous chemicals and air, water and soil pollution and contamination) to 0% for 17 targets notimpacted by any SASB issue, with a mean of 12.65%, meaning that on average each target is impactedby less than four SASB’s issues.
Averaging the TERIs across each SDG, as defined in (6), we calculated the Target Specific ESGRelevance Index (TSERI). Table 7 shows that whereas on a goal level the SDG most impacted by SASB’sissues is SDG 3 (good health and wellbeing, 60%), at a target level it is SDG 7 (affordable and cleanenergy, 26%). The TSERI ranges from 4% for SDG 4 (quality education) to 26% for SDG 7, with a meanof 12.95%.

Sustainability 2018, 10, 2248 10 of 23
Table 7. ESG Relevance Index (ERI) and Target Specific ESG Relevance Index (TSERI).
SDG # of SASB’s Issues Impacting the SDG ERI TSERI
SDG 1 11 37% 15%SDG 2 10 33% 13%SDG 3 18 60% 19%SDG 4 4 13% 4%SDG 5 7 23% 10%SDG 6 13 43% 18%SDG 7 10 33% 26%SDG 8 14 47% 16%SDG 9 9 30% 12%
SDG 10 10 33% 10%SDG 11 10 33% 9%SDG 12 15 50% 13%SDG 13 9 30% 10%SDG 14 9 27% 10%SDG 15 8 40% 15%SDG 16 11 37% 8%
3.2. The SDG Impact Indices and the Target Impact Indices
The second group of indices we created allows the assessment of the specific ability of the issuesthat are financially material for an industry. It is based on the assumption that that the number of SDGsand targets impacted by all SASB issues represent the theoretical maximum effect that can be obtainedby the private sector (i.e., the impact on SDGs that a theoretical company operating in a theoreticalindustry for which all the issues are material on a financial perspective might have). We therefore setthis value equal to 100.
On the basis of SASB Materiality Map™ [22], we considered only the issues that are material foreach industry in SASB’s Sustainable Industry Classification System™ [19]. In essence, with differentdegrees of detail, the SDG Impact Index family measures the extent to which a company doing well onthe material issues for its sector is doing good by contributing to each SDG.
At a goal level, the Industry SDG Impact Index (ISII)—defined by (7)—measures the ability ofan industry to affect a given SDG through its material issues. In general, the ISIIs present noticeablevariation and for each industry there is a particular SDG where it has high impact. It is too cumbersometo present all of the data since it would a table of 79 (number of SASB industries) by 16 (number ofSDGs). Table 8 illustrates this for the biotechnology industry with the highest score of 75.00 for SDG 4(quality education) and the lowest of 36.36 for SDG 16 (peace, justice and strong institutions).
Table 8. Industry SDG Impact Index (ISII) for the biotechnology industry.
SDG ISII SDG ISII
SDG4 75.00 SDG2 50.00SDG11 60.00 SDG8 50.00SDG5 57.14 SDG12 42.86SDG14 57.14 SDG1 40.00SDG3 55.56 SDG7 40.00SDG9 55.56 SDG10 40.00SDG15 54.55 SDG13 37.50SDG6 53.85 SDG16 36.36
At a target level, the Industry Target Impact Index (ITII), defined by (8), presents similar variations.Providing the data would be even more cumbersome, with a table of 79 by 107 (the number of targets).For illustration, Table 9 shows the data for the targets in SDG 8 (decent work and economic growth)

Sustainability 2018, 10, 2248 11 of 23
for the biotechnology industry, with the highest score of 100.00 for target 8.6 and the lowest of 0.00 fortarget 8.2 (see Table 2 for a description of the targets of SDG 8).
Table 9. Industry Target Impact Index (ITII) for the biotechnology industry.
Biotechnology Industry
SDG 8 Targets ITII
Target 8.6 100.00Target 8.3 50.00Target 8.5 50.00Target 8.7 50.00Target 8.8 50.00Target 8.9 50.00Target 8.4 42.86Target 8.1 40.00Target 8.2 0.00
Target 8.10 n.a. *
* None of SASB’s issues impact target 8.10 and so the ITII cannot be calculated.
The target level mapping allowed us to calculate a target-weighted SDG impact index for eachindustry, the Industry SDG Target Impact Index (ISTII), defined by (9). Again, using the biotechnologyindustry as example, values presented in Table 10 shows a similar variation to the previous index.Nevertheless, while SDG 4 remain the SDG most affected by the industry, SDG 13 (climate action) is inthis case the goal with the lowest value.
Table 10. Industry SDG Target Impact Index (ISTII) for the Biotechnology Industry.
Biotechnology Industry
SDG ISTII SDG ISTII
SDG1 40.91 SDG2 60.00SDG3 52.94 SDG4 87.50SDG5 55.55 SDG6 66.66SDG7 43.48 SDG8 45.83SDG9 66.66 SDG10 50.00SDG11 68.42 SDG12 54.83SDG13 33.33 SDG14 65.00SDG15 48.78 SDG16 43.47
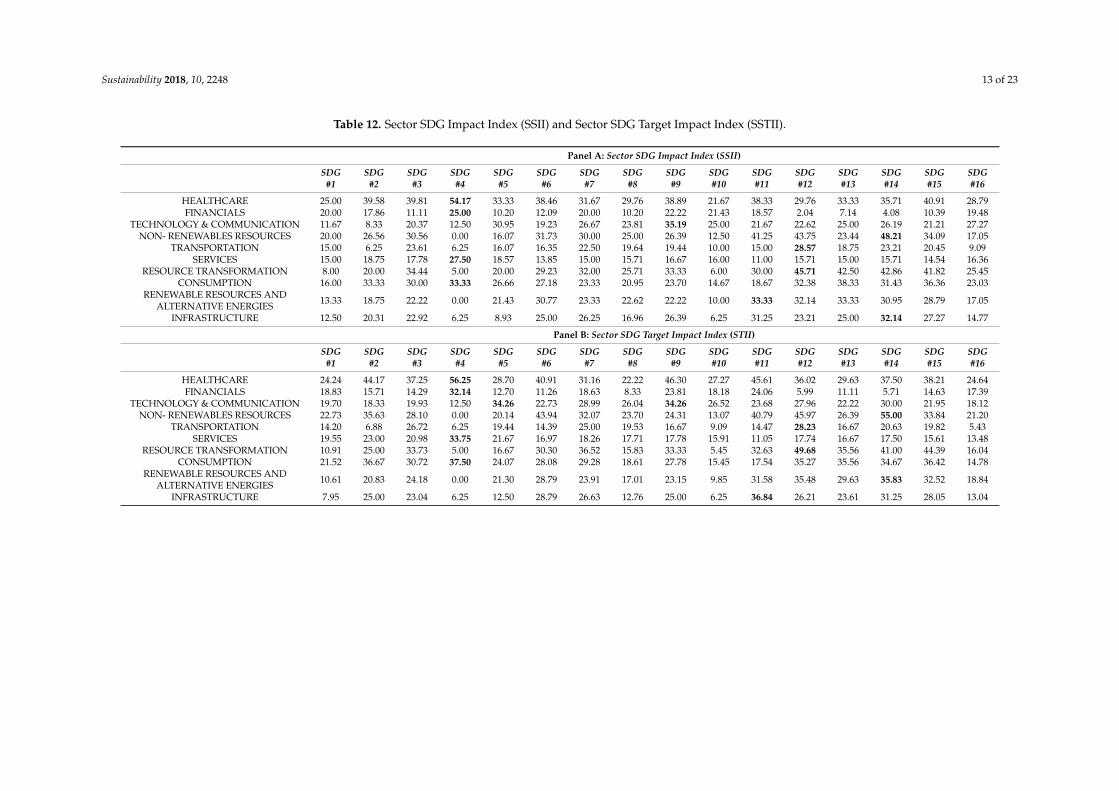
At a sector level, averaging the industry SDG impact indices both at a goal and a target level,we calculated for each SDG (or each target) three other indices: the Sector SDG Impact Index (SSII);the Sector Target Impact Index (STII); and the Sector SDG Target Impact Index (SSTII), respectively definedby (10), (11) and (12) formulas.
Using the health care Sector as an example, Table 11 shows the data for the targets in SDG 8,with a maximum of 33.33 also in this case for target 8.6 and a minimum value of 0.00 for target 8.2.
Values of SSIIs and SSTIIs are presented in Table 12. We can observe that for each sector there areparticular SDGs where it has high impact (in bold in Table 12) and for each SDG there are particularsectors that have a high impact on it. At a goal level, SDG 4 is the goal where the highest number ofsectors (four out of ten) presents the highest SSII, whereas at a target level (SSTII) this also applies toSDG 14 (life below water).

Sustainability 2018, 10, 2248 12 of 23
Table 11. Sector Target Impact Index (STII) for the health care sector.
Health Care Sector
SDG 8 Targets STII
Target 8.6 33.33Target 8.4 30.95Target 8.1 26.67Target 8.9 25Target 8.3 20.83Target 8.5 20.83Target 8.8 20.83Target 8.7 16.67Target 8.2 0
Target 8.10 n.a. *
* None of SASB’s issues impact target 8.10 and so the STII cannot be calculated.
The last indices we calculated measure the ability of SASB industries and sectors to impact SDGsin general. These are represented by the Average Industry SDG Impact Index (AISII), the Average SectorSDG Impact Index (ASSII) and the corresponding indices at a target level, Average Industry SDG TargetImpact Index (ASTII) and the Average Sector SDG Target Impact Index (ASSTII), described by formulas(13)–(16) in the Methodology section.
For reason of space, we do not present tabulated data of the above-mentioned indices at industrylevel. Using the industries in the health care sector as an example, the AISII ranges from 15.00 inthe health care distribution industry to 50.34 for the biotechnology and pharmaceuticals industries,whereas the AISTII ranges from 13.79 in the managed care industry to 53.69 in the biotechnology andpharmaceutical industries, showing that some industries in the health care sector are more relevant tothe SDGs than others. Indeed, this pattern is constant in all sectors, and the average standard deviationof the AISII is 15.31% whereas for the AISTII is equal to 17.27. Values are presented in Table 13.
Sustainability 2018, 10, 2248 13 of 23
Table 12. Sector SDG Impact Index (SSII) and Sector SDG Target Impact Index (SSTII).
Panel A: Sector SDG Impact Index (SSII)
SDG#1
SDG#2
SDG#3
SDG#4
SDG#5
SDG#6
SDG#7
SDG#8
SDG#9
SDG#10
SDG#11
SDG#12
SDG#13
SDG#14
SDG#15
SDG#16
HEALTHCARE 25.00 39.58 39.81 54.17 33.33 38.46 31.67 29.76 38.89 21.67 38.33 29.76 33.33 35.71 40.91 28.79FINANCIALS 20.00 17.86 11.11 25.00 10.20 12.09 20.00 10.20 22.22 21.43 18.57 2.04 7.14 4.08 10.39 19.48
TECHNOLOGY & COMMUNICATION 11.67 8.33 20.37 12.50 30.95 19.23 26.67 23.81 35.19 25.00 21.67 22.62 25.00 26.19 21.21 27.27NON- RENEWABLES RESOURCES 20.00 26.56 30.56 0.00 16.07 31.73 30.00 25.00 26.39 12.50 41.25 43.75 23.44 48.21 34.09 17.05
TRANSPORTATION 15.00 6.25 23.61 6.25 16.07 16.35 22.50 19.64 19.44 10.00 15.00 28.57 18.75 23.21 20.45 9.09SERVICES 15.00 18.75 17.78 27.50 18.57 13.85 15.00 15.71 16.67 16.00 11.00 15.71 15.00 15.71 14.54 16.36
RESOURCE TRANSFORMATION 8.00 20.00 34.44 5.00 20.00 29.23 32.00 25.71 33.33 6.00 30.00 45.71 42.50 42.86 41.82 25.45CONSUMPTION 16.00 33.33 30.00 33.33 26.66 27.18 23.33 20.95 23.70 14.67 18.67 32.38 38.33 31.43 36.36 23.03
RENEWABLE RESOURCES ANDALTERNATIVE ENERGIES 13.33 18.75 22.22 0.00 21.43 30.77 23.33 22.62 22.22 10.00 33.33 32.14 33.33 30.95 28.79 17.05
INFRASTRUCTURE 12.50 20.31 22.92 6.25 8.93 25.00 26.25 16.96 26.39 6.25 31.25 23.21 25.00 32.14 27.27 14.77
Panel B: Sector SDG Target Impact Index (STII)
SDG#1
SDG#2
SDG#3
SDG#4
SDG#5
SDG#6
SDG#7
SDG#8
SDG#9
SDG#10
SDG#11
SDG#12
SDG#13
SDG#14
SDG#15
SDG#16
HEALTHCARE 24.24 44.17 37.25 56.25 28.70 40.91 31.16 22.22 46.30 27.27 45.61 36.02 29.63 37.50 38.21 24.64FINANCIALS 18.83 15.71 14.29 32.14 12.70 11.26 18.63 8.33 23.81 18.18 24.06 5.99 11.11 5.71 14.63 17.39
TECHNOLOGY & COMMUNICATION 19.70 18.33 19.93 12.50 34.26 22.73 28.99 26.04 34.26 26.52 23.68 27.96 22.22 30.00 21.95 18.12NON- RENEWABLES RESOURCES 22.73 35.63 28.10 0.00 20.14 43.94 32.07 23.70 24.31 13.07 40.79 45.97 26.39 55.00 33.84 21.20
TRANSPORTATION 14.20 6.88 26.72 6.25 19.44 14.39 25.00 19.53 16.67 9.09 14.47 28.23 16.67 20.63 19.82 5.43SERVICES 19.55 23.00 20.98 33.75 21.67 16.97 18.26 17.71 17.78 15.91 11.05 17.74 16.67 17.50 15.61 13.48
RESOURCE TRANSFORMATION 10.91 25.00 33.73 5.00 16.67 30.30 36.52 15.83 33.33 5.45 32.63 49.68 35.56 41.00 44.39 16.04CONSUMPTION 21.52 36.67 30.72 37.50 24.07 28.08 29.28 18.61 27.78 15.45 17.54 35.27 35.56 34.67 36.42 14.78
RENEWABLE RESOURCES ANDALTERNATIVE ENERGIES 10.61 20.83 24.18 0.00 21.30 28.79 23.91 17.01 23.15 9.85 31.58 35.48 29.63 35.83 32.52 18.84
INFRASTRUCTURE 7.95 25.00 23.04 6.25 12.50 28.79 26.63 12.76 25.00 6.25 36.84 26.21 23.61 31.25 28.05 13.04

Sustainability 2018, 10, 2248 14 of 23
Table 13. Average Industry SDG Impact Index (AISII) and Average Industry SDG Target Impact Index(AISTII) for the health care sector.
Industry AISII AISTII
Biotechnology 50.34 53.69Pharmaceuticals 50.34 53.69
Medical Equipment 45.60 45.57Health Care Delivery 29.95 25.62
Health Care Distribution 15.00 14.29Managed Care 18.46 13.79
Finally, in Table 14 are presented the values for the Average Sector SDG Impact Index (ASSII)and the Average Sector SDG Target Impact Index (ASSTII).
Table 14. Average Sector SDG Impact Index (ASSII) and Average Sector SDG Target ImpactIndex (ASSTII).
Sector ASSII ASTII
HEALTHCARE 34.95 34.44FINANCIALS 14.49 14.00
TECHNOLOGY & COMMUNICATION 22.35 24.22NON- RENEWABLES RESOURCES 26.66 30.60
TRANSPORTATION 16.89 18.10SERVICES 16.45 18.05
RESOURCE TRANSFORMATION 26.99 28.42CONSUMPTION 26.84 27.37
RENEWABLE RESOURCES AND ALTERNATIVE ENERGIES 22.97 23.81INFRASTRUCTURE 20.34 21.40
In both cases, health care is the sector that has the highest overall impact on the SDGs. This resultis not surprising. Table 12 shows that this sector is among the four most important sectors for almost allthe goals, followed by consumption, non-renewable resources and resource transformation. The lowestvalue both at a goal and a target level of the impact index for overall the SDGs is of the financial sector,that is (see Table 12) among the three most important sectors only for SDG 10 (reduced inequalities)when the index is calculated at a goal level and for SDG 1 (no poverty) and SDG 10 when the indexis calculated at a target level. Nevertheless, it must be noticed that our framework takes into accountonly the direct relevance of a sector for SDGs. Indeed, the financial sector plays a crucial role on theachievement of the goals also through the “indirect” impact it can have (i.e., credit scoring based on SDGrelevant issues, investment in companies/industries with high SDG impact, etc.). In general, adoptingthe SDGs as a unified framework for investment and credit policies, the financial sector can enhance theSDG relevance for all sectors. Let’s consider SDG 7 (affordable and clean energy) as example, for whichthe two most relevant sectors are non-renewable resources and resource transformation. In this case,the financial sector, besides through increasing energy efficiency of own buildings and operations,can contribute to reinforce the impact of the other sectors by financing projects in sustainable energy,through renovation loans, green loans, and structured finance.
4. Conclusions, Limitations and Further Research
In the introduction we noted the importance of the private sector in contributing to theachievement of the SDGs. Both the public and private sector need to understand the varying degreesto which the latter can support the former in achieving the SDGs. In the aggregate, the private sectorwill be more important to some SDGs, and their specific targets, than others. This paper providesspecific guidance on how the private sector can support the SDGs by mapping the material issues thatcreate value for shareholders to SDG targets that will make the world a better place. Our research

Sustainability 2018, 10, 2248 15 of 23
shows that for each sector, there are particular SDGs where it has high impact and for each SDG thereare particular sectors that have a high impact on it, and some sectors are more important to the SDGsin aggregate than others. The same is true at the target level.
None of these findings are surprising since it would be expected that some sectors would be morerelevant to a particular SDG than others. What perhaps is surprising is to see that a few sectors standout in terms of their impact on the SDGs and that some SDGs are more impacted by SASB’s ESG topicsthan others. The former means that the success of a few sectors will largely determine whether theSDG goals are met. The latter means that while some SDGs will substantially benefit from the privatesector “doing well”, others will benefit to a lesser extent.
As introduced in the methodology section, a limitation of the matching between SASB’s materialissues with the SDGs or their targets is its definition as a dichotomous variable (impact/not impact).It does not take into account the fact that a material SASB issue in one sector could be more importantthan another due to the absolute value of the topic. If we had a credible weighting scheme, the resultscould be different. This same caveat applies to our analysis at the target level. Another caveat is thatwe treat the impact of a material ESG issue as equal if it is relevant to an SDG. Just how importanta material issue is to a SDG could vary according to its nature. For example, GHG emissions could bemore important to achieving the success of some SDGs than others even though it has an impact on allof them. This too applies at the target level.
However, we believe that each material issue could impact a single SDG or target with a varyingdegree between 0 and 1; in this way, we can take into account fuzzy set theory (Zadeh, 1965) [23]. In thesocial sciences, fuzzy set theory has initially been adopted to study poverty and social exclusion [24,25].Later, this methodology has been successfully implemented to monitor the effects of marital disruptionon well-being [26], to measure the multidimensional education mismatch [27], to measure laborparticipation [28], and to study multidimensional measures of quality of life [29]. The positive resultsachieved while applying the fuzzy set approach to fields other than poverty demonstrate its wideapplicability and robustness.
In the context of the matching between SASB material issues with the SDGs (or their targets),such varying degrees are defined as membership functions (m.f. = µi,j) to the fuzzy set of impactedSGSs. In other words, each SDG is impacted by a certain SASB material issue, but a varying degreefrom 0 to 1. Clearly, the approach proposed in Part II is a special case of the fuzzy approach, where themembership functions are either 0 (impi,j = 0) or 1 (impi,j = 1).
This methodology could be implemented, for example, in Equation (17), which could be rewritten as:
ISI Ij,nk =∑30
i=1 µj,i,nk
∑30i=1 µj,i
100 =MIkMI
100 (17)
for which Equation (17) is a special case when the impact could only be fully present or absent.We think this analysis is helpful for two broad audiences. The first is the corporate community. For it,they can use it to determine which SASB issues are most congruent for them in terms of both doingwell and doing good. In particular, since we have mapped the material ESG issues in each industry tothe target level of the SDGs. This provides a company a well-structured narrative. It can simply pointto its performance on its material ESG issues and the SDG targets for which these issues are relevant.
The second audience is investors. Again, assuming that ESG performance metrics are available,an investor can assess the implications at the target level to the relevant SDGs. The same can bedone in a portfolio basis. At both a company and portfolio level, the above caveats apply. To this wewould add adjustments based on company size (such as by revenues or market cap) and perhaps thelocation of their operations. While investors must put investment returns first, they are increasinglyrecognizing that the system-level impacts of their portfolios will affect their ability to generate thesereturns over the long term. Important work is being done here by The Investment Integration Project

Sustainability 2018, 10, 2248 16 of 23
(TIIP), a research service that helps investors to move their level of analysis beyond just portfolios toinclude the context in which these portfolios exist [30].
In order to serve both audiences, we are looking for ways to provide our detailed mapping in thepublic domain.
We would like to conclude with one final reflection. If good metrics existed for companyperformance on their material issues, one could use these ESG measures as proxies for SDG impact.They obviously wouldn’t be impact measures. For the most part, the key performance indicatorsrecommended by SASB are output measures which have outcomes that lead to impacts [9].
True measures of impact are difficult to obtain since they require data from outside the company.Impact measures are about positive and negative externalities being created by a company’s operations.Most work to date on impact measurement has been done in the private markets. Developingmethodologies for doing so in the public markets will be important for achieving the SDGs.
Author Contributions: C.C. and R.G.E. conceived and designed the research; G.B. developed the methodology;C.C. conducted the analysis; C.C. and R.G.E. wrote the paper; G.B., C.C. and R.G.E. revised the paper.
Conflicts of Interest: The authors declare no conflict of interest.
Appendix A
Table A1. Target Specific Relevance Index (TSRI).
SASB General Issue Category SDG Impacted # of Targets Total # of Targets Impacted TSRI
Environment
GHG emissions7 3 2 66.70%9 5 1 20.00%
12 8 1 12.50%
Air quality3 9 4 44.40%
11 7 1 14.30%12 8 2 25.00%
Energy management
3 9 4 44.40%7 3 3 100.00%9 5 2 40.00%
12 8 3 37.50%13 3 1 33.30%
Fuel management
3 9 4 44.40%7 3 3 100.00%
12 8 3 37.50%13 3 1 33.30%
Water and wastewatermanagement
2 5 5 100.00%3 9 1 11.10%6 6 6 100.00%
11 7 2 28.60%12 8 3 37.50%14 7 4 57.10%15 9 3 33.30%
Waste and hazardous materialsmanagement
3 9 1 11.10%6 6 4 66.70%8 10 2 20.00%
11 7 2 28.60%12 8 4 50.00%14 7 3 42.90%15 9 4 44.40%

Sustainability 2018, 10, 2248 17 of 23
Table A1. Cont.
SASB General Issue Category SDG Impacted # of Targets Total # of Targets Impacted TSRI
Biodiversity impacts
2 5 2 40.00%6 6 2 33.30%
11 7 2 28.60%12 8 2 25.00%14 7 4 57.10%15 9 5 55.60%
Social Capital
Human rights and communityrelations
1 5 2 40.00%6 6 6 100.00%8 10 5 50.00%
10 7 3 42.90%11 7 2 28.60%16 10 6 60.00%
Access and affordability
1 5 2 40.00%3 9 2 22.20%5 6 2 33.30%7 3 1 33.30%8 10 1 10.00%9 5 3 60.00%
10 7 3 42.90%11 7 4 57.10%
Customer welfare
2 5 3 60.00%3 9 3 33.30%4 7 2 28.60%6 6 3 50.00%
15 9 1 11.10%
Data security and customerprivacy 16 10 1 10.00%
Fair disclosure and labeling
2 5 2 40.00%3 9 4 44.40%4 7 1 14.30%
16 10 1 10.00%
Fair marketing and advertising
1 5 2 40.00%2 5 1 20.00%3 9 4 44.40%4 7 3 42.90%
Human Capital
Labor relations
1 5 2 40.00%3 9 4 44.40%8 10 7 70.00%
10 7 3 42.90%
Fair labor practices
1 5 3 60.00%3 9 2 22.20%5 6 3 50.00%6 6 1 16.70%8 10 5 50.00%
10 7 2 28.60%16 10 2 20.00%
Employee health safety andwellbeing
3 9 4 44.40%5 6 4 66.70%8 10 5 50.00%
Sustainability 2018, 10, 2248 18 of 23
Table A1. Cont.
SASB General Issue Category SDG Impacted # of Targets Total # of Targets Impacted TSRI
Diversity and inclusion
5 6 5 83.30%8 10 6 60.00%
10 7 4 57.10%16 10 2 20.00%
Compensation and benefits1 5 3 60.00%8 10 3 30.00%
10 7 2 28.60%
Recruitment development andretention
4 7 2 28.60%5 6 2 33.30%8 10 5 50.00%9 5 2 40.00%
10 7 3 42.90%
Business Model and Innovation
Lifecycle impacts of productsand services
3 9 4 44.40%6 6 2 33.30%7 3 3 100.00%8 10 1 10.00%9 5 2 40.00%
11 7 3 42.90%12 8 3 37.50%13 3 1 33.30%14 7 2 28.60%15 9 5 55.60%16 10 1 10.00%
Environmental social impacts onassets & operations
1 5 1 20.00%2 5 2 40.00%3 9 1 11.10%6 6 3 50.00%7 3 1 33.30%9 5 2 40.00%
11 7 3 42.90%13 3 1 33.30%15 9 5 55.60%
Product packaging
6 6 2 33.30%8 10 1 10.00%
12 8 1 12.50%13 3 1 33.30%14 7 1 14.30%15 9 4 44.40%
Product quality and safety
2 5 3 60.00%3 9 1 11.10%
12 8 1 12.50%15 9 4 44.40%
Leadership and Governance
Systemic risk management
7 3 2 66.70%9 5 1 20.00%
10 7 1 14.30%11 7 1 14.30%16 10 2 20.00%

Sustainability 2018, 10, 2248 19 of 23
Table A1. Cont.
SASB General Issue Category SDG Impacted # of Targets Total # of Targets Impacted TSRI
Accident and safety management
1 5 1 20.00%3 9 2 22.20%6 6 2 33.30%8 10 2 20.00%
12 8 2 25.00%14 7 2 28.60%15 9 2 22.20%
Business ethics and transparencyof payments 16 10 2 20.00%
Competitive behavior
1 5 3 60.00%7 3 2 66.70%9 5 2 40.00%
10 7 2 28.60%
Regulatory capture and politicalinfluence
2 5 2 40.00%7 3 3 100.00%
12 8 1 12.50%13 3 2 66.70%16 10 4 40.00%
Materials sourcing
3 9 3 33.30%5 6 1 16.70%6 6 1 16.70%8 10 2 20.00%
12 8 3 37.50%13 3 1 33.30%15 9 5 55.60%16 10 1 10.00%
Supply chain management
1 5 4 80.00%3 9 3 33.30%5 6 2 33.30%6 6 2 33.30%7 3 3 100.00%8 10 3 30.00%9 5 3 60.00%
10 7 2 28.60%11 7 1 14.30%12 8 3 37.50%13 3 1 33.30%14 7 4 57.10%15 9 4 44.40%16 10 1 10.00%
Table A2. Target ESG Relevance Index (TERI).
Target # of SASB Issues Impacting the Target TERI
Target 1.1 4 13.33%Target 1.2 4 13.33%Target 1.3 3 10.00%Target 1.4 6 20.00%Target 1.5 5 16.67%Target 2.1 4 13.33%Target 2.2 5 16.67%

Sustainability 2018, 10, 2248 20 of 23
Table A2. Cont.
Target # of SASB Issues Impacting the Target TERI
Target 2.3 2 6.67%Target 2.4 6 20.00%Target 2.5 3 10.00%Target 3.1 8 26.67%Target 3.2 8 26.67%Target 3.3 1 3.33%Target 3.4 10 33.33%Target 3.5 4 13.33%Target 3.6 1 3.33%Target 3.7 2 6.67%Target 3.8 3 10.00%Target 3.9 14 46.67%Target 4.1 0 0.00%Target 4.2 0 0.00%Target 4.3 2 6.67%Target 4.4 3 10.00%Target 4.5 2 6.67%Target 4.6 0 0.00%Target 4.7 1 3.33%Target 5.1 5 16.67%Target 5.2 3 10.00%Target 5.3 2 6.67%Target 5.4 2 6.67%Target 5.5 5 16.67%Target 5.6 1 3.33%Target 6.1 4 13.33%Target 6.2 5 16.67%Target 6.3 9 30.00%Target 6.4 9 30.00%Target 6.5 2 6.67%Target 6.6 4 13.33%Target 7.1 8 26.67%Target 7.2 7 23.33%Target 7.3 8 26.67%Target 8.1 5 16.67%Target 8.2 3 10.00%Target 8.3 4 13.33%Target 8.4 7 23.33%Target 8.5 8 26.67%Target 8.6 1 3.33%Target 8.7 4 13.33%Target 8.8 8 26.67%Target 8.9 8 26.67%
Target 8.10 0 0.00%Target 9.1 4 13.33%Target 9.2 5 16.67%Target 9.3 1 3.33%Target 9.4 6 20.00%Target 9.5 2 6.67%
Target 10.1 5 16.67%Target 10.2 7 23.33%Target 10.3 4 13.33%Target 10.4 3 10.00%Target 10.5 3 10.00%Target 10.6 0 0.00%Target 10.7 0 0.00%Target 11.1 3 10.00%
Sustainability 2018, 10, 2248 21 of 23
Table A2. Cont.
Target # of SASB Issues Impacting the Target TERI
Target 11.2 1 3.33%Target 11.3 2 6.67%Target 11.4 2 6.67%Target 11.5 6 20.00%Target 11.6 5 16.67%Target 11.7 0 0.00%Target 12.1 0 0.00%Target 12.2 9 30.00%Target 12.3 5 16.67%Target 12.4 10 33.33%Target 12.5 7 23.33%Target 12.6 0 0.00%Target 12.7 0 0.00%Target 12.8 0 0.00%Target 13.1 7 23.33%Target 13.2 2 6.67%Target 13.3 0 0.00%Target 14.1 7 23.33%Target 14.2 3 10.00%Target 14.3 6 20.00%Target 14.4 1 3.33%Target 14.5 1 3.33%Target 14.6 1 3.33%Target 14.7 1 3.33%Target 15.1 8 26.67%Target 15.2 8 26.67%Target 15.3 10 33.33%Target 15.4 5 16.67%Target 15.5 7 23.33%Target 15.6 0 0.00%Target 15.7 3 10.00%Target 15.8 0 0.00%Target 15.9 0 0.00%Target 16.1 1 3.33%Target 16.2 3 10.00%Target 16.3 1 3.33%Target 16.4 6 20.00%Target 16.5 7 23.33%Target 16.6 2 6.67%Target 16.7 2 6.67%Target 16.8 0 0.00%Target 16.9 0 0.00%Target 16.10 1 3.33%
References
1. PwC. SDG Reporting Challenge. Pragmatism and Real Engagement: Dutch Companies and the SDGs,2017. Available online: https://www.pwc.nl/nl/assets/documents/pwc-sdg-reporting-challenge2017.pdf(accessed on 3 February 2018).
2. Principles of Responsible Investment (PRI). Aligning Responsible Investment with the UN SustainableDevelopment Goals, 2017. Available online: http://www.unepfi.org/wordpress/wp-content/uploads/2017/11/Aligning-investment-with-the-SDGs.pdf (accessed on 3 February 2018).
3. Scheyvens, R.; Banks, G.; Hughes, E. The private sector and the SDGs: The need to move beyond ‘businessas usual’. Sustain. Dev. 2016, 24, 371–382. [CrossRef]

Sustainability 2018, 10, 2248 22 of 23
4. Torres-Rahman, Z.; Baxter, G.; Rivera, A. Business and the United Nations: Working Together towardsthe Sustainable Development Goals: A Framework for Action, SDG Fund, 2015. Available online: https://www.sdgfund.org/sites/default/files/business-and-un/SDGF_BFP_HKSCSRI_Business_and_SDGs-Web_Version.pdf (accessed on 6 June 2018).
5. Chakravorti, B. How Companies Can Champion Sustainable Development, 2017. Available online: https://hbr.org/2017/03/how-companies-can-champion-sustainable-development (accessed on 6 June 2018).
6. EU High Level Expert Group on Sustainable Finance, Financing a Sustainable European Economy, 2018.Available online: https://ec.europa.eu/info/sites/info/files/180131-sustainable-finance-final-report_en.pdf (accessed on 7 June 2018).
7. European Commission. Communication from the Commission to the European Parliament, the EuropeanCouncil, the Council, the European Central Bank, the European Economic and Social Committee and theCommittee of the Regions, Action Plan: Financing Sustainable Growth, 2018. Available online: https://eur-lex.europa.eu/legal-content/EN/TXT/PDF/?uri=CELEX:52018DC0097&from=EN (accessed on 7 June 2018).
8. Global Reporting Initiative (GRI). An Analysis of the Goals and Targets, 2017. Available online: https://www.globalreporting.org/SiteCollectionDocuments/2017/GRI_UNGC_Final-Draft_An-Analysis-of-the-Goals-and-Targets_July2017.pdf (accessed on 20 October 2017).
9. Vörösmarty, C.J.; Rodríguez Osuna, V.; Koehler, D.A.; Klop, P.; Spengler, J.D.; Buonocore, J.J.; Cak, A.D.;Tessler, Z.D.; Corsi, F.; Green, P.A.; et al. Scientifically assess impacts of sustainable investments. Science 2018,359, 523–525. [CrossRef] [PubMed]
10. Borgers, A.; Derwall, J.; Koedijk, K.; Ter Horst, J. Stakeholder relations and stock returns: On errors ininvestors’ expectations and learning. J. Empir. Financ. 2013, 22, 159–175. [CrossRef]
11. Eccles, R.G.; Ioannou, I.; Serafeim, G. The impact of corporate sustainability on organizational processes andperformance. Manag. Sci. 2014, 60, 2835–2857. [CrossRef]
12. Galema, R.; Plantinga, A.; Scholtens, B. The stocks at stake: Return and risk in socially responsible investment.J. Bank. Financ. 2008, 32, 2646–2654. [CrossRef]
13. Orlitzky, M.; Schmidt, F.L.; Rynes, S.L. Corporate social and financial performance: A meta-analysis. Organ. Stud.2003, 24, 403–441. [CrossRef]
14. Friede, G.; Busch, T.; Bassen, A. ESG and financial performance: Aggregated evidence from more than 2000empirical studies. J. Sustain. Financ. Invest. 2015, 5, 210–233. [CrossRef]
15. Khan, M.; Serafeim, G.; Yoon, A. Corporate sustainability: First evidence on materiality. Account. Rev. 2015,91, 1697–1724. [CrossRef]
16. Grewal, J.; Hauptmann, C.; Serafeim, G. Stock Price Synchronicity and Material Sustainability Information;Harvard Business School Working Paper 17-098; Harvard Business School Working Knowledge: Boston, MA,USA, 2017.
17. Sustainability Accounting Standard Board. SASB’s Approach to Materiality for the Purpose of StandardsDevelopment. Available online: http://library.sasb.org/wp-content/uploads/2017/01/ApproachMateriality-Staff-Bulletin-01192017.pdf?hsCtaTracking=9280788c-d775-4b34-8bc8-5447a06a6d38%7C2e22652a-5486-4854-b68f-73fea01a2414 (accessed on 27 April 2018).
18. Eccles, R.G.; Serafeim, G. The performance frontier: Innovating for a sustainable strategy. Harv. Bus. Rev.2013, 91, 50–60. [PubMed]
19. Sustainability Accounting Standards Board. Sustainable Industry Classification System™ (SICS™).Available online: https://www.sasb.org/approach/sics/ (accessed on 27 September 2017).
20. Phadke, H.; DeMates, L. Investing with the Sustainable Development Goals; White Paper TruValue Labs:San Francisco, CA, USA, 2017; Available online: https://www.truvaluelabs.com/insights/white-papers/investing-with-the-sustainable-development-goals (accessed on 27 September 2017).
21. OECD. An SDG-Based Results Framework for Development Co-Operation, Draft Note by the Results Team of theDevelopment Co-Operation Directorate; OECD: Paris, France, 2016.
22. Sustainability Accounting Standards Board. SASB Materiality Map™. Available online: https://www.sasb.org/materiality/sasb-materiality-map/ (accessed on 27 September 2017).
23. Zadeh, L.A. Fuzzy sets. Inf. Control 1965, 8, 338–353. [CrossRef]24. Cerioli, A.; Zani, S. A fuzzy approach to the measurement of poverty. In Income and Wealth Distribution,
Inequality and Poverty; Springer: Berlin/Heidelberg, Germany, 1990.

Sustainability 2018, 10, 2248 23 of 23
25. Cheli, B.; Lemmi, A. A totally fuzzy and relative approach to the multidimensional analysis of poverty.Econ. Notes 1995, 24, 115–134.
26. Aassve, A.; Betti, G.; Mazzuco, S.; Mencarini, L. Marital disruption and economic well-being: A comparativeanalysis. J. R. Stat. Soc. Ser. A 2007, 170, 781–799. [CrossRef]
27. Betti, G.; D’Agostino, A.; Neri, L. Educational mismatch of graduates: A multidimensional and fuzzy indicator.Soc. Indic. Res. 2011, 103, 465–480. [CrossRef]
28. Belhadj, B. Employment measure in development countries via minimum wage and poverty: New Fuzzyapproach. Opsearch 2015, 52, 329–339.
29. Betti, G.; Soldi, R.; Talev, I. Fuzzy multidimensional indicators of quality of life: The empirical case ofMacedonia. Soc. Indic. Res. 2016, 127, 39–53. [CrossRef]
30. Eccles, R.G. Measuring Investors’ Contributions to the Sustainable Development Goals, Forbes 11 March 2018.Available online: https://www.forbes.com/sites/bobeccles/2018/03/11/measuring-investors-contributions-to-the-sustainable-development-goal/#16ff10783edb (accessed on 15 April 2018).
© 2018 by the authors. Licensee MDPI, Basel, Switzerland. This article is an open accessarticle distributed under the terms and conditions of the Creative Commons Attribution(CC BY) license (http://creativecommons.org/licenses/by/4.0/).