the relationship between multifaceted motivational factors
TRANSCRIPT
Walden University Walden University
ScholarWorks ScholarWorks
Walden Dissertations and Doctoral Studies Walden Dissertations and Doctoral Studies Collection
2020
The Relationship Between Multifaceted Motivational Factors and The Relationship Between Multifaceted Motivational Factors and
Academic Achievement Academic Achievement
Sandra LuAnn Beasley Walden University
Follow this and additional works at: https://scholarworks.waldenu.edu/dissertations
Part of the Educational Psychology Commons, and the Social and Behavioral Sciences Commons
This Dissertation is brought to you for free and open access by the Walden Dissertations and Doctoral Studies Collection at ScholarWorks. It has been accepted for inclusion in Walden Dissertations and Doctoral Studies by an authorized administrator of ScholarWorks. For more information, please contact [email protected].

Walden University
College of Social and Behavioral Sciences
This is to certify that the doctoral dissertation by
Sandra Beasley
has been found to be complete and satisfactory in all respects,
and that any and all revisions required by
the review committee have been made.
Review Committee
Dr. Susana Verdinelli, Committee Chairperson, Psychology Faculty
Dr. John Meis, Committee Member, Psychology Faculty
Dr. Georita Frierson, University Reviewer, Psychology Faculty
Chief Academic Officer and Provost
Sue Subocz, Ph.D.
Walden University
2020

Abstract
The Relationship Between Multifaceted Motivational Factors and
Academic Achievement
by
Sandra LuAnn Beasley
MA, Walden University, 2010
BS, ASU: Barrett’s Honor College, 2003
Doctoral Study Submitted in Partial Fulfillment
of the Requirements for the Degree of
Doctor of Philosophy
Clinical Psychology
Walden University
May 2020

Abstract
The United States has yet to reach the White House’s 2020 goal of attaining the top
international ranking in college degree attainment among young adults. Researchers have
investigated the academic performance variables associated with timely degree
attainment for first-year college students. Prior research has indicated that poorly
motivated students are likely to struggle academically, experience academic stress, and
drop out of school. However, it remains unknown which types of motivation significantly
affect academic achievement. The purpose of this study was to better understand which
Reiss basic desires of motivation predict undergraduate academic achievement. An
additional purpose of this study was to determine which basic desires of motivation,
among gender and age groups, predict cumulative grade point average (GPA). Based on
Reiss’s theory, I used the Reiss School Motivation Profile (RSMP) to examine which of
the motivational factors predicted cumulative undergraduate GPA. Using a convenience
sampling method, I recruited 459 community college students to complete the online
surveys. The bivariate ordinal logistic regression results indicated a modest yet
significant relationship between 4 of the Reiss motivation factors (curiosity, order, status,
and vengeance) and cumulative GPA. The multivariate ordinal logistic regression results
indicated a modest yet significant relationship between 3 Reiss motivation factors (order,
vengeance, and physical exercise) and cumulative GPA, but not between gender, age, and
cumulative GPA. The results of this study may provide useful insights to academic
institutions administrators regarding how they can use motivational factors to identify
students who may need academic assistance.

The Relationship Between Multifaceted Motivational Factors and
Academic Achievement
by
Sandra LuAnn Beasley
MA, Walden University, 2010
BS, ASU: Barrett’s Honor College, 2003
Dissertation Submitted in Partial Fulfillment
of the Requirements for the Degree of
Doctor of Philosophy
Clinical Psychology
Walden University
May 2020

Dedication
I dedicate this dissertation to the late Dr. Steven Reiss, an eminent clinical
psychologist at Ohio State University and renowned researcher in the field of motivation
and education (McNally, 2017).

Acknowledgments
First, I am thankful to the late Dr. Steven Reiss and his wife, Dr. Maggi Reiss, for
allowing me to participate in the Reiss Motivation Profile (RMP) training course,
corresponding with me via email, and providing the necessary information and resources
to conduct this study.
Second, I want to express my deep appreciation to the community college
administrators, class instructors, and faculty who wholeheartedly supported my efforts to
conduct this dissertation study on campus.
I want to thank Dr. Susana Verdinelli, who unfailingly guided me, encouraged
me, and provided her professional expertise so that I could move forward in a timely
manner and complete this dissertation. Dr. Verdinelli, it was an honor and privilege to
have you as my dissertation chair.
I also want to thank my second committee member, Dr. Meis, for his professional
advice and expertise to help me shape this dissertation into a scholarly work.
I want to thank Dr. Elsie Jackson, Dr. Essam Mahmoud, and Mr. Rico Rivera for
their uplifting encouragement, professional guidance, and timely comments while in the
process of writing the key elements for each section of the dissertation.
I want to thank my family for their understanding and patience for my
inaccessibility while completing this dissertation. You are very special to me and dearly
loved.
Above all, I want to thank the Almighty Creator for hearing my prayers, opening
the path forward, and blessing my efforts to complete my educational journey.

i
Table of Contents
List of Tables .......................................................................................................................v
Chapter 1: Foundation of the Study and Literature Review ................................................1
Introduction ....................................................................................................................1
Background ....................................................................................................................2
Problem Statement .........................................................................................................4
Purpose Statement ..........................................................................................................5
Research Questions and Hypotheses .............................................................................6
Theoretical Framework for the Study ............................................................................8
Nature of the Study ......................................................................................................10
Definitions....................................................................................................................11
Assumptions .................................................................................................................11
Scope and Deliminations .............................................................................................12
Limitations ...................................................................................................................13
Significance..................................................................................................................15
Chapter Summary ........................................................................................................16
Chapter 2: Literature Review .............................................................................................17
Introduction ..................................................................................................................17
Literature Research Strategy ........................................................................................19
Predictors of College Completion ......................................................................... 20
Motivational Predictors of Academic Achievement ............................................. 20
ii
Theoretical Framework: Reiss Theory of 16 Desires ..................................................21
Six Motivation Reasons for Low Academic Achievement................................... 23
Literature Review: Predictors of College Completion.................................................25
Traditional and Nontraditional Factors ................................................................. 25
Summary ......................................................................................................................43
Chapter Summary ........................................................................................................45
Chapter 3: Research Methods ............................................................................................47
Introduction ..................................................................................................................47
Study Variables ..................................................................................................... 48
Time and Resource Constraints ............................................................................ 49
Study Design ......................................................................................................... 49
Summary ............................................................................................................... 51
Methodology ................................................................................................................52
Population ............................................................................................................. 52
Sampling Strategy and Procedures ....................................................................... 56
Recruitment ........................................................................................................... 61
Data Collection ..................................................................................................... 63
Instrumentation ..................................................................................................... 68
Operationalization ................................................................................................. 77
Data Analysis Plan ................................................................................................ 78
Summary ............................................................................................................... 87
iii
Threats to Validity .......................................................................................................88
Internal, External, and Statistical Conclusion Validity ......................................... 88
Ethical Procedures ................................................................................................ 89
Chapter Summary ........................................................................................................91
Chapter 4: Presentation of the Results and Findings .........................................................93
Introduction ..................................................................................................................93
Data Collection ............................................................................................................94
Timeframe and Actual Recruitment...................................................................... 94
Response Rates ..................................................................................................... 95
Participant Characteristics .................................................................................... 96
Adverse Events ..................................................................................................... 99
Results 100
Descriptive Statistics ........................................................................................... 100
Bivariate Ordinal Logistic Regression ................................................................ 104
Multivariate Ordinal Logistic Regression ........................................................... 116
Chapter Summary ......................................................................................................125
Chapter 5: Discussion, Conclusions, and Recommendations ..........................................128
Introduction ................................................................................................................128
Study Purpose ..................................................................................................... 128
Key Findings ....................................................................................................... 129
Interpretation of the Findings.....................................................................................130

iv
Small Effect of Motivation on Academic Achievement ..................................... 131
Small Effect of Reiss Motivation on Academic Achievement ........................... 132
Summary ............................................................................................................. 137
Limitations and Recommendations for Future Research ...........................................137
Validity ............................................................................................................... 138
Reliability ............................................................................................................ 138
Generalization ..................................................................................................... 140
Summary ............................................................................................................. 141
Implications................................................................................................................141
Positive Social Change ....................................................................................... 142
Summary ............................................................................................................. 143
Conclusions ................................................................................................................143
References ........................................................................................................................145
Appendix A 17-Item Demographic Questionnaire ..........................................................173
Appendix B Permission from RSMP Developer .............................................................177
Appendix C Study Flyer and Invitational Letter..............................................................178
Appendix D Consent Form ..............................................................................................179
Appendix E 10-Item Online Demographic Online Questionnaire ...................................182
Appendix F 17-Item Demographic Questionnaire ...........................................................185
Appendix G Two-Item Demographic Online Questionnaire ...........................................189
Appendix H Reiss School Motivation Profile Scores ......................................................190

v
List of Tables
Table 1. Effect Size as a Function of Statistical Test ....................................................... 60
Table 2. Item Analytics for 13 Reiss School Motivation Profile Scales .......................... 77
Table 3. Data Analysis Plan for Research Questions ....................................................... 78
Table 4. Number and Proportion of Sex at Birth Groups (N = 459) ................................. 96
Table 5. Number and Proportion of Age Groups (N = 459) ............................................. 97
Table 6. Number and Proportion of Ethnicity Groups (N = 459) ..................................... 98
Table 7. Contingency Table of Academic Class Standing by Academic Year at a Western
U.S. Community College (N = 459) ......................................................................... 99
Table 8. Frequency and Percentage Distribution of Cumulative GPA at a Western U.S.
Community College (N = 446) ............................................................................... 101
Table 9. Frequency and Percentage Distribution of Truncated Cumulative GPA at a
Western U.S. Community College (N = 446) ......................................................... 102
Table 10. Descriptive Statistics for 13 Reiss School Motivation Profile Scales ............ 104
Table 11. Test of Parallel Lines for 15 Bivariate Ordinal Logistic Regression Models . 106
Table 12. Results for Binary Logistic Regression Models for Tranquility on Binomial
Cumulative GPA Categories ................................................................................... 108
Table 13. Bivariate Ordinal Logistic Regression Model Coefficients ............................ 112
Table 14. Multicollinearity Assumption Test on Independent Variables ....................... 118
Table 15. Test of Parallel Lines for Multivariate Ordinal Logistic Regression Models . 118
Table 16. Bivariate and Multivariate Ordinal Logistic Regression Model Coefficients 121

vi
List of Figures
Figure 1. Composite scores of RSMP ............................................................................... 70
Figure 2. Academic achievement factors .......................................................................... 84

1
Chapter 1: Foundation of the Study and Literature Review
Introduction
In the field of educational psychology, researchers have found that motivation
strongly affects student academic achievement up to college degree completion (Slanger,
Berg, Fisk, & Hanson, 2015). Academic achievement refers to types of student grade
point average (GPA), namely cumulative GPA across 8 semesters (Slanger et al., 2015);
first-year GPA (Allen & Robbins, 2010); and first-year, first-semester GPA (Slanger et
al., 2015). Motivational factors found to affect academic achievement or membership in
academic achievement groups fall under three domains: (a) expectancies, (b) sources of
motivation, and (c) goal types. Expectancies include self-efficacy, or how students
perceive their academic performance (Krumrei-Mancuso, Newton, Kim, & Wilcox, 2013;
Richardson, Abraham, & Bond, 2012). Kinds of motivation can include intrinsic,
extrinsic, and amotivation (i.e., lack of motivation; Stover, Hoffmann, de la Iglesia, &
Liporace, 2014). Goal types refer to students’ grade goals (Richardson et al., 2012).
Based on previous research on academic achievement and motivation, the present study
addressed the educational issues of poorly motivated students who struggle academically,
experience academic stress, and are likely to drop out of school.
The introduction sections of Chapter 1 include a summary of the recent research
literature on college students’ academic achievement and student motivation. I provide
evidence of the decline of the United States’ international ranking in tertiary-type B (or
undergraduate) level of postsecondary degrees among young adults. Tertiary-type B level

2
of international education is equivalent to at least a 2-year associate degree with an
emphasis on practical, technical, or occupational skills for direct entry into the workforce
(OECD, 2016). I also describe a relevant, meaningful research gap related to the
influence of motivational beliefs on both high and low academic achievements. In
summary, in the introductory sections of this chapter, I review past research on the
academic achievement and student motivation factors that significantly affect students’
goals of attaining an undergraduate college degree.
Background
As well-known documented concepts in research literature, the conceptual
variables in the motivational domain (i.e., sources of motivation, expectancies, and goal
types) provide insight into probable reasons for the decline of the United States’
international ranking in undergraduate level of postsecondary degrees. Under the domain
sources of motivation, researchers have found that types of motivation—intrinsic,
extrinsic, and amotivation—significantly predict academic performance (Stover et al.,
2014). Under the domains expectancies and the classification of goal types, researchers
have found that the motivational variables of academic self-efficacy, performance self-
efficacy, and goal setting significantly predict student GPA scores (i.e., semester, course,
cumulative, tertiary) among undergraduate students across class standings (Krumrei-
Mancuso et al., 2013; Richardson et al., 2012). However, an area that appears to be
under-researched concerns the motivational factors that predict both low and high
collegiate academic performance (Campbell & Fuqua, 2008; Gershenfeld, Hood, & Zhan,
3
2015; Singh, 2014) within a theoretical framework that is goal-oriented and personality-
trait specific (Froiland, Mayor, & Herlevi, 2015; Richardson et al., 2012). Theoretical
personality traits include the following Big Five traits: extraversion, agreeableness,
conscientiousness, neuroticism, and openness to experience (Richardson et al., 2012).
Further work in the under-researched area related to the influence of motivation on
collegiate academic performance may provide important insights into why the United
States’ international ranking in postsecondary college degrees has fallen.
Reiss’s (2004, 2013) 16 basic desires theory is a theoretical framework that is
both goal-oriented and personality-trait specific. It is goal-oriented because the 16 basic
desires pertain to end-goal variables or goals desired “for their own sake” (Reiss, 2004, p.
179). The 16 basic desires are acceptance, curiosity, eating, family, honor, idealism,
independence, order, physical activity, power, romance, saving, social contact, status,
tranquility, and vengeance (Reiss, 2004). It is personality-trait specific because the 16
basic desires are significantly correlated with the Big Five Traits: openness,
conscientiousness, extroversion, agreeableness, and neuroticism (Olson, & Chapin,
2007). Because there appears to be a gap in the understanding of the multifaceted
motivational factors (within a goal-oriented personality theory) that relate to academic
achievement, I examined which motivational factors predict different levels of academic
performance (i.e., cumulative GPA) among community college students. Additional
learner characteristics of interest included both gender and age.
4
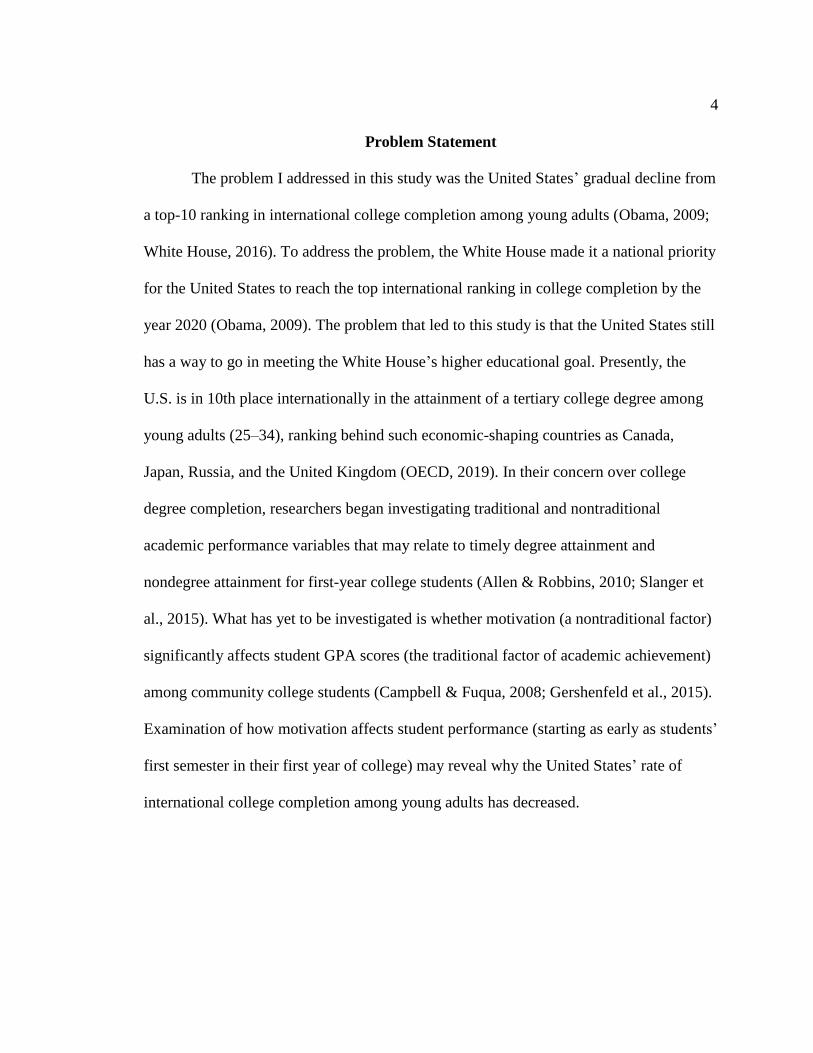
Problem Statement
The problem I addressed in this study was the United States’ gradual decline from
a top-10 ranking in international college completion among young adults (Obama, 2009;
White House, 2016). To address the problem, the White House made it a national priority
for the United States to reach the top international ranking in college completion by the
year 2020 (Obama, 2009). The problem that led to this study is that the United States still
has a way to go in meeting the White House’s higher educational goal. Presently, the
U.S. is in 10th place internationally in the attainment of a tertiary college degree among
young adults (25–34), ranking behind such economic-shaping countries as Canada,
Japan, Russia, and the United Kingdom (OECD, 2019). In their concern over college
degree completion, researchers began investigating traditional and nontraditional
academic performance variables that may relate to timely degree attainment and
nondegree attainment for first-year college students (Allen & Robbins, 2010; Slanger et
al., 2015). What has yet to be investigated is whether motivation (a nontraditional factor)
significantly affects student GPA scores (the traditional factor of academic achievement)
among community college students (Campbell & Fuqua, 2008; Gershenfeld et al., 2015).
Examination of how motivation affects student performance (starting as early as students’
first semester in their first year of college) may reveal why the United States’ rate of
international college completion among young adults has decreased.
5
Purpose Statement
The philosophical worldview on which I based the quantitative research design
and conclusions of my study was post-positivism. This type of worldview refers to an
independent, theory-driven reality in which all observations of reality are approximate,
never fully explained, and never absolute (Gray, 2014; Scotland, 2012). With the post-
positivism perspective in mind, the initial purpose of the study was to gain a better
understanding of whether motivational factors, gender, and age predicted membership in
either an academic probation group or an honors group. An additional purpose of the
study was to examine whether there were any differences in the motivational factors
associated with these two academic groups.
Due to the low number of participants in the first semester in which I conducted
the study, I revised the purpose of the study and the research questions. The revised
purpose of the study was to understand which motivational factors predict academic
achievement (i.e., cumulative GPA) among community college students. An additional
purpose was to determine which motivational factors, among gender and age groups,
predict undergraduate academic achievement. Overall, in my quantitative study, I
examined the association of cumulative GPA with 13 motivational factors, gender, and
age among community college students.

6
Research Questions and Hypotheses
I examined the revised purpose of the study with 15 research questions regarding
the association of Reiss basic desires of motivation with different levels of GPA, gender,
and age.
RQ 1: Does the RSMP factor of social contact predict different levels of GPA?
Ho1: The RSMP factor of social contact does not predict different levels of
GPA.
Ha2: The RSMP factor of social contact will predict different levels of GPA.
RQ 2: Does the RSMP factor of curiosity predict different levels of GPA?
Ho1: The RSMP factor of curiosity does not predict different levels of GPA.
Ha2: The RSMP factor of curiosity will predict different levels of GPA.
RQ 3: Does the RSMP factor of honor predict different levels of GPA?
Ho1: The RSMP factor of honor does not predict different levels of GPA.
Ha2: The RSMP factor of honor will predict different levels of GPA.
RQ 4: Does the RSMP factor of family predict different levels of GPA?
Ho1: The RSMP factor of family does not predict different levels of GPA.
Ha2: The RSMP factor of family will predict different levels of GPA.
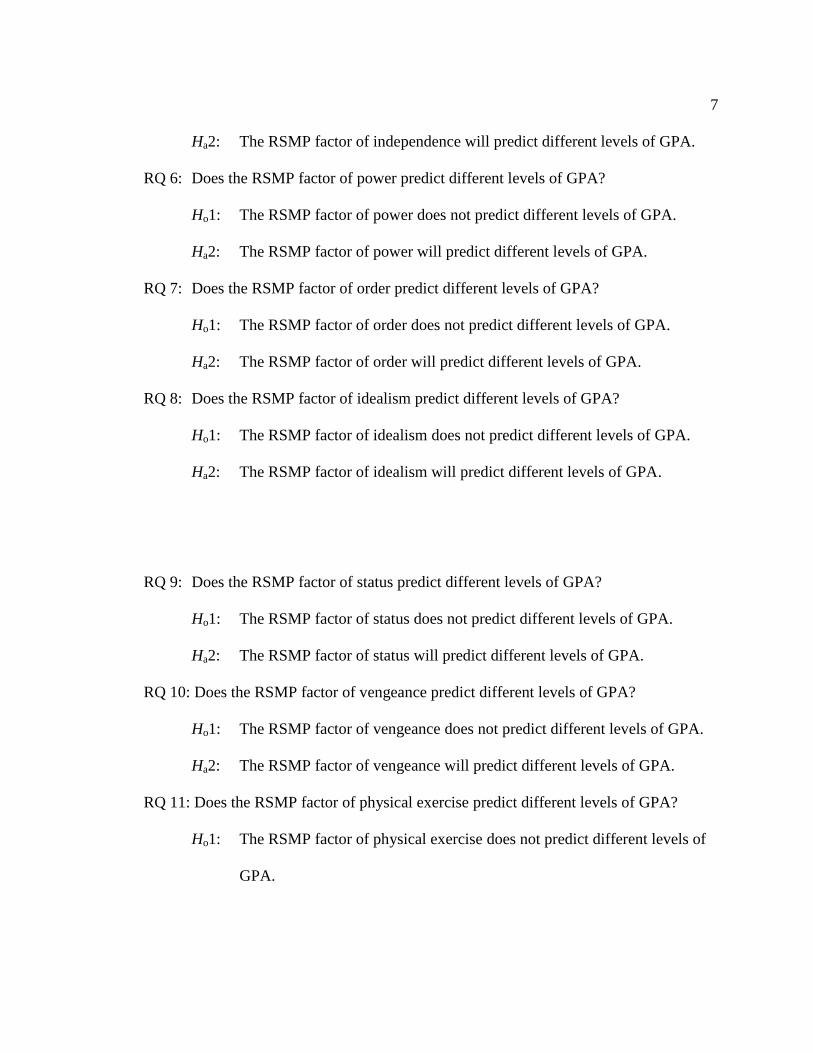
RQ 5: Does the RSMP factor of independence predict different levels of GPA?
Ho1: The RSMP factor of independence does not predict different levels of
GPA.
7
Ha2: The RSMP factor of independence will predict different levels of GPA.
RQ 6: Does the RSMP factor of power predict different levels of GPA?
Ho1: The RSMP factor of power does not predict different levels of GPA.
Ha2: The RSMP factor of power will predict different levels of GPA.
RQ 7: Does the RSMP factor of order predict different levels of GPA?
Ho1: The RSMP factor of order does not predict different levels of GPA.
Ha2: The RSMP factor of order will predict different levels of GPA.
RQ 8: Does the RSMP factor of idealism predict different levels of GPA?
Ho1: The RSMP factor of idealism does not predict different levels of GPA.
Ha2: The RSMP factor of idealism will predict different levels of GPA.
RQ 9: Does the RSMP factor of status predict different levels of GPA?
Ho1: The RSMP factor of status does not predict different levels of GPA.
Ha2: The RSMP factor of status will predict different levels of GPA.
RQ 10: Does the RSMP factor of vengeance predict different levels of GPA?
Ho1: The RSMP factor of vengeance does not predict different levels of GPA.
Ha2: The RSMP factor of vengeance will predict different levels of GPA.
RQ 11: Does the RSMP factor of physical exercise predict different levels of GPA?
Ho1: The RSMP factor of physical exercise does not predict different levels of
GPA.

8
Ha2: The RSMP factor of physical exercise will predict different levels of GPA.
RQ 12: Does the RSMP factor of acceptance predict different levels of GPA?
Ho1: The RSMP factor of acceptance does not predict different levels of GPA.
Ho2: The RSMP factor of acceptance will predict different levels of GPA.
RQ 13: Does the RSMP factor of tranquility predict different levels of GPA?
Ho1: The RSMP factor of tranquility does not predict different levels of GPA.
Ha2: The RSMP factor of tranquility will predict different levels of GPA.
RQ 14: Do the RSMP factors and gender predict different levels of GPA?
Ho1: The RSMP factors and gender does not predict different levels of GPA.
Ha2: The RSMP factors and gender will predict different levels of GPA.
RQ 15: Do the RSMP factors and age predict different levels of GPA?
Ho1: The RSMP factors and age does not predict different levels of GPA.
Ha2: The RSMP factors and age will predict different levels of GPA.
To test the first 13 null hypotheses, I performed bivariate ordinal logistic
regression, an inferential statistical technique, in SPSS. To test the 14th and 15th null
hypotheses, I preformed multivariate ordinal logistic regression analyses.
Theoretical Framework for the Study
Two related psychological theories guided my investigation of the impact of
motivation on academic achievement at the community college level of education. Reiss
(2004, 2013) empirically derived the first theory, the 16 basic desires of motivation, from
both explorative and confirmatory factor analytical studies of what a diverse sample of

9
individuals perceived as motivating them. Reiss (2004, 2013) proposed that the
theoretical constructs (i.e., basic desires of motivation) were innate, universal, and deeply
embedded in human nature and that they resulted in goal-orientated behaviors. Moreover,
the majority of the basic desires of motivation were positively associated with student
academic achievement (Reiss, 2009, 2013). The second theory includes six of the
motivational constructs noted in the 16 basic desires theory. Specifically, in the six
motivational reasons for low academic achievement theory, Reiss (2009) proposed that
poor scholastic performance was a result of students experiencing six high or low basic
desires of motivation. Reiss (2009) derived the theory from both factor analysis and
validity studies for each of the Reiss Motivation Profile (RMP) scales (Reiss, 2009). I
discuss these theories in more detail in Chapter 2.
Taking into account Reiss’s two interrelated theories on motivation, researchers
have further investigated which basic desires of motivation were significantly associated
with low or high academic achievement among students in secondary education (Froiland
et al et al., 2015; Kavanaugh & Reiss, 2003). Based on current research, there appears to
be no quantitative study that has examined which Reiss basic desires of motivation
predict academic achievement among undergraduate students (Cerasoli, Nicklin, & Ford,
2014). Therefore, I used both of Reiss’s motivational theories to guide my study
examining which motivational factors predict different levels of academic performance
(i.e., cumulative GPA) among community college students.

10
Nature of the Study
In the quantitative study, I used a cross-sectional survey design. In particular, I
collected student data using the Reiss School Motivation Profile (RSMP) to assess which
basic desires of motivation were significantly associated with academic performance (i.e.,
cumulative GPA) among community college students. The RSMP is a 104-item self-
report questionnaire that measures 13 basic desires of motivation and represents
motivational constructs of the 16 basic desires of motivation theory (IDS Publishing
Corporation, 2017; Reiss, 2013). I used a cross-sectional survey to collect data to make
inferences about community college students at one point in time (Sedgwick, 2014;
Tourangeau, 2015). Collected data included sociodemographic information related to
class standing, gender, age, race, ethnicity, and intellectual disabilities or mental health
impairments (Beaudoin & Kumar, 2012; Fernandez et al., 2016).
To analyze the research data, I used the International Business Machines (IBM,
2019) SPSS statistical software (standard version 25.0) for Windows. I performed
bivariate ordinal logistic regression in SPSS to examine whether RSMP factors, age, and
gender predict different levels of cumulative GPA, broken into five ordinal groups: (a)
less than 2.25, (b) 2.25–2.74, (c) 2.75–3.24, (d) 3.25–3.74, and (e) 3.75–4.00. I also
performed multivariate ordinal logistic regressions with proportional odds in SPSS to
determine the effect of (a) gender and the RSMP scales on cumulative GPA and (b) age
and the RSMP scales on cumulative GPA. The results of this study may provide
important insights for academic administrators regarding whether they can use
11
motivational factors to identify students who may need academic assistance or more
challenging work.
Definitions
Basic desires of motivation. Human strivings or desires (Havercamp & Reiss,
2003).
College student. Undergraduate students, of various ages, at a western U.S.
community college.
Cumulative GPA. Percentage of grade distribution per semester.
Tertiary education. International education programs equivalent to at least a
two-year associate degree with an emphasis on practical, technical, or occupational skills
for direct entry into the workforce (OECD, 2016).
Assumptions
There are four assumptions associated with my quantitative research study. First, I
assumed that the psychometric instrument I used to measure the motivational reasons for
students’ GPA scores reliably measured the constructs. Second, I assumed that student
respondents were honest about (a) their eligibility to participate in the study, (b) having
sufficient language skills to understand the survey questions, and (c) not having any
learning or intellectual disabilities that may affect the accuracy of the survey answers.
Third, for the purpose of increasing both the accuracy of analysis and the reliability of
study results, I assumed that the student participants candidly answered the survey
questions. Last, I assumed that I recruited a sample of the targeted population of students

12
(in accord with current institutional statistics), increasing the generalizability of the
research results to the targeted population.
Scope and Deliminations
There are two specific aspects of the research problem that I addressed in the
study. I examined which multifaceted motivational factors predicted cumulative GPA
among students enrolled at a community college. From a micro perspective, I focused on
this because there appears to be increasing interest among researchers to help
undergraduate students learn to manage the motivational drives that decrease the
liklihood of obtaining a college degree (Allen & Robbins, 2010; Mengel, 2014). From a
macro perspective, I chose this focus because college completion is a national
educational issue. Recent statistics have indicated a substantial decline in the United
States’ international ranking for students’ completion of at least an associate degree since
1990 (Fry, 2017; Nettles, 2017; OECD, 2016). Overall, the study addressed the issue of
internal validity between the specific aspects of the research problem (i.e., U.S. decline in
international college completion) and the rationale for the specific focus (i.e., to help
students manage motivational drives that decrease the liklihood of obtaining a college
degree).
I applied restrictive boundaries to the targeted population, the conceptual
framework of the study, and the potential generalizability of the findings.
The targeted population included community college students who were 18 years old or
older and were primarily registered in first-year courses. As to the conceptual framework

13
of the study, I excluded Ryan’s self-determination theory of motivation, even though it
relates to academic achievement because Ryan’s theory does not address genetic-based
factors of internal motivation, unlike Reiss’s (2004, 2013) 16 basic desires theory (Ryan
& Deci, 2000; Taylor et al., 2014). Types of genetic-based factors of internal motivation
included in Reiss’s theory are curiosity, fear, and power (Froiland et al., 2015; Reiss,
2012). As to the remaining restrictive boundary of the study (generalizability of the
findings), the study results do not generalize to all ages of undergraduate students
because I targeted the individual attributes specifically related to the adolescent and
young adult stages of psychosocial development (Erikson, 1968; Goguen, Hiester, &
Nordstrom, 2010; Matsushima & Ozaki, 2015). In other words, the survey responses and
study results primarily reflected the attributes, beliefs, and perceptions of young adults
registered in introductory academic courses. Together, these specific boundaries of the
study were necessary to assure the external validity of the study findings.
Limitations
Potential limitations to the study design, methodological weaknesses, and biases
that may influence study outcomes were the nature of self-report measures, confounding
variables, and statistical outliers. As to the study design, the procedures related to
answering questionnaire items may have threatened the internal validity of the study.
Such threats include respondents’ (a) misinterpretation of a questionnaire item
(comprehension stage), (b) lack of insight into their internal state of motivation (recall
stage), and (c) insensitivity to subtle changes in prior and present beliefs or behaviors
14
(integrate stage; Duckworth & Yeager, 2015). Potential threats to validity in the
remaining procedural stages included reference bias and acquiescence bias. The former
bias refers to respondents’ frame of reference or implicit standard of selection of a Likert
survey score (translate stage; Duckworth & Yeager, 2015). The latter bias (acquiescence
bias) refers to respondents’ inclination to agree with survey items regardless of actual
content (response stage; Duckworth & Yeager, 2015).
To assure more accurate and unbiased self-reporting, I used best data screening
practices. These practices included providing information about the RSMP survey;
explaining the Likert 7-point scale response scores; discussing how to answer
inapplicable questions; and encouraging the respondents to self-report a lack of energy,
attention, or thoughtfulness following the completion of the survey (DeSimone, Harms,
& DeSimone , 2015). Overall, by following these best data screening practices, I took
reasonable measures to address the study limitations related to research design and
associated biases.
As to the potential limitations in methodology weaknesses, I did not design the
study to control for confounding variables (beyond gender and age), nor did I use
extreme outlier values that could have influenced the research outcomes. I chose to
include gender and age as variables because prior research has indicated that both of
these variables predict GPA measures of academic achievement (Sangkapan & Laeheem,
2014; Tilahun, Gedefaw, & Asefa, 2015). Types of confounding variables that I did not
use included those that are both traditional (i.e., race, ethnicity, religion) and

15
nontraditional variables (i.e., employment status, current living situation). A
methodological weakness that may reflect error in the statistical analysis of student data
is the use of extreme outliers (Yens, Brannan, & Dumsha, 2014).
In consideration of these specific research design and methodology limitations, I
assured the internal validity of the research outcome by using ordinal regression analysis
to control for the two covariates (gender and age) while examining which basic desires of
motivation predict academic achievment (Pannucci & Wilkins, 2010). I also took
measures to eliminate any extreme outliers by visually inspecting the data for any errors
and statistically screening (i.e., graphing) for any extreme responses in the data
(DeSimone et al., 2015). Inclusively, by utilizing both of the measures, I took reasonable
actions to address the two methodlogical weaknesses of the study.
Significance
The results of this study may inform low-achieving community college students
on how best to manage particular behaviors and personality traits so that they can either
avoid too much satisfaction of weak motivational drives or seek more satisfaction of
strong life motivational drives, which put them at risk for completing an associate’s
degree (Allen, & Robbins, 2010; Mengel, 2014; Robbins, Oh, Le, & Button, 2009). For
example, underachieving students with lower than average motivational drive for order
could learn how to best to manage disorganized and careless behaviors and spontaneous
personality tendencies (Mengel, 2014; Reiss, 2013). Also, underachieving students with a
higher than average motivational drive for competition could learn how best to manage
16
defensive combative behaviors (Mengel, 2014; Reiss, 2013). Insights from this study may
also aid students and instructors in targeting effective strategies for improving the success
of probationary students whose motivational profiles negatively affect their GPA scores
(Reiss, 2013). Overall, the study results may help academic administrators to identify
which first-year community college students need extra assistance or more challenging
endeavors by using their motivation profiles as indicators of either low or high academic
achievement.
Chapter Summary
In review of Chapter 1, I introduced the Reiss motivation factors and how they
relate to the academic performance of undergraduate students. Additionally, I
summarized the major sections of Chapters 2 and 3 concerning (a) current research
literature on academic achievement and student motivation, (b) the research questions
and associated hypotheses, and (c) the research design and methodology. Furthermore, I
briefly reviewed the purpose, nature, significance, scope, delimitations, and limitations of
the study. In the next chapter, I provide an in-depth review of the empirical research on
academic achievement and student motivation.
17
Chapter 2: Literature Review
Introduction
As the United States competes for top international ranking of college graduates
by the year 2020, young adults’ achievement of successful academic outcomes in
postsecondary education is a national priority (Obama, 2009). This higher educational
goal is a national priority because one of the more valuable skills in a global economy is
the ability to sell knowledge with the prerequisite of a good education (American
Association of Collegiate Registers and Admission Officers [AACRAO], 2015; Obama,
2009). Hence, the United States’ low international college completion rate may
ultimately lead to a “prescription of economic decline” (Obama, 2009, Third Challenge
section). Despite the White House’s initial step to make college “more accessible,
affordable, and attainable” in 2013 (White House, 2016, October), the United States
slipped from 15th internationally in undergraduate postsecondary degrees among young
adults between the ages of 25 and 34 years (OECD, 2011) to 16th (OECD, 2015). Current
statistics indicate that the United States is in 10th place internationally in the attainment
of a tertiary (or postsecondary) college degree among young adults, behind such
economic-shaping countries as Canada, Japan, Russia, and the United Kingdom (OECD,
2019). Overall, the United States still has a way to go in meeting the White House’s
higher educational goal.

18
Researchers have investigated the traditional and nontraditional academic
performance variables associated with timely degree attainment and nondegree
attainment among first-year students in postsecondary education.
For example, researchers in the field of educational psychology have found that the
nontraditional factors of student motivation strongly influence first-semester student
success in the first year, as well as during eight subsequent semesters (a time period
equivalent to completion of a four-year undergraduate degree; Allen & Robbins, 2010;
Slanger et al., 2015). Additionally, they found that poorly motivated students are likely to
struggle academically (i.e., have a below-average first-semester GPA or cumulative
GPA), experience academic stress, and drop out of school before attaining a college
degree (Allen & Robbins, 2010; Slanger et al., 2015). However, it is currently unknown
whether motivation beliefs significantly influence high and low levels of academic
achievement among undergraduate students (Campbell & Fuqua, 2008; Gershenfeld et
al., 2015). The purpose of my dissertation was to understand which motivational factors
predicted academic performance (i.e., cumulative GPA) among community college
students. An additional purpose was to determine which of the motivational factors,
among gender and age groups, predicted cumulative GPA.
In this chapter, I review the empirical research on academic achievement and
student motivation. Researchers have discovered several predictors that significantly
affect students’ goals of attaining an undergraduate college degree. These predictors fall
under the following three categories: traditional and non-traditional, academic predictors,

19
and motivation. Traditional and non-traditional predictors include those associated with
demographics, college integration, finances, and work hours. Academic predictors
include those associated with GPA as early as the first semester of college. Motivation
predictors include those clustered into three sub-categorical motivational groups: (a)
attribution, optimism, pessimism, expectancies, and perceived control; (b) sources of
motivation; and (c) goal type. I also review the theoretical framework of this study,
which includes two empirically supported motivation theories related to the influence of
motivation on student academic achievement in higher educational institutions. Finally, I
bring attention to the issue in the field of clinical and educational psychology regarding
which motivational factors strongly associate with college GPA.
Literature Research Strategy
I used the following databases as literature review resources: ERIC, Google
Scholar, ProQuest Central Premier, PsycArticles, and SAGE Premier. I also used the
Online Walden University Library to collect further resources. I used the following
search terms, both alone and in combination: academic performance, college attainment,
college graduates, degree attainment, GPA, first-year GPA, first-semester GPA,
graduation, graduation GPA, honors program, motivation, motivational factors
predictors, and psychosocial factors. To find articles associated with the dissertation sub-
topics of academic achievement and student motivation, I used a combination of different
databases and combined terms as follows:

20
Predictors of College Completion
Traditional and nontraditional predictors.
o SAGE Premier: predictors and college degree.
Traditional academic predictor: academic achievement.
o ERIC and SAGE Premier: first-year GPA and college graduates; first-
semester GPA, graduation, and GPA; first-semester GPA, first-semester
GPA, graduation, and honors program; first-semester GPA, graduation,
and honors program.
Nontraditional academic predictor: motivation.
o PsycArticles and SAGE Premier: first-semester GPA, graduation, and
motivation; degree attainment, academic performance, and motivation.
Motivational Predictors of Academic Achievement
Motivation Factors.
o ERIC, Google Scholar, and ProQuest Central Premier: GPA, academic
performance, and motivational factors; first-semester GPA, GPA, and
psychosocial factors; first-semester GPA, GPA, and motivation; low
academic achievement, high academic achievement, and college students;
motivation, RMP, and learning.
The majority of the database searches involved a preset limit to research published since
2008. I did not search for older research articles unless researchers highlighted them in
their research studies.

21
Theoretical Framework: Reiss Theory of 16 Desires
Two theoretical frameworks for this study were Reiss’s (2004, 2013) theory of 16
basic desires and his “six motivation reasons for low academic achievement” theory
(Reiss, 2009). Reiss proposed in his theory of 16 basic desires that there are innate
motivational factors (commonly known as basic desires intrinsic motives, or
psychological needs) that are universal and deeply embedded in human nature (Reiss,
2004, 2013). These basic desires are acceptance, curiosity, eating, family, honor,
idealism, independence, order, physical activity, power, romance, saving, social contact,
status, tranquility, and vengeance (Reiss, 2004, 2013). According to a recent 40-year
comprehensive meta-analysis on motivation and performance (achievement-related
behavior), there appears to be no quantitative review of the impact of Reiss motivational
constructs (as mediators) on academic achievement at the undergraduate level of
education (Cerasoli et al., 2014).
Reiss (2013) proposed the theory of 16 basic desires as the “only taxonomy of
human needs [or motives]” empirically derived from both explorative and confirmatory
factor analysis studies of what a diverse sample of individuals perceived as motivating
them (p. 159). These analytical studies, executed in two peer-reviewed studies and one
doctoral study, investigated both a 15-factor model (Havercamp, 1998) and a 16-factor
model (Havercamp & Reiss, 2003; Reiss & Havercamp, 1998). The research criteria for
the factorial analysis studies were limited to a theoretical assumption of fundamental
motives—namely that they are universal end goals responsible for “psychologically

22
significant behavior” (Reiss & Havercamp, 1998, p. 98).
The resulting basic desire factors from the factor-analytical work became the 16
psychometric scales of a standard assessment tool, the RMP and its school version, the
RSMP. In description, the 16 basic desire factors are as follows:
• Acceptance: The desire for approval.
• Curiosity: The desire for cognition and understanding.
• Eating: The desire for food (not included in the RSMP school version).
• Family: The desire for family (e.g., raise a family or spend time with siblings);
• Honor: The desire for moral character.
• Idealism: The desire to improve society.
• Independence: The desire for self-reliance.
• Order: The desire for organization.
• Physical activity: The desire for muscle exercise.
• Power: The desire for influence or leadership.
• Romance: The desire for beauty and sex (not included in the RSMP school
version).
• Saving: The desire to collect (not included in the RSMP school version).
• Social contact: The desire for peer companionship.
• Status the desire: For respect based on social standing.
• Tranquility: The desire to be free of anxiety and pain.
• Vengeance: The desire to confront those who offend (Reiss, 2013).

23
Six Motivation Reasons for Low Academic Achievement
Based on a review of the peer-reviewed research literature on 16 basic desires
theory, Reiss proposed an additional theory: six motivation reasons for low academic
achievement (Reiss, 2009, p. 224). Reiss’s proposed that poor scholastic performance is a
result of students experiencing either a weak or a strong basic desire associated with
fundamental motive(s) as follows:
• Acceptance: High desire, fear of failure.
• Curiosity: Low desire, lack of need for cognition.
• Power: Low desire, lack of need for ambition.
• Honor: Low desire for or a lack of responsibility.
• Order: Low desire, lack of need to be organized, thoughtful, and careful.
• Vengeance: High desire for and predisposition toward confrontation (Reiss,
2009).
Reiss (2009) drew scientific evidence for the reliability of his additional theory
(six motivation reasons for low academic achievement) from prior factor analysis studies
and studies of the concurrent and criterion validity for each of the six RSMP scales that
represent the fundamental motives in the 16 basic desires theory. Concerning the validity
of the theoretical model, Reiss (2009, 2012) indicated that it is “anecdotal [rather] than
scientific” evidence (p. 220). More specifically, it is anecdotal in that school
psychologists used the school version of the RMP questionnaire (which includes the six
fundamental factor motives noted in the model) to identify the motivational reasons for

24
poor academic achievement in approximately 40 school settings nationwide, according to
2012 data (IDS Publishing Corporation, 2017; Reiss, 2009, 2012). The second principle
of the empirical theory of basic desires lends support to the model in which Reiss
proposed that the fundamental motives have two characteristics: what is desired and how
much is typically desired (Reiss, 2013). The primary reason Reiss (2009) established the
theoretical model was to stimulate new empirical research on “motivation in schools” (p.
2).
Use of Reiss theory in previous studies. Taking into account Reiss’s two
interrelated theories on motivation, researchers further investigated which of the 13
motivation factors were significantly associated with academic achievement among
students in their secondary level of education (Froiland et al., 2015; Kavanaugh, & Reiss,
2003). Academic achievement referred to various student GPA levels: above-average,
average, and below-average (Froiland et al., 2015). Researchers use the standardized self-
report assessment tool, the RSMP (Reiss, 2013), to identify the factors of the basic
desires of school motivation as perceived by the students.
Among the research results, Froiland et al. (2015) found that the basic desire of
intellectual curiosity was significantly associated with academic achievement.
Furthermore, the authors found an indirect relationship between physical activity and
intellectual curiosity that was significantly associated with academic achievement. The
latter result indicated that both a strong desire for intellectual curiosity and a weak desire
for physical activity were significantly associated with above-average academic

25
achievement. Conversely, both a low need for intellectual curiosity and a high need for
physical activity were significantly associated with below-average academic
achievement. Suggestions for further study included further examination of the
association between the basic desires of motivation and academic achievement (Froiland
et al., 2015).
Both of Reiss’ two motivational theories (16 basic desires theory and six
motivation reasons for low academic achievement) were useful in explaining the results
of the present study. This study addressed which of the 13 basic desires of motivation
predict undergraduate academic achievement. Furthermore, the predicted results
addressed which of the basic desires of motivation, among gender and age groups, predict
cumulative GPA.
Literature Review: Predictors of College Completion
The type of traditional and nontraditional factors associated with college
completion include demographic information, enrollment status, grade scores, academic
and social integration, remedial education, and academic motivation. The next
subsections will review these areas in more detail.
Traditional and Nontraditional Factors
To address the yearly decline in the United States’ international ranking in
undergraduate level degrees, researchers have investigated the traditional and non-
traditional academic performance variables associated with timely degree attainment and
non-degree attainment among first-year students (Obama, 2009; OECD, 2011, 2015;

26
Slanger et al., 2015; Obama, 2009; OECD, 2011, 2015; Slanger et al., 2015). For
example, Attewell, Heil, and Reisel (2011) assessed the how attainment of an
undergraduate college degree related to both traditional and non-traditional academic
performance variables, guided by Tinto’s (1975) integrative model of institutional
departure at both two-year and four-year academic institutions (i.e., community colleges,
universities). Tinto proposed that the academic integration (academic performance) and
social integration (i.e., extracurricular activities, peer-group interactions) of first-year
college students was positively related to college completion. Though Tinto proposed the
integrative model over 30 years ago, in a literature review of dominant theoretical
assumptions on non-completion in the last four decades, Melguizo (2011) found Tinto’s
(1975, 2015) model to be a common theory used to explain the longitudinal process of
college incompletion. The independent academic performance variables in Attewell et
al.’s (2011) study included the following:
Traditional variables.
1. Race, ethnicity, and gender.
2. Parent’s socioeconomic status: Income, net worth, and highest college degree.
3. Preparation: High school classes, high school GPA, and SAT scores.
4. First-year financial aid: Federal work study, Pell grants, federal loans, other
forms of aid.
5. Academic and social integration: Student meetings with faculty outside class
and student participation in study groups, sports, clubs, and events with
27
college peers.
6. First-year remediation: Math, reading, and language.
Nontraditional variables.
1. First-year work hours: Part-time, full-time, and non-traditional status: college
part time; delayed enrollment; and non-traditional composite (independent,
single parent, married, married with dependents.
The results of the Attewell et al.’s (2011) study showed a direct association
between the traditional and non-traditional academic performance variables and the
attainment (or non-attainment) of an undergraduate college degree. Given these results,
the meta-analysis justified the rationale for addressing both traditional and non-traditional
academic predictors in the dissertation. That is, both academic performance variables
predicted the “greatest numerical potential” for improving the yearly decline in the
United States’ international ranking in undergraduate college degree completion at both
community colleges and four-year academic institutions (Attewell et al., 2011, p. 554).
Academic achievement. In addition to investigating the traditional and non-
traditional academic achievement variables associated with timely degree attainment and
non-degree college degree attainment among undergraduate students, researchers have
explored whether the traditional academic performance variable first-year GPA affects
timely undergraduate degree attainment and non-degree undergraduate attainment.
Gayles (2012) examined institutional student data on whether first-year GPA strongly
predicted both the continuous dependent variable cumulative GPA and the dependent

28
variables of general undergraduate college completion and honors undergraduate college
completion. The sample population included full-time university students (N = 8,743)
enrolled as first-year students in the fall of 1998. In addition to Gayles’s study, other
researchers have examined whether one of the earliest measures of academic
performance—first-year, first-semester GPA—predicted undergraduate college
completion (general graduation, honors graduation, and non-graduation).
Raju and Schumacker (2015) and Campbell and Fuqua (2008) examined
institutional student data to determine which first-year traditional and non-traditional
variables affect completion of an undergraduate degree. The sample population in Raju
and Schumacker’s (2015) study was full-time students (N = 22,099) enrolled as first-year
students in the fall of 1995. Included among the post-college independent variables was
first-semester GPA. The sample population in Campbell and Fuqua’s (2008) study was
first-year university students (N = 336) enrolled in an honors program. Categorical
factors of the dependent variable college completion included the following three
comparison groups (award groups): (a) completers (students who completed the honors
degree program, N = 62); (b) partial completers (students who completed the general
honors award versus the degree honors program, N = 73); and (c) non-completers
(students who completed no honors awards). Included among the post-college
independent variables was first-semester GPA. The latter referred to students’ average
first-semester GPA at the targeted time of honors graduation (fall of 2000). Together, the

29
researchers examined the first-year traditional academic factors that significantly predict
college completion of an undergraduate degree.
Gayles (2012) found that first-year GPA predicted undergraduate academic
performance (general graduation and honors graduation) across a diverse sample
population of university first-year students. Specifically, the results indicated that first-
year GPA explained more than 50% to 65% of the variation in cumulative GPA among
the diverse sample group of students. Both Raju and Schumacker (2015) and Campbell
and Fuqua (2008) found that academic achievement (operationalized as first-year, first-
semester GPA) predicted undergraduate college completion for a diverse sample
population of first-year students. Specifically, Raju and Schumacker (2015) found that,
among the general sample of students who did not graduate (N = 7,293), 39% (N = 2,845)
had a freshman, first-semester GPA of less than 2.25. On the other hand, Campbell and
Fuqua (2008) found that, when comparing the first-semester GPA averages of three
undergraduate degree-seeking groups of honor students (completers, partial completers,
and non-completers), the non-completer group had significantly lower first-year, first-
semester GPA (3.34) than the other two groups: 3.77 for partial completers and 3.84 for
completers.
Taken together, the quantitative studies by Gayles (2012), Raju and Schumacker
(2015), and Campbell and Fuqua (2008) suggest that first-year students who do not
perform well academically (i.e., have a low GPA) are more likely to not complete an
undergraduate degree program. These studies also provide a rationale for addressing the

30
traditional academic achievement predictor, freshmen, first-semester GPA, as one of the
dissertation topics of interest as this variable was found to be a significant predictor of
potential student drop outs among two contrasting groups of students (honor students and
at-risk students) prior to graduation. Because the research findings suggested academic
achievement predicted college completion, future investigation (in accord with the
dissertation research questions) remained on what whether motivation plays a significant
role in academic achievement up to the time of college completion (Campbell & Fuqua,
2008; Gershenfeld et al., 2015).
Motivation. Along with research investigations on the effect of the traditional
academic performance variable, GPA, on both completion and non-completion of an
undergraduate degree, researchers have investigated whether the non-traditional
academic variable of academic motivation affects completion and non-completion of an
undergraduate college degree (Allen & Robbins, 2010; Slanger et al et al., 2015). Allen
and Robbins (2010) investigated whether academic motivation directly affected timely
undergraduate degree attainment among a diverse group of college students across 15
four-year (N= 3,072) and 13 two-year (N = 788) postsecondary institutions. The
academic motivational factor of academic discipline refered to the students’ perceptions
on doing academic tasks and the degree they perceived themselves as both hardworking
and conscientious. Timely degree attainment referred to earning either an associate
degree (or completion of a certificate program) at a two-year college or community
college or a bachelor’s degree at a four-year college or university. First-year academic

31
performance referred to first-year cumulative GPA.
Slanger et al. (2015) investigated whether there was an association between
academic motivation, academic success, and student retention over eight semesters (a
period of time equivalent to a six-year bachelor’s college degree) and cumulative course-
load capacity. The sample population comprised of 10 cohorts (2002–2011) of students
(N = 6,043) across different circumstances from one Midwestern university. Student
circumstances included those who shared a particular experience together within a
particular time span particularly. Circumstances included summer orientation (2002),
mandatory freshmen orientation one credit course (2003), enrollment in selected
academic colleges (2004–2010), enrollment of college athletes, and conditional admits
(2007–2010). Cumulative course load, which referred to the division of number of credits
earned over the number of graded classes, indicated students’ capability to be successful
in navigating a full course load. For instance, students with a poor or high GPA taking 3
credit hour courses is qualitatively different than students who earned a poor or high GPA
taking 1 credit hour courses. The motivational constructs and associated factors in
Slanger et al.’s study included the following:
• Academic motivation: Study habits, intellectual interests, verbal and writing
confidence, math and science confidence, desire to finish college, and attitude
towards college.
• General coping ability: Sociability, family emotional support, opinion
tolerance, career closure, and sense of financial security.

32
• Receptivity to support services: Career counseling, financial counseling,
academic assistance, and social enrichment.
In addition to examining whether motivation predicted college academic performance,
Slanger et al. combined the variable factors of motivation into four compound variables
to examine whether motivation predicted cumulative GPA over eight semesters. The
definitions of the combined factors were as follows:
• Dropout proneness: Students’ overall inclination to drop out college prior to
completing their degree.
• Predicted academic difficulty: Which students were most likely to have a low
GPA after their first semester in college.
• Educational stress: Students’ overall college experience of stress.
• Receptivity of institutional help: How responsive students’ were likely to be
toward intervention via college support services (personal counseling and
academic assistance; Noel-Levitz, 2011; Slanger et al., 2015).
Among the study results, Allen and Robbins (2010) found that academic
motivation appeared to affect timely degree completion at a two-year college or
community college (β = 0.082, p < .05) or a bachelor’s degree at a four-year college or
university (β = 0.218, p < .01), as a result of its indirect effect on first-year academic
performance. On the other hand, Slanger et al. (2015) found that motivational factors of
academic motivation, general coping, and receptivity to support services strongly
influenced both the earliest indication of academic achievement (first-year, first-semester

33
GPA) and ongoing academic performance (cumulative GPA) across eight semesters (a
time period equivalent to the completion of a bachelor’s degree). More specifically, the
authors found that motivation predicted first-year, first-semester GPA and cumulative
GPA across eight semesters using 25% (a quartile) of the predicted 2009 first-semester
GPAs (using 2003 cohort data), in comparison to the quartile of actual 2009 first-year,
first-semester GPA. Slanger et al. selected the 2003 cohort data (out of the 10 cohort
groups) for predicting 2009 GPAs because it was the largest data set and had the best
assessment consistency in a mandatory first-year college skills course. In addition, 33%
(a tertile) of the 2009 predicted course-load capacity results were consistent in relation to
the actual 2009 tertile course-load capacity results as follows:
Quartile cohort data.
1. Motivational factors found to predict 2009 first-semester GPA (using 2003
cohort data) were similar to the actual effect of the motivational factors on
2009 first-semester GPA.
2. Motivational factors found to predict 2009 second-semester GPAs were
similar to the actual effect of the motivation factors on 2009 second-semester
GPAs.
Tertile cohort data.
1. Predicted first semester 2009 load capacity was similar to actual first semester
2009 load capacity.
34
2. Predicted second semester 2009 load capacity was similar to actual first
semester 2009 load capacity.
Both of Allen and Robbins (2010) and Slanger et al.’s (2015) quantitative studies
indicated that poorly motivated students likely (a) struggled academically (i.e., had a
below-average first-semester GPA and below-average cumulative GPA), (b) experienced
academic stress, and (c) were inclined to drop out of school prior to a timely attainment
of an undergraduate college degree. In light of the indirect effect of motivation (via
student GPA) on college completion, researchers focused on motivational predictors as
points of intervention for improving academic achievement up to the time of college
completion (Krumrei-Mancuso et al., 2013).
Motivational predictors of academic achievement. Among the motivational
predictors examined for interventions to improve academic achievement up to the time of
college completion were students’ perceptions of academic and performance capabilities.
In a 13-year meta-analysis (1997–2010), Richardson et al. (2012) explored the
motivational group factors correlated with student GPA. Research studies (N = 315) were
extracted from two databases: PsycINFO and the Web of Knowledge. The definition of
undergraduate academic performance, in terms of tertiary (university) GPA, included
both cumulative GPA and course GPA.
The three motivational groups, along with the description of their factors, were as
follows:
1. Attributions, optimism, pessimism, expectancies, and perceived control:

35
a. Locus of control: Perception of control over life occurrences and ending
results.
b. Pessimistic attributional style: Perception of control over negative life
occurrences and ending results.
c. Optimism: General viewpoint that good things will occur.
d. Academic self-efficacy: Perception of academic ability, academic control,
and academic self-concept.
e. Performance self-efficacy: Perception of performance ability.
2. Source of motivation:
a. Self-esteem: Perception of self-worth (i.e., self like, good qualities).
b. Academic intrinsic motivation: Satisfaction of academic intrinsic learning
(i.e., self-interest in the experience).
c. Academic extrinsic motivation: Acquisition of knowledge and
engagement in academic tasks for instrumental purposes (to satisfy others
or receive an award or reward).
3. Goal type:
a. Learning goal orientation: Disposition toward the development or
demonstration of ability in achievement situations: knowledge, mastery,
and skills (i.e., learning as much as possible or selecting challenging
course material that promotes learning).

36
b. Performance goal orientation: Achievement endeavors to show
competence comparative to others (i.e., thoughts of outperforming
classmates or doing well in class to show academic capability to others).
c. Avoidance goal type: Avoidance of learned tasks that may demonstrate
inabilities or under-achievement (i.e., motivation to achieve due to the fear
of under-performing).
d. Grade goal: Self-allocation of nominal goal standards (i.e., on a scale from
0% to 100%, the smallest percentage grade goal student would be satisfied
with).
The results from Richardson et al.’s (2012) long-term meta-analysis indicated
that, from the three motivational groups, three factors significantly correlated with
tertiary GPA. More specially, grade goal (self-assigned minimum standards), academic
self-efficacy (general perceptions of academic ability), and performance self-efficacy
(efforts to demonstrate competency) significantly predicted cumulative GPA and course
GPA for a diverse population of undergraduate students, including first-year through
fourth-year students.
In addition to Richardson et al.’s (2012) long-term meta-analysis, researchers
have examined the effect of student motivation on first-year academic achievement
among a sample population of first-year students in both two-year and four-year
academic institutions. As previously mentioned, Allen and Robbins (2010) investigated
whether the motivational variable of self-discipline directly affected timely degree
37
attainment or indirectly affected timely degree attainment (via first-year GPA) for a
diverse group of college students across both two-year (i.e., community college) and
four-year (i.e., university) educational institutions. As previously mentioned, the
construct of self-discipline referred to students’ perceptions of the effort they put into
academic tasks, their conscientiousness, and how hardworking they were. This definition
of self-discipline fits the description of the motivational construct performance self-
efficacy (motivational predictor of tertiary GPA) in Richardson et al.’s (2012) meta-
analysis. The definition of performance self-efficacy included students’ “perception of
academic performance” in the areas of scholastic skills and their scholastic abilities
(Richardson et al., 2012, p. 356).
Further expanding on the effect of student motivation on academic achievement,
Krumrei-Mancuso et al. (2013) investigated whether the psychosocial variable of
academic self-efficacy strongly influenced both the earliest measure of academic
performance (freshmen, first-semester GPA) and the latter form of academic performance
(end of the first-year GPA). Krumrei-Mancuso et al. defined academic self-efficacy as
students’ degree of confidence in their academic abilities (GPA), awareness of their study
efforts (hardworking, conscientious), and expectation of academic success (i.e.,
completing college). This independent variable also fits the description of the
motivational construct academic self-efficacy (a resulting motivational predictor of
tertiary GPA) in Richardson et al.’s (2012) meta-analysis. The description of academic
self-efficacy was a “general perception of academic capability” in the areas of self-

38
confidence, academic self-concept, and academic control (Richardson et al., 2012, p.
353).
The results of Allen and Robbins’ (2010) and Krumrei-Mancuso et al.’s (2013)
empirical studies aligned with those of the meta-analysis by Richardson et al. (2012)
because their results indicated that student motivation significantly affected first-year
academic achievement. Allen and Robbins (2010) found that the motivational construct
self-discipline strongly predicted cumulative first-year GPA. Expanding on this result,
Krumrei-Mancuso et al. (2013) found that the psychosocial (or motivational) variable
academic self-efficacy strongly influenced freshmen, first-semester GPA and end-of-the-
first-year GPA. Overall, Richardson et al. (2012), Krumrei-Mancuso et al. (2013), and
Allen and Robbins (2010), suggested that the motivational factors of general perceptions
of academic ability and academic performance significantly predicted freshmen, first-
semester GPA and undergraduate college completion in a diverse sample of students.
Sources of motivation. In addition to examining the motivational factors that
predict student first-year GPA as early as the first semester of college, researchers have
examined the motivational factors that predict group membership in above-average or
below-average academic performance groups (Stover et al., 2014). Academic
performance refers to student GPA. Furthermore, researchers have examined the
differences in motivational factors associated with group membership in both above-
average and below-average academic performances. The control group was students with
average academic performance (Singh, 2014).

39
Stover et al. (2014) examined the role of self-determined motivation on
membership in both high and low academic performance groups. The sample population
was undergraduate students from Buenos Aires University in Buenos Aires, Argentina.
Based on Argentina’s universal tertiary grading scale, achievement groups ranged from 0
to 10, with 4 as the minimum passing grade (Foreign Credits Inc., 2012; Glave, 2013).
The percentage ranges of the grading numbers corresponded to the following letter
grades: (a) high-achievement numbers between 8.0 and 10.00 (A- to A+; 25%), (b)
average-achievement numbers between 4.00 and 8.99 (50%), and (c) low-achievement
numbers between 0.00 and 3.99 (F; 75%; Foreign Credits Inc., 2012; Glave, 2013).
Self-determined motivation, in accordance with Ryan and Deci’s (2000) self-
determination theory, referred to an energy source and direction in behaviors expressed
through a continuum of increased self-determination with three core positions reflecting
the degree of autonomic behavior: amotivation, extrinsic motivation, and intrinsic
motivation. Stover et al. (2014) built upon the self-determination theory by hypothesizing
that motivational behavior would indirectly influence academic achievement through the
use of learning strategies. The definitions of the motivational variables and associated
factors were as follows:
Intrinsic motivation (IM). Performing an activity for the innate satisfaction
derived from the activity itself (Ryan & Deci, 2000).

40
1. IM orientation towards stimulating experiences: Performing an activity for the
innate satisfaction derived from stimulating experiences (aesthetics,
intellectual, and sensorial).
2. IM orientation towards knowledge: Performing an activity for the innate
satisfaction derived from the pleasure of learning.
3. IM orientation towards achievement (Ima): Performing an activity for the
innate satisfaction derived from overcoming personal limitations and
accomplishing goals, pursuits, or difficult activities.
Extrinsic motivation (EM). Performing an activity for the purpose of attaining
some separable outcome.
1. EM identified regulation (EMidr): Performing an activity for extrinsic
motives, including those related to societal values, entering the labor market,
and improvement of abilities.
2. EM interjected regulation (EMintr): Performing activity to improve self-
esteem or to avoid anxiety and guilt in such areas as not being successful, not
achieving desired results, or not meeting family expectations.
3. EM external regulation (EMer): Performing activity to avoid punishments or
to obtain rewards.
Amotivation. Discerning a lack of control over events, lack of ability, and
absence of pursuit.

41
1. Organization and planning: Organizing, concentrating, and time managing
academic activities.
2. Abilities to prepare exams: Valuing the use of test strategies, knowledge of
instructions, and anticipates test contents.
3. Motivation: Persevering and dedicating energy towards studies.
4. Resources for learning: Contemplating the use of graphic tables, conceptual
maps, highlighting, and underlining.
5. Control and consolidation strategies (CCE): Revising academic materials and
contents.
6. Abilities to rank information (ARI): Selecting the key information to learn.
(Stover et al., 2014).
In comparison to Stover et al.’s (2014) research study, Singh (2014) examined the
differences in the motivational factors associated with membership in above-average or
below-average academic performances using students with average academic
performance as the control group. The sample population included graduate students
from Punjabi University in Punjab, India. The researchers determined membership in the
achievement groups based on academic “percentage marks” (i.e., the number of points
attained at the end of academic course work; Punjabi University, 2015, p. 2). The ranges
of the percentage marks (m) equated to the following letter grades: (a) above-average
ranges of m between 75 and 90 were A to A+, (b) average ranges of m between 25 and 75
were C to B+, and (c) below-average ranges of m less than 25 were D (Punjabi

42
University, 2015). The motivational beliefs’ components and associated constructs, as
measured by the Motivational Strategies for Learning Questionnaire (MSLQ; Pintrich,
Smith, Garcia, & McKeachie, 1991), were as follows:
1. Value
a. IM: Internal forces that influence student performance.
b. EM: Outside rewards and punishment that influence a student’s academic
achievement.
c. Task value: Importance of tasks or activities.
2. Expectancy
a. Control of learning beliefs: A student’s beliefs and effort to learn.
b. Self-efficacy: Beliefs that assist a student organize and execute a specific
action that produces a given attainment.
3. Affective
a. Test anxiety: A student’s worry about taking tests (Singh, 2014).
Both Stover et al. (2014) and Singh (2014) found significant differences between
the academic achievement groups in relation to motivation. Stover et al. (2014) found
that self-determined motivation significantly predicted academic performance through
three of the four learning strategy factors: learning and planning, motivation, and
resources for learning. Singh (2014) found that there was a significant difference between
high and average achievement groups on the motivational beliefs of task value and

43
control of learning beliefs. Singh also found that there was a significant difference in task
value between the average and high achievers groups.
The results of Singh’s (2014) study, though significant, were more likely
inaccurate, according to Nausheen’s (2016) recent cross-cultural exploratory analysis of
the MSLQ motivation scales in another sample of undergraduate students from Punjabi
University in Punjab, India. Because the Pakistani students’ conceptions of their
motivations to learn is different to those of U.S. students, Nausheen (2016) significantly
modified (by deleting factor items) the factor structure of the MSLQ motivational scales
with an acceptable Cronbach alpha measurement of internal consistency. Nausheen
suggested that future research was necessary to further develop and carefully adapt the
MSLQ for use in the context of Pakistani higher education and in other Eastern cultures.
Overall, the studies by Stover et al. (2014) and Singh (2014) suggested that the degree to
which students designed, organized, adjusted, and persevered in a schedule and the
degree to which they anticipated possible evaluations determined their membership in
high or low academic performance groups.
Summary
The review of the literature on both the traditional factors of student academic
achievement and the nontraditional variables strongly associated with academic
achievement provided insight into probable reasons for the yearly decline in the United
States’ international ranking in undergraduate college degrees. Campbell and Fuqua
(2008) and Gershenfeld et al. (2015) found that the traditional factor of academic
44
achievement (freshmen, first-semester GPA) was significantly associated with timely
degree attainment within a six-year period. Allen and Robbins (2010) and Slanger et al.
(2015) found that the nontraditional factors of motivation had a strong effect on timely
degree attainment via first-year GPA or freshmen, first-semester GPA. The motivational
factors included those associated with academic self-discipline, academic motivation,
general coping ability, and receptivity to support services. In addition, Slanger et al.
(2015) found that the compounding factors of student motivation (namely academic
difficulties and dropout proneness) played a significant role in student retention over a
period of eight semesters.
Researchers have investigated types of motivational predictors as points of
intervention for improving academic achievement up to the time of college completion,
which fall under three classifications of motivation (Froiland et al., 2015; Krumrei-
Mancuso et al., 2013; Richardson et al., 2012; Singh, 2014; Stover et al., 2014). The
motivational classifications are as follows: (a) attribution, optimism, pessimism,
expectancies, and perceived control; (b) sources of motivation; and (c) goal types
(Krumrei-Mancuso et al., 2013; Richardson et al., 2012). Under the subclassification of
expectancies and the classification of goal types, Richardson et al. (2012) and Krumrei-
Mancuso et al. (2013) found that multiple motivational factors—academic self-efficacy,
performance self-efficacy, and goal setting—significantly predicted student GPA scores
(i.e., tertiary, course, cumulative, semester) among a diverse population of undergraduate
college students: first-year through fourth-year students.
45
Under the remaining classification of motivation, sources of motivation, Stover et
al. (2014), in his study on the role of self-determined motivation on membership in both
high and low academic performances, found that three types of motivation (innate,
external, and amotivation) significantly predicted academic performance through three
learning strategy factors. These factors were learning and planning, motivation (i.e.,
persevering and dedicating energy towards studies), and resources for learning. In other
words, Stover suggested that the degree to which students designed, organized, adjusted,
and persevered in a schedule and the degree to which they anticipated possible
evaluations determined their membership in high or low academic performance groups.
Chapter Summary
Given the recent empirical research on academic achievement and student
motivation on a diverse population of undergraduate students, research scholars have
suggested further investigation into the following under-researched areas:
• The motivational factors that affect first-semester, below-average academic
achievement among students noted as in the “at-risk zone” of student performance
(Gershenfeld et al., 2015, p. 17).
• The motivational factors that affect first semester above-average academic
achievement among honor students (Campbell & Fuqua, 2008).
• Whether undergraduate honor students and undergraduate students on academic
probation differ in their motivation beliefs found to be significantly associated
with their academic performance (Singh, 2014).

46
Overall, there appears to be a gap in the literature related to the motivational
factors that predict academic achievement. Froiland et al. (2015) and Richardson et al.
(2012) suggested that future research on the predictors of academic achievement should
include a range of previously tested cross-domain predictors within a theoretical
framework that is goal-oriented and personality-trait specific. One of these theoretical
frameworks is Reiss’ theory of the 16 basic desires of motivation (Froiland et al., 2015).
Cross-domain predictors include those associated with academic motivation under the
domains of expectancies, sources of motivation, and goal types. This dissertation
investigated whether there were significant relationships between the RSMP factor scales
(within the theoretical framework of Reiss’s theory) and cumulative GPA. An additional
purpose was to determine the differences in motivational factors across gender and age
groups. In the next chapter, I describe the methodology used to answer the research
questions.

47
Chapter 3: Research Methods
Introduction
The purpose of the present quantitative study was to understand which
motivational factors predict academic performance (i.e., cumulative GPA) among
students enrolled at a community college in the western United States. An additional
purpose was to determine which of the motivational factors, among gender and age
groups, predicted cumulative GPA. Major sections of this chapter cover research design
and rationale, methodology, threats to validity, ethical procedures, and chapter summary.
In the Research Design section, I provide a rationale for my selection of a quantitative,
cross-sectional survey design. In the Methods section, I describe the convenience
sampling technique used to increase the net of eligible participants in a relatively
expedient and inexpensive manner. I also describe how I determined the projected sample
size to compare with the actual sample size. Furthermore, I discuss and clarify why I
selected the RSMP as the preferred independent measure of motivation. To protect the
community college’s identity (per IRB agreement), I did not use references when I
reviewed prior institutional school data.
In the Analysis of Data section, I explain why I chose an ordinal logistic
regression model to determine which of the independent variables best predicted the
dependent variables scores. In the Threats to Validity section, I review the steps taken to
avoid possible threats to the statistical results, including the reliability and validity of the
test instrument, sampling procedures, and inclusion and accountability of the research

48
question variables. Finally, in the Ethical Procedures section, I review how administrative
and faculty members from the community college under study assisted in the recruitment
of student participants. I also discuss the treatment of study participants and data.
Study Variables
The independent variables in the current study were Reiss motivational factors,
age, and gender. The motivation factors were the 13 empirically-derived factor scales of
the standardized school measurement tool derived from the RSMP (IDS Publishing
Corporation, 2017; Reiss, 2013). The qualifying age groups included the following: 18,
19 to 24, 25 to 39, 40 to 64, and 65 years or older. The dependent variable in my study
was cumulative GPA, ranked into six ordinal groups: (a) less than 2.0, (b) 2.0–2.24, (c)
2.25–3.74, (d) 2.75–3.24, (e) 3.25–2.74, and (f) 3.75–4.00. To examine whether the
RSMP motivational factors, age, and gender predicted cumulative GPA level, I designed
the study to examine the following research questions:
RQ 1: Does the RSMP factor of social contact predict different levels of GPA?
RQ 2: Does the RSMP factor of curiosity predict different levels of GPA?
RQ 3: Does the RSMP factor of honor predict different levels of GPA?
RQ 4: Does the RSMP factor of family predict different levels of GPA?
RQ 5: Does the RSMP factor of independence predict different levels of GPA?
RQ 6: Does the RSMP factor of power predict different levels of GPA?
RQ 7: Does the RSMP factor of order predict different levels of GPA?
RQ 8: Does the RSMP factor of idealism predict different levels of GPA?

49
RQ 9: Does the RSMP factor of status predict different levels of GPA?
RQ 10: Does the RSMP factor of vengeance predict different levels of GPA?
RQ 11: Does the RSMP factor of physical exercise predict different levels of GPA?
RQ 12: Does the RSMP factor of acceptance predict different levels of GPA?
RQ 13: Does the RSMP factor of tranquility predict different levels of GPA?
RQ 14: Do the RSMP factors and gender predict different levels of GPA?
RQ 15: Do the RSMP factors and age predict different levels of GPA?
Time and Resource Constraints
I used a quantitative, cross-sectional survey design in this study. In comparison to
a longitudinal survey, a cross-sectional survey involves the collection of data at a single
point in time rather than at two or more points in time (Sedgwick, 2014; Tourangeau,
2015). The personal benefits of collecting data at a single point of time include the
completion of the study within the time period stipulated by Walden University and
within an affordable cost bracket (i.e., costs related to study advertisement flyers,
transportation costs, and complimentary gifts for participation).
Study Design
Broadly, a research design refers to a plan that moves from a philosophical
worldview (or paradigm) towards a systematic arrangement of research methodology
(Creswell, 2014; Harwell, 2013). The philosophical worldview constructs that guide the
methodology of a research study are as follows:
• Ontology: What is the nature of reality or the knowable?

50
• Epistemology: What is the nature of the relationship between the inquirer and
what is known (Scotland, 2012; Taylor & Medina, 2013)?
The type of philosophical paradigm researchers follow directly affects (a) what they
discover, (b) the conclusive ideas they derive from these discoveries, and (c) whether
these conclusive ideas generate valid and reliable knowledge in the social sciences (Bean,
2011; Harwell, 2013). In my study, I used a quantitative, cross-sectional survey design
grounded within the components of a philosophical worldview.
The philosophical worldview that underlies my quantitative research design is
post-positivism. The ontological perspective of post-positivism is critical realism; that is,
there is an independent reality to discover in my research study, independent of my
perspective, though it cannot be truly known (Gray, 2014; Scotland, 2012). The
epistemological perspective of post-positivism is modified objectivism; that is, there is an
independent reality to study, but that all observations are inherently fallible (Gray, 2014).
Given the ontological and epistemological perspectives of critical realism and modified
objectivism, I generated theory-driven hypotheses. I used inferential statistics to show the
likelihood that the resulting observations were true.
The scientific model that guided my quantitative research design was the
hypothetico-deductive model. This type of scientific model involves the formulation of
hypotheses through empirical based theory and peer-reviewed research literature (Barker,
Pistrang, & Elliott, 2016; Tariq, 2015). Additionally, the model describes how best to
arrange the research conditions to permit the analysis of research questions and

51
associated hypotheses. I arranged the research conditions by (a) group selection by group
characteristic, (b) group types (random assignment or pre-existing), and (c) group
conditions (experimental or non-experimental; Kazdin, 2016). In consideration of the
hypothetico-deductive model, I categorized the dependent variable, cumulative GPA, into
six groups: (a) less than 2.00, (b) 2.00–2.24, (c) 2.25–3.74, (d) 2.75–3.24, (e) 3.25–2.74,
and (f) 3.75–4.00. Furthermore, I categorized the independent variable age into five age
groups: 18 years old, 19–24 years old, 25–39 years old, 40–64 years old, and 65 years old
or older. The groups were under non-experimental conditions and were pre-existing, that
is, the pre-existing variables defined the groups for GPA, gender, and age.
Summary
In sum, I designed the study to examine whether the 13 RSMP motivational
factors, age, and gender predicted cumulative GPA level. I used a quantitative, cross-
sectional survey design, meaning that I collected data at a single point of time. The
foundation of the research design was a postpositivism worldview and in accord with the
hypothetico-deductive (scientific) model. This philosophical worldview and scientific
method provided the groundwork to (a) generate theory-driven research questions, (b)
select inferential statistics to test the hypotheses, and (c) arrange the research conditions
by group selection (i.e., academic achievement), group type (i.e., pre-existing), and group
condition (i.e., non-experimental).

52
Methodology
In the Methodology section, I review the study’s quantitative cross-sectional
design, discuss the targeted population of interest, explain the sampling strategy and
procedures, describe the recruitment and data collection procedures, and expand on the
instrumentation and operationalization of the constructs. I also discuss the software I used
for data analysis and the descriptive and inferential statistical methods used to test the
null hypotheses (see Table 2). Moreover, I discuss the threats to internal and external
validity and the ethical procedures pertaining to recruitment, anonymity, confidentiality,
data collection, treatment of data, and protection of confidential data.
Population
For the initial study design, I defined two levels of the dependent variable
academic achievement. These two levels were students on academic probation and
students in the honors program. Due to the low number of study participants, I revised the
original study design whereas I redefined the dependent variable academic achievement
as cumulative GPA. A description of the target population and sample for both the initial
and revised study designs follows.
Initial study design. In the fall semester of 2018, I recruited two groups of
students at a community college located in the western region of the United States. The
recruitment groups included students in the honors program and students on academic
probation. The students were members of the two academic groups described in the
original research questions, as follows:

53
RQ 1: Does the RSMP factor of social contact predict different levels of GPA?
RQ 2: Does the RSMP factor of curiosity predict different levels of GPA?
Initial targeted population. The recruitment groups included students in the
honors program and students on academic probation. According to the 2017–2018
community college student handbook, students are put on academic probation if, after
taking 12 or more credits, their cumulative GPA is less than 1.60 (for students who have
taken 12–15 credits) or less than 1.75 (for 16–30 credits). According to the honors
program webpage, students in the honors program must meet the following requirements:
(a) maintain a cumulative GPA of 3.25, (b) have a full-time status, and (c) fulfill a time-
applicable honors contract or honors project. The number of first-time students on
academic probation at the community college in the spring of 2018 was 169 students
(Associate Dean of Student Affairs, personal communication, February 2, 2018). The
number of students in the honors program in the spring of 2018 was 355 (Dean of the
Honors program, personal communication, February 6, 2018). Overall, the targeted
population size was 524 (i.e., 355 honor students plus 169 first-time students on academic
probation).
Sample alignment to population. Out of the total number of qualifying student
volunteers (N = 79), only five students, between the ages of 18 and 24, participated in the
study; this means that 1% of the targeted population participated.
Current study design. Due to the low rate of student participation in the 2018
fall semester study, I revised the study intent, research questions, and sampling strategy.

54
The updated study intent (for the spring semester of 2019) was to gain a better
understanding of which motivational factors might predict different levels of academic
performance. The number of research questions increased from two to 15 (see the
Introduction section of Chapter 3). Accordingly, the first 13 questions pertained to the
individual effect of each of the RSMP scales on cumulative GPA. The 14th question
related to the effects of all RSMP factors, along with gender. The 15th question examined
the effects of the RSMP factors, along with age.
In the revised study, the dependent variable included the following GPA levels:
(a) less than 2.0, (b) 2.0–2.24, (c) 2.25–3.74, (d) 2.75–3.24, (e) 3.25–2.74, and (f) 3.75–
4.00. The independent variables remained the same—namely, the 13 Reiss motivational
factors, age, and gender. However, the number of qualifying age groups increased from
two age groups (18 years old and 19–24 years old) to five age groups (18 years old, 19–
24 years old, 25–39 years old, 40–64 years old, and 65 years old or older). Overall, the
current study examined the effect of the study variables: Reiss motivation factors, age,
and gender on cumulative GPA. The updated sample strategy was to test the students
while in class (vs. a single testing site) using an online survey format of the demographic
questionnaire and the RSMP survey (with the original paper-based format as an option).
Current targeted population. The recruited sample included students enrolled in
developmental and introductory level academic courses. I targeted students in these
classes because these classes more likely included young adults who, according to
Erikson’s (1968) theory of psychosocial development, had an interest in the dissertation

55
study’s topic: the relationship between motivation and academic achievement. Erikson
theorized that, within their lifetime, individuals progress through eight developmental
stages characterized by distinct psychological issues they must resolve (Erikson &
Erickson, 1982; Erikson, 1968, 1970). Researchers found that Erickson’s fifth and sixth
developmental stages (adolescence [12–18 years old] and young adulthood [19–40 years
old], respectively) included individuals most likely to be in college. Areas of association
within these stages include (a) cognitive developmental patterns (Sacco, 2013), (b)
intrinsic values of self-growth (Hope, Milyavskaya, Holding, & Koestner, 2014), (c)
motivation (Matsushima & Ozaki, 2015), and (d) academic achievement (Goguen et al.,
2010). Overall, the intention of the dissertation study was to recruit college students, who
would be more likely to complete the study survey because of their self-interest in
identifying the types of motivations predict cumulative GPA.
Sample alignment to population. I conducted the study at a community college
located in the western United States. The sample closely represented the targeted college
population. According to the 2018 spring 45th Day institutional statistics on the
community college, most of the students (65%) of the total student population (N =
7,486) were under 25 years of age. Of the students who participated in the study (N =
459), most of the students (85%) were under 25 years of age. Both the sample and
population statistical results fit the age groups noted in Erickson’s developmental stages
five (adolescence: 12–18) and six (young adulthood (19–40).

56
Summary. I indicated that the majority of the targeted population and sample fit
the description of Erickson’s fifth and sixth life stages of development of college students
between the ages of 18-40. As such, I proposed that the majority of sample likely
participated in the dissertation study because of their self-interest in the study’s topic.
Sampling Strategy and Procedures
Just as student recruitment methods can significantly influence sample variability
(Demerouti & Rispens, 2014), sampling methods can have a significant impact on
whether or not the research study results will generalize to a larger population (Etikan,
Musa, & Alkassim, 2016). Given the necessity of examining the association of different
levels of students’ cumulative GPA with 13 motivational factors, gender, and age among
community college students, I employed a convenience sampling method. The
convenience method is common in quantitative research (Elfil & Negida,2017; Etikan et
al., 2016). Criterion for using this type of sampling method is that the sample population
be (a) easily accessible, (b) within geographic proximity, (c) available at a given time, or
(d) willing to participate for the purpose of the study (Etikan et al., 2016). With this
criterion in mind, I used the convenience method to save time, that is, to complete the
study within the IRB allotted time period of two semesters.
Justification. Criterion for using the random sampling method does not include
the selection of group participants who are willing to volunteer for the study or who the
researcher expects to cooperate (Banerjee & Chaudhury, 2010). From a theoretical
perspective, I ruled out the use of the random sampling method because the targeted

57
population (students registered in developmental and introductory courses) were more
likely to be young adults who showed a cognitive interest in the study’s topic of
academic achievement and motivation. These students hence had a desire to both
participate in the study and cooperate in the completion of the psychological assessment.
In comparison with the convenience sampling method, the purposeful sampling
method is common in qualitative research. The prerequisite for the purposeful sampling
method is that it “cannot be used when the variables in the study are quantitative in
nature” (Etikan et al., 2016). On the basis of this prerequisite, purposeful sampling did
not appear to be a viable sampling method to use in my study. Hence, I designed the
research question variables to be quantitative in nature.
Overall, I determined that the convenience sampling method was best suited for
the study. The foremost reason was that I could acquire statistical data that was likely to
be valid, in that it represents the homogeneous population of the sample drawn. More
specifically, there will be no change in the statistical data if the sample were randomly
selected, difficult to reach, outside geographic proximity, or unavailable at a specific
time. I also chose this sampling strategy because my geographic proximity to the college
allowed for easier access to the target population.
Sampling frame. The generalizability of educational research findings from the
sample to the target population depends on definitive sampling methods. Such methods
include not only a clear and identifiable description of the targeted population, specific
procedures for how the sample was drawn, but also a sampling frame (Elfil & Negida,

58
2017). A sampling frame refers to a formal list of basic units (e.g., individuals,
institutional systems) who make up a targeted population in a research study (Martínez-
Mesa, González-Chica, Duquia, Bonamigo, & Bastos, 2016; Salazar, Crosby, &
DiClemente, 2015). In the present study, the sampling frame was college students
(registered in developmental and introductory classes) at a community college in the
western region of the United States.
Inclusive and exclusive criteria. Inclusion and exclusion criteria define who
makes up the study sample. By definition, inclusion criterion identifies the study
population in a reliable and unbiased manner (Garg, 2016). In contrast, exclusion criteria
are any factors that disqualify potential participants from a study (Garg, 2016). The
exclusion criterion is thus an all-encompassing factor of the inclusion criterion.
The criterion for inclusion is the samples’ ranked level of cumulative GPA: less
than 2.0, 2.0-2. 24, 2.25-2.74, 2.75-3.24, 3.25-3.74, or 3.75-4.0. Due to a federal school
regulation that prohibits accessing student grades via registrar education records (as well
as student directory information to recruit them) without students’ prior permission, it
was impossible to recruit the total targeted population in the study. Though I was not able
to attain an all-inclusive sampling frame, by clearly and identifiably aligning the targeted
population with the research hypotheses, I was able to accomplish the following: (a)
increase the confidence that the study’s research outcome was valid; (b) prevent selection
bias (i.e., unintended errors in the recruitment of participants); (c) prevent information

59
bias (data inaccuracy); and (d) increase the generalizability of the study results to the
targeted population (Bennett et al., 2010).
Power analysis. Power analysis is a statistical method used to determine an
optimal, preliminary sample size for the purpose of ensuring a high reliability of study
results (Tomczak, Tomczak, Kleka, & Lew, 2014). Determination of the sample size via
power analysis requires specifying levels for the alpha (a), statistical power (1- β), and
effect size (Cohen, 1992b; Funder et al., 2014). Alpha is a statistical number between
zero and one that represents the probability of a making Type I error, that is, the
conditional probability of erroneously rejecting the null hypothesis in the sample when it
is actually true in the population (Emmert-Streib & Dehmer, 2019; Funder et al., 2014).
To decrease the probability of a Type I error, a common practice in social sciences is to
set the alpha value at .05 (Cohen, 1992b; Tomczak et al., 2014). Statistical power is the
probability of correctly rejecting the null hypothesis (Funder et al., 2014). Within the
statistical power equation (1- β), beta (β) is a number between zero and one that
represents the probability of a Type II error, that is, the probability of erroneously
accepting the null hypothesis in the sample when in fact it is false in the population
(Funder et al., 2014). A common practice in social sciences to decrease the probability of
a Type II error is to set the beta at .20, which in turn, will establish the statistical power (1
– β = 1 - .20) at .80 (Cohen, 1992b; Funder et al., 2014).
Determining an effect size requires considering various research factors. An effect
size (ES) refers to the magnitude of distance between the null hypothesis’s value (H0 = 0)

60
and the alternative hypothesis’s value (H1 ≠ 0; Cohen, 1992b; Keskin & Aktas, 2013).
Theoretically speaking, the closer a detected effect size is to the null hypothesis of 0, the
more difficult it is to reject the null hypothesis (Cohen, 1992b). The magnitude of the
effect size also depends on other factors, such as the nature of the research questions, the
precision of the instrument, and the homogeneity of the sample (Funder et al., 2014). A
common practice in social sciences is to pair Cohen’s (1988, 1992a) conventional effect
sizes of small, medium, and large with statistical significance tests (Funder et al., 2014).
Cohen’s medium effect size, with a 95% confidence interval (CI), typically represents an
approximation of the “average size of observed effects” (Cohen, 1992a, p. 281; Funder et
al., 2014; Tomczak et al., 2014). The recommended percentage for CI (i.e., 95%)
provides an estimation of both the size and the precision of the effect size (Funder et al.,
2014). Overall, to determine an optimal, preliminary sample size, I set the alpha level at
.05, a statistical power of no less than .80, and a conventional effect size for a specific
statistical test (see Table 1).
Table 1
Effect Size as a Function of Statistical Test
Effect size
Tests Effect indices None Small Medium Large Citation
Logistic
regression Odds ratio test 0 1.68 3.47 6.71
Chen, Cohen,
& Chen (2010)

61
Sample size. I used the G*Power 3.1.9.4 power analysis (Faul, Erdfelder,
Buchner, & Lang, 2019) software to predetermine the sample size. This particular sample
size method ensures a higher reliability of the study along with the researcher’s concerns
(i.e., research budget, time restraints) or by professional recommendations (Keskin &
Aktas, 2013). The advantage of using the G*Power program is that it makes use of
Cohen’s (1988, 1992a) effect size measures (Faul, Erdfelder, Lang, & Buchner, 2007;
Keskin & Aktas, 2013). Preliminary steps for using the G*power program include the
selection of a power analysis and a statistical test in accord with the null hypothesis.
Given the need to identify the sample size necessary to induce meaningful
outcomes, I selected the G*Power a priori power analysis (to compute the sample size as
a function of user-specified values for alpha, statistical power, and effect size; Faul,
Erdfelder, Buchner, & Lang, 2017; Funder et al., 2014). I also selected the G*Power chi-
squared (χ2) test, Goodness-of-fit, to test the null hypotheses (Faul et al., 2017). I set the
input parameters at an alpha level of .05, a medium effect size of .30, and a power goal of
0.80. The calculated parameter values yielded a total minimum sample size of 143 and an
actual power of 0.80. Overall, the predetermined sample size to ensure a high reliability
of the study results was 143 participants.
Recruitment
I used the full IRB recruitment period (October 1, 2018 through April 30, 2019)
to recruit student volunteers. In the 2018 fall semester, I made initial contact with two
academic groups of students—namely, students registered in the honors program and
62
students listed on academic probation. I recruited participants from the honors academic
group by briefly discussing the study in diverse types of honor classes. The director of the
honors program also posted an online honors announcement about the study. To recruit
participants for the academic probation academic group, the Interim Dean of Students
attached a study flyer and invitational letter in emails addressed to students on academic
probation (see Appendix C). Initial student contact through a college administrative
channel served to protect the students’ anonymity (vs. contacting them personally via
registration) and their sense of group inclusion (i.e., handing the flyer out to all the
students).
Once I determined the number of students who met the screening criteria (n = 79),
I provided the student volunteers with the date, time, and collective place on campus to
participate in the study survey (the week of December 12 through December 18, 2018). I
decided to wait until the end of the semester (a week before class finals) because of the
low rate of recruitment questionnaires received via email back (n = 2) from the students
listed on academic probation. Six percent (n = 5) of the total number of qualifying student
volunteers participated in the study. Due to the low number of student participants in the
fall study and for the purpose of maximizing student participation during the spring
semester of 2019, I switched the method of collecting student data.
Second semester of study. In the 2019 spring semester, I made initial contact
with students primarily registered in developmental and introductory academic classes (n
= 29 classes). The college IRB director, the college department directors, and the class

63
instructors pre-approved the survey method of conducting the study in-class immediately
following a brief introduction of the study. If the course was online or it was not possible
to conduct the study in class (due to class time restraints), the instructors sent information
about the study to their students along with the study Qualtrics URL study link. The
interim dean of students also sent out the study invitational letter and flyer and link to the
Qualtrics study to students on academic probation. Overall, by altering the logistical part
of data collection process after the fall recruitment period, the overall usability response
rate was 88% (n = 459) in the spring of 2019 and 6% (n = 5) in the fall semester of 2018.
Data Collection
I used an IRB-approved online survey format of the demographic questionnaire
and the RSMP survey. I also offered a paper-based format as an optional method.
Researchers have confirmed that the collection of data via a computer device exhibits
comparable psychometric survey properties as a paper-based format (Ravert, Gomez-
Scott, & Donnellan, 2015) and favorable acceptance rates among students (K. Park, N.
Park, Heo, & Gustafson, 2019). Ravert et al. (2015) examined whether data collected
from undergraduate students (N = 258) via a web-based survey and a paper-based survey,
had similar psychometric properties in the areas of acceptance rates, missing data, words
per response, scale scores, and scale internal consistency. Park et al. (2019) increased the
knowledge on acceptance rates by examining what factors influenced undergraduate
students’ willingness to participate in online surveys.

64
Ravert et al. (2015) found that there was a significant correlation between the
web-based format and the paper-based format of a survey in psychometric properties (r =
.511; N = 256), and there were no significant differences in acceptance rates between the
formats (z = –.416). Park et al. (2019) found that there was a significant association
between the online survey format and survey participation (β = 0.169, p < .05). The
researchers highlighted the following features of the online survey format: (a)
convenience: technical component of conducting an online survey, (b) appropriateness:
easiness to fill out, (c) organization: efficiency of survey, and (d) the running time:
brevity of time. Overall, the researchers suggested that an online-based survey is a viable
alternative method to a paper-based survey.
Online survey software. I used the Qualtrics online survey software (Qualtrics,
2019) for the following reasons: (a) it is a common option in the academic community
(Duke University, n.d.; Yale University, 2019), (b) it has stringent information security
requirements (it is FedRAMP certified, which is the gold standard of U.S. federal security
compliance; Qualtrics, 2019), and (c) it has a wide array of options while enabling direct
access to survey questions (Rubin, 2019, May 21). Researchers also use Qualtrics to
administer controlled online surveys to methodically study personality factors, such as
motivation, to ascertain individual’s beliefs and behaviors (Evans, & Mathur, 2018).
Given the advantages of using the Qualtrics survey software, I recruited more than the
minimum number of participants required to run a regression analysis.
Demographic questionnaire. I created the online demographic questionnaire in

65
accord with peer-review research and ethical guidelines and standards. Guided by the
research literature, I designed the questionnaire in accord with the data’s relevancy to the
study variables (AAPOR, 2015; ETS, 2015) and the theoretical framing of social
identities (Braun, Woodley, Richardson, & Leidner, 2012; Fernandez et al., 2016; Rankin
& Garvey, 2015). If participants indicated that they had an intellectual disability during
the demographic portion of the online survey, they were taken to the end of the study
(without completing the online RSMP) and thanked for their time. Guided by ethical
guidelines and standards, I designed the questionnaire to assure students’ anonymity
(AAPOR, 2015; ACPA, 2013; ETS, 2015; Harris, 2015) and to avoid any bias during the
data collection process (Braun et al., 2012; Fernandez et al., 2016). Keeping in mind the
prior research ethical guidelines and standards, as well as the change in research design
and research hypotheses (between the 2018 fall semester and 2019 spring semester), I
created three different versions of the demographic questionnaire.
10-item version. The 10-item (paper-based only) demographic questionnaire
included questions tailored to the initial hypotheses (see Appendix E). Inclusion of the
questionnaire items was in accord with (research-based) best practices for asking
demographic questions (Fernandez et al., 2016) and for identifying at-risk students
(Beaudoin & Kumar, 2012). The demographic questions related to students’ academic
background, demographic characteristics, social-economic background, and intellectual
disability (see Appendix A). Items related to the study variables included the participants’
gender, age, and cumulative GPA level from the prior semester: 3.75, -4.00, 3.25, - 3.74,

66
2.75, - 3.24, 2.25, -2.74, 2.0, -2.24, and less than 2.0. The item on intellectual disability
was essential to ask the participants as Reiss (2013) designed the RSMP for those
students without intellectual disabilities. I conducted the initial study using the 10-item
demographic questionnaire (at the designated campus test site) during the week of
December 12 through December 18, 2018.
15-item version. The online (and optional paper-based) 15-item demographic
questionnaire included questions tailored to the revised hypotheses (see Appendix F). I
added five demographic and study variable questions to the existing 10-item
demographic questionnaire. Specifically, the demographic questions included the
following: (a) the credit-based status of students listed on academic probation (Q4): first
time and continuous, (b) the semester-based status of students in the honors program
(Q13, Q14): first time and continuous, and (c) the importance of religion or spirituality in
the students’ life (Q12). The additional study variable question asked whether the
participants were on academic probation (Q15). I conducted the current study using the
15-item demographic questionnaire during the beginning of the 2019 spring semester.
17-item version. The online (and optional paper-based) 17-item demographic
questionnaire included demographic and study variable questions tailored to the revised
hypotheses (see Appendix A). I added two questions to the existing 15-item demographic
questionnaire. Specifically, the demographic question pertained to the total amount of
credits taken (not including the current semester). The additional study variable question

67
pertained to the participants’ cumulative GPA level. I conducted the in-class study using
the 17-item demographic questionnaire throughout the 2019 spring semester.
Two-item supplemental survey. Because I changed to the 17-item version of the
demographic questionnaire after data collection had begun, I asked students who
participated in the 15-item online survey to complete a 2-item supplementary
demographic survey in the online format (see Appendix G). I revisited the five honors
classes (in April 2019) and requested that the study participants complete the 2-item
supplemental survey. After conducting the online study, I merged the demographic (15-
item survey plus 2-item supplemental survey) questionnaire data together and scanned for
missing data. I eliminated 37 honor student cases due to missing RSMP data and kept the
remaining cases (n = 50; 42.5%) for data analysis purposes. Altogether, I created three
versions of the demographic questionnaire (and one supplemental demographic survey),
which aligned with the initial hypotheses or the current study hypotheses.
Informed consent. The general invitational letter and study flyer provided in the
paper and online form included the following informed consent information:
• Issues of confidentiality.
• Benefits to the students.
• Option of withdrawing.
• Introduction of the assessment instrument (RSMP), how much time it takes (15
minutes), and how it can be taken (written form).

68
• Introduction of the demographic questionnaire, how much time the test takes
(under 5 minutes) and how it can be taken (written form).
• Provision of incentives in first semester of study (see Appendix C).
Data collection procedures and debriefing. Before the participants began
completing the survey, I provided them with brief instructions on how to complete the
demographic questionnaire and the RSMP test; answered any questions prior to, during,
and after the study; and advised that study participation was completely voluntary. I also
reviewed the consent form material (see Appendix D). Specifically, I shared information
about (a) the RSMP instrument, (b) myself as the researcher of the dissertation study, (c)
how to contact the overseeing IRB, and (d) how to contact me. I also obtained informed
consent from participants before they began the study and informed them that the study
results would be available upon request. For the initial study, I offered incentives of food
and beverages after participants had completed the study. For the revised study, some of
the class instructors offered the incentive of class credit if the students chose to
participate in the study. I also offered entry into a raffle for a monetary gift card ($25.00
value) for students recruited via email invitation. There were no follow-up procedures,
such as interviews or treatments.
Instrumentation
I used the school version of the RSMP to assess the strength of students’
motivational drives. I received permission to use this instrument from the IDS Publishing
Corporation (see Appendix B). The RSMP, developed by Steven Reiss (2009), is a 104-
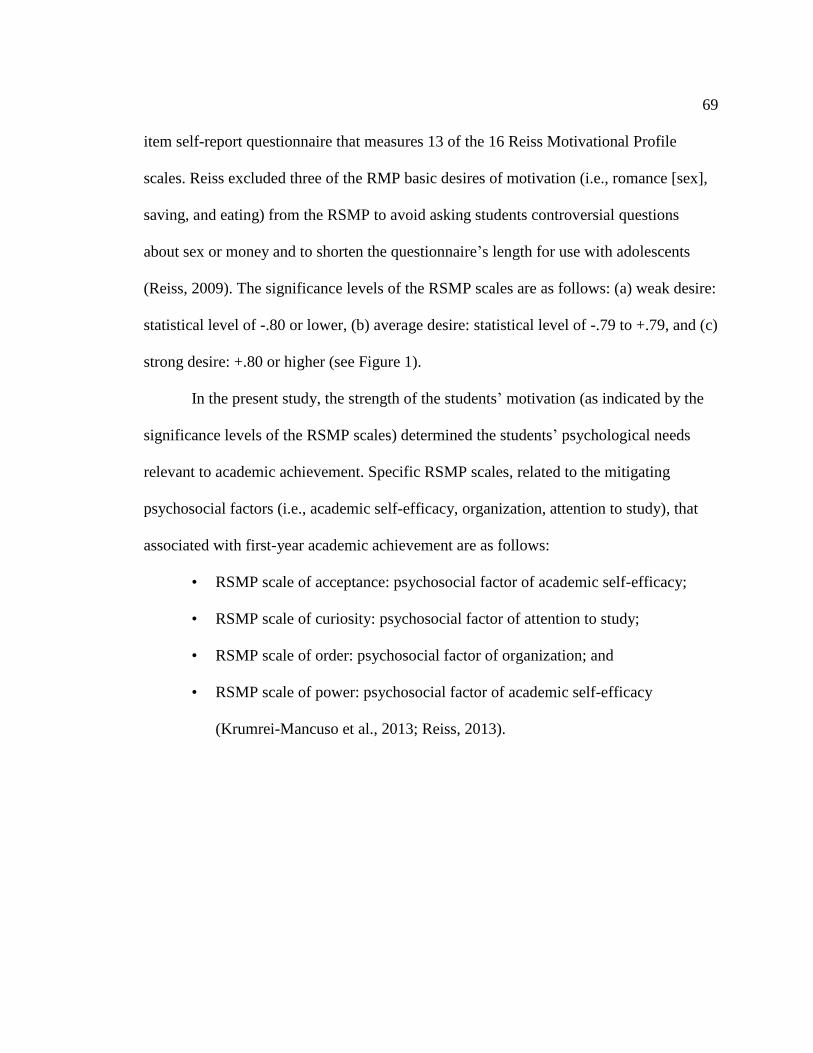
69
item self-report questionnaire that measures 13 of the 16 Reiss Motivational Profile
scales. Reiss excluded three of the RMP basic desires of motivation (i.e., romance [sex],
saving, and eating) from the RSMP to avoid asking students controversial questions
about sex or money and to shorten the questionnaire’s length for use with adolescents
(Reiss, 2009). The significance levels of the RSMP scales are as follows: (a) weak desire:
statistical level of -.80 or lower, (b) average desire: statistical level of -.79 to +.79, and (c)
strong desire: +.80 or higher (see Figure 1).
In the present study, the strength of the students’ motivation (as indicated by the
significance levels of the RSMP scales) determined the students’ psychological needs
relevant to academic achievement. Specific RSMP scales, related to the mitigating
psychosocial factors (i.e., academic self-efficacy, organization, attention to study), that
associated with first-year academic achievement are as follows:
• RSMP scale of acceptance: psychosocial factor of academic self-efficacy;
• RSMP scale of curiosity: psychosocial factor of attention to study;
• RSMP scale of order: psychosocial factor of organization; and
• RSMP scale of power: psychosocial factor of academic self-efficacy
(Krumrei-Mancuso et al., 2013; Reiss, 2013).

70
Figure 1. Composite scores of RSMP.
There is empirical support for the RSMP as a scientific measure of motivation.
Froiland et al. (2015) investigated what basic desires of school motivation were
significantly associated with academic achievement among high school students, ages
16–20. The authors acknowledged the utility of using the RSMP to examine student
motivation within a school setting and the validity and reliability of the instrument.
Froiland et al. found that the motives of intellectual curiosity and family significantly
associated with academic achievement. Regarding gender, male students had a stronger
desire for intellectual curiosity and a lower desire for family than female students.
Furthermore, students with a stronger desire for intellectual curiosity had a higher level of
academic achievement when they had a weaker desire for physical activity. Overall,

71
Froiland et al. concluded that the RSMP is significantly associated with student academic
achievement.
Reliability. The findings of two confirmatory factor analysis (CFA) studies
supported a 15-factor RMP model of fundamental motives (Havercamp & Reiss, 2003;
Reiss & Havercamp, 1998). The RMP factors include acceptance, curiosity, eating,
family, honor, idealism, independence, order, physical activity, power, romance, social
contact, status, tranquility, and vengeance. Acceptable instrument consistency with the
Cronbach’s alpha coefficients averaged between .82 (Reiss & Havercamp, 1998) and .83
(Havercamp & Reiss, 2003) across the scales. Acceptable internal consistency reliability
coefficients for a personality assessment range between .70 and .90 (M = .77; Charter,
2003).
The external reliability coefficients of a 15-factor RMP model of fundamental
motives also had a high test-retest instrumental consistency with the Pearson Product
Moment correlations ranging between .72 to .96 (M = .83) across the scales after a two-
week interval (Reiss & Havercamp, 1998) and .69 to .88 (M = .80) after a four-week
interval (Havercamp & Reiss, 2003). Acceptable test-retest reliability coefficients for a
personality assessment range between .70 and .90 (M = .79; Charter, 2003). Overall, prior
research has shown that the internal and external reliability of the 15 factor scales of the
initial RMP has an acceptable level of consistency and stability over time. The
scientifically-derived evidence of a 15-factor model of fundamental motives supports the
72
research assumptions of fundamental motives as referring to end purposes and universal
goals.
Validity. The findings of two concurrent validity studies support a 16-factor
model of the RMP. Olson and Weber (2004) explored the relationship between
personality traits (five factor model; McCrae & John, 1992) and fundamental motives
(16-factor model; Reiss, 2004) among university students. The researchers measured the
fundamental motives using the RMP test and personality traits using the Revised
Neuroticism-Extraversion-Openness Inventory (NEO PI-R; Costa, & McCrae, 1992;
McCrae & John, 1992). The NEO PI-R scales are neuroticism, extroversion, openness to
experience, agreeableness, and consciousness (McCrae & John, 1992).
Olson and Weber (2004) found that there was a significant relationship between
the majority of the RMP scales and one or more of the NEO-PI-R scales. Seven of the
RMP motive scales were positively correlated with the NEO-PI-R scale of Neuroticism:
Savings (r2 = .28, p < .01), Order (r
2 = .33, p < .01), Status (r
2 = .24, p < .01), Vengeance
(r2 = .31, p < .01), Eating (r
2 = .25, p < .01), Acceptance, (r
2 = .50, p < .01), and
Tranquility (r2 = .46, p < .01). Two of the RMP motive scales were positively correlated
with the NEO-PI-R trait scale of Extroversion: Social Contact: (r2 = .58, p < .01) and
Status (r2 = .19, p < .05). Four of the RMP scales were positively or negatively correlated
with the NEO-PI-R scale of Openness to Experience: Social Contact (r2 = .20, p < .05),
Curiosity (r2 = .46, p < .01), Order (r
2 = -.19, p < .01), and Independence (r
2 = .17, p <
.01).

73
Additionally, seven of the RMP scales were positively or negatively correlated
with the NEO-PI-R trait scale of Agreeableness: Honor (r2 = -.18, p < .01), Power (r
2
= -.18, p < .05), Idealism (r2 = -.30, p < .01), Independence (r
2 = -.29, p < .01), Status (r
2
= -.28, p < .01), Romance (r2 = -.23, p < .01), and Family (r
2 = .22, p < .01). Four of the
RMP scales were positively correlated with the NEO-PI-R scale of Consciousness: Honor
(r2 = .31, p < .01), (r
2 = .33, p < .01), Idealism (r
2 = .24, p < .01), and Family (r
2 = .21, p
< .05). The researchers concluded that there was an association between fundamental
motives and personality traits. Overall, the study provided concurrent validity for the 16
factor RMP model. Furthermore, the study supported the 16-basic theory’s first
hypothesis that the majority of the basic desires are “trait motives” (Reiss, 2004, p. 186)
and the theory’s first principle that the basic desires are deeply rooted in human nature
(Reiss, 2013).
In a more recent concurrent validity study, Olson and Chapin (2007) examined
the relationship between fundamental motives (Reiss, 2004) and psychological needs
(Deci & Ryan, 1985, 200) as well as their association to well-being (McGregor & Little,
1998) and intrinsic and intrinsic motivation (Harter, 1978). The population sample was
university students. The components of well-being are eudaimonic and hedonic.
Eudaimonic well-being refers to the meaning in life in the areas of feeling of
connectedness, purpose, and growth (McGregor & Little, 1998). Hedonic well-being
refers to happiness in the areas of satisfaction with life, positive affect, and freedom from
negative affect (McGregor & Little, 1998).

74
Psychological instruments used to assess the association between the
psychological needs and fundamental motives and their relationship to well-being and
intrinsic and extrinsic motivation included the following:
1. The Reiss Motivation Profile (RMP; Reiss, 2013)
2. The Basic Psychological Needs Satisfaction in General Scale (BNSG;
Johnston & Finney, 2010; Kashdan, Julian, Merritt, & Uswatte, 2006; Meyer,
Enstrom, Harstveit, Bowles, & Beevers, 2007)
3. The Purpose in Life Test (PILT; Crumbaugh & Henrion, 1988)
4. The Positive and Negative Affect Schedule Scale (PANAS; Watson, Clark, &
Tellegen, 1988)
5. The Work Preference Inventory (WPI; Amabile, Hill, Hennessey, & Tighe,
1994).
Olson and Chapin (2007) found that there was a significant relationship between
six of the RMP scales and one or more of the BNSG scales. The RMP Family scale was
positively correlated with all three BNSG scales: Autonomy (r = .28, p < .01),
Competence (r = .26, p < .01), and Relatedness (r = .44, p < .01). The RMP Independent
scale was negatively correlated with the BNSG Relatedness scale (r = -.30, p < .01). The
BNSG Relatedness scale was also correlated with two of the RMP scales, Status (r = .25,
p < .0) and Social Contact (r =51, p < .01). Additionally, the RMP Acceptance scale was
negatively correlated with the BNSG Autonomy scale (r = -.26, p < .01). The RMP
competence scale was positively correlated with the physical activity motive (r = .25, p <

75
.01) and negatively correlated with the vengeance motive (r = -.30, p < .01). The
researchers concluded that there was an association between fundamental motives and
psychological needs.
Olson and Chapin (2007) also found that there was a significant relationship
between six of the RMP scales and the well-being measurements (PILT, PANAS). Six of
the RMP scales were positively correlated with the PANAS Positive Effect scale: affect:
curiosity (r = .26, p < .05), honor (r = .20, p < .01), social contact (r = .26, p < .05),
family (r = .26, p < .05), status (r = .22, p < .01), physical activity (r = .44, p < .05), and
acceptance (r = -.46, p < .05). Additionally, six of the RMP scales were positively or
negatively correlated with the PIL (meaning in life) scale: Idealism (r = .28, p < .05),
Honor (r = .33, p < .05), Social Contact (r = .25, p < .05), Family (r = .33, p < .05),
Physical Activity (r = .23, p < .05), and Vengeance (r = -.32, p < .05). The researchers
concluded that there was an association between fundamental motives and well-being.
Additionally, Olson and Chapin (2007) found that there was a significant
relationship between six of the RMP scales and the WPI scales. Six of the RMP scales
were positively or negatively correlated with the intrinsic WPI scale: Curiosity (r = .54, p
< .05), Idealism (r = .24, p < .05), Power (r = .20, p < .01), Physical Activity (r = .26, p <
.05), Acceptance (r = -.21, p < .01), and Tranquility (r = -.25, p < .05). The intrinsic
scales include the factors of Challenge and Enjoyment (Amabile et al., 1994).
Additionally, the five of the RMP scales were positively correlated with the WPI
extrinsic factor scales: Acceptance (r = .48, p < .05), Status (r = .42, p < .05), Order (r =
76
.23, p < .01), Power (r = .19, p < .01), Eating (r = .35, p < .05), and Saving (r = .23, p <
.01). The extrinsic scales include the factors of Compensation and Outward (i.e.,
individual concern with recognition and the directives of others; Amabile et al., 1994).
The researchers concluded that there was an association between the fundamental
motives, intrinsic motivation, and extrinsic motivation. Overall, the study established the
concurrent validity of the 16-factor RMP model. Additionally, the study results supported
the theory of the 16 desires as “end motives” (Reiss, 2004, p. 180) and Reiss’s fourth
hypothesis that each of basic desires produced an intrinsically different valued feeling of
joy (Reiss, 2013).
Established reliability coefficients. For each of the RSMP scales, I conducted
item analyses to examine the internal consistency of the scales. Established reliability
coefficients (or internal reliability) for an educational and personality assessment tool
range between .70 and .90 (Charter, 2003; Pallant, 2016; Taber, 2018). The reliability
coefficients for the RMP range between .82 (Reiss & Havercamp, 1998) and .83
(Havercamp & Reiss, 2003) across scales. In the present study, the Cronbach’s alpha
averaged between .73 and .92 across scales (considered acceptable values; see Table 2).

77
Table 2
Item Analytics for 13 Reiss School Motivation Profile Scales
Internal consistency
Scales N αa SD(r)
b
Physical exercise 453 0.92 0.1
Family 449 0.92 0.1
Vengeance 451 0.88 0.14
Order 451 0.86 0.09
Acceptance 449 0.85 0.09
Social contact 449 0.84 0.11
Tranquility 451 0.82 0.09
Curiosity 451 0.81 0.09
Power 451 0.81 0.12
Status 451 0.81 0.08
Idealism 451 0.80 0.08
Honor 449 0.77 0.13
Independence 451 0.73 0.13 a Cronbach alpha coefficients. b Standard deviation of inter-item correlations.
Operationalization
In association with the study’s null hypotheses, I defined the predictor variable of
motivation as basic human strivings or basic desires (Havercamp & Reiss, 2003). These
basic desires make up the 13 empirically-derived factor scales of the RSMP (IDS
Publishing Corporation, 2017; Reiss, 2013). I defined gender as the participants’ sex
assignment at birth (female or male) and age as their particular age group (18 years old,
19–24, 25–39, 40–64, or 65 or older). Furthermore, I defined the outcome variable—
academic achievement—as the participants’ level of cumulative GPA from the prior
semester: (a) less than 2.00, (b) 2.00–2.24, (c) 2.25–3.74, (d) 2.75–3.24, (e) 3.25– 2.74,
and (f) 3.75–4.00

78
I measured the predictor and outcome variables using descriptive statistical
procedure methods. More specifically, I calculated gender, age (see Tables 4–5) and
cumulative GPA data (see Tables 8–9) using both frequencies and percentages in table
form (Geramian, Mashayekhi, & Ninggal, 2012). The resulting statistical scores represent
the frequency rates of gender and age groups and the frequency and percent distribution
of different levels of cumulative GPA. I calculated the RSMP data (see Table 10) using
range, means, and standard deviation in table form (Froiland et al., 2015). The resulting
statistical scores represent the RSMP standard scores on a 7-point Likert scale. Overall, I
measured each of the predictor and outcome study variables using descriptive statistical
procedure methods, calculating frequency, percentage, and RSMP scale scores.
Data Analysis Plan
Table 3
Data Analysis Plan for Research Questions
Software for statistical analysis. I analyzed the data using the 2019 IBM
Research questions Dependent variables Independent variables Statistical procedure
Questions 1-13 Different levels of
cumulative GPA
13 RSMP factors Bivariate ordinal logistic regression
Question 14
Different levels of
cumulative GPA
Gender
Multivariate ordinal logistic regression
Question 15 Different levels of
cumulative GPA
Age Multivariate ordinal logistic regression
79
Statistical Package software (SPSS) for Microsoft Windows. Social science researchers
commonly use this statistical software when examining the relationships between a set of
independent variables and one continuous variable (Ong & Puteh, 2017). Specifically,
researchers use SPSS for bivariate and multivariate analysis for both nonparametric and
parametric statistical techniques (Ong & Puteh, 2017). I used the SPSS descriptive
statistical procedure methods to measure the predictor and outcome study variables and
the SPSS inferential statistical procedure method, ordinal logistic regression, to test the
null hypotheses. The significance level for all statistical analyses was set a priori at α <
.05.
Research questions and hypotheses. I examined the current lines of study intent
with 15 research questions that highlighted the association of Reiss basic desires of
motivation with different levels of GPA, gender, and age.
RQ 1: Does the RSMP factor of social contact predict different levels of GPA?
Ho1: The RSMP factor of social contact does not predict different levels of
GPA.
Ha2: The RSMP factor of social contact will predict different levels of GPA.
RQ 2: Does the RSMP factor of curiosity predict different levels of GPA?
Ho1: The RSMP factor of curiosity does not predict different levels of GPA.
Ha2: The RSMP factor of curiosity will predict different levels of GPA.
RQ 3: Does the RSMP factor of honor predict different levels of GPA?
Ho1: The RSMP factor of honor does not predict different levels of GPA.

80
Ha2: The RSMP factor of honor will predict different levels of GPA.
RQ 4: Does the RSMP factor of family predict different levels of GPA?
Ho1: The RSMP factor of family does not predict different levels of GPA.
Ha2: The RSMP factor of family will predict different levels of GPA.
RQ 5: Does the RSMP factor of independence predict different levels of GPA?
Ho1: The RSMP factor of independence does not predict different levels of
GPA.
Ha2: The RSMP factor of independence will predict different levels of GPA.
RQ 6: Does the RSMP factor of power predict different levels of GPA?
Ho1: The RSMP factor of power does not predict different levels of GPA.
Ha2: The RSMP factor of power will predict different levels of GPA.
RQ 7: Does the RSMP factor of order predict different levels of GPA?
Ho1: The RSMP factor of order does not predict different levels of GPA.
Ha2: The RSMP factor of order will predict different levels of GPA.
RQ 8: Does the RSMP factor of idealism predict different levels of GPA?
Ho1: The RSMP factor of idealism does not predict different levels of GPA.
Ha2: The RSMP factor of idealism will predict different levels of GPA.
RQ 9: Does the RSMP factor of status predict different levels of GPA?
Ho1: The RSMP factor of status does not predict different levels of GPA.
Ha2: The RSMP factor of status will predict different levels of GPA.
RQ 10: Does the RSMP factor of vengeance predict different levels of GPA?

81
Ho1: The RSMP factor of vengeance does not predict different levels of GPA.
Ha2: The RSMP factor of vengeance will predict different levels of GPA.
RQ 11: Does the RSMP factor of physical exercise predict different levels of GPA?
Ho1: The RSMP factor of physical exercise does not predict different levels of
GPA.
Ha2: The RSMP factor of physical exercise will predict different levels of GPA.
RQ 12: Does the RSMP factor of acceptance predict different levels of GPA?
Ho1: The RSMP factor of acceptance does not predict different levels of GPA.
Ho2: The RSMP factor of acceptance will predict different levels of GPA.
RQ 13: Does the RSMP factor of tranquility predict different levels of GPA?
Ho1: The RSMP factor of tranquility does not predict different levels of GPA.
Ha2: The RSMP factor of tranquility will predict different levels of GPA.
RQ 14: Do the RSMP factors and gender predict different levels of GPA?
Ho1: The RSMP factors and gender does not predict different levels of GPA.
Ha2: The RSMP factors and gender will predict different levels of GPA.
RQ 15: Do the RSMP factors and age predict different levels of GPA?
Ho1: The RSMP factors and age does not predict different levels of GPA.
Ha2: The RSMP factors and age will predict different levels of GPA.
Research Questions 1–13. The first 13 questions guiding this research study
focused on motivational factors that may predict academic achievement (i.e., cumulative
GPA) among community college students. The independent variables were the Reiss

82
basic desires of motivation, age, and gender. The dependent variable was cumulative
GPA. To examine the focus of the study, I conducted an analysis of the first13
hypotheses (see Chapter 3: Introduction section).
Analysis Plan. To test Null Hypotheses 1–13, I used the inferential statistical
procedure of bivariate ordinal logistic regression (see Table 3). Researchers use this type
of regression to determine the relationship between the values displayed by one
independent variables and one ordinal dependent variable (Bertani, Di Paola, Russo, &
Tuzzolino, 2018). I used the bivariate ordinal logistic analysis to determine the
relationship between the values displayed by the independent variables (the Reiss 13
basic desires of motivation (and the ordinal dependent variable (cumulative GPA; Laerd
Statistics, 2018).
Research Questions 14–15. The last two research questions guiding this research
study (RQs 14–15) focused on the differences in motivational factors between gender
groups and age groups and their association with cumulative GPA. The independent
variables were the Reiss basic desires of motivation, age, and gender. The dependent
variable was different levels of cumulative GPA. To examine the additional focus of the
study, I conducted an analysis of the 14th and 15th hypotheses (see Chapter 3:
Introduction).
Analysis Plan. To test Null Hypotheses 14 and 15, I used the inferential statistical
technique of multivariate ordinal logistic regression analysis. This type of regression is an
extension of the bivariate ordinal logistic regression, which researchers use to determine
83
the interaction between the values displayed between the values of two or more
independent variables and an ordinal dependent variable (Liu, 2018). I used a
multivariate ordinal logistic analysis to determine the relationship between the values
displayed by one of the independent variables (Laerd Statistics, 2018): Reiss’ basic
desires of motivation (found to significantly associate with Cumulative GPA), gender,
and age; and the ordinal dependent variable: cumulative GPA.
Interpretation of the results.
Descriptive statistics. I used SPSS descriptive statistical procedure methods to
determine which of the basic desires of motivation (RSMP scales) were more salient for
different levels of cumulative GPA: (a) low academic achievement: less than 2.0, (b)
average: 2.0 - 2.24 and 2.25 – 3.24 and (c) above average (to excellent): 3.25 -3.74 and
3.75 – 4.0 (see Figure 2; Table 8). Each of the 13 basic desire composites comprise eight
respective items. Computation of the composite scores for each basic desire involved the
averaging the individual test scores across the eight respective items. Composite scores
could range from -3 to 3, with high scores corresponding to strong basic desires of
motivation, average scores corresponding to average motivation desires of motivation,
and low scores corresponding to weak basic desires of motivation (see Figure 1).

84
Figure 2. Academic Achievement Factors. Students at the below average academic
achievement level were on academic probation following their first semester in college
and had a cumulative GPA of less than 2.0. Students at the above average academic
achievement level were honors students who had a cumulative GPA of at least 3.25. A
South West University refers to a post-secondary institution located in the United States.
Inferential statistics. Researchers have used ordinal logistic regression to
determine which academic and nonacademic variables (e.g., prior academic performance,
socio-demographics, and personal characteristics) predict post-secondary academic
achievement (Hodara & Lewis, n.d.; Mothilal, Broos, De Laet, & Pinxten, 2018). They
have also used ordinal logistic regression to determine whether the demographic
variables of age and gender predict post-secondary academic achievement (Adejumo &
Adetunji, 2013; Mahmood, Murad, & Kakamad, 2018). In line with previous peer-
reviewed studies, I used ordinal logistic regression to determine which of the 13 Reiss
basic desires of motivation (non-academic variables) predict academic achievement at a

85
community college in the western United States. I also used ordinal logistic regression to
determine whether key Reiss basic desires (determined in bivariate ordinal logistic
regression results), among age and gender groups, predict academic achievement at the
same community college.
I interpreted the ordinal logistic regression results in accord with the SPSS key
parametric estimates: (a) odds ratio (OR): exponentiation of the B coefficient [EXP(B)],
(b) 95% CI for EXP(B), (c) Wald chi-square with degrees of freedom: Wald χ2
(df value),
and (d) significance level: p value (Laerd Statistics, 2018; Pallant, 2016). The odds ratio
conveys useful information about the effect of the predictor variables on the outcome
variable (Andrade, 2015; Pallant, 2016). For each of the odds ratios, the 95% CI refers to
the probable confidence that the range of (upper and low) values encompass the true
value of odds ratio (Pallant, 2016). If the 95% CI for EXP (B) does not include 1.00 in
the lower and upper values, the odds ratio is significant (Andrade, 2015; Pallant, 2016).
The Wald χ2
value determines the statistical significance of each of the predictor variables
(Laerd Statistics, 2018; Pallant, 2016). In combination with the degrees of freedom,
higher values of Wald χ2
indicate significance (International Business Machines, 2019). I
reported only the odds ratio results when the significance level was less than .05 (see
Chapter 4: Results section).
Data cleaning and screening procedures. For computation of reliability
purposes, the RSMP instrument has a 7-point Likert scale for each of the 104 test items.
Researchers have found that the Likert scale is susceptible to response biases, including

86
social desirability and acquiescent responding (i.e., the tendency to select a positive
connotation; DeSimone et al., 2015). Hence, I used best practice recommendations to
screen for low-quality data. Direct techniques included self-report and instructed items;
indirect techniques included archival screening and statistical screening (DeSimone et al.,
2015). Prior to administering the RSMP test, I used the self-report technique to encourage
participants to share with me if they did not exert effort, attention, energy, or
thoughtfulness. I also used the technique of instructed items to (a) provide information on
the RSMP test items: reference to personal goals, want, and values, (b) explain what the
Likert 7-point scale responses (i.e., strength of agreement or disagreement), and (c)
discuss how to answer an inapplicable question: imagine their reaction to an event. I
instructed the participants to use the 0 or neutral ratings if they were confused by the
wording of an item, neither agree nor disagree, or no opinion. Finally, I expressed to the
participants how valuable their answers would be to the outcome of the research project.
Collectively, the direct screening techniques of self-report and instructed items provided
a means to monitor insufficient effort via self-admittance or noticeable patterns of errors
in survey scale responses.
The indirect techniques of archival screening and statistical screening also provide
a means to monitor insufficient effort. Archival screening refers to the examination of
response behaviors over the course of a survey (DeSimone et al., 2015). In order to
examine response behaviors, I tracked the time it took for the participants to complete the
survey. DeSimone et al. (2015) suggested that if students complete a survey too soon,

87
outside the minimum time to spend on an item (i.e., 2 seconds per item), it reflects a lack
of attention and inaccurate responses. The other indirect technique, statistical screening,
refers to the use of a descriptive screening procedure (i.e., mean, standard deviation,
skewness, and kurtosis) to compare individual responses to item response distributions in
order to ascertain whether there are any extreme response patterns (DeSimone et al.,
2015). I used the IBM SPSS (2019) descriptive screening procedures (i.e., mean, standard
deviation, skewness, and kurtosis) to statistically screen for any extreme response
patterns. Collectively, the techniques of archival screening and statistical screening
provided an indirect means to monitor insufficient effort identified via student response
time or in any extreme response patterns.
Summary
In the present study, I examined the effect of the Reiss motivation factors, age,
and gender on cumulative GPA. I recruited a sample of students enrolled in
developmental and introductory level academic courses. As described in the sampling
strategies and procedures section, I selected a sampling frame of college students at a
community college in the western region of the United States. For the purpose of
inducing meaningful outcomes, I used the G*Power software to predetermine the sample
and effect sizes. I used convenience sampling when recruiting participants and collected
data using an online survey that included the demographic questionnaire and the RSMP
survey.

88
As part of the data analysis plan, I discussed the online demographic
questionnaire and the RSMP test at the day and time set aside for the students to complete
the online survey. I also reviewed the consent form, informed participants that
participation was completely voluntary, and answered any questions. After completing
the data collection process, I used the SPSS descriptive statistical procedure methods to
measure the predictor and outcome study variables. I also used ordinal logistic regression,
an inferential statistical procedure, to test the null hypotheses. To monitor insufficient
student effort and to clean collected data, I applied best practices recommended for data
screening including the use of direct (i.e., self-report, instructed items) and indirect (i.e.,
archival screening, statistical) screening techniques.
Threats to Validity
Internal, External, and Statistical Conclusion Validity
Possible threats to statistical results in a cross-sectional research study include the
(a) reliability and validity of the test instrument, (b) sampling procedures, and (c)
inclusion and accountability of the research question variables (Yens et al., 2014). I used
a reliable and valid test instrument in my study: the RSMP (the school version of the
RMP). As mentioned earlier in the dissertation, there is an body of peer-reviewed work
on the RMP showing that it satisfies the scientific criteria of reliability as determined by
test-retest reliability and internal consistency using Cronbach’s alpha. Researchers also
found that the RMP scales had high levels of both concurrent and criterion validity.
Concerning the threat of sampling procedures, I took steps to include a larger number of

89
participants (N = 459 participants) than the pre-determined sample size established for
statistical analyses. Because one of the threats to external validity is insufficient
representation of the targeted population, a sufficient sample of participants is essential
(Yens et al., 2014). Finally, as to the threat of inclusion and accountability of the research
question variables, I made sure (as mentioned earlier in the dissertation) to select factor
variables of motivation and academic achievement that researchers found to influence
first-year, first-semester academic achievement. Overall, I used evidence-based
recommendations to address the possible threats to the statistical results in this cross-
sectional study.
Ethical Procedures
As part of the recruitment and data collection processes, I sought preliminary
permission to recruit students enrolled at a western U.S. community college from the vice
president of academic affairs, IRB member, and administrative directors who oversee
matters related to students listed on academic probation and students enrolled in the
honors program. I also sought permission to recruit students from community college
instructors who teach honors courses. After approval from Walden University’s IRB and
the western U.S. community college’s district IRB, I adhered to ethical procedures.
Although I did not employ a deceptive or harmful approach that required follow-up
procedures (e.g., follow up interviews), I corrected any misconceptions that participants
had by encouraging the participants to share, at any time, adverse experiences they had
while completing the survey. Other ethical procedures I adhered to included taking

90
reasonable steps to minimize the harm of research procedures by providing participants
prompt and appropriate information prior to and at the conclusion of the research study
(American Psychological Association, 2010). In sum, I adhered to ethical procedures
prior to and during the recruitment and data collection process.
Treatment of study participants and data. To ensure both the confidentiality
and anonymity of participant’s data, I reviewed the confidentiality form (see Appendix
D) with participants and then requested that they sign the confidentiality form prior to
data collection. If the confidentiality form was reviewed in the online survey form, they
clicked on the consent button prior to participating in the research study (see Appendix
D). The confidentiality form informed participants that any information they provided
would (a) be kept confidential, (b) not be used for any purposes outside of this research
project, and (c) be de-identified in the study reports. I also explained that the online
survey data (demographic questionnaire and RSMP test) would be stored on a password-
protected personal computer.
For the optional paper survey data (demographic questionnaire and RSMP test), I
informed participants that I would secure the data by coding the survey responses using
an identification number rather than their name. I also asked them to seal the survey
packet prior to submission. Furthermore, I gave participants a copy of the consent form to
keep for their records. I shared that I would keep the data for a period of at least six years
after completion of the study and then destroy it thereafter. Overall, I adhered to revised
statues while in the process of recruiting participants and collecting data (Family

91
Educational Rights and Privacy Act, 1974; Revised Statutes, 2018) for the purposes of
assuring student privacy (i.e., non-directory student information) and student
confidentiality (i.e., student collection data).
To summarize, I addressed potential threats to the results of this cross-sectional
study by (a) using the school version of a reliable and valid scientific measure, the RMP;
(b) surveying a sufficient sample of participants; and (c) selecting factor variables of
motivation and academic achievement found in prior peer-reviewed research studies to
affect first-year academic achievement: Reiss basic desires of the RMP and semester-
based cumulative GPA. I also adhered to ethical procedures prior to and during the
recruitment and data collection processes.
Chapter Summary
In review of Chapter 3, I revised the initial methodology of the dissertation study
as a result of the low rate of participants. The revised purpose of the study was to
understand which motivational factors predict academic achievement (i.e., cumulative
GPA) among community college students. An additional purpose was to determine
differences in motivational factors, among gender and age groups, in predicting
cumulative GPA. The independent variables were motivational factors, age, and gender.
The dependent variable was cumulative GPA, ranked into six ordinal groups.
I used the convenience sampling method to recruit students. I collected data using
an online survey, which included a demographic questionnaire and the RSMP survey.
Prior to and during the recruitment and data collection process, I adhered to ethical

92
procedures. As part of the data analysis plan, I used SPSS descriptive statistical
procedure methods to measure the predictor and outcome study variables and ordinal
logistic regression, an inferential statistical procedure, to test the null hypotheses. To
monitor insufficient student effort and to clean the collected data, I applied evidence-
based best practices for data screening. In Chapter 4, I summarize the descriptive
information pertaining to the participants, review the assumptions for the applied
statistical methods, and report the outcomes of the statistical analyses.
93
Chapter 4: Presentation of the Results and Findings
Introduction
The purpose of the present quantitative study was to gain a better understanding
of the motivational factors that predict academic achievement and whether the
motivational factors, along with gender and age, predict student success. This information
could aid community college administrators and class instructors in identifying effective
strategies for improving the success of students whose motivational profiles negatively
impact their GPA scores. College students could also learn how to manage motivational
drives that decrease the likelihood of obtaining a college degree.
I revised the proposed research questions (see Chapter 3: Population section).
This revision was necessary due to the low number of participants listed on academic of
probation (see Chapter 3: Population section). Instead of using a binary dependent
variable referring to academic probation group and honors group (in the original research
question) as an indicator of academic achievement, I used cumulative GPA. To examine
whether the RSMP factors, age, and gender predicted GPA level, I conducted an analysis
related to the fifteen research questions. The first 13 research questions pertained to the
individual effect of each of the RSMP scales on cumulative GPA. That is, I conducted a
bivariate analysis to examine whether the 13 RSMP factors (i.e., social contact, curiosity,
honor, family, independence, power, order, idealism, status, vengeance, exercise,
acceptance, tranquility) predicted cumulative GPA. For the 14th research question, I
conducted a multivariate analysis to examine whether the RSMP factors and gender

94
predicted academic achievement. Similarly, for the 15th research question, I examined
whether motivational factors and age predicted GPA.
Data Collection
In the following data collection sections, I describe the timeframe for data
collection, actual recruitment, and the response rates. I also discuss any deviations in data
collection from the plan presented in Chapter 3. In the participant characteristics section,
I describe the representativeness of the sample to the community college population and
any adverse events related to the intervention. In the results section, I review the study
findings of SPSS descriptive statistics and ordinal logistic regression.
Timeframe and Actual Recruitment
I collected data in the spring semester of 2019 between the months of March and
April. Four hundred and seventy-one participants accessed the online survey via the
Qualtrics (2019) link. Based on the power analysis for sample size described in Chapter
3, the minimal sample size required for a two-tailed regression analysis was 143. To
reach the sample size quota, I recruited participants during class time and through class
announcement postings and email. Class recruitment primarily included those students
registered in core courses (100-level) and remedial, developmental courses (090-level). I
selected these types of courses because they included the student population of interest
(young adults in their first year of college). Recruitment through class announcement
postings included students in the honors program and students registered in online
courses. The honors program director sent out a general announcement about the online

95
survey along with the Qualtrics URL link to the honors students. Similarly, the online
class instructors sent their students a general announcement about the online survey along
with the Qualtrics URL link.
Email recruitment included students placed on academic probation. Use of this
method was necessary to recruit the total population of students listed on academic
probation at the community college (N = 104). The interim dean of student affairs sent
out an invitational letter to students on academic probation with a Qualtrics survey link
and attached study flyer. Contacting the students in this administrative manner was in
adherence to the Family Educational Rights and Privacy Act (Family Educational Rights
and Privacy Act, 1974). This federal regulation protects the privacy of student
educational records (i.e., academic achievement, discipline files) as well as student
directory information (i.e., name, email address). Taking into consideration the various
recruitment methods, I attained the sample size necessary to run both two-tailed
regression analyses within the allotted recruitment period of two months.
Response Rates
Of the total 534 responses, I deemed 471 usable as a result of full completion.
Sixty-three responses were deemed unusable as a result of partial completion and survey
duplication in another class. The latter reason may be due to the instructors’ inclusion of
extra credit or the participant’s desire to retake the survey. Of the 471 usable cases, I
eliminated 12 cases due to missing data points and age restriction. Three participants did
not complete any of the RSMP survey questions, and nine participants marked that they
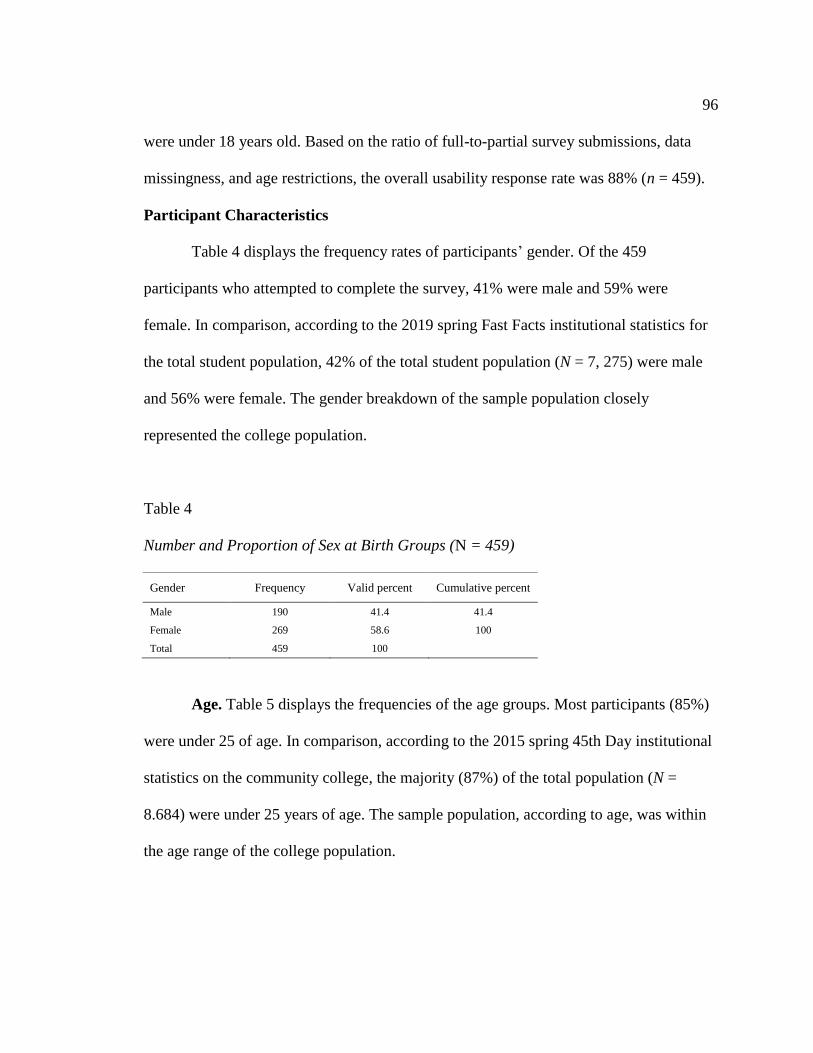
96
were under 18 years old. Based on the ratio of full-to-partial survey submissions, data
missingness, and age restrictions, the overall usability response rate was 88% (n = 459).
Participant Characteristics
Table 4 displays the frequency rates of participants’ gender. Of the 459
participants who attempted to complete the survey, 41% were male and 59% were
female. In comparison, according to the 2019 spring Fast Facts institutional statistics for
the total student population, 42% of the total student population (N = 7, 275) were male
and 56% were female. The gender breakdown of the sample population closely
represented the college population.
Table 4
Number and Proportion of Sex at Birth Groups (N = 459)
Gender Frequency Valid percent Cumulative percent
Male 190 41.4 41.4
Female 269 58.6 100
Total 459 100
Age. Table 5 displays the frequencies of the age groups. Most participants (85%)
were under 25 of age. In comparison, according to the 2015 spring 45th Day institutional
statistics on the community college, the majority (87%) of the total population (N =
8.684) were under 25 years of age. The sample population, according to age, was within
the age range of the college population.
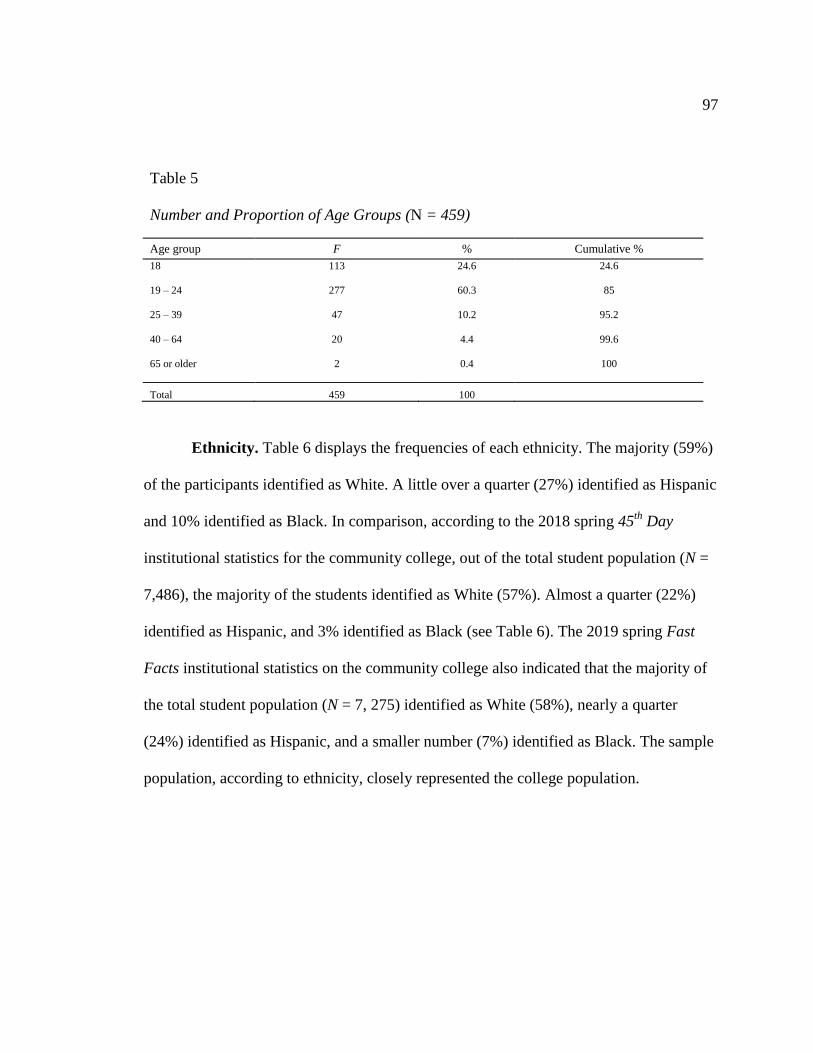
97
Table 5
Number and Proportion of Age Groups (N = 459)
Age group F % Cumulative %
18 113 24.6 24.6
19 – 24 277 60.3 85
25 – 39 47 10.2 95.2
40 – 64 20 4.4 99.6
65 or older 2 0.4 100
Total 459 100
Ethnicity. Table 6 displays the frequencies of each ethnicity. The majority (59%)
of the participants identified as White. A little over a quarter (27%) identified as Hispanic
and 10% identified as Black. In comparison, according to the 2018 spring 45th
Day
institutional statistics for the community college, out of the total student population (N =
7,486), the majority of the students identified as White (57%). Almost a quarter (22%)
identified as Hispanic, and 3% identified as Black (see Table 6). The 2019 spring Fast
Facts institutional statistics on the community college also indicated that the majority of
the total student population (N = 7, 275) identified as White (58%), nearly a quarter
(24%) identified as Hispanic, and a smaller number (7%) identified as Black. The sample
population, according to ethnicity, closely represented the college population.

98
Table 6
Number and Proportion of Ethnicity Groups (N = 459)
Sample population Total population
Race/Ethnic N % n %
White 271 59 4,289 59%
Hispanic 123 27 1,644 23%
Black 45 10 258 4%
Asian 19 4 263 4%
American Indian 13 3 90 1%
Hawaiian / Pacific Islander 3 1 8 0%
Two or more races 13 3 189 3%
Other 4 1 745 10%
Note. Groups in the 2019 Spring Sample Population (N = 459) and in the 2019 Spring 45th Day Population (N = 7,275)
at the Central Arizona Community College.
Academic class standing. In addition to the institutional information on student
gender, age, and ethnicity, Table 7 displays the frequencies of academic class standing.
The majority (65%) of the participants were in their first year of college as either first-
time students (i.e., first semester; no prior enrollment at college or university) or as
continuous students (i.e., two semesters or more). In accord with the 2019 spring Fast
Facts institutional statistics on the community college, close to three quarters (72%) of
the total student population (N = 7, 275) were in their first year of college as either first-
time students or as continuous students with limited college experience. The sample
population, according to academic class standing, closely represented the college
population.

99
Table 7
Contingency Table of Academic Class Standing by Academic Year at a Western U.S.
Community College (N=459)
Academic Class Standing Academic year (current)
Total
1st
year
2nd
year
3rd
year
> 3rd
year
Other /
unknown
High
school1
1st semester 57 0 0 0 0 0 57
2nd semester or more 242 0 0 0 0 0 242
Second-year student 0 126 0 0 0 0 126
Other 2 0 12 8 11 1 34
Total 301 126 12 8 11 1 459 1 High school students were continuing or dual enrolled students
Summary. The sample was similar to the total population of students enrolled in
a community college in the Western region of the United States. The majority of the
sample was within the age group between 18 and 24. Additionally, the majority of the
total populations were first-year students with little or no college experience. Because I
recruited students who fit the sociodemographic profile of the college population in the
spring of 2019, research inferences can be made about the student population (Banerjee
& Chaudhury, 2010).
Adverse Events
During data collection, no participants reported instances of psychological harm
or adverse events. While showing the class presentation on the purpose of the study,
several of the participants gave positive comments about (a) the international college
completion rate among young adults, (b) the White House’s 2020 college completion
goal, and (c) how the 13 Reiss motivation factors personally related to their academic
100
success. Additionally, several of the students commented on the that it didn’t take long to
complete the online survey, expressed curiosity about the PhD dissertation process, and
conveyed good wishes for the completion of my dissertation.
Results
The results section includes information on (a) the descriptive statistics of the
dependent and independent variables, (b) statistical procedures and associated
assumptions applicable to the study, and (c) data analysis results organized by significant
research questions. As to the descriptive statistics, I review the findings related to
cumulative GPA, the RSMP scales, gender, and age. As to the data analysis results for
the first 13 research questions, I used the statistical procedure of bivariate ordinal logistic
regression. For Research Questions 14 and 15, I used the statistical procedure of
multivariate ordinal logistic regression.
Descriptive Statistics
Table 8 displays the frequency and percent distribution of cumulative GPA. The
majority (57%) of the participants had an above-average cumulative GPA in the previous
semester (3.25 to 4.0). A 2017 annual report from the community college also indicated
that the majority (80%) of the participants (N = 8,684) had an above-average cumulative
GPA (3.0 to 4.0) in the 2015 fall semester. Additionally, a 2019 annual report from the
community college indicated that, across the three-year period of 2015–2018, the
percentage of grade distribution per semester was above average (3.68 to 3.76). The

101
sample appears to represent the total population in average grade distribution of 3.25 or
higher.
Table 8
Frequency and Percent Distribution of Cumulative GPA at a Western U.S. Community
College (N =446)
Cumulative GPA F Valid % Cumulative %
Less than 2.0 17 3.8 3.8
2.0 - 2,24 19 4.3 8.1
2.25 -2.74 32 7.2 15.3
2.75 – 3.24 124 27.8 43.1
3.25 – 3.74 139 31.2 74.3
3.75 – 4.0 115 25.8 100
Total 446a 100
Note: Students were asked her cumulative GPA prior to the current semester a Missing cases = 13
To assure adequate cell count (i.e., no zero values in a factor space noted in SPSS
output results) while running the SPSS ordinal logistic regression, I truncated the two
lower GPA levels: 2.00–2.24 and less than 2.00 (see Table 9).

102
Table 9
Frequency and Percent Distribution of Truncated Cumulative GPA at a Western U.S.
Community College (N =446)
Cumulative GPA f Valid % Cumulative % < 2.25 36 8.1 8.1
2.25 - 2.74 32 7.2 15.2
2.75 - 3.24 124 27.8 43.0
3.25 - 3.74 139 31.2 74.2
3.75 - 4.00 115 25.8 100.0
Total 446a 100
Note: Students were asked her cumulative GPA prior to the current semester a Missing cases = 13
RSMP scales. Table 10 displays the descriptive statistics for each of the RSMP
scales. The RSMP standard scores ranged on a Likert scale between -3 and +3. The
RSMP scale score results, on average, ranged between -.66 and 1.58. The median scale
scores ranged from -.63 to +1.63. According to Reiss (2009), the significance levels of
the RSMP scales indicate the strength (weak, average, or strong) of a basic desire. Reiss
wrote that these basic desires are drives that motivate all humans. Scale scores below -.80
indicate a weak desire, scores between -.79 and .79 indicate an average or moderate
desire, and scores greater than .80 indicate a strong desire. Table 11 shows that none of
the means of the scale scores fell into the lower range of desire. Eight of the scales had an
average score that fell in the moderate range of desire, and five of the scales had an
average score that fell into the higher range of strong desire. Together, the RSMP scales
indicated that over half (62%) of the study participants had strong motivational drives
103
related to idealism, order, family, and curiosity.
As shown in Table 10, the kurtosis values were between -0.08 and 1.04. The
skewness values were between -0.04 and 0.24. For sample sizes greater than 300,
researchers can determine deviations from normal distributions by examining the
absolute values of kurtosis and skewness. Distributions with skewness values greater than
2 and kurtosis values greater than 4 are considered to have non-normal distributions
(Mishra et al., 2019). For continuous data, the testing of normality is essential for
determining the selection of parametric and nonparametric tests (Mishra et al., 2019). As
shown in Table 10, the sample size was larger than 300 (N = 449–451), and none of the
scales had distributional values greater than the absolute values. Hence, the continuous
data (scale scores for the 13 RSMP scales) had a normal distribution and is suitable for
applying proposed correlation and regression parametric procedures.
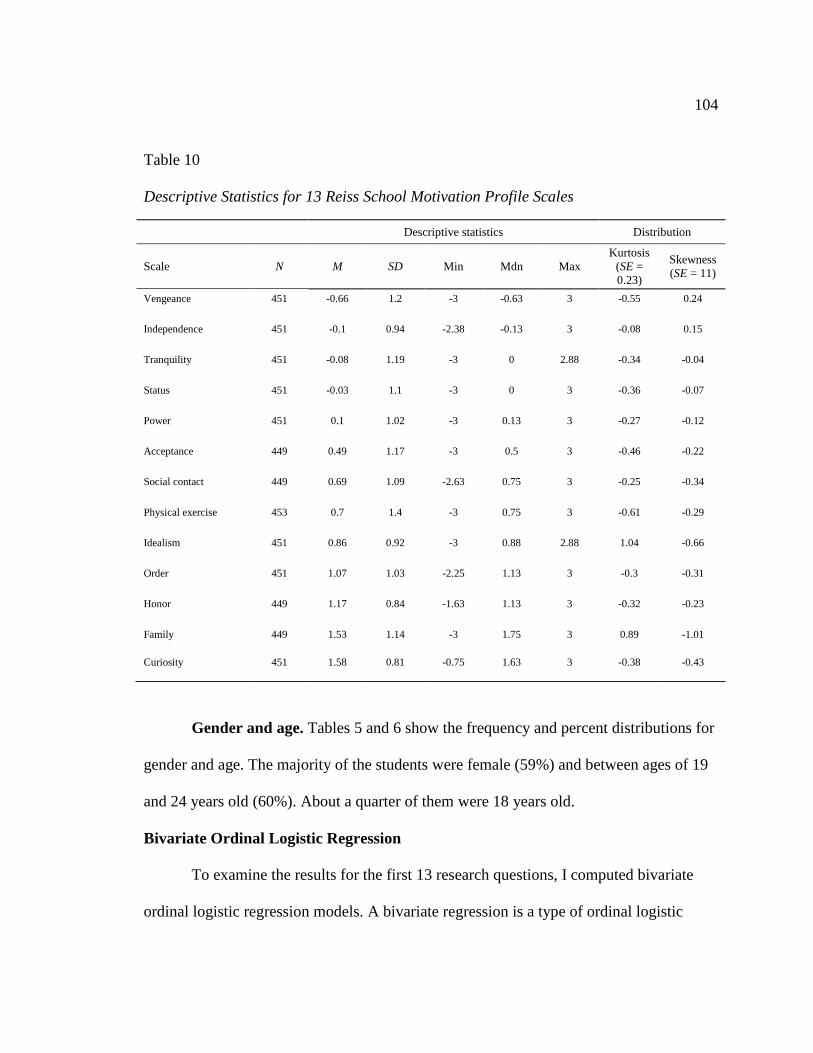
104
Table 10
Descriptive Statistics for 13 Reiss School Motivation Profile Scales
Descriptive statistics Distribution
Scale N M SD Min Mdn Max
Kurtosis
(SE =
0.23)
Skewness
(SE = 11)
Vengeance 451 -0.66 1.2 -3 -0.63 3 -0.55 0.24
Independence 451 -0.1 0.94 -2.38 -0.13 3 -0.08 0.15
Tranquility 451 -0.08 1.19 -3 0 2.88 -0.34 -0.04
Status 451 -0.03 1.1 -3 0 3 -0.36 -0.07
Power 451 0.1 1.02 -3 0.13 3 -0.27 -0.12
Acceptance 449 0.49 1.17 -3 0.5 3 -0.46 -0.22
Social contact 449 0.69 1.09 -2.63 0.75 3 -0.25 -0.34
Physical exercise 453 0.7 1.4 -3 0.75 3 -0.61 -0.29
Idealism 451 0.86 0.92 -3 0.88 2.88 1.04 -0.66
Order 451 1.07 1.03 -2.25 1.13 3 -0.3 -0.31
Honor 449 1.17 0.84 -1.63 1.13 3 -0.32 -0.23
Family 449 1.53 1.14 -3 1.75 3 0.89 -1.01
Curiosity 451 1.58 0.81 -0.75 1.63 3 -0.38 -0.43
Gender and age. Tables 5 and 6 show the frequency and percent distributions for
gender and age. The majority of the students were female (59%) and between ages of 19
and 24 years old (60%). About a quarter of them were 18 years old.
Bivariate Ordinal Logistic Regression
To examine the results for the first 13 research questions, I computed bivariate
ordinal logistic regression models. A bivariate regression is a type of ordinal logistic

105
analysis used to examine the association of a relationship between two study variables
(Bertani et al., 2018). As a member of the family of regression analyses in SPSS, the
ordinal logistic analysis determines (a) whether the independent predictor variable(s) has
a statistically significant effect on a dependent outcome variable, and (b) how well an
ordinal logistic regression model predicts the dependent variable (Laerd Statistics, 2018).
Prior to running the analysis, I examined the data to ensure there were no violations of its
assumptions. The procedure assumptions relate to the study design and how well the data
fit the ordinal regression models. After examination of the study variables, I found that
the study data met all of the relevant assumptions.
Assumptions. The first assumption of bivariate ordinal logistic regression is that
the dependent variable is measurable at the ordinal level (Laerd Statistics, 2018). The
dependent variable in my study was cumulative GPA, truncated into five ordinal groups:
(a) less than 2.25, (b) 2.25 - 2.74, (c) 2.75 - 3.24, (d) 3.25 - 3.74, and (e) 3.75 - 4.00.
The second assumption is that one or more of the independent variables is continuous or
categorical (Laerd Statistics, 2018). The independent variables RSMP factors were
continuous. The other independent variables gender and age (i.e., 18, 19-24, 25 – 39, 40 –
64, 65 or older), were nominal and ordinal variables, respectively. Thus, the data met the
first and second assumptions of bivariate ordinal logistic regression.
The third assumption is that there should be proportional odds in that each of the
independent variables should have an identical effect at each cumulative split of the
dependent variable (Laerd Statistics, 2018). One of the methods to test this assumption is

106
to run a full likelihood ratio test (i.e., test of parallel lines) using SPSS statistics (Laerd
Statistics, 2018). The SPSS procedure compares the fit of the proportional odds model to
a model with varying location parameters (Laerd Statistics, 2018). If the data meets the
proportional odds assumption, the difference in model fit (i.e., chi-square scores) between
these two models should be small and insignificant (p > .05; Laerd Statistics, 2018). If
the data does not meet the assumption of proportional odds, the difference in fit between
the models should be large and significant (p < .05; Laerd Statistics, 2018). The full
likelihood ratio test results may also flag a violation of proportional odds that does not
exist (Laerd Statistics, 2018). To further examine whether the data violated this
assumption, I ran separate binomial logistic regressions on the cumulative, dichotomous
dependent variable (Laerd Statistics, 2018).
Table 11
Test of Parallel Lines for 15 Bivariate Ordinal Logistic Regression Models
Models
Ag
e (M
1)
Sex
(M
2)
Ven
gea
nce
(M
3)
Ord
er (
M4
)
Ho
no
r (M
5)
Sta
tus
(M6
)
Cu
rio
sity
(M
7)
Ph
ysi
cal
Ex
erci
se (
M8
)
Acc
epta
nce
(M
9)
Idea
lism
(M
10
)
Tra
nq
uil
ity
(M
11
)
So
cial
Con
tact
(M
12
)
Po
wer
(M
13
)
Fam
ily
(M
14
)
Ind
epen
den
ce (
M1
5)
χ2 2.16 2.5 2.51 2.5 3.03 1.05 3.22 3.29 0.59 1.08 7.84 6.07 1.09 1.37 1.4
df 6 4 3 3 3 3 3 3 3 3 3 3 3 3 3
p 0.9 0.64 0.47 0.48 0.39 .79 0.36 0.35 0.9 0.78 0.05 0.11 0.78 0.71 0.7
To test the assumption of proportional odds, I conducted a test of parallel lines on

107
16 bivariate ordinal models (see Table 11). The results indicated that the data met the
assumption of proportional odds for fifteen of the bivariate ordinal logistic regression
models. However, the chi-square test result for the 11th model of Tranquility appeared to
be sensitive to the sample size (χ2
(df = 3) = 7.84, p = .05). To further examine whether
the data violate this assumption, I ran a separate binomial logistic regression on the
cumulative, dichotomous dependent variable of Cumulative GPA to determine whether
the odds ratios were different. The results indicated that the odds ratios ranged from 0.86
to 1.14, suggesting a possible violation of the proportional odds ratio assumption. Rather
than cautiously interpreting the results from the ordinal logistic odds model, I conducted
a binomial logistic regression to determine the effect of tranquility on cumulative GPA.
Tranquility did not have an effect on cumulative GPA (see Table 12).
The fourth assumption is that there is no occurrence of multicollinearity (i.e., a
high inter-correlation among two or more independent variables; Laerd Statistics, 2018).
Because I conducted bivariate logistic regressions with only one independent variable per
model, this assumption was not relevant.
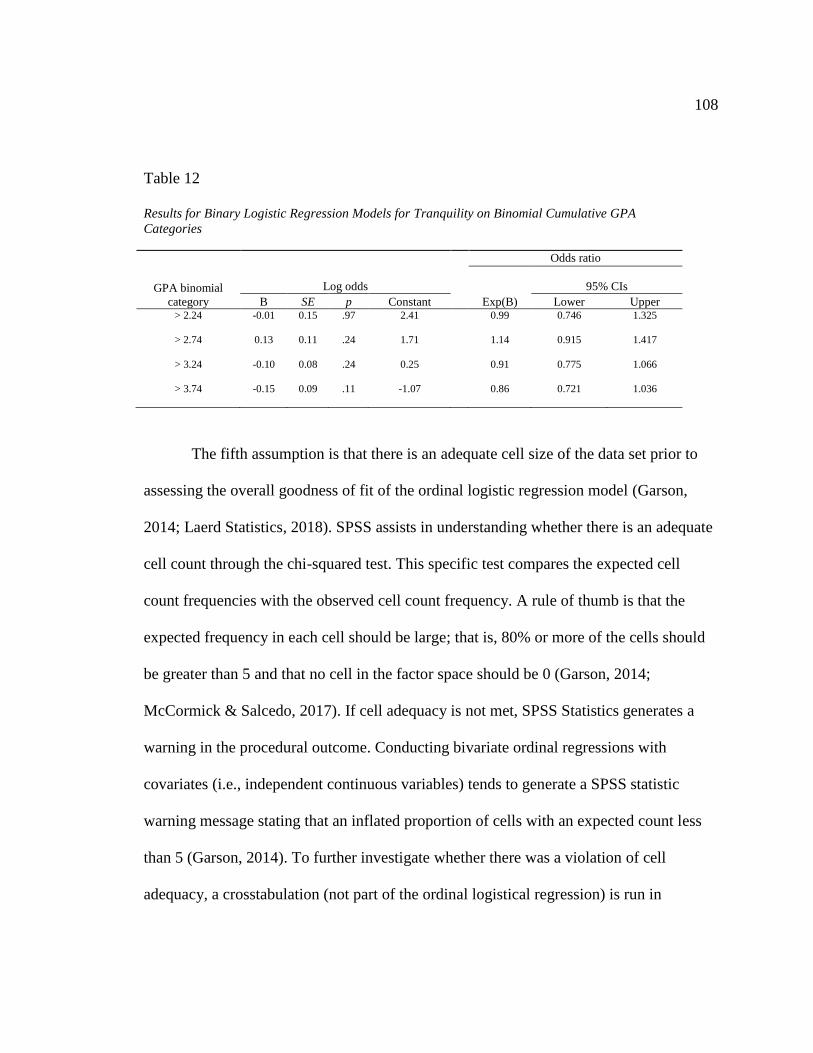
108
Table 12
Results for Binary Logistic Regression Models for Tranquility on Binomial Cumulative GPA
Categories
GPA binomial
category
Log odds
Odds ratio
Exp(B)
95% CIs
B SE p Constant Lower Upper > 2.24 -0.01 0.15 .97 2.41
0.99 0.746 1.325
> 2.74 0.13 0.11 .24 1.71
1.14 0.915 1.417
> 3.24 -0.10 0.08 .24 0.25
0.91 0.775 1.066
> 3.74 -0.15 0.09 .11 -1.07
0.86 0.721 1.036
The fifth assumption is that there is an adequate cell size of the data set prior to
assessing the overall goodness of fit of the ordinal logistic regression model (Garson,
2014; Laerd Statistics, 2018). SPSS assists in understanding whether there is an adequate
cell count through the chi-squared test. This specific test compares the expected cell
count frequencies with the observed cell count frequency. A rule of thumb is that the
expected frequency in each cell should be large; that is, 80% or more of the cells should
be greater than 5 and that no cell in the factor space should be 0 (Garson, 2014;
McCormick & Salcedo, 2017). If cell adequacy is not met, SPSS Statistics generates a
warning in the procedural outcome. Conducting bivariate ordinal regressions with
covariates (i.e., independent continuous variables) tends to generate a SPSS statistic
warning message stating that an inflated proportion of cells with an expected count less
than 5 (Garson, 2014). To further investigate whether there was a violation of cell
adequacy, a crosstabulation (not part of the ordinal logistical regression) is run in

109
Descriptive Statistics that provides information about cell adequacy in the factor table
(Garson, 2014).
Prior to examining the bivariate ordinal logistic regressions, I checked for cell
adequacy. I treated each of the independent ordinal variables (age, gender) as a “nominal
variable” and transferred them into the Factor(s) box. I treated each of the independent
ordinal variables (13 RSMP factors) as a “continuous variable” and transferred it into the
Covariate(s) box (Laerd Statistics, 2018, Procedure II: Running the Plum Procedure
section). I transferred the dependent ordinal variable (continuous GPA) into the
Dependent box. The resulting outcome generated warning messages. Since the warning
sign pertains to a factor space not missing values in the covariate space (Garson, 2014), I
ran a crosstabulation through SPSS Descriptive statistics to show the factor space table.
Before running the crosstabulation, I treated each of the independent ordinal variables
(age, gender) as a nominal variable and transferred them into the Roll (factor) box. I
transferred the dependent ordinal variable (cumulative GPA) into the Column box. The
outcome report generated no warnings; hence, the fifth assumption was met.
Overall fit of the model. To interpret the overall fit of the ordinal regression
model, SPSS Statistics provides the following measures: likelihood-ratio test, goodness-
of-fit tests, and pseudo-R2 measures. The likelihood-ratio test (i.e., Model Fit - Chi-
Square measurement) reflects the change in model fit between the full model and the
intercept-only model (Laerd Statistics, 2018; Menard, 2010). The goodness-of-fit tests
(i.e., Pearson’s Chi-Square, Deviance Chi-Square measurements) provide an overall

110
measure of whether the model fits the data well (Laerd Statistics, 2018; Menard, 2010).
The pseudo-R2 measures (i.e., Nagelkerke, McFadden) attempt to assess the predictive
capacity of the model as used in least-squares linear regression (Smith & McKenna,
2013).
In recent peer-reviewed articles, researchers have cautioned the use of common
pseudo-R2 measures for interpreting the overall fit of the ordinal regression model. They
noted the following reasons for caution: (a) the influence of study design characteristics
on pseudo-R2 estimates (Hemmert, Schons, Wieseke, & Schimmelpfennig, 2018), (b)
limited guidelines for interpretation (Smith & McKenna, 2013), and (c) the resulting
lower values across common pseudo-R2 squares measures when compared to values of
ordinary least squares found under similar conditions (Smith & McKenna, 2013). For
example, Hemmert et al. (2018) investigated the fundamental differences of seven
distinct pseudo-R2 measures and their dependence on basic study design characteristics.
The meta-analysis included 274 published logistic regression models and 24 simulation
scenarios varying in sample size (N =150, 500, or 1000).
The results of Hemmert et al.’s (2018) study indicated that almost all pseudo-R2
squares measures were influenced by sample size, number of predictor variables, number
of dependent variable categories, and its distribution asymmetry. Furthermore, the values
of the different pseudo-R2 measures varied significantly. When comparing different
regression models on the study data, the pseudo-R2 measures were directly affected by

111
the number of independent variables in the model. Recommendations included the
rejection of the use of McFadden’s benchmark values for sample sizes larger than 200.
Current research, SPSS statistical tutorials, and statistical guides on logistic
regression cite additional reasons for the cautionary use of pseudo-R2 square measures.
These reasons included the notion that the measures are: (a) not a good criterion (Akin &
Şenturk, 2012; Bozpolat, 2016; Laerd Statistics, 2018), (b) not universally valued (Laerd
Statistics, 2018), (c) lead to confusing interpretations and unclear reporting (Hemmert et
al., 208), and (d) inconclusive in peer-review literature (Osborne, 2015). When pseudo-R2
measures are low, researchers interpreted the overall fit of the ordinal regression model
using the likelihood-ratio test and goodness-of-fit tests (Akin & Şenturk, 2012; Bozpolat,
2016). Guided by recent research and updated SPSS statistical tutorials, I used the
likelihood-ratio test and goodness-of-fit tests to interpret the overall fit of the ordinal
regression models. This aligns with Coe’s (2002) recommendation to use reliable,
universally accepted measures to determine the strength of a relationship between two
variables.
Results. I conducted a series of bivariate ordinal logistic regressions to determine
whether the RSMP factors, age, and gender predicted different cumulative GPA level (as
noted in the 15 research questions). Table 13 displays the significant results.
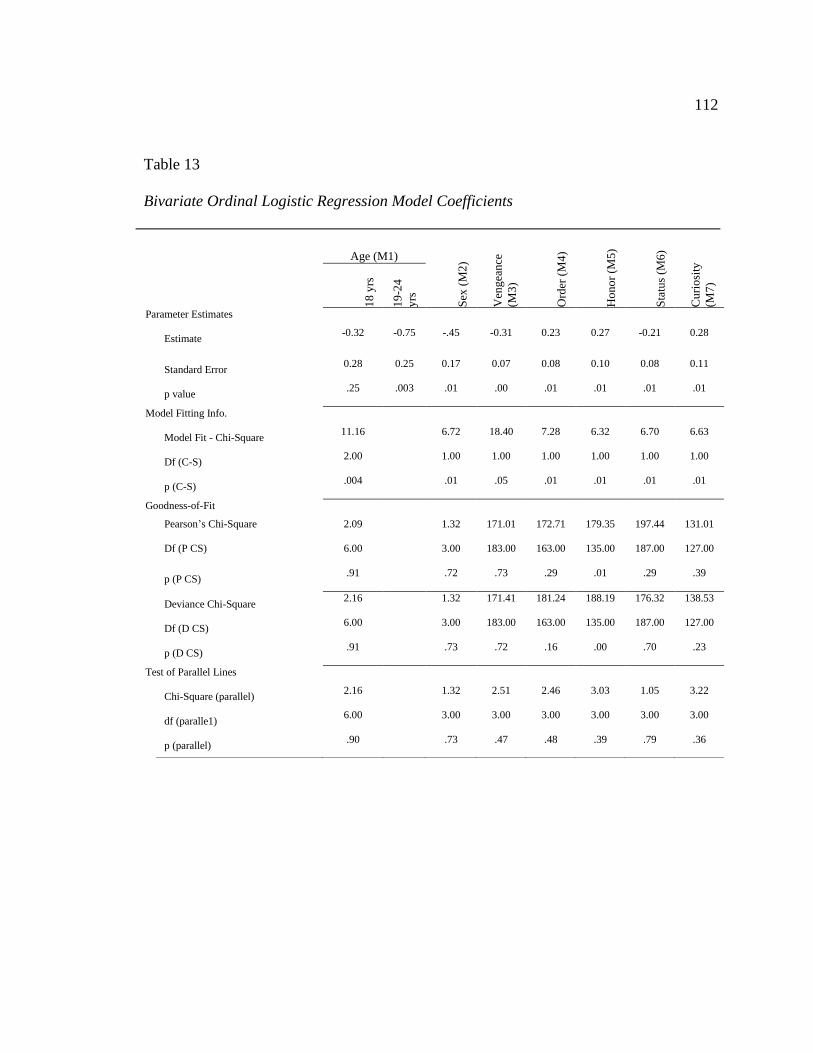
112
Table 13
Bivariate Ordinal Logistic Regression Model Coefficients
Age (M1)
Sex
(M
2)
Ven
gea
nce
(M3
)
Ord
er (
M4
)
Ho
no
r (M
5)
Sta
tus
(M6
)
Cu
rio
sity
(M7
)
18
yrs
19
-24
yrs
Parameter Estimates
Estimate
-0.32 -0.75 -.45 -0.31 0.23 0.27 -0.21 0.28
Standard Error 0.28 0.25 0.17 0.07 0.08 0.10 0.08 0.11
p value
.25 .003 .01 .00 .01 .01 .01 .01
Model Fitting Info.
Model Fit - Chi-Square
11.16
6.72 18.40 7.28 6.32 6.70 6.63
Df (C-S)
2.00
1.00 1.00 1.00 1.00 1.00 1.00
p (C-S)
.004 .01 .05 .01 .01 .01 .01
Goodness-of-Fit
Pearson’s Chi-Square 2.09
1.32 171.01 172.71 179.35 197.44 131.01
Df (P CS) 6.00
3.00 183.00 163.00 135.00 187.00 127.00
p (P CS)
.91 .72 .73 .29 .01 .29 .39
Deviance Chi-Square
2.16
1.32 171.41 181.24 188.19 176.32 138.53
Df (D CS)
6.00
3.00 183.00 163.00 135.00 187.00 127.00
p (D CS)
.91 .73 .72 .16 .00 .70 .23
Test of Parallel Lines
Chi-Square (parallel)
2.16
1.32 2.51 2.46 3.03 1.05 3.22
df (paralle1)
6.00
3.00 3.00 3.00 3.00 3.00 3.00
p (parallel)
.90 .73 .47 .48 .39 .79 .36
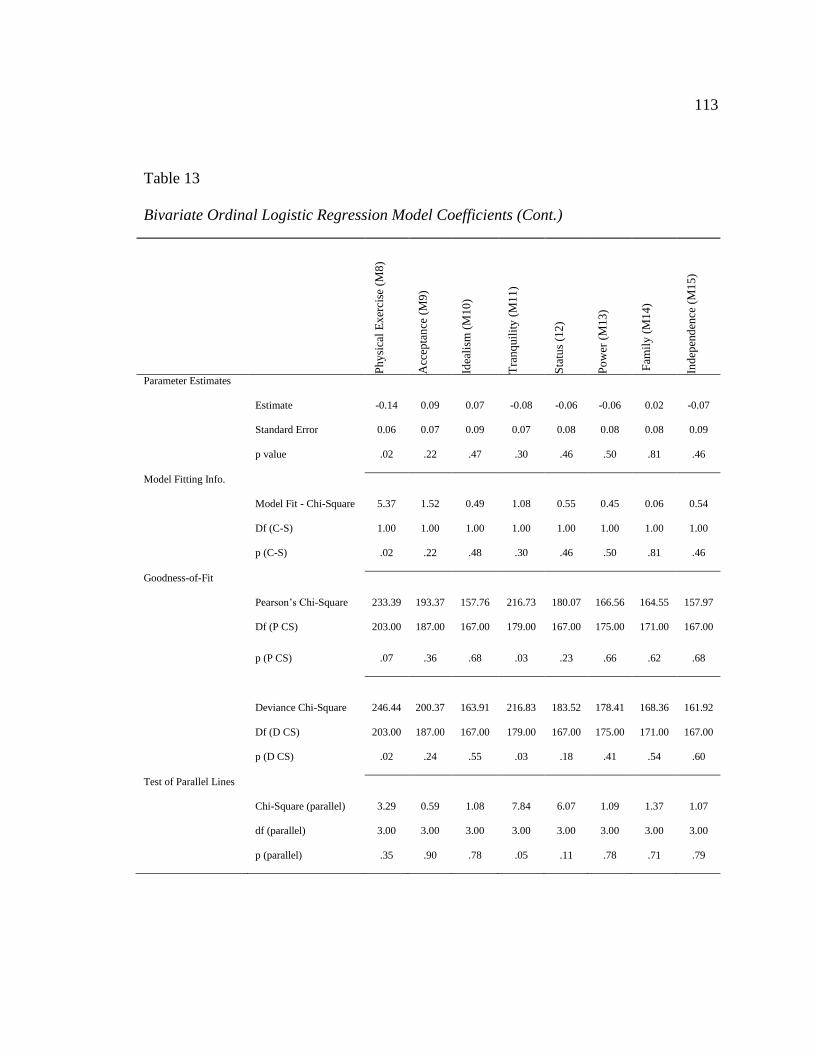
113
Table 13
Bivariate Ordinal Logistic Regression Model Coefficients (Cont.)
Ph
ysi
cal
Ex
erci
se (
M8
)
Acc
epta
nce
(M
9)
Idea
lism
(M
10
)
Tra
nq
uil
ity
(M
11
)
Sta
tus
(12
)
Po
wer
(M
13
)
Fam
ily
(M
14
)
Ind
epen
den
ce (
M1
5)
Parameter Estimates
Estimate -0.14 0.09 0.07 -0.08 -0.06 -0.06 0.02 -0.07
Standard Error 0.06 0.07 0.09 0.07 0.08 0.08 0.08 0.09
p value .02 .22 .47 .30 .46 .50 .81 .46
Model Fitting Info.
Model Fit - Chi-Square 5.37 1.52 0.49 1.08 0.55 0.45 0.06 0.54
Df (C-S) 1.00 1.00 1.00 1.00 1.00 1.00 1.00 1.00
p (C-S) .02 .22 .48 .30 .46 .50 .81 .46
Goodness-of-Fit
Pearson’s Chi-Square 233.39 193.37 157.76 216.73 180.07 166.56 164.55 157.97
Df (P CS) 203.00 187.00 167.00 179.00 167.00 175.00 171.00 167.00
p (P CS) .07 .36 .68 .03 .23 .66 .62 .68
Deviance Chi-Square 246.44 200.37 163.91 216.83 183.52 178.41 168.36 161.92
Df (D CS) 203.00 187.00 167.00 179.00 167.00 175.00 171.00 167.00
p (D CS) .02 .24 .55 .03 .18 .41 .54 .60
Test of Parallel Lines
Chi-Square (parallel) 3.29 0.59 1.08 7.84 6.07 1.09 1.37 1.07
df (parallel) 3.00 3.00 3.00 3.00 3.00 3.00 3.00 3.00
p (parallel) .35 .90 .78 .05 .11 .78 .71 .79

114
Research Question 2. The null hypothesis for RQ 2 stated that the RSMP factor
of curiosity would not predict different levels of GPA. Given the ordinal logistic
regression results, I rejected the null hypothesis. Increases in participants’ need for
curiosity was modestly associated with increases in the odds of GPA, with an odds ratio
of 1.32, 95% CI [1.073 to 1.627], Wald χ2
(1) = 6.86, p < .01. Moreover, the model was
consistent with the observed data, Pearson χ2
= 131.02, p = .39; Deviance χ2 = 138.53, p =
.23. The results suggested that students with a strong desire for intellectual understanding
were likely to have a higher GPA than those with a weaker desire for deep thinking.
Research Question 3. The null hypothesis for RQ 3 stated that the RSMP factor
of honor would not predict different levels of GPA. Given the ordinal logistic regression
results, I rejected the null hypothesis. An increase in participants’ need for honor or
integrity was modestly associated with an increase in the odds of GPA, with an odds ratio
of 1.30, 95% CI [1.064to 1.304], Wald χ2 (1) = 6.51, p <.01. The results suggested that
students with a strong desire for an upright character were likely to have a higher GPA
than those with a weaker desire for integrity. However, the model was not consistent with
the observed data, Pearson χ2 = 179.35, p < .05; deviance χ
2 = 188.19, p < .01.
Research Question 7. The null hypothesis for RQ 7 stated that the RSMP factor
of order would not predict different levels of GPA. Given the ordinal logistic regression
results, I rejected the null hypothesis. An increase in participants’ need for order was
modestly associated with an increase in the odds of GPA, with an odds ratio of 1.26, 95%
CI [1.064 to 1.481], Wald χ2 (1) = 7.24, p < .01. Moreover, the model was consistent with

115
the observed data, Pearson χ2 = 172.71, p = .29; deviance χ
2 = 181.24, p = .16. The results
suggested that students with a strong desire for organization were likely to have a higher
GPA than those with a weaker desire for organization.
Research Question 9. The null hypothesis for RQ 9 stated that the RSMP factor
of status would not predict different levels of GPA. Given the ordinal logistic regression
results, I rejected the null hypothesis. An increase in participants’ need for social status
was modestly associated with a decrease in the odds of GPA, with an odds ratio of 0.81,
95% CI [0.697 to 0.948], Wald χ2 (1) = 6.99, p < .01. Moreover, the model was consistent
with the observed data, Pearson χ2 = 197.44, p = .29; deviance χ
2 = 176.32, p = .70. The
results suggested that students with a strong desire for respect based on social standing
were likely to have a lower GPA than those with a weaker desire for status.
Research Question 10. The null hypothesis for RQ 10 stated that the RSMP
factor of vengeance would not predict different levels of GPA. Given the ordinal logistic
regression results, I rejected the null hypothesis. An increase in participants’ need for
vengeance was modestly associated with a decrease in the odds of GPA, with an odds
ratio of 0.74, 95% CI [0.636 to 0.848], Wald χ2
(1) = 17.77, p <.00. Moreover, the model
was consistent with the observed data, Pearson χ2
= 171.01, p = .73; deviance χ2 = 171.41,
p = .72. The results suggested that students with a strong desire to confront those who
offend were likely to have lower GPAs than those with a weaker desire for confrontation.
Research Question 11. The null hypothesis for RQ 11 stated that the RSMP
factor of physical exercise would not predict different levels of GPA. Given the ordinal

116
logistic regression results, I rejected the null hypothesis. A decrease in participants’ need
for physical exercise was modestly associated with a decrease in the odds of GPA, with a
odds ratio of 0.87, 95% CI [0.77 to 0.981), Wald χ2
(df = 1) = 5.18, p < .02. The results
suggested that students with a strong desire for physical exercise were less likely to have
a higher GPA than those with a weaker desire for physical activity. However, the model
may not be consistent with the observed data, Pearson χ2
= 233.39, p = .07; deviance χ2 =
246.44, p < .05.
Conclusion. The results of the bivariate ordinal logistical regression indicated
that, among the RSMP scales, six of the variables (curiosity, honor, order, status,
vengeance, and physical exercise) were significantly associated with cumulative GPA
with a small effect size. Moreover, according to the goodness-of-fit indices, four of the
RSMP scales (curiosity, order, status, and vengeance) were consistent with the observed
data. To determine the effects of the RSMP scales (significant at the bivariate level),
gender, and age on cumulative GPA, I conducted a series of multivariate ordinal logistic
regressions with proportional odds.
Multivariate Ordinal Logistic Regression
To examine the results for Research Questions 14 and 15, I computed multivariate
ordinal logistic regression models. Multivariate logistic regression analysis is an
extension of the bivariate ordinal logistic regression in which two or more independent
variables are taken into consideration simultaneously to predict the ordinal
(dichotomized) dependent variable (Liu, 2018). The multivariate ordinal logistic

117
regression in the present study included the demographic variables of gender and age, as
well as six of the RSMP independent variables (curiosity, honor, order, status, vengeance,
and physical exercise) found to significantly associate with cumulative GPA. Prior to
running the analysis, I examined the data to ensure there were no violations of its
assumptions. The procedure assumptions relate to the study design and how well the data
fit the ordinal regression models. After examination of the study variables, I determined
that the study data met all of the relevant assumptions.
Assumptions. Multivariate ordinal logistic regression includes the same five
assumptions previously described for bivariate ordinal logistic regression. The first two
assumptions were met as follows: (a) the dependent variable, cumulative GPA, was
measured at the ordinal level, (b) age and gender were treated as categorical, and (c) the
13 RMSP scales were treated as continuous. To test the third assumption of
multicollinearity, I conducted a SPSS collinearity diagnostic test. The results indicated
that both the tolerance and variance inflation factor (VIF) values were well within the
acceptable range (see Table 14).

118
Table 14
Multicollinearity Assumption Test on Independent Variables
Independent variables
Collinearity statistics
Tolerance VIF 19–24 years 0.443 2.256
Gender 0.821 1.219
Curiosity 0.673 1.485
Honor 0.567 1.764
Order 0.699 1.431
Status 0.582 1.718
Vengeance 0.71 1.408
Physical exercise 0.682 1.466
Note: a. Dependent variable: Cumulative GPA
Tolerance values greater than 0.1 and variance inflation factor (VIF) value of 10 indicates there were no violations of multi-collinearity.
To test the fourth assumption of proportional odds, I conducted a parallel test for
the two sets of multivariate ordinal logistic regressions. The results indicated that the
assumption of proportional odds was met because the difference in model fit between
these two models was small and insignificant (see Table 15).
Table 15
Test of Parallel Lines for Multivariate Ordinal Logistic Regression Models
Models
Female
(R.Q. 14)
With age
(R.Q. 15)
Model 16
(7 I.V.s)
Model 17
(5 I.V.s)
Model 18
(7 I.V.s)
Model 19
(5 I.V.s)
χ2 18.63 13.89
19.69 13.32
df 21 15
24 18
p .61 .53
.71 .77

119
To test the fifth assumption, I conducted a series of multivariate ordinal logistic
regressions. Based on recent research and up-to-date SPSS statistical tutorials, I used the
likelihood-ratio test and goodness-of-fit tests to interpret the overall fit of the ordinal
regression models (for additional information please see the dissertation section: Overall
fit of the bivariate ordinal regression model). Prior to examining the multivariate ordinal
logistic regressions, I checked for cell adequacy. I treated the independent ordinal
variables (age, gender) as nominal variables and transferred them into the Factor(s) table.
I treated the five independent ordinal variables (RSMP factors; curiosity, honor, order,
status, and vengeance) as continuous variables and transferred them into the Covariate(s)
table. I also transferred the dependent ordinal variable (continuous GPA) into the
Dependent box. The resulting outcome generated warning messages for the bivariate
ordinal logistic regressions ran with a (covariate) RSMP factor.
Because the warning sign pertained to the factor space and not missing values in
the covariate space (Garson, 2014), I ran a crosstabulation through SPSS Descriptive
Statistics. Before conducting the crosstabulation, I treated the independent ordinal
variables (age, gender) as nominal variables and transferred them into the Roll (factor
table) box. I also transferred the dependent ordinal variable (cumulative GPA) into the
Column box. The outcome report generated no warnings; hence, the fifth assumption was
met. Overall, all the relevant assumptions of the multivariate ordinal logistic regression
were met.

120
Overall fit of the model. Based on current research and updated SPSS statistical
tutorials on ordinal logistic regression, I used the likelihood-ratio test and goodness-of-fit
tests to interpret the overall fit of the multivariate ordinal regression models. For further
information, please see (Bivariate ordinal logistic section: Assumptions: Overall fit of the
model).
Results. I conducted a set of multivariate ordinal logistic regressions with
proportional odds to determine the effect of the RSMP scales (that were significant at the
bivariate level), gender, and age on cumulative GPA. Table 16 provides the results for the
regression models. Model 16 shows the effect of gender and RSMP scales on cumulative
GPA. Model 17 shows the effect of age and RSMP scales on cumulative GPA.

121
Research Question 14. The null hypothesis for RQ 14 stated that gender and RSMP
factors would not predict different levels of GPA. According to the full likelihood ratio
tests (test of parallel lines), the proportional odds for Model 16 was χ2 (df = 21) = 18.63,
p = .61.
Table 16
Bivariate and Multivariate Ordinal Logistic Regression Model Coefficients
Bivariate Model 1-15
Multivariate Models
With Female With Age
Model 16 Model 17
B SE B SE B SE
Female -.45* .17 -.27 .19 N/A N/A
Age (18 yrs) -.32 .28 N/A N/A -0.08 0.30
Age (19 to 24 yrs) -.75** .25 N/A N/A -.49 .26
Vengeance -.31** .07 -.22** .08 -.23** .08
Order .23** .08 .21* .1 .26** .1
Honor .27* .1 .13 .13 .08 .13
Status -.21** .08 -.11 .09 -.11 .09
Curiosity .28** .11 .22 .12 .2 .12
Physical Exercise -.14* .28 -.16* .07 -.16* .07
Model Fit - χ2 4.71 44.47
df (C-S) 7 8
p (C-S) 0.001 0.001
Pearson’s χ2 1741.21 1729.51
df (P CS) 1733 1732
p (P CS) 0.44 0.51
Deviance χ2 1237.6 1233.84
df (D CS) 1733 1732
p (D CS) 1 1
Nagelkerke R2Pseudo 0.09 0.1
McFadden R2pseudo 0.03 0.04
*p < .05 (2-tailed), **p < .01 (2-tailed), ***p < .001
N / A: not applicable, i.e., model does not include these variables.

122
As a precursor for conducting the multivariate analysis, I examined the bivariate
relationships between gender and academic achievement. The odds for females on
cumulative GPA were less than the odds for males (odds ratio of 0.64, 95% CI [0.454 to
0.898), Wald χ2
(df = 1) = 6.67, p < .01). This model was consistent with the observed
data (Pearson χ2
= 1.32, p = .72; deviance χ2 = 1.32, p = .73). The results suggested that
males were likely to have a higher cumulative GPAs than females.
Given the multivariate ordinal logistic regression results, I partially rejected the
null hypothesis for Research Question 14 (see Table 16). With Model 16, I examined the
effects of gender and RSMP scales (that were significant at the bivariate level) on
cumulative GPA. The model fit significantly predicted over and above the intercept-only
model, χ2
(df = 7) = 4.71, p < .001. Moreover, the deviance goodness-of-fit test indicated
that the model was a good fit to the observed data, χ2
(df = 1733) = 1237.60, p = 1.0.
The results suggested that odds of females were similar to that of males (odds
ratio of .85, 95% CI [0.75, 0.97], Wald χ2 (1) = 2.13, p = .145. However, there was a
modest, yet significant relationship between GPA and three RMSP scales (vengeance,
order, and physical exercise). Order was positively related to cumulative GPA. An
increase in participants’ need for order was associated with an increase in the odds of
cumulative GPA (odds ratio of 1.23, 95% CI [1.01 to 1.49], Wald χ2
(1) = 4.30, p < .04).
The results suggested that students with a strong desire for structure were likely to have a
higher GPA than those with a weaker desire for organization.
Vengeance and physical exercise were inversely related to cumulative GPA. An

123
increase in participants’ need for vengeance was modestly associated with a decrease in
the odds of cumulative GPA (odds ratio of .81, 95% CI [0.69 to 0.95], Wald χ2
(1) = 7.02,
p < .01). The results suggested that students who had a strong desire to confront those
who offend were likely to have a lower cumulative GPA than those with a weaker desire
for confrontation. An increase in participants’ need for physical exercise was associated
with a decrease in the odds of GPA (odds ratio of 0.85, 95% CI [0.75 to 0.97], Wald χ2
(1) = 5.46, p < .02). The results suggest that students with a strong desire for physical
activity are likely to have a lower cumulative GPA than those with a weaker desire for
exercise.
Overall, the results of the multivariate ordinal logistic regression partially
supported the alternative hypothesis for RQ 14. The results indicated that there was a
modest, yet significant relationship between cumulative GPA and three RMSP scales
(vengeance, order, and physical exercise) but not between GPA and gender.
Research Question 15. The null hypothesis for RQ 15 stated that age and RSMP
factors would not predict different levels of GPA. According to the full likelihood ratio
tests, the proportional odds for Model 17 was χ2
(df =24) = 19.69, p = .71.
As a precursor for conducting the multivariate analysis, I examined the bivariate
relationships between age and academic achievement. The odds of 18-year-old students
on cumulative GPA was similar to the odds for students older than 24 (odds ratio of 0.72,
95% CI [0.416 to 1.26] Wald χ21.304, p = .25). The odds for students between 19 and 24
years were lower than older students (odds ratio of 0.474, 95% CI [0.291 to 0.772], Wald

124
χ2
(df = 1) = 11.16, p < .004). Moreover, the model was consistent with the observed data
(Pearson χ2
= 2.09, p = .91; deviance χ2 = 2.16, p = .91).The results suggested that
students 25 years or older were likely to have a higher cumulative GPA than students
between 19 and 24 years.
Given the multivariate ordinal logistic regression results, I partially rejected the
null hypothesis for Research Question 15 (see Table 16). With Model 17, I examined the
effect of age and RSMP scales (that were significant at the bivariate level) on cumulative
GPA. The model fit was significantly greater over and above the intercept-only model (χ2
(df = 8) = 44.47, p < .001). Additionally, the deviance goodness-of-fit test indicated that
the model was a good fit to the observed data, χ2
(df = 1732) = 1233.84, p = 1.0.
The results indicated that the odds of 18 year old students (odds ratio of 0.92,
95% CI [0.514 to 1.646], Wald χ2
(1) = 0.08, p = 0.78) and 19 to 24 year old students
(odds ratio of 0.62, 95% CI [0.37 to 1.025], Wald χ2
(1) = 3.48, p = .06) were similar to
students 25 years and older (see Table 16). However, there was a modest, yet significant
relationship between cumulative GPA and three of the RMSP scales (vengeance, order,
and physical exercise).
Order was positively related with cumulative GPA. An increase in participants’
need for order was modestly associated with an increase in the odds of cumulative GPA
(odds ratio of 1.30, 95% CI [1.073 to 1.561], Wald χ2
(1) = 7.29, p < .01). The results
suggest that students with a strong desire for structure are likely to have higher
cumulative GPAs than those with a weaker desire for organization.
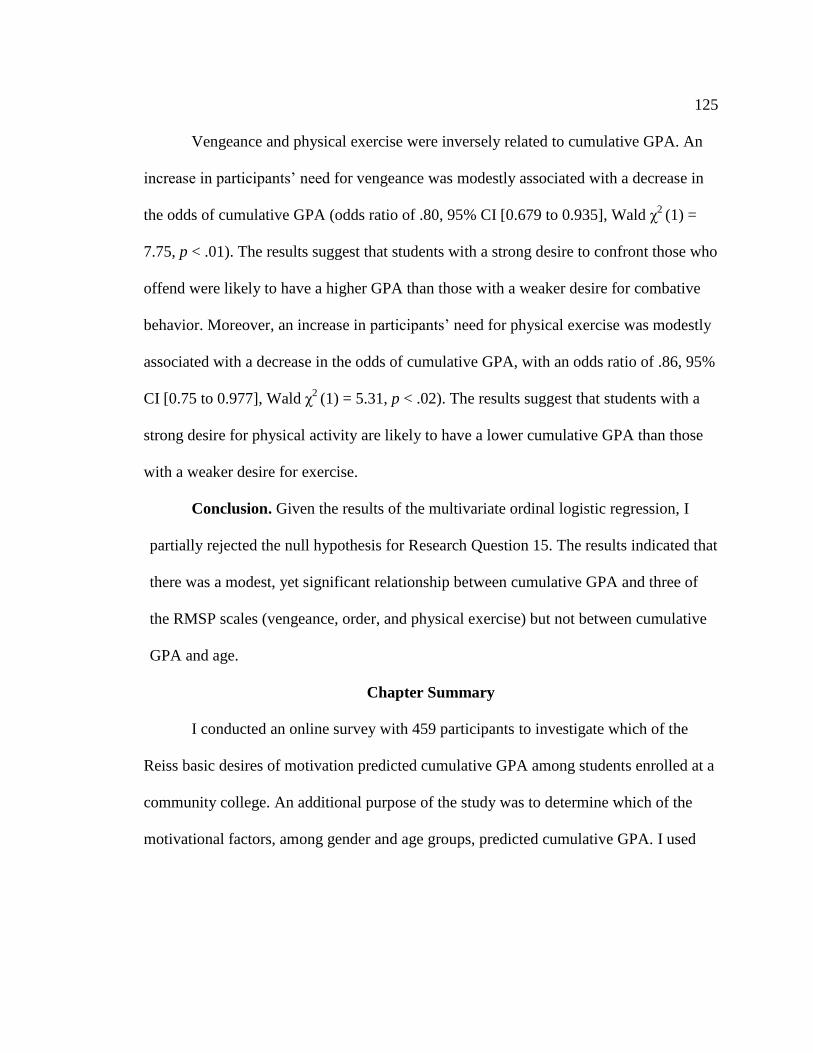
125
Vengeance and physical exercise were inversely related to cumulative GPA. An
increase in participants’ need for vengeance was modestly associated with a decrease in
the odds of cumulative GPA (odds ratio of .80, 95% CI [0.679 to 0.935], Wald χ2
(1) =
7.75, p < .01). The results suggest that students with a strong desire to confront those who
offend were likely to have a higher GPA than those with a weaker desire for combative
behavior. Moreover, an increase in participants’ need for physical exercise was modestly
associated with a decrease in the odds of cumulative GPA, with an odds ratio of .86, 95%
CI [0.75 to 0.977], Wald χ2
(1) = 5.31, p < .02). The results suggest that students with a
strong desire for physical activity are likely to have a lower cumulative GPA than those
with a weaker desire for exercise.
Conclusion. Given the results of the multivariate ordinal logistic regression, I
partially rejected the null hypothesis for Research Question 15. The results indicated that
there was a modest, yet significant relationship between cumulative GPA and three of
the RMSP scales (vengeance, order, and physical exercise) but not between cumulative
GPA and age.
Chapter Summary
I conducted an online survey with 459 participants to investigate which of the
Reiss basic desires of motivation predicted cumulative GPA among students enrolled at a
community college. An additional purpose of the study was to determine which of the
motivational factors, among gender and age groups, predicted cumulative GPA. I used

126
SPSS ordinal logistic regression to determine the bivariate relationship between the study
variables.
The sample was similar to the total population of students enrolled in a
community college in the western region of the United States. Across demographic
groups, the majority was representative of both genders and represented the age group
between 18 and 24. The descriptive statistics indicated the majority of the sample was
first-year students with little or no college experience. Over half of the participants had
an above-average cumulative GPA between 3.25 and 4.00 in previous semesters. Because
I recruited students who fit the current sociodemographic profile of the college
population, research inferences can be made about the student population.
The independent variables in the proposed study were Reiss motivational factors,
age, and gender. The motivation factors referred to the 13 empirically-derived factor
scales of the standardized school measurement tool derived from the RSMP. The
qualifying age groups included the following: 18, 19 to 24, 25 to 39, 40 to 64, and 65
years or older. The dependent variable was cumulative GPA, ranked into six ordinal
groups: (a) less than 2.0, (b) 2.0 - 2.24, (c) 2.25 -3.74, (d) 2.75 – 3.24, (e) 3.25 - 2.74, and
(f) 3.75 - 4.00.
The bivariate ordinal logistic regression results indicated that six of the RSMP
variables (curiosity, honor, order, status, vengeance, and physical exercise) had a modest,
yet significant association with cumulative GPA. Moreover, four of the RSMP scales
(curiosity, order, status, and vengeance) were consistent with the observed data,

127
according to the goodness-of-fit indices. Among the demographic variables, age (19 -
24), and gender (males) had a modest, yet significant association with cumulative GPA.
The multivariate ordinal logistic regression results indicated that there was not a
significant relationship between cumulative GPA, gender, and age. However, there was a
modest, yet significant relationship between cumulative GPA and three of the RMSP
scales (vengeance, order, and physical exercise). In Chapter 5, I discuss the
interpretations, limitations, recommendations, and implications of the study results.

128
Chapter 5: Discussion, Conclusions, and Recommendations
Introduction
In Chapter 5, I summarize the purpose, key findings, interpretations, limitations,
recommendations, and implications of the study results. In the interpretation section, I
describe how the study results confirm and extend the findings in the peer-reviewed
literature on motivation and academic achievement. In the limitation section, I explain the
study weaknesses related to the validity, reliability, and generalization of the study
findings. In the recommendation section, I offer suggestions for future research on the
influence of motivation on academic achievement. In the study implication section, I
describe how the study findings can impact positive social change and ways to implement
that change.
Study Purpose
The purpose of the quantitative cross-sectional study was to better understand
which of the Reiss (2013) basic desires of motivation predict undergraduate academic
achievement. An additional purpose was to determine which basic desires of motivation,
among gender and age groups, predict cumulative GPA. Taking into consideration
research on motivation as a predictor of academic achievement, researchers have
suggested further investigation into what type of intrinsic motivational factors account for
different levels of GPA scores among undergraduate students (Campbell & Fuqua, 2008;
Gershenfeld et al., 2015). I designed this dissertation study to fill this research gap.

129
Key Findings
The bivariate ordinal logistic regression results indicated a modest, yet significant
relationship between four of the Reiss motivation factors (curiosity, order, status, and
vengeance) and cumulative GPA. A modest relationship, as reported in peer-reviewed
research articles (Di Lorenzo et al., 2014; Fitzpatrick & Burns, 2019; Glanville et al.,
2020; Wen & Yeh, 2014), refers to a small or low-level effect or a weak association when
the odds-ratio is less than 1.5, but not equal to 1.0 (Chen, et. al., 2010). As the values of
odds ratio move away from 1.0, the relationship becomes stronger (Cohen, 1992a;
Salgado, 2018). Hence, interpretation of the results should be cautious. The results
suggest that students with a higher need (or desire) for curiosity and order (organization)
are likely to have a higher cumulative GPA than students with a lower desire.
Conversely, students with a high desire for social status and vengeance are likely to have
a lower cumulative GPA than those with a weaker desire.
When I examined age or gender with the aforementioned variables, three of the
RSMP scales—but not gender or age—had a modest, yet significant relationship with
academic achievement. The results suggest that students with a strong desire for
organization are likely to have a higher cumulative GPAs than those with a weaker
desire. Furthermore, those with a strong desire for vengeance and physical exercise are
likely to have a lower cumulative GPAs than those with a higher desire. Overall, the
results indicated a modest relationship between cumulative GPA and the RSMP factors of
order, status, and vengeance but not between cumulative GPA and gender or age.
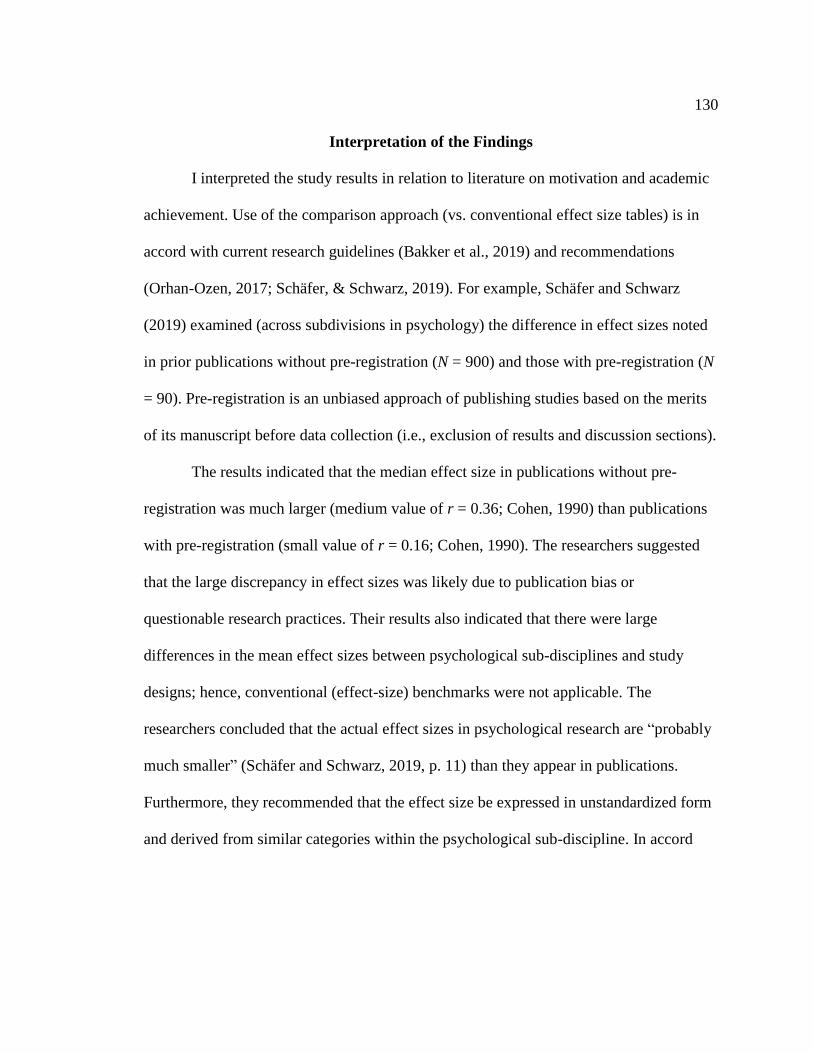
130
Interpretation of the Findings
I interpreted the study results in relation to literature on motivation and academic
achievement. Use of the comparison approach (vs. conventional effect size tables) is in
accord with current research guidelines (Bakker et al., 2019) and recommendations
(Orhan-Ozen, 2017; Schäfer, & Schwarz, 2019). For example, Schäfer and Schwarz
(2019) examined (across subdivisions in psychology) the difference in effect sizes noted
in prior publications without pre-registration (N = 900) and those with pre-registration (N
= 90). Pre-registration is an unbiased approach of publishing studies based on the merits
of its manuscript before data collection (i.e., exclusion of results and discussion sections).
The results indicated that the median effect size in publications without pre-
registration was much larger (medium value of r = 0.36; Cohen, 1990) than publications
with pre-registration (small value of r = 0.16; Cohen, 1990). The researchers suggested
that the large discrepancy in effect sizes was likely due to publication bias or
questionable research practices. Their results also indicated that there were large
differences in the mean effect sizes between psychological sub-disciplines and study
designs; hence, conventional (effect-size) benchmarks were not applicable. The
researchers concluded that the actual effect sizes in psychological research are “probably
much smaller” (Schäfer and Schwarz, 2019, p. 11) than they appear in publications.
Furthermore, they recommended that the effect size be expressed in unstandardized form
and derived from similar categories within the psychological sub-discipline. In accord

131
with Schäfer and Schwarz’s recommendation, I compare the dissertation results in the
next section with prior literature on the effect of motivation on academic achievement.
Small Effect of Motivation on Academic Achievement
In a recent meta-analysis, Orhan-Ozen (2017) examined the effect size of
motivation on academic achievement in 205 studies published between 2010 and 2015.
Moderator variables included the publication year and type, the country (culture), school
subject, and sample groups. The results indicated a low-level (r = .27) positive
relationship between motivation and academic achievement. Additionally, Orhan-Ozen
found that all the moderator variables significantly affected the effect size of motivation
on academic achievement.
Orhan-Ozen (2017) concluded that, although there was a low-level effect of
motivation on academic achievement, the results supported prior literature findings that
there is a relationship between motivation and academic achievement and that motivation
plays an important role in academic achievement. Based on the researcher’s conclusion, it
appears that, although there was a modest (i.e., odds ratio of 1.1 to 1.5) effect of
motivation on academic achievement in the dissertation study, the results support the
empirically-accepted argument in literature that motivation plays an important role on
academic achievement (Gharghani, Gharghani, & Hayat, 2019; Muwonge, Schiefele,
Ssenyonga, & Kibedi, 2019; Vanslambrouck, Zhu1, Pynoo, Lombaerts, & Tondeur,
2017). Hence, in the next section, I explore the dissertation results with Chapter 2

132
literature and other research associated with the effect of motivation on academic
achievement.
Small Effect of Reiss Motivation on Academic Achievement
In this study section, I review the study results in light of the existing literature on
the relationship between motivational drives and academic achievement. I interpret the
study results in the context of existing literature on Reiss’s (2009) six motivational
reasons for low academic achievement theory. Furthermore, I review the study results in
accord with current literature on the relationship between gender, age, and academic
achievement. The purpose of interpreting the results in relationship to literature findings
is to extend knowledge in the disciplines of psychology and education.
Curiosity.
Research literature. The dissertation results suggested that students with a strong
desire for intellectual understanding were likely to have a higher GPA than those with a
lower desire for deep thinking. This result aligns with prior research. In Chapter 2, I
noted that Kavanaugh and Reiss (2003) determined that a portion of low-achieving
students in their study (N = 49) had a weak desire for intellectual pursuits. The standard
test scores indicated that 39% of the students scored at least 0.8 standard deviations (SD)
below the RSMP norm for curiosity, whereas only 8% scored at least 0.8 SD above the
RSMP norm for curiosity (see Figure 1 in Appendix H). Additionally, Froiland et al.
(2015) found a modest (r = 0.14), positive relationship between intellectual curiosity and
academic achievement among high school students aged 16–20. However, in a structural

133
equation, curiosity was moderately positively associated with two other RSMP scales,
(honor and idealism). Froiland concluded that students with a desire to learn and think
deeply are typically ethical and value being of assistance to others.
Theoretical framework. In Reiss’s additional theory (noted in Chapter 2) of the
six motivation reasons for low academic achievement, Reiss (2009) hypothesized that
students with a low score on the RSMP scale of curiosity are low achievers because they
have a weak desire for deep thinking (or low need for cognition). Personality traits that
are likely evident include students as being practical or hands-on learners, and action-
orientated (Reiss, 2013). In contrast, students with high scores on the RSMP scale of
curiosity are high achievers because they have a strong desire for intellectual pursuits (or
a high need for cognition) that provide satiation for “stimulus novelty” (Reiss, 2013, p.
52). The results of the present study support Reiss’s (2009) theory as the results
suggested that students with a low desire for curiosity decrease their odds for academic
achievement.
Order.
Research literature. The study results suggested that students with a strong desire
for structure were likely to have a higher cumulative GPA than those with a weaker
desire for organization. This result is in line with the prior research referenced in Chapter
2. Kavanaugh and Reiss (2003) determined that a portion of low-achieving students had a
weak desire to be organized. The standard test scores indicated that 27% of the low-
achieving high school students scored at least 0.8 SD below the RSMP norm for order,

134
and none scored at least 0.8 SD above the RSMP norm for order (see Figure 1; Appendix
H). Other researchers found that the degree to which students were motivated to design,
organize, adjust, or persevere in a schedule determined their level of academic
performance (Muwonge et al., 2019; Stover et al., 2014).
Theoretical framework. In his six motivation reasons for low academic
achievement theory, Reiss (2009) hypothesized that students with a low score on the
RSMP scale of order are low achievers because they have a low desire for organization.
Personality traits that are likely evident include students as being spontaneous,
disorganized, dislikes planning, and tardy (Reiss, 2013). In contrast, students with a
stronger basic desire for order tend to be organized; punctual; and attentive to details,
rule, and schedules (Reiss, 2009). The dissertation study corroborates Reiss’s theory that
students with a weak desire for order decrease their odds for academic achievement.
Status.
Research literature. The dissertation results suggested that students with a strong
desire for respect, based on social standing, were likely to have a lower GPA than those
with a weaker desire for status. This conclusion aligns with other findings in the literature
that the degree to which students were impacted by their family’s social status (i.e.,
educational and vocational degrees, occupational status; annual family net income)
determined their level of academic performance (Steinmayr, Dinger, & Spinath, 2012;
Wang & Finch, 2018).
Vengeance.

135
Research literature. The study results suggest that students who have a strong
desire to confront those who offend are likely to have lower a GPA than those with a
weak desire for combative behavior. This result aligns with prior research. Kavanaugh
and Reiss’s (2003) determined that a portion of low-achieving students had a strong
desire for vengeance. The standard test scores indicated that 55% of the underachieving
high school students scored at least 0.8 SD above the RSMP norm for vengeance, and 6%
scored at least 0.8 SD below the RSMP norm for vengeance (see Appendix H). In a
longitudinal study, Thomas (2019) examined research literature from 2006–2016 on
college student peer aggression and its application for post-secondary educational
institutions. The researcher found a gap in the literature related to the effect of aggression
on students’ motivation towards academic achievement. The present study added new
knowledge to address this particular gap in research.
Theoretical framework. In the six motivation reasons for low academic
achievement theory, Reiss (2009) hypothesized that students with a high score on the
RSMP scale of vengeance are low achievers because they have a predisposition toward
confrontation. Personality traits that are likely evident include students as being
competitor, fighter, argumentative, and aggressive (Reiss, 2013). In contrast, Reiss
suggested that students with a low score on the RSMP scale of vengeance have a
predisposition to avoid conflict (Reiss, 2009). The results of the present study support
Reiss’s (2009) theory because these results suggest that students with a strong desire for
vengeance decrease their odds for academic achievement.

136
Gender and age.
Research literature. When I examined age or gender with the aforementioned
Reiss motivation variables (i.e., curiosity, order, status, vengeance), neither gender nor
age had a relationship with academic achievement. The results suggested that students
with a strong desire for organization are likely to have a higher cumulative GPA than
those with a weaker desire for structure. Furthermore, students with a strong desire for
vengeance and physical exercise are likely to have a lower cumulative GPA than those
with a weaker desire for confrontation or psychical activity.
Motivation and gender. Pedaste et al. (2015) examined whether there were
gender-related differences in the association of cognition ability, motivation, gender, and
academic performance among first-year college students. The results indicated that all the
study variables except gender were significantly associated with academic performance.
In a more recent study, Gharghani et al. (2019) examined the relationships between
learning strategies, motivational beliefs, and gender on academic achievement among
college students. The results indicated that all the study variables except gender predicted
academic performance.
Motivation and age. In a qualitative study, Srisermbhok (2017) investigated the
impacting factors for learning achievement and failures (course grade) among
undergraduate college students. The results indicated that both attitude and motivation
(but not age) affected learning achievement and failure. In a quantitative study,
Vanslambrouck et al. (2017) examined the relationship between learner characteristics,

137
motivation, age group, and expected performance among college students. The results
indicated that all the study variables except age group were significantly correlated with
expected performance.
Conclusion. Overall, the results of the present study align with researchers who
showed a significant association between motivation and academic performance, but not
gender or age.
Summary
To interpret the modest size of the study results, I first explored the differences of
effect sizes in literature across subdivisions in psychology and of motivation on academic
achievement. The odds ratio effect sizes were small; however, they appear to fall within
the normal range in accord with research across subdivisions in psychology and in the
area of interest: the effect of motivation on academic achievement. Although there was a
modest effect size, the study results support the empirical argument in the literature that
motivation plays an important role in academic achievement (Orhan-Ozen, 2017).
Limitations and Recommendations for Future Research
Interpretation of the dissertation results should be taken with caution because of
its small effect size (Odds ratio of 1.1 to1.5). The results should also be taken with
caution due to a number of study limitations (Connelly, 2013; Queiros, Faria, & Almeida,
2017). In Chapter 1, I described potential study limitations related to data collection and
data analysis. They included the study design (the nature of self-reporting) and
methodology weaknesses (confounder variables and statistical outliers). I also explained

138
reasonable measures taken to assure accurate and non-biased self-reporting in the pursuit
of acquiring trustworthy results. In the current chapter, I describe other limitations related
to the generalization, validity, and reliability of the study findings. I also discuss how the
limitations may have affected the results and identify clear directions for future research.
Validity
The internal validity of the study results was limited to the research design.
Because I collected data at one point in time (as a cross-sectional study), I was not able to
sufficiently establish a cause-and-effect relationship between the study variables (Setia,
2016; Yens et al., 2014). However, the research outcome inferences can generalize to the
current community college population because the sample size was large (N = 459) and
the participants fit the current sociodemographic profile of the college (Rezigalla, 2020;
Setia, 2016). Additionally, the cross-sectional design may be valid because the Reiss
(2004, 2012, 2013) motivation factors are thought to be genetic traits and thus stable over
time (Kesmodel, 2018). Future recommendations include conducting a follow-up
retrospective cohort study (or longitudinal study) using the same community college
population, to detect any differences and trends in the study over time (Kesmodel, 2018;
Rezigalla, 2020; Sedgwick, 2014).
Reliability
The reliability of the study results was limited due to the survey mode. I used the
Qualtrics software company’s (Qualtrics, 2019) online survey software to maximize
student participation because web-based surveys have favorable acceptance rates among

139
students (Park et al., 2019). Insufficient effort to complete the survey (Huang, Liu, &
Bowling, 2015) or inattentiveness to the survey questions (Silber, Danner, & Rammstedt,
2019) could deflate the strength of the observed relationships between the study variables
in the sample. However, to assure sufficient effort and attentiveness, I used the best data
screening practices during the recruitment process (DeSimone et al., 2015), as described
in Chapter 1. Future recommendations include the use of attention checks via the use of
“trap questions,” such as “Please select the response option ‘agree’ for this question.” If a
participant fails to click the requested response, it may provide an indication of
inattentiveness to the question and perhaps the entire survey (Alvarez, Atkeson, Levin, &
Li, 2019; Gummer, Robmann, & Silber, 2018; Silber et al., 2019).
Another limitation was that I collected cumulative GPA data through an ordered
questionnaire item using unequal size ranges. Although it is not unusual in educational
research to use categorical GPA when examining the relationship between motivation
and academic achievement (e.g., Caskie, Sutton, & Eckhardt, 2014; Remali, Ghazali,
Kamaruddin, & Kee, 2013), categorical variables are not as reliable as continuous
variables. Variables measured with categorical response options are less informative and
precise than those measured continuously. When reliability is lowered, the likelihood of
detecting an effect is lowered. Future recommendations include asking the participants to
indicate their actual cumulative GPA from the previous semester (Caskie et al., 2014).
Ideally, another recommendation is to use the participants’ official transcripts for a more
reliable measurement of semester GPA (Rosen, Porter, & Rogers, 2017). Researchers
140
found that participants who misreport on a survey tend to either inflate their score (Rosen
et al., 2017) or are not able to recall their actual GPA. Accuracy of GPA is dependent on
recall ability within a timeframe (Tourangeau, 2018).
Generalization
The study location and delimitation limited the generalization (external validity)
of the study results. I designed the study to primarily recruit study participants from
introductory academic courses. I also conducted the study at one community college in
the western United States. The majority of the community college participants were first-
year students, had little or no college experience, and had an above-average cumulative
GPA. Given these study boundaries, the research outcome does not provide external
evidence of a causal link to other study locations and student subgroups (Burell, & Gross,
2018; Ercikan & Roth, 2014; Wade 2108). However, I sought generalization by
integrating evidence of multiple studies on the influence of motivation on academic
achievement (see Chapter 2) that included other subgroups of students in different
educational settings (Ercikan & Roth, 2014; Wang, 2018). Future recommendations
include repeating the study with other participants in other educational settings (Price &
Murnan, 2004) as well as conducting a qualitative study (Burell, & Gross, 2018; Ercikan
& Roth, 2014). These recommendations may identify invariants in the dissertation study
that continue to hold across a range of applicable situations and subgroups.

141
Summary
I described the boundaries of the study and explained the implication of the study
limitations. I also identified clear directions for future. Possible study limitations included
the following: (a) the nature of the cross-sectional study design (i.e., inability to establish
a cause-and-effect relationship between study variables), (b) insufficient effort or
inattentiveness during online survey completion: inflated strength of observed
relationship between study variables, (c) use of one community college location: results
do not generalize to other educational institutions, and (d) collected data from
participants in introductory courses: results do not generalize to other student subgroups.
Future recommendations include short-range possibilities for researchers to enhance the
validity, reliability, and generalization of the study findings.
Implications
The results indicated a modest but significant association between Reiss basic
desires of motivation (curiosity, order, status, vengeance) and academic achievement.
The odds ratio effect sizes were small; however, the study’s low-level effect size appears
to be within the normal range (based on recent meta-analyses and research studies) across
psychology subdivisions (Bosco, Aguinis, Singh, Field, & Pierce, 2015; Schäfer &
Schwarz, 2019) on the area of interest: the effect of motivation on academic achievement
(Almalki, 2019; Iyer, 2017; Orhan-Ozen, 2017). The following section describes the
potential impact of the study for positive social change that does not exceed the study
boundaries.

142
Positive Social Change
One of the potential contributions of the study for positive social change is that it
may assist low-achieving college students learn how best to manage particular behaviors
and personality traits that put them at risk for completing a college degree. That is, at-risk
students can learn to avoid too much satisfaction of weak or strong motivational drives in
a manner that leads to academic success throughout their educational experience (Allen
& Robbins, 2010; Mengel, 2014; Robbins et al., 2009). For example, students with lower
than average motivational drive for order could learn how best to manage disorganized
and careless behaviors and spontaneous personality tendencies. Students with lower than
average motivational drive for intellectual understanding could learn how best to manage
frustration and boredom in traditional college curricula that requires deep or sustained
thinking (Reiss, 2009, 2013).Underachieving students with a higher than average
motivational drive for vengeance could also learn how best to manage defensive
combative behaviors (Mengel, 2014; Reiss, 2013). Students with higher than average
motivational drive for social status could also learn how best to manage the impact of
their social- economic status on their belief and capability to achieve academic success
(Steinmayr et al., 2012; Wang & Finch, 2018). College counselors could assess the
motivational reasons for low student academic achievement using the RMP as part of the
assessment batteries to evaluate students.
Recent statistics show a substantial decline in United States’ international ranking
in completing at least an associate degree since 1990 (Fry, 2017; Nettles, 2017; OECD,

143
2016). Insights from this study may aid educators in targeting effective strategies for
improving the success of students whose motivational profiles negatively affect their
GPA scores (Reiss, 2013). Furthermore, the contributions of the study may lead to the
identification of first-year community college students in need of extra assistance or more
challenging academic pursuits because their motivation profiles are indicative or
suggestive of either low or high academic achievement. School psychologists may also
benefit from using the RMP as a resourceful, scalable, repeatable, and measurable means
to fully understand the relationship between undergraduates’ motives and poor academic
achievement (Reiss, 2004, 2009, 2012).
Summary
Due to the modest effect size of the dissertation study, caution should be heeded
on the study’s potential impact for positive social change at the individual and
organizational levels. Recommendations for future work include conducting a deeper
investigation (i.e., qualitative study; study replication) into the effect of the Reiss
motivation factors on cumulative GPA in a similar sample (i.e., community college
students aged of 19–24 taking introductory academic classes).
Conclusions
The purpose of this quantitative cross-sectional study was to better understand
which of the Reiss (2013) basic desires of motivation predict undergraduate academic
achievement and to determine which basic desires of motivation, among gender and age
groups, predicted cumulative GPA. The bivariate ordinal logistic regression results

144
indicated a modest relationship between the RSMP factors scales (curiosity, order, status,
and vengeance) and cumulative GPA. The multivariate ordinal logistic regression results
indicated a modest, yet significant relationship between the Reiss motivation factors
(order, vengeance, and physical exercise) and cumulative GPA, but not between gender,
age, and cumulative GPA. Because the effect size was small, the results should be taken
with caution. This study contributes to the existing literature on the effect of motivation
on collegiate academic achievement. Replication of the dissertation study may inform
academic administrators on how to use motivational factors to identify students who may
need academic assistance or more challenging tasks.
145
References
Adejumo, A. O., & Adetunji A. (2013). Application of ordinal logistic regression in the
study of students’ performance. Mathematical Theory and Modeling, 3(11), 10-
20. Retrieved from
https://www.researchgate.net/publication/280945132_Application_of_Ordinal_Lo
gistic_Regression_in_the_Study_of_Students'_Performance
Alvarez, R., Atkeson, L., Levin, I., & Li, Y. (2019). Paying attention to inattentive survey
respondents. Political Analysis, 27(2), 145–162. doi:10.1017/pan.2018.57
Akin, B., & Şenturk, E. (2012). Bi̇reyleri̇n mutluluk düzeyleri̇ni̇n ordi̇nal loji̇sti̇k
regresyon anali̇zi̇ ile incelenmesi̇: Analyzing levels of happiness of individuals
with ordinal logistic analysis. Öneri, 37, 183.
doi:10.14783/od.v10i37.1012000182
Allen, J., & Robbins, S. (2010). Effects of interest-major congruence, motivation, and
academic performance on timely degree attainment. Journal of Counseling
Psychology, 57(1), 23–35. doi:10.1037/a0017267
Almalki, S. A. (2019). Influence of motivation on academic performance among dental
college students. Open Access Macedonian Journal of Medical Sciences, 7(8),
1374–1381. doi:10.3889/oamjms.2019.319
Amabile, T. M., Hill, K. G., Hennessey, B. A., & Tighe, E. M. (1994). The work
preference inventory: Assessing intrinsic and extrinsic motivational orientations.
Journal of Personality and Social Psychology, 66(5), 950–967. doi:10.1037/0022-

146
3514.66.5.950
American Association for Public Opinion Research (AAPOR). (2015). The code of
professional ethics and practices. Author. Retrieved from
http://www.aapor.org/Standards-Ethics/AAPOR-Code-of-Ethics.aspx
American Association of Collegiate Registers and Admission Officers (AACRAO).
(2015). 6 years in and 6 to go, only modest progress on Obama’s college
completion goal. Author. Retrieved from
http://www.aacrao.org/resources/resources-detail-view/6-years-in-and-6-to-go--
only-modest-progress-on-obama-s-college-completion-goal
American College Personal Association (ACPA) Governing Board. (2013). ACPA
standards for demographic questions. Author. Retrieved from
http://www.myacpa.org/sites/default/files/Proposal-Demographic-Questions-and-
Responses-2.pdf
American Psychological Association. (2010). Publication manual of the American
Psychological Association (6th ed.). Washington, DC: Author. Retrieved from
https://www.apa.org/pubs/books/4200066
Andrade, C. (2015). Understanding relative risk, odds ratio, and related terms: As simple
as it can get. The Journal of Clinical Psychiatry, 76(7), e857–e861.
doi:10.4088/JCP.15f10150 PMID:26231012
Attewell, P., Heil, S., & Reisel, L. (2011). Competing explanations of undergraduate non-
completion. American Educational Research Journal, 48(3), 536–559.
147
doi:10.3102/0002831210392018
Banerjee A, Chaudhury S. (2010). Statistics without tears: Populations and samples.
Industrial Psychiatry Journal [serial online] 2010 [cited 2020 Apr 10];19:60-5.
Retrieved from: http://www.industrialpsychiatry.org/text.asp?2010/19/1/60/77642
Bakker, A., Cai, J., English, L., Kaiser, G., Mesa, V., & Van Dooren, W. (2019). Beyond
small, medium, or large: Points of consideration when interpreting effect
sizes. Educational Studies in Mathematics, 102(1), 1–8. doi:10.1007/s10649-019-
09908-4
Barker, C., Pistrang, N., & Elliott, R. (2016). Research methods in clinical psychology:
An introduction for students and practitioners (3rd ed.). Chichester, UK: John
Wiley & Sons.
Bean, J. (2011). Intellect, light, and shadow in research design. In C. Conrad & R. Serlin
(Eds.), The SAGE handbook for research in education: Pursuing ideas as the
keystone of exemplary inquiry (pp. 165–182). Thousand Oaks, CA: SAGE
Publications, Inc. doi:10.4135/9781483351377.n12
Beaudoin, B., & Kumar, P. (2012). Using data to identify at-risk students and develop
retention strategies. Washington, DC: The Advisory Board Company. Retrieved
from https://www.csueastbay.edu/oaa/files/docs/student-
success/IDAtRiskStud.pdf
Bennett, C., Khangura, S., Brehaut, J. C., Graham, I. D., Moher, D., Potter, B. K., &
Grimshaw, J. M. (2010). Reporting guidelines for survey research: An analysis of

148
published guidance and reporting practices. PLoS Medicine, 8(8), e1001069–
e1001069. doi:10.1371/journal.pmed.1001069
Bertani, A., Di Paola, G., Russo, E., & Tuzzolino, F. (2018). How to describe bivariate
data. Journal of Thoracic Disease, 10(2), 1133–1137.
doi:10.21037/jtd.2018.01.134
Bosco, F. A., Aguinis, H., Singh, K., Field, J. G., & Pierce, C. A. (2015). Correlational
effect size benchmarks. The Journal of Applied Psychology, 100(2), 431–449.
doi:10.1037/a0038047
Bozpolat, E. (2016). Investigation of the self-regulated learning strategies of students
from the faculty of education using ordinal logistic regression analysis.
Educational Sciences: Theory and Practice, 16(1), 301–318. Retrieved from
https://files.eric.ed.gov/fulltext/EJ1101188.pdf
Braun, E., Woodley, A., Richardson, J. T. E., & Leidner, B. (2012). Self-rated
competences questionnaires from a design perspective. Educational Research
Review, 7(1), 1–18. doi:10.1016/j.edurev.2011.11.005
Burell, N., & Gross, C. (2018). Quantitative research, purpose of. In M. Allen (Ed.), The
SAGE encyclopedia of communication research methods (pp. 1378–1380).
Thousand Oaks, California: SAGE Publications, Inc.
Campbell, C., & Fuqua, R. (2008). Factors predictive of student completion in a
collegiate honors program. Journal of College Student Retention, 10(2), 129–153.
doi:10.2190/CS.10.2.b

149
Cerasoli, C. P., Nicklin, J. M., & Ford, M. T. (2014). Intrinsic motivation and extrinsic
incentives jointly predict performance: A 40-year meta-analysis. Psychological
Bulletin, 140(4), 980–1008. doi:10.1037/a0035661
Caskie, G. I. L., Sutton, M. C., & Eckhardt, A. G. (2014). Accuracy of self-reported
college GPA: Gender-moderated differences by achievement level and academic
self-efficacy. Journal of College Student Development, 55(4), 385–390.
doi:10.1353/csd.2014.0038
Charter, R. A. (2003). A breakdown of reliability coefficients by test type and reliability
method, and the clinical implications of low reliability. The Journal of General
Psychology, 130(3), 290–304. doi:10.1080/00221300309601160
Chen, H., Cohen, P., & Chen, S. (2010). How big is a big odds ratio? Interpreting the
magnitudes of odds ratios in epidemiological studies. Communications in
Statistics. Simulation and Computation, 39(4), 860–864.
doi:10.1080/03610911003650383
Coe, R. (2002). It’s the effect size, stupid: What effect size is and why it is important.
Retrieved from https://www.leeds.ac.uk/educol/documents/00002182.htm
Cohen, J. (1988). Statistical power analysis for the behavioral sciences (2nd ed., p. 174).
Hillsdale, NJ: Erlbaum. Retrieved from
http://www.utstat.toronto.edu/~brunner/oldclass/378f16/readings/CohenPower.pd
f
Cohen, J. (1990). Things I have learned (so far). American Psychologist, 45(12), 1304.

150
doi:10.1037/0003-066X.45.12.1304
Cohen, J. (1992a). A power primer. In A. E. Kazdin & A. E. Kazdin (Ed) (Eds.),
Methodological issues and strategies in clinical research, 4th ed. (pp. 279–284).
Washington, DC, US: American Psychological Association. doi:10.1037/0033-
2909.112.1.155
Cohen, J. (1992b). Statistical power analysis. Current Directions in Psychological
Science, 1(3), 98–101. doi:10.1111/1467-8721.ep10768783
Cohen, J. (2016). A power primer. In A. E. Kazdin & A. E. Kazdin (Ed) (Eds.),
Methodological issues and strategies in clinical research, 4th ed. (2015-32022-
018; pp. 279–284). American Psychological Association. doi:10.1037/14805-018
College Board, Peterson’s, U.S. News & World Report, & Morse, Common Data Set
Team. (2019). Common data set initiative. Retrieved from
https://www.commondataset.org/
Connelly, L. M. (2013). Limitation section. Medsurg Nursing, 22(5), 325–336, 336.
Retrieved from https://www-ncbi-nlm-nih-
gov.ezp.waldenulibrary.org/pubmed/24358575
Costa, T., & McCrae, R. (1992). Revised NEO personality inventory (NEO-PI-R) and
NEO five-factor inventory (NEO-FFI) professional manual. Odessa, FL:
Psychological Assessment Resources. doi:10.4135/9781849200479.n9
Creswell, J. W. (2014). Research design: Qualitative, quantitative, and mixed methods
approaches (4th ed.). Thousand Oaks: SAGE Publications.

151
Crumbaugh, J. C., & Henrion, R. (1988). The PIL Test: Administration, interpretation,
uses theory and critique. International Forum for Logotherapy, 11(2), 76–88.
Retrieved from https://psycnet.apa.org/record/1991-17191-001 Di Lorenzo, L.,
Coco, V., Forte, F., Trinchese, G. F., Forte, A. M., & Pappagallo, M. (2014). The
use of odds ratio in the large population-based studies: Warning to readers.
Muscles, Ligaments and Tendons Journal, 4(1), 90–92.
doi:10.32098/mltj.01.2014.16
Deci, E., & Ryan, R. (1985). Intrinsic motivation and self-determination in human
behavior. New York: Plenum Press. doi:10.1007/978-1-4899-2271-7
Demerouti, E., & Rispens, S. (2014). Improving the image of student-recruited samples:
A commentary. Journal of Occupational and Organizational Psychology, 87(1),
34–41. doi:10.1111/joop.12048
DeSimone, J., Harms, P., & DeSimone, A. (2015). Best practice recommendations for
data screening: DATA SCREENING. Journal of Organizational Behavior, 36(2),
171–181. doi:10.1002/job.1962
Duckworth, A. L., & Yeager, D. S. (2015). Measurement matters: Assessing personal
qualities other than cognitive ability for educational purposes. Educational
Researcher, 44(4), 237–251. doi:10.3102/0013189X15584327
Duke University. (n.d.). Qualtrics. Retrieved from https://oit.duke.edu/what-we-
do/applications/qualtrics\
Educational Testing Service. (2015). E. T. S. Standards for quality and fairness. Author.

152
Retrieved from https://www.ets.org/s/about/pdf/standards.pdf
Emmert-Streib, F., & Dehmer, M. (2019). Understanding statistical hypothesis testing:
The logic of statistical inference. Machine Learning and Knowledge Extraction,
1(3), 945–961. doi:10.3390/make1030054
Elfil, M., & Negida, A. (2017). Sampling methods in clinical research; an educational
review. Emergency (Tehran, Iran), 5(1), e52. Retrieved from
http://www.ncbi.nlm.nih.gov/pmc/articles/PMC5325924/
Ercikan, K., & Roth, W. (2014). Limits of generalizing in education research: Why
criteria for research generalization should include population heterogeneity and
uses of knowledge claims. Teachers College Record, 116(5), 1–28. Retrieved
from https://web.uvic.ca/~mroth/PREPRINTS/Ercikan_Roth_finalR.pdf
Erikson, E. (1970). The quest for identity. Newsweek, 76 (25), 84-89.
Erikson, E., & Erickson, J. M. (1982). The life cycle completed: Extended version. New
York: Norton.
Erikson, E. H. (1968). Identity: Youth and crisis. New York: Norton.
Etikan, I., Musa, S., & Alkassim, S. (2016). Comparison of convenience sampling and
purposive sampling. American Journal of Theoretical and Applied Statistics, 5(1),
1–4. doi:10.11648/j.ajtas.20160501.11
Evans, J., & Mathur, A. (2018). The value of online surveys: A look back and a look
ahead. Internet Research, 28(4), 854–887. doi:10.1108/IntR-03-2018-0089
Family Educational Rights and Privacy Act. (1974). 20 U.S.C. § 1232g; 34 CFR §99

153
(1974, 2018). Retrieved from https://www.ecfr.gov/cgi-bin/text-
idx?rgn=div5&node=34:1.1.1.1.33
Faul, F., Erdfelder, E., Lang, A.-G., & Buchner, A. (2007). G*Power 3: A flexible
statistical power analysis program for the social, behavioral, and biomedical
sciences. Behavior Research Methods, 39(2), 175–191. doi:10.3758/BF03193146
Faul, F., Erdfelder, E., Buchner, A., & Lang, A.-G. (2017). G * Power 3.1 manual.
Retrieved from http://www.gpower.hhu.de/
Faul, F., Erdfelder, E., Buchner, A., & Lang, A.-G. (2019). G*Power Version 3.1.9.4.
[computer software]. Uiversität Kiel, Germany. Retrieved from
http://www.gpower.hhu.de/
Fernandez, T., Godwin, A., Doyle, J., Boone, H., Kirn, A., Benson, L., & Potvin, G.
(2016). More comprehensive and inclusive approaches to demographic data
collection. School of Engineering Education Graduate Students Series, 60, 1–26.
doi:10.18260/p.25751
Fitzpatrick, D., & Burns, J. (2019). Single-track year-round education for improving
academic achievement in U.S. K-12 schools: Results of a meta-analysis.
Campbell Systematic Reviews, 15(3), e1053. doi:10.1002/cl2.1053
Foreign Credits Inc. (2012). Classbase: Argentina grading system. Retrieved from
http://www.foreigncredits.com/About.aspx
Froiland, M., Mayor, P., & Herlevi, M. (2015). Motives emanating from personality
associated with achievement in a Finnish senior high school: Physical activity,
154
curiosity, and family motives. School Psychology International, 36(2), 207–221.
doi:10.1177/0143034315573818
Fry, R. (2017). U.S. still has a ways to go in meeting Obama’s goal of producing more
college grads. Pew Research Center. Retrieved from
http://www.pewresearch.org/fact-tank/2017/01/18/u-s-still-has-a-ways-to-go-in-
meeting-obamas-goal-of-producing-more-college-grads/
Funder, D. C., Levine, J. M., Mackie, D. M., Morf, C. C., Sansone, C., Vazire, S., &
West, S. G. (2014). Improving the dependability of research in personality and
social psychology: Recommendations for research and educational practice.
Personality and Social Psychology Review, 18(1), 3–12.
doi:10.1177/1088868313507536
Garg, R. (2016). Methodology for research I. Indian Journal of Anaesthesia, 60(9), 640–
645. doi:10.4103/0019-5049.190619
Garson, D. (2014). Ordinal regression: Statistical associates “Blue Book” series book 9.
Statistical Associates Publishers. Retrieved from
http://www.statisticalassociates.com/logistic_p.pdf
Gayles, J. (2012). Race, late bloomers and first-year GPA: Predicting beyond the
freshmen year. Educational Research Quarterly, 36(1), 13–29. Retrieved from
http://erquarterly.org/
Geramian, S., Mashayekhi, S., & Ninggal, M. (2012). The relationship between
personality traits of international students and academic achievement. Procedia:

155
Social and Behavioral Sciences, 46, 4374–4379.
doi:10.1016/j.sbspro.2012.06.257
Gershenfeld, S., Hood, D., & Zhan, M. (2015). The role of first-semester GPA in
predicting graduation rates of underrepresented students. Journal of College
Student Retention, 0(0), 1–20. doi:10.1177/1521025115579251
Gharghani, A., Gharghani, M., & Hayat, A. (2019). (in press). Correlation of
motivational beliefs and cognitive and metacognitive strategies with academic
achievement of students of Shiraz university of medical sciences. Strides in
Development of Medical Education, In Press, In Press(In Press).
doi:10.5812/sdme.81169
Glanville, K. P., Coleman, J. R. I., Hanscombe, K. B., Euesden, J., Choi, S. W., Purves,
K. L., . . . Lewis, C. M., & the Major Depressive Disorder Working Group of the
Psychiatric Genomics Consortium. (2020). Classical human leukocyte antigen
alleles and C4 haplotypes are not significantly associated with depression.
Biological Psychiatry, 87(5), 419–430. doi:10.1016/j.biopsych.2019.06.031
Glave, B. (2013). Online guide to educational system around the world: Argentina.
Retrieved from NAFSA: Association of International Educators website:
http://www.nafsa.org/_/file/_/ges/argentina.pdf
Goguen, L., Hiester, M., & Nordstrom, A. (2010). Associations among peer relationships,
academic achievement, and persistence in college. Journal of College Student
Retention, 12(3), 319–337. doi:10.2190/CS.12.3.d

156
Gray, D. (2014). Doing Research in the Real World (3rd ed.). Washington, DC: SAGE
Publications Ltd.; Retrieved from
http://www.dphu.org/uploads/attachements/books/books_5343_0.pdf
Gummer, T., Robmann, J., & Silber, H. (2018). Using instructed response items as
attention checks in web surveys: Properties and implementation. Sociological
Methods & Research, •••, 1–27. doi:10.1177/0049124118769083
Harris, K. (2015). Research ethics FAQs for doctoral students in the field of education:
Practical tips for avoiding delays and problems in the research approval process.
Walden University. Retrieved from
http://academicguides.waldenu.edu/researchcenter/orec/guides
Harter, S. (1978). Effectance motivation reconsidered. Human Development, 21(1), 34–
64. doi:10.1159/000271574
Harwell, M. (2013). Research design in qualitative/quantitative/mixed methods. In C.
Conrad & R. Serlin (Eds.), The SAGE handbook for research in education:
pursuing ideas as the keystone of exemplary inquiry (pp. 147–164). Thousand
Oaks, CA: SAGE Publications, Inc.
Havercamp, M. (1998). The Reiss Profile of motivation sensitivity: Reliability, validity,
and social desirability (Unpublished Dissertation). Ohio State University, Ohio.
Havercamp, S. M., & Reiss, S. (2003). A comprehensive assessment of human strivings:
Test-retest reliability and validity of the Reiss Profile. Journal of Personality
Assessment, 81(2), 123–132. doi:10.1207/S15327752JPA8102_04

157
Hemmert, G., Schons, L., Wieseke, J., & Schimmelpfennig, H. (2018). Log-likelihood-
based Pseudo-R2 in Logistic Regression: Deriving sample-sensitive benchmarks.
Sociological Methods & Research, 47(3), 507–531.
doi:10.1177/0049124116638107
Hodara, M., & Lewis, K. (n.d.). How well does high school grade point average predict
college performance by student urbanicity and timing of college entry? 12.
Hope, N., Milyavskaya, M., Holding, A., & Koestner, R. (2014). Self-growth in the
college years: Increased importance of intrinsic values predicts resolution of
identity and intimacy stages. Social Psychological & Personality Science, 5(6),
705–712. doi:10.1177/1948550613516875
Huang, J. L., Liu, M., & Bowling, N. A. (2015). Insufficient effort responding:
Examining an insidious confound in survey data. The Journal of Applied
Psychology, 100(3), 828–845. doi:10.1037/a0038510
IDS Publishing Corporation. (2017). Reiss school motivation assessment. Retrieved from
http://www.motivatelearning.com/schoolOrder.php
International Business Machines. (2019). IBM SPSS Statistics v25.0. Retrieved from
https://www.ibm.com/support/pages/node/618179
Iyer, R. D. (2017). Uncovering Students’ Motivation for Learning Science: Gender
Differences in Mumbai. 9(3), 16.
Johnston, M., & Finney, J. (2010). Measuring basic needs satisfaction: Evaluating
previous research and conducting new psychometric evaluations of the Basic
158
Needs Satisfaction in General Scale. Contemporary Educational Psychology,
35(4), 280–296. doi:10.1016/j.cedpsych.2010.04.003
Kashdan, T. B., Julian, T., Merritt, K., & Uswatte, G. (2006). Social anxiety and
posttraumatic stress in combat veterans: Relations to well-being and character
strengths. Behaviour Research and Therapy, 44(4), 561–583.
doi:10.1016/j.brat.2005.03.010
Kavanaugh, P., & Reiss, S. (2003). Why high school students get poor grades.
Unpublished manuscript, The Ohio State University Nisonger Center.
Kazdin, A. (2016). Experimental and observational designs: An overview. In A. E.
Kazdin & A. E. Kazdin (Ed) (Eds.), Methodological issues and strategies in
clinical research, 4th ed. (pp. 155–180). Washington, DC, US: American
Psychological Association. Retrieved from
http://ezp.waldenulibrary.org/login?url=http://search.ebscohost.com/login.aspx?di
rect=true&db=psyh&AN=2015-32022-011&site=eds-live&scope=site
Keskin, B., & Aktas, A. (2013, September). Statistical power analysis. Presented at the
The 7th International Days of Statistics and Economics, Prague, Czech Republic.
Retrieved from http://msed.vse.cz/files/2013/224-Keskin-Burak-paper.pdf
Kesmodel, U. S. (2018). Cross-sectional studies - what are they good for? Acta
Obstetricia et Gynecologica Scandinavica, 97(4), 388–393.
doi:10.1111/aogs.13331
Krumrei-Mancuso, E., Newton, F., Kim, E., & Wilcox, D. (2013). Psychosocial factors
159
predicting first-year college student success. Journal of College Student
Development, 54(3), 247–266. doi:10.1353/csd.2013.0034
Laerd Statistics (2018). Ordinal logistic regression using SPSS Statistics. Statistical
tutorials and software guides. Retrieved from https://statistics.laerd.com/
Liu, L. (2018). Advanced biostatistics and epidemiology applied in heart failure study. In
Heart Failure (pp. 83–102). Epidemiology and Research Methods;
doi:10.1016/B978-0-323-48558-6.00005-0
Mahmood, N., Murad, S., & Kakamad, K. (2018). Ordinal Logistic Regression for
Students Academic Performance in Kurdistan Region of Iraq.
doi:10.22610/imbr.v10i2.2388.g1664
Martínez-Mesa, J., González-Chica, D. A., Duquia, R. P., Bonamigo, R. R., & Bastos, J.
L. (2016). Sampling: How to select participants in my research study? Anais
Brasileiros de Dermatologia, 91(3), 326–330. doi:10.1590/abd1806-
4841.20165254
Matsushima, R., & Ozaki, H. (2015). Relationships between identity and academic
motivation. Psychological Reports, 117(1), 217–229.
doi:10.2466/07.10.PR0.117c16z7
McCormick, K., & Salcedo, J. (2017). SPSS statistics for data analysis and visualization.
John Wiley & Sons, Inc. doi:10.1002/9781119183426
McCrae, R. R., & John, O. P. (1992). An introduction to the five-factor model and its
applications. Journal of Personality, 60(2), 175–215. doi:10.1111/j.1467-

160
6494.1992.tb00970.x
McGregor, I., & Little, B. R. (1998). Personal projects, happiness, and meaning: On
doing well and being yourself. Journal of Personality and Social Psychology,
74(2), 494–512. doi:10.1037/0022-3514.74.2.494
McNally, R. J. (2017). Steven Reiss (1947–2016). American Psychologist, 72(4), 405–
405. doi:10.1037/amp0000138
Melguizo, T. (2011). A review of the theories developed to describe the process of
college persistence and attainment. In J. C. Smart & M. B. Paulsen (Eds.), Higher
education: handbook of theory and research (pp. 395–424). Springer
Netherlands; doi:10.1007/978-94-007-0702-3_10
Menard, S. (2010). Logistic Regression: From Introductory to Advanced Concepts and
Applications. SAGE Publications, Inc. doi:10.4135/9781483348964
Mengel, S. (2014). Assessment of student motivation and learning. Presented at the
proceedings of the 2013 AAU teaching showcase, Sackville, NB. Retrieved from
http://www.academia.edu/27266860/Assessment_of_Student_Motivation_and_Le
arning
Meyer, B., Enstrom, K., Harstveit, M., Bowles, P., & Beevers, G. (2007). Happiness and
despair on the catwalk: Need satisfaction, well-being, and personality adjustment
among fashion models. The Journal of Positive Psychology, 2(1), 2–17.
doi:10.1080/17439760601076635
Mishra, P., Pandey, C., Singh, U., Gupta, A., Sahu, C., & Keshri, A. (2019). Descriptive

161
statistics and normality tests for statistical data. Annals of Cardiac Anaesthesia,
22(1), 67. doi:10.4103/aca.ACA_157_18
Mothilal, R., Broos, T., De Laet, T., & Pinxten, M. (2018). Predicting first-year
engineering student success: From traditional statistics to machine learning.
Muwonge, C., Schiefele, U., Ssenyonga, J., & Kibedi, H. (2019). Modeling the
relationship between motivational beliefs, cognitive learning strategies, and
academic performance of teacher education students. South African Journal of
Psychology. Suid-Afrikaanse Tydskrif vir Sielkunde, 49(1), 122–135.
doi:10.1177/0081246318775547
Nausheen, M. (2016). An adaptation to the motivated strategies for learning questionnaire
(mslq) for postgraduate students in Pakistan: results of an exploratory factor
analysis. Bulletin of Education and Research, 38(1), 1–16.
Nettles, M., (2017). Challenges and opportunities in achieving the national postsecondary
degree attainment goals. Retrieved from Wiley Online Library website:
https://onlinelibrary.wiley.com/doi/abs/10.1002/ets2.12141
Noel-Levitz, (2011). College student inventory advisor’s guide – Form B [inventory
guidebook]. Retrieved from
https://www.ruffalonl.com/upload/Student_Retention/RMS/CSI_AdvisorGuideFo
rmB4year.pdf
Obama, B. (2009, February). Remarks of President Barack Obama: As prepared for
delivery address to joint session of congress. Retrieved from Whitehouse

162
Government website: Retrieved from
https://www.whitehouse.gov/the_press_office/Remarks-of-President-Barack-
Obama-Address-to-Joint-Session-of-Congress
Olson, K., & Chapin, C. (2007). Relations of fundamental motives and psychological
needs to well-being and intrinsic motivation. In P. Zelick (Ed.), Issues in the
psychology of motivation (pp. 133–145). Hauppauge, NY: Nova Science
Publishers, 1-3.
Olson, R., & Weber, D. A. (2004). Relations between big five traits and fundamental
motives. Psychological Reports, 95 (3/1), 795-803. doi:10.2466/PR0.95.7.795-
802
Ong, M., & Puteh, F. (2017). Quantitative data analysis: Choosing between SPSS, PLS
and AMOS in social science research. International Interdisciplinary Journal of
Scientific Research, 3(1), 14-25.
Organization for Economic Co-operation and Development (OECD). (2011). Education
at a glance: United States. Retrieved from the OECD website:
https://www.oecd.org/education/skills-beyond-school/48631582.pdf
Organization for Economic Co-operation and Development (OECD). (2015). Education
at a glance Interim report: Update of employment and educational attainment
indicators. Retrieved from OECD website: http://www.oecd.org/edu/EAG-
Interim-report.pdf
Organization for Economic Co-operation and Development (OECD). (2016). Education

163
at a glance: OECD indicators. Retrieved from OECD website:
http://dx.doi.org/10.1787/eag-2016-en
Orhan-Ozen, S. (2017). The effect of motivation on student achievement. In E. Karadag
(Ed.), The factors effecting student achievement (pp. 35–56). Springer
International Publishing; doi:10.1007/978-3-319-56083-0_3
Osborne, J. (2015). Best Practices in Logistic Regression: Multinomial and Ordinal
Logistic Regression (pp. 388-433). Author. 55 London Road, London: SAGE
Publications, Ltd
Pallant, J. (2016). SPSS survival manual: A step by step guide to data analysis using
SPSS. Maidenhead: Open University Press/McGraw-Hill.
Pannucci, C., & Wilkins, E. (2010). Identifying and avoiding bias in research. Plastic and
Reconstructive Surgery, 126(2), 619–625. doi:10.1097/PRS.0b013e3181de24bc
Park, K., Park, N., Heo, W., & Gustafson, K. (2019). What prompts college students to
participate in online surveys? International Education Studies, 12(1), 69–79.
doi:10.5539/ies.v12n1p69
Pedaste, M., Must, O., Silm, G., Täht, K., Kori, K., Leijen, Ä., & Mägi, M. (2015). How
do cognitive ability and study motivation predict the academic performance of it
students? Proceedings of ICERI 2015 Conference, 7167–7176. Retrieved from
https://library.iated.org/view/PEDASTE2015HOW
Pintrich, P., Smith, D., Garcia, T., & McKeachie, W. (1991). A manual for the use of the
motivated strategies for learning questionnaire (MSLQ). Ann Arbor, MI: National
164
Center for Research to Improve Postsecondary Teaching and Learning; Retrieved
from http://files.eric.ed.gov/fulltext/ED338122.pdf
Price, J., & Murnan, J. (2004). Research limitations and the necessity of reporting them.
American Journal of Health Education, 35(2), 66–67.
doi:10.1080/19325037.2004.10603611
Punjabi University. (2015). Punjabi University, Patiala. Retrieved from
http://pu.edu.pk/home/index
Qualtrics. (2019). Academic Achievement Research Study [Data set]. Qualtrics
[Distributor]. Retrieved from https://www.qualtrics.com
Queiros, A., Faria, D., & Almeida, F. (2017). Strengths and limitations of qualitative and
quantitative research methods. European Journal of Education Studies, 3(9), 369–
387. doi:10.5281/ZENODO.887089
Raju, D., & Schumacker, R. (2015). Exploring student characteristics of retention that
lead to graduation in higher education using data mining models. Journal of
College Student Retention, 16(4), 563–591. doi:10.2190/CS.16.4.e
Rankin, S. (Sue), & Garvey, J. C. (2015). Identifying, quantifying, and operationalizing
queer-spectrum and trans-spectrum students: Assessment and Research in Student
Affairs. New Directions for Student Services, 2015(152), 73–84.
doi:10.1002/ss.20146
Ravert, R., Gomez-Scott, J., & Donnellan, M. (2015). Equivalency of paper versus tablet
computer survey data. Educational Researcher, 44(5), 308–310.
165
doi:10.3102/0013189X15592845
Reiss, S. (2004). Multifaceted nature of intrinsic motivation: The theory of 16 basic
desires. Review of General Psychology, 8(3), 179–193. doi:10.1037/1089-
2680.8.3.179
Reiss, S. (2009). Six motivational reasons for low school achievement. Child and Youth
Care Forum, 38(4), 219–225. doi:10.1007/s10566-009-9075-9
Reiss, S. (2012). Intrinsic and extrinsic motivation. Teaching of Psychology, 39(2), 152–
156. doi:10.1177/0098628312437704
Reiss, S. (2013). The Reiss Motivation Profile. Worthington, Ohio: IDS Publishing
Corporation. Retrieved from http://www.idspublishing.com/
Reiss, S., & Havercamp, M. (1998). Toward a comprehensive assessment of fundamental
motivation: Factor structure of the Reiss Profile. Psychological Assessment, 10(2),
97–106. doi:10.1037/1040-3590.10.2.97
Remali, A., Ghazali, M., Kamaruddin, M., & Kee, T. (2013). Understanding academic
performance based on demographic factors, motivation factors and learning
styles. Asian Social Science, 3(9), 1938–1951. Retrieved from
http://www.aessweb.com/pdf-files/Ijass-si-3(9)-1938-1951.pdf
Rezigalla, A. A. (2020). Observational study designs: Synopsis for selecting an
appropriate study design. Cureus, 12(1), e6692–e6692. doi:10.7759/cureus.6692
Richardson, M., Abraham, C., & Bond, R. (2012). Psychological correlates of university
students’ academic performance: A systematic review and meta-analysis.

166
Psychological Bulletin, 138(2), 353–387. doi:10.1037/a0026838
Robbins, S. B., Oh, I. S., Le, H., & Button, C. (2009). Intervention effects on college
performance and retention as mediated by motivational, emotional, and social
control factors: Integrated meta-analytic path analyses. The Journal of Applied
Psychology, 94(5), 1163–1184. doi:10.1037/a0015738
Rosen, J. A., Porter, S. R., & Rogers, J. (2017). Understanding student self-reports of
academic performance and course-taking behavior. AERA Open, 3(2).
doi:10.1177/2332858417711427
Ross, P. T., & Bibler Zaidi, N. L. (2019). Limited by our limitations. Perspectives on
Medical Education, 8(4), 261–264. doi:10.1007/s40037-019-00530-x
Rubin, R. (2019, May 21). Qualtrics. PCMag UK. Retrieved from
https://uk.pcmag.com/cloud-services/118019/qualtrics
Ryan, R. M., & Deci, E. L. (2000). Intrinsic and extrinsic motivations: Classic
Definitions and New Directions. Contemporary Educational Psychology, 25(1),
54–67. doi:10.1006/ceps.1999.1020
Sacco, R. G. (2013). Re-envisaging the eight developmental stages of Erik Erikson: The
Fibonacci Life-Chart Method (FLCM). Journal of Educational and
Developmental Psychology, 3(1), 140–146. doi:10.5539/jedp.v3n1p140
Salazar, L., Crosby, R., & DiClemente, R. (2015). Research methods in health promotion
(L. Salazar, Ed.). 2nd ed.). San Francisco, CA: Jossey-Bass.
Salgado, J. (2018). Transforming the Area under the Normal Curve (AUC) into Cohen’s

167
d, Pearson’s r pb , Odds-Ratio, and Natural Log Odds-Ratio: Two Conversion
Tables. The European Journal of Psychology Applied to Legal Context, 10, 35–
47. doi:10.5093/ejpalc2018a5
Sangkapan, J., Laeheem, K. (2014). Factors affecting students academic achievement into
probation status at Prince of Songkla University. Retrieved from
http://tar.thailis.or.th/handle/123456789/681
Schäfer, T., & Schwarz, M. A. (2019). The meaningfulness of effect sizes in
psychological research: Differences between sub-disciplines and the impact of
potential biases. Frontiers in Psychology, 10, 813. doi:10.3389/fpsyg.2019.00813
Scotland, J. (2012). Exploring the philosophical underpinnings of research: Relating
ontology and epistemology to the methodology and methods of the scientific,
interpretive, and critical research paradigms. English Language Teaching, 5(9),
9–16. doi:10.5539/elt.v5n9p9
Sedgwick, P. (2014). Cross sectional studies: Advantages and disadvantages. BMJ
(Clinical Research Ed.), 348(2), 2276–2276. doi:10.1136/bmj.g2276
Setia, M. S. (2016). Methodology Series Module 3: Cross-sectional Studies. Indian
Journal of Dermatology, 61(3), 261–264. doi:10.4103/0019-5154.182410
Silber, H., Danner, D., & Rammstedt, B. (2019). The impact of respondent attentiveness
on reliability and validity. International Journal of Social Research Methodology,
22(2), 153–164. doi:10.1080/13645579.2018.1507378
Singh, K. (2014). Motivational beliefs and academic achievement of university students.

168
Journal of Research & Method in Education, 4(1), 1–3. Retrieved from
http://www.iosrjournals.org/iosr-jrme/papers/Vol-4%20Issue-1/Version-
4/A04140103.pdf doi:10.9790/7388-04140103
Slanger, D., Berg, A., Fisk, S., & Hanson, G. (2015). A longitudinal cohort study of
student motivational factors related to academic success and retention using the
college student inventory. Journal of College Student Retention, 17(3), 278–302.
doi:10.1177/1521025115575701
Smith, T., & McKenna, C. (2013). A Comparison of Logistic Regression Pseudo R2
Indices. Multiple Regression Viewpoints, 39(2), 17–25. Retrieved from
https://www.glmj.org/archives/articles/Smith_v39n2.pdf
Srisermbhok, A. (2017). A comparison between highly motivated learners and
unmotivated learners’ learning achievement: A case study of business English
majors at Southeast Bangkok College. Language Education and Acquisition
Research Network (LEARN). Journal, 10(1), 1–13. Retrieved from
https://www.tci-thaijo.org/index.php/LEARN/article/view/135957
Steinmayr, R., Dinger, F. C., & Spinath, B. (2012). Motivation as a mediator of social
disparities in academic achievement: Motivation as mediator of social disparities.
European Journal of Personality, 26(3), 335–349. doi:10.1002/per.842
Stover, J., Hoffmann, A., de la Iglesia, G., & Liporace, M. (2014). Predicting academic
achievement: The role of motivation and learning strategies. Problems of
Psychology in the 21St Century, 8(1), 71–84. Retrieved from

169
http://journals.indexcopernicus.com/abstract.php?icid=1100550
Taber, K. (2018). The use of Cronbach’s alpha when developing and reporting research
instruments in science education. Research in Science Education, 48(6), 1273–
1296. doi:10.1007/s11165-016-9602-2
Tourangeau, R. (2018). The survey response process from a cognitive viewpoint. Quality
Assurance in Education, 26(2), 169–181. doi:10.1108/QAE-06-2017-0034
Tariq, M. (2015). Hypothetico-deductive method: a comparative analysis. Journal of
Basic and Applied Research International, 7(4), 228–231.
doi:10.1007/s10670004-6882-0 2
Taylor, G., Jungert, T., Mageau, G., Schattke, K., Dedic, H., Rosenfield, S., & Koestner,
R. (2014). A self-determination theory approach to predicting school achievement
over time: The unique role of intrinsic motivation. Contemporary Educational
Psychology, 39(4), 342–358. doi:10.1016/j.cedpsych.2014.08.002
Taylor, P., & Medina, M. (2013). Educational research paradigms: From positivism to
multiparadigmatic. Journal for Meaning-Centered Education, 1, 1–16.
doi:10.13140/2.1.3542.0805
Thomas, R. (2019). College student peer aggression: A review with applications for
colleges and universities. Aggression and Violent Behavior, 48, 218–229.
doi:10.1016/j.avb.2019.08.013
Tilahun, B., Gedefaw, A., & Asefa, A. (2015). Predictors of self-reported academic
performance among undergraduate medical students of Hawassa University,

170
Ethiopia. Advances in Medical Education and Practice, 305.
doi:10.2147/AMEP.S78604
Tinto, V. (1975). Dropout from higher education: A theoretical synthesis of recent
research. Review of Educational Research, 45(1), 89–125.
doi:10.3102/00346543045001089
Tinto, V. (2015). Through the eyes of students. Journal of College Student Retention,
0(0), 1–16. doi:10.1177/1521025115621917
Tomczak, M., Tomczak, E., Kleka, P., & Lew, R. (2014). Using power analysis to
estimate appropriate sample size. Trends in Sport Sciences, 21(4), 195–206.
Retrieved from
http://www.academia.edu/11044470/Using_power_analysis_to_estimate_appropri
ate_sample_size
Tourangeau, R. (1984). Cognitive science and survey methods. In T. Jabine, M. L. Straf,
J. M. Tanur, & R. Tourangeau (Eds.), Cognitive Aspects of Survey Design:
Building a Bridge Between Disciplines (pp. 73–100). Washington, DC: National
Academy Press.
Tourangeau, R. (2015). The future of survey research: Challenges and opportunities.
Science Foundation Advisory Committee for the Social, Behavioral and
Economic Sciences Subcommittee on Advancing SBE Survey Research.
Retrieved from
https://www.nsf.gov/sbe/AC_Materials/The_Future_of_Survey_Research.pdf

171
Vanslambrouck, S. Zhu1, C. Pynoo, B. Lombaerts, K. & Tondeur, J. (2017). Adult
learner characteristics as predictors of performance, satisfaction and intent-to-
persist in online and blended environments. Proceedings of the International
Conference on E-Learning, 221–229. Retrieved from
https://pdfs.semanticscholar.org/b46b/ce0a780df389f73f8239660ac2df15f9a023.p
df
Wang, M. (2018). Generalization. In M. Allen (Ed.), The SAGE encyclopedia of
communication research methods (pp. 619–6212). Thousand Oaks, California:
SAGE Publications, Inc.
Wang, L., & Finch, H. (2018). Motivation variables mediate the relationship between
socioeconomic status and academic achievement. Psychology and Education: An
Interdisciplinary Journal, 55, 123–136. Retrieved from
https://www.researchgate.net/publication/329516367_Motivation_Variables_Med
iate_the_Relationship_between_Socioeconomic_Status_and_Academic_Achieve
ment
Watson, D., Clark, L. A., & Tellegen, A. (1988). Development and validation of brief
measures of positive and negative affect: The PANAS scales. Journal of
Personality and Social Psychology, 54(6), 1063–1070. doi:10.1037/0022-
3514.54.6.1063
Wen, S. H., & Yeh, J. I. (2014). Cohen’s h for detection of disease association with rare
genetic variants. BMC Genomics, 15(1), 875. doi:10.1186/1471-2164-15-875

172
White House. (2016, October). Higher education: Knowledge and skills for the jobs of
the future. Retrieved from https://obamawhitehouse.archives.gov/node/174466
Yale University. (2019). About survey tools and support. Retrieved from
https://yale.service-
now.com/it?id=service_offering&sys_id=5b584dcd6fbb31007ee2abcf9f3ee4e3
Yens, D. P., Brannan, G. D., & Dumsha, J. Z. (2014). A research primer, Part 2:
Guidelines for developing a research project. The Journal of the American
Osteopathic Association, 114(1), 41–51. doi:10.7556/jaoa.2014.006

173
Appendix A
17-Item Demographic Questionnaire
Participant Demographic Information:
Self Report
Name:
_____________________________
Email:
_____________________________
Optional Phone Number
_____________________________
Inclusivity and Functionality of Demographic Questions
The survey will include questionnaire items about your academic and personal identity.
These items were designed in accord with current research on intentional rationale (i.e.,
timey trends) and on social identities (American College Personnel Association, 2013;
Gender Identity in the U.S. Surveillance, 2014).
Demographic Questions
The following questionnaire items related to your identity and background will be kept
confidential, anonymous, and in a secured environment.
1. Academic Class Standing
□ First year
□ First-time student: 1st semester
□ Continuing student: 2nd
semester or more
□ Second-year student
□ Other, please specify: _____________________________________
2. How long have you attended ______? □ Currently in my 1st semester
□ Currently in my 2nd semester
□ Other, please describe: _____________________________________
3. Enrollment Status for Last Semester (Fall)
□ Full time: Equal to 12 credits or more
□ ¾ time: 9–11 credits
□ Half time: 6–8 credits
□ Less than half time: Less than 6 credits

174
□ Continuing education: Non-credit classes
□ Not currently enrolled
4. Is your current enrollment status limited to one of the following?
□ 12 credit hours
□ 6 credit hours or less
□ Unknown
5. Race / Ethnicity (Select all that apply)
□ African American / Black
□ American Indian / Alaska Native
□ Asian American
□ Caucasian / White
□ Hispanic / Latino
□ Native Hawaiian / Pacific Islander
□ Other, please describe: _____________________________________
6. Sex Assignment at Birth
□ Male
□ Female
7. Gender Identity (Select all that apply)
□ Male
□ Woman
□ Trans male / Trans man
□ Trans female / Trans woman
□ Genderqueer / Gender non-conforming
□ Other, please describe: _____________________________________
8. Age
□ 17 or under
□ 18
□ 19–24
□ 25–39
□ 40–64
□ 65 or older
9. Disability / Impairment
□ No
□ Prefer not to answer
□ Yes: Please indicate the terms that best describes the condition(s) you experience
□ Free response: _____________________________________

175
10. Current Employment Status
□ Full time
□ Part time
□ No
11. Religion, Spiritual Practice, or Existential Worldview
□ Agnostic
□ Atheist
□ Baptist
□ Buddhist
□ Catholic
□ Christian
□ Hindu
□ Jewish
□ Muslim
□ Latter Day Saints / Mormon
□ Lutheran
□ Muslim
□ Pagan
□ Presbyterian
□ Quaker
□ Taoist
□ Unitarian Universalist
□ No Identity
□ Other; please specify: _____________________________________
12. How important is religion or spiritual practice in your life?
□ Very important
□ Somewhat important
□ Not too important
□ Not at all important
13. If you are a Presidents’ Honors Scholarship recipient, what (current) semester are you in the Honors Program?
□ First semester
□ Second semester
□ Third semester
□ Fourth semester
□ Does not apply to me
14. If you are an Honors Achievement Award recipient, how many semesters have you been in the Honors
Program?

176
□ 1-2 semesters
□ 3-4 semesters
□ More than 4 semesters
□ Does not apply to me
15. Are you currently on Academic Probation?
□ Yes
□ No
16. Not including current semester, approximately how many credits have you taken? □ 0 -12
□ 12-34
□ 37 - 48
□ 49-60
□ More than 60
17. Not including current semester, approximately what is your cumulative grade point
average? □ 3.75 – 4.00
□ 3.25 – 3.74
□ 2.75 – 3.24
□ 2.25 – 3.74
□ 2.0 – 2.24
□ Less than 2.0

177
Appendix B
Permission from RSMP Developer

178
Appendix C
Study Flyer and Invitational Letter
STUDENT VOLUNTEERS NEEDED
For a
Study Investigating
The Multifaceted Motivational Factors
On Academic Achievement
Motivation
to Graduation
Looking for students who:
Are first-time to college students,
Between the ages of 18 and 24, and
Registered in an academic achievement class
Participation is completely voluntary and confidential. You may withdraw at any time.
Food (i.e., pizza, vegetable tray, soda pop) and a monetary gift of $5.00 will be provided
Time to complete the demographic questionnaire is approx. 5 minutes. Time to
complete the assessment instrument is approx. 15 minutes.
Interested individuals please contact Sandra Beasley for more information

179
Appendix D
Consent Form
You are invited to take part in a research study of “The Relationship of Multifaceted
Motivational Factors on Academic Achievement.” The researcher is inviting first time,
first year, students on academic probation and honor students, between the ages of 18 and
24, to be in the study. This study is being conducted by a researcher named Sandra
Beasley who is a doctoral student at Walden University.
Background Information: The purpose of this study is to increase the knowledge in the field of
clinical and educational psychology on what motivational factors are associated with above-
average academic performance and below-average academic performance among first-year
students. An additional purpose of the study is to determine the differences in the two
motivational profiles associated with both above-average and below-average academic
performances. Academic performance, in both purpose statements, refers to semester GPA in the
first year of college.
Here are some sample questions in the survey:
1) I enjoy meeting new people
2) I have a “thirst for Knowledge”
3) Self-reliance is one of my most important goals
4) I enjoy directing group activities
5) I often worry about the well-being of society
6) Fitness is very important to me
Voluntary Nature of the Study: This study is voluntary. Everyone will respect your decision of
whether or not you choose to be in the study. No one will treat you differently if you decide not to

180
be in the study. If you decide to join the study now, you can still change your mind later. You
may stop at any time.
Study Risks: Other than some risk of minor discomforts encountered in daily life (i.e.,
stress, fatigue, personal concerns) or those during the performance of routine
psychological examinations or tests, participating in this study should not pose any risk to
your safety or wellbeing.
Compensation: In exchange for your participation, upon request, you will receive a 1-2 page
written summary of the findings of this study. There will also be complimentary food on sight at
the time of your participation (i.e., pizza, vegetable tray, and soda pop) and a monetary gift of
$5.00. Of most importance, you will receive the appreciation of the researchers and others who
may benefit from what you choose to reveal about the scope and nature of what innately
motivates you. If you would you like to know the results about this research study, via e-mail,
please check yes to the question at the end of the Informed Consent Form
Privacy: Any information you provide will be kept confidential. The researcher will not use your
personal information for any purposes outside of this research project. Also, the researcher will
not include your name or anything else that could identify you in the study reports. Survey data
will be kept secure by coding all of your responses using an identity number rather than your
name. After the collection of the survey in the student-sealed packets, I will run the uncompleted
packets through a paper shredder, place the completed packets in a locked filing cabinet located
in a secured room, and store the completed electronic data in a password-protected personal
computer. Data will be kept for a period of at least 6 years after completion of the research
study and then destroyed. The researcher will give you a copy of the Consent Form to
keep for your records.
Contacts and Questions: You may ask any questions you have now or if you have questions
later, you may contact the researcher via phone. If you want to talk privately about your rights as

181
a participant, you can contact the Institutional Research Board (IRB) who can discuss this area of
concern with you.
Walden University’s approval number for this study is IRB is 04-03-18-0078602. Since Walden
is only overseeing the analysis of the data, there is no assignment of an expiration date.
Statement of Consent: I have read the above information and I feel I understand the study well
enough to make a decision about my involvement. My signature below indicates I am agreeing to
the terms described above. (If agreeing via the internet, please type your name and send via your
email address.)
Printed Name of Participant: _________________________________________
Date of consent: __________________________________________________
Participant’s Signature: _____________________________________________
Researcher’s Signature: ____________________________________________
Summary of Research Study Results: Would you like to know the results about this
research study via e-mail?
□ Yes
□ No

182
Appendix E
10-Item Online Demographic Online Questionnaire
Participant Demographic Information: Self Report
Participant ID: Name:
_____________________
Email:
______________________
Optional Phone Number
_______________________
Inclusivity and Functionality of Demographic Questions
The survey will include questionnaire items about your academic and personal identity. These
items were designed in accord with current research on intentional rationale (i.e., timey trends)
and on social identities (American College Personnel Association, 2013; Gender Identity in the
U.S. Surveillance, 2014).
Demographic Questions
The following questionnaire items related to your identity and background will be kept
confidential, anonymous, and in a secured environment.
1. Academic Class Standing
□ First year
□ First-time student: 1st semester
□ Continuing student: 2nd
semester or more
□ Second-year student
□ Other, please specify: _____________________________________
2. How long have you attended the college?
□ Currently in my 1st semester
□ Currently in my 2nd
semester
□ Other, please describe: _____________________________________
3. Enrollment Status for Current Semester
□ Full time: Equal to 12 credits or more
□ ¾ time: 9-11 credits
□ Half time: 6-8 credits
□ Less than half time: Less than 6 credits
□ Continuing education: Non-credit classes
□ Not currently enrolled

183
4. Race / Ethnicity (Select all that apply)
□ African American / Black
□ American Indian / Alaska Native
□ Asian American
□ Caucasian / White
□ Hispanic / Latino
□ Native Hawaiian / Pacific Islander
□ Other, please describe: _____________________________________
5. Sex Assignment at Birth
□ Male
□ Female
6. Gender Identity (Select all that apply)
□ Male
□ Woman
□ Trans male / Trans man
□ Trans female / Trans woman
□ Genderqueer / Gender non-conforming
□ Other, please describe: _____________________________________
7. Age
□ 17 or under
□ 18
□ 19 – 24
□ 25 – 39
□ 40 - 64
□ 65 or older
8. Disability / Impairment
□ No
□ Prefer not to answer
□ Yes: Please indicate the terms that best describes the condition(s) you experience
□ Free response: _________________________
9. Current Employment Status
□ Full time
□ Part time
□ No
10. Religion or Spiritual Practice (Select all that apply)

184
□ Agnostic
□ Atheist
□ Baptist
□ Buddhist
□ Catholic
□ Christian
□ Hindu
□ Jewish
□ Latter Day Saints / Mormon
□ Lutheran
□ Muslim
□ Pagan
□ Presbyterian
□ Quaker
□ Taoist
□ Unitarian Universalist
□ No Identity
□ Other; please specify: _________________________

185
Appendix F
17-Item Demographic Questionnaire
Participant Demographic Information:
Self Report
Name:
_____________________________
Email:
_____________________________
Optional Phone Number
_____________________________
Inclusivity and Functionality of Demographic Questions
The survey will include questionnaire items about your academic and personal identity.
These items were designed in accord with current research on intentional rationale (i.e.,
timey trends) and on social identities (American College Personnel Association, 2013;
Gender Identity in the U.S. Surveillance, 2014).
Demographic Questions
The following questionnaire items related to your identity and background will be kept
confidential, anonymous, and in a secured environment.
1. Academic Class Standing
□ First year
□ First-time student: 1st semester
□ Continuing student: 2nd
semester or more
□ Second-year student
□ Other, please specify: _____________________________________
2. How long have you attended the college? □ Currently in my 1st semester
□ Currently in my 2nd semester
□ Other, please describe: _____________________________________
3. Enrollment Status for Last Semester (Fall)
□ Full time: Equal to 12 credits or more
□ ¾ time: 9–11 credits
□ Half time: 6–8 credits
□ Less than half time: Less than 6 credits

186
□ Continuing education: Non-credit classes
□ Not currently enrolled
4. Is your current enrollment status limited to one of the following?
□ 12 credit hours
□ 6 credit hours or less
□ Unknown
5. Race / Ethnicity (Select all that apply)
□ African American / Black
□ American Indian / Alaska Native
□ Asian American
□ Caucasian / White
□ Hispanic / Latino
□ Native Hawaiian / Pacific Islander
□ Other, please describe: _____________________________________
6. Sex Assignment at Birth
□ Male
□ Female
7. Gender Identity (Select all that apply)
□ Male
□ Woman
□ Trans male / Trans man
□ Trans female / Trans woman
□ Genderqueer / Gender non-conforming
□ Other, please describe: _____________________________________
8. Age
□ 17 or under
□ 18
□ 19–24
□ 25–39
□ 40–64
□ 65 or older
9. Disability / Impairment
□ No
□ Prefer not to answer
□ Yes: Please indicate the terms that best describes the condition(s) you experience
□ Free response: _____________________________________

187
10. Current Employment Status
□ Full time
□ Part time
□ No
11. Religion, Spiritual Practice, or Existential Worldview
□ Agnostic
□ Atheist
□ Baptist
□ Buddhist
□ Catholic
□ Christian
□ Hindu
□ Jewish
□ Muslim
□ Latter Day Saints / Mormon
□ Lutheran
□ Muslim
□ Pagan
□ Presbyterian
□ Quaker
□ Taoist
□ Unitarian Universalist
□ No Identity
□ Other; please specify: _____________________________________
12. How important is religion or spiritual practice in your life?
□ Very important
□ Somewhat important
□ Not too important
□ Not at all important
13. If you are a Presidents’ Honors Scholarship recipient, what (current) semester are you in the Honors Program?
□ First semester
□ Second semester
□ Third semester
□ Fourth semester
□ Does not apply to me
14. If you are an Honors Achievement Award recipient, how many semesters have you been in the Honors
Program?

188
□ 1-2 semesters
□ 3-4 semesters
□ More than 4 semesters
□ Does not apply to me
15. Are you currently on Academic Probation?
□ Yes
□ No

189
Appendix G
Two-Item Demographic Online Questionnaire
Demographic Questions
The following questionnaire items related to your identity and background will be kept
confidential, anonymous, and in a secured environment.
AccumCred16 Not including the current semester, approximately how many credits have
you taken?
o 0 - 12
o 13 - 24
o 37 - 48
o 49 - 60
o More than 60
CumGPA17 Not including the current semester, approximately what is you cumulative
grade point average for courses taken?
o 3.75 - 4.00
o 3.25 - 3.74
o 2.75 - 3.24
o 2.25 - 2.74
o 2.0 - 2.24
o Less than 2.0

190
Appendix H
Reiss School Motivation Profile Scores
(Kavanaugh, & Reiss, 2003)
Figure H1. Reiss School Motivation Profile Scores: Physical Activity, Acceptance,
Social Contact, Status, Power, and Independence (Kavanaugh & Reiss, 2003). The Y
scale shows mean standard scores and the X scale shows number of students.

191
Figure H2. Reiss School Motivation Profile Scores: Idealism, Tranquility, Curiosity,
Family, and Order (Kavanaugh & Reiss, 2003). The Y scale shows mean standard scores
and the X scale shows number of students.