the relationship between peer, social, and school factors, and delinquency among youth
TRANSCRIPT

Research Papers
The Renationship Between Peer, Social, and School Factors, and Delinquency Among Youth Joanne j . Paetsch, Lorne D. Bertrand
ABSTRACT: This article examines the relationships between selfreported delinquency and peer, social, and school factors among junior and senior high school students in Calgary, Alberta, Canada, using both cross-tabulation and multiple-regression analyses. A greater number of ninth grade students w’ere delinquent compared to students in the other grades studied. Predictably, peers’ level of delinquency correlated strongly and positively with students’ level of delinquency. Strong, positive correlations with delinquency also were found for students reporting high levels of involvement in sports, and high levels of involvement in commerciaWentertainment activities. Multivariate analyses indicated the strongest predictor of delinquent behavior within the group of peer and social variables was peer delinquency. Within the group of school variables, the strongest predictors of delinquent behavior were how ofen classes were skipped and the number of times students were suspended from school. However, students’ grades in school did not significantly increase the accuracy of the regression eqution. (J Sch Health. 1997;67( 1):27-33)
strong positive correlation exists between the level of A youth delinquent behavior and their involvement with delinquent Do delinquent youth seek out delinquent friends, or do delinquent friends negatively influence a youth’s behavior? What other factors may interact with delinquent peer variables to influence delinquent behavior?
Two classic sociological theories argue both sides of the causality issue. Differential Association Theory states that peer associations provide the environment for the learning and reinforcement of beliefs and behavior.’ Therefore, youth who associate with conforming peers are more likely to be conforming in their beliefs and actions, and youth who associate with delinquent peers are more likely to be delinquent in their beliefs and actions.6 Social Control Theory argues that, due to a weakening of social controls, youth who already are delinquent will seek out other delin- quent youth for companionship.’’
Some authors argued for an “interactional perspective,” which combines aspects of both Differential Association Theory and Social Control Theory.b Over time, both theo- ries are interrelated and exert bidirectional causal influ- ences on one another.
... delinquent peers are likely to reinforce delin- quency, and as the subject anticipates and experi- ences those positive peer reactions, delinquency is likely to increase. In turn, the more a person engages in delinquency, the more likely he or she is to associ- ate with delinquent peers.’ A more practical approach to the study of delinquent
behavior among youth examines other factors that may
Joanne J . Paetsch, BA, Administrator; and Lorne D. Bertrand, PhD, Social Research Associate, Canadian Research Institute for Law and the Family, c/o Faculty of Law, The University of Calgary, 2500 University Drive Nw, Calgary, Alberta T2N IN4 Canada. This study was conducted by the Canadian Research Institute f o r Law and the Family f o r the Calgary Police Service, with funding from Solicitor General Canada. This article was submitted July 9, 1996, and revised and accepted for publica- tion November 6, 1996.
interact with delinquent peers to influence delinquency. While research studies examined variables such as gender: age,’ attachment,* group versus individual relationship^,^ family situations,8 friendship characteristics,’.’ and delin- quency characteristics,” few studies examined the relation- ship between school and leisure activities, peer associa- tions, and delinquent behavior. Further, since much research in this area was conducted in the United States, limited information is available concerning the Canadian context.
This article examines the relationships between self- reported delinquency and peer and school factors among junior and senior high school students in Calgary, Alberta, Canada, using both cross tabulation and multiple-regression analyses. Since the research design employed in this study was cross-sectional, it cannot directly address the causality issue. However, it does identify interesting factors that may influence a youth’s delinquent behavior.
METHODS Sample
Data analyzed in this article were obtained from a study of youth crime and violence conducted by the Canadian Research Institute for Law and the Family.” One compo- nent of the study involved a student youth violence survey administered to junior and senior high school students. The sample of 962 students was drawn randomly from 14 junior high schools and six senior high schools in various parts of Calgary that corresponded to low, medium, and high-crime areas.
Of the surveyed students, 5 1 % were male and 49% were female, and 86% indicated they were born in Canada. A relatively even proportion of students existed in grades 7- 11, but a smaller proportion of students in grade 12 partici- pated in the study. Students’ ages ranged from 12-18. Students in the sample were equally distributed across the low, medium, and high-crime areas of the city. However,
Journal of School Health January 1997, Vol. 67, No. 1 27

because no consistent relationship was found between delinquency and area of the city, data were not analyzed separately by area.
One limitation of school-based samples is that school drop-outs are not included. Since this group contained youth at highest risk for engaging in delinquent behavior,” the effect of any bias introduced by this source is an under- estimation of delinquency.
Instrumentation Using a questionnaire administered by trained members
of the research team in a classroom setting, students were asked the extent to which they had engaged in delinquent behaviors in their lifetime, as well as within the past year. Questionnaire administration was conducted in 1994. To measure the extent of delinquency, students were asked to indicate whether they had engaged in certain types of prop- erty- and violence-related behaviors. While not all of these behaviors would be considered illegal, such as consensual fighting, most do represent criminal activity. Property- related behaviors were damaged someone’s property on purpose, stole less than $50, stole more than $50, stole with friends, broke into a house, or stole a car or motorcycle. Violence-related behaviors were took something by force or threat, threatened to hurt someone, slapped, punched, or kicked someone, threatened someone with a weapon, fought with a group of friends, or touched someone in a sexual way against their will.
For purposes of multiple-regression analyses, these forms of delinquency were combined into a single score by summing the number of delinquent behaviors that students reported engaging in within the past year, thus yielding a single delinquency score for each respondent ranging from 0 to 12. For example, a student who engaged in three delin- quent behaviors within the past year would receive a delin- quency score of three. While this method did not allow for differentiation among students based on severity of delin- quent behaviors, it did provide an index of the extent of involvement in delinquency.
For cross-tabulation analyses, the delinquency score was collapsed into three categories according to the following criteria: students who had not engaged in any of the delin- quent behaviors within the past year were classified as nondelinquent; students who had engaged in one or two forms of delinquency were classified as exhibiting a low level of delinquency; and students who had engaged in three or more forms of delinquency were classified as exhibiting a moderatehigh level of delinquency. Consistent with other studies, these results indicated that youth who committed only one or two delinquent behaviors were most likely to have engaged in less serious types of property or violent behaviors such as stealing something worth less than $50 or slapping or punching someone in anger. Thus, most students who had engaged in more serious forms of delinquency fell into the “moderate/high delinquency” group. l4
Students also were asked questions about school and social life variables. Specifically, students were asked ques- tions about their overall grade average, the frequency with which they skipped school, the number of times they had been suspended from school, and whether they had thought about dropping out of school. Concerning their social life, or day-to-day activities, students were asked questions
about their involvement in extracurricular activities and their peer relationships. For example, students were asked how often they engaged i n sports activities; commercial/entertainment activities such as going to movies, video arcades, and pool halls; and arts and cultural activities such as going to museums, plays, and libraries. They were asked how often they did activities with peers, their peers’ level of delinquency, and whether their parents approved of their friends. All tests of statistical significance were conducted using the Chi-square test of association.
RESULTS Bivariate Analyses
All independent variables measured in the study were cross-tabulated with the dependent variable, or level of delinquency. All relationships examined were statistically significant.
Table 1 presents results from the analyses between level of delinquency and gender and grade. Male students were more likely to report a moderatelhigh level of delinquency (37.7%) than were female students (23.8%). In terms of grade, ninth grade students reported the highest levels of delinquency. For example, 42.5% of ninth grade students reported a moderatelhigh level of delinquency, compared to 24.3% of seventh grade students and only 17.6% of 12th grade students.
Peer and social variables. Results from the analyses between peer and social variables and level of delinquency are presented in Table 2. As expected, peer delinquency was significantly related to students’ level of delinquency. For example, of students reporting that their peers have a moderate/high level of delinquency, 68.9% reported a moderate/high level of delinquency for themselves. Conversely, of students who reported no peer delinquency, only 3.4% reported a moderatehgh level of delinquency for themselves.
Other peer factors also were statistically significant. Students who reported never or only occasionally engaging in activities with peers were more likely to report no delin- quency themselves (54% and 52.4%, respectively) than a moderate/high level of delinquency (22% and 22.6%, respectively). Interestingly, students who reported engaging in activities with peers often were almost as likely to report no delinquency (36.2%) as they were to report a moderate/high level of delinquency (37.8%). Students whose parents approved of their friends were much more likely to report no delinquency (48.2%) than a moderate/high level of delinquency (25.4%). In contrast, students who reported that their parents disapproved of their friends were much more likely to report a moderate/high level of delinquency (62.5%) than low (17.9%) or no delinquency (19.6%).
In terms of leisure/social activities, students who reported a low level of involvement in sports were more likely to report no delinquency (47.9%) than a moderate/high level of delinquency (25.6%). However, students who reported a high level of involvement in sports were almost as likely to report a moderate/high level of delinquency (36.9%) as they were no delinquency (38.9%). Students who reported a high level of involvement in sports were considerably more likely to report a moderate/high
28 Journal of School Health January 1997, Vol. 67, No. 1

level of delinquency than were students who reported a low level of sports activity.
Students who reported a high level of involvement in commercial/entertainment activities were more likely to report a moderatehgh level of delinquency (46.8%) than no delinquency (31.8%). In contrast, students who reported a low level of involvement in these types of activities were more likely to report no delinquency (56%) than they were a low (25.3%) or moderate/high level of delinquency (18.8%). Finally, students who engaged in a high level of arts and cultural activities were more likely to report no delinquency (53.3%) than a moderate/high level of delin- quency (22.5%), while students who enga,ged in a low level of arts and cultural activities were more likely to report a moderate/high level of delinquency (39.1 "I).
Table 1 Level of Delinauencv
of Student Respondents b i Genden and Grade
Level of Delinquency None Low Moderate/High
n % n % n Yo Gender'
Male (n = 486) 191 39.3 112 23.0 183 37.7 Female (n = 474) 229 48.3 132 27.8 113 23.8
Grade' 7 (n = 202) 108 53.5 45 22.3 49 24.3 8 (n = 171) 74 43.3 45 26.3 52 30.4 9(n = la) 56 35.0 36 22.5 68 42.5 10(n = 172) 62 36.0 53 33.7 52 30.2 11 (n = 167) 74 44.3 34 20.4 59 35.3 12 (n = 85) 45 52.9 25 29.4 15 17.6
' ' Missing observations = 2, f ( 2 ) = 2f.5, p c ,001
Missing observations = 5. f (10) = 35.2, p c .Wl
Table 2 Level of Delinquency
of Student Respondents by Peer and Social Variables
Level of Delinquency None
n % Peer delinquency'
None (n = 179) 147 82.1 Moderate (n = 537) 252 42.9 High (n = 196) 22 11.2
Never (n = 50) 27 54.0 Occasionally (n = 393) 206 52.4 Often (n = 519) 188 36.2
Approve (n = 767) 370 48.2 Disapprove (n = 56) 11 19.6 Don't know friends (n = 73) 19 26.0 Don't know (n = €6) 21 31.8
Law (n = 386) I85 47.9 Moderate (n = 275) 119 43.3 High (n = 301) 117 38.9
Level of involvement in commercial/entertainmentS Low (n = 400) 224 56.0 Moderate (n = 295) 112 38.0 High (n = 267) 85 31.8
Low (n = 394) 144 36.5 Moderate (n = 324) 147 45.4
Frequency of activities with peers'
Parents' opinions of friends'
Level of involvement in sports4
Level of involvment in arts and culture6
Low ModeratdHiph n Y'
26 14.5 180 30.7 39 19.9
12 24.0 98 24.9 135 26.0
202 26.3 10 17.9 17 23.3 16 24.2
102 26.4 70 25.5 73 24.3
101 25.3 87 29.5 57 21.3
96 24.4 90 27.8
n
6 155
13
1 1 89
196
195 35 37 29
99 86
111
75 96
125
154 87 5s
%
3.4 26.4 68.9
22.0 22.6 37.8
25.4 62.5 50.7 43.9
25.6 31.3 36.9
18.8 32.5 46.8
39.1 26.9
High (n = 244) 130 53.3 59 24.2 .. 22.5
1 f ( 4 ) = 264.6, p <.#I 4 y(4) = 10.5, p c .05 2 f ( 4 ) = 32.7, p c.Wl 5 f ( 4 ) = 69.7, p < .Wl 3 f ( 6 ) = 585, p c .Wl 6 f ( 4 ) = 26.8, p c .WI
School variables. Table 3 presents results from the cross-tabulation of school variables and level of delin- quency. Again, all results were statistically significant. Students reporting a 90% to . loo% grade average were more likely to report no delinquency (66.7%) than a low (16.7%) or moderatehgh level of delinquency (16.7%). Of students reporting failing marks (< 50%), 40% reported a moderate/high level of delinquency, 33.3% reported a low level of delinquency, and 26.7% reported no delinquency.
The more time students reported spending on home- work, the less likely they were to report delinquency. For example, of students who reported spending five or more hours per week on homework, 56.1 % reported no delin- quency, and 19.8% reported a moderate/high level of delin- quency. In contrast, of students who reported doing no homework, 64.4% reported a moderatehgh level of delin- quency, 17.8% reported a low level of delinquency, and 17.8% reported no delinquency.
S tudents who reported skipping c lasses of ten (once/week or more) were more likely to report a moder- atekigh level of delinquency (60.6%) than low (19.7%) or no delinquency (19.7%). Students who reported skipping classes often were three times more likely to report a moderate/high level of delinquency than no delinquency. Similarly, of students who reported having been suspended from school, 65.2% reported a moderateihigh level of delinquency in contrast to 25% of students who had never been suspended. Of students who had ever thought about dropping out of school, 59.5% reported a moderate/high level of delinquency, compared to 26.8% who stated that they had never thought of dropping out.
Multivariate Analyses A series of stepwise multiple regression analyses was
conducted on students' level of delinquency, using the
Table 3 Level of Delinauencv
of Student Respondents b) Schkol Variables Level of Delinquency
None n YO
Grades in school' 90% - 103% (n = 30) 20 66.7
70% . 79% (n =333) 157 47.1
50% - 59% (n = 96) 22 22.9 < 50% (n = 15) 4 26.7
0 hours (n = 73) 13 17.8 1.4 hours (n = 495) 187 37.8 5+ hours (n = 394) 221 56.1
&o% - 89% (n = 269) 138 51.3
M)% . 69% (n = 219) 80 36.5
Time spent on homework per week'
How often classes are skipped' Never (n = 571) 310 54.3 Once a month or less
(n = 264) 86 32.6 Once a week or more
(n = 127) 25 19.7
Yes (n = 138) 30 21.7 No (n = 824) 391 47.5
Yes (n = 116) 20 17.2
Ever been suspended from school
Ever thought about dropping out of school'
Low n %
5 16.7 68 25.3 84 25.2 57 26.0 26 27.1 5 33.3
13 17.8 137 27.7 95 24.1
142 24.9
78 29.5
25 19.7
18 13.0 227 27.5
27 23.3
M o d e r a W H i g h n
5 63 92 82 48 6
47 171 78
119
100
77
90 206
69
%
16.7 23.4 27.6 37.4 50.0 40.0
64.4 34.5 19.8
20.8
37.9
a . 6
65.2 25.0
59.5 No (n = 846) 401 47.4 218 25.8 227 26.8
1 f ( l 0 ) = 45.4, p c .WI 4 f (2 ) = 89.8, p c .Wl 2 f ( 4 ) = 76.4, p c .Wl 5 f (2 ) = 56.8, p c .Wl
Journal of School Health January 1997, Vol. 67, No. 1 29
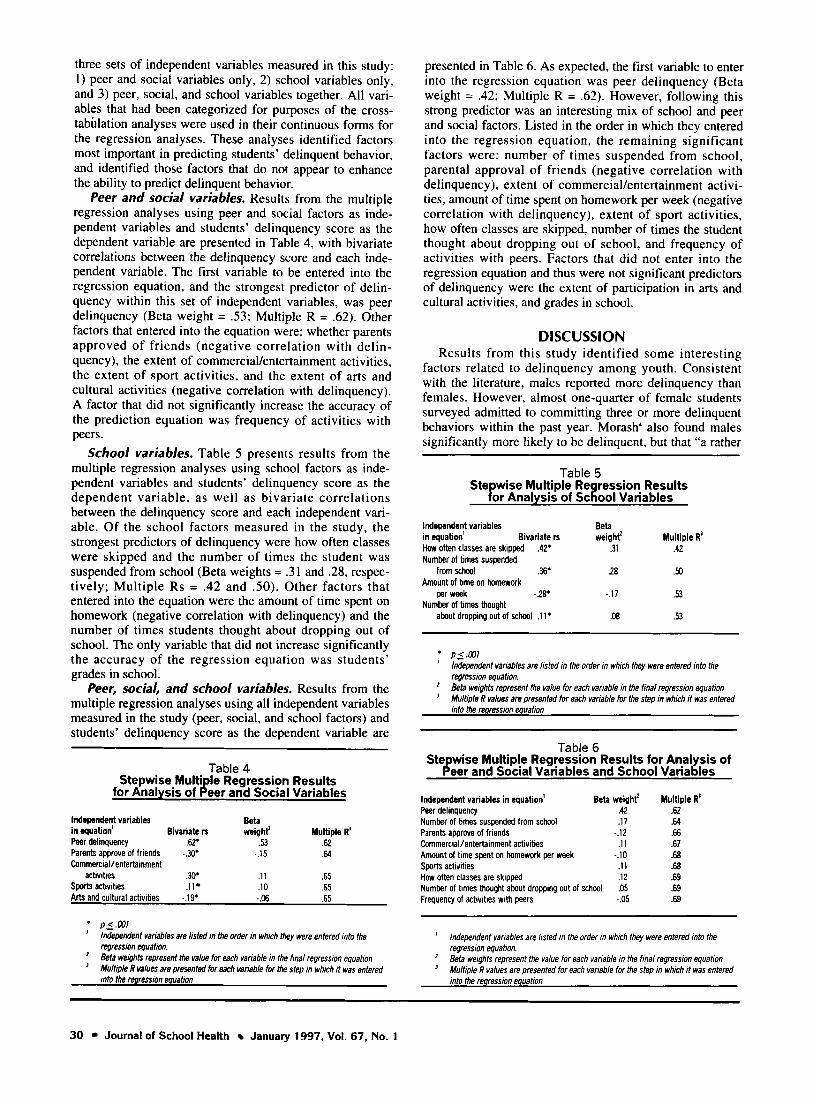
three sets of independent variables measured in this study: 1 ) peer and social variables only, 2) school variables only, and 3) peer, social, and school variables together. All vari- ables that had been categorized for purposes of the cross- tabulation analyses were used in their continuous forms for the regression analyses. These analyses identified factors most important in predicting students' delinquent behavior, and identified those factors that do not appear to enhance the ability to predict delinquent behavior.
Peer and social variables. Results from the multiple regression analyses using peer and social factors as inde- pendent variables and students' delinquency score as the dependent variable are presented in Table 4, with bivariate correlations between the delinquency score and each inde- pendent variable. The first variable to be entered into the regression equation, and the strongest predictor of delin- quency within this set of independent variables, was peer delinquency (Beta weight = .53; Multiple R = .62). Other factors that entered into the equation were: whether parents approved of friends (negative correlation with delin- quency), the extent of commerciaYentertainment activities, the extent of sport activities, and the extent of arts and cultural activities (negative correlation with delinquency). A factor that did not significantly increase the accuracy of the prediction equation was frequency of activities with peers.
School variables. Table 5 presents results from the multiple regression analyses using school factors as inde- pendent variables and students' delinquency score as the dependent variable, as well as bivariate correlations between the delinquency score and each independent vari- able. Of the school factors measured in the study, the strongest predictors of delinquency were how often classes were skipped and the number of times the student was suspended from school (Beta weights = .31 and .28, respec- tively; Multiple Rs = .42 and .50). Other factors that entered into the equation were the amount of time spent on homework (negative correlation with delinquency) and the number of times students thought about dropping out of school. The only variable that did not increase significantly the accuracy of the regression equation was students' grades in school.
Peer, social, and school variables. Results from the multiple regression analyses using all independent variables measured in the study (peer, social, and school factors) and students' delinquency score as the dependent variable are
Table 4 Stepwise Multi le Regression Results
for Analysis of 8eer and Social Variables
Independent variables Beta in equation' Bivariate rs weight Multiple R' Peer delinquency .62* .53 .62 Parents approve of friends -.3W -.15 .64 Commercial/entertainment
activities .w .11 .65 Sports activities .11 .10 .65 Arts and cultural activities -.19* -.06 .65
' p_'.Wl ' '
independent variables are listed in the order in which they were entered into the regression equation. Beta weights represent the value for each variable in the hnal regression equation Multiple R values are presenhxi for each variable for the step in which it was entered into the regression equation
presented in Table 6. As expected, the first variable to enter into the regression equation was peer delinquency (Beta weight = .42; Multiple R = .62). However, following this strong predictor was an interesting mix of school and peer and social factors. Listed in the order in which they entered into the regression equation, the remaining significant factors were: number of times suspended from school, parental approval of friends (negative correlation with delinquency), extent of commercial/entertainment activi- ties, amount of time spent on homework per week (negative correlation with delinquency), extent of sport activities, how often classes are skipped, number of times the student thought about dropping out of school, and frequency of activities with peers. Factors that did not enter into the regression equation and thus were not significant predictors of delinquency were the extent of participation in arts and cultural activities, and grades in school.
DI SCUSSl ON Results from this study identified some interesting
factors related to delinquency among youth. Consistent with the literature, males reported more delinquency than females. However, almost one-quarter of female students surveyed admitted to committing three or more delinquent behaviors within the past year. Morash4 also found males significantly more likely to be delinquent, but that "a rather
Table 5 Ste wise Multiple Re ression Results
for Analysis of Sc%ool Variables
Independent variables Beta in quation' Bivariate rs weight' Multiple R' How often classes are skipped .42* .31 .42 Number of times suspended
from school .36* .2a .53 Amount of time on homework
per week - 2F -.17 .53 Number of times thought
about dropping out of school .11* .08 .53
* p 5 . W l ' '
lndependent variables are listed in the order in which they were entered into the regression equation. Beta weights represent the value for each variable in ihe hnal regression equation Mulhple R values are presented for each variable for the step in which it was entered into the regression equation
Table 6 Ste wise Multiple Regression Results for Anal sis of
fee, and Social Variables and School Varialles
Independent variables in equation' Peer delinquency .42 Number of times suspended from school .17 Parents approve of friends -.12 Commercial/entertainment activities .11 Amount of time spent on homework per week -.lo Sports activities .I 1 How often classes are skipped 12
.05 -.05
Beta weight'
Number of times thought about dropping out of school Frequency of activities with peers
Multiple R' .62 .64 .66 6 7 .68 .68 .69 .69 .69
' '
lndependent variables are listed in the order in which they were entered into the regression equation. Beta weights represent the value for each variable in the final regression equabon Multiple R values are presented for each variable for the step in which it was entered into the regression equation
30 Journal of School Health January 1997, Vol. 67, No. 1
sizable group” of females had committed aggressive delin- quent acts, and “in some cases the girls’ seriousness scores were above the mean for both the male anti female groups.”
In terms of age, a greater number of ninth grade students (ages approximately 14- 15) were delinquent compared to the other grades studied, including grades seven, eight, 10, 11, and 12. One contributing factor to this pattern may be that, in later grades, youth most likely to engage in delin- quent behaviors also are more likely to have dropped out of school, and thus not be included in the sample. However, the finding of substantial levels of delinquency in ninth grade may indicate a need to target preveni.ion efforts to the junior high school level.
The bivariate analyses revealed some interesting rela- tionships between peer, social, and school variables, and students’ level of delinquency. Predictably, peers’ level of delinquency was strongly and positively correlated with students’ level of delinquency. This finding is consistent with previous theoretical formulations concerning the rela- tionship between delinquency and association with delin- quent peers.69 lo For example, both Differential Association Theory and Social Control Theory predict that a high level of delinquency wiIl be associated with a delinquent peer group. However, these theories differ in terms of causal linkages. While Differential Association Theory states that a youth will learn delinquent behaviors by associating with a delinquent peer group, Social Control Theory states that delinquent youth will seek out a delinquent peer group. Unfortunately, due to the cross-sectional nature of this study, the direction of the causal relationship cannot be determined.
Students who reported engaging in activities often with peers were almost as likely to report no delinquency as a moderatehigh level of delinquency. This finding suggests frequent association with peers is not sufficient to explain delinquency. Agnew’ states that the impact of delinquent peers on an adolescent’s own behavior depends on the amount of contact with peers, the extent to which peers are delinquent, and the extent to which the adolescent feels emotionally close to the peers. Agnew suggests that delin- quency can be reduced by altering the relationship between the adolescent and delinquent peers, or reducing emotional closeness, thus increasing the ability to resist peer pressure.
Another interesting finding was that students who reported a high level of involvement in sports were consid- erably more likely to report a moderatehigh level of delin- quency than were students who reported a low level of sports activity. This finding raises the question of whether involvement in contact sports sanctions the use of violence in other activities.
The nature of students’ extracurricular and leisure activi- ties was associated with level of delinquency. Students who reported a high level of involvement in commercial/enter- tainment activit ies were more l ikely to report a moderatelhigh level of delinquency, and students who reported a high level of involvement in arts and cultural activities were more likely to report no delinquency. Possible explanations for these findings art: that commer- ciallentertainment activities tend to be group-oriented, while arts and cultural activities tend to be individual- oriented. In addition, there may be more opportunity for youth to engage in delinquency in a mall setting, for exam- ple, than in a museum.
In terms of school factors, it is not surprising that students who spend more time on homework and have high grade averages are less likely to report delinquent behavior. Nor is it surprising that students who skip school often or have been suspended are more l ikely to report a moderatehigh level of delinquency. What is important to note, however, is the magnitude of this relationship. Students who skip school were three times more likely to report a moderatehigh level of delinquency than no delin- quency. This finding underscores the importance of keep- ing young people in school.
Multivariate analyses were conducted to identify the factors most important in predicting delinquent behavior, and to identify those factors that do not appear to enhance the ability to predict delinquent behavior. Consistent with the literature, the strongest predictor of delinquent behavior within the group of peer and social variables was peer delinquency. Interestingly, as discussed above, frequency of activities with peers was not a significant factor in the regression equation.
Within the group of school variables, the strongest predictors of delinquent behavior were how often classes were skipped and the number of times students were suspended from school. Particularly since students’ grades in school did not significantly increase the accuracy of the regression equation, students who are not in school may be using this time to engage in delinquent behaviors.
The multiple regression analyses using all of the inde- pendent variables measured in the study are particularly interesting because they indicate that both peer and social factors, as well as school factors, are important variables in predicting delinquency. Again, as expected, peer delin- quency was the strongest predictor of delinquency, followed by number of times suspended from school, parental approval of friends (negative correlation with delinquency), extent of commerciallentertainment activi- ties, amount of time spent on homework per week (negative correlation with delinquency), extent of sport activities, how often classes are skipped, number of times the student thought about dropping out of school, and frequency of activities with peers.
While strong relationships were found between these risk factors and delinquency, not all youth exposed to risk factors develop delinquent behaviors. The notion of resiliency, or protective factors, has recently been proposed to account for these exceptions. For example, it has been suggested that the presence of protective factors, such as positive family interaction, can offset the effects of risk factors, such as low socioeconomic status.’S It may be that the presence of numerous risk factors, such as those found in this study, coupled with a lack of protective factors, places a young person at greatest risk for delinquent behav- ior. Intervention programs that attempt to foster protective factors, while at the same time reducing or minimizing the effects of risk factors, may be among the most effective strategies for reducing delinquent behavior.
CONCLUSION The problem of youth violence causes great concern in
today’s society. Results from this study raise a number of questions and underscore the need for further research in several areas. Are female adolescents becoming more
Journal of School Health January 1997, Vol. 67, No. 1 31
delinquent? Is delinquent behavior starting at younger ages? How can we lessen the effects of negative peer rela- tionships? Do extracurricular activities that involve physi- cal contact sanction the use of violence in other activities? How can we discourage students from skipping school? Do schools need to reconsider suspension policies? What protective factors are most likely to enhance resiliency among youth, and what methods are most effective in enhancing these factors? Further research will help answer these questions, and address the problem of delinquent behavior among youth.
References 1. Agnew R. The interactive effects of peer variables on delinquency.
2. Brownfield D, Thompson K. Attachment to peers and delinquent
3. Giordano PC, Cernkovich SA, Pugh MD. Friendships and delin-
4. Morash M. Gender, peer group experiences, and seriousness of
Crim. 1991;29( 1):47-72.
behaviour. Can J Crim. 1991;33(1):45-60.
quency. Am JSoc. 1986;91(5):1170-1202.
delinquency. J Res Crim Del. 1986;23(1):43-67.
5 . Pabon E, Rodriguez 0, Gurin G. Clarifying peer relations and delin- quency. Youth Soc. 1992;24(2): 149-165.
6. Thornberry TP, Lizotte AJ, Krohn MD, Farnworth M, Jang SJ. Delinquent peers, beliefs, and delinquent behavior: A longitudinal test of interactional theory. Crim. 1994;32( 1 ):47-83.
7. Warr M. Age, peers, and delinquency. Crim. 1993;31(1): 17-40, 8 . Warr M. Parents, peers, and delinquency. Soc Forces.
9. Sutherland EH. Criminology, 4th ed. Philadelphia, Pa: JB Lippincott; 1947.
10. Hirschi T. Causes of Delinquency. Berkeley, Calif University of California Press; 1969.
1 I . Smith DA, Visher CA, Jajoura GR. Dimensions of delinquency: Exploring the correlates of participation, frequency, and persistence of delinquent behavior. J Res Crim Del. 1991;28( 1):6-32.
12. Smith RB, Bertrand LD, Arnold BL, Hornick JP. A Srudy ofthe Level and Nature of Youth Crime and Violence in Calgary. Calgary, Alberta: Calgary Police Service; 1995.
13. Clayton RR, Voss HL. Technical Report on Drug Abuse and Dropouts. Rockville, Md: National Institute on Drug Abuse; 1982.
14. Graham J , Bowling B. Young People and Crime. London, England: Home Office; 1995.
15. Yoshikawa H. Prevention as cumulative protection: Effects of early family support and education on chronic delinquency and its risks.
I993;72( I ):247-264.
Psycho1 Bull. 1994;115( 1):28-54.
A S 11 A P A + R T N E R S
President's Diamond Endowment Partner + Blue Cross/Blue Shield of Illinois, 233 N. Michigan Ave., Chicago, IL 60601-5655
Platinum Endowment Partner + McGovern Fund for the Behavioral Sciences, 6969 Brompton, Houston, TX 77025
Gold Endowment Partner + + + +
Children's Health Market, P.O. Box 7294, Wilton, CT 06897 Consumer Health Care Division of Pfizer, Inc., New York, NY 1001 7 JFK Health World, 1301 S. Grove Ave., Barrington, IL 60010 Tambrands, Inc., One Marcus Ave., Lake Success, NY 1 1042
Silver Endowment Partner + + Dept. of Health Science Education, University of Florida, Gainesville, FL 3261 1 The Imagineering Group LLC, 96 Atlantic Ave., Lynbrook, NY 1 1563
Sustaining Partner + + + +
Dept. of Adult Counseling, Health and Vocational Education, Kent State University, Kent, OH 44242-0001 School Health Corporation, 865 Muirfield Drive, Hanover Park, IL 60103 Southern Illinois University at Carbondale Foundation, Carbondale, IL 6290 1 Southern Illinois University at Edwardsville Foundation, Edwardsville, IL 62026- 1082
Century Partner + + + American Optometric Association, 1505 Prince Street, Suite 300, Alexandria, VA 223 14-28 16 Commercial Press, Inc., 115 S. Depeyster St., Kent, OH 44240 Meeks Heit Publishing Co., P.O. Box 121, Blacklick, OH 43004
32 Journal of School Health January 1997, Vol. 67, No. 1