the relationship between pharmacokinetic exposure and qt ... · health network communications 2008,...
TRANSCRIPT

2nd Annual Exploratory Clinical Development CongressHealth Network Communications 2008, London
The Relationship between Pharmacokinetic exposure and QT prolongation in Cardiac Safety Trials
A Ring (Phase I-IIa Biostatistics)Boehringer Ingelheim Pharma GmbH & Co. KG
2
Overview
• The QT interval as a biomarker
• Primary analysis according to ICH E14
• “PK-QT modelling” analysis in TQT studies
- Linear and nonlinear approach
- Case studies
- Current regulatory position
• Use of exposure response-modelling
- Early Phase I studies
- Oncology
• Conclusions
3
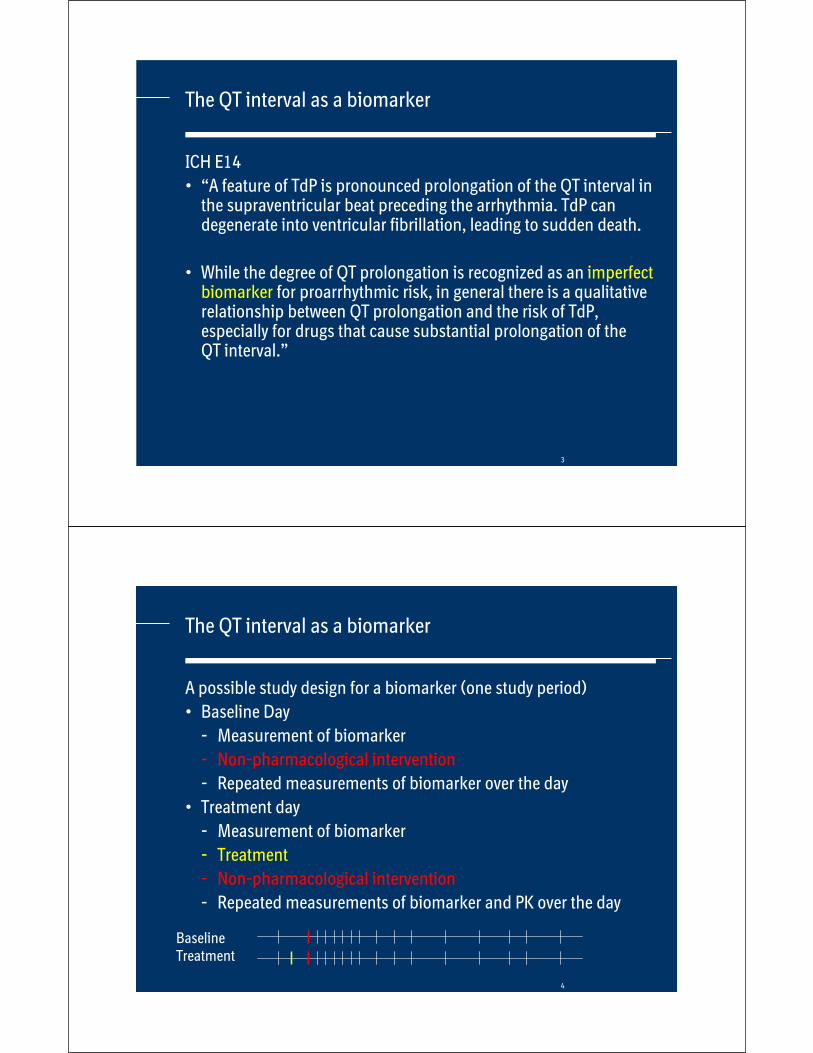
The QT interval as a biomarker
ICH E14
• “A feature of TdP is pronounced prolongation of the QT interval in the supraventricular beat preceding the arrhythmia. TdP can degenerate into ventricular fibrillation, leading to sudden death.
• While the degree of QT prolongation is recognized as an imperfectbiomarker for proarrhythmic risk, in general there is a qualitative relationship between QT prolongation and the risk of TdP, especially for drugs that cause substantial prolongation of the QT interval.”
4
The QT interval as a biomarker
A possible study design for a biomarker (one study period)
• Baseline Day
- Measurement of biomarker
- Non-pharmacological intervention
- Repeated measurements of biomarker over the day
• Treatment day
- Measurement of biomarker
- Treatment
- Non-pharmacological intervention
- Repeated measurements of biomarker and PK over the day
BaselineTreatment

5
The QT interval as a biomarker
A possible study design for GLUCOSE in metabolic trials
• Baseline Day
- Measurement of glucose
- Glucose/Meal tolerance test
- Repeated measurements of glucose over the day
• Treatment day
- Measurement of biomarker
- Treatment
- Glucose/Meal tolerance test
- Repeated measurements of glucose and PK over the day
BaselineTreatment
6
The QT interval as a biomarker
A possible study design for QT studies
• Baseline Day
- ECG recording
- Avoid any interventions/stress
- Repeated ECG recordings over the day
• Treatment day
- ECG recording
- Treatment
- Avoid any interventions/stress
- Repeated ECG recordings and PK measurements over the day
BaselineTreatment
7
The QT interval as a biomarker
Reasons for such study designs
• Allow for intraindividual comparison of baseline and treatment data
- Cover circadian rhythms or other systematic patterns of the biomarker
• Pharmacokinetic measurements are sampled together with biomarker measurements to enable integrated exposure-response modelling
• The QT interval can be interpreted as “just another biomarker”, and hence similar methods as for other biomarkers could be utilized
8
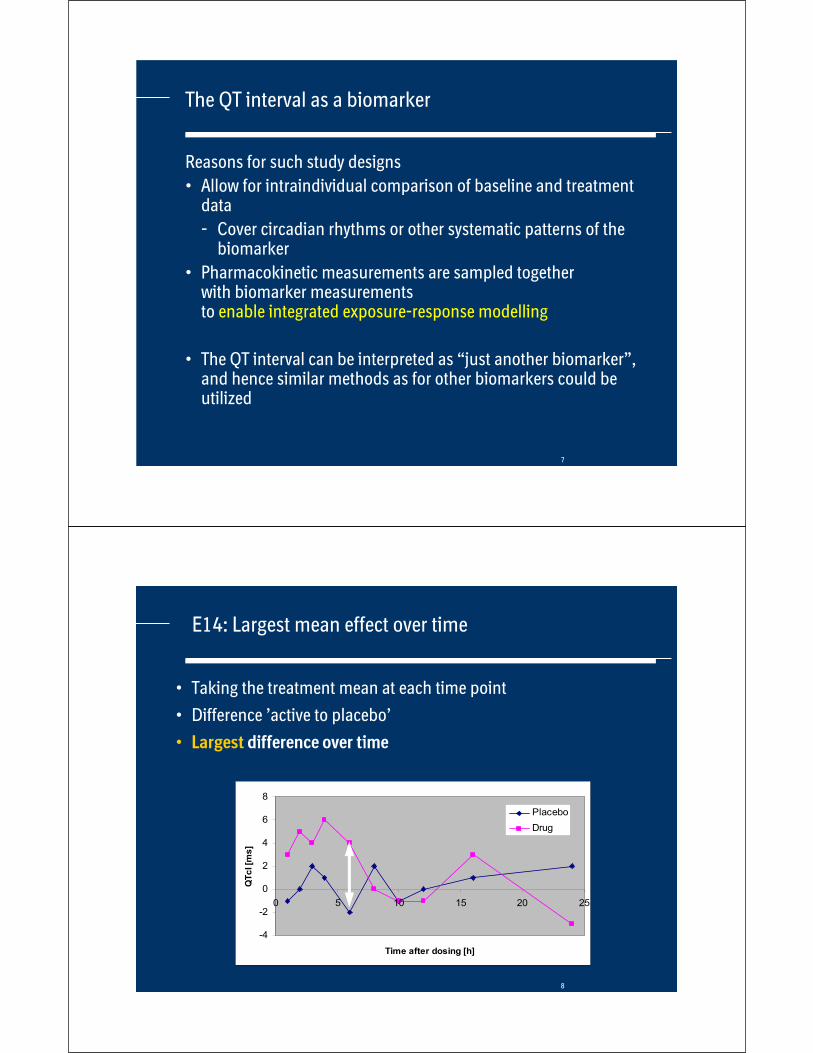
E14: Largest mean effect over time
• Taking the treatment mean at each time point
• Difference ’active to placebo’
• Largest difference over time
-4
-2
0
2
4
6
8
0 5 10 15 20 25
Time after dosing [h]
QT
cI [m
s]
Placebo
Drug
9
Primary analysis according to ICH E14
• Primary analysis in “thorough QT studies” is only based on the ECG recordings
• Pharmacokinetic measurements were primarily seen to justify the appropriateness of the trial design, specifically the selection of the doses and of the sampling times
• “While the peak serum concentration does not always correspond to the peak effect on QT/QTc interval, care should be taken to perform ECG recordings at time points around the Cmax.”
• “In general, the duration of dosing or dosing regimen should be sufficient to characterize the effects of the drug and its active metabolites at relevantconcentrations.”
• “If not precluded by considerations of safety or tolerability due to adverse effects, the drug should be tested at substantial multiples of the anticipated maximum therapeutic exposure.”
10
Primary analysis according to ICH E14
• Reasons for this specification of this primary analysis
- This primary analysis is in most cases conservative and hence provides efficient protection of the public
- Analysis is rather easy to describe (but statistically it is not so easy to implement it)
• Main difference: QT (c) interval is a safety parameter
- Analysis should not be based on modelling assumptions which could potentially be wrong
- For regulators, safety biomarkers are of more importance than efficacy biomarkers

11
E14: Largest mean effect over time
• Case study A for “no effect drug” • QTcN time-matched change from baseline • Largest difference: 1.8 ms (with 4.3 ms 95% UCL)• Note the placebo effect for the change from baseline (day -1)
-10
-5
0
5
10
0:00 2:00 4:00 6:00 8:00 10:00 12:00
Placebo
Pbo-corrected
3xDose
95%-UCL
12
-10
-5
0
5
10
0:00 2:00 4:00 6:00 8:00 10:00 12:00
Placebo
Pbo-corrected
2xDose
95%-UCL
Largest mean effect over time
• Case study B for “mild QT prolongation”
• QTcI time-matched change from baseline
• Largest difference: 7.1 ms (with 9.3 ms 95% UCL)
13
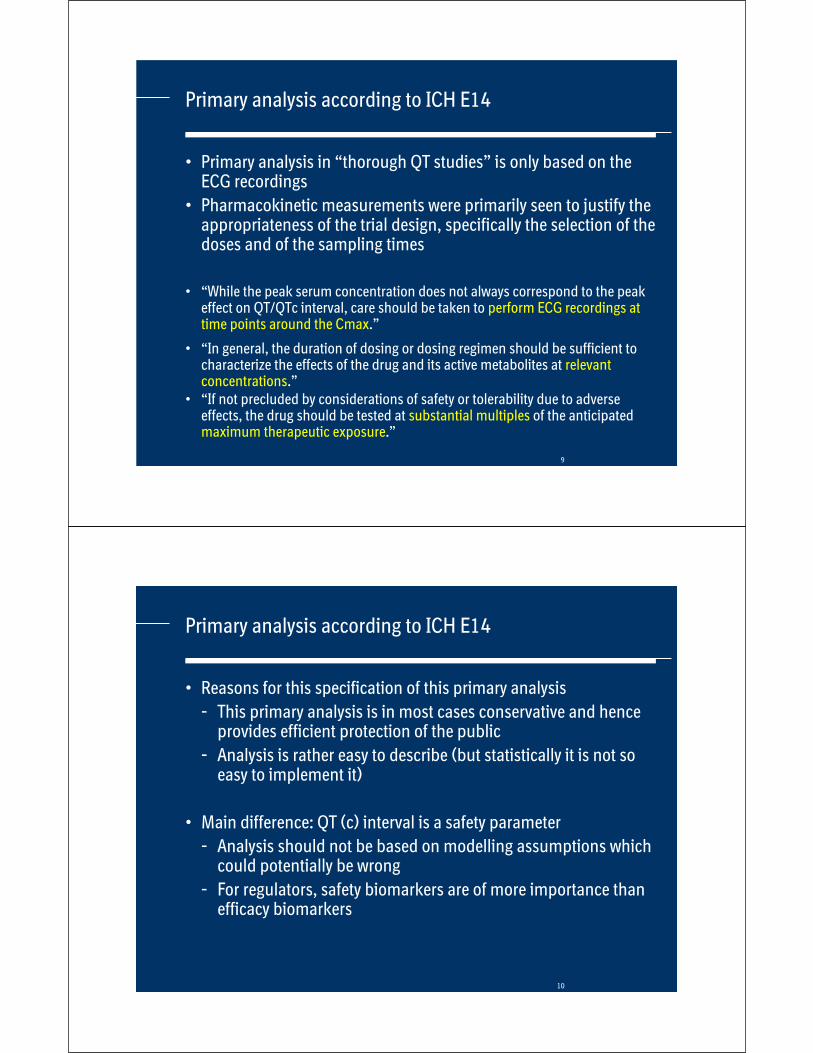
Placebo
1x dose
2x dose
4x dose
8x dose
Dose dependent QTc prolongationCase study C
14
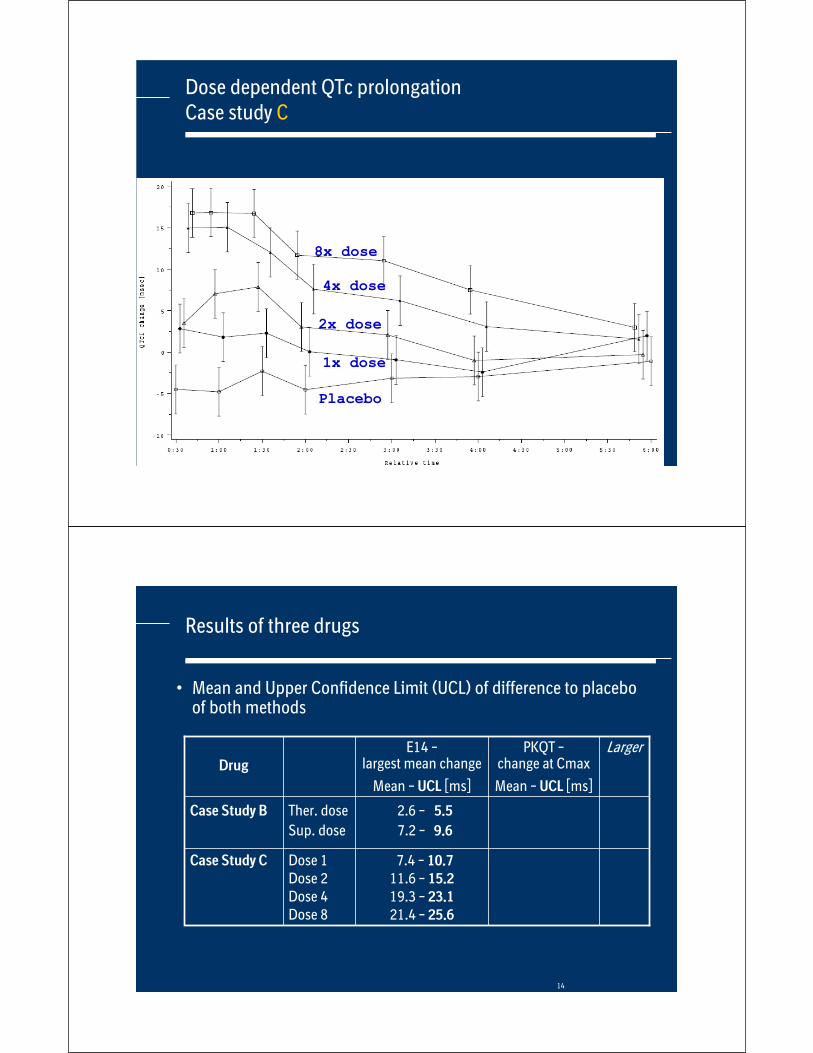
Results of three drugs
• Mean and Upper Confidence Limit (UCL) of difference to placebo of both methods
Drug
E14 –largest mean change
Mean – UCL [ms]
PKQT –change at Cmax
Mean – UCL [ms]
Larger
Case Study B Ther. dose
Sup. dose
Dose 1Dose 2Dose 4Dose 8
2.6 – 5.5
7.2 – 9.6
Case Study C 7.4 – 10.7
11.6 – 15.2
19.3 – 23.1
21.4 – 25.6
15
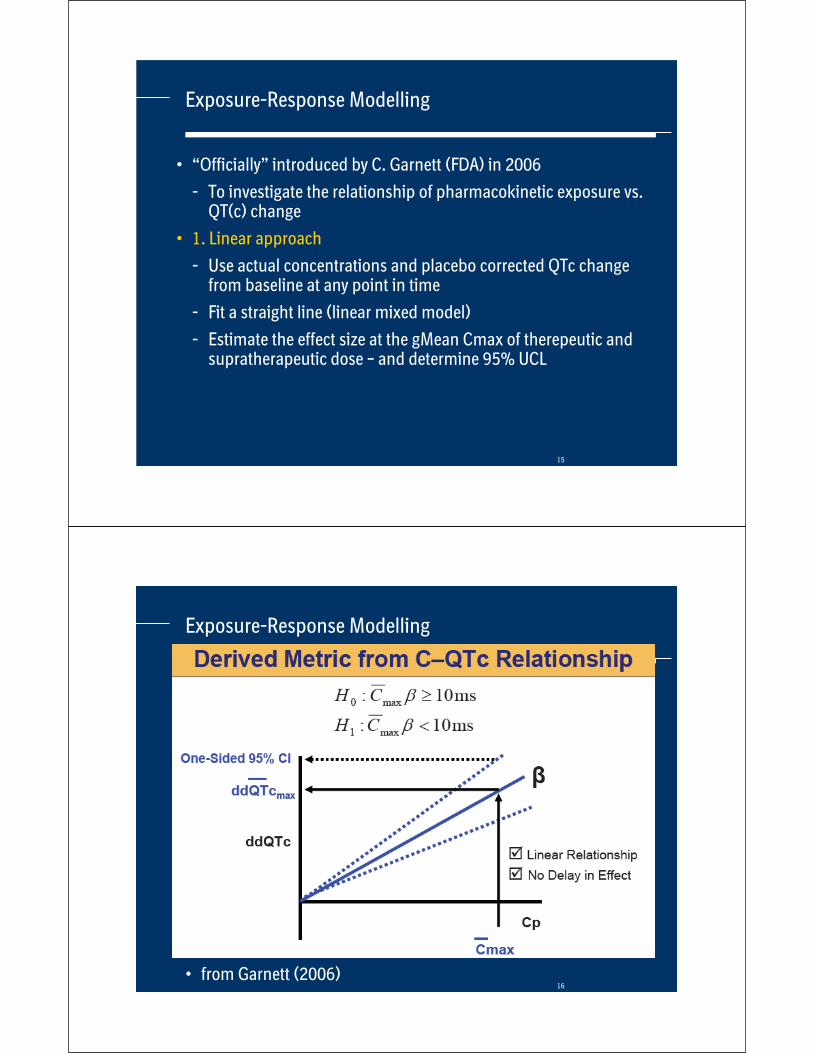
Exposure-Response Modelling
• “Officially” introduced by C. Garnett (FDA) in 2006
- To investigate the relationship of pharmacokinetic exposure vs. QT(c) change
• 1. Linear approach
- Use actual concentrations and placebo corrected QTc change from baseline at any point in time
- Fit a straight line (linear mixed model)
- Estimate the effect size at the gMean Cmax of therepeutic and supratherapeutic dose – and determine 95% UCL
16• from Garnett (2006)
Exposure-Response Modelling

17
Exposure-Response Modelling
• Main Assumptions of the linear PK-QTc modelling
- Linear relationship between concentration and QTc effect
- No delay in effect (Hysteresis)
- No (active) metabolites
QTc-Effect = E0 + p * Conc
18
Case study B - reevaluated
• At Cmax of supratherapeutic dose: 5.8 ms (95% UCL: 6.9 ms)
Cmax,ss

19
Case study C - reevaluated
• Linear relationship?
• QTcI time matched change from baseline
-30
-20
-10
0
10
20
30
40
50
60
70
Conc
dQTcICmax,D1 Cmax,D2 Cmax,D4 Cmax,D8
20
Comparison of PKQT and E14
• Mean and Upper Confidence Limit (UCL) of difference to placebo of both methods
Drug
E14 –largest mean change
Mean – UCL [ms]
PKQT –change at Cmax
Mean – UCL [ms]
Larger
Case Study B Ther. dose
Sup. dose
Dose 1Dose 2Dose 4Dose 8
2.6 – 5.5
7.2 – 9.6
3.7 – 4.3
5.7 – 6.6
E14E14
Case Study C 7.4 – 10.7
11.6 – 15.2
19.3 – 23.1
21.4 – 25.6
5.9 – 6.2
9.6 – 10.1
19.1 – 20.1
30.5 – 31.6
E14E14E14
PKQT
21
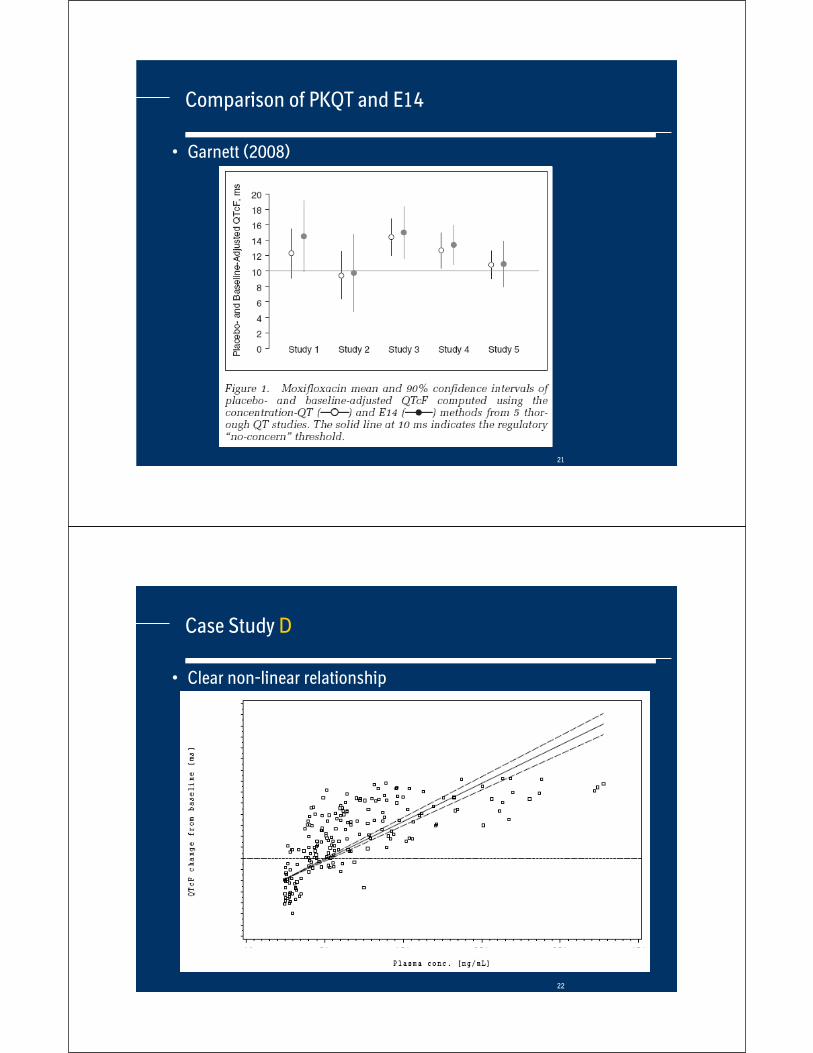
Comparison of PKQT and E14
• Garnett (2008)
22
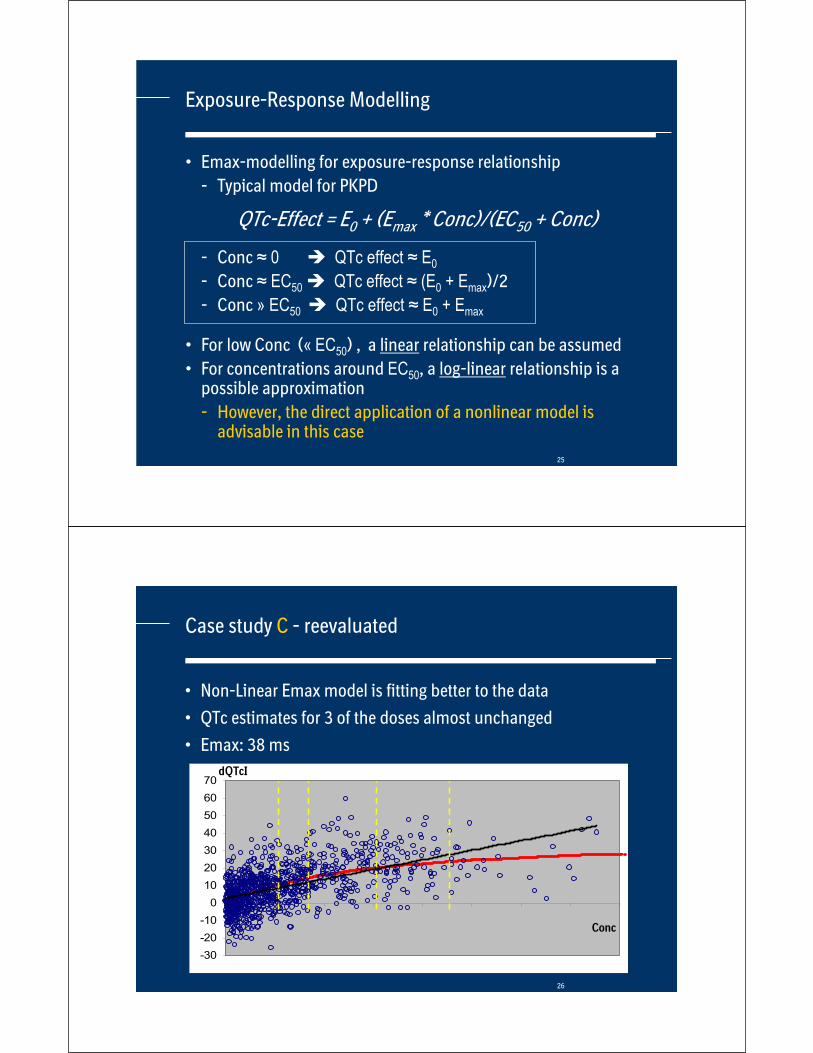
Case Study D
• Clear non-linear relationship

23
PK-QT modelling: Improvements
• 2. Non-Linear approach
- Typical effect-relationship: Emax-model
- Use actual concentrations and placebo corrected QTc change from baseline at any point in time
- Estimate the effect size at the gMean Cmax of therepeutic and supratherapeutic dose – and determine 95% UCL
• Assumption
- Again: no hysteresis, no active metabolites
• Strong interaction between Statisticians, Pharmacometriciansand Clinicians advised
24
Emax model, Emax=20 ms, EC50=1000
Emax model
0
2
4
6
8
10
12
14
16
18
20
0 500 1000 1500 2000 2500 3000
QTc-Effect = E0 + (Emax * Conc)/(EC50 + Conc)
QTc
concentration
25
Exposure-Response Modelling
• Emax-modelling for exposure-response relationship
- Typical model for PKPD
- Conc 0 QTc effect E0
- Conc EC50 QTc effect (E0 + Emax)/2
- Conc » EC50 QTc effect E0 + Emax
• For low Conc (« EC50) , a linear relationship can be assumed
• For concentrations around EC50, a log-linear relationship is a possible approximation
- However, the direct application of a nonlinear model is advisable in this case
QTc-Effect = E0 + (Emax * Conc)/(EC50 + Conc)
26
-30
-20
-10
0
10
20
30
40
50
60
70
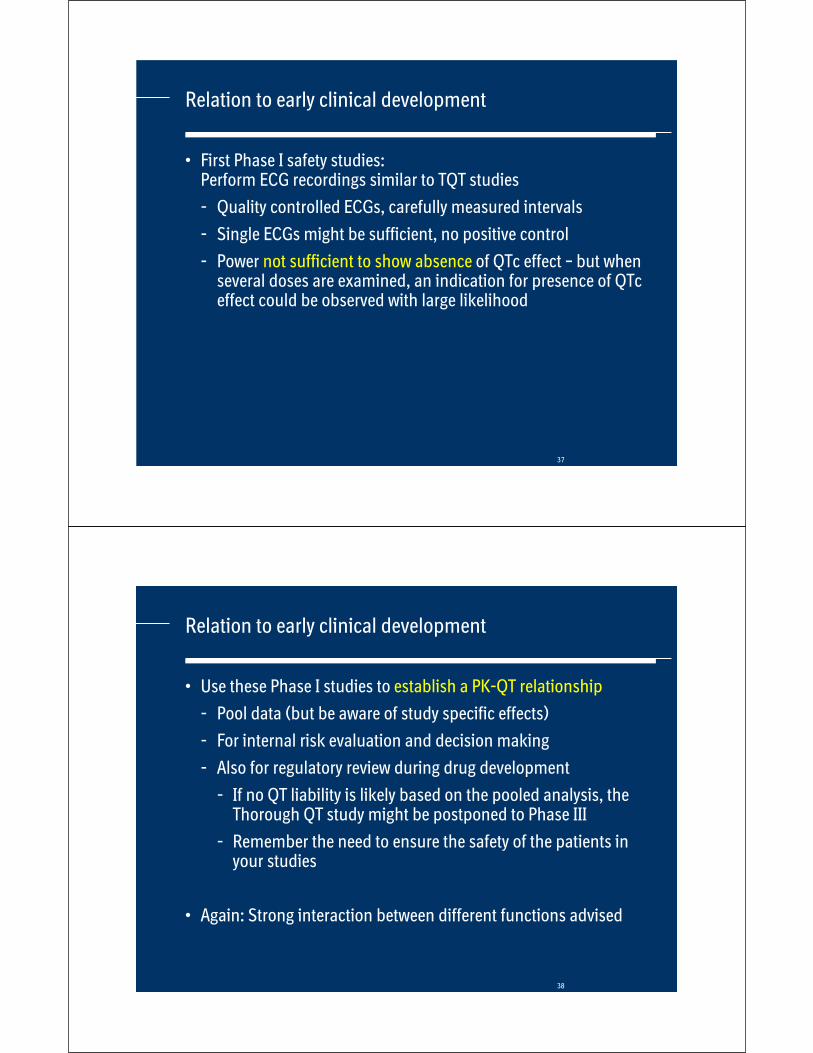
Case study C - reevaluated
• Non-Linear Emax model is fitting better to the data
• QTc estimates for 3 of the doses almost unchanged
• Emax: 38 ms
Conc
dQTcI

27
Case study D - reevaluated
• Non-Linear Emax model is clearly better
28
PK-QT modelling: Improvements
Emax-type relation is not the only possible PKPD model
• If this model does not fit – try something else (e.g. Hill coefficient)
• Examples for causes of indirect relationship
- Effect of drug on heart rate
- Delay due to between blood exposure and target place (distribution)
- Active metabolites
• Which are relevant, how can they be detected?
• Again: Strong interaction between Statisticians, Clinicians and Pharmacometricians advised

29
Stepwise approach in TQT trials
• Perform E14 analysis – largest change from baseline
- Use repeated measurements analysis for highest statistical efficiency
• If E14 analysis is clearly negative – STOP, otherwise explore linear PK-QT model
- Any indication for a deviation from linearity?
- If yes, explore non-linear mixed effects model (e.g. Emax)
• Provide hysteresis plots
- Any indication for delayed effects?
- If yes, hand-over to NONMEM experts for refined modelling
- Incorporate analysis NONMEM model (based on existing PK model, if possible)
• Stepwise allows for putting the capacity, where it is needed
30
Current regulatory position (FDA)

31
Current regulatory position
• “If the ‘thorough QT/QTc study’ is positive, additional evaluation in subsequent clinical studies should be performed.
• One objective of this evaluation should be to fully describe theeffect of the drug on the QT/QTc interval in the target patient population with particular attention to dose and concentration-related effects.”
32
Specific example: Sitagliptin
• Dose used: 100 mg and 800 mg (8fold therapeutic dose)

33
Specific example: Sitagliptin
• Dose used: 100 mg and 800 mg (8fold therapeutic dose)
34
Specific example: Sitagliptin
• Dose used: 100 mg and 800 mg (8fold therapeutic dose)
- Single dose, but worst case (with regard to PK) clearly covered
• E14 result:
- no QT(c) effect at 100 mg
- Supratherapeutic dose: 8ms maximal effect (with 95% UCL of 11 ms) 3 hours post dose/ slight prolongation also at the other time points
• Did the sponsor do wrong in selecting a too high supratherapeutic dose?

35
Specific example: Sitagliptin
• Did the sponsor do wrong in selecting a too high supratherapeuticdose?
• NO: This dose clearly characterized the QT(c) effect of the drug
• PK-QT model came out with an UCL of less than 10 ms
• Label only mentions this characterization of the QTc effect
- No precaution/warnings with regard to cardiac safety
36
Specific example: Sitagliptin
• Other question: If supratherapeutic doses are used to characterisethe QT(c) effect, based on a PK-QT model: Do we still need the therapeutic doses?
• Including therapeutic doses are still recommended: Modelling should be supportive, but not the main analysis (just in case the supratherapeutic dose overshoots the limit)
• Including two doses allows better for checking the inherent assumptions of the models (e.g. linearity)
• Therapeutic pharmacokinetic exposures should not only be a minority of the data material in TQT trials
37
Relation to early clinical development
• First Phase I safety studies: Perform ECG recordings similar to TQT studies
- Quality controlled ECGs, carefully measured intervals
- Single ECGs might be sufficient, no positive control
- Power not sufficient to show absence of QTc effect – but when several doses are examined, an indication for presence of QTceffect could be observed with large likelihood
38
Relation to early clinical development
• Use these Phase I studies to establish a PK-QT relationship
- Pool data (but be aware of study specific effects)
- For internal risk evaluation and decision making
- Also for regulatory review during drug development
- If no QT liability is likely based on the pooled analysis, the Thorough QT study might be postponed to Phase III
- Remember the need to ensure the safety of the patients in your studies
• Again: Strong interaction between different functions advised

39
Application in oncology
• “There are some drugs that cannot be studied in a “thorough QT/QTc study” in healthy volunteers due to safety or tolerability concerns (e.g., cytotoxic cancer drugs). In such cases, the “thorough QT/QTc study” can often be conducted in patient populations.
• When this is not possible, the importance of detecting and modifying this safety risk means that other ways of detecting effects on the QT/QTc interval need to be developed. These might include the collection of ECGs at multiple time points under tightly controlled settings that target a broad range of doses earlyin development.”
40
Application in oncology
• E14 approach can usually not be applied in oncology
- Most often, supratherapeutic doses cannot be studied
• PK-QT modelling could be the central tool in this therapeutic area
• Again, collect quality controlled ECGs, carefully measured intervals
- Phase I patient studies are best options
• Use these studies to establish a PK-QT relationship
- Characterize the effect potential within the therapeutic window
• Questions on generalisation and extrapolation of the results remain,but less of concern if the drug is effective in the proposed range of pharmacokinetic exposure
41
Conclusions
• PK-QT modelling is supportive to E14 analysis in TQT trial
• Analysis assumptions are often fulfilled, but should generally be checked
- Linearity of effect
- Delay of effect
• The data rich TQT studies with carefully measured ECG intervals provide a sound basis for developing the PK-QT models (and its methodologies)
- The situation might be different pre-clinically (be aware of false negative signals from automatic ECG measurements)
• Establishing a PK-QT relationship early on could be supportive for internal decision making and communication with regulators
42
Biopharmaceutical forum
• http://www.biopharmnet.com/cardiac.html
• Network forum to discuss questions
• Literature on QT evaluation

43
Acknowlegdements
• Michael Koenen-Bergmann (Clinical)
• Katja Grasmäder, Vincent Duval (Pharmacokinetics)
• Christina Ring (Biostatistics, University of Ulm)
• Patricia Glomb (Biostatistics, University of Heidelberg)
44
References
General PKPD
• Csajka C, Verotta D. Pharmacokinetic-PharmacodynamicModelling: History and Perspectives. J Pharmacokin. Pharmacodyn. 2006: 227-279
• Bonate P. Pharmacokinetic-Pharmacodynamic Modeling and Simulation. Springer 2005.
PKQT
• Garnett CE et al. Concentration-QT Relationships Play a Key Role in the Evaluation of Proarrhythmic Risk During Regulatory Review. J Clin Pharmacol., 2008:13-18

45
Appendix
BACK-UP
46
Current regulatory position (FDA)
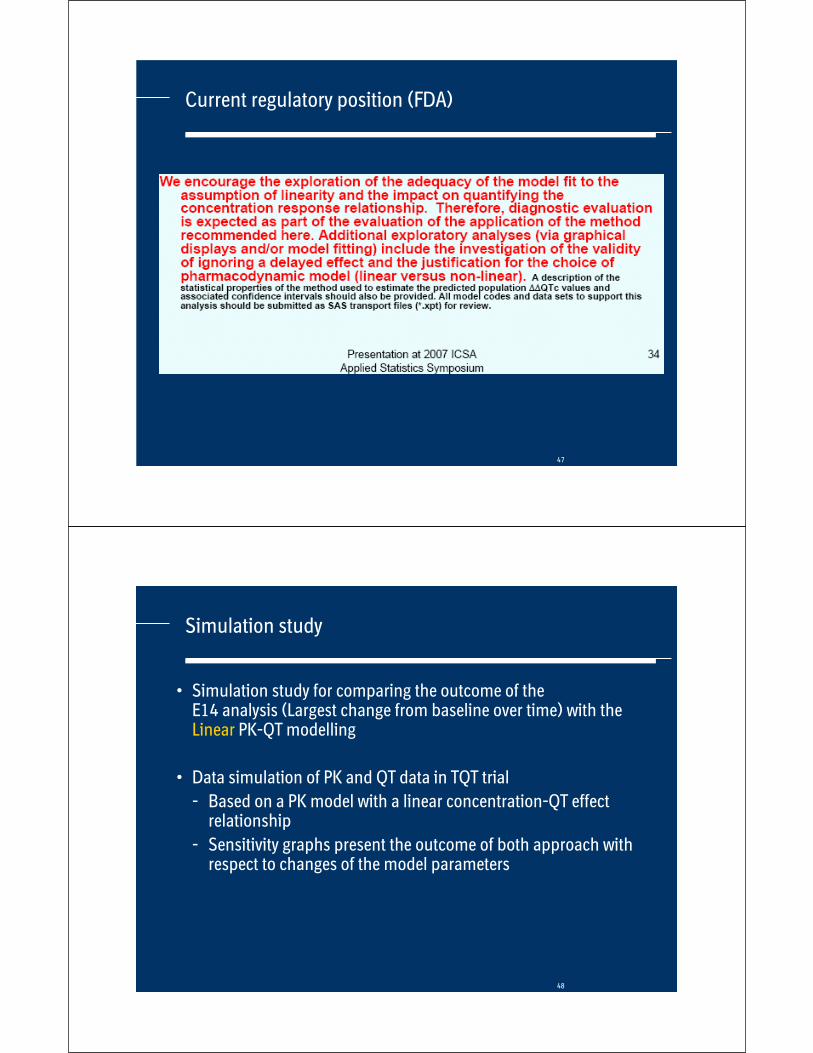
47
Current regulatory position (FDA)
48
Simulation study
• Simulation study for comparing the outcome of the E14 analysis (Largest change from baseline over time) with the Linear PK-QT modelling
• Data simulation of PK and QT data in TQT trial
- Based on a PK model with a linear concentration-QT effect relationship
- Sensitivity graphs present the outcome of both approach with respect to changes of the model parameters
49
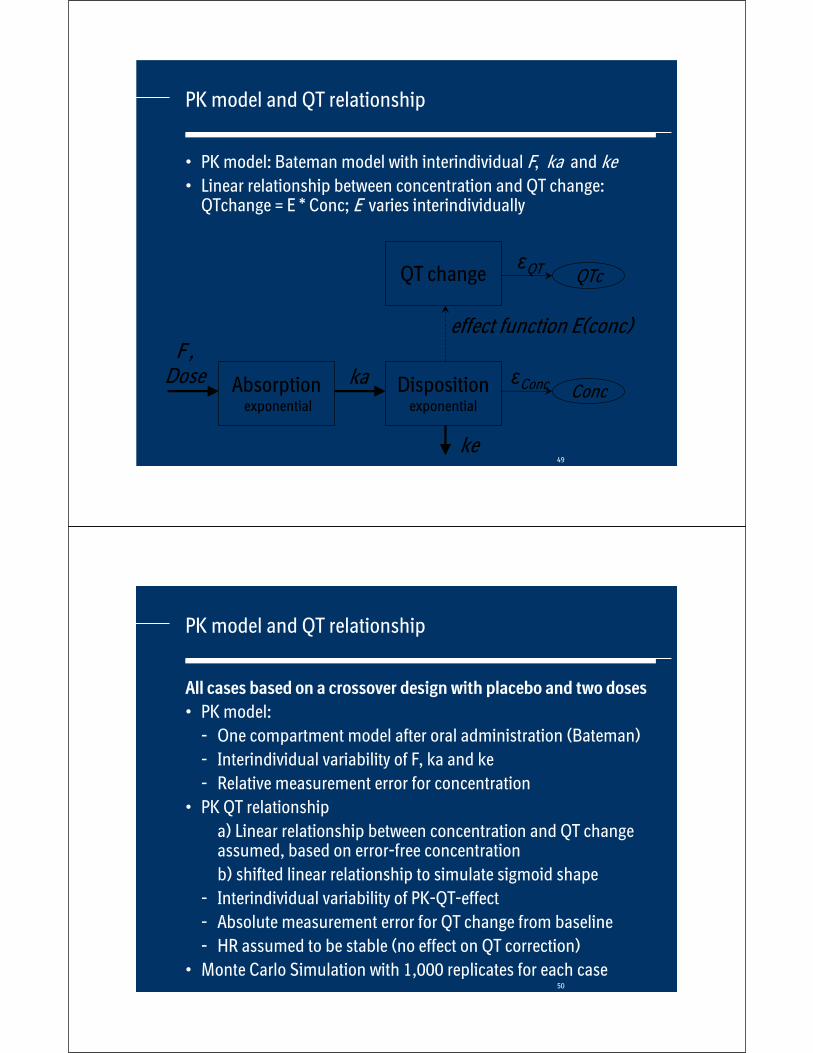
PK model and QT relationship
• PK model: Bateman model with interindividual F, ka and ke• Linear relationship between concentration and QT change:
QTchange = E * Conc; E varies interindividually
Absorptionexponential
Dispositionexponential
ka
ke
F ,Dose Conc Conc
effect function E(conc)
QT change QT QTc
50
PK model and QT relationship
All cases based on a crossover design with placebo and two doses
• PK model:
- One compartment model after oral administration (Bateman)
- Interindividual variability of F, ka and ke
- Relative measurement error for concentration
• PK QT relationship
a) Linear relationship between concentration and QT change assumed, based on error-free concentration
b) shifted linear relationship to simulate sigmoid shape
- Interindividual variability of PK-QT-effect
- Absolute measurement error for QT change from baseline
- HR assumed to be stable (no effect on QT correction)
• Monte Carlo Simulation with 1,000 replicates for each case

51
Example Outcomes of the model (12 subjects)
Concentration without error Concentration with error
delta QTc
0,0
0,1
0,2
0,3
0,4
0,5
0 3 6 9 12
0,0
0,1
0,2
0,3
0,4
0,5
0,6
0 3 6 9 12
-10
-5
0
5
10
15
0 3 6 9 12
52
Results of simulation studies
• The results of the PK-QT modelling and the E14 analysis are generally similar
• The bias of the PK-QT modelling is smaller than E14, but increases for higher doses
• Performance of PK-QT modelling is better than E14 up to moderate PK measurement error
• PK-QT analysis is sensitive to changes of its assumptions (sigmoid effect) and may underestimate the QTc effect, while E14 is very robust to those changes