the relationship between porter generic strategies and
TRANSCRIPT
The Relationship between Porter Generic
Strategies and Strategic Orientation An Applied Study on Jordanian Human Drugs Industrial Companies
Prepared by
Ibrahim Rafid Abdulhaleem
Supervisor
Dr. Sabah Hameed Agha
THESIS SUBMITTED IN PARTIAL FULFILLMENT
OF THE REQUIREMENTS FOR THE DEGREE OF
Master in Business Administration
Faculty of Business
Middle East University
July / 2011
II
DELEGATIONDELEGATIONDELEGATIONDELEGATION
I am Ibrahim Rafid Abdulhaleem I authorize Middle East University to make
copies of my dissertation to libraries, institutions, or people when asked
Name: Ibrahim Rafid Abdulhaleem
Signature:
Date: 17/ 10 / 2011
III
DISCUSSION COMMITTEE DECISIONDISCUSSION COMMITTEE DECISIONDISCUSSION COMMITTEE DECISIONDISCUSSION COMMITTEE DECISION
This dissertation was discussed under title:
The Relationship between Porter Generic Strategies and Strategic
Orientation: An Applied Study on Jordanian Human Drugs Industrial Companies
It was approved on 6 July 2011
Date: 6 / 8 / 2011

IV
ACKNOWLEDGEMENTACKNOWLEDGEMENTACKNOWLEDGEMENTACKNOWLEDGEMENT
This thesis is the product of an educational experience at
MEU, various people have contributed towards its completion at
different stages, either directly or indirectly, and any attempt to
thank all of them is bound to fall short.
To begin, I would like to express my whole hearted and
sincere gratitude to Dr. Sabah Hameed Agha for his guidance,
time, and patience, for supporting me and this thesis during every
stage of its development.
I would like to extend my special thanks to all workers at
MEU.
Sincerely Yours,
Ibrahim Rafid Abdulhaleem

V
DEDICATIONDEDICATIONDEDICATIONDEDICATION
I dedicate this thesis especially to two persons
The first one is the man who is standing all the time behind
me pushing me forward and never let me stop moving to the
best...trying to make me the best person in this world by his
encouragement, support and by providing all what I need to keep
walking to success.. to the man who is living inside me … to the
man who represent my spirit … so a great thanks to you Rafid AL-
Taha … my unique father.
The second one is the woman who represents the heart to
myself … the heart that will never stop working and will never
stop beating until the last moment in my life … the heart that
never think about herself and never think to take a rest … the
heart that all what she think about is how to supply me with all
the blood and oxygen that I need to continue my life helping me to
face the worst in this life without fearing … helping me to stand
up again after each downfall so a great thanks to you Hayfaa, AL-
Skaikhly … my fabulous mother.
And I also want to dedicate this thesis to my sisters and my
brother Mohammed for their support … so thanks for all .
VI
Table of Contents Page Subject
II DELEGATION
III DISCUSSION COMMITTEE DECISION
IV Acknowledgement
V Dedication
VI Table of Contents
VIII List of tables
X List of Figures
XI Appendices
XII Abstract in English Language
XIV Abstract in Arabic Language
1 Chapter One
General Framework 2 (1-1): Introduction 4 (1-2): Study Problem and Questions 5 (1-3): Significance of the Study 6 (1-4): Objectives of the Study
6 (1-5): Study Hypotheses 7 (1-6): Study Limitations 8 (1-7): Study Difficulties 8 (1-8): Terminologies
11 Chapter Two
Theoretical Framework and Previous Studies 12 (2-1): Introduction
13 (2-2): Porter Generic Strategies 24 (2-3): Strategic Orientation
35 (2-4): Previous Studies 41 (2-5): Study contribution to Knowledge
VII
Table of Contents
Page Subject
43 Chapter Three
Method and Procedures 44 (3-1): Introduction 44 (3-2): Study Methodology 45 (3-3): Study Population and Sample 48 (3-4): Study Model 49 (3-5): Study Tools and Data Collection
50 (3-6): Statistical Treatment 51 (4-3): Validity and Reliability
54 Chapter Four
Analysis of Results & Hypotheses Tests 55 (4-1): Introduction 55 (4-2): Descriptive analysis of study variables 63 (4-3): Study Hypotheses Tests
75 Chapter Five
Results, Conclusions and Recommendations 76 (5-1): Results 78 (5-2): Conclusions 79 (5-3): Recommendations
80 References 84 Appendices
List of Tables
VIII
Page Subject No.
33 The Dimensions of Strategic Orientation as reflected in many of the
researchers (2-1)
46 Jordanian Human Drugs Industrial Companies (3-1)
47 Descriptive sample of the demographic variables of the study (3-2)
53 Reliability of Questionnaire Dimensions (3-3)
56 Arithmetic mean, SD, item importance and importance level of Low
cost Strategy (4-1)
57 Arithmetic mean, SD, item importance and importance level of
Differentiation Strategy (4-2)
59 Arithmetic mean, SD, item importance and importance level of Focus
Strategy (4-3)
60 Arithmetic mean, SD, item importance and importance level of
Customer Orientation (4-4)
61 Arithmetic mean, SD, item importance and importance level of
Competitor orientation (4-5)
64
Correlation between Porter generic Strategies (low cost Strategy; differentiation Strategy; focus Strategy) and Strategic Orientation (Customer orientation; Competitor orientation) in Jordanian Human
Drugs Industrial Companies
(4-6)
65
Different between top management and marketing manager’s perspective about Porter generic strategies (low cost Strategy;
differentiation Strategy; focus Strategy) in Jordanian Human Drugs Industrial Companies
(4-7)
67 Difference between top management and marketing manager’s perspective about low cost Strategy in Jordanian Human Drugs
Industrial Companies (4-8)
68 Difference between top management and marketing manager’s
perspective about differentiation Strategy in Jordanian Human Drugs Industrial Companies
(4-9)
69 Difference between top management and marketing manager’s perspective about focus Strategy in Jordanian Human Drugs
Industrial Companies (4-10)
71
Difference between top management and marketing manager’s perspective about Strategic Orientation (Customer orientation; Competitor orientation) in Jordanian Human Drugs Industrial
Companies
(4-11)
List of Tables
IX
Page Subject No.
72
Different between top management and marketing manager’s
perspective about Customer orientation in Jordanian Human Drugs
Industrial Companies
(4-12)
74
Difference between top management and marketing manager’s
perspective about Competitor orientation in Jordanian Human Drugs
Industrial Companies
(4-13)

X
List of Figures
Page Subject No.
48 Study Model (3-1)

XI
Appendices
Page Subject No.
90 Names of arbitrators 1
91 Questionnaire of the Study 2
XII
The Relationship Between Porter Generic Strategies and Strategic
Orientation
An Applied Study on Jordanian Human Drugs Industrial Companies
Prepared by
Ibrahim Rafid Abdulhaleem
Supervised by
Dr. Sabah Hameed Agha
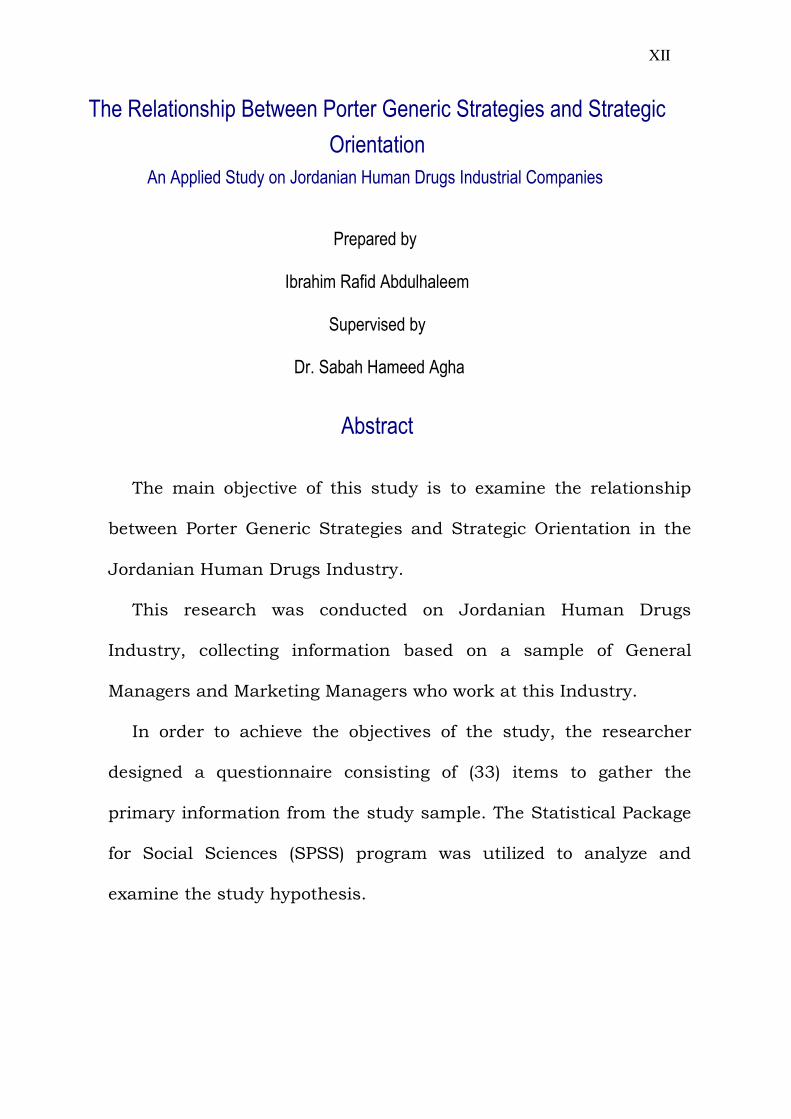
Abstract
The main objective of this study is to examine the relationship
between Porter Generic Strategies and Strategic Orientation in the
Jordanian Human Drugs Industry.
This research was conducted on Jordanian Human Drugs
Industry, collecting information based on a sample of General
Managers and Marketing Managers who work at this Industry.
In order to achieve the objectives of the study, the researcher
designed a questionnaire consisting of (33) items to gather the
primary information from the study sample. The Statistical Package
for Social Sciences (SPSS) program was utilized to analyze and
examine the study hypothesis.
XIII
A comprehensive analysis of the relationship between Porter
generic Strategies (low cost Strategy; differentiation Strategy; focus
Strategy) and Strategic Orientation (Customer orientation;
Competitor orientation) at level (α ≤ 0.05); the differences between
top management and marketing manager’s perspective about Porter
generic strategies (low cost Strategy; differentiation Strategy; focus
Strategy) at level (α ≤ 0.05); the difference between top management
and marketing manager’s perspective about low cost Strategy at
level (α ≤ 0.05); the difference between top management and
marketing manager’s perspective about differentiation Strategy at
level (α ≤ 0.05); the difference between top management and
marketing manager’s perspective about focus Strategy at level (α ≤
0.05); the difference between top management and marketing
manager’s perspective about Strategic Orientation (Customer
orientation; Competitor orientation) at level (α ≤ 0.05) and the
difference between top management and marketing manager’s
perspective about Customer orientation and Competitor orientation
at level (α ≤ 0.05) was assessed.
Finally, the researcher draws conclusions concerning the
results of the analysis, and the recommendations related to the
conclusions. At the meantime the researcher gave a space for
further research to do in the future.

XIV
ا����� ��� ا��ا�����ت ا����� �� ر�� وا�� �� ا��ا���� درا� �(��)�� '&% $�آ�ت �"!� ا�دو�� ا������ ا�رد���
إ'ــ*اد
ا��اه�- را/* '�*ا�.&�-
إ$ـ�اف ا�*آ� ر
��7ح �45* أ�2
ا�4&:9 ���&�8 ا������
ا����� ��� ا��ا�����ت ا����� �� ر�� وا�� �� ���ن ه=> ا�*را� إ�% ه*/;
و��.)�?A أه?*اف ا�*را?� . $�آ�ت �"!� ا�دو�� ا������ ا�رد��?� ا��ا���� /�
�??� '�!??� و��??���4?? ا��4& �??�ت ا� /)??�ة )33( $??4&; ا���C??5 ��??"�4- ا??����� �??�م
�� �� E4ا� �ا��? �?� )144( ا�*را �����A ا�4?* F?ي ا���� ء ذ�?H .���� و�?*?K �?/و
م ��R�"?5 ��ر ا���K�Qت ���:*ام ا�.��P اO وا�Nو�.&�&�M ��ى �4 ا������ت ?&�&�
�???�'�4��و�???- ا???�:*ام ا��*�???* �???� ا�???���S اA???�(.�� ��R�"???5O أه???*اف SPSS ا
7?&; ا�*را?� �����?�ت ا�*را?� و/��M���?K ا��.&�?T '4&�?� ��اء إو��* . ا�*را��
: أ��زه��% '*د �� ا�!��URإ
��??� �ً�R�"??5د '��??� دا�??� إ ا??��ا�����ت أن ا��.&�??T ا�??�4 �� أوY??K و�??
)ا��ا����� ا��Q&E ا�Q:4]�؛ ا��ا����� ا��P�4؛ ا?��ا����� ا���آ�?P (ا����� �� ر��
$??�آ�ت �??"!� /??� )ا�� �??� ����R�??�P؛ ا�� �??� �����F??/�!4 (وا�� �??� ا??��ا����
�� ا�رد��??�ا�دو�??� ا���??� �??� ى د�F??� *??!' )α ≤ 0.05( � �??وأن ه!??�ك /??�وق دا�
ل ?5 A� Fي ا����ا?��ا�����ت ا����?� إ�R�"5ً� ��� و��M �_� اOدارة ا��&�� و�*
ر�� ��) P??��ا����� ا���آ�؛ اP?�4?��ا����� ا��؛ ا�[?Q:4ا� �?Q&E?��ا����� ا�ا( *?!'

XV
�� ى د�F�)α ≤ 0.05(دارة ا��&�?� ه!�ك /�وق دا�� و�Oا �?_� �?M�و ��?� �ً�R�"5إ
5 ل A� Fي ا���� ى د�?� ا��ا����� ا�Q&E?� ا�Q:4?]� و�*�F?� *?!' )α ≤ 0.05( �
ل و??5 A� F??ي ا���� ه!??�ك /??�وق دا�??� إ�R�"??5ً� �??�� و�M??� �_??� اOدارة ا��&�??� و�??*
ى د�?� ا��ا����� �F?� *?!' P?�4ا��)α ≤ 0.05( و� �?� �ً�R�"?5ه!?�ك /?�وق دا�?� إ �
ل??5 A� F??ي ا���� ى ا??��ا����� و�M??� �_??� اOدارة ا��&�??� و�??*�F??� *??!' P??ا���آ�
�� د /�وق دا�� إα ≤ 0.05( .�ً�R�"5(د� � �ً[���� و�M?� �_?� و�* د�; ا�!��UR أ
ل ?5 A� Fي ا����ا�� �?� ����R�?�P؛ ا�� �?� (ا�� �?� ا?��ا���� اOدارة ا��&�� و�*
��F?/�!4���( �?/ �!"?� رد��?� $?�آ�ت� ى د�?� ا�دو�?� ا��?���� ا�F?� *?!' )α ≤
وأن ه!???�ك /???�وق دا�???� إ�R�"???5ً� �???�� و�M???� �_???� اOدارة ا��&�???� و�???*��ي � )0.05
5 ل A� Fو ا�� �R��P��� �� ى د�� ا�� �� �����F/�!4ا���F� *!' )α ≤ 0.05(.
�� *�*���� T�&.ا�� UR��� %&' Pل ا���آ��N و�� ،C5ا��� U�!�و�* ا ،UR��!ا�
ع K و/� �bQ ا� �; . وأو%7 ����*�* �� ا�� ��7ت إ�!�داً إ�% ا�!����ت ا�4
C.إ��اءه� /� ���ل ا�� �E4� ث ا��F4)�&�� ا��� .�&� �5�F� C5أ'(% ا���.

1
Chapter One
General Framework
(1-1): Introduction
(1-2): Study Problem and Questions
(1-3): Significance of the Study
(1-4): Objectives of the Study
(1-5): Study Hypotheses
(1-6): Study Limitations
(1-7): Study Difficulties
(1-8): Terminologies
2
(1-1): Introduction Over the course of the last decade, the benefit of the
development of Strategic orientation concept has become almost
the main concern among Strategic scholars (Narver and Slater,
1990: 20-35). The increased interest in this topic of the
relationship between Strategic orientation and Performance has
generated several major theoretical and empirical studies in
literature of strategy addressing the concept of Strategic
orientation and its consequences for organizational performance
(Harris & Ogbonna, 2001; Pelham, 1999; Rose & Shoham, 2002: ;
Slater & Narver, 2000: Wood & Bhuian, 2000).
The result has been the generation of a substantial body of
literature which suggests a positive relationship between Strategic
orientation and organizational performance (Kumar, et..al, 2002;
Slater and Narver, 2000). Generally, it is held that businesses
which focus on the needs of their customers and strive to
continually meet these needs through the provision of superior
value will experience consistently positive outcomes.
As part of this surge in attention, recent findings of several
researchers (Kumar,et..al, 1998; Pelham, 1999; Slater and Narver,
1994) suggest potentially serious shortcomings in accepted
conceptualizations of Strategic orientation, which remain either
far too broad, or too narrow, to be of optimal value from a
3
strategic perspective. Some conceptualizations are too broad in
that they are based on ill-defined notions of organizational
"culture," while others are overly narrow due to being rooted in
simplistic views of the strategic focus of the organization. Current
models of Strategic orientation often fail to consider possible
antecedents to its formation. They also fail to examine the
complete range of potential mediators to the concept's
relationship with organizational performance, which in literature
is consistently defined in overly general profit terminology. In
short, despite recent efforts to clearly explain the concept of
strategic orientation, it remains an appealing but superficial
slogan which both scholars and practitioners alike have yet to
fully understand or utilize.
In contrast to previous efforts, the current study finds that
Strategic orientation has a direct effect on performance, while
competitive business strategy acts as an antecedent.
Furthermore, these effects are proposed to be contingent upon
similarities across organizations in their markets and in their
approaches to provide value for their customers, as indicated by
the business unit's position along its respective industry's value
chain (Porter, 1985).
The purpose of this study is to investigate the relationship
between Porter Generic Strategies and Strategic Orientation in the
4
Jordanian Human Drugs Industrial Companies. In addition to
investigate whether there are differences between top
management and marketing managers attitudes toward Porters
generic strategic and strategic orientation.
(1-2): Study Problem and Questions
Generic strategies can be successfully linked to organizational
performance through the use of key strategic practices such as
Focus on customers and competitors. Porter’s (1985) generic
strategies of low cost, differentiation, focus strategies are generally
accepted as a strategic typology for organizations. However, little
empirical research has been done on strategic practices
associated with each generic strategy. Furthermore, no attention
has been given to the relationship between Porter Generic
Strategies and Strategic Orientation. This exploratory study
attempts to address this gap in literature.
Based on above, one may demonstrate the Study Problem via
stirring up the questions below:
Question One: Is there a relationship between Porter generic
strategies (low cost Strategy; differentiation Strategy; focus
Strategy) and Strategic Orientation (Customer orientation;
Competitor orientation)
5
Question Two: Is there a difference between top management
and marketing manager’s perspective about Porter generic
strategies (low cost Strategy; differentiation Strategy; focus
Strategy) and Strategic Orientation (Customer orientation;
Competitor orientation)?
(1-3): Significance of the Study
The importance of the current study is:
1. Investigative the variables in Porter Generic Strategies and
Strategic Orientation.
2. To identify the importance relationship between study variables
that clarifies the situation in front of decision makers in
Jordanian Human Drugs Industrial Companies.
3. To provide a better context for Jordanian Human Drugs
Industrial Companies and more information for the decision
maker about the Porter Generic Strategies and Strategic
Orientation benefits.
6
(1-4): Objectives of the Study
The main objective of this study is to clarify the relationship
between Porter Generic Strategies and Strategic Orientation in the
Jordanian Human Drugs Industrial. This can be achieved through
the following:
1. Prepare theoretical framework, about Porter Generic Strategies
and Strategic Orientation topics.
2. Identify the importance level of study variables in Jordanian
Human Drugs Industrial Companies.
3. Explore the relationship between Porter Generic Strategies and
Strategic Orientation in the Jordanian Human Drugs Industrial
Companies.
4. Explore the differences between top management and
marketing manager’s perspective about Porter generic strategies
and Strategic Orientation.
(1-5): Study Hypotheses
Based on the study problem and the literature review, the
following research hypotheses were examined:
HO1: There is no significant relationship between Porter
Generic Strategies (Low cost Strategy; Differentiation Strategy;
7
Focus Strategy) and Strategic Orientation (Customer Orientation;
Competitor Orientation) at the level (α ≤ 0.05).
HO2: There is no significant difference between top
management and marketing manager’s perspective about Porter
Generic strategies (Low cost Strategy; Differentiation Strategy;
Focus Strategy) at the level (α ≤ 0.05).
HO3: There is no significant difference between top
management and marketing manager’s perspective about
Strategic Orientation (Customer Orientation; Competitor
Orientation) at the level (α ≤ 0.05).
(1-6): Study Limitations
The study focus on the following:
Human Limitations: The employees working in the Jordanian
Human Drugs Industrial Companies who occupied the following
positions (Top Management, Marketing Managers).
Place Limitations: Jordanian Human Drugs Industrial
Companies.
Time Limitations: The period between (2010 – April 2011).
Scientific Limitations: The researcher depends on generic
strategies (low cost Strategy; differentiation Strategy; focus
Strategy) that suggested by Porter (1980; 1985). However, in the
Strategic Orientation (Customer orientation; Competitor

8
orientation) the researcher depends on Narver & Slater (1990:20-
35); Morgan & Strong, (1998: 1051-1073).
(1-7): Study Difficulties
1. This study is limited to the Top Management, Marketing
Managers working in the Jordanian Human Drugs Industrial
Companies.
2. The results of this study will depend on the data gathered from
respondents concerning research hypothesis.
(1-8): Study Terminologies
Generic Strategies: Basic choices faced by companies are
essentially the scope of the markets that the company would
serve and how the company would compete in the selected
markets. Focus on ways in which a company can achieve the
most advantageous position that it possibly can in its industry
(Porter, 1980, 1985). They will be measured by:
- Low cost Strategy: Lower costs and cost advantages result from
process innovations, learning curve benefits, economies of scale,
reductions, product designs that reduce manufacturing time
and costs, and reengineering activities.
9
- Differentiation Strategy: Product differentiation fulfills a unique
customer’s need through tailoring the product or the service,
allowing organizations to charge a premium price to capture
market share. Differentiation strategy is effectively implemented
when the business provides unique or superior value to the
customer through product quality, features, or after-sale
support. The quality may be real or perceived based on fashion,
brand name, or image.
- Focus Strategy: Adopting a narrow competitive scope within the
industry. Focus strategies led to grow in market share through
operating in a niche market or markets not attractive to, or
overlooked by, larger competitors. These niches arise from a
number of factors including geography, buyer characteristics,
product specifications, or requirements.
Strategic Orientation: is the specific approach a firm
implements to create superior and continuous performance
(Gatignon & Xuereb, 1997: 77-90). They will be measured by:
- Customer orientation: an organizational culture that facilitates
the understanding of targeted buyers and allows for the
continuous creation of customer value (Narver & Slater, 1990:
20-35).
- Competitor orientation: an organizational culture that stresses
the understanding of the short-term strengths and weaknesses

10
and long-term capabilities and strategies of the current and
potential key competitors (Deshpande, et..al, 1993: 23-37).
11
Chapter Two
Theoretical Framework and Previous Studies
(2-1): Introduction
(2-2): Porter Generic Strategies
(2-3): Strategic Orientation
(2-4): Previous Studies
(2-5): Study contribution to Knowledge
12
(2-1): Introduction
Strategy is an important means for survival in the face of
the dynamic nature of competitive environments (Dong, et..al,
2008: 82-88).
Mintzberg (1990: 105-236) places Porter’s work in the
“positioning school” which advocates an analytic approach to
strategic planning and implementation. On the basis of the main
competitive advantage of a firm in relation to its competitors,
Porter (1980; 1985) has defined three generic strategies: 1) Cost
leadership, 2) Differentiation and 3) Focus.
Strategic orientation is defined as the “strategic directions
implemented by a Firm to create the proper behaviors for the
continuous superior performance of the business” (Narver and
Slater, 1990: 20-35) which consists of Customer orientation and
Competitor orientation.
This chapter is divided into Five sections. The first three
sections deal with Porter Generic Strategies, Strategic Orientation,
and the relationship between Study Variables respectively. The
fourth section is devoted to the previous studies, and finally the
sixth highlights the study contribution to knowledge.

13
(2-2): Porter Generic Strategies
Strategy is an essential part of any effective business plan.
By using an effective competitive strategy, a company finds its
industry niche and learns about its customers (Porter, 1980).
Porter (1985) asserts there are basic businesses strategies –
differentiation, cost leadership, and focus – and a company
performs best by choosing one strategy on which to concentrate.
However, many researchers see a combination of these strategies
may offer a company the best chance to achieve a competitive
advantage (Cross, 1999; Fuerer and Chaharbaghi, 1997; Hlavacka
et al., 2001). Whatever strategy a business chooses, it must fit
with the goals and objectives of the company to gain a competitive
advantage (Kippenberger, 1996; Parker and Helms, 1992).
Porter purports companies must be competitive to become
an industry leader (Murdoch, 1999), to be successful both
nationally and abroad (Niemira, 2000; Davidson, 2001; Anon,
1998), this can be accomplished by adopting the Porter generic
strategic to achieve competitive advantage which apply to all
industries in most nations (Median and Chin, 1995; Campbell-
Hunt, 2000).
Various types of organizational strategies have been
identified over the years (Miles and Snow, 1978; Chrisman et al.,
14
1988; Porter, 1980) but Porter’s generic strategies remain the
most commonly supported and identified in key strategic
management textbooks (David, 2000; Miller, 1998) and in the
literature (Miller and Dess, 1993). Porter’s (1980) generic
strategies can yield competitive advantage and ensuring long term
profitability. Porter suggests that the firm must make a choice
between one of the generic strategies rather than end up being
“stuck in the middle”.
On the basis of the main competitive advantage of a firm in
relation to its competitors, Porter (1980; 1985) has defined three
generic strategies: 1) Cost leadership: a company capable to
produce and commercialize at a lower cost than its competitors.
Both the profitability and the market shares controlled by these
firms are substantial, because low cost leaders are capable to
match the prices of their most efficient competitors. This firm will
usually target groups of consumers that have basic,
unsophisticated needs, requiring cheap and low quality products
and services. However, to achieve cost leadership, the firm has to
obtain a high relative market share, which requires capital
investment in product R&D and manufacturing, as well as
aggressive pricing (Porter, 1980). 2) Differentiation: can be
achieved on the basis of any specific organizational skill or
competence that represents a competitive advantage in
15
comparison with other firms. It can be argued that the Cost
Leadership Strategy can also represent a version of the
Differentiation strategy. 3) Focus is rather on differentiation
through superior quality and service, in order to develop a unique
market proposition, or on Cost Leadership strategy which is
characterized by a successive reduction of the selling price,
through a differentiation approach the firm is capable to use a
premium price, with higher profit margins. In these conditions,
the main aim of the organization is to create price loyalty and
price inelasticity, which can create entry barriers for direct
competitors, and mitigate the power of buyers, who lack
comparable substitutes (Porter, 1980).
Porter’s definition of generic strategies was largely based on
the analysis of large corporations, acting in mature markets. His
work provided a clear image of the essential activities of firms
(Kotha & Vadlamani 1995: 75-83), integrated into a vertical chain
of economic processes that include suppliers, manufacturing and
commercial organizations, and finally customers. In comparison
with the previous economic models that considered the business
activity in the context of atomized markets, Porter’s model is more
realistic, focusing on large organizations that shape many
industries as monopolies or oligopolies (Brandenburger, 2002: 58-
60).
16
Porter’s generic strategies framework constitutes a major
contribution to the development of the strategic management
literature. Generic strategies were first presented in two books by
Professor Michael Porter of the Harvard Business School (Porter,
1980, 1985). Porter (1980, 1985) suggested that some of the most
basic choices faced by companies are essentially the scope of the
markets that the company would serve and how the company
would compete in the selected markets. Competitive strategies
focus on ways in which a company can achieve the most
advantageous position that it possibly can in its industry
(Pearson, 1999). The profit of a company is essentially the
difference between its revenues and costs. Therefore high
profitability can be achieved through achieving the lowest costs or
the highest prices vis-à-vis the competition. Porter used the terms
‘cost leadership’ and ‘differentiation’, wherein the latter is the way
in which companies can earn a price premium.
Porter has described a category scheme consisting of three
general types of strategies that are commonly used by businesses
to achieve and maintain competitive advantage. These three
generic strategies are defined along two dimensions: strategic
scope and strategic strength. Strategic scope is a demand-side
dimension and looks at the size and composition of the market
you intend to target. Strategic strength is a supply-side dimension
17
and looks at the strength or core competency of the firm. In
particular he identified two competencies that he felt were most
important: product differentiation and product cost (efficiency).
Back in his 1980 classic Competitive Strategy: Techniques
for Analyzing Industries and Competitors, Porter simplifies the
scheme by reducing it down to the three best strategies. They are
cost leadership, differentiation, and market segmentation (or
focus). Market segmentation is narrow in scope while both cost
leadership and differentiation are relatively broad in market
scope.
Empirical research on the profit impact of marketing
strategy indicated that firms with a high market share were often
quite profitable, but so were many firms with low market share.
The least profitable firms were those with moderate market share.
This was sometimes referred to as the hole in the middle problem.
Porter’s explanation for this is that firms with high market share
were successful because they pursued a cost leadership strategy
and firms with low market share were successful because they
used market segmentation to focus on a small but profitable
market niche. Firms in the middle were less profitable because
they did not have a viable generic strategy (Yamin, et..al, 1999).
Porter suggested combining multiple strategies is successful
in only one case. Combining a market segmentation strategy with
18
a product differentiation strategy was seen as an effective way of
matching a firm’s product strategy (supply side) to the
characteristics of your target market segments (demand side). But
combinations like cost leadership with product differentiation
were seen as hard (but not impossible) to implement due to the
potential for conflict between cost minimization and the additional
cost of value-added differentiation.
In the current study, the researcher focuses on three key
Strategies of Porter Generic: Cost leadership, Differentiation and
Focus.
(2-2-1): Cost leadership
Cost leadership. strategy focuses on gaining competitive
advantage by having the lowest cost in the industry (Bauer and
Colgan, 2001; Hyatt, 2001; Davidson, 2001). In order to achieve a
low-cost advantage, an organization must have a low-cost
leadership strategy, low-cost manufacturing, and a workforce
committed to the low-cost strategy (Malburg, 2000). The
organization must be willing to discontinue any activities in which
they do not have a cost advantage and should consider
outsourcing activities to other organizations with a cost advantage
(Malburg, 2000). For an effective cost leadership strategy, a firm
must have a large market share (Hyatt, 2001). There are many
areas to achieve cost leadership such as mass production, mass
19
distribution, economies of scale, technology, product design,
input cost, capacity utilization of resources, and access to raw
materials (Malburg, 2000; Venu, 2001; Davidson, 2001). Porter
(1985) purports only one firm in an industry that can be the cost
leader (Venu, 2001).
Lower costs and cost advantages result from process
innovations, learning curve benefits, and economics of scale,
product designs reducing manufacturing time and costs, and
reengineering activities. A low-cost or cost leadership strategy is
effectively implemented when the business designs, produces, and
markets a comparable product more efficiently than its
competitors. The firm may have access to raw materials or
superior proprietary technology which helps to lower costs.
Firms do not need to sacrifice revenue to be the cost leader
since high revenue is achieved through obtaining a large market
share (Porter, 1996; Bauer and Colgan, 2001). Lower prices lead
to higher demand and, therefore, to a larger market share (Helms
et al., 1997). As a low cost leader, an organization can present
barriers against new market entrants who would need large
amounts of capital to enter the market (Hyatt, 2001). The leader
then is somewhat insulated from industry wide price reductions
(Porter, 1980; Hlavacka et al., 2001; Malburg, 2000). The cost
leadership strategy does have disadvantages. It creates little
20
customer loyalty and if a firm lowers prices too much, it may lose
revenues (Cross, 1999).
(2-2-2): Differentiation
Differentiation is one of Porter’s key business strategies
(Reilly, 2002). When applying this strategy, a company focuses its
efforts on providing a unique product or service (Hyatt, 2001;
Bauer and Colgan, 2001; Hlavacka, et..al., 2001). Since the
product or service is unique, it will provide high customer loyalty
(Cross, 1999). Product differentiation fulfills a customer need and
involves tailoring the product or service to the customer. This
allows organizations to charge a premium price to capture market
share.
The differentiation strategy is effectively implemented when
the business provides unique or superior value to the customer
through product quality, features, or after-sale services. Firms
following a differentiation strategy can charge a higher price for
their products based on the product characteristics, the delivery
system, the quality of service, or the distribution channels. The
quality may be real or perceived based on fashion, brand name, or
image. The differentiation strategy appeals to a sophisticated or
knowledgeable consumer interested in a unique or quality
product and willing to pay a higher price.
21
The key step in devising a differentiation strategy is to
determine what makes a company different from a competitor’s
(McCracken, 2002; Reilly, 2002; Berthoff, 2002; Rajecki, 2002).
Factors including market sector quality of work, the size of the
firm, the image, graphical reach, involvement in client
organizations, product, delivery system, and the marketing
approach have been suggested to differentiate a firm (McCracken,
2002; Davidson, 2001). To be effective, the message of
differentiation must reach the clients (McCracken, 2002), as the
customer’s perceptions of the company are important (Berthoff,
2002).
When using differentiation, firms must be prepared to add a
premium to the cost (Hyatt, 2001). However, since customers
perceive the product or service as unique, they are loyal to the
company and willing to pay the higher price for its products
(Hlavacka et al., 2001; Venu, 2001; Cross, 1999).
Some key concepts for establishing differentiation include:
1. Speaking about the product to select panels (McCracken,
2002).
2. Writing on key topics affecting the company in the
association’s magazine or newsletter (McCracken, 2002).
3. Becoming involved in the community (McCracken, 2002).
4. Being creative when composing the company’s portfolio.
22
5. Offering something the competitor does not or cannot offer
(Rajecki, 2002).
6. Adding flair and drama to the store layout (Differentiation will
be key, 2002).
7. Providing e-commerce (Chakravarthy, 2000).
8. Making access to company information and products both
quick and easy (Chakravarthy, 2000).
9. Using company size as an advantage (Darrow et al., 2001).
10. Training employees with in-depth product and service
knowledge (Darrow et al., 2001).
11. Offering improved or innovative products (Helms et al.,
1997).
12. Emphasizing the company’s state-of-the-art technology,
quality service, and unique products/services (Hlavacka et al.,
2001; Bright, 2002).
13. Using photos and renderings in brochures (McCracken,
2002).
14. Selecting products and services for which there is a
strong local need (Darrow et al., 2001).
23
(2-2-3): Focus
In the focus strategy, a firm targets a specific segment of the
market (Davidson, 2001; Porter, 1996; Bauer and Colgan, 2001;
Cross, 1999; Hlavacka et al., 2001; Hyatt, 2001). The firm can
choose to focus on a select customer group, product range,
geographical area, or service line (Anon, 1998; Hyatt, 2001; Venu,
2001; Darrow et al., 2001; Martin, 1999; McCracken, 2002). For
example, some European firms focus solely on the European
market (Stone, 1995). Focus also is based on adopting a narrow
competitive scope within an industry. Focus aims at growing
market share through operating in a niche market or in markets
either not attractive to, or overlooked by, larger competitors.
These niches arise from a number of factors including geography,
buyer characteristics, and product specifications or requirements.
A successful focus strategy depends upon an industry segment
large enough to have good growth potential but not of key
importance to other major competitors (Porter, 1980). Market
penetration and market development can be an important focus
strategy. Midsize and large firms use focus-based strategies but
only in conjunction with differentiation or cost leadership generic
strategies. But, focus strategies are most effective when
24
consumers have distinct preferences and when the niche has not
been pursued by rival firms (David, 2000).
(2-3): Strategic Orientation
Business strategy has been characterized as the manner in
which a firm decides to compete (Walker & Ruekert, 1987). It
encompasses the pursuit, achievement, and maintenance of
competitive advantage in an industry (Varadarajan & Clark,
1994). Given its position as a focal issue in organizational
decision making, it is not surprising that the concept of strategy
has been linked to performance outcomes. Indeed, it is a key
postulate that many management researchers devote attention
toward, in at least some respect, because without doubt ‘‘the
notion that superior performance requires a business to gain and
hold an advantage over competitors is central to contemporary
strategic thinking’’ (Day & Wensley, 1988: 1).
Strategic orientations are aspects of corporate culture
(Hurley & Hult, 1998: 42-54; Narver & Slater, 1990: 20-35).
Strategic orientation is defined as the “strategic directions
implemented by a firm to create the proper behaviors for the
continuous superior performance of the business” (Gatignon and
Xuereb, 1997: 77-90; Menguc & Auh, 2005: 4-19).
25
The latter research stream is considered, at least to some
extent, in most strategy studies by way of internal and external
phenomena that are either controlled for or measured as explicit
influences upon performance (Rajagopalan, 1996). However, an
established literature base has been documented which is devoted
to both understanding the nature of strategy processes (Van de
Ven, 1992) and the assessment of the process – performance
relationship (Hart & Banbury, 1994). Many aspects of this
relationship have been examined from individual, group, and
organizational viewpoints with no clear or consistent evidence
having been reached (Rogers, et..al., 1999). A consequence of this
lack of consensus has been that strategy content research has
more recently played a greater role in explaining variations in
business performance both when considered in combination with
strategy process issues (Ketchen, et..al., 1996) as well as a
construct in its own right (Voss & Voss, 2000).
Strategy content primarily focuses upon the outcome of
strategic decisions and the manner in which business strategy
content is manifest in a firm has been variously described as
strategic fit, strategic predisposition, strategic thrust, strategic
choice, and more commonly strategic orientation (Manu and
Sriram, 1996). The literature has considered strategic orientation
from three viewpoints: the narrative approach, the classificatory
26
approach, and the comparative approach. The narrative approach
endeavors to describe the nature of strategy which is unique to
the event, situation, and organization (Czarniawska, 1998). The
emphasis tends to be placed on qualitative methodologies such as
case study analyses. The classificatory approach: This approach
attempts to classify firms’ strategy according to either ex ante
conceptual arguments or ex post empirically derived groupings.
These classifications are respectively known as typologies (Miles
and Snow, 1978; Porter, 1980) and taxonomies (Wright et al.,
1995). This form of methodology is well grounded in the
management literature but it must be acknowledged that
schemata such as these are restricted solely to intergroup
comparison, which prevents any investigation of intergroup
analysis (Speed, 1993).
The third approach to business strategy assessment is
comparative approach. This approach seeks to evaluate strategy
by way of multiple traits or dimensions common to all firms.
Therefore, strategy is considered in terms of the relative emphasis
made by the firm along each strategic orientation dimension. This
approach, consequently, overcomes the empirical limitations of
the classificatory method in that strategic orientation is viewed
not across strict strategy classifications but, alternatively, along
specific dimensions. Venkatraman (1989) has proposed six
27
dimensions of strategic orientation: aggressiveness, analysis,
defensiveness, futurity, proactiveness, and riskiness.
Aggressiveness: means how firms aggressively respond to
the environment. Aggressiveness captures the facet of a firm’s
strategic orientation that, in comparison with its competitors,
rapidly deploys resources to improve market position (Clark and
Montgomery, 1996; Fombrun and Ginsberg, 1990). Such a trait is
characteristic of the marketing (Achrol, 1991) that seeks first-
mover advantage and exhibits a combative posture in exploiting
market opportunities (Buzzell et al., 1975). The overriding theme
of aggressiveness is the focus on “beating competition” (Wong and
Saunders, 1993: 30), Although aggressiveness may demand high
investment to constantly improve on relative market share and
competitive position, the key ingredient of success and
sustainability along this route must be the ability to identify
customer needs through an appropriate window of opportunity
and rapidly mobilize resources to respond accordingly. Hence, the
offensive manoeuvres (Davidson, 1987) associated with
aggressiveness are likely to be characteristic of market oriented
firms.
Analysis: the analysis dimension of strategic orientation is
distinct from Miles and Snow’s (1978) analyzer type of firm which
28
is a combination of prospecting and defensive strategy
behaviours. Here, analysis is considered to represent the overall
problem-solving approach to strategic decision making resulting
in attempts to secure complete understanding of issues in both
organizational and environmental contexts (Miller and Friesen,
1984). Furthermore, this dimension refers to the nature of
internal systems used in the execution of competitive strategy to
achieve desired objectives (Grant and King, 1982; Venkatraman,
1989). A parallel can be drawn between analysis and the
comprehensiveness trait proposed by Fredrickson (1984) as an
important construct in the strategic management process.
Consequently, analysis is critical to ensure that “fit” is achieved
between an organization’s strategy and its environment.
Defensiveness: the dimension of defensiveness reflects
behaviours aimed at protecting a firm’s market position as
opposed to any attempt to develop it in any way (Venkatraman,
1989). In marked contrast to aggressive actions, the emphasis
tends to be on cost reduction and efficiency gains, which has been
explained by Thompson (1967) in his view of organizations
defending their core technologies and the concept of domain
defense strategy explored by Miles and Cameron (1982).
Defensiveness encourages an internal focus for organizational
strategists which, consequently, deflects attention away from the
29
external environment of the firm. Therefore, when changes occur
in the marketplace, the defensiveness trait means that firms have
limited adaptive capabilities and may be “unlikely to notice
market change or ... be able to adapt to change if it is noticed”
(McKee et al., 1989: 22). Furthermore, for the defender (Miles and
Snow, 1978) type of firm, Slater and Narver (1993: 38) have stated
that they “gain relatively little benefit from a high magnitude of
market orientation. In fact, a substantial investment of resources
in market oriented activities could distract the defender from its
primary preoccupation with low cost”.
Futurity: the notion of organizational preparedness for, and
positioning in, future environmental situations is at the heart of
strategic management advocacy. Although the scape of the
explication of competitive futures is extremely complex, planning
for the evolving marketplace is still crucially important in
competitive strategy (Piercy and Morgan, 1994). In this respect,
Levitt (1960) has declared that the focus of marketing should not
only be on recognizing customer needs per se, but should also
appreciate the enduring nature of the needs organizations are
attempting to satisfy. Following this, Anderson (1982) claims that
the goal of marketing is to communicate the long run focus of
customer and consumer satisfaction to all interests in the firm.
The conceptual association between firms’ marketing activities
30
and long term emphasis is, therefore, not recent. However, the
need for a long term perspective has become more important in
the face of significant environmental change (Ganesan, 1994) and
it is now a strategic imperative for the market oriented firm to
“constantly discover and implement additional value for its
customers” (Narver and Slater, 1990: 22).
Proactiveness: the proactive behaviour of organizations is a
core constituent of innovation (Manu and Sriram, 1996).
Proactiveness describes the initiative adopted by firms to
continuously search for opportunities (Slater and Narver, 1993)
and experiment with responses to changing marketplace
conditions (Lynn et al., 1996; Venkatraman, 1989). Founded on
an action orientation, proactiveness also uses the strong research
and development capabilities that are a feature of this dimension
(Gatignon and Xuereb, 1997). Fundamental in achieving such
innovation capabilities, organizations exhibiting this
proactiveness trait must encourage strong interfunctional
cohesiveness (Atuahene-Gima, 1996) and direct their efforts
toward a market focus (Burchill and Fine, 1997; Slater and
Narver, 1995). In this case, evidence suggests that while
particularly proactive firms may not be initially market oriented, a
process of evolution is often experienced which requires
organizations to establish processes and structures that enable
31
them to better understand their customers (Roberts, 1990). The
value of being proactive in strategic orientation has been
considered in the marketing literature for some time (Dickson,
1992; Zeithaml and Zeithaml, 1984). The traditional argument
suggests that marketing has adopted a reactive stance to the
marketplace by responding to signals identified in the
environment. This debate has now altered the prescriptive view of
a proactive stance would be more accurate” (Jaworski and Kohli,
1996:126) for reflecting market oriented activities and behaviours.
Riskiness: the concept of risk can be considered by way of
the possible losses and gains that can be derived from an action
(Clark and Montgomery, 1996; March and Shapira, 1987).
Conceptualizing risk in this manner means that riskiness can be
manifest in resource allocation decision scenarios (Venkatraman,
1989) and be a key parameter in driving decision making for
products and markets (Dickson and Giglierano, 1986). Within
models of business competitiveness (Day, 1994), there is a
recognition that constructive risk taking is an important factor in
stimulating the entrepreneurialism (Miller, 1987) which is implicit
in market opportunity-seeking behavior (Baird and Thomas,
1990). A danger of restricting marketing attention to existing
customers and competitors results in the “tyranny of the served
market” (Hamel and Prahalad, 1991: 83) where efforts are too

32
narrowly focused on the expressed needs of the customer at the
expense of neglecting the latent needs of both existing and
potential customers. Hence, a true market orientation maintains
a balance between these two elements which should “encourage a
sufficient willingness to take risks” (Slater and Narver, 1995: 67).
Despite the fact that businesses’ gains and losses may be high
from new product introductions serving new and existing
customers, market orientation requires that firms be tolerant of
risk and accept the possible failures (Jaworski and Kohli, 1993).
Indeed, it has been posited that in the market oriented firm,
where senior executives encourage an acceptance of risk and
acknowledge certain failures as inevitable, junior executives will
be more inclined to develop new customer offerings in response to
changing needs (Kohli and Jaworski, 1990).
Previous studies examining strategic orientations have
pointed specifically to the behaviors associated with the
organization-wide generation, dissemination, and use of market
intelligence as being the key ingredients of a strategic orientation
(Baker & Sinkula, 1999: 311-427; Kohli & Jaworski, 1990: 1-18;
Narver & Slater, 1990: 20-35). An important aspect of a strategic
orientation is the creation of shared values and behaviors
throughout the entire organization. When strategic orientation
extends to all levels of an organization, it becomes an
33
organizational culture. Culture can unify an organization’s
capabilities into a “one unit”.
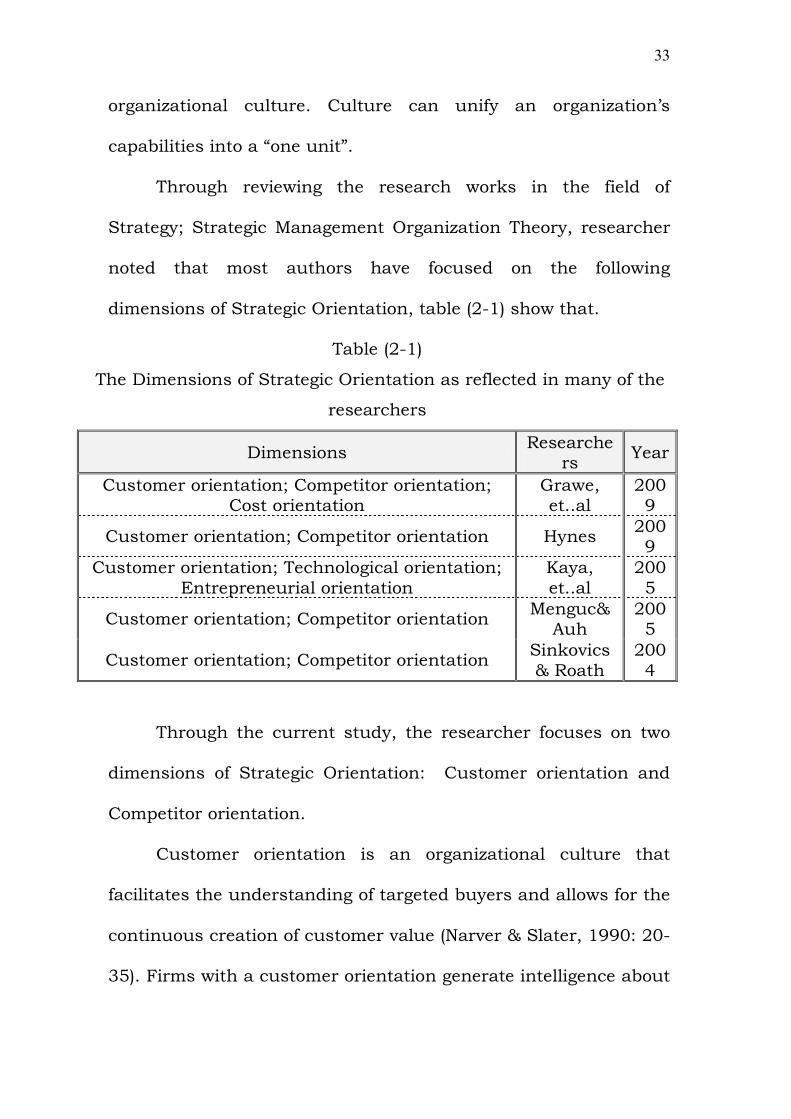
Through reviewing the research works in the field of
Strategy; Strategic Management Organization Theory, researcher
noted that most authors have focused on the following
dimensions of Strategic Orientation, table (2-1) show that.
Table (2-1)
The Dimensions of Strategic Orientation as reflected in many of the
researchers
Year Researche
rs Dimensions
2009
Grawe, et..al
Customer orientation; Competitor orientation; Cost orientation
2009
Hynes Customer orientation; Competitor orientation
200
5 Kaya,
et..al Customer orientation; Technological orientation;
Entrepreneurial orientation 2005
Menguc& Auh
Customer orientation; Competitor orientation
200
4
Sinkovics
& Roath Customer orientation; Competitor orientation
Through the current study, the researcher focuses on two
dimensions of Strategic Orientation: Customer orientation and
Competitor orientation.
Customer orientation is an organizational culture that
facilitates the understanding of targeted buyers and allows for the
continuous creation of customer value (Narver & Slater, 1990: 20-
35). Firms with a customer orientation generate intelligence about
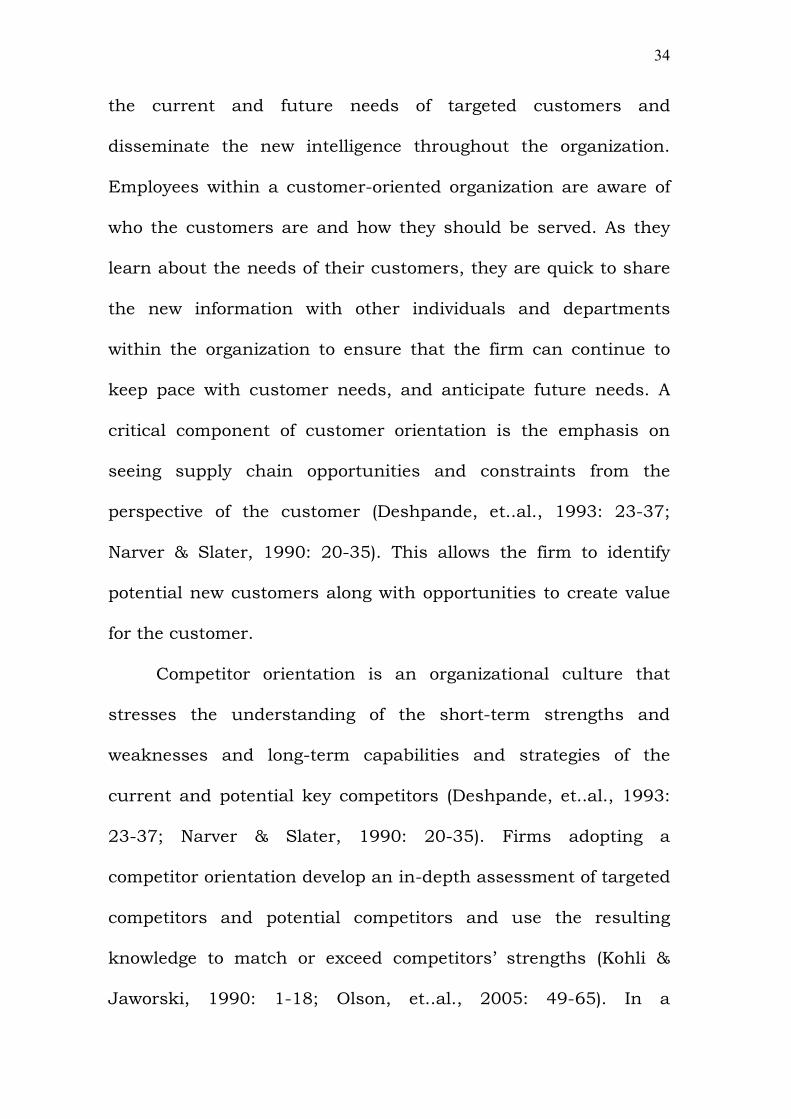
34
the current and future needs of targeted customers and
disseminate the new intelligence throughout the organization.
Employees within a customer-oriented organization are aware of
who the customers are and how they should be served. As they
learn about the needs of their customers, they are quick to share
the new information with other individuals and departments
within the organization to ensure that the firm can continue to
keep pace with customer needs, and anticipate future needs. A
critical component of customer orientation is the emphasis on
seeing supply chain opportunities and constraints from the
perspective of the customer (Deshpande, et..al., 1993: 23-37;
Narver & Slater, 1990: 20-35). This allows the firm to identify
potential new customers along with opportunities to create value
for the customer.
Competitor orientation is an organizational culture that
stresses the understanding of the short-term strengths and
weaknesses and long-term capabilities and strategies of the
current and potential key competitors (Deshpande, et..al., 1993:
23-37; Narver & Slater, 1990: 20-35). Firms adopting a
competitor orientation develop an in-depth assessment of targeted
competitors and potential competitors and use the resulting
knowledge to match or exceed competitors’ strengths (Kohli &
Jaworski, 1990: 1-18; Olson, et..al., 2005: 49-65). In a
35
competitor-oriented firm, competitive assessment is not solely the
responsibility of senior management. Employees throughout the
organization participate in the development of intelligence
regarding competitors’ new products and services, as well as
products and services offered by companies not considered to be
direct competitors.
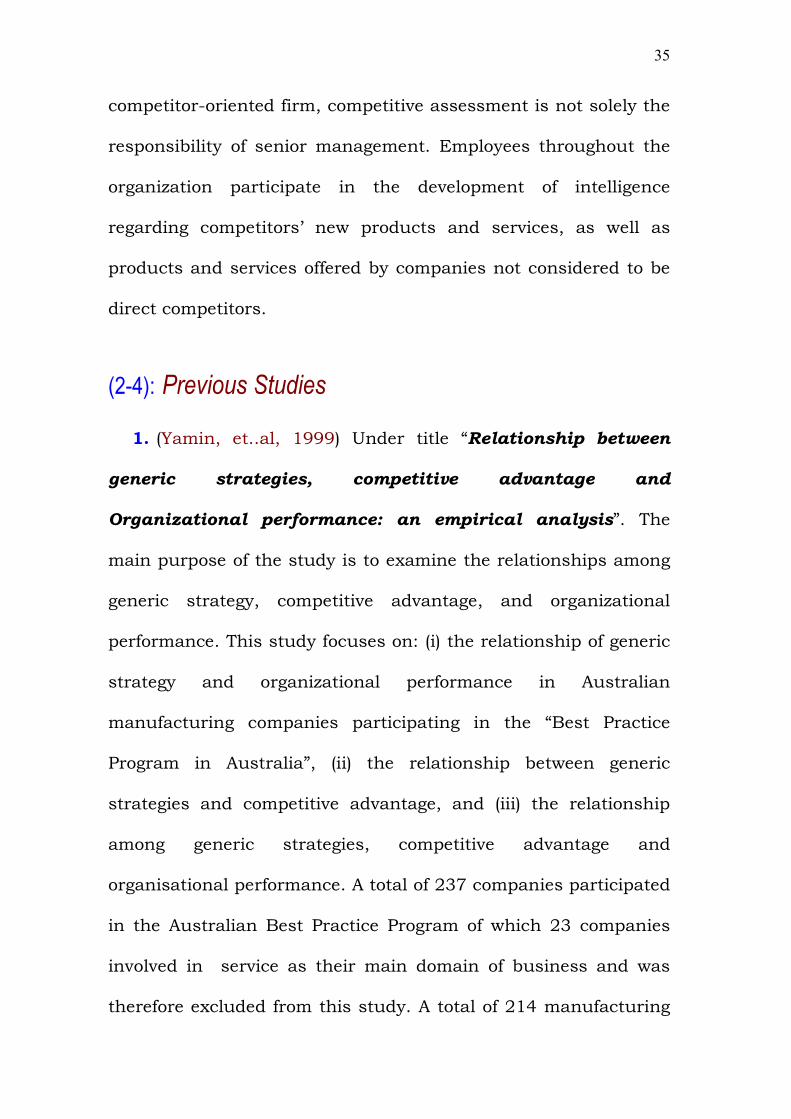
(2-4): Previous Studies
1. (Yamin, et..al, 1999) Under title “Relationship between
generic strategies, competitive advantage and
Organizational performance: an empirical analysis”. The
main purpose of the study is to examine the relationships among
generic strategy, competitive advantage, and organizational
performance. This study focuses on: (i) the relationship of generic
strategy and organizational performance in Australian
manufacturing companies participating in the “Best Practice
Program in Australia”, (ii) the relationship between generic
strategies and competitive advantage, and (iii) the relationship
among generic strategies, competitive advantage and
organisational performance. A total of 237 companies participated
in the Australian Best Practice Program of which 23 companies
involved in service as their main domain of business and was
therefore excluded from this study. A total of 214 manufacturing
36
companies forms the sample for this study. Finally, the
implications of generic strategies, organizational performance,
performance measures and competitive advantage are studied.
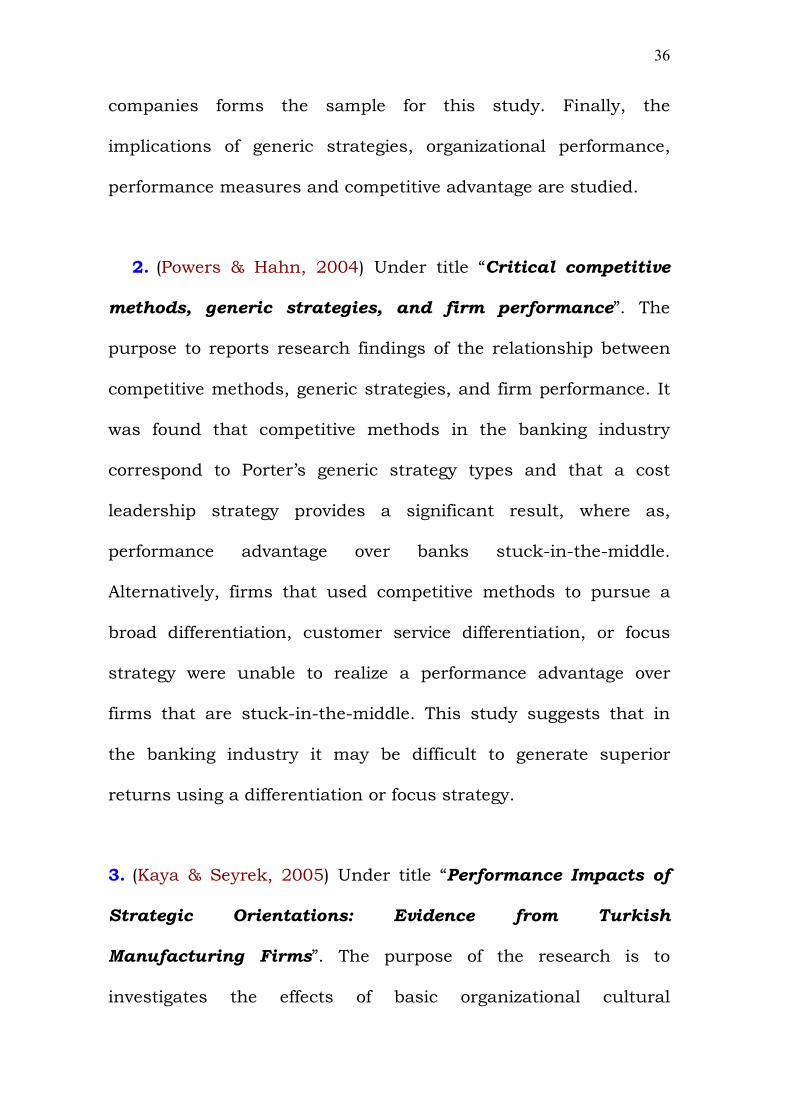
2. (Powers & Hahn, 2004) Under title “Critical competitive
methods, generic strategies, and firm performance”. The
purpose to reports research findings of the relationship between
competitive methods, generic strategies, and firm performance. It
was found that competitive methods in the banking industry
correspond to Porter’s generic strategy types and that a cost
leadership strategy provides a significant result, where as,
performance advantage over banks stuck-in-the-middle.
Alternatively, firms that used competitive methods to pursue a
broad differentiation, customer service differentiation, or focus
strategy were unable to realize a performance advantage over
firms that are stuck-in-the-middle. This study suggests that in
the banking industry it may be difficult to generate superior
returns using a differentiation or focus strategy.
3. (Kaya & Seyrek, 2005) Under title “Performance Impacts of
Strategic Orientations: Evidence from Turkish
Manufacturing Firms”. The purpose of the research is to
investigates the effects of basic organizational cultural
37
orientations, namely entrepreneurial, technological and customer
orientations on firm financial performance when market
dynamism is high and when it is low. Data were collected from 91
manufacturing firms operating in The Marmara region of Turkey.
The research results show that there is a positive and meaningful
relation between entrepreneurial orientation and financial
performance when the market dynamism is high. Also, there is a
positive and meaningful relation between technological orientation
and financial performance when the market dynamism is low. On
the other hand, there is a negative and meaningful relation
between customer orientation and financial performance when
the market dynamism is either high or low.
4. (Allen & Helms, 2006) Under title “Linking strategic
practices and organizational performance to Porter’s
generic strategies”. The purpose is testing the following two
hypotheses: specific strategic practices (or tactics) can be
identified which are associated with each generic Porter strategy;
and there are specific strategic practices which are more strongly
associated with higher levels of organizational performance within
each generic strategy. To test these hypotheses, a questionnaire
was developed and administered to a sample of 226 working
adults. A factor analysis and regression analysis were used to
38
analyze the data. Findings include a list of critical strategic
practices significantly associated with organizational performance
for each of Porter’s generic strategies.
5. (Sánchez & Sánchez-Marín, 2006) Under title “Strategic
Orientation, Management Characteristics, and Performance:
A Study of Spanish SMEs”. The purpose of this study is to view
the management characteristics of Spanish small and medium
enterprises (SMEs) according to their strategic orientation and the
consequences in terms of firm performance and business
efficiency. The typology of strategies formulated by Miles and
Snow has important implications for management, because
depending on the strategic orientation adopted - defender,
prospector, or analyzer - the firm can emphasize to a great extent
some aspects of management, such as technological position,
innovation, organizational design, and human resource
management. Moreover, these aspects of management can largely
determine firm performance and business efficiency. A sample of
1,351 Spanish SMEs provided the data for an empirical test of
these issues. The results confirm the expected relationships,
revealing, on the one hand, significant differences between
prospector and defender SMEs regarding the key factors on which
they base their management characteristics and, on the other
39
hand, the different influences that each strategic orientation has
on firm performance.
6. (Fuentes, et..al, 2006) Under title “Total Quality
Management, Strategic Orientation and Organizational
Performance: the Case of Spanish Companies”. The purpose of
this study is to examines the relationship between strategy and
Total Quality Management (TQM) implementation, as well as the
impact of both TQM and Strategic orientation on organizational
performance. They have used the emphasis on cost leadership,
differentiation on marketing and differentiation on innovation as
strategic dimensions to develop four great strategic
configurations. The Sample of 1550 privately-owned Spanish
companies that have embraced TQM implementation. The degrees
of implementation of the TQM elements in each of them, as well
as their associations to the various types of performances have
been studied. The results significantly support the hypotheses
proposed, and suggest differences in TQM implementation
depending on the selected strategy. It is also noticed that
companies with greater degrees of co-alignment between their
strategies and TQM are those with the highest levels of
performance.
40
7. (Guner, et..al, 2007) Under title “Strategic Orientation
and Export Performance: A Three-Country Study of
Manufacturing Firms”. The study aimed to examine the linkage
between strategic variables and the export performance of firms in
the United States, Germany, and Japan. R&D Intensity, Capital
Intensity, Average Collection Period, Debt Leverage, and Labor
Productivity are used as measures of strategic variables. sample
for the present study included a total of 988 firms, consisting of
320 U.S. firms, 358 Japanese firms, and 310 German firms in
manufacturing sector. R&D intensity and Labor Productivity are
found to have a strong and positive association with export
performance in all three countries. Capital intensity and average
collection period also have significant relationship with export
performance in the United States and Japan, respectively.
8. (Chung, et..al, 2008) Under title “The Impact of Strategic
Orientation and HRM Systems on Firm Performance”. The
purpose is to address the impact of strategic orientation and HRM
systems on firm performance and empirically investigates whether
human resources management structure is significantly related
with performance. In particular, we examine interaction effects
between strategic orientation variable and HRM systems. These
hypotheses are tested with a sample of 278 companies listed on
41
the Korean Workplace Pane Surveys (WPS) from 2004 to 2006.
The analysis provided the results listed below. First, the typology
of strategies formulated by Miles & Snow has implication for HRM
system, because depending on the strategic orientation adopted,
the firm can emphasize to a great extent some aspects of HRM.
The results confirm the relationships, revealing, on the band,
significant differences between prospector, analyzer and defender.
Second, the strong effect of HRM system on organizational
performance. This result is likely to rooted in Korean context of
Korean business organization. Third, this article show that the
strength of relationship between HRM systems and performance
will varies with different types/ levels of business strategy. In the
case organization pursuing prospector’s strategy the strength of
relation between HRM systems and performance will be stronger
as compare to the analyzers and defenders.
(2-5): Study contribution to knowledge
To clarify what distinguishes the current study from previous
studies, some comparisons have been made, which are presented
as follows:
1. Concerning the environment, all studies have been mainly
conducted in American, European and Asian countries. In
42
contrast, the current study was carried in an Arab country,
namely the Jordan.
2. Most of the previous studies have been mainly focusing on
service industry areas, while this one is all about a manufacturing
environment.
3. In terms of objectives, previous studies aimed to clarify the
effect of Strategic Orientation on Performance, while the current
study is concerned to verify the Relationship between Porter
Generic Strategies and Strategic Orientation on Jordanian Human
Drugs Industrial Companies.
43
Chapter Three
Method and Procedures
(3-1): Introduction
(3-2): Study Methodology
(3-3): Study Population and Sample
(3-4): Study Model
(3-5): Study Tools and Data Collection
(3-6): Statistical Treatment
(3-7): Validity and Reliability
44
(3-1): Introduction
This chapter is divided into the following six sections: Study
Methodology; Study Population and Sample; Study Model; Study
Tools and Data Collection; Statistical Treatment; Reliability and
Validity.
(3-2): Study Methodology
Descriptive research involves collecting data in order to test
hypotheses or to answer questions concerned with the current
status of the subject of the study. Typical descriptive studies are
concerned with the assessment of attitudes, opinions,
demographic information, conditions, and procedures. The
research design chosen for the study is the survey research. A
survey is an attempt to collect data from members of a population
in order to determine the current status of that population with
respect to one or more variables .The Survey research of
knowledge at its best can provide very valuable data. It involves a
careful design and execution of each of the components of the
research process.
The researcher designed a survey instrument that could be
administered to selected subjects. The purpose of the survey
45
instrument was to collect data concerning respondent's attitudes
towards Porter Generic Strategies and Strategic Orientation.
(3-3): Study Population and Sample
To increase credibility, it is important to choose the sample
that will represent the population under investigation. The
population of the study represents the whole workers in the
Jordanian Human Drugs Industrial Companies. The sample of the
study is the General Mangers and Marketing Managers who work at
the Jordanian Human Drugs Industrial Companies was (169). Table
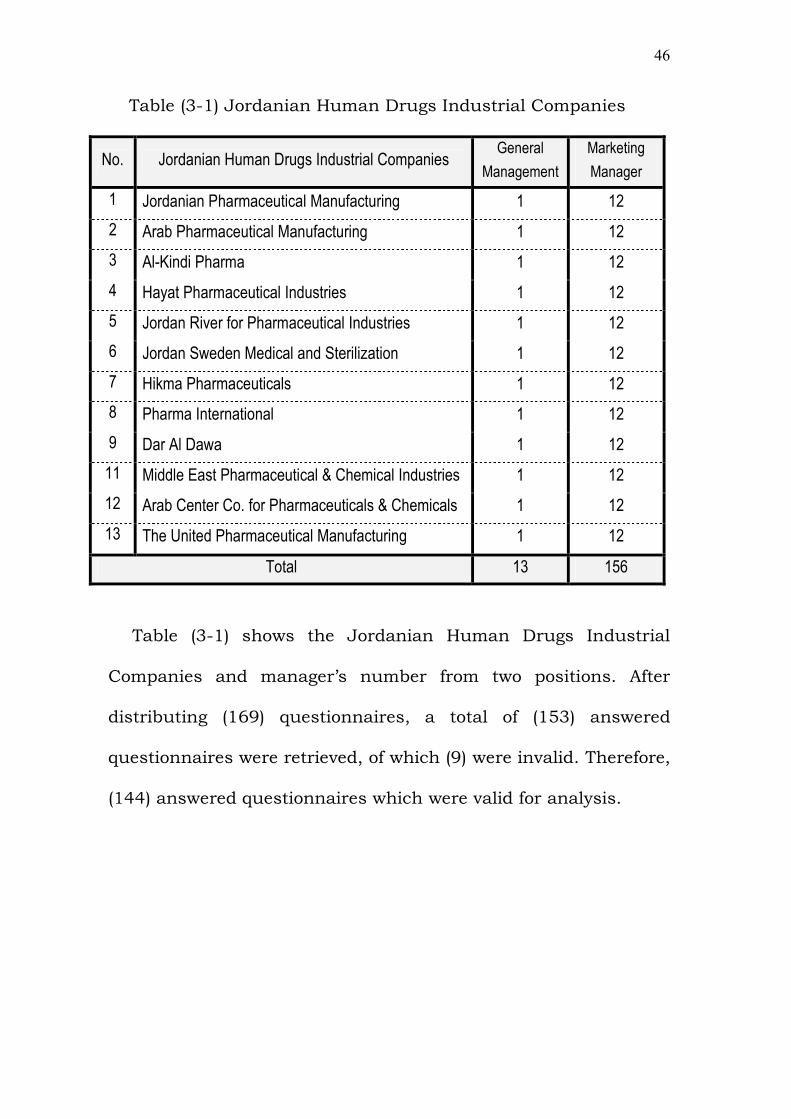
(3-1) shows the Jordanian Human Drugs Industrial Companies.
46
Table (3-1) Jordanian Human Drugs Industrial Companies
No. Jordanian Human Drugs Industrial Companies General
Management
Marketing
Manager
1 Jordanian Pharmaceutical Manufacturing 1 12
2 Arab Pharmaceutical Manufacturing 1 12
3 Al-Kindi Pharma 1 12
4 Hayat Pharmaceutical Industries 1 12
5 Jordan River for Pharmaceutical Industries 1 12
6 Jordan Sweden Medical and Sterilization 1 12
7 Hikma Pharmaceuticals 1 12
8 Pharma International 1 12
9 Dar Al Dawa 1 12
11 Middle East Pharmaceutical & Chemical Industries 1 12
12 Arab Center Co. for Pharmaceuticals & Chemicals 1 12
13 The United Pharmaceutical Manufacturing 1 12
Total 13 156
Table (3-1) shows the Jordanian Human Drugs Industrial
Companies and manager’s number from two positions. After
distributing (169) questionnaires, a total of (153) answered
questionnaires were retrieved, of which (9) were invalid. Therefore,
(144) answered questionnaires which were valid for analysis.
47
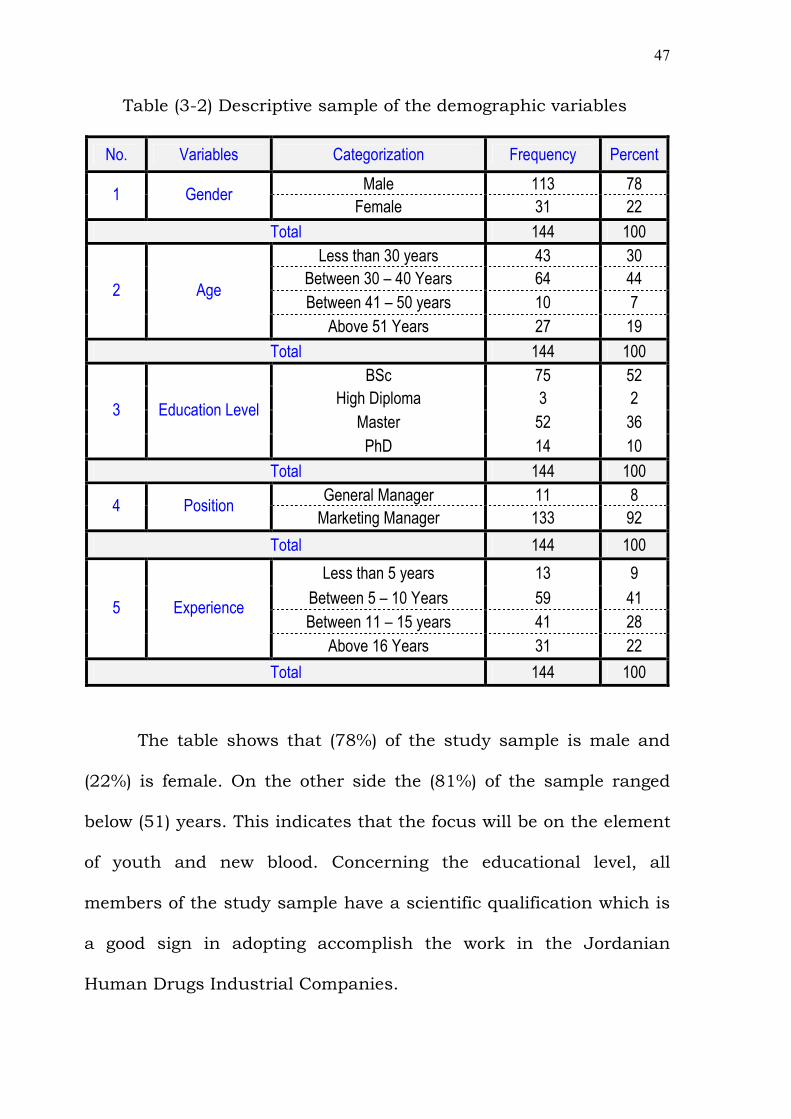
Table (3-2) Descriptive sample of the demographic variables
Percent Frequency Categorization Variables No.
78 113 Male 22 31 Female
Gender 1
100 144 Total
30 43 Less than 30 years 44 64 Between 30 – 40 Years
7 10 Between 41 – 50 years
19 27 Above 51 Years
Age 2
100 144 Total
52 75 BSc 2 3 High Diploma
36 52 Master
10 14 PhD
Education Level 3
100 144 Total
8 11 General Manager 92 133 Marketing Manager
Position 4
100 144 Total
9 13 Less than 5 years
41 59 Between 5 – 10 Years
28 41 Between 11 – 15 years
22 31 Above 16 Years
Experience 5
100 144 Total
The table shows that (78%) of the study sample is male and
(22%) is female. On the other side the (81%) of the sample ranged
below (51) years. This indicates that the focus will be on the element
of youth and new blood. Concerning the educational level, all
members of the study sample have a scientific qualification which is
a good sign in adopting accomplish the work in the Jordanian
Human Drugs Industrial Companies.
48
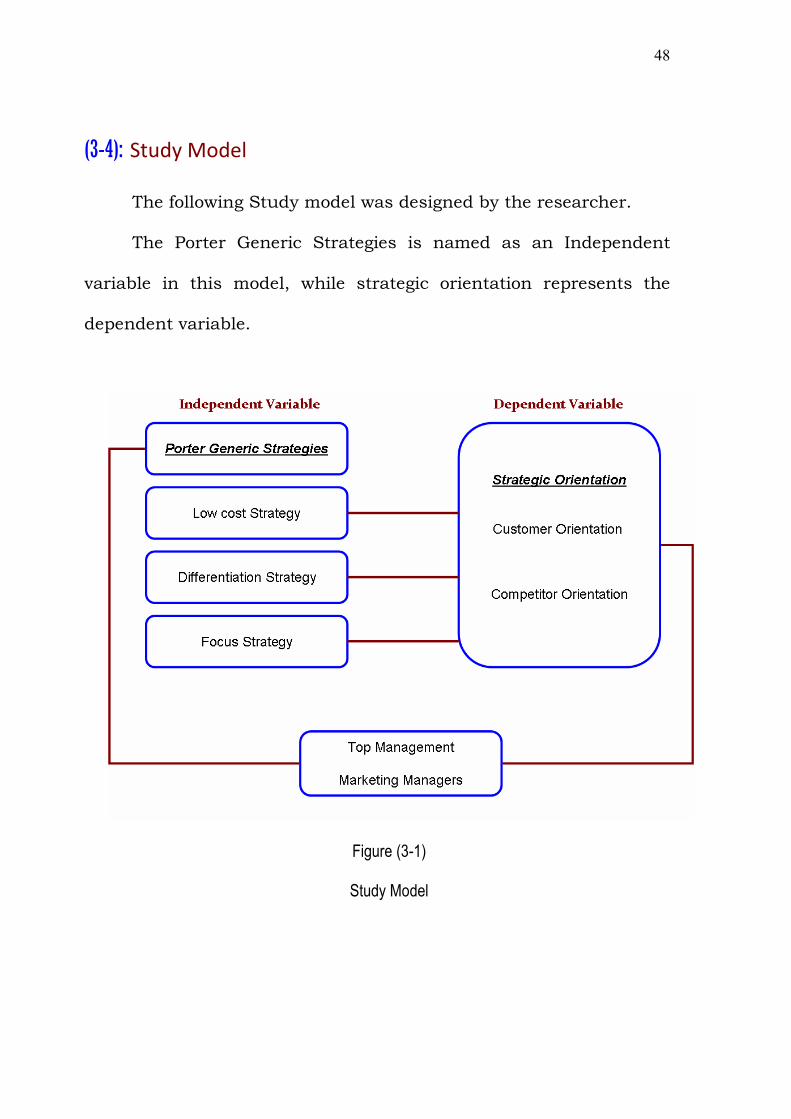
(3-4): Study Model
The following Study model was designed by the researcher.
The Porter Generic Strategies is named as an Independent
variable in this model, while strategic orientation represents the
dependent variable.
Figure (3-1)
Study Model
49
(3-5): Study Tools and Data Collection
The current study is two-fold, theoretical and practical. In the
theoretical side, the researcher relied on the scientific
studies/thoughts that are related to this study. Regarding in the
practical side, the researcher relied on descriptive and analytical
methods using the practical manner to collect, analyze data and test
hypotheses.
The data collection, manners analysis and programs used in
the current study are based on two sources:
1. Secondary sources: books, journals, theses to write the theoretical
framework of the study.
2. Primary source: a questionnaire that was designed to reflect the
study objectives and questions.
In this study, both primary and secondary data were used.
The data collected for the model was through questionnaire. After
conducting a thorough review of the literature pertaining to Porter
Generic Strategies and Strategic Orientation, the researcher
formulated the questionnaire instrument for this study.
The questionnaire instrumental sections are as follows:
50
Section One: Demographic variables. The demographic
information was collected with closed-ended questions, through (5)
factors (Gender; Age; Education Level; Position and Experience).
Section Two: Porter Generic Strategies. This section
measured the Porter Generic Strategies (cost leadership differention
and focus strategies) through (15) items on a Likert-type scale: Low
cost Strategy Measured through (6) questions from (1) to (6).
Differentiation Strategy Measured through (6) questions from (7)
to (12). Focus Strategy Measured through (3) questions from (13) to
(15).
Section Three: Strategic Orientation. This section measured
the Strategic Orientation suggested from Narver & Slater (1990:20-
35); Morgan & Strong, (1998: 1051-1073) (Customer orientation;
Competitor orientation), through (2) dimensions using (18) items on
a Likert-type scale: Customer orientation Measured by (12)
questions from (16) to (27). Competitor orientation Measured by (6)
questions from (28) to (33).
(3-6): Statistical Treatment
To analyze data collected from the questionnaire the researcher
used Statistical Package for the Social Sciences (SPSS). Finally, the
researcher used the suitable Statistical methods that consist of:
51
� Cronbach’s α to test the questionnaire reliability.
� Percentage and Frequency.
� Arithmetic Mean and Standard Deviation.
� Pearson Correlation.
� Chi2 to identify the different perspective between top management
and marketing managers about study variables.
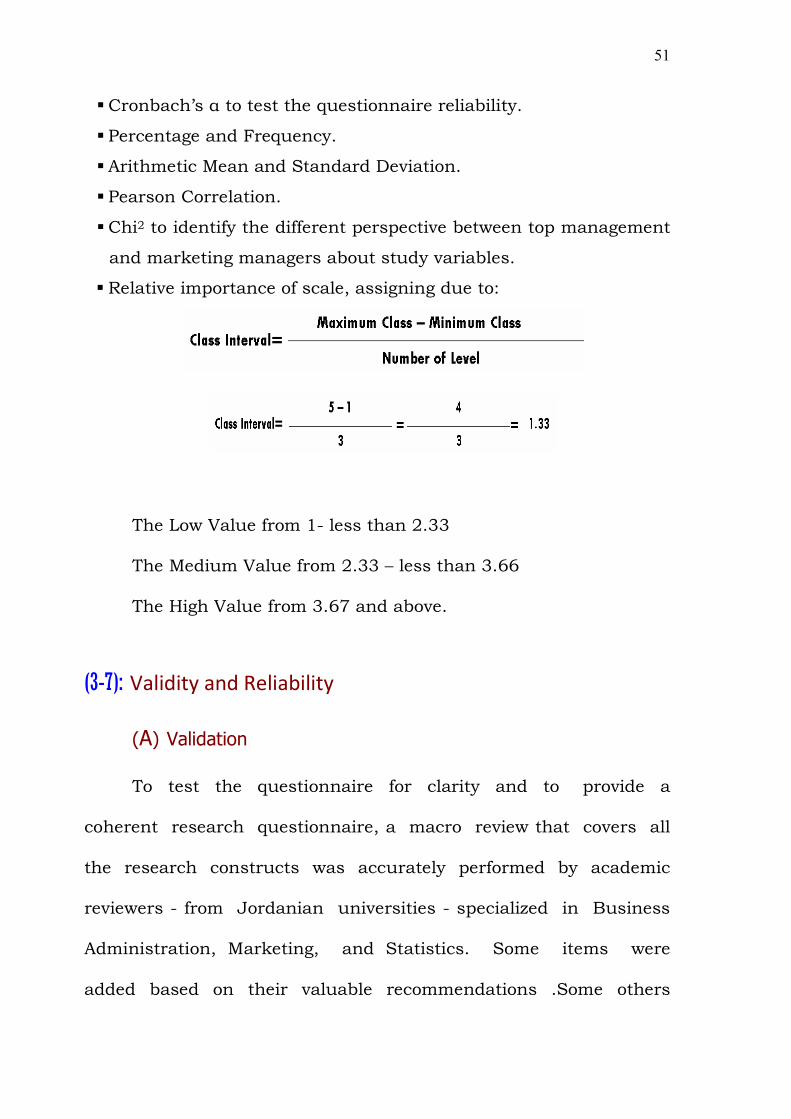
� Relative importance of scale, assigning due to:
The Low Value from 1- less than 2.33
The Medium Value from 2.33 – less than 3.66
The High Value from 3.67 and above.
(3-7): Validity and Reliability
(A) Validation
To test the questionnaire for clarity and to provide a
coherent research questionnaire, a macro review that covers all
the research constructs was accurately performed by academic
reviewers - from Jordanian universities - specialized in Business
Administration, Marketing, and Statistics. Some items were
added based on their valuable recommendations .Some others
52
were reformulated to become more accurate and to enhance
the research instrument. The academic reviewers are (4) and the
overall percent of respond is (100%), (see appendix “1”).
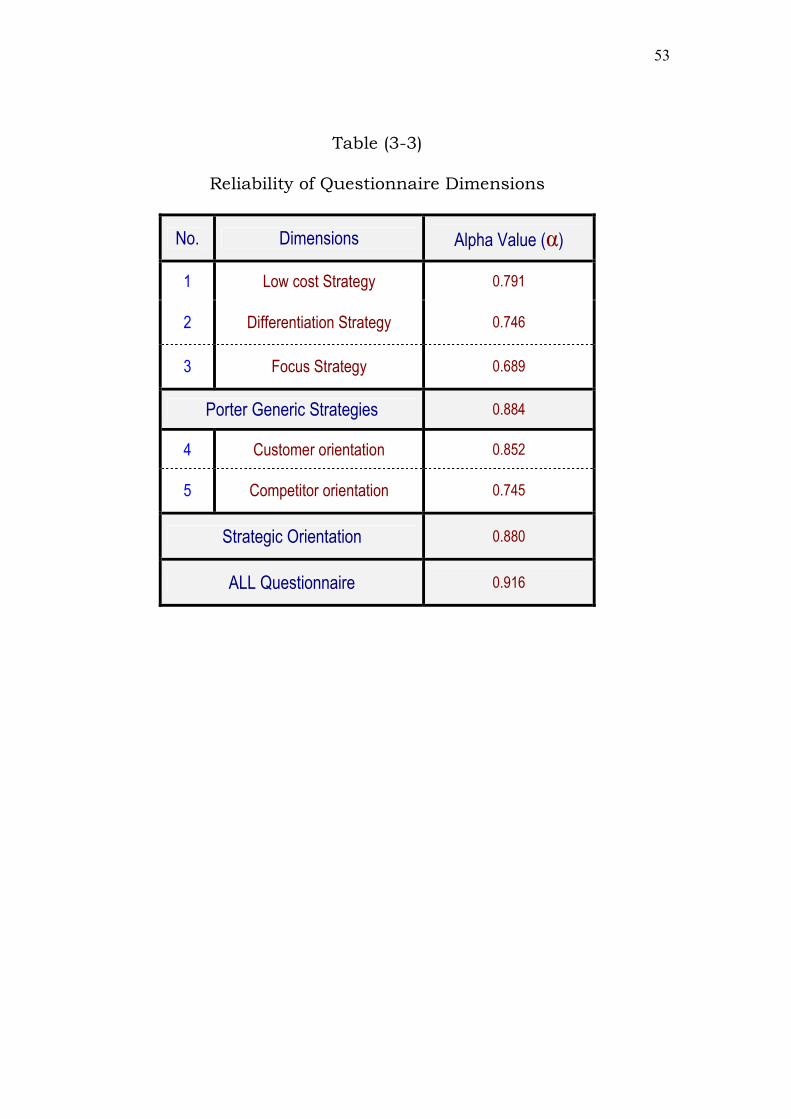
(B) Study Tool Reliability
The reliability analysis applied to the level of Cronbach Alpha
(α) is the criteria of internal consistency which was at a minimum
acceptable level (Alpha ≥ 0.60) suggested by (Sekaran, 2003). The
overall Cronbach Alpha (α) = (0.916), whereas the High level of
Cronbach Alpha (α) is to Customer orientation = (0.852). The lowest
level of Cronbach Alpha (α) is to Focus Strategy = (0.689). These
results are acceptable as suggested by (Sekaran, 2003). The results
were shown in Table (3-3).
53
Table (3-3)
Reliability of Questionnaire Dimensions
Alpha Value (α) Dimensions No.
0.791 Low cost Strategy 1
0.746 Differentiation Strategy 2
0.689 Focus Strategy 3
0.884 Porter Generic Strategies
0.852 Customer orientation 4
0.745 Competitor orientation 5
0.880 Strategic Orientation
0.916 ALL Questionnaire
54
Chapter Four
Analysis, Results & Hypotheses Test
(4-1): Introduction
(4-2): Descriptive analysis of study variables
(4-3): Study Hypotheses Test
(4-1): Introduction
55
According to the purpose of the research and the research
framework presented in the previous chapter, this chapter describes
the results of the statistical analysis of the data collection for the
research questions and research hypotheses. The data analysis
includes a description of the Means and Standard Deviations for the
questions of the study; Multiple and Simple Linear and Regression
analysis are used.
(4-2): Descriptive analysis of study variables
(4-2-1): Porter Generic Strategies:
Low cost Strategy:
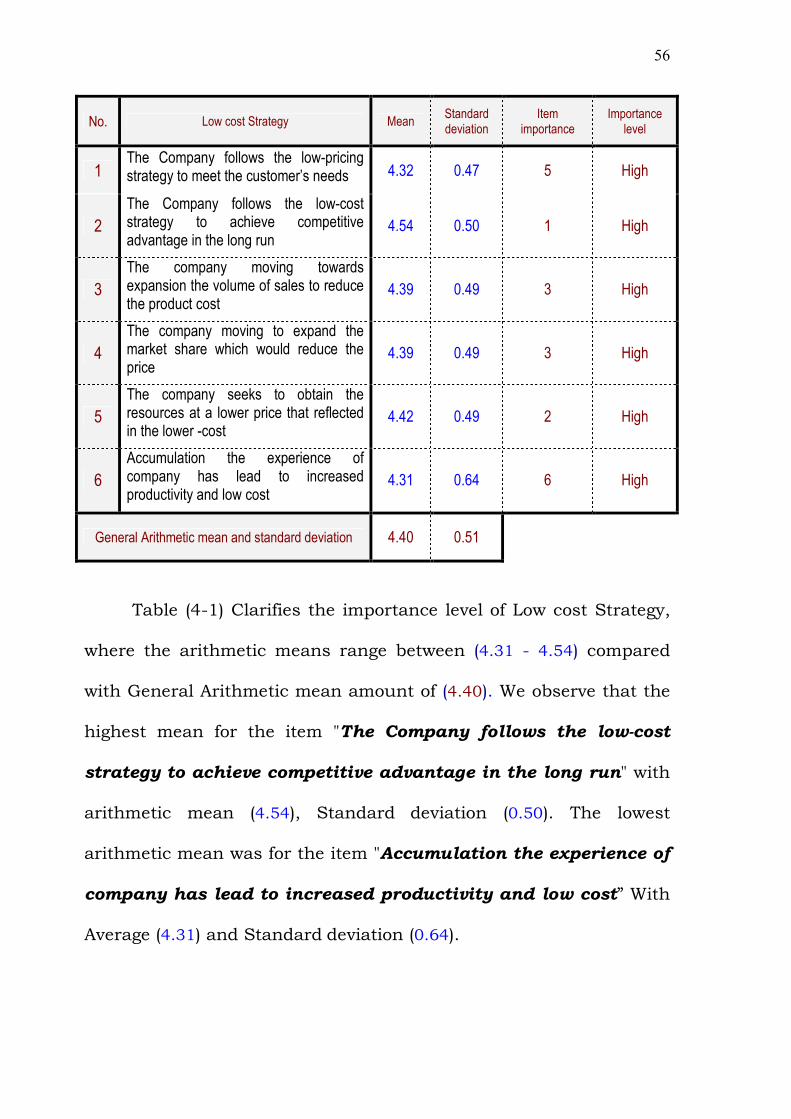
The researcher used the arithmetic mean, standard deviation,
item importance and importance level as shown in Table (4-1).
Table (4-1)
Arithmetic mean, SD, item importance and importance level of Low
cost Strategy
56
Importance level
Item importance
Standard deviation
Mean Low cost Strategy No.
High 5 0.47 4.32 The Company follows the low-pricing strategy to meet the customer’s needs 1
High 1 0.50 4.54
The Company follows the low-cost strategy to achieve competitive advantage in the long run
2
High 3 0.49 4.39
The company moving towards expansion the volume of sales to reduce the product cost
3
High 3 0.49 4.39
The company moving to expand the market share which would reduce the price
4
High 2 0.49 4.42
The company seeks to obtain the resources at a lower price that reflected in the lower -cost
5
High 6 0.64 4.31
Accumulation the experience of company has lead to increased productivity and low cost
6
0.51 4.40 General Arithmetic mean and standard deviation
Table (4-1) Clarifies the importance level of Low cost Strategy,
where the arithmetic means range between (4.31 - 4.54) compared
with General Arithmetic mean amount of (4.40). We observe that the
highest mean for the item "The Company follows the low-cost
strategy to achieve competitive advantage in the long run" with
arithmetic mean (4.54), Standard deviation (0.50). The lowest
arithmetic mean was for the item "Accumulation the experience of
company has lead to increased productivity and low cost” With
Average (4.31) and Standard deviation (0.64).
57
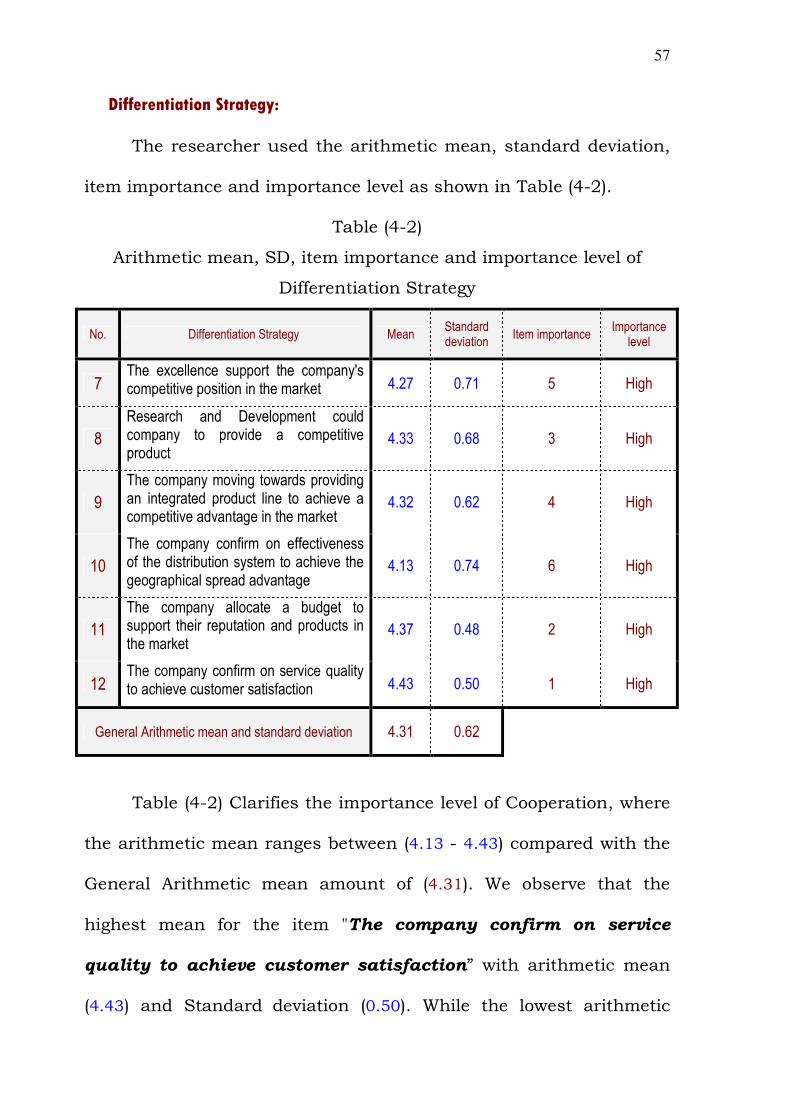
Differentiation Strategy:
The researcher used the arithmetic mean, standard deviation,
item importance and importance level as shown in Table (4-2).
Table (4-2)
Arithmetic mean, SD, item importance and importance level of
Differentiation Strategy
Importance level
Item importance Standard deviation
Mean Differentiation Strategy No.
High 5 0.71 4.27 The excellence support the company's competitive position in the market 7
High 3 0.68 4.33
Research and Development could company to provide a competitive product
8
High 4 0.62 4.32
The company moving towards providing an integrated product line to achieve a competitive advantage in the market
9
High 6 0.74 4.13
The company confirm on effectiveness of the distribution system to achieve the geographical spread advantage
10
High 2 0.48 4.37
The company allocate a budget to support their reputation and products in the market
11
High 1 0.50 4.43 The company confirm on service quality to achieve customer satisfaction 12
0.62 4.31 General Arithmetic mean and standard deviation
Table (4-2) Clarifies the importance level of Cooperation, where
the arithmetic mean ranges between (4.13 - 4.43) compared with the
General Arithmetic mean amount of (4.31). We observe that the
highest mean for the item "The company confirm on service
quality to achieve customer satisfaction” with arithmetic mean
(4.43) and Standard deviation (0.50). While the lowest arithmetic
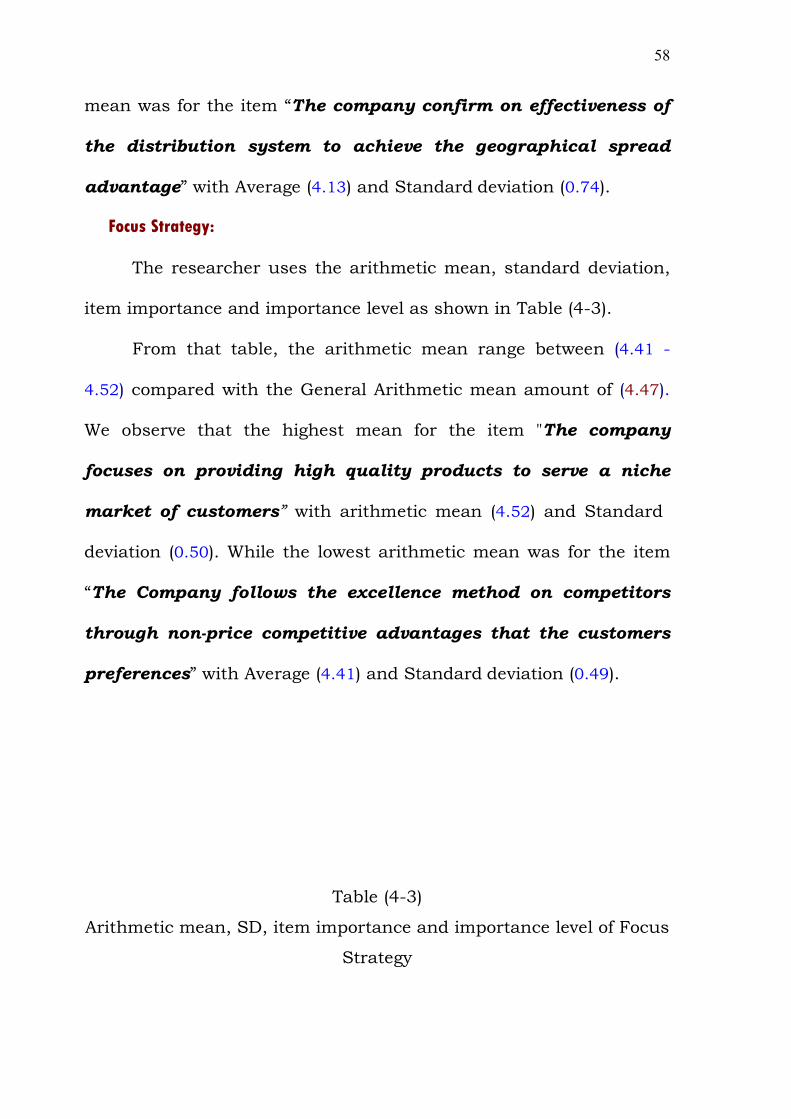
58
mean was for the item “The company confirm on effectiveness of
the distribution system to achieve the geographical spread
advantage” with Average (4.13) and Standard deviation (0.74).
Focus Strategy:
The researcher uses the arithmetic mean, standard deviation,
item importance and importance level as shown in Table (4-3).
From that table, the arithmetic mean range between (4.41 -
4.52) compared with the General Arithmetic mean amount of (4.47).
We observe that the highest mean for the item "The company
focuses on providing high quality products to serve a niche
market of customers” with arithmetic mean (4.52) and Standard
deviation (0.50). While the lowest arithmetic mean was for the item
“The Company follows the excellence method on competitors
through non-price competitive advantages that the customers
preferences” with Average (4.41) and Standard deviation (0.49).
Table (4-3)
Arithmetic mean, SD, item importance and importance level of Focus
Strategy
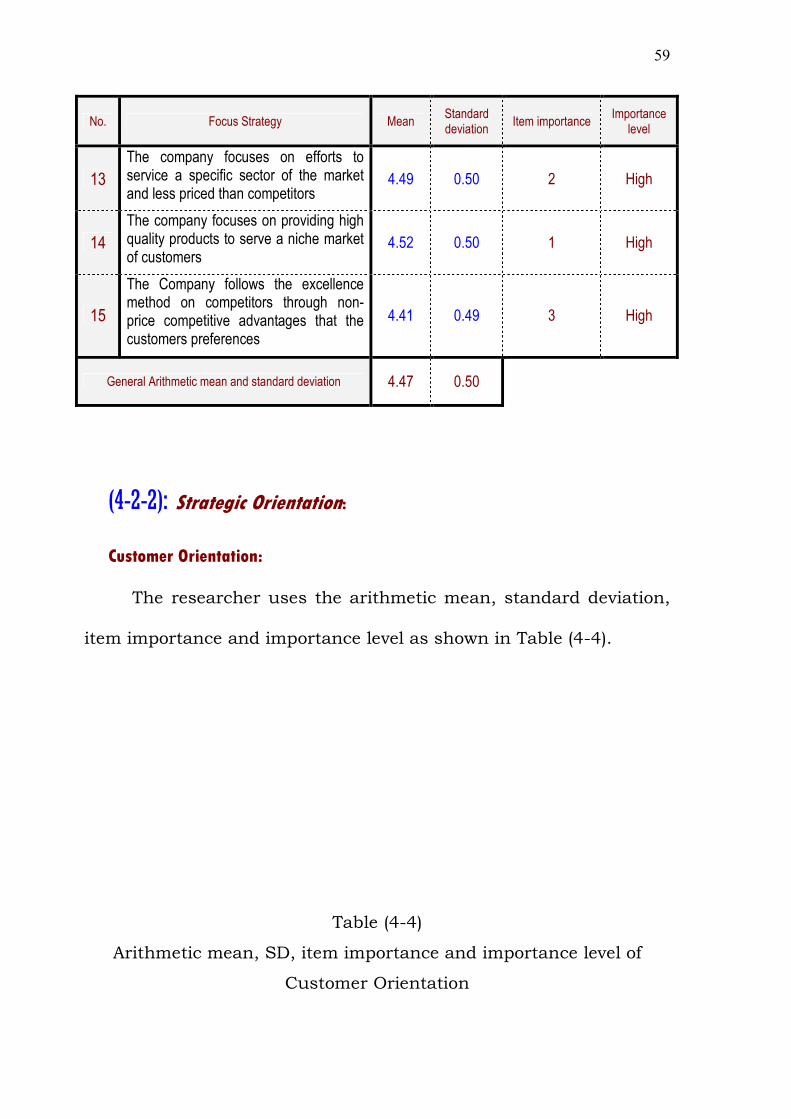
59
Importance level
Item importance Standard deviation
Mean Focus Strategy No.
High 2 0.50 4.49
The company focuses on efforts to service a specific sector of the market and less priced than competitors
13
High 1 0.50 4.52
The company focuses on providing high quality products to serve a niche market of customers
14
High 3 0.49 4.41
The Company follows the excellence method on competitors through non-price competitive advantages that the customers preferences
15
0.50 4.47 General Arithmetic mean and standard deviation
(4-2-2): Strategic Orientation:
Customer Orientation:
The researcher uses the arithmetic mean, standard deviation,
item importance and importance level as shown in Table (4-4).
Table (4-4)
Arithmetic mean, SD, item importance and importance level of
Customer Orientation
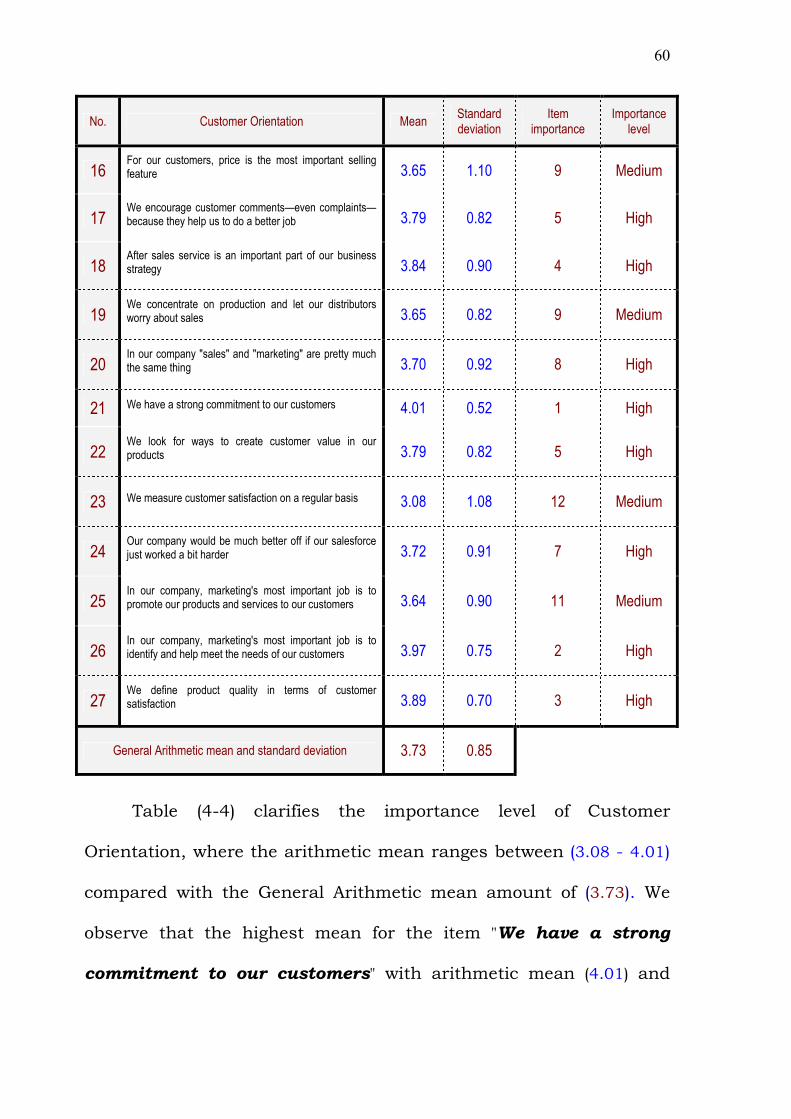
60
Importance level
Item importance
Standard deviation
Mean Customer Orientation No.
Medium 9 1.10 3.65 For our customers, price is the most important selling feature 16
High 5 0.82 3.79 We encourage customer comments—even complaints—because they help us to do a better job 17
High 4 0.90 3.84 After sales service is an important part of our business strategy 18
Medium 9 0.82 3.65 We concentrate on production and let our distributors worry about sales 19
High 8 0.92 3.70 In our company "sales" and "marketing" are pretty much the same thing 20
High 1 0.52 4.01 We have a strong commitment to our customers 21
High 5 0.82 3.79 We look for ways to create customer value in our products 22
Medium 12 1.08 3.08 We measure customer satisfaction on a regular basis 23
High 7 0.91 3.72 Our company would be much better off if our salesforce just worked a bit harder 24
Medium 11 0.90 3.64 In our company, marketing's most important job is to promote our products and services to our customers 25
High 2 0.75 3.97 In our company, marketing's most important job is to identify and help meet the needs of our customers 26
High 3 0.70 3.89 We define product quality in terms of customer satisfaction 27
0.85 3.73 General Arithmetic mean and standard deviation
Table (4-4) clarifies the importance level of Customer
Orientation, where the arithmetic mean ranges between (3.08 - 4.01)
compared with the General Arithmetic mean amount of (3.73). We
observe that the highest mean for the item "We have a strong
commitment to our customers" with arithmetic mean (4.01) and
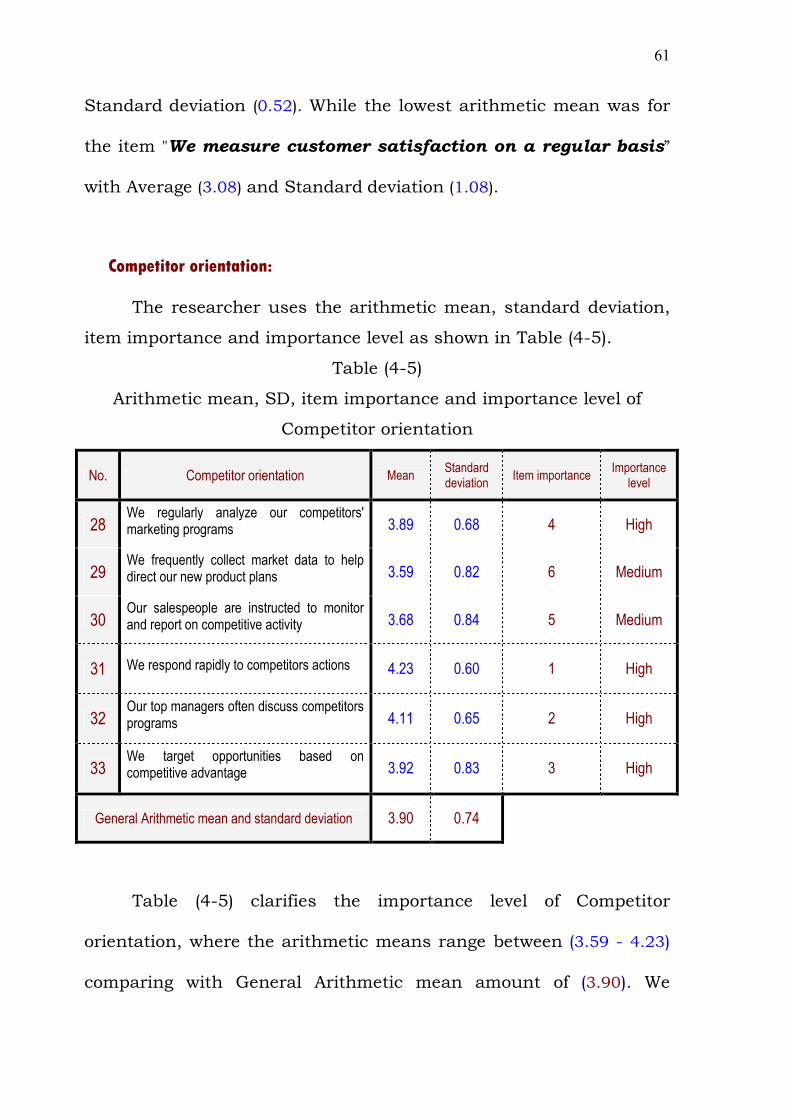
61
Standard deviation (0.52). While the lowest arithmetic mean was for
the item "We measure customer satisfaction on a regular basis”
with Average (3.08) and Standard deviation (1.08).
Competitor orientation:
The researcher uses the arithmetic mean, standard deviation,
item importance and importance level as shown in Table (4-5).
Table (4-5)
Arithmetic mean, SD, item importance and importance level of
Competitor orientation
Importance level
Item importance Standard deviation
Mean Competitor orientation No.
High 4 0.68 3.89 We regularly analyze our competitors' marketing programs 28
Medium 6 0.82 3.59 We frequently collect market data to help direct our new product plans 29
Medium 5 0.84 3.68 Our salespeople are instructed to monitor and report on competitive activity 30
High 1 0.60 4.23 We respond rapidly to competitors actions 31
High 2 0.65 4.11 Our top managers often discuss competitors programs 32
High 3 0.83 3.92 We target opportunities based on competitive advantage 33
0.74 3.90 General Arithmetic mean and standard deviation
Table (4-5) clarifies the importance level of Competitor
orientation, where the arithmetic means range between (3.59 - 4.23)
comparing with General Arithmetic mean amount of (3.90). We
62
observe that the highest mean for the item "We respond rapidly to
competitors actions” with arithmetic mean (4.23) and Standard
deviation (0.60). While the lowest arithmetic mean was for the item
"We frequently collect market data to help direct our new
product plans” with Average (3.59) and Standard deviation (0.82).
(4-3): Study Hypotheses Test
63
The researcher in this part tested the main hypotheses and
studied sub hypotheses, through Pearson Correlation, and Chi2 to
identify the different perspective between General management and
marketing managers about study variables:
HO1: There is no significant relationship between Porter
generic Strategies (low cost Strategy; differentiation Strategy; focus
Strategy) and Strategic Orientation (Customer orientation; Competitor
orientation) at level (αααα ≤≤≤≤ 0.05).
To test this hypothesis, the researcher uses the Pearson
Correlation to ensure the Correlation between Porter generic
Strategies (low cost Strategy; differentiation Strategy; focus Strategy)
and Strategic Orientation (Customer orientation; Competitor
orientation) in Jordanian Human Drugs Industrial Companies. As
shown in Table (4-6).
Table (4-6)
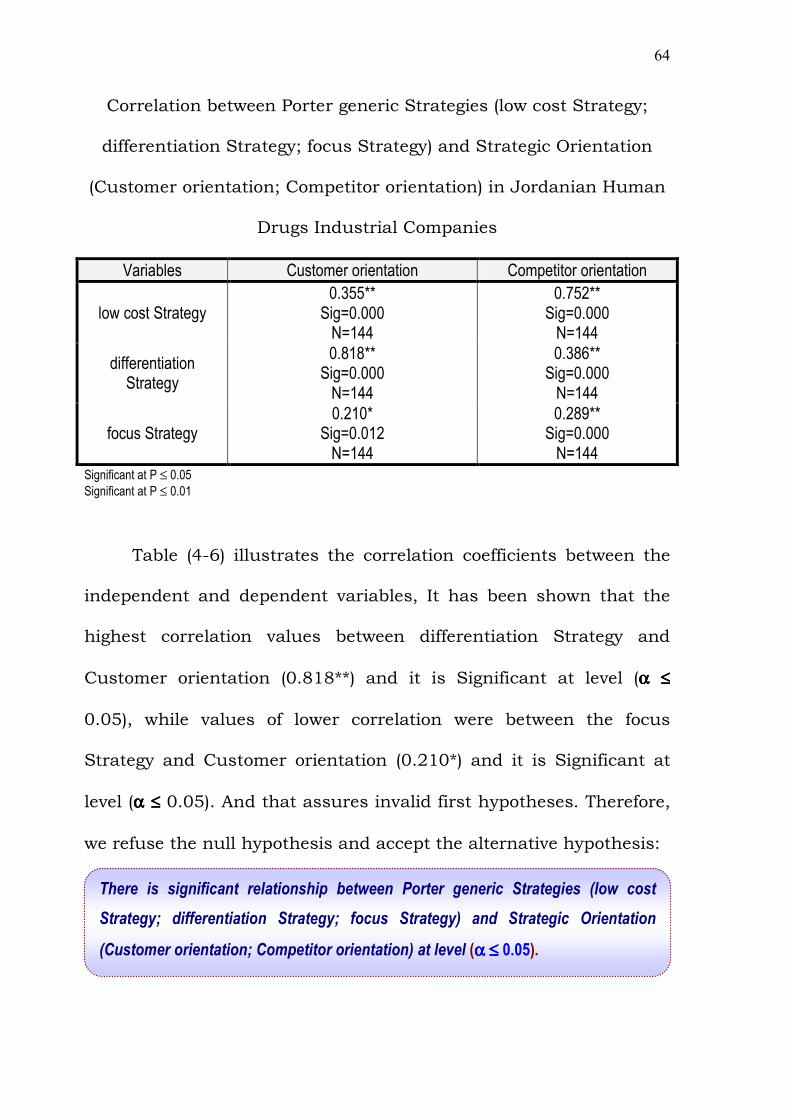
64
Correlation between Porter generic Strategies (low cost Strategy;
differentiation Strategy; focus Strategy) and Strategic Orientation
(Customer orientation; Competitor orientation) in Jordanian Human
Drugs Industrial Companies
Variables Customer orientation Competitor orientation
low cost Strategy 0.355** Sig=0.000 N=144
0.752** Sig=0.000 N=144
differentiation Strategy
0.818** Sig=0.000 N=144
0.386** Sig=0.000 N=144
focus Strategy 0.210*
Sig=0.012 N=144
0.289** Sig=0.000 N=144
Significant at P ≤ 0.05
Significant at P ≤ 0.01
Table (4-6) illustrates the correlation coefficients between the
independent and dependent variables, It has been shown that the
highest correlation values between differentiation Strategy and
Customer orientation (0.818**) and it is Significant at level (αααα ≤≤≤≤
0.05), while values of lower correlation were between the focus
Strategy and Customer orientation (0.210*) and it is Significant at
level (αααα ≤≤≤≤ 0.05). And that assures invalid first hypotheses. Therefore,
we refuse the null hypothesis and accept the alternative hypothesis:
There is significant relationship between Porter generic Strategies (low cost
Strategy; differentiation Strategy; focus Strategy) and Strategic Orientation
(Customer orientation; Competitor orientation) at level (αααα ≤≤≤≤ 0.05).
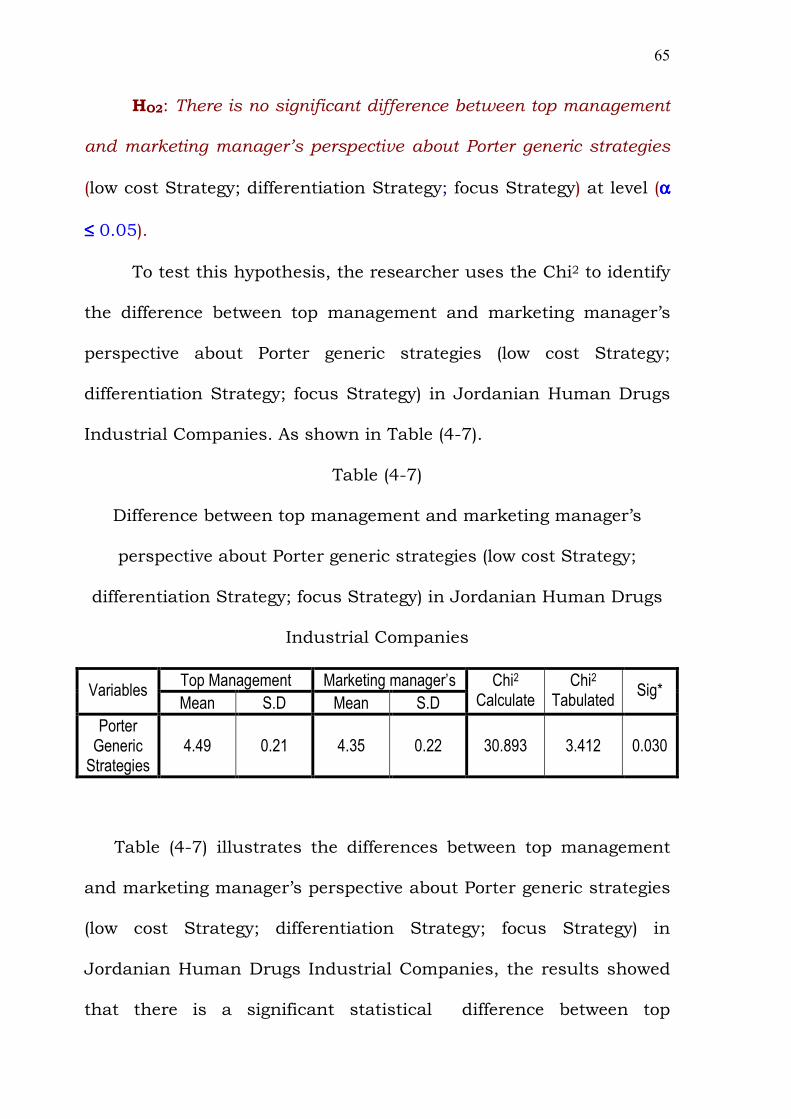
65
HO2: There is no significant difference between top management
and marketing manager’s perspective about Porter generic strategies
(low cost Strategy; differentiation Strategy; focus Strategy) at level (αααα
≤≤≤≤ 0.05).
To test this hypothesis, the researcher uses the Chi2 to identify
the difference between top management and marketing manager’s
perspective about Porter generic strategies (low cost Strategy;
differentiation Strategy; focus Strategy) in Jordanian Human Drugs
Industrial Companies. As shown in Table (4-7).
Table (4-7)
Difference between top management and marketing manager’s
perspective about Porter generic strategies (low cost Strategy;
differentiation Strategy; focus Strategy) in Jordanian Human Drugs
Industrial Companies
Top Management Marketing manager’s Variables
Mean S.D Mean S.D
Chi2 Calculate
Chi2 Tabulated
Sig*
Porter Generic Strategies
4.49 0.21 4.35 0.22 30.893 3.412 0.030
Table (4-7) illustrates the differences between top management
and marketing manager’s perspective about Porter generic strategies
(low cost Strategy; differentiation Strategy; focus Strategy) in
Jordanian Human Drugs Industrial Companies, the results showed
that there is a significant statistical difference between top
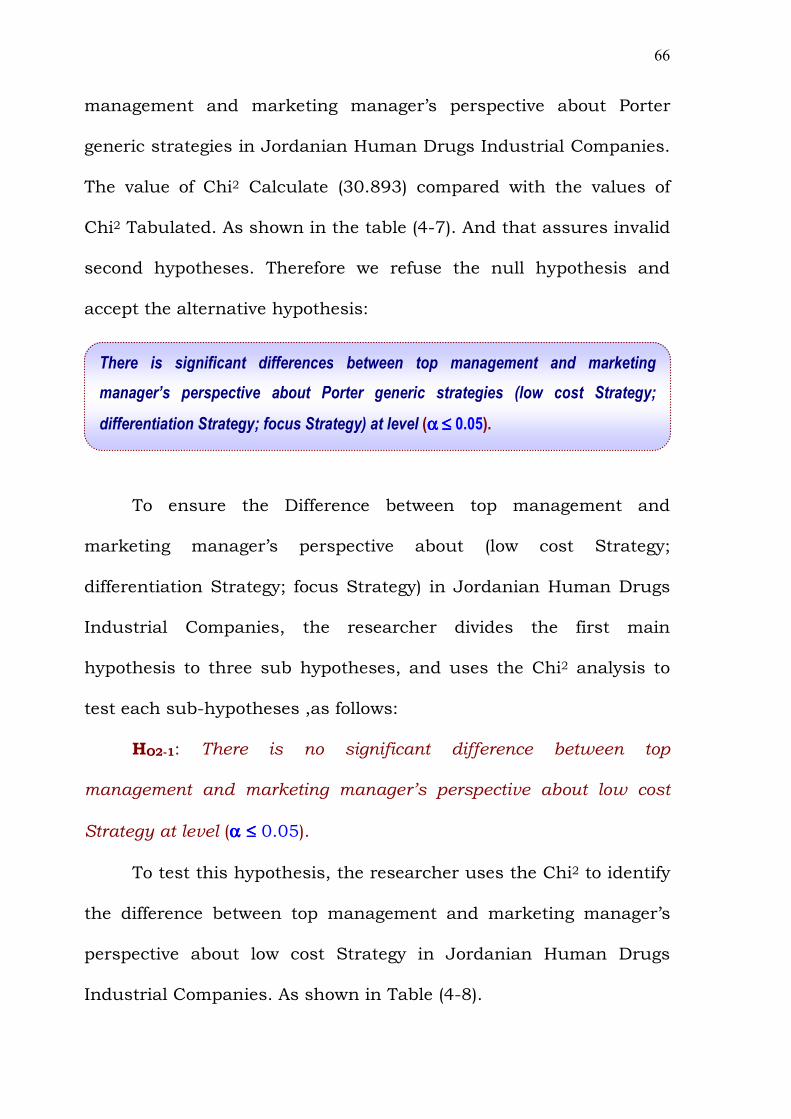
66
management and marketing manager’s perspective about Porter
generic strategies in Jordanian Human Drugs Industrial Companies.
The value of Chi2 Calculate (30.893) compared with the values of
Chi2 Tabulated. As shown in the table (4-7). And that assures invalid
second hypotheses. Therefore we refuse the null hypothesis and
accept the alternative hypothesis:
To ensure the Difference between top management and
marketing manager’s perspective about (low cost Strategy;
differentiation Strategy; focus Strategy) in Jordanian Human Drugs
Industrial Companies, the researcher divides the first main
hypothesis to three sub hypotheses, and uses the Chi2 analysis to
test each sub-hypotheses ,as follows:
HO2-1: There is no significant difference between top
management and marketing manager’s perspective about low cost
Strategy at level (αααα ≤≤≤≤ 0.05).
To test this hypothesis, the researcher uses the Chi2 to identify
the difference between top management and marketing manager’s
perspective about low cost Strategy in Jordanian Human Drugs
Industrial Companies. As shown in Table (4-8).
There is significant differences between top management and marketing
manager’s perspective about Porter generic strategies (low cost Strategy;
differentiation Strategy; focus Strategy) at level (αααα ≤≤≤≤ 0.05).
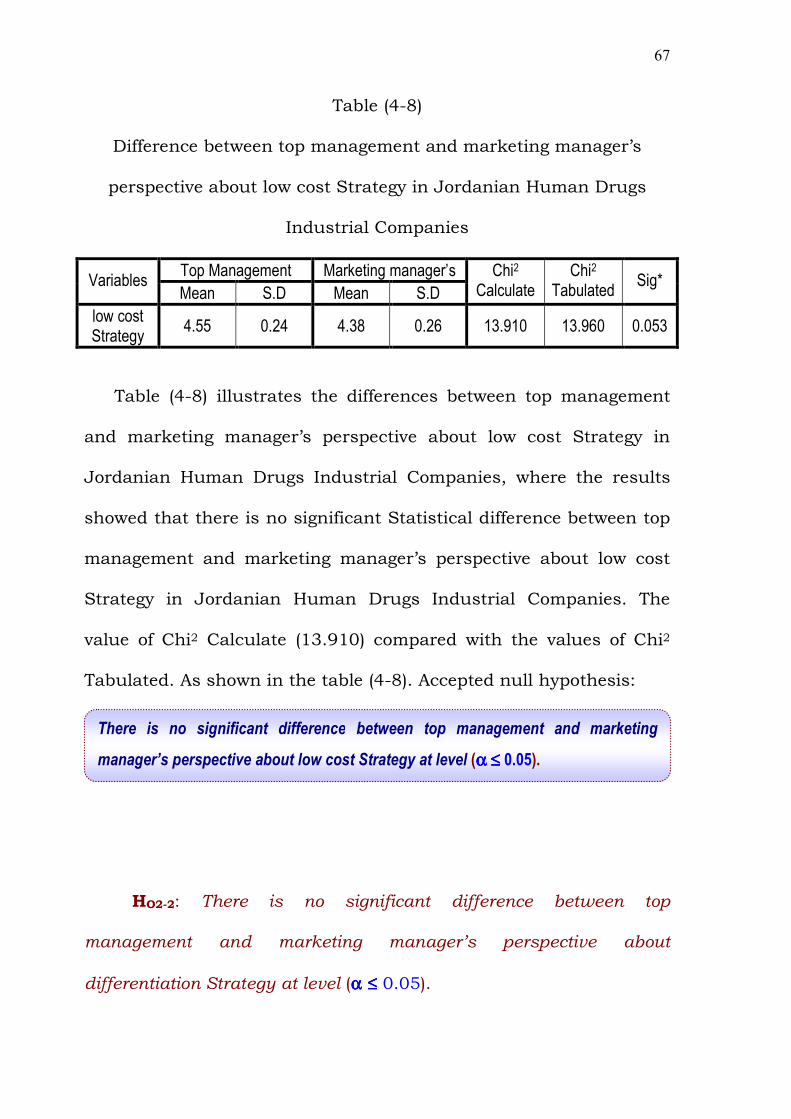
67
Table (4-8)
Difference between top management and marketing manager’s
perspective about low cost Strategy in Jordanian Human Drugs
Industrial Companies
Top Management Marketing manager’s Variables
Mean S.D Mean S.D
Chi2 Calculate
Chi2 Tabulated
Sig*
low cost Strategy
4.55 0.24 4.38 0.26 13.910 13.960 0.053
Table (4-8) illustrates the differences between top management
and marketing manager’s perspective about low cost Strategy in
Jordanian Human Drugs Industrial Companies, where the results
showed that there is no significant Statistical difference between top
management and marketing manager’s perspective about low cost
Strategy in Jordanian Human Drugs Industrial Companies. The
value of Chi2 Calculate (13.910) compared with the values of Chi2
Tabulated. As shown in the table (4-8). Accepted null hypothesis:
HO2-2: There is no significant difference between top
management and marketing manager’s perspective about
differentiation Strategy at level (αααα ≤≤≤≤ 0.05).
There is no significant difference between top management and marketing
manager’s perspective about low cost Strategy at level (αααα ≤≤≤≤ 0.05).
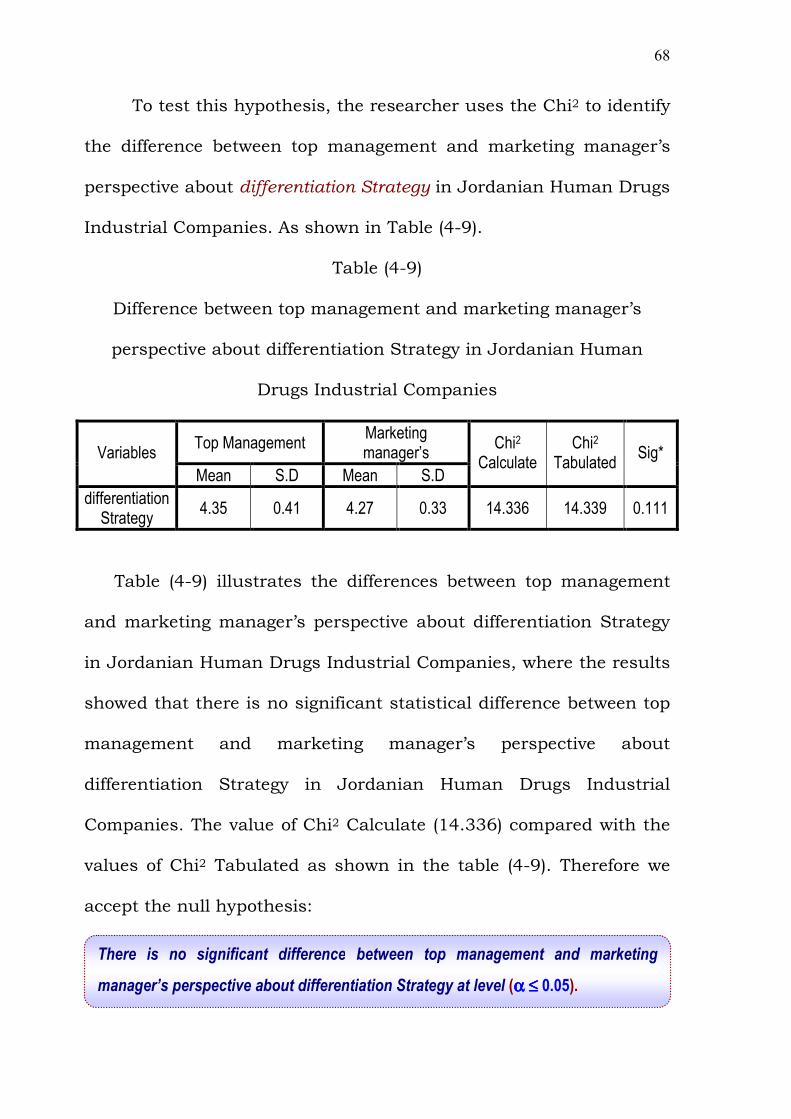
68
To test this hypothesis, the researcher uses the Chi2 to identify
the difference between top management and marketing manager’s
perspective about differentiation Strategy in Jordanian Human Drugs
Industrial Companies. As shown in Table (4-9).
Table (4-9)
Difference between top management and marketing manager’s
perspective about differentiation Strategy in Jordanian Human
Drugs Industrial Companies
Top Management Marketing manager’s Variables
Mean S.D Mean S.D
Chi2 Calculate
Chi2 Tabulated
Sig*
differentiation Strategy
4.35 0.41 4.27 0.33 14.336 14.339 0.111
Table (4-9) illustrates the differences between top management
and marketing manager’s perspective about differentiation Strategy
in Jordanian Human Drugs Industrial Companies, where the results
showed that there is no significant statistical difference between top
management and marketing manager’s perspective about
differentiation Strategy in Jordanian Human Drugs Industrial
Companies. The value of Chi2 Calculate (14.336) compared with the
values of Chi2 Tabulated as shown in the table (4-9). Therefore we
accept the null hypothesis:
There is no significant difference between top management and marketing
manager’s perspective about differentiation Strategy at level (αααα ≤≤≤≤ 0.05).
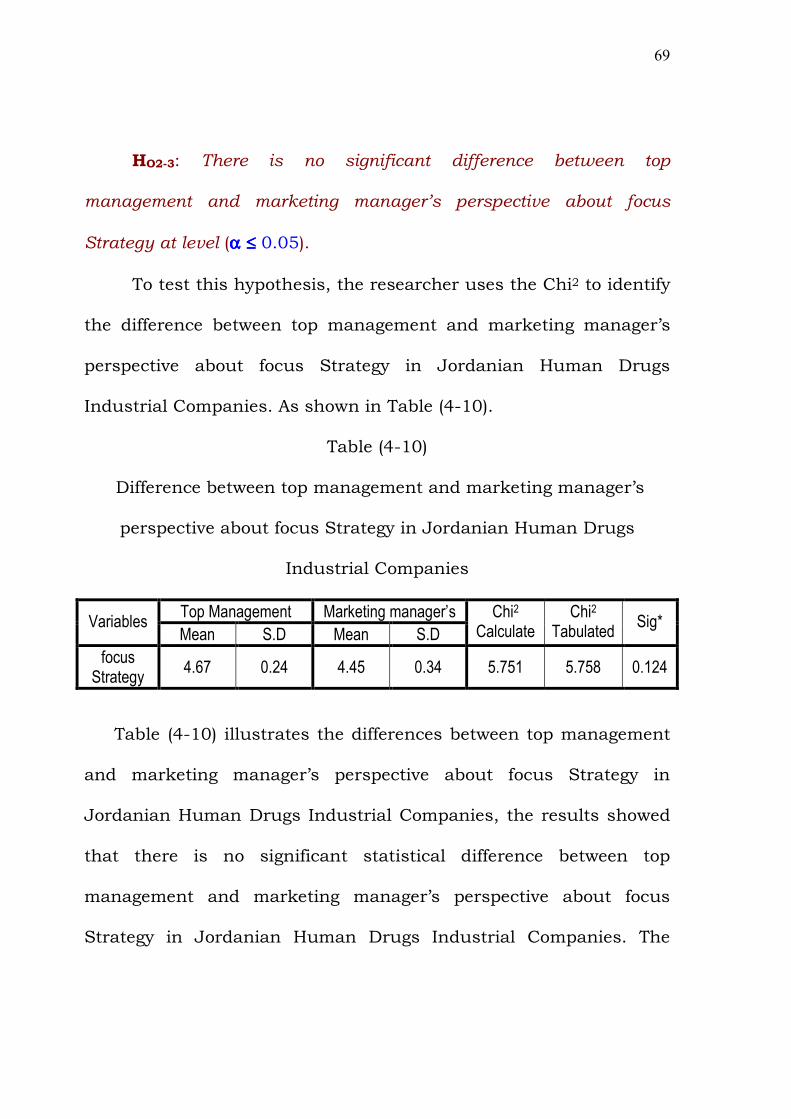
69
HO2-3: There is no significant difference between top
management and marketing manager’s perspective about focus
Strategy at level (αααα ≤≤≤≤ 0.05).
To test this hypothesis, the researcher uses the Chi2 to identify
the difference between top management and marketing manager’s
perspective about focus Strategy in Jordanian Human Drugs
Industrial Companies. As shown in Table (4-10).
Table (4-10)
Difference between top management and marketing manager’s
perspective about focus Strategy in Jordanian Human Drugs
Industrial Companies
Top Management Marketing manager’s Variables
Mean S.D Mean S.D
Chi2 Calculate
Chi2 Tabulated
Sig*
focus Strategy
4.67 0.24 4.45 0.34 5.751 5.758 0.124
Table (4-10) illustrates the differences between top management
and marketing manager’s perspective about focus Strategy in
Jordanian Human Drugs Industrial Companies, the results showed
that there is no significant statistical difference between top
management and marketing manager’s perspective about focus
Strategy in Jordanian Human Drugs Industrial Companies. The
70
value of Chi2 Calculate (5.751) compared with the values of Chi2
Tabulated. As shown in the table (4-10). Accepted null hypothesis:
HO3: There is no significant difference between top management
and marketing manager’s perspective about Strategic Orientation
(Customer orientation; Competitor orientation) at level (αααα ≤≤≤≤ 0.05).
To test this hypothesis, the researcher uses the Chi2 to identify
the difference between top management and marketing manager’s
perspective about Strategic Orientation (Customer orientation;
Competitor orientation) in Jordanian Human Drugs Industrial
Companies. A shown in Table (4-11).
Table (4-11)
There is no significant difference between top management and marketing
manager’s perspective about focus Strategy at level (αααα ≤≤≤≤ 0.05).
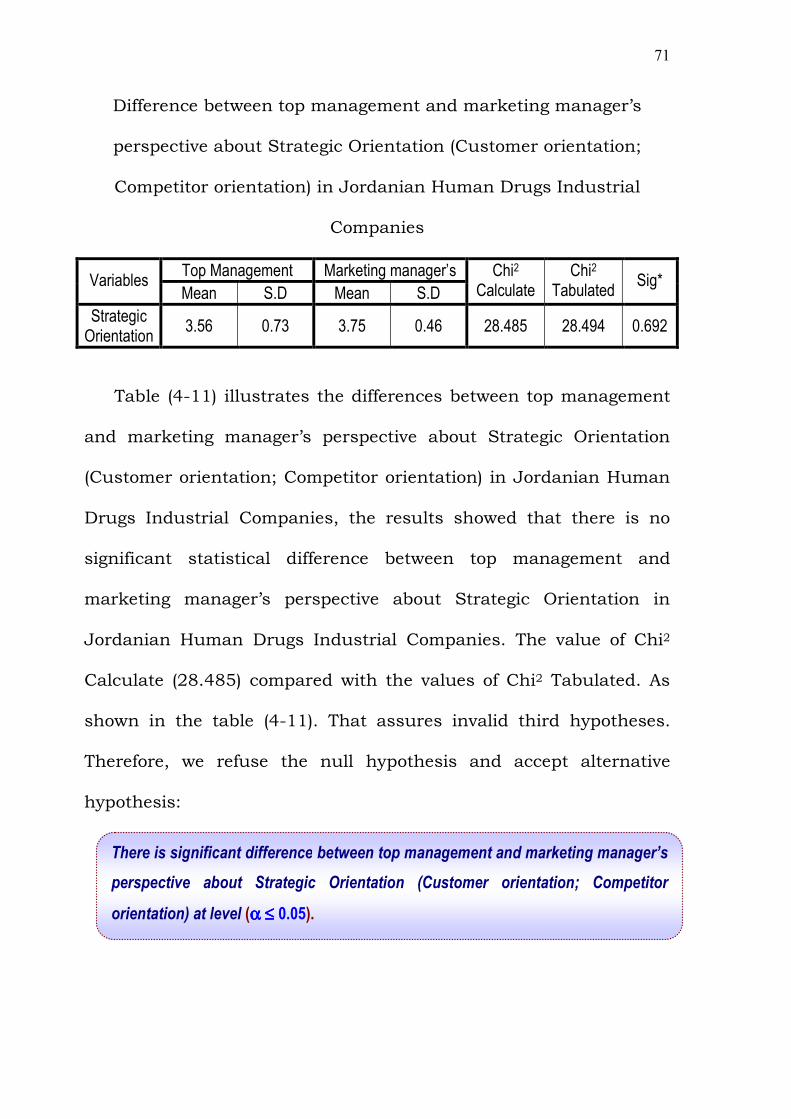
71
Difference between top management and marketing manager’s
perspective about Strategic Orientation (Customer orientation;
Competitor orientation) in Jordanian Human Drugs Industrial
Companies
Top Management Marketing manager’s Variables
Mean S.D Mean S.D
Chi2 Calculate
Chi2 Tabulated
Sig*
Strategic Orientation
3.56 0.73 3.75 0.46 28.485 28.494 0.692
Table (4-11) illustrates the differences between top management
and marketing manager’s perspective about Strategic Orientation
(Customer orientation; Competitor orientation) in Jordanian Human
Drugs Industrial Companies, the results showed that there is no
significant statistical difference between top management and
marketing manager’s perspective about Strategic Orientation in
Jordanian Human Drugs Industrial Companies. The value of Chi2
Calculate (28.485) compared with the values of Chi2 Tabulated. As
shown in the table (4-11). That assures invalid third hypotheses.
Therefore, we refuse the null hypothesis and accept alternative
hypothesis:
There is significant difference between top management and marketing manager’s
perspective about Strategic Orientation (Customer orientation; Competitor
orientation) at level (αααα ≤≤≤≤ 0.05).
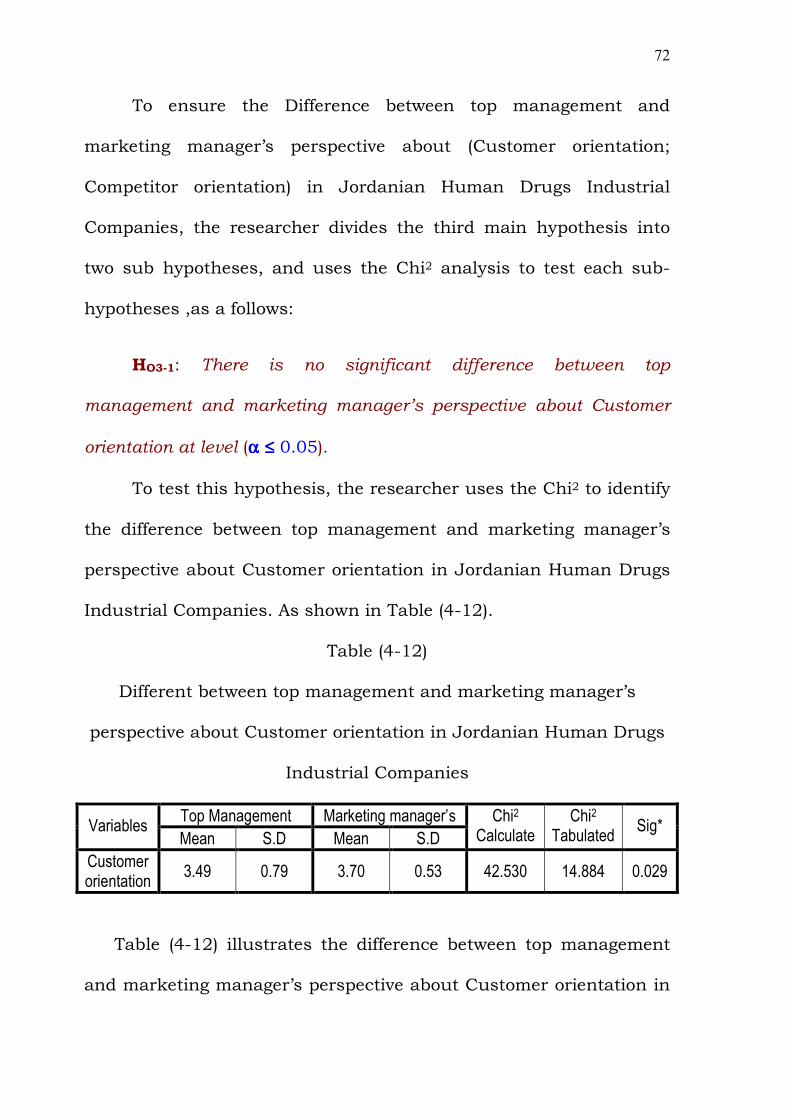
72
To ensure the Difference between top management and
marketing manager’s perspective about (Customer orientation;
Competitor orientation) in Jordanian Human Drugs Industrial
Companies, the researcher divides the third main hypothesis into
two sub hypotheses, and uses the Chi2 analysis to test each sub-
hypotheses ,as a follows:
HO3-1: There is no significant difference between top
management and marketing manager’s perspective about Customer
orientation at level (αααα ≤≤≤≤ 0.05).
To test this hypothesis, the researcher uses the Chi2 to identify
the difference between top management and marketing manager’s
perspective about Customer orientation in Jordanian Human Drugs
Industrial Companies. As shown in Table (4-12).
Table (4-12)
Different between top management and marketing manager’s
perspective about Customer orientation in Jordanian Human Drugs
Industrial Companies
Top Management Marketing manager’s Variables
Mean S.D Mean S.D
Chi2 Calculate
Chi2 Tabulated
Sig*
Customer orientation
3.49 0.79 3.70 0.53 42.530 14.884 0.029
Table (4-12) illustrates the difference between top management
and marketing manager’s perspective about Customer orientation in
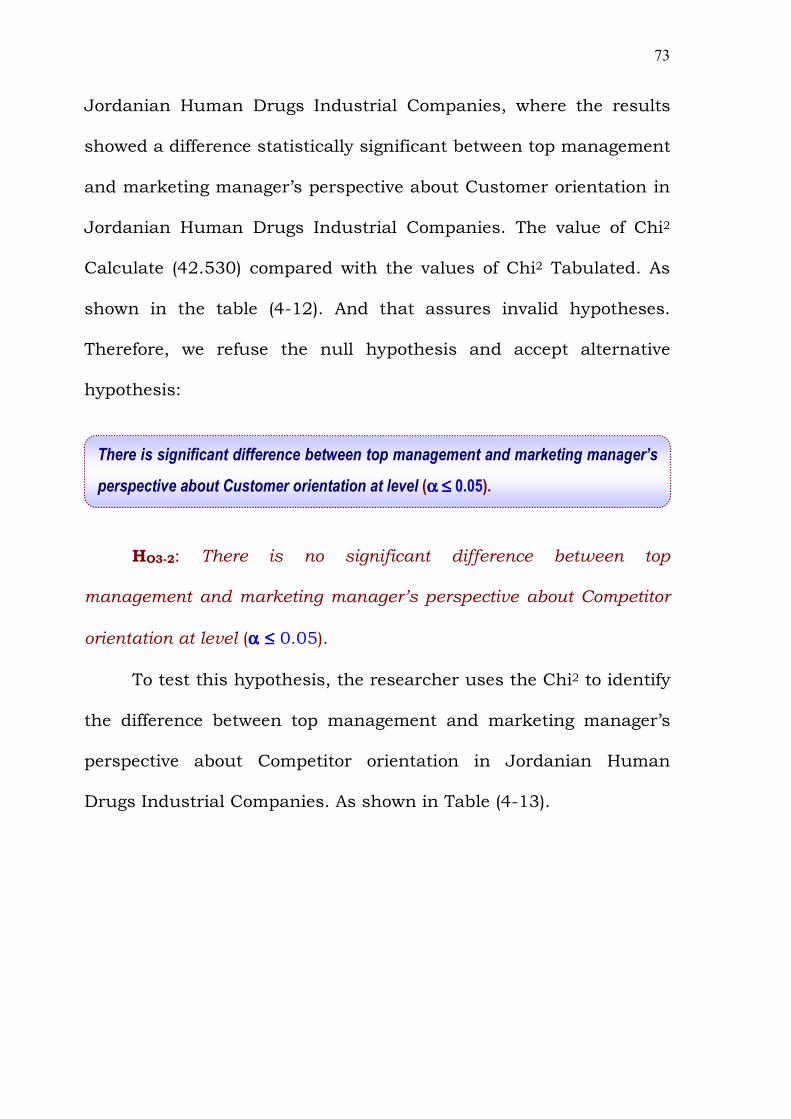
73
Jordanian Human Drugs Industrial Companies, where the results
showed a difference statistically significant between top management
and marketing manager’s perspective about Customer orientation in
Jordanian Human Drugs Industrial Companies. The value of Chi2
Calculate (42.530) compared with the values of Chi2 Tabulated. As
shown in the table (4-12). And that assures invalid hypotheses.
Therefore, we refuse the null hypothesis and accept alternative
hypothesis:
HO3-2: There is no significant difference between top
management and marketing manager’s perspective about Competitor
orientation at level (αααα ≤≤≤≤ 0.05).
To test this hypothesis, the researcher uses the Chi2 to identify
the difference between top management and marketing manager’s
perspective about Competitor orientation in Jordanian Human
Drugs Industrial Companies. As shown in Table (4-13).
There is significant difference between top management and marketing manager’s
perspective about Customer orientation at level (αααα ≤≤≤≤ 0.05).
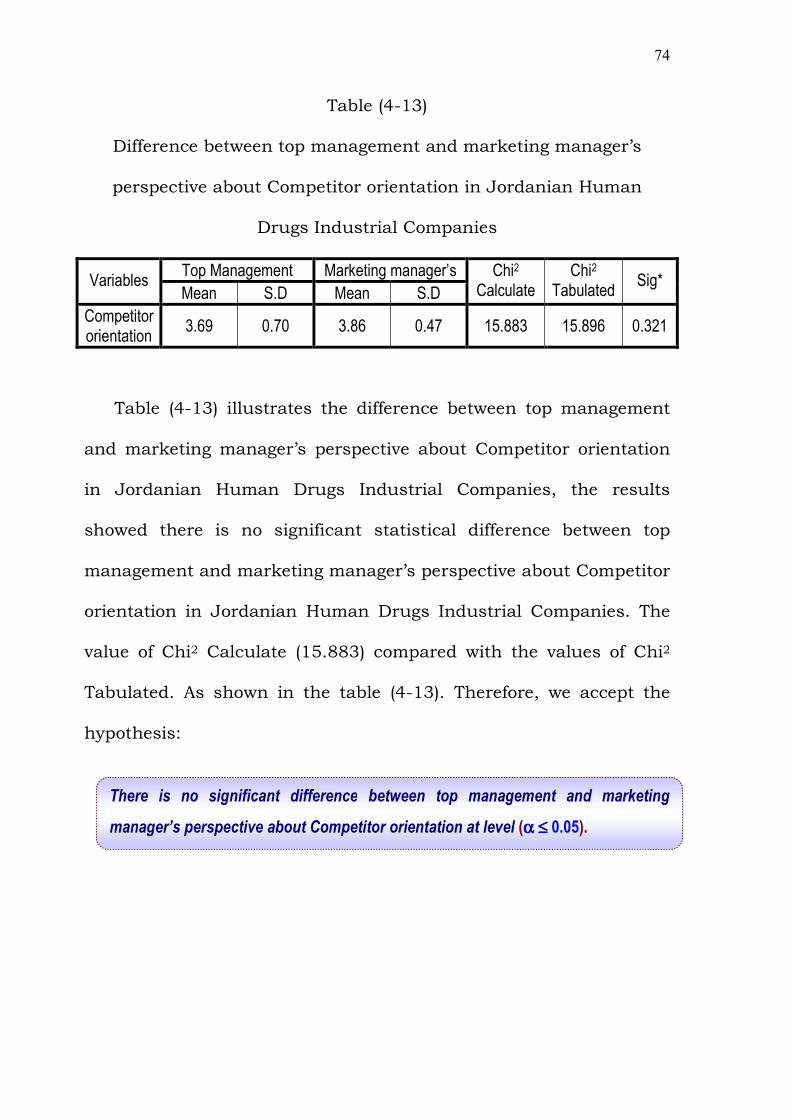
74
Table (4-13)
Difference between top management and marketing manager’s
perspective about Competitor orientation in Jordanian Human
Drugs Industrial Companies
Top Management Marketing manager’s Variables
Mean S.D Mean S.D
Chi2 Calculate
Chi2 Tabulated
Sig*
Competitor orientation
3.69 0.70 3.86 0.47 15.883 15.896 0.321
Table (4-13) illustrates the difference between top management
and marketing manager’s perspective about Competitor orientation
in Jordanian Human Drugs Industrial Companies, the results
showed there is no significant statistical difference between top
management and marketing manager’s perspective about Competitor
orientation in Jordanian Human Drugs Industrial Companies. The
value of Chi2 Calculate (15.883) compared with the values of Chi2
Tabulated. As shown in the table (4-13). Therefore, we accept the
hypothesis:
There is no significant difference between top management and marketing
manager’s perspective about Competitor orientation at level (αααα ≤≤≤≤ 0.05).
75
Chapter Five
Results, Conclusions and
Recommendations
(5-1): Results
(5-2): Conclusions
(5-3): Recommendations
76
(5-1): Results
1. The importance level of Low cost Strategy in Jordanian Human
Drugs Industrial Companies was high (4.04).
2. The importance level of Differentiation Strategy in Jordanian
Human Drugs Industrial Companies was high (4.31).
3. The importance level of Focus Strategy in Jordanian Human
Drugs Industrial Companies was high (4.47).
4. The importance level of Customer Orientation in Jordanian
Human Drugs Industrial Companies was high (3.73).
5. The importance level of Competitor Orientation in Jordanian
Human Drugs Industrial Companies was high (3.90).
6. There are significant relationship between Porter generic
Strategies (low cost Strategy; differentiation Strategy; focus Strategy)
and Strategic Orientation (Customer orientation; Competitor
orientation) at level (α ≤ 0.05).
7. There are significant differences between top management and
marketing manager’s perspective about Porter generic strategies (low
cost Strategy; differentiation Strategy; focus Strategy) at level (α ≤
0.05).
77
8. There are no significant difference between top management and
marketing manager’s perspective about low cost Strategy at level (α ≤
0.05).
9. There are no significant difference between top management and
marketing manager’s perspective about differentiation Strategy at
level (α ≤ 0.05).
10. There are no significant difference between top management and
marketing manager’s perspective about focus Strategy at level (α ≤
0.05).
11. There are significant difference between top management and
marketing manager’s perspective about Strategic Orientation
(Customer orientation; Competitor orientation) at level (α ≤ 0.05).
12. There are significant difference between top management and
marketing manager’s perspective about Customer orientation at level
(α ≤ 0.05).
13. There are no significant difference between top management and
marketing manager’s perspective about Competitor orientation at
level (α ≤ 0.05).
78
(5-2): Conclusions
1. Top management and marketing managers at the human
drugs companies acknowledge the important role of generic
strategies (low cost, differentiation and focus) in the field of
human drugs industry.
2. The findings of this study indicated that human drugs
companies promote strategic orientation (customers and
competitors orientation).
3. The leaders and managers recognized that employees play an
important role in contributing to quality outcomes.
4. The marketing managers were acknowledged as the group
that provided the care and understood the needs of their
customers.
79
(5-3): Recommendations
1. Human Drugs companies should concentrate on customer
satisfaction and quality Outcomes to attain competitive
advantage and achieve market share.
2. Leader and managers should enhance the relationship
between generic strategies and strategic orientation through
understanding of their customer wants and needs.
3. Top management and marketing managers work as a group
and placed more emphases on communication to achieve their
organizational goals.
4. For further research the researcher suggest to investigate
the same model in not-for- profit organizations.

80
References
81
1. Achrol, R.S. (1991), “Evolution of the marketing organization: new forms for turbulent
environments”, Journal of Marketing, Vol. 55, October: 77-93.
2. Allen, Richard S. & Helms, Marilyn M, (2006), “Linking strategic practices and
organizational performance to Porter’s generic strategies”, Business Process Management
Journal, Vol.12, No.4: 433 -454.
3. Anon (1998), “Strategy according to Michael Porter”, The Antidote from CSBS, Vol. 16:
24-25.
4. Baker, W.E. and Sinkula, J.M. (1999), “The synergistic effect of market orientation and
learning orientation on organizational performance”, Journal of the Academy of Marketing
Science, Vol. 27 No. 4: 411-27.
5. Bauer, C. & Colgan, J. (2001), “Planning for electronic commerce strategy: an
explanatory study from the financial services sector”, Logistics Information Management,
Vol. 14, No.1/2: 24-32.
6. Berthoff, A. (2002), “Differentiation II”, Computer Dealer News, Vol. 18 No. 2: 20.
7. Brandenburger, A.M, (2002), "Porter’s Added value: High Indeed”, Academy of
Management Executive, Vol. 16, No. 2: 58-60.
8. Bright, J. (2002), “The missing revenue link”, Communications International, March:
46-47.
9. Burchill, G. and Fine, C.H. (1997), “Time versus market orientation in product concept
development: empirically-based theory generation”, Management Science, Vol. 43, No. 4:
465-78.
10. Buzzell, R.D., Gale, B.T. and Sultan, R.M (1975), “Market share – a key to profitability”,
Harvard Business Review, Vol. 53, No. 1: 97-106.
11. Campbell-Hunt, C. (2000), “What have we learned about generic competitive strategy? A
meta-analysis”, Strategic Management Journal, Vol. 21, No. 2: 127-54.
12. Chakravarthy, S. (2000), “Business line: e-strategy: different strokes”, Businessline,
October 4.
13. Chrisman, J., Hofer, C. and Bolton, W. (1988), “Toward a system for classifying business
strategies”, Academy of Management Review, Vol. 13: 413-428.
82
14. Chung, Dong Seop; Jung, Hyun Woo; Baek, Soo Jung & Lee, Hee Ok, (2008), “The
Impact of Strategic Oriantation and HRM Systems on Firm Performance”, International
Journal of business Strategy, Vol.8, No.2: 82-88.
15. Cross, L. (1999), “Strategy drives marketing success”, Graphic Arts Monthly, Vol. 71
No. 2: 96.
16. Darrow, W.P., Algin, B. and King, D.H. (2001), “David vs Goliath in the hardware industry:
generic strategies and critical success factors as revealed by business practice”, The Mid-
Atlantic Journal of Business, Vol. 37 No. 2/3: 97-109.
17. David, F. (2000), “Strategic Management Concepts and Cases”, Prentice-Hall,
Englewood Cliffs, NJ.
18. Davidson, S. (2001), “Seizing the competitive advantage”, Community Banker, Vol. 10,
No. 8: 32-4.
19. Day, G. S., and Wensley, R. (1988), “Assessing advantage: A framework for diagnosing
competitive superiority”, Journal of Marketing, Vol.52, April: 1-20.
20. Day, G.S. (1994), “The capabilities of market-driven organizations”, Journal of
Marketing, Vol. 58, No. 4: 37-52.
21. Deshpande, R., Farley, J.U. and Webster, F.E. Jr (1993), “Corporate culture customer
orientation, and innovativeness in Japanese firms: a quadrad analysis”, Journal of
Marketing, Vol. 57, No. 1: 23-37.
22. Dickson, P.R. and Giglierano, J.J. (1986), “Missing the boat and sinking the boat: a
conceptual model of entrepreneurial risk”, Journal of Marketing, Vol. 50, July: 58-70.
23. Dickson, P.R. (1992), “Toward a general theory of competitive rationality”, Journal of
Marketing, Vol. 56, No. 1: 69-83.
24. Dong Seop Chung; Hyun Woo Jung; Soo Jung Baek & Hee Ok Lee, (2008), “The impacts
of strategic orientation and HRM systems on firm performance”, International Journal of
business Strategy, Vol.8, No.2: 82-88.
25. Fombrun, C.J. and Ginsberg, A. (1990), “Shifting gears: enabling change in corporate
aggressiveness”, Strategic Management Journal, Vol. 11, No. 4: 297-308.
83
26. Fuentes, M, Mar; Montes, Javier Llorens & Fernandez, Luis M., (2006), “Total Quality
Management, Strategic Orientation and Organizational Performance: the Case of Spanish
Companies”, Total Quality Management, Vol.17, No.3: 303-323.
27. Fuerer, R. and Chaharbaghi, K. (1997), “Strategy development: past, present, and
future”, Training for Quality, Vol. 5 No. 2: 58-70.
28. Ganesan, S. (1994), “Determinants of long term orientation in buyer-seller relationships”,
Journal of Marketing, Vol. 58, April: 1-19.
29. Gatignon, Hubert & Xuereb, Jean-Marc (1997), "Strategic Orientation of the Firm New
Product Performance," Journal of Marketing Research, Vol. 34, No. 1: 77-90.
30. Grant, J.H. and King, W.R. (1982), “The Logic of Strategic Planning”, Little, Brown and
Company, Boston, MA.
31. Guner, Berrin; Lee, Jooh & Habte-Giorgis, Berhe, (2007), “Strategie Orientation and
Export Performance: A Three-Country Study of Manufacturing Firms “, Journal of
Transnational Management, Vol. 12, No. , April: 61 – 77.
32. Hamel, G. and Prahalad, C.K. (1991), “Corporate imagination and expeditionary
marketing”, Harvard Business Review, Vol. 69, July-August: 81-92.
33. Harris, L.C., and Ogbonna, E, (2001), “Strategic human resource management, market
orientation, and organizational performance”, Journal of Business Research, Vol. 51, No.
2: 157-166.
34. Helms, M.M., Clay, D. and Peter, W. (1997), “Competitive strategies and business
performance: evidence from the adhesives and sealants industry”, Management Decision,
Vol. 35, No. 9: 689-703.
35. Hlavacka, S., Ljuba, B., Viera, R. and Robert, W. (2001), “Performance implications of
Porter’s generic strategies in Slovak hospitals”, Journal of Management in Medicine, Vol.
15 No. 1: 44-66.
36. Hurley, R.F. and Hult, G.T.M. (1998), “Innovation, market orientation, and
organizational learning: an integration and empirical examination”, Journal of Marketing,
Vol. 62, No. 3: 42-54.
37. Hyatt, L. (2001), “A simple guide to strategy”, Nursing Homes, Vol. 50, No. 1: 12-13.
84
38. Jaworski, B.J. and Kohli, A.K. (1993), “Market orientation: antecedents and
consequences”, Journal of Marketing, Vol. 57, July: 53-70.
39. Jaworski, B.J. and Kohli, A.K. (1996), “Market orientation: review, refinement and
roadmap”, Journal of Market Focused Management, Vol. 1 No. 2: 119-135.
40. Kaya, N. & Seyrek, I, (2005), “Performance impacts of strategic orientations: Evidence
from Turkish manufacturing firms”, The Journal of American Academy of Business,
March: 68-71.
41. Kippenberger, T. (1996), “A strong focus at Amoco UK”, The Antinode, Vol. 1, No. 1:
22-24.
42. Kohli, A.K. and Jaworski, B.J. (1990), “Market orientation: the construct, research
propositions, and managerial implications”, Journal of Marketing, Vol. 54, No. 2: 1-18.
43. Kotha, S & Vadlamani, B.L, (1995), “Assessing generic strategies: An empirical
investigation of two competing typologies in discrete manufacturing industries”, Strategic
Management Journal, Vol. 16, No. 1: 75-83.
44. Kumar K., Subramanian, R., and Strandholm, K. (2002). Market orientation and
performance: Does organizational strategy matter?”, Journal of Applied Business
Research, Vol. 18, No. 1: 37-50.
45. Kumar K., Subramanian R., and Yauger, C. (1998), “Examining the market orientation-
performance relationship: A Context-Specific Study”, Journal of Management, Vol. 98,
No.2: 201-233.
46. Lynn, G., Morone, J. and Paulson, A. (1996), “Marketing and discontinuous innovation:
the probe and learn process”, California Management Review, Vol. 38 No. 3: 8-37.
47. Malburg, C. (2000), “Competing on costs”, Industry Week, Vol. 249, No. 17: 31.
48. Manu, F.A. and Sriram, V. (1996), “Innovation, marketing strategy, environment and
performance”, Journal of Business Research, Vol. 35: 79-91.
49. March, J.G. and Shapira, Z. (1987), “Managerial perspective on risk and risk taking”,
Management Science, Vol. 33, No. 11: 1404-1418.
85
50. Martin, R. (1999), “The new ‘geographical turn’ in economics: some critical reflections”,
Cambridge Journal of Economics, Vol. 23, No. 1: 65-91.
51. McKee, D.O., Varadarajan, P.R. and Pride, W.M. (1989), “Strategic adaptability and
firm performance: a market contingent perspective”, Journal of Marketing, Vol. 53, July: 21-
35.
52. Median, A. and Chin, A.C. (1995), “Mortgage-pricing determinants: a comparative
investigation of national regional and local building societies”, International Journal of Bank
Marketing, Vol. 13, No. 3: 3-11.
53. Menguc, Bulent & Auh, Seigyoung, (2005), “A Test of Strategic Orientation Formation
vs. Strategic Orientation Implementation: The Influence of TMT Functional Diversity and
Inter-functional Coordination”, Journal of Marketing Theory and Practice, Vol. 13, No. 2: 4-
19.
54. Miles, R.E. and Snow, C.C. (1978), “Organizational Strategy and Process
Structure”, McGraw-Hill, New York, NY.
55. Miller, A. and Dess, G. (1993), “Assessing Porter’s (1980) model in terms of its
generalizability, accuracy, and simplicity”, Journal of Management Studies, Vol. 30: 553-
585.
56. Miller, D. and Friesen, P.H. (1984), “Organizations: A Quantum View”, Prentice Hall,
Englewood Cliffs, NJ.
57. Miller, D. (1987), “Strategy making and structure: analysis and implications for
performance”, Academy of Management Journal, Vol. 30, No. 1: 7-32.
58. Miller, D. (1989), “Matching strategies and strategy making: process, content and
performance”, Human Relations, Vol. 42, No. 3: 241-60.
59. Mintzberg, H. (1990), “Strategy formation: schools of thought”. In J.W. Fredrickson
(Ed.) Perspectives on Strategic Management, New York: Harper Business: 105-236.
60. Margan, Robert E & Strong, Carolyn A., (1998), “Market orientation and dimensions of
strategic orientation”, European Journal of Marketing, Vol. 32 No. 11/12: 1051-1073.
86
61. Murdoch, A. (1999), “Future indicative?”, Accountancy, Vol. 123, No. 1270: 48-49.
62. Narver, J.C. and Slater, S.F. (1990), “The effect of a market orientation on business
profitability”, Journal of Marketing, Vol. 54, No. 4: 20-35.
63. Niemira, M.P. (2000), “Can Japan compete?”, Barron’s, Vol. 80 No. 49: 57-58.
64. Olson, E.M., Slater, S.F. and Hult, G.T.M. (2005), “The performance implications of fit
among business strategy, marketing organization structure, and strategic behavior”, Journal
of Marketing, Vol. 69, No. 3: 49-65.
65. Parker, B. and Helms, M.M. (1992), “Generic strategies and firm performance in a
declining industry”, Management International Review, Vol. 32, No. 1: 23-29.
66. Pelham, A.M. (1999), “Influence of environment, strategy, and market orientation on
performance in small manufacturing firms”, Journal of Business Research, Vol.45, No.1:
33-46.
67. Piercy, N.F. and Morgan, N.A. (1994), “The marketing planning process: behavioural
problems compared to analytical techniques in explaining marketing plan credibility”, Journal
of Business Research, Vol. 29: 167-78.
68. Porter, M.E., (1980), “Competitive Strategy: Techniques for Analyzing Industries
and Competitors”, New York: Free Press.
69. Porter, M. E., (1985), “Competitive Advantage: Creating and Sustaining Superior
Performance”, New York: Free Press.
70. Porter, M. (1996), “What is strategy?”, Harvard Business Review,
November/December: 61-78.
71. Powers, Thomas, L & Hahn, William, (2004), “Critical competitive methods, generic
strategies, and firm performance”, The International Journal of Bank Marketing, VoL.22,
No.1: 43 – 64.
72. Rajecki, R. (2002), “What’s your brand”, Contracting Business, Vol. 59, No. 3: 40.
73. Reilly, T. (2002), “Be a champion of the solution”, Industrial Distribution, Vol. 91, No.
5: 62.
74. Roberts, E.B. (1990), “Evolving toward product and market orientation: the early years
of technology-based firms”, Journal of Product Innovation Management, Vol. 7: 274-287.
87
75. Rose, G. M., and Shoham, A, (2002), “Export performance and market orientation:
Establishing an empirical link”, Journal of Business Research, Vol. 55, No. 3: 217-225.
76. Sánchez, Antonio Aragón & Sánchez-Marín, Gregorio, (2006), “Strategic Orientation,
Management Characteristics, and Performance: A Study of Spanish SMEs”, Journal of
Small Business Management, Vol. 43, No. 3: 287-308.
77. Slater, S. F., & Narver, J. C, (2000), “The positive effect of a market orientation on
business profitability: A balanced replication, Journal of Business Research, Vol.48, No. 1:
69-73.
78. Slater, S.F. and Narver, J.C. (1993), “Product-market strategy and performance: an
analysis of the Miles and Snow strategy types”, European Journal of Marketing, Vol. 27
No. 10: 33-51.
79. Slater, S. F., & Narver, J. C, (1994), “Does competitive environment moderate the
market orientation-performance relationship?” Journal of Marketing, Vol.58, January: 46-55.
80. Slater, S.F. and Narver, J.C. (1995), “Market orientation and the learning organization”,
Journal of Marketing, July: 63-74.
81. Speed, R. (1993), “Maximizing the potential of strategic typologies for marketing
strategy research”, Journal of Strategic Marketing, Vol. 1: 171-188.
82. Stone, M. (1995), “Strategic development related to Europeanization of UK logistics
and distribution service suppliers”, European Business Review, Vol. 95, No. 5: 9-14.
83. Varadarajan, P.R. and Clark, T. (1994), “Delineating the scope of corporate, business
and marketing strategy”, Journal of Business Research, Vol. 31 No. 2-3: 93-105.
84. Walker, O.C. and Ruekert, R.W. (1987), “Marketing’s role in the implementation of
business strategies: a critical review and conceptual framework”, Journal of Marketing, Vol.
51, July: 15-33.
85. Wong, V. and Saunders, J. (1993), “Business orientations and corporate success”,
Journal of Strategic Marketing, Vol. 1: 20-40.
86. Wood V.R.; Bhuian S., & Kiecker P., (2000), “Market orientation and organizational
performance in not-for-profit hospitals”, Journal of Business Research, Vol.48, No. 3: 213-
226.

88
87. Yamin, Shahid ; Gunasekaran, A & Macondo, Felix, (1999), “ Relationship between
generic strategies, competitive advantage and Organizational performance: an empirical
analysis”, Technovation, Vol. 19: 507–518
88. Zeithaml, C.P. and Zeithaml, V.A. (1984), “Environmental management: revising the
marketing perspective”, Journal of Marketing, Vol. 48, Spring: 46-53.

89
Apendices
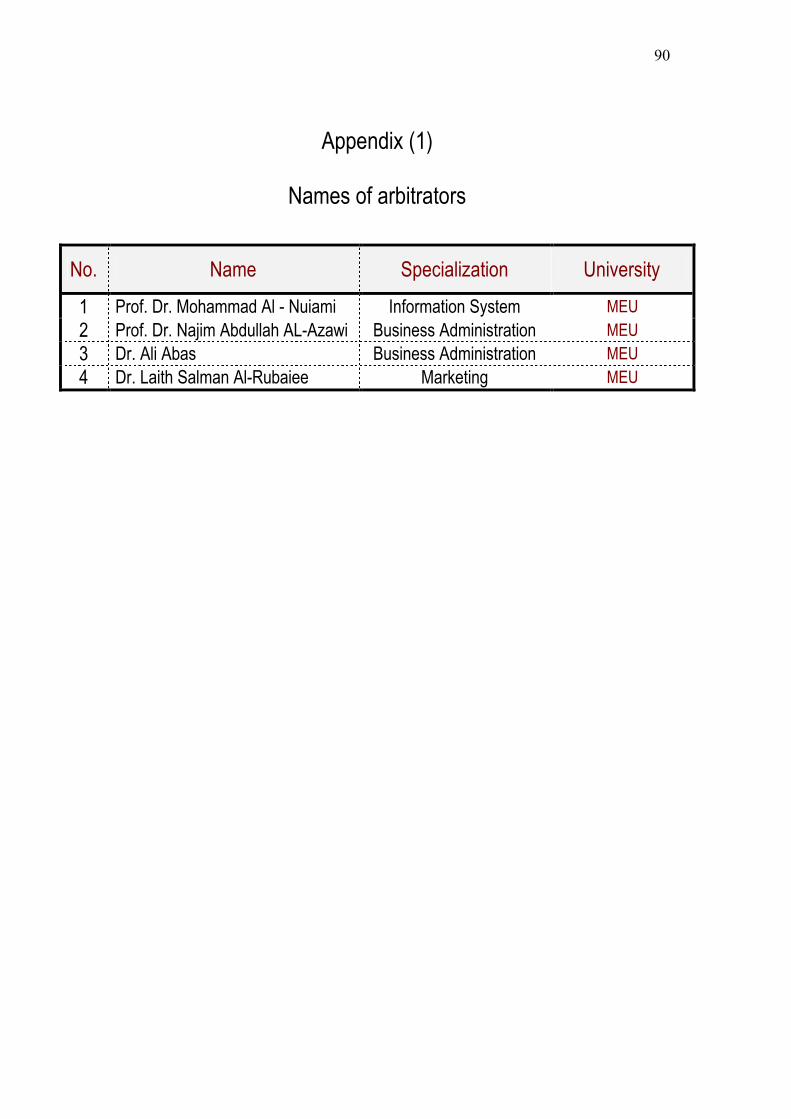
90
Appendix (1)
Names of arbitrators
University Specialization Name No.
MEU Information System Prof. Dr. Mohammad Al - Nuiami 1 MEU Business Administration Prof. Dr. Najim Abdullah AL-Azawi 2 MEU Business Administration Dr. Ali Abas 3 MEU Marketing Dr. Laith Salman Al-Rubaiee 4
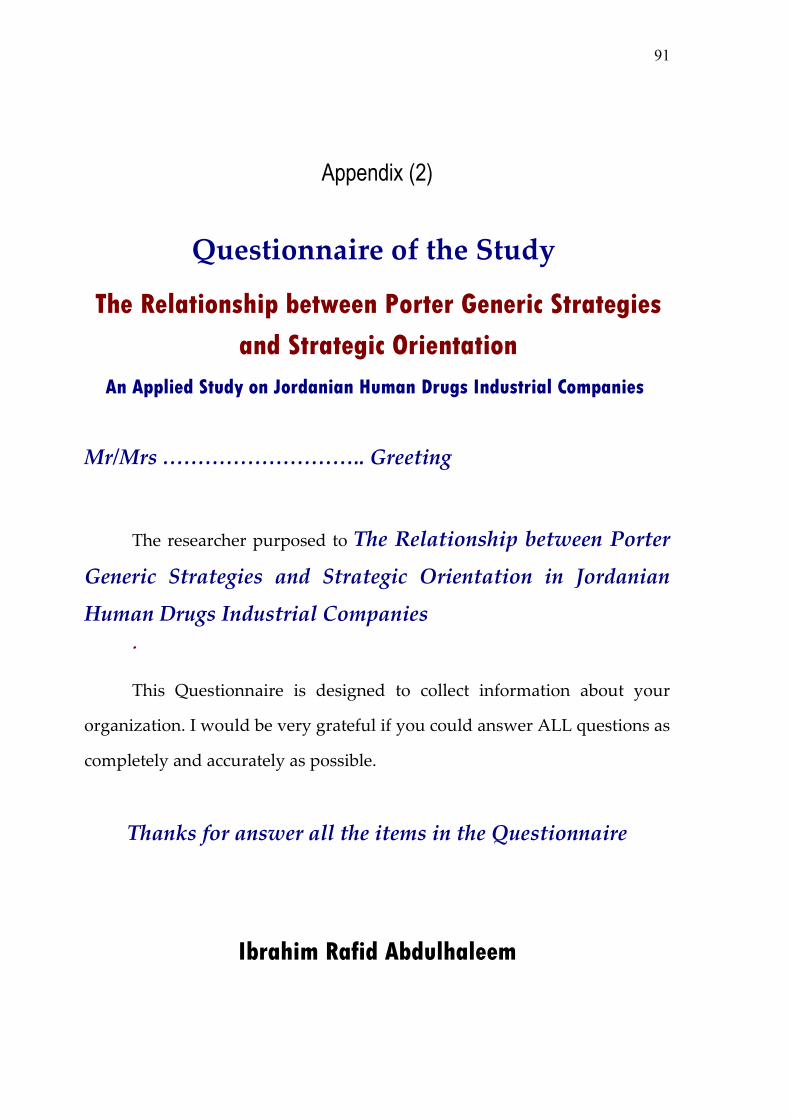
91
Appendix (2)
Questionnaire of the Study
The Relationship between Porter Generic Strategies
and Strategic Orientation
An Applied Study on Jordanian Human Drugs Industrial Companies
Mr/Mrs ……………………….. Greeting
The researcher purposed to The Relationship between Porter
Generic Strategies and Strategic Orientation in Jordanian
Human Drugs Industrial Companies .
This Questionnaire is designed to collect information about your
organization. I would be very grateful if you could answer ALL questions as
completely and accurately as possible.
Thanks for answer all the items in the Questionnaire
Ibrahim Rafid Abdulhaleem
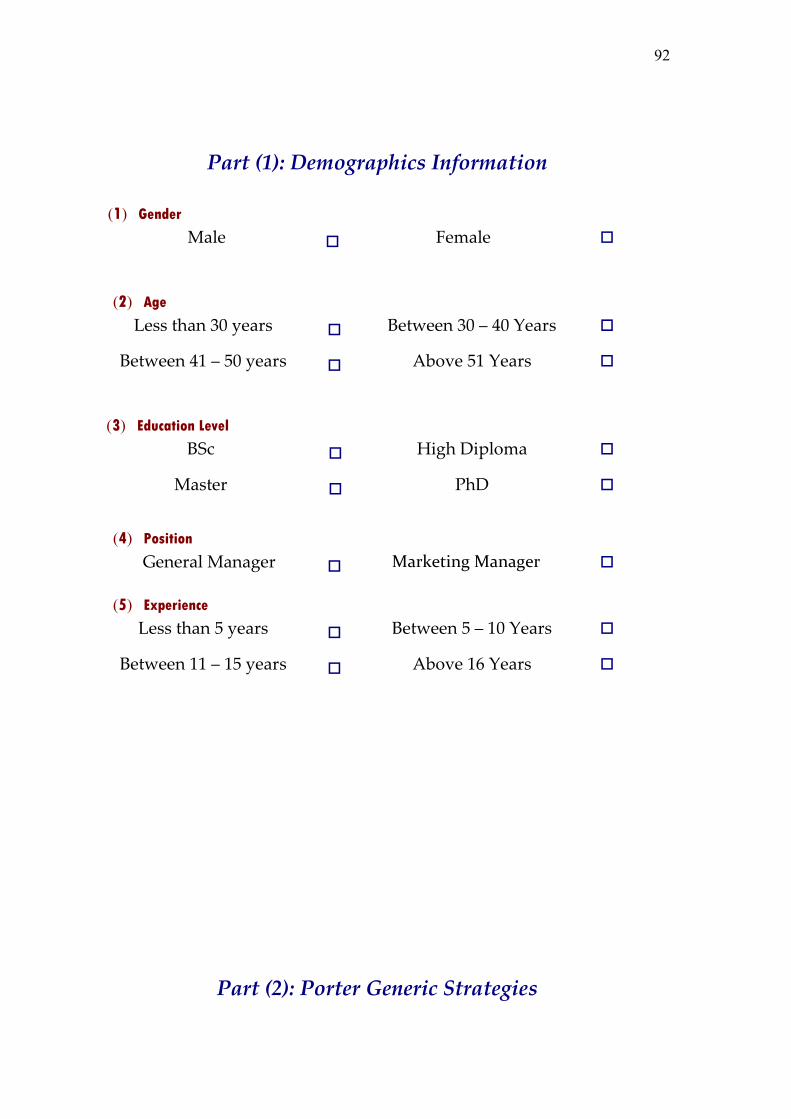
92
Part (1): Demographics Information
)1( Gender
� Female � Male
)2( Age � Between 30 – 40 Years � Less than 30 years
� Above 51 Years � Between 41 – 50 years
)3( Education Level � High Diploma � BSc
� PhD � Master
)4( Position � Marketing Manager � General Manager
)5( Experience � Between 5 – 10 Years � Less than 5 years
� Above 16 Years � Between 11 – 15 years
Part (2): Porter Generic Strategies
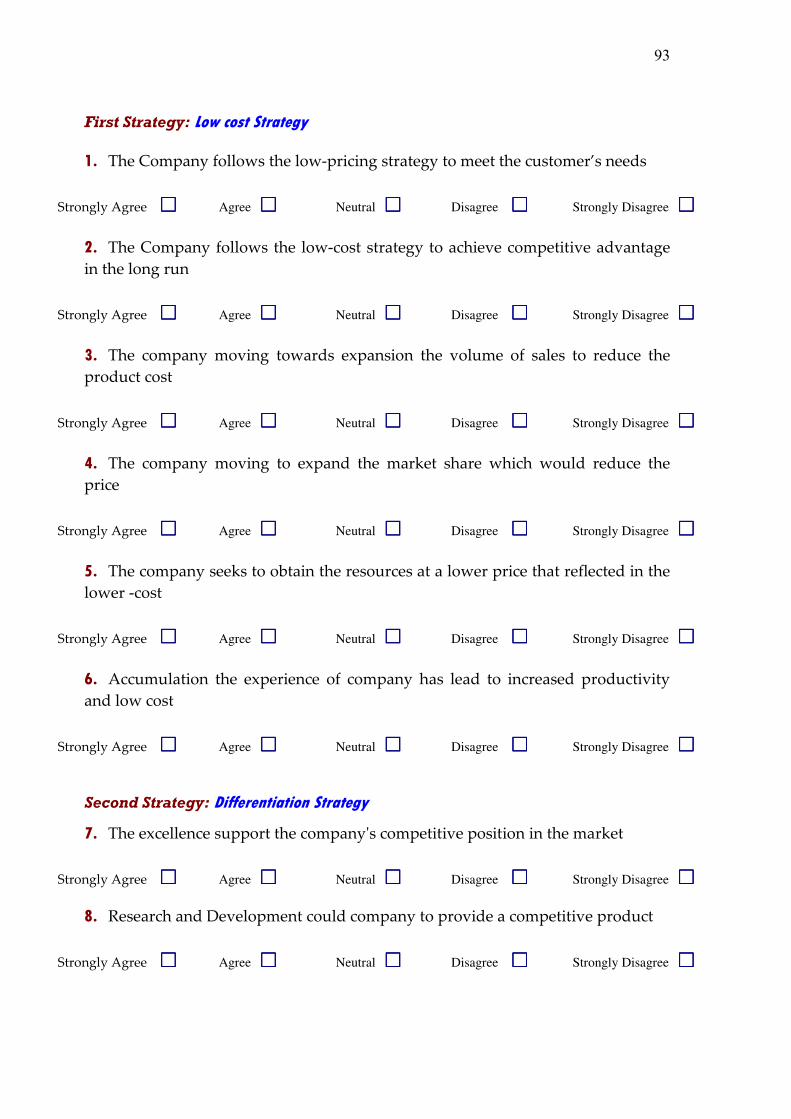
93
First Strategy: Low cost Strategy
1. The Company follows the low-pricing strategy to meet the customer’s needs
2. The Company follows the low-cost strategy to achieve competitive advantage
in the long run
3. The company moving towards expansion the volume of sales to reduce the
product cost
4. The company moving to expand the market share which would reduce the
price
5. The company seeks to obtain the resources at a lower price that reflected in the
lower -cost
6. Accumulation the experience of company has lead to increased productivity
and low cost
Second Strategy: Differentiation Strategy
7. The excellence support the company's competitive position in the market
8. Research and Development could company to provide a competitive product
���� Strongly Disagree ���� Disagree ���� Neutral ���� Agree ���� Strongly Agree
���� Strongly Disagree ���� Disagree ���� Neutral ���� Agree ���� Strongly Agree
���� Strongly Disagree ���� Disagree ���� Neutral ���� Agree ���� Strongly Agree
���� Strongly Disagree ���� Disagree ���� Neutral ���� Agree ���� Strongly Agree
���� Strongly Disagree ���� Disagree ���� Neutral ���� Agree ���� Strongly Agree
���� Strongly Disagree ���� Disagree ���� Neutral ���� Agree ���� Strongly Agree
���� Strongly Disagree ���� Disagree ���� Neutral ���� Agree ���� Strongly Agree
���� Strongly Disagree ���� Disagree ���� Neutral ���� Agree ���� Strongly Agree
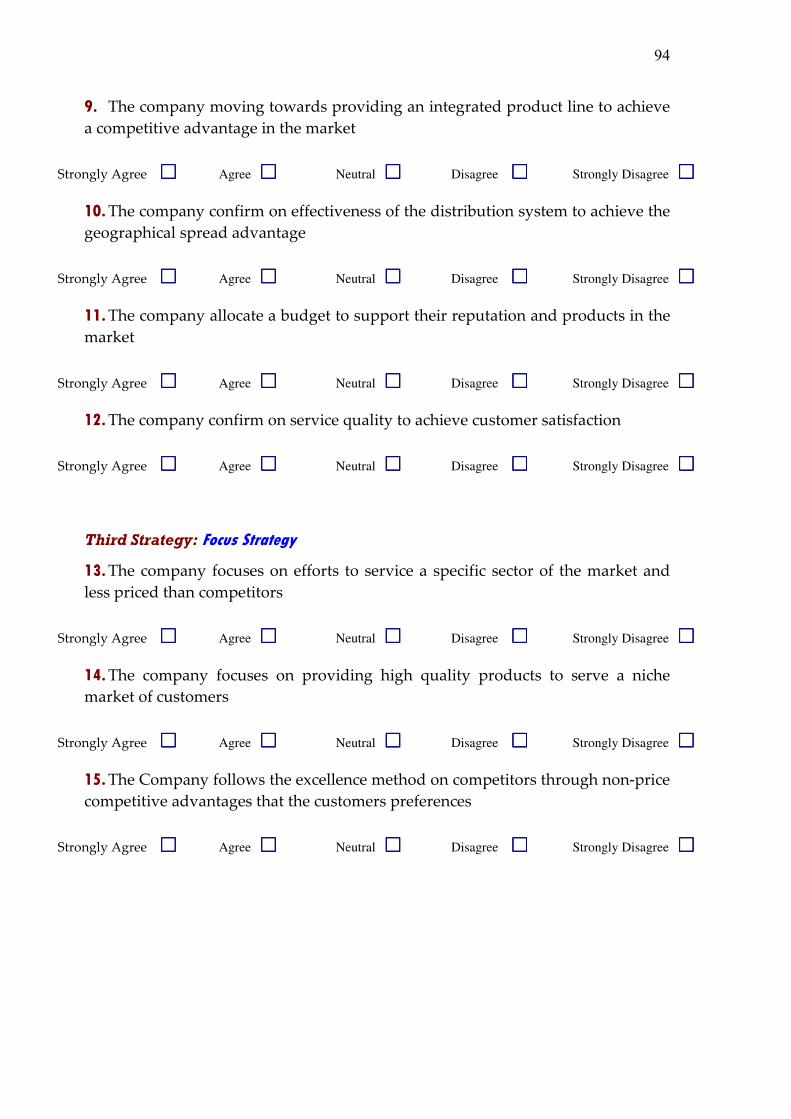
94
9. The company moving towards providing an integrated product line to achieve
a competitive advantage in the market
10. The company confirm on effectiveness of the distribution system to achieve the
geographical spread advantage
11. The company allocate a budget to support their reputation and products in the
market
12. The company confirm on service quality to achieve customer satisfaction
Third Strategy: Focus Strategy
13. The company focuses on efforts to service a specific sector of the market and
less priced than competitors
14. The company focuses on providing high quality products to serve a niche
market of customers
15. The Company follows the excellence method on competitors through non-price
competitive advantages that the customers preferences
���� Strongly Disagree ���� Disagree ���� Neutral ���� Agree ���� Strongly Agree
���� Strongly Disagree ���� Disagree ���� Neutral ���� Agree ���� Strongly Agree
���� Strongly Disagree ���� Disagree ���� Neutral ���� Agree ���� Strongly Agree
���� Strongly Disagree ���� Disagree ���� Neutral ���� Agree ���� Strongly Agree
���� Strongly Disagree ���� Disagree ���� Neutral ���� Agree ���� Strongly Agree
���� Strongly Disagree ���� Disagree ���� Neutral ���� Agree ���� Strongly Agree
���� Strongly Disagree ���� Disagree ���� Neutral ���� Agree ���� Strongly Agree
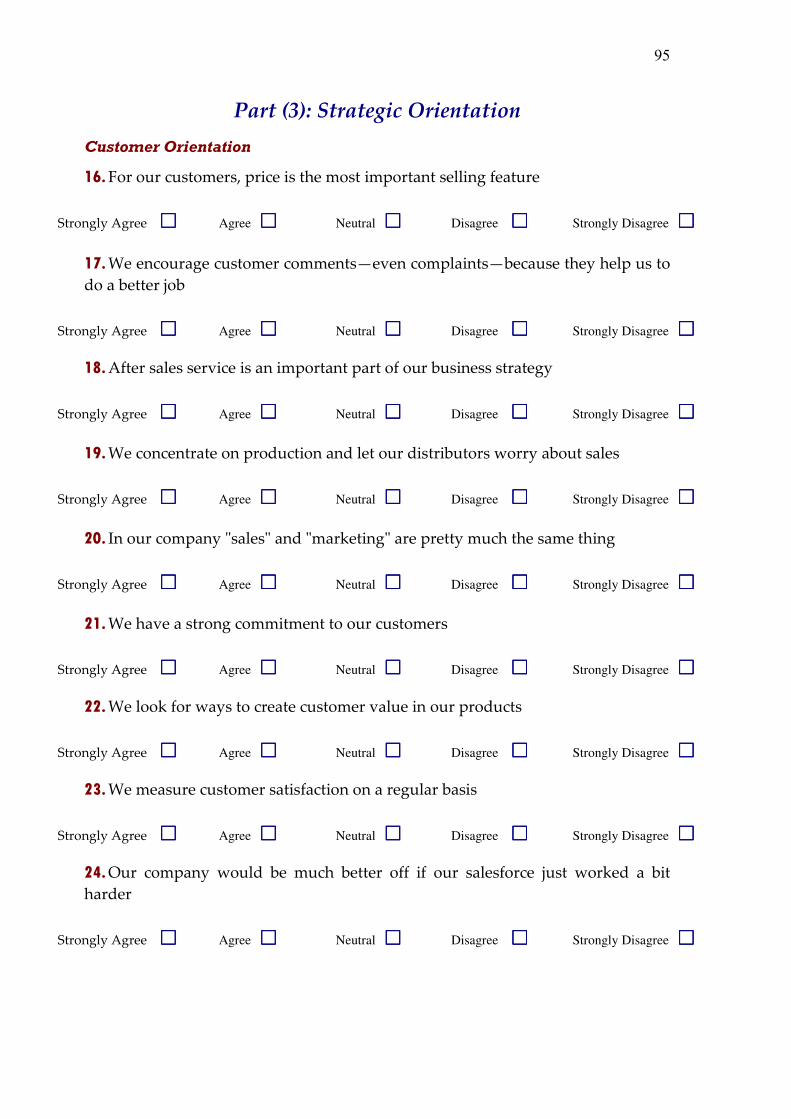
95
Part (3): Strategic Orientation
Customer Orientation
16. For our customers, price is the most important selling feature
17. We encourage customer comments—even complaints—because they help us to
do a better job
18. After sales service is an important part of our business strategy
19. We concentrate on production and let our distributors worry about sales
20. In our company "sales" and "marketing" are pretty much the same thing
21. We have a strong commitment to our customers
22. We look for ways to create customer value in our products
23. We measure customer satisfaction on a regular basis
24. Our company would be much better off if our salesforce just worked a bit
harder
���� Strongly Disagree ���� Disagree ���� Neutral ���� Agree ���� Strongly Agree
���� Strongly Disagree ���� Disagree ���� Neutral ���� Agree ���� Strongly Agree
���� Strongly Disagree ���� Disagree ���� Neutral ���� Agree ���� Strongly Agree
���� Strongly Disagree ���� Disagree ���� Neutral ���� Agree ���� Strongly Agree
���� Strongly Disagree ���� Disagree ���� Neutral ���� Agree ���� Strongly Agree
���� Strongly Disagree ���� Disagree ���� Neutral ���� Agree ���� Strongly Agree
���� Strongly Disagree ���� Disagree ���� Neutral ���� Agree ���� Strongly Agree
���� Strongly Disagree ���� Disagree ���� Neutral ���� Agree ���� Strongly Agree
���� Strongly Disagree ���� Disagree ���� Neutral ���� Agree ���� Strongly Agree
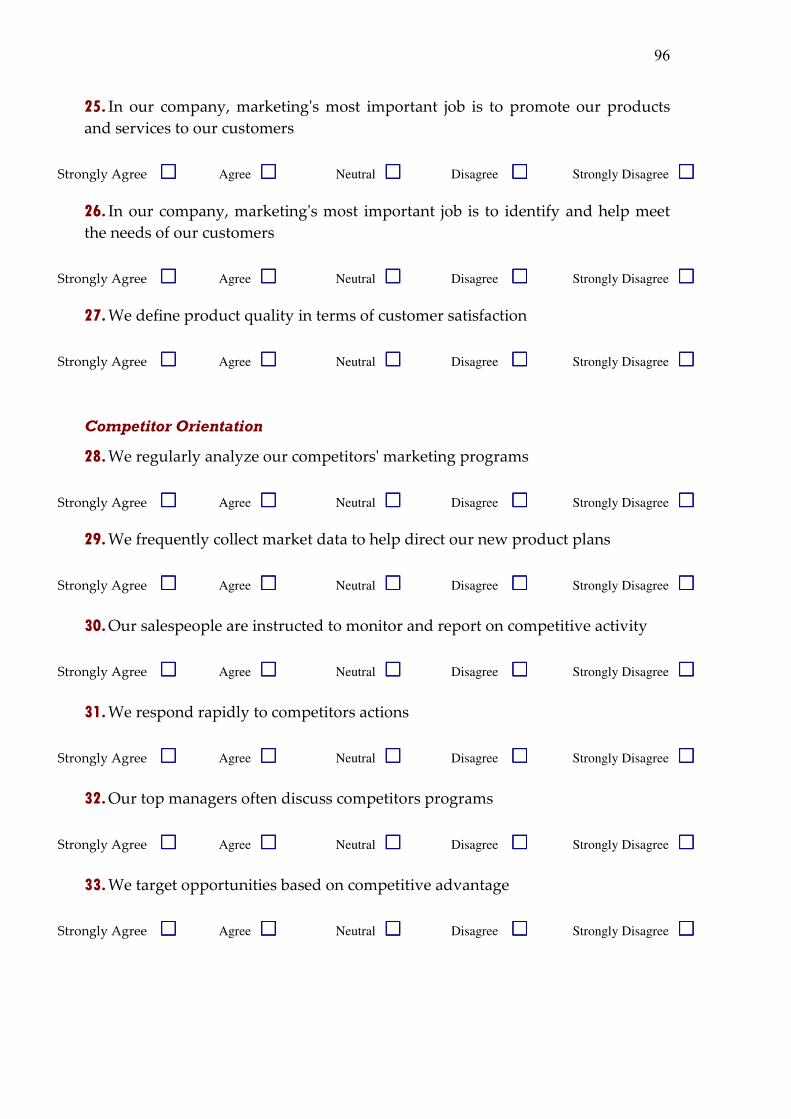
96
25. In our company, marketing's most important job is to promote our products
and services to our customers
26. In our company, marketing's most important job is to identify and help meet
the needs of our customers
27. We define product quality in terms of customer satisfaction
Competitor Orientation
28. We regularly analyze our competitors' marketing programs
29. We frequently collect market data to help direct our new product plans
30. Our salespeople are instructed to monitor and report on competitive activity
31. We respond rapidly to competitors actions
32. Our top managers often discuss competitors programs
33. We target opportunities based on competitive advantage
���� Strongly Disagree ���� Disagree ���� Neutral ���� Agree ���� Strongly Agree
���� Strongly Disagree ���� Disagree ���� Neutral ���� Agree ���� Strongly Agree
���� Strongly Disagree ���� Disagree ���� Neutral ���� Agree ���� Strongly Agree
���� Strongly Disagree ���� Disagree ���� Neutral ���� Agree ���� Strongly Agree
���� Strongly Disagree ���� Disagree ���� Neutral ���� Agree ���� Strongly Agree
���� Strongly Disagree ���� Disagree ���� Neutral ���� Agree ���� Strongly Agree
���� Strongly Disagree ���� Disagree ���� Neutral ���� Agree ���� Strongly Agree
���� Strongly Disagree ���� Disagree ���� Neutral ���� Agree ���� Strongly Agree
���� Strongly Disagree ���� Disagree ���� Neutral ���� Agree ���� Strongly Agree