the relationship between transparency and customer-based
TRANSCRIPT
The relationship between transparency and
customer-based brand equity in the FMCG industry
Michelle Wood
Student Number: 17325880
Mobile: 079 519 5253
A research project submitted to the Gordon Institute of Business Science, University of
Pretoria, in partial fulfilment of the requirements for the degree of Master of Business
Administration
7 November 2018
Abstract
This research sought to determine whether transparency is a significant driver, relative to
other drivers, of customer-based brand equity within the food and beverage sector of the
FMCG industry. More emphasis is placed on transparency and ethical challenges
encountered by organisations today, than in earlier years. Transparency is also seen as one
of the critical components in business and social structures. However, unethical behaviours
and lack of transparency indicate that organisations are unaware of the effect of their actions
on consumer behaviour and perceptions or they are attempting to engage consumers’
perceptions with signalling efforts which are not always as authentic, transparent and
credible.
The research adopted a deductive, qualitative approach among users of food and beverage
products in the FMCG industry, and the philosophy employed was positivism. Primary data
was collected through an online questionnaire and was distributed using convenience and
snowball sampling. 186 responses were valid and retained for the research. Correlation and
multiple regression analysis were applied to these responses to test the hypotheses.
The results indicated that brand trust, brand image, brand credibility and transparency had
significant positive relationships with CBBE. Despite the significant relationships between
the independent variables and CBBE, only brand credibility was identified as a significant
driver of CBBE in the proposed regression model, relative to the context of the food and
beverage sector in the FMCG industry.
This research found that transparency does not significantly impact CBBE; however, further
research would suggest using alternative drivers and industries. Additionally, the influence
of transparency on the drivers and dimensions of CBBE could further be explored.
Keywords
Customer-based brand equity; Transparency; Information quality; FMCG.

ii
Declaration
I declare that this research project is my own work. It is submitted in partial fulfilment of the
requirements for the degree of Master of Business Administration at the Gordon Institute of
Business Science, University of Pretoria. It has not been submitted before for any degree or
examination in any other University. I further declare that I have obtained the necessary
authorisation and consent to carry out this research.
_ _________________ __7 November 2018______________
Michelle Wood Date
iii
Table of Contents
Abstract ............................................................................................................................... i
Keywords ............................................................................................................................ i
Declaration ......................................................................................................................... ii
List of Tables .................................................................................................................... vii
List of Figures ................................................................................................................... viii
Terminology and abbreviations ......................................................................................... ix
CHAPTER 1: INTRODUCTION TO RESEARCH PROBLEM ............................................. 1
1.1 Introduction ............................................................................................................... 1
1.2 Background to the research problem ........................................................................ 2
1.3 Research objectives .................................................................................................. 4
1.4 Relevance of the research ........................................................................................ 4
1.4.1 Customer-based brand equity (CBBE) ............................................................... 5
1.4.2. Transparency and signalling .............................................................................. 6
1.4.3. FMCG industry .................................................................................................. 7
1.5 Chapter summary and layout of the study ................................................................. 9
CHAPTER 2: LITERATURE REVIEW .............................................................................. 10
2.1 Brand equity ........................................................................................................... 10
2.2 The perspectives of brand equity ............................................................................ 11
2.2.1 Financial perspective: firm-based brand equity ................................................. 12
2.2.2 Consumer perspective: customer-based brand equity ...................................... 12
2.3 Key conceptualisations of CBBE ............................................................................. 13
2.4 Signalling theory ..................................................................................................... 21
2.4.1 The signalling process ...................................................................................... 21
2.4.1.1 The sender ................................................................................................. 21
2.4.1.2 The receiver ............................................................................................... 22
2.4.1.3 The signal ................................................................................................... 23
iv
2.5 Transparency .......................................................................................................... 24
2.5.1 Defining transparency ....................................................................................... 24
2.5.2 Dimensional structure of transparency .............................................................. 26
2.5.3 Measurements and determinants of transparency ............................................. 29
2.5.3 Advantages and disadvantages of transparency ............................................... 30
2.6 Conclusion .............................................................................................................. 32
CHAPTER 3: RESEARCH QUESTION AND HYPOTHESES .......................................... 34
CHAPTER 4: RESEARCH METHODOLOGY ................................................................... 35
4.1 Choice of methodology ........................................................................................... 35
4.2 Population ............................................................................................................... 35
4.3 Scope and unit of analysis ...................................................................................... 36
4.4 Sample size and method ........................................................................................ 36
4.4.1 Sample size ...................................................................................................... 36
4.4.2 Sample method ................................................................................................ 37
4.5 Measurement Instrument ........................................................................................ 37
4.5.1 Design and pre-test of the questionnaire .......................................................... 38
4.5.2 Construct and scales ........................................................................................ 38
4.6 Data collection ........................................................................................................ 40
4.7 Data Analysis .......................................................................................................... 40
4.7.1 Descriptive statistics ......................................................................................... 40
4.7.2 Exploratory factor analysis................................................................................ 41
4.7.3 Validity ............................................................................................................. 41
4.7.4 Reliability .......................................................................................................... 41
4.7.5 Correlation analysis .......................................................................................... 42
4.7.6 Multiple regression analysis.............................................................................. 42
4.8 Limitations .............................................................................................................. 43
CHAPTER 5: RESULTS ................................................................................................... 45
v
5.1 Introduction ............................................................................................................. 45
5.2 Descriptive statistics ............................................................................................... 45
5.2.1 Sample socio-demographic characteristics ....................................................... 45
5.2.2 Construct variables ........................................................................................... 48
5.3 Exploratory factor analysis ...................................................................................... 49
5.3.1 Customer-based brand equity .......................................................................... 49
5.3.2 Drivers of CBBE ............................................................................................... 51
5.3.3 Transparency ................................................................................................... 54
5.4 Validity and reliability .............................................................................................. 55
5.5 Correlation analysis ................................................................................................ 58
5.6 Multiple regression analysis .................................................................................... 60
5.7 Conclusion .............................................................................................................. 61
CHAPTER 6: DISCUSSION OF RESULTS ...................................................................... 63
6.1 Introduction ............................................................................................................. 63
6.2 Hypothesis 1 ........................................................................................................... 63
6.3 Hypothesis 2 ........................................................................................................... 66
6.4 Hypothesis 3 ........................................................................................................... 68
6.5 Hypothesis 4 ........................................................................................................... 70
6.6 Conclusion .............................................................................................................. 73
CHAPTER 7: CONCLUSION ........................................................................................... 75
7.1 Introduction ............................................................................................................. 75
7.2 Principle findings ..................................................................................................... 75
7.3 Theoretical implications .......................................................................................... 75
7.4 Implications for management .................................................................................. 76
7.5 Limitations of research ............................................................................................ 78
7.6 Recommendations for future research .................................................................... 79
7.7 Conclusion .............................................................................................................. 80
vi
8. REFERENCES ............................................................................................................. 82
9. APPENDICES .............................................................................................................. 95
Appendix A: Survey Questionnaire ............................................................................... 95
Appendix B: GIBS ethical clearance approval ............................................................. 100
Appendix C: Histogram ............................................................................................... 101
Appendix D: Regression scatter plots ......................................................................... 102
Appendix E: Descriptive statistics of section C to section K ........................................ 104
Appendix F: Scree plots – CBBE, drivers of CBBE and transparency ......................... 105
Appendix G: Rotated factor matrix .............................................................................. 107
vii
List of Tables
Table 1: Share of each sector in total household consumption, by consumption segment .. 8
Table 2: Definitions of brand equity in the literature .......................................................... 10
Table 3: Construct classifications of CBBE according to dimensions and antecedents ..... 15
Table 4: A description of the various definitions of transparency ...................................... 25
Table 5: Overlap of transparency dimensions ................................................................... 27
Table 6: Measurement factors that affect communication transparency ........................... 30
Table 7: Sample distribution by gender ............................................................................ 46
Table 8: Sample distribution by age ................................................................................. 46
Table 9: Sample distribution by population group ............................................................. 47
Table 10: Sample distribution by monthly income ............................................................. 47
Table 11: Sample distribution by education ...................................................................... 48
Table 12: Descriptive statistics of the variables ................................................................ 48
Table 13: Correlation matrix of CBBE ............................................................................... 49
Table 14: Initial KMO and Bartlett’s test results for CBBE................................................. 50
Table 15: Anti-image matrices: CBBE .............................................................................. 50
Table 16: Total variance explained: CBBE ....................................................................... 51
Table 17: Correlation matrix of drivers of CBBE ............................................................... 51
Table 18: Initial KMO and Bartlett’s test results for drivers of CBBE ................................. 52
Table 19: Anti-image matrices: drivers CBBE ................................................................... 52
Table 20: Communalities: drivers of CBBE ....................................................................... 53
Table 21: Total variance explained: CBBE ....................................................................... 53
Table 22: Correlation matrix of transparency .................................................................... 54
Table 23: Initial KMO and Bartlett’s test results for transparency ...................................... 54
Table 24: Anti-image matrices: transparency.................................................................... 55
Table 25: Total variance explained: transparency ............................................................ 55
Table 26: Factor loading matrix ........................................................................................ 56
Table 27: Cronbach’s Alpha test results ........................................................................... 57
Table 28: Pearson correlation matrix ................................................................................ 58
Table 29: Collinearity statistics ......................................................................................... 59
Table 30: Model summary with CBBE as the dependent variable ..................................... 60
Table 31: ANOVA multiple regression .............................................................................. 60
Table 32: Coefficients multiple regression ........................................................................ 61
Table 33: Status of hypothesis ......................................................................................... 62
viii
List of Figures
Figure 1: Household FMCG spend ..................................................................................... 8
Figure 2: Perspectives of brand equity ............................................................................. 11
Figure 3: Conceptualisation based on Aaker’s brand equity model ................................... 13
Figure 4: Conceptualisation based on Keller’s CBBE model ............................................. 14
ix
Terminology and abbreviations
Customer-based brand equity – CBBE
Fast-moving consumer goods – FMCG
Variance inflation factor – VIF
Exploratory factor analysis – EFA
Principle axis factoring – PAF
Measuring sample adequacy – MSA
Keiser-Meyer-Olkin – KMO
Analysis of variance – ANOVA
1
CHAPTER 1: INTRODUCTION TO RESEARCH PROBLEM
1.1 Introduction
This section offers a framework relating to the context of the title and explains the aim of the
research. Chapter one will also identify the need for the research, together with the research
objectives. Contributions, relating to this research will also be mentioned.
This research attempted to determine whether transparency is a significant driver of
customer-based brand equity (CBBE) within the food and beverage sector of the fast-moving
consumer goods (FMCG) industry, through the lens of signalling theory. Signalling theory is
based on the expectation that the varying degrees of information available to consumers
lead to the dilemma of asymmetrical information (Taj, 2016). Signalling theory also imparts
a theoretical underpinning to understand the techniques through which consumer purchase
intentions and decision-making are influenced (Hyun Baek & Whitehill King, 2011).
Consumers are inclined to be uncertain or hesitant during the decision-making process if
they are unsure of the product characteristics due to asymmetrical information (Erdem,
Swait & Valenzuela, 2006; Hyun Baek & Whitehill King, 2011). In an attempt to reduce
information asymmetry, organisations use signals (Dögl & Holtbrügge, 2014) which include
marketing mix activities, information disclosure and communication (Pecot, Merchant,
Valette-Florence & De Barnier, 2018). In another context, organisational behaviour which
demonstrates their intentions, motives or goals also function as signals (Hetze, 2016).
Research by Bordalo, Gennaioli & Shleifer (2013) proposed that salient product
characteristics are the main focal point of consumers during the decision-making process,
as opposed to utilising all the available and relevant information (Oehler & Wendt, 2017).
This suggestion can, however, create motivation for organisations to give preference to
information that highlights specific product characteristic and to be less transparent
regarding other characteristics.
The conventional concept of information suggested that increasing the quantity or volume
of information will aid the consumer-decision making process (Granados, Gupta &
Kauffman, 2010). However, Oehler and Wendt (2017) contradicted this suggestion and
made various recommendations and assumptions regarding the criteria needed for quality
information to satisfy consumers’ needs. The findings were based on research in
2
behavioural economics, which stipulated required circumstances for quality information to
include: transparency, clarity and comparability (Connelly, Certo, Ireland & Reutzel, 2011;
Oehler & Wendt, 2017). It is argued that the current quality of information which consumers
have access to, does not satisfy these needs, which in turn affects the perception of the
organisation (Chaudhuri & Holbrook, 2001; Guckian, Chapman, Lickel, & Markowitz, 2018).
Information and communication portray fundamental roles in steering sales and building
brand equity (Keller, 2009) and according to Parris, Dapko, Arnold and Arnold (2016),
advances in technology created the expectation from stakeholders that transparency should
be an organisational norm.
1.2 Background to the research problem
More emphasis is placed on transparency and ethical challenges encountered by
organisations today, than in earlier years (Iglesias, Markovic, Singh & Sierra, 2017; James
& Montgomery, 2017). Transparency can be seen as one of the key components in business
and social structures. The concept, however, threatens to become obligatory in business
practices. Organisations such as Volkswagen (Guckian et al., 2018), British Petroleum
(Nyilasy, Gangadharbatla & Paladino, 2014), Ikea (Diallo & Lambey-Checchin, 2017), Dow
Corning (Ingram, Skinner & Taylor, 2005), Nestle (Brunk, 2010), various textile
manufacturers (James & Montgomery, 2017; Kang & Hustvedt, 2014) and more recently in
South Africa, Enterprise Food (a subsidiary of Tiger Brands), have been condemned by
media and consumers for their dishonourable business practices and lack of transparency.
Transparency developed into a meaningful communication topic in business (Men & Hung-
Baesecke, 2015) and advances in technology and communication methods have
proliferated consumer expectations and areas in which organisations can share knowledge
and information, thus supporting the concept of transparency (Men & Tsai, 2014; Men &
Hung-Baesecke, 2015; Parris et al., 2016). Since matters relating to ethical business
practices and transparency are becoming more global in today’s society, organisations are
more aware of their moral perception and image (James & Montgomery, 2017). This
awareness, however, does not always support their marketing campaigns, communication
methods, availability of information and behaviours.
Competing organisations are compelled to recognise the power and ferocity of consumer
beliefs (Brunk & Blumelhuber, 2011; Iglesias et al., 2017). According to Brunk (2010),
3
business practices fundamentally impact the consumer, because perceptions of
organisational behaviour and willingness to provide quality information influence consumers’
regard to the organisation. Consumer attitudes towards and the relationship with the brand
will ultimately determine the purchase behaviour of the consumer (Brunk & Blumelhuber,
2010). Unethical behaviours and lack of transparency (i.e. unsatisfactory disclosure, clarity
and accountability) by various organisations indicate that organisations are either unaware
of the effect of their actions on consumer behaviour, perceptions and needs (Men & Hung-
Baesecke, 2015), or they are attempting to engage consumers’ perceptions with signalling
efforts which are not always as authentic, transparent and credible (Warren, Burns &
Tackett, 2012; Oehler & Wendt, 2017).
Transparency concerning information and brands can be of importance in two ways (Merlo,
Eisingerich, Auh & Levstek, 2018). Firstly, consumers always encounter various levels of
uncertainty during the decision-making process and evaluation of quality (Chaudhuri &
Holbrook, 2001; Hyun Baek & Whitehill King, 2011). Transparency, through its dimensions
of disclosure, clarity and accuracy, can aid consumers by increasing their knowledge and
decreasing uncertainty (Erdem & Swait, 1998; Parris et al., 2016; Pecot et al., 2018).
Secondly, transparency can be of importance to organisations in the creation of a favourable
behaviour or response from consumers (Iglesias et al., 2017). Lin, Lobo and Leckie (2017)
stated that communication enables organisations to convey information related to their
values and brands to consumers. Moreover, an organisation’s dedication and information
provision about ecological, societal and ethical issues are identified as determining
constituents in governing consumers’ favourable valuation of an organisation and their brand
(Nyilasy et al., 2013; Lin et al., 2017).
Transparency can also be a signal to consumers to show that the organisation has nothing
to conceal (Erdem & Swait, 1998; Pecot et al., 2018). These attempts may be compensated
with increased consumer trust (Chaudhuri & Holbrook, 2001; Guckian et al., 2018), a
favourable image (Burmann, Jost-Benz & Riley, 2009; Iglesias et al., 2017), repurchase
intention and paying a premium price (Merlo et al., 2018). It can, therefore, be argued that
consumers appreciate the opportunity transparency allows them to make faster and more
informed decisions, also reducing the level of uncertainty concerning the reliability of the
organisation (Erdem & Swait, 1998; Hyun Baek & Whitehill King, 2011).
4
1.3 Research objectives
The primary objective of this research was to determine whether transparency is a significant
driver of CBBE within the food and beverage sector of the fast-moving consumer goods
industry. This was achieved by examining the strength of the relationships various drivers
identified in the literature had with CBBE. Subsequently, the strength of the relationship
between transparency and CBBE was examined and measured in relation to the other
drivers. The overarching question this research sought to answer is: Is transparency a
significant driver, relative to other drivers, of CBBE?
1.4 Relevance of the research
The concept of brand equity has been studied from various perspectives and the importance
thereof in diverse fields has been suggested by numerous authors (Keller, 1993; De
Chernatony, Harris & Christodoulides, 2004; Shankar, Azar & Fuller, 2008; Kim & Hyun,
2011; Baalbaki & Guzmán, 2016; Farjam & Hongyi, 2015; Iglesias et al., 2017; Datta,
Ailawadi & van Heerde, 2017). Following the conceptual work of Keller (1993) and Aaker
(1996) on CBBE, substantial advancements have been made with reference to how
consumers define and analyse brands, as well as consumer perceptions relating to the same
brands (De Chernatony et al., 2004; Erdem & Swait, 1998; Christodoulides, Cadogan &
Veloutsou, 2015; Çifci, Ekinci, Whyatt, Japurta, Molinillo & Siala, 2016; Baalbaki & Guzman,
2016). The outcome of this research will offer an understanding of how consumers cogitate,
discern and react in response to transparent organisations and brands in the FMCG
industry.
According to Dubbink, Graafland and van Liedekerke (2008) transparent organisations offer
information in a manner which enables consumers to gain insight and understanding relating
to matters and circumstances that concern them. However, current levels of knowledge and
understanding surrounding transparency are still inadequate (Schnackenberg & Tomlinson,
2016; Parris et al., 2016), thereby leading to the failure of organisations to fully understand
the impact of transparency on them and their stakeholders. It can be argued that
organisations view the consumer only as an end-user, rather than as a participant in the
financial success of a brand and the creation of a sustainable organisation (Guckian et al.,
2018). Consumers can react to the exposed unethical behaviour by changing their purchase
behaviour, leading to declining sales earnings, and detrimental results for an organisational
brand image and reputation (Grappi, Romani & Bagozzi, 2013), collectively a decrease in
5
brand equity. The research aims to identify transparency as a significant driver of CBBE.
Transparency has not been favoured in CBBE literature as a construct of choice when
studying relationships or impact various drivers have on CBBE. Therefore, this research
study aims to address that gap.
The first contribution to literature will be the establishment of a regression model that
correlates well-established drivers (brand trust, brand image and brand credibility) and
transparency as a possible driver of CBBE in the FMCG environment. It supports the idea
stated by Shankar et al. (2008), that brand equity is a key construct to research because it
is beneficial to both consumers and organisations. Baalbaki and Guzmán (2016), believed
that the drivers of brand equity are characteristics that are important to consumers when
they assess information to lower risks related to decision-making. It is, therefore, relevant to
understand the individual decision-making process that involves the interpretation and
processing of information and knowledge, relevant to brands (Kim & Hyun, 2011).
Yoo, Donthu and Lee (2000) also articulated that the ability to understand the drivers of
brand equity and leveraging it in business can increase the competitive advantage of the
organisation and increase brand prosperity. This statement justifies research to aid the
identification of additional drivers of CBBE.
The literature available relating to transparency is general with many differences and
inconsistencies. The contribution to literature will, therefore, impart a reasonable and
functional definition of transparency, and recognise the importance of the various
dimensions of transparency during the signalling process. Also, the research simplifies the
dimensions of transparency, which provide a clear guideline to managers on what literature
suggests transparency should involve. Marketing and brand managers ought to ensure that
all their marketing mix initiatives, communication and information demonstrate these
dimensions to establish favourable consumer behaviours and perceptions. This research
will aid managers in understanding how transparency, through information signals, give rise
to brand knowledge and ultimately drives CBBE.
1.4.1 Customer-based brand equity (CBBE)
As stated by Shankar et al. (2008), brand equity is a critical element to research because it
is advantageous to both consumers and organisations. However, for an organisation to
6
make inferences about their brand equity and make suggestions to management on how to
direct efforts towards increasing it, it is fundamental that organisations understand particular
perspectives of brand equity, coupled with different cultural aspects, product categories and
consumer perceptions (Christodoulides et al., 2015). Hetze (2016) reinforces the need for
organisations to understand the various perceptions and drivers, due to distinct individual
values and norms that determine consumer behaviour. Stakeholders can have inconsistent,
divergent and contradictive expectations and perceptions of organisations due to their
varying interests (Hetze, 2016).
Strong brand equity, from the point of view of a consumer (i.e. CBBE), indicates reliability
and trustworthiness, which in turn improves brand perceptions and can result in favourable
perceptions about organisational and brand statements as well as behaviours (Shankar et
al., 2008). During current global uncertainties, the sustainability of organisations and brands
should be the main concern for managers.
1.4.2. Transparency and signalling
Parris et al. (2016) argued that transparency might be the solution and approach
organisations should take in order to curtail asymmetrical information that exists in the
market. Sustainable organisations are built on consumer-brand relationships and are
strengthened by communication and trustworthiness (Iglesias et al., 2017). Consumer
behaviour and perceptions play a vital role in an organisations ability to identify consumer
needs, attract new consumers and retain existing ones, and is therefore directly related to
the sustainability of the organisation (Morhart, Malär, Guèvremont & Grohmann, 2015).
Transparency is a signal to consumers to show that the organisation has nothing to conceal
(Erdem & Swait, 1998; Pecot et al., 2018). These attempts may be compensated with
increased consumer trust (Chaudhuri & Holbrook, 2001; Guckian et al., 2018), a favourable
image (Burmann et al., 2009; Iglesias et al., 2017) repurchase intention and paying a
premium price (Merlo et al., 2018). It can, therefore, be argued that consumers appreciate
the opportunity transparency allows them to make faster and more informed decisions, also
reducing the level of uncertainty concerning the reliability of the organisation (Erdem &
Swait, 1998; Hyun Baek & Whitehill King, 2011).
7
1.4.3. FMCG industry
FMCG products are relatively low cost, regularly purchased goods with low-involvement
(Menidjel, Benhabib & Bilgihan, 2017; Nierobisch, Toporowski, Dannewald & Jahn, 2017).
The level of involvement can further be considered as to how serious a consumer is in
purchasing a product and the amount of information they require during their decision-
making process (Tanner & Raymond, 2015). The level of involvement is considered a
continuum, ranging from decisions which are somewhat routine (low-involvement of
consumers), for example FMCG products, compared to decisions which demand ample
consideration (high-involvement of consumers), such as durable or luxury goods (Tanner &
Raymond, 2015; Nierobisch et al., 2017). The FMCG industry represents products that are
typified as low-involvement goods, due to the negligible amount of effort a consumer has to
exert when choosing an item due to routine behaviour (Nierobisch et al., 2017).
Additionally, McWilliam (1997) argued that the majority of consumers consider FMCG
products as unimportant, along with the low-involvement required during the decision-
making process, as well as in terms of personal importance to consumers. Products
consumed within the FMCG industry are predominantly personal, and Nierobisch et al.
(2017) inferred that consumers tend to not make a statement about themselves through low-
involvement brands.
Furthermore, the FMCG industry trades in goods which are categorised as necessities, and
it is inferred that the income of an individual is not important to organisations operating in
this industry. Despite that, the total household spending on FMCG product categories
contributes significantly towards consumption, because a large part of the population has
the means to buy the necessities on a recurrent basis. Additionally, as indicated by the World
Bank (2010), food and beverage spend is recognised as one of the biggest segments of
consumer expenditures (see Table 1).
8
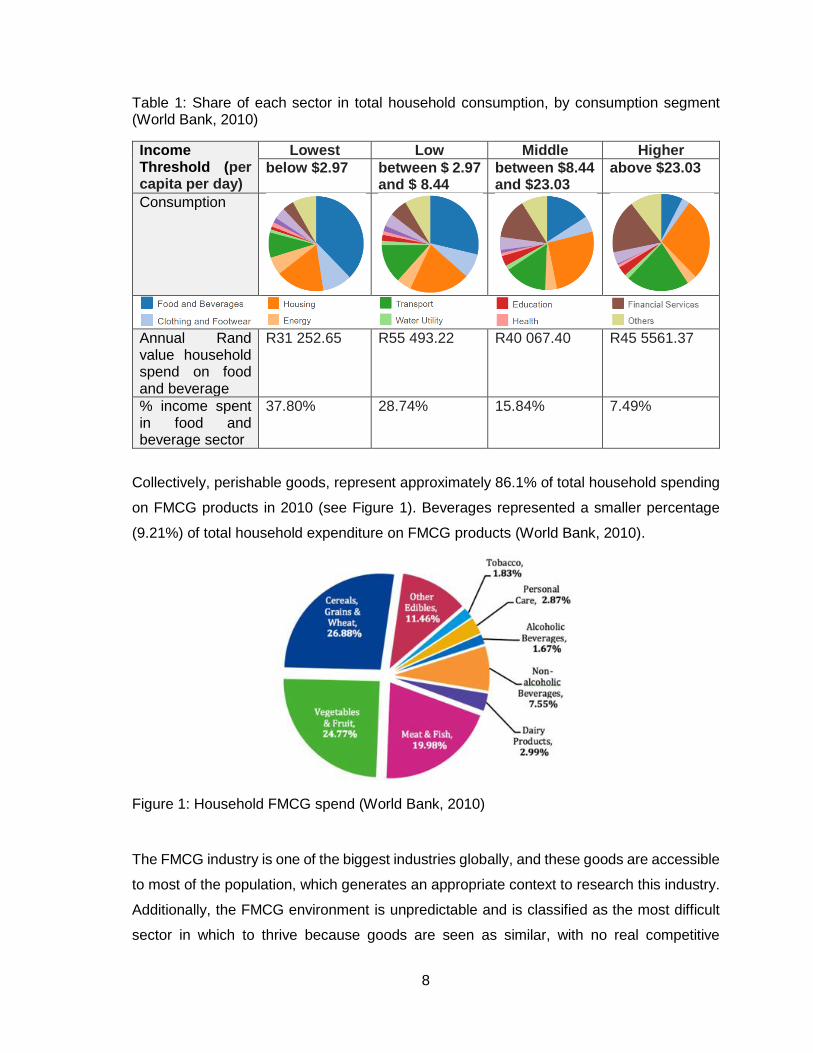
Table 1: Share of each sector in total household consumption, by consumption segment (World Bank, 2010)
Income Threshold (per capita per day)
Lowest Low Middle Higher
below $2.97 between $ 2.97 and $ 8.44
between $8.44 and $23.03
above $23.03
Consumption
Annual Rand value household spend on food and beverage
R31 252.65 R55 493.22 R40 067.40 R45 5561.37
% income spent in food and beverage sector
37.80% 28.74% 15.84% 7.49%
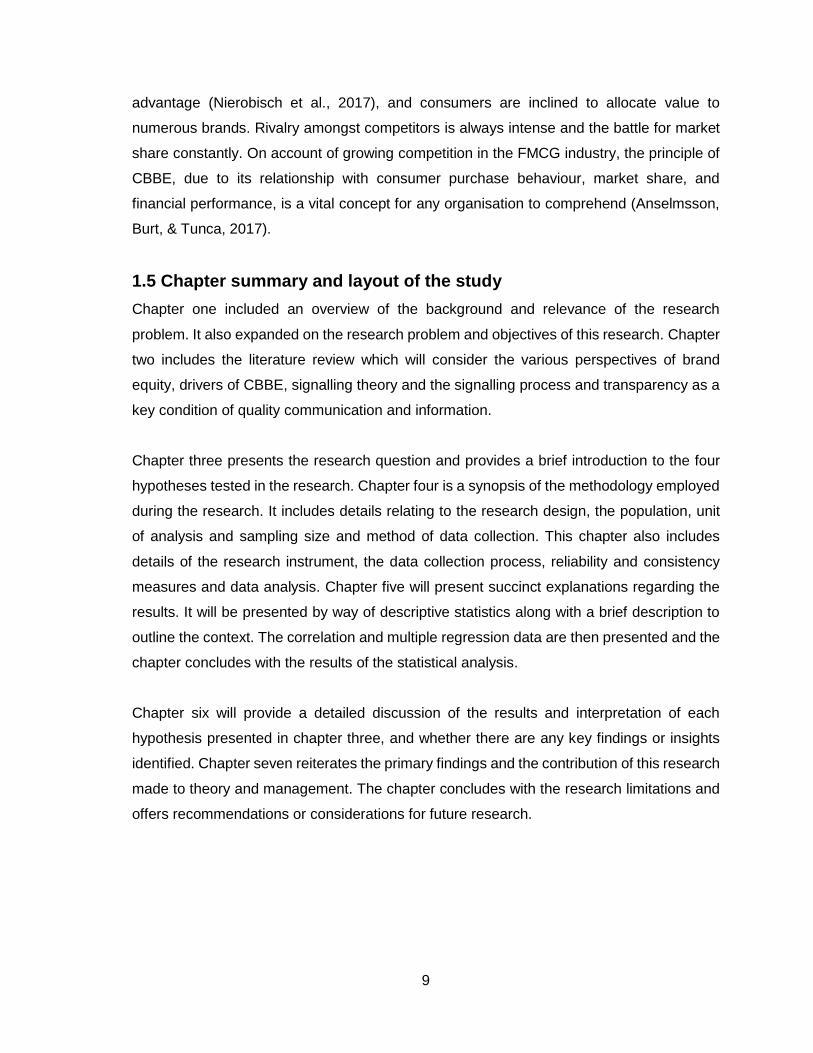
Collectively, perishable goods, represent approximately 86.1% of total household spending
on FMCG products in 2010 (see Figure 1). Beverages represented a smaller percentage
(9.21%) of total household expenditure on FMCG products (World Bank, 2010).
Figure 1: Household FMCG spend (World Bank, 2010)
The FMCG industry is one of the biggest industries globally, and these goods are accessible
to most of the population, which generates an appropriate context to research this industry.
Additionally, the FMCG environment is unpredictable and is classified as the most difficult
sector in which to thrive because goods are seen as similar, with no real competitive
9
advantage (Nierobisch et al., 2017), and consumers are inclined to allocate value to
numerous brands. Rivalry amongst competitors is always intense and the battle for market
share constantly. On account of growing competition in the FMCG industry, the principle of
CBBE, due to its relationship with consumer purchase behaviour, market share, and
financial performance, is a vital concept for any organisation to comprehend (Anselmsson,
Burt, & Tunca, 2017).
1.5 Chapter summary and layout of the study
Chapter one included an overview of the background and relevance of the research
problem. It also expanded on the research problem and objectives of this research. Chapter
two includes the literature review which will consider the various perspectives of brand
equity, drivers of CBBE, signalling theory and the signalling process and transparency as a
key condition of quality communication and information.
Chapter three presents the research question and provides a brief introduction to the four
hypotheses tested in the research. Chapter four is a synopsis of the methodology employed
during the research. It includes details relating to the research design, the population, unit
of analysis and sampling size and method of data collection. This chapter also includes
details of the research instrument, the data collection process, reliability and consistency
measures and data analysis. Chapter five will present succinct explanations regarding the
results. It will be presented by way of descriptive statistics along with a brief description to
outline the context. The correlation and multiple regression data are then presented and the
chapter concludes with the results of the statistical analysis.
Chapter six will provide a detailed discussion of the results and interpretation of each
hypothesis presented in chapter three, and whether there are any key findings or insights
identified. Chapter seven reiterates the primary findings and the contribution of this research
made to theory and management. The chapter concludes with the research limitations and
offers recommendations or considerations for future research.
10
CHAPTER 2: LITERATURE REVIEW
2.1 Brand equity
The concept of brand equity has been the focal point of marketing literature for many
decades (Datta et al., 2017). Farjam and Hongyi (2015) mentioned that in efforts to
characterise the relationship between brands and consumers, marketing literature created
the term brand equity. Table 2 contains key definitions of brand equity and were selected
based on two assumptions. First, the definitions of Aaker (1991, 1996) and Keller (1993)
who formed the fundamental concept of CBBE are definitions which most authors resort to
in research. Second, the remaining definitions specifically related to the consumer
perspective and perceptions of brand equity.
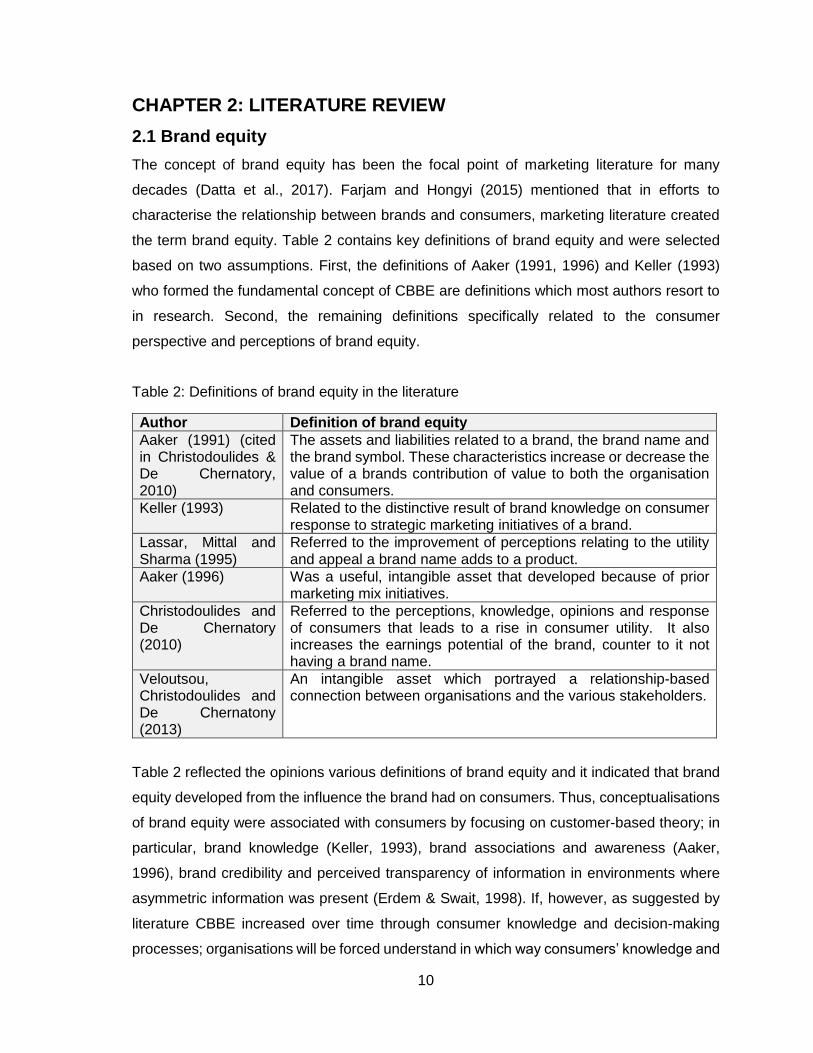
Table 2: Definitions of brand equity in the literature
Author Definition of brand equity
Aaker (1991) (cited in Christodoulides & De Chernatory, 2010)
The assets and liabilities related to a brand, the brand name and the brand symbol. These characteristics increase or decrease the value of a brands contribution of value to both the organisation and consumers.
Keller (1993) Related to the distinctive result of brand knowledge on consumer response to strategic marketing initiatives of a brand.
Lassar, Mittal and Sharma (1995)
Referred to the improvement of perceptions relating to the utility and appeal a brand name adds to a product.
Aaker (1996) Was a useful, intangible asset that developed because of prior marketing mix initiatives.
Christodoulides and De Chernatory (2010)
Referred to the perceptions, knowledge, opinions and response of consumers that leads to a rise in consumer utility. It also increases the earnings potential of the brand, counter to it not having a brand name.
Veloutsou, Christodoulides and De Chernatony (2013)
An intangible asset which portrayed a relationship-based connection between organisations and the various stakeholders.
Table 2 reflected the opinions various definitions of brand equity and it indicated that brand
equity developed from the influence the brand had on consumers. Thus, conceptualisations
of brand equity were associated with consumers by focusing on customer-based theory; in
particular, brand knowledge (Keller, 1993), brand associations and awareness (Aaker,
1996), brand credibility and perceived transparency of information in environments where
asymmetric information was present (Erdem & Swait, 1998). If, however, as suggested by
literature CBBE increased over time through consumer knowledge and decision-making
processes; organisations will be forced understand in which way consumers’ knowledge and
11
decisions build and influence the formation of brand equity (Hyun Baek & Whitehill King,
2011).
Apart from the variations of brand equity definitions available in the literature, the topic of
CBBE was filled with explanations, conceptual frameworks, various dimension constructs
and scale measurements (Farjam & Hongyi, 2015). The following section will, therefore,
attempt to deconstruct and collate the various viewpoints and fundamental
conceptualisations.
2.2 The perspectives of brand equity
Research considered different perspectives of brand equity (Keller, 1993; De Chernatony et
al., 2004; Shankar et al., 2008; Kim & Hyun, 2011; Baalbaki & Guzmán, 2016; Farjam &
Hongyi, 2015; Iglesias et al., 2017). Literature also suggested numerous, often opposing
perspectives of brand equity, along with conflicting views concerning the dimensions and
antecedents that affect it (Baalbaki & Guzman, 2016). For example, Chistodoulides and De
Chernatony (2010) implied that from Aaker’s (1991) definition, brand equity could have been
evaluated from the perspective of the organisations (firm-based brand equity) and the
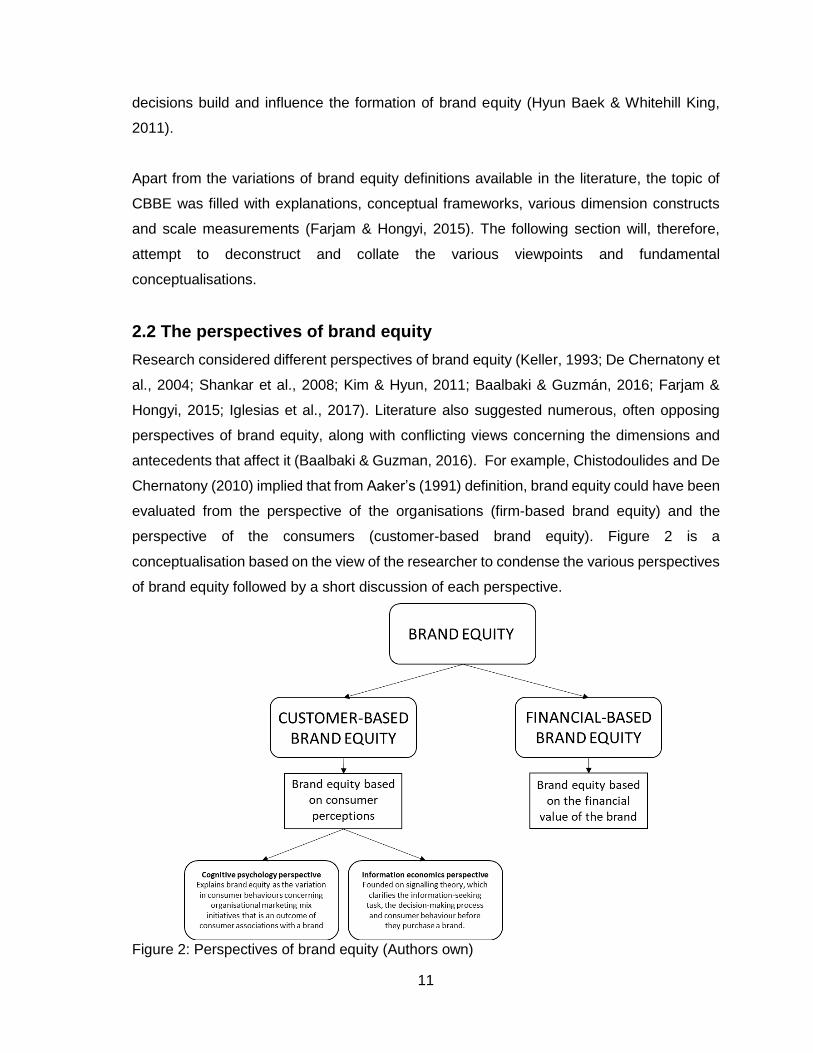
perspective of the consumers (customer-based brand equity). Figure 2 is a
conceptualisation based on the view of the researcher to condense the various perspectives
of brand equity followed by a short discussion of each perspective.
Figure 2: Perspectives of brand equity (Authors own)
12
2.2.1 Financial perspective: firm-based brand equity
Firm-based brand equity (i.e. financial perspective), was interested in establishing the
financial value of the brand (Christodoulides et al., 2015). However, according to
Christodoulides and De Chernatory (2010), financial gains were the result of consumer
response to a brand name. Although appraising the financial value of a brand was practical,
it failed to convey an understanding of how brand equity was created (Aaker, 1996; Farjam
& Hongyi, 2015). Therefore, because this research was interested in how value was created
through the consumer perspective and how that influences brand equity, this research study
only focused on the perspective of CBBE.
2.2.2 Consumer perspective: customer-based brand equity
Brand equity literature thus far attempted to understand organisational marketing efforts and
intangible resources (i.e., brand name), and the relationship with consumer perceptions of
quality, brand image, purchase intentions and loyalty (Çifci et al., 2016). For that reason,
CBBE was argued to be brand equity relating to consumer perceptions (Christodoulides et
al., 2015; Anselmsson et al., 2017). The CBBE perspective has been the preferred
approached used in marketing because it was argued that when a brand can provide no
benefits or significance to consumers, it is virtually worthless to them (Farjam & Hongyi,
2015).
The knowledge involved in understanding CBBE had been developed from two
perspectives: cognitive psychology and signalling theory in information economics (De
Chernatony & Christodoulides, 2004; Baalbaki & Guzmán, 2016). The perspective of
cognitive psychology explained brand equity as the variation in consumer behaviours,
related to marketing mix initiatives, that were an outcome of consumer associations with a
brand (Keller, 1993; Aaker, 1996). Additionally, this perspective originated from consumer
associations that altered perceptions of brand characteristics (Baalbaki & Guzmán, 2016).
In another context, Erdem and Swait (1998) mentioned that according to Stigler (1961), the
information-economics perspective was based on signalling theory, which clarified the
information-seeking task, the decision-making process and consumer behaviour before they
purchased a brand. In the context of information economics, organisations have
communicated information by way of signals relevant to their brand characteristics
(Christodoulides & De Chernatory, 2010). Signals could, as stated by Erdem et al. (2006),
13
include brand names, information and communication. The information economic
perspective also considered consumer uncertainty and the influence it had during decision-
making through information costs and perceived risks (Baalbaki & Guzmán, 2016).
2.3 Key conceptualisations of CBBE
There are several conceptualisations of CBBE (Chrisodoulides et al., 2015). However, a
theme that emerged was that the literature on CBBE equity was built primarily upon two
foundational models, Aaker (1996) and Keller (1993) (Park, 2009; Christodoulides et al.,
2015; Baalbaki & Guzman, 2016).
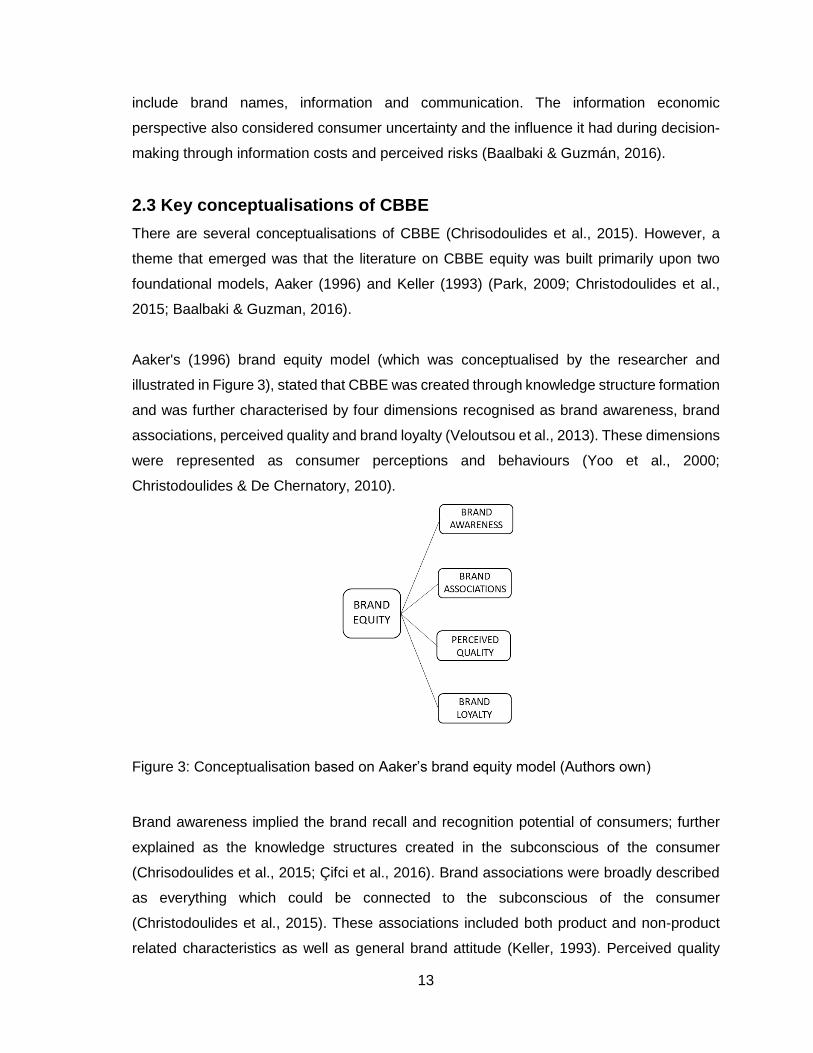
Aaker's (1996) brand equity model (which was conceptualised by the researcher and
illustrated in Figure 3), stated that CBBE was created through knowledge structure formation
and was further characterised by four dimensions recognised as brand awareness, brand
associations, perceived quality and brand loyalty (Veloutsou et al., 2013). These dimensions
were represented as consumer perceptions and behaviours (Yoo et al., 2000;
Christodoulides & De Chernatory, 2010).
Figure 3: Conceptualisation based on Aaker’s brand equity model (Authors own)
Brand awareness implied the brand recall and recognition potential of consumers; further
explained as the knowledge structures created in the subconscious of the consumer
(Chrisodoulides et al., 2015; Çifci et al., 2016). Brand associations were broadly described
as everything which could be connected to the subconscious of the consumer
(Christodoulides et al., 2015). These associations included both product and non-product
related characteristics as well as general brand attitude (Keller, 1993). Perceived quality
14
was explained as the perception consumers held about the quality of brands when matched
to similar products (Christodoulides et al., 2015; Baalbaki & Guzman, 2016). Lastly, loyalty
was the positive feelings or commitment a consumer had with a brand (Christodoulides et
al., 2015; Pappu & Quester, 2016).
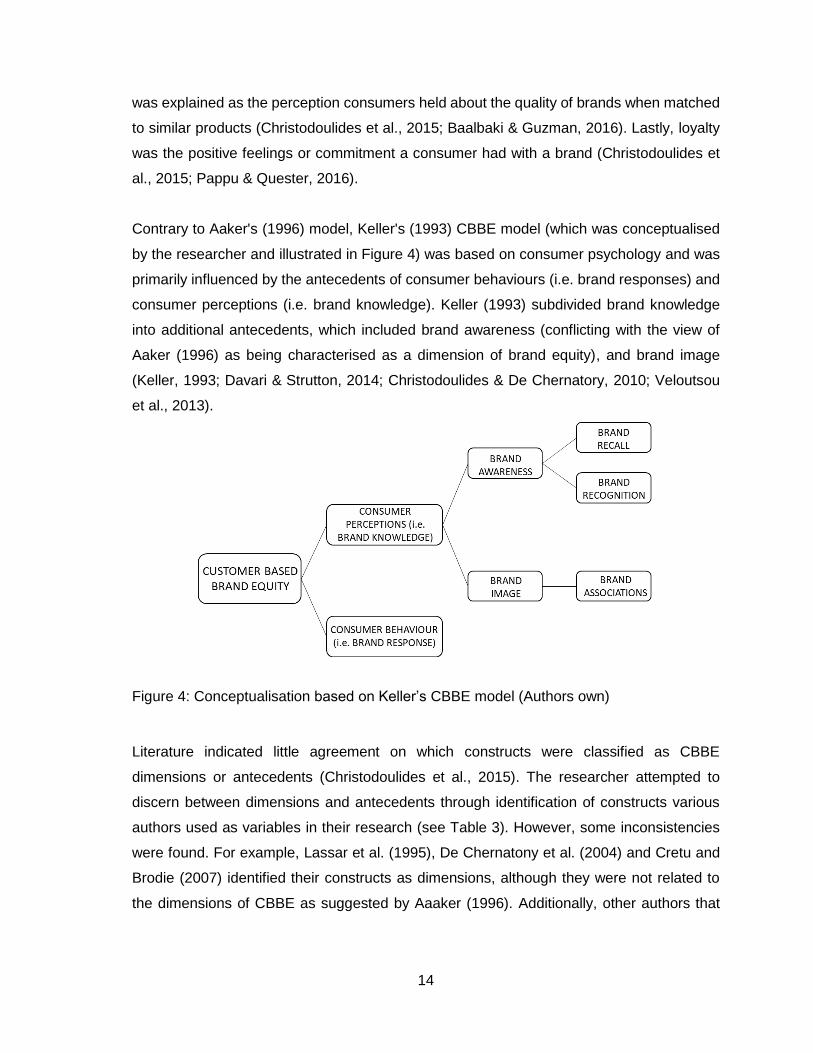
Contrary to Aaker's (1996) model, Keller's (1993) CBBE model (which was conceptualised
by the researcher and illustrated in Figure 4) was based on consumer psychology and was
primarily influenced by the antecedents of consumer behaviours (i.e. brand responses) and
consumer perceptions (i.e. brand knowledge). Keller (1993) subdivided brand knowledge
into additional antecedents, which included brand awareness (conflicting with the view of
Aaker (1996) as being characterised as a dimension of brand equity), and brand image
(Keller, 1993; Davari & Strutton, 2014; Christodoulides & De Chernatory, 2010; Veloutsou
et al., 2013).
Figure 4: Conceptualisation based on Keller’s CBBE model (Authors own)
Literature indicated little agreement on which constructs were classified as CBBE
dimensions or antecedents (Christodoulides et al., 2015). The researcher attempted to
discern between dimensions and antecedents through identification of constructs various
authors used as variables in their research (see Table 3). However, some inconsistencies
were found. For example, Lassar et al. (1995), De Chernatony et al. (2004) and Cretu and
Brodie (2007) identified their constructs as dimensions, although they were not related to
the dimensions of CBBE as suggested by Aaaker (1996). Additionally, other authors that
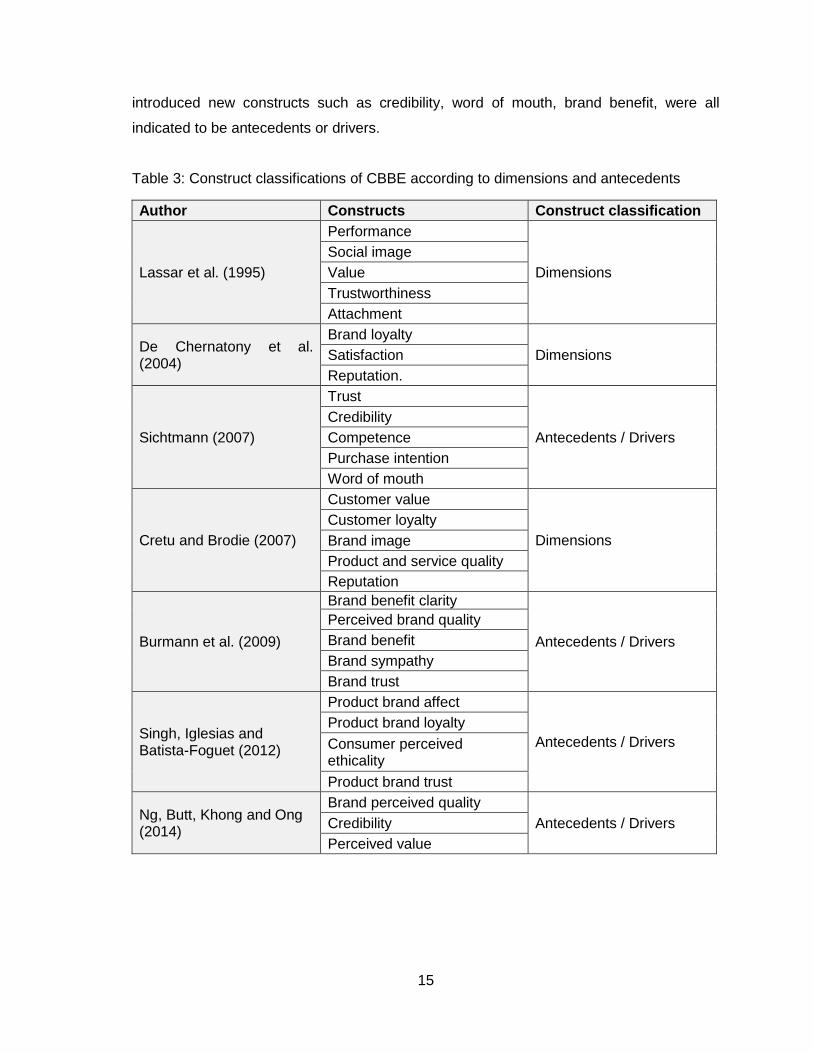
15
introduced new constructs such as credibility, word of mouth, brand benefit, were all
indicated to be antecedents or drivers.
Table 3: Construct classifications of CBBE according to dimensions and antecedents
Author Constructs Construct classification
Lassar et al. (1995)
Performance
Dimensions
Social image
Value
Trustworthiness
Attachment
De Chernatony et al. (2004)
Brand loyalty
Dimensions Satisfaction
Reputation.
Sichtmann (2007)
Trust
Antecedents / Drivers
Credibility
Competence
Purchase intention
Word of mouth
Cretu and Brodie (2007)
Customer value
Dimensions
Customer loyalty
Brand image
Product and service quality
Reputation
Burmann et al. (2009)
Brand benefit clarity
Antecedents / Drivers
Perceived brand quality
Brand benefit
Brand sympathy
Brand trust
Singh, Iglesias and Batista-Foguet (2012)
Product brand affect
Antecedents / Drivers
Product brand loyalty
Consumer perceived ethicality
Product brand trust
Ng, Butt, Khong and Ong (2014)
Brand perceived quality
Antecedents / Drivers Credibility
Perceived value
16
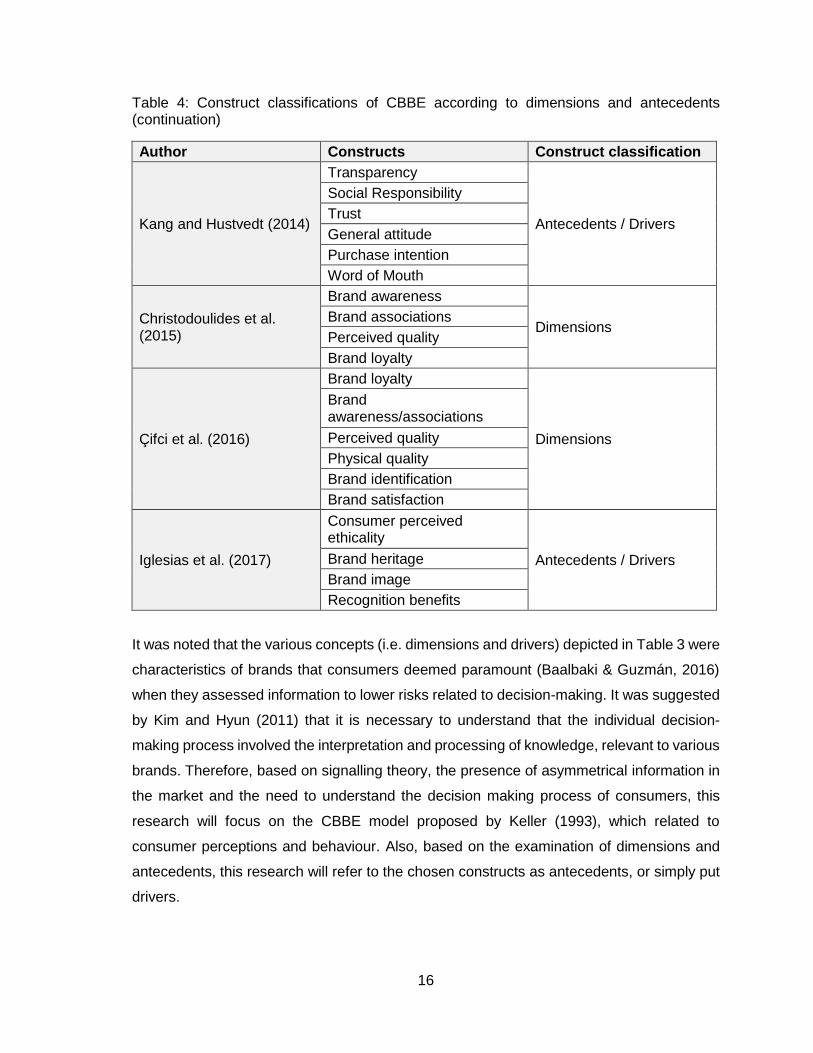
Table 4: Construct classifications of CBBE according to dimensions and antecedents (continuation)
Author Constructs Construct classification
Kang and Hustvedt (2014)
Transparency
Antecedents / Drivers
Social Responsibility
Trust
General attitude
Purchase intention
Word of Mouth
Christodoulides et al. (2015)
Brand awareness
Dimensions Brand associations
Perceived quality
Brand loyalty
Çifci et al. (2016)
Brand loyalty
Dimensions
Brand awareness/associations
Perceived quality
Physical quality
Brand identification
Brand satisfaction
Iglesias et al. (2017)
Consumer perceived ethicality
Antecedents / Drivers Brand heritage
Brand image
Recognition benefits
It was noted that the various concepts (i.e. dimensions and drivers) depicted in Table 3 were
characteristics of brands that consumers deemed paramount (Baalbaki & Guzmán, 2016)
when they assessed information to lower risks related to decision-making. It was suggested
by Kim and Hyun (2011) that it is necessary to understand that the individual decision-
making process involved the interpretation and processing of knowledge, relevant to various
brands. Therefore, based on signalling theory, the presence of asymmetrical information in
the market and the need to understand the decision making process of consumers, this
research will focus on the CBBE model proposed by Keller (1993), which related to
consumer perceptions and behaviour. Also, based on the examination of dimensions and
antecedents, this research will refer to the chosen constructs as antecedents, or simply put
drivers.
17
For this research, the researcher deemed it appropriate to choose drivers based on the
above reasoning of Baalbaki and Guzmán (2016) and Kim and Huyn (2011), as well as the
association each construct had within the framework of information. For example, brand
credibility was implied by Erdem and Swait (1998), to improve quality perception, reduce
risk perception and information costs, consequently raising anticipated consumer benefit
that was indicative of brand purchase intention. According to Baek, Kim and Yu (2010),
signalling theory also suggested that brand credibility was a vital factor of brand signals in
order to communicate information successfully to consumers.
Parris et al. (2016) argued that transparency might be the solution and approach
organisations should take in order to curtail asymmetrical information that exists in the
market. Moreover, transparency has not been favoured in CBBE literature as a construct of
choice when studying relationships or impact various drivers have on CBBE. Therefore, this
research study aims to address that gap. Furthermore, Park (2009) suggested that
successful marketing information and communications were built on the evaluation of
consumer perceptions of the brand (i.e., brand image), consumer confidence (i.e., brand
trust) and consumer behaviour (i.e., purchase intentions). Therefore, based on the
suggestions of Park (2009) and Erdem and Swait (1998) the following drivers were chosen
for comparative reasons to address the aim of the research: (1) brand trust, (2) brand image,
(3) brand credibility together with transparency (discussed in section 2.5). The subsequent
section is a brief discussion of each of the chosen drivers.
2.3.3.1 Brand trust
Research indicated that CBBE was explained when brand trust was taken into consideration
(Delgado-Ballester & Munuera-Aleman, 2001) because perceptions about the dependability
and integrity of brands formed the creation of trust in consumers’ minds (Chaudhuri &
Holbrook, 2001; Davari & Strutton, 2014). Kang and Hustvedt (2014) explained that trust
was the belief a consumer held, that organisational behaviours would always consider the
interests of the consumer. Additionally, Delgado-Ballester and Munuera-Aleman (2005)
stated that brand trust developed from consumer learning through experience. It was vital
that organisations focused on actions, initiatives and behaviour that could positively
influence brand trust (Kang & Hustvedt, 2014). From this, it was inferred that if consumers
are not seen as stakeholders that could impact the CBBE of an organisation, consumers
had the ability to switch between brands. Similarly, Burmann et al. (2009) depicted brand
18
trust as the inclination of consumers to expect a brand to deliver on the promises
communicated to them through information, communications and behaviours. From another
viewpoint, Guckian et al. (2018) recognised that consumer-brand relationships founded on
trust promoted favourable responses from consumers towards the organisation.
Trust was said to be important in environments where consumers have high expectations
and competition between brands was common (Men & Tsai, 2014; Men & Hung-Baesecke,
2015). The argument remained because persistent levels of brand trust were related to
increased brand loyalty, positive word-of-mouth and repurchase intentions (Park, 2009;
Guckian et al., 2018). This argument made sense because Chaudhuri & Holbrook (2001)
mentioned that in an unpredictable environment, trust minimised the risk perception of the
consumer because they could depend on the brand trust relationship. Additionally, moral
behaviour by organisations arguably created consumer trust (Guckian et al., 2018). To build
trust, brands had to ensure that their behaviour was concerned with the interest of the
consumer as well as mutual objectives and beliefs (Chaudhuri & Holbrook, 2001).
2.3.3.2 Brand image
Brand image was explained as the way in which consumers thought about the brand instead
of what the brand did (Keller, 2001). Brand image also alluded to the associations created
inside the consumers' memories, which were linked to a brand. In another context, brand
image was described as perceptions attached to as well as impression formed of the brand
in the consumer’s subconscious, which incorporated symbolic denotations linked to the
product (He & Lai, 2014; Cretu & Brodie, 2007).
A fundamental requirement of a strong brand image was that the brand should be
entrenched in the consumer's subconscious (Keller, 1993, 2001). Effective marketing
signals (which include information and communication) were valuable in the formation of
increased brand associations, improved quality perceptions and greater brand loyalty from
consumers (Davari & Strutton, 2014). Consequently, marketing signals affected the ease
with which different sets of information and associations about the brand consolidated within
the mind of the consumer (Cretu & Brodie, 2007).
Cho and Fiore (2015) considered that brand image comprised of three categories of
consumer associations. Additionally, Iglesias et al. (2017) proposed that these consumer
19
associations were created during both direct and indirect interactions consumers have with
a brand. First, cognitive associations included individuals’ thoughts, principles and
valuations related to a brand (Cho & Fiore, 2015). Emotional associations included
emotions and feelings consumers formed with a brand and could be both favourable or
critical. The category of sensory associations considered the physical senses a consumer
linked with a brand (Cho & Fiore, 2015).
Iglesias et al. (2017) stated that for organisations to build strong CBBE, coupled with
compelling consumer-brand relationships, the brand image had to be scrupulously
preserved and upheld. Literature reinforced the idea that a positive brand image impacted
various consumer reactions which included consumer loyalty, consumer purchase intentions
and behaviour, and favourable word-of-mouth disclosures (Park, 2009; Guckian et al.,
2018); ultimately resulting in strong CBBE (Iglesias et al., 2017). It was inferred that, apart
from organisations and brands having a good brand image, the image they displayed must
have been consistent throughout all interactions with consumers to ensure invariable CBBE.
2.3.3.3 Brand credibility
Brand credibility ensued when CBBE was considered from the perspective of signalling
theory (Erdem & Swait, 1998). Brand credibility was defined as the perception consumers
had towards the believability of a brand and whether organisations had the capability and
promptitude to provide what was promised consistently (Erdem & Swait, 1998, 2004; Erdem,
Swait & Louviere, 2002). Simply stated, when consumers purchased a credible brand, they
could be certain that the product was of good quality. Brand credibility, according to Baek et
al. (2010), was suggested as an imperative driver to organisations if they wanted to create
a strong brand because brand credibility was argued to impact the chance that the brand
was incorporated in future consideration sets of consumers (Erdem et al.,2002). For
organisations a positive outcome of having a credible brand was twofold. It could create the
opportunity to reduce marketing costs, because of the elevated prospect that consumers will
agree with the message. Also, it could grow sales by means of consumer repeat purchase
behaviour and consumer recommendations (Baek et al., 2010).
Brand credibility was formed by two facets: expertise and trustworthiness (Erdem & Swait,
1998, 2004; Erdem et al., 2006; Baek et al., 2010). Trustworthiness as a facet described the
alacrity of an organisation to provide consumers with what had been promised (Baek et al.,
20
2010). The facet of expertise related to the capability of the organisation to provide what
was promised (Erdem & Swait, 1998).
Additional to the facets of credibility, other antecedents related to brand credibility, were
consistency (Baek et al., 2010) and clarity (Erdem & Swait, 1998, 2004) of product-related
information. Consistency portrayed the level of agreement and uniformity of the marketing
initiatives of an organisation over a given period (Erdem et al., 2006). Clarity illustrated the
absence of ambiguity of information pertinent to a brand (Erdem et al., 2002). Considering
the facets and antecedents of brand credibility, it substantiated the statement by Erdem and
Swait (1998) who suggested that brand credibility was a main element of a brand signal
needed for effective information delivery.
Literature also suggested that brand credibility was a signal related to the quality of a brand
(Erdem & Swait, 2004). Brands had the ability to affect various aspects of the choice
consideration sets and decision-making processes of consumers (Baek et al., 2010), which
suggested that brand credibility was a critical element fundamental to the establishment of
consumer consideration sets (Erdem & Swait, 1998; Baek et al., 2010). According to Erdem
et al. (2002), uncertainty was intrinsic in affecting the consideration set and decision-making,
especially related to brand characteristics and benefits. If consumers were unsure of a brand
and the marketplace was defined by asymmetric information (i.e. organisations hold more
information about their products than consumers have), brands could function as signals.
The signals offered by organisations could also function as a method for consumers to gain
knowledge, encipher and assess information relating to brand attributes and benefits. Erdem
and Swait (2004) further argued that since brands served as signals, if organisations did not
provide trustworthiness and expertise, the CBBE would diminish.
Furthermore, brand credibility, implied by Erdem and Swait (1998, 2004), improved quality
perception, reduce risk perception and information costs, and consequently improved the
anticipated consumer benefit that was indicative of brand purchase intention. This statement
substantiated the idea of Hyun Baek and Whitehill King (2011) that credible brands were
regarded as sources of knowledge, which would reduce consumer efforts and information
costs during the decision-making process. Additionally, Aaker (1996) stated that the
increased perceived quality and risks and information costs related to brand credibility could
positively alter consumer perceptions and valuation of a brand.
21
2.4 Signalling theory
The information economics perspective of CBBE and signalling theory both related to the
belief that varying degrees of information accessible to consumers resulted in the dilemma
of asymmetrical information (Baek et al., 2010; Taj, 2016). Information asymmetry inferred
consumer uncertainty regarding the traits relating to a brand supplied by an organisation
(Baek et al., 2010). However, consumers were inclined to be hesitant during the purchasing
process if they were unsure of product characteristics due to asymmetrical information
(Hyun Baek & Whitehill King, 2011). Thus, signalling theory imparted a theoretical
underpinning for this research to understand the techniques and information requirements
through which consumer purchase intentions and decision-making were influenced in an
environment where asymmetrical information exists.
Signalling had been widely discussed in communication literature (Erdem & Swait, 1998;
Connelly et al., 2011; Dögl & Holtbrügge, 2014; Hetze, 2016; Pecot et al., 2018). Baek et
al. (2010) defined a signal as any activity an organisation undertook to impart information
credibly concerning intangible qualities or benefits to a consumer. Erdem and Swait (1998)
also suggested that signals associated with a brand included previous and current and
marketing mix initiatives. Signals were further explained as organisational behaviour which
demonstrates intentions, motives or goals (Hetze, 2016).
2.4.1 The signalling process
According to Dögl and Holtbrügge (2014), signalling had three facets: the sender
responsible for sending information (i.e. organisation), the signal (i.e. the information
disclosed through marketing mix elements or communication) and the receiver (i.e.
stakeholder or consumer) who interprets the information.
2.4.1.1 The sender
As stated by Erdem et al. (2006), uncertainty originated from the asymmetry of information
that exists among organisations and consumers. In order for organisations to avoid the
predicament, they utilised signals to communicate information (Dögl & Holtbrügge, 2014),
which included marketing mix activities, information and behaviours (Pecot et al., 2018).
These signals had the potential to be useful to an organisation because credible brand
signals could enhance perceptions about brand quality in situations where uncertainty
22
ensued as well as improve consumer credence in brand communication (Erdem & Swait,
1998; Hyun Baek & Whitehill King, 2011).
Keller (2009) stated that communication and information portrayed a fundamental role in
steering sales and building CBBE. However, the environment of communication had also
become more intricate, which led to consumers having the ability to choose both their media
preference and signals they wish to receive (Keller, 2009). Therefore, organisations needed
to choose the most appropriate signal in order to captivate consumers as effective
information signals can give rise to brand knowledge (Westberg & Pope, 2014).
2.4.1.2 The receiver
The conventional concept of information suggested that increasing the quantity or volume
of information and demonstrating transparency would aid the consumer-decision making
process (Granados et al., 2010). Contradictory to this statement, it was argued that only
increasing the available levels of information would not alter consumer behaviour, because
Connelly et al. (2011) found it essential for consumers to be able to obtain quality,
unambiguous information that they could understand, before signals and information were
able to affect their decision-making processes.
However, Oehler and Wendt (2017) mentioned that behavioural economics suggested that
consumers had restricted cognitive capabilities when it involved perceptions of information
and the processing thereof. Consumers were said to be affected by psychological and
incentive elements (Kahneman & Tversky, 1979; Oehler & Wendt, 2017), which signified
that consumers cannot make rational decisions (i.e. bounded rationality). Consumers
assessed information by making use of heuristics, based on their beliefs and values, gained
through experience (Oehler & Wendt, 2017), consumers also followed their self-interest
based either on personal benefits or through avoidance of personal cost (Davari & Strutton,
2014). These evaluations aided them in their decision-making process (Davari & Strutton,
2014; Bhaduri & Ha-Brookshire, 2017). This coping mechanism, however, led to increased
consumer risks, because they were not concentrating on the relevant information to fulfil
their requirements. Instead, they concentrated on information that was easily accessible and
delivered in the most conspicuous manner (Oehler & Wendt, 2017). It was inferred that in
today's hyper-connected world which is inundated with available information, consumers
were experiencing information overload (Oehler & Wendt, 2017).
23
2.4.1.3 The signal
Extending on the views of Connelly et al. (2011) relating to the quality of information, Oehler
and Wendt (2017), although considering the limitations of consumer cognitive function,
suggested that consumer information needed to fulfil certain quality conditions for the
consumer to use it. These necessary conditions included transparency, clarity and
comparability (Oehler & Wendt, 2017). This argument made sense because it was reasoned
that for consumers to use information during decision-making, the information needed to be
noticed and understood (Connelly et al., 2011; Rawlins, 2009; Men, 2014; Men & Hung-
Baesecke, 2015; Schnackenberg & Tomilinson, 2016). It was required that information
needed to be guided by the consumers' ability to utilise the available information to make
just decisions (Rawlins, 2009; Men, 2014; Men & Hung-Baesecke, 2015; Schnackenberg &
Tomilinson, 2016). It was, however, disputed that the current quality of information that
consumers had access to, did not satisfy consumer needs, which in turn affected the
trustworthiness of the organisation (Chaudhuri & Holbrook, 2001; Guckian et al., 2018).
The information paradigm, as suggested by Granados et al. (2010), stated that it was
possible to encourage consumer decision-making by merely increasing the quantity of
information. This view neglected the fact that consumers, due to bounded rationality, did not
have the ability to be entirely informed. Contrary to the view of Granados et al. (2010),
although consumer information conditions, such as transparency, clarity and comparability,
signify the need that must be met for consumers to make fair decisions (Oehler & Wendt,
2017), Parris et al. (2016) argued that transparency might be the solution and approach
organisations should take in order to curtail asymmetrical information that exists in the
market. This view is adopted by the researcher and transparency will, therefore, be
discussed in more detail, as one of the essential conditions that quality information is
required to fulfil (Parris et al., 2016; Oehler & Wendt, 2017).
Although transparency developed into a meaningful communication topic (Men & Hung-
Baesecke, 2015), evolving technology and communication methods have proliferated
consumer expectations and created areas in which organisations could share knowledge
and information, sequentially supporting transparency (Men & Tsai, 2014; Men & Hung-
Baesecke, 2015). According to Dubbink et al. (2008), transparent organisations offered
information in a manner which enabled consumers to gain insight and understanding of
matters and circumstances that concern them. However, the current level of research
24
surrounding transparency is still inadequate, thereby leading to the failure of organisations
to fully understand the impact of transparency on themselves and their stakeholders.
2.5 Transparency
According to Parris et al. (2016), the call for elevated transparency had become obligatory
and the significance of exploring transparency was widely publicised (Schnackenberg &
Tomlinson, 2016). However, considering the increasing number of organisations that have
been sighted for unethical behaviour and insufficient transparency, the gist of the
understanding and use of transparency seemed to be accepted to a lesser degree. This
absence or insufficient transparency had heightened consumer incredulity and disbelief
(Parris et al., 2016; Nyilasy et al., 2013; Lin et al., 2017). Furthermore, various stakeholders
were increasingly enabled by the evolution of technology and betterment of communication
(Men, 2014), which created the expectation that transparency should be standard practice
(Parris et al., 2016).
Transparency had been investigated in various domains which include accounting and
finance, marketing, organisational behaviour and political science (Parris et al., 2016; Albu
and Flyverbom, 2016; Holland, Krause, Provencher & Seltzer, 2018). Transparency
literature was widely available within the framework of business to consumer relationships
(Schnackenberg & Tomlinson, 2016; Holland et al., 2018). Furthermore, organisational
behaviour literature explained transparency in terms of the improvement of trust,
organisational identity, culture and perceptions (Kaptein, 2008; Walumbwa, Luthans, Avey
& Oke, 2011). According to Bushman, Piotroski and Smith (2004), the financial field
investigated transparency within the scope of economic environments, organisational
disclosures, and monetary policy. Marketing contributed to research that explored
transparency through product disclosure and consumer response to risk information
(Schnackenberg & Tomlinson, 2016; Holland et al., 2018).
2.5.1 Defining transparency
A significant part of the literature considered transparency in the context of organisational
openness, availability and accessibility concerning information sharing. Despite
transparency evolving into a catchphrase used in business, the review of the available
literature revealed that definitions of transparency were frequently indefinite and vague
25
(Schnackenberg & Tomlinson, 2016; Parris et al., 2016), with many differences and
inconsistencies.
Albu and Flyverbom (2016) mentioned that various authors attempted to rationalise
transparency by positioning the role of information as the focal point. Transparency, in
literature, was primarily recognised as the sharing of information and was entirely dependent
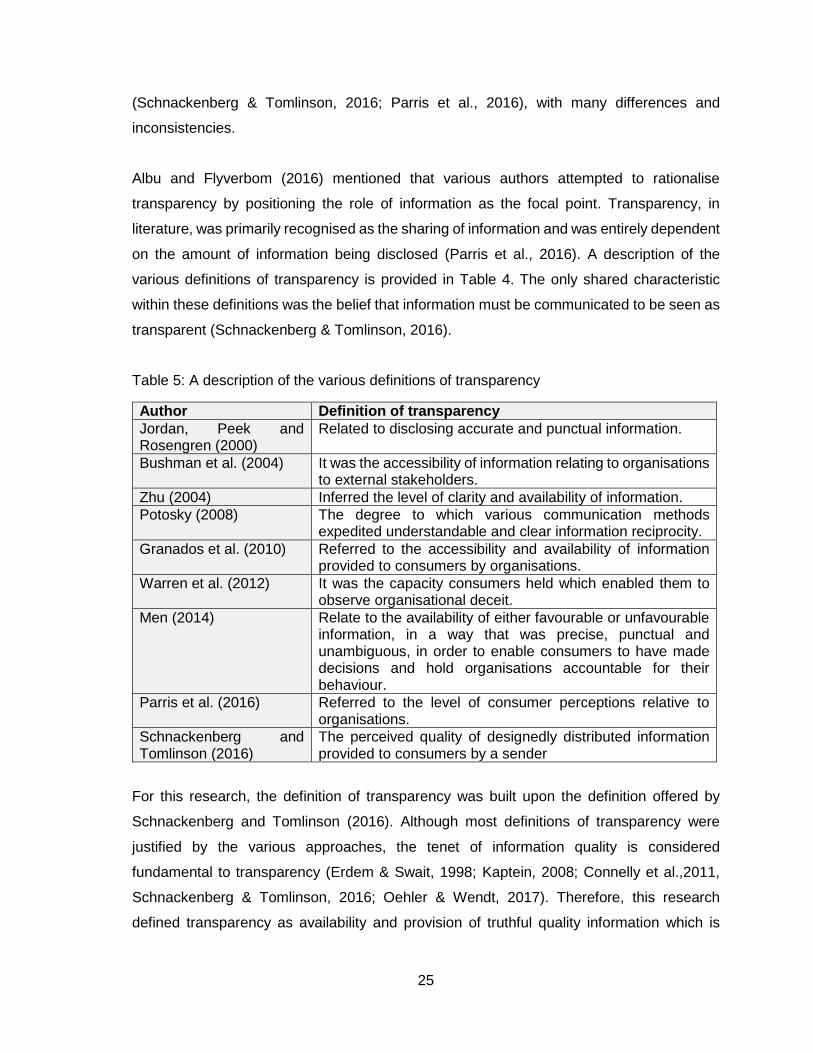
on the amount of information being disclosed (Parris et al., 2016). A description of the
various definitions of transparency is provided in Table 4. The only shared characteristic
within these definitions was the belief that information must be communicated to be seen as
transparent (Schnackenberg & Tomlinson, 2016).
Table 5: A description of the various definitions of transparency
Author Definition of transparency
Jordan, Peek and Rosengren (2000)
Related to disclosing accurate and punctual information.
Bushman et al. (2004) It was the accessibility of information relating to organisations to external stakeholders.
Zhu (2004) Inferred the level of clarity and availability of information.
Potosky (2008) The degree to which various communication methods expedited understandable and clear information reciprocity.
Granados et al. (2010) Referred to the accessibility and availability of information provided to consumers by organisations.
Warren et al. (2012) It was the capacity consumers held which enabled them to observe organisational deceit.
Men (2014) Relate to the availability of either favourable or unfavourable information, in a way that was precise, punctual and unambiguous, in order to enable consumers to have made decisions and hold organisations accountable for their behaviour.
Parris et al. (2016) Referred to the level of consumer perceptions relative to organisations.
Schnackenberg and Tomlinson (2016)
The perceived quality of designedly distributed information provided to consumers by a sender
For this research, the definition of transparency was built upon the definition offered by
Schnackenberg and Tomlinson (2016). Although most definitions of transparency were
justified by the various approaches, the tenet of information quality is considered
fundamental to transparency (Erdem & Swait, 1998; Kaptein, 2008; Connelly et al.,2011,
Schnackenberg & Tomlinson, 2016; Oehler & Wendt, 2017). Therefore, this research
defined transparency as availability and provision of truthful quality information which is
26
understandable to the individual consumer (Rawlins, 2009; Men & Tsai, 2014; Men & Hung-
Baesecke, 2015; Schnackenberg & Tomlinson, 2016).
It was argued that by various authors that consumers' uncertainty increased, affecting
consumer behaviour and decision-making, if the amount of information available was
unnecessary or if the information was complicated to understand (Erdem & Swait, 1998;
Chaudhuri & Holbrook, 2001; Hyun Baek & Whitehill King, 2011). It was, therefore, in support
of the provided definition, suggested that transparency could only be functional if it were
built upon provision of complete, objective information, which was available and simple to
understand (Rawlins, 2009; Men, 2014; Schnackenberg & Tomlinson, 2016; Merlo et al.,
2018).
2.5.2 Dimensional structure of transparency
The dimensional elements of transparency were considered from various viewpoints within
research. The organisational perspective was examined with regards to the degree of
visibility and availability of information organisations presented to consumers (Zhu, 2004;
Kaptein, 2008; Granados et al., 2010; Men & Hung-Baesecke, 2015; Taj, 2016;
Schnackenberg & Tomlinson, 2016). The consumer perspective defined transparency as an
individual's personal feelings and opinions relevant to receiving of information and signals
from an organisation (Cretu & Brodie, 2007; Davari & Strutton, 2014; Westberg & Pope,
2014).
As mentioned earlier, it was evident from the literature that due to the discrepancies and
variations in the definition of transparency, the meaning of information quality was unclear
(Granados et al., 2010; Schnackenberg & Tomlinson, 2016). Similarly, there was also
inconsistency concerning the dimensions that constituted transparency. It was, mentioned
by Parris et al. (2016) that some definitions in literature did not use the particular term of
openness, although it was insinuated. By way of illustration, Rawlins (2009), specified that
transparency included three distinct facets: truthfulness, significant and useful information;
involvement of stakeholders; and impartial, unbiased and accountability (Men, 2014; Men &
Hung-Baesecke, 2015). Therefore, Table 5 illustrates different studies with similar
conceptualisations, which indicated that transparency was mainly considered from three
overlapping approaches as suggested by Schnackenberg and Tomlinson (2016):
disclosure, clarity and accuracy.
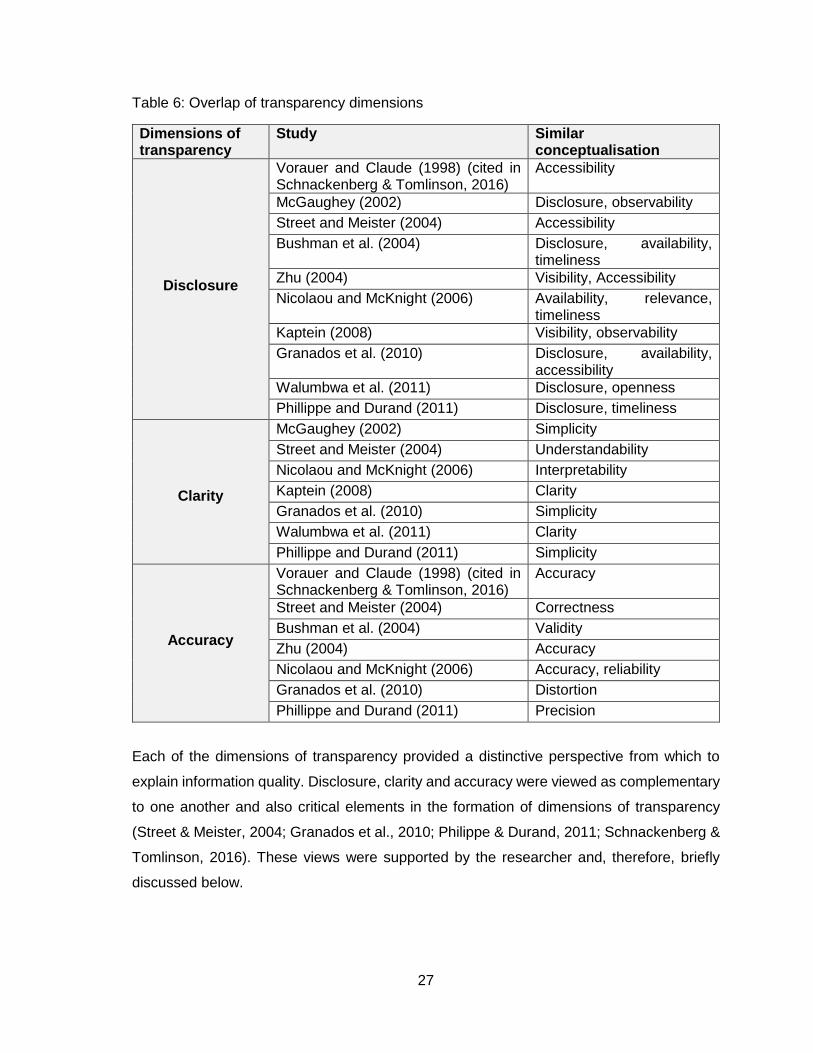
27
Table 6: Overlap of transparency dimensions
Dimensions of transparency
Study Similar conceptualisation
Disclosure
Vorauer and Claude (1998) (cited in Schnackenberg & Tomlinson, 2016)
Accessibility
McGaughey (2002) Disclosure, observability
Street and Meister (2004) Accessibility
Bushman et al. (2004) Disclosure, availability, timeliness
Zhu (2004) Visibility, Accessibility
Nicolaou and McKnight (2006) Availability, relevance, timeliness
Kaptein (2008) Visibility, observability
Granados et al. (2010) Disclosure, availability, accessibility
Walumbwa et al. (2011) Disclosure, openness
Phillippe and Durand (2011) Disclosure, timeliness
Clarity
McGaughey (2002) Simplicity
Street and Meister (2004) Understandability
Nicolaou and McKnight (2006) Interpretability
Kaptein (2008) Clarity
Granados et al. (2010) Simplicity
Walumbwa et al. (2011) Clarity
Phillippe and Durand (2011) Simplicity
Accuracy
Vorauer and Claude (1998) (cited in Schnackenberg & Tomlinson, 2016)
Accuracy
Street and Meister (2004) Correctness
Bushman et al. (2004) Validity
Zhu (2004) Accuracy
Nicolaou and McKnight (2006) Accuracy, reliability
Granados et al. (2010) Distortion
Phillippe and Durand (2011) Precision
Each of the dimensions of transparency provided a distinctive perspective from which to
explain information quality. Disclosure, clarity and accuracy were viewed as complementary
to one another and also critical elements in the formation of dimensions of transparency
(Street & Meister, 2004; Granados et al., 2010; Philippe & Durand, 2011; Schnackenberg &
Tomlinson, 2016). These views were supported by the researcher and, therefore, briefly
discussed below.
28
Disclosure was explained by Williams (2008) and Rawlins (2008), as consumer perceptions
such that information is presented and experienced on a timely basis. According to Bushman
et al. (2004), disclosure was also recommended as a core dimension of transparency,
although it was advocated that for information to be transparent, it must also be open and
candid (Schnackenberg & Tomlinson, 2016; Merlo et al., 2018). Moreover, it was stated that
disclosure also necessitated relevant information (Dubbink et al., 2008; Kaptein, 2008; Kim
& Hyun, 2011; Parris et al., 2016; Schnackenberg & Tomlinson, 2016; Merlo et al., 2018).
Clarity was described as the perceived degree through which information provided by an
organisation was understood by the consumer (Erdem and Swait, 1998; Street & Meister,
2004; Oehler & Wendt, 2017). According to Schnackenberg and Tomlinson (2016),
information comprising of expressions and functional industry language was confusing for
consumers to understand; therefore, it failed to be transparent, even if the information was
disclosed. In this research, clarity was diverged from disclosure, because it was ultimately
about conveying the meaning of information between the consumer and the organisation,
instead of the quantity and relevance of information provided (i.e. disclosure).
Accuracy, as a dimension of transparency, was described as the discernment that
information transferred between the consumer and the organisation was precise (Jordan et
al., 2000; Rawlins, 2008; Men, 2014; Schnackenberg & Tomlinson, 2016). Walumbwa et al.
(2011) argued that accuracy was fundamental to transparency because information was
incapable of being transparent if it was knowingly asymmetrical and biased. This research
distinguished between accuracy and clarity and disclosure premised on the fact that
accuracy could be described as dependability and authenticity of information as opposed to
understandability and quantity.
In addition to the above three dimensions of transparency, it was also proposed that
transparency was framed around the consumers' capability to search, collect and
understand the necessary information about an organisation (Erdem & Swait, 1998; Zhu,
2004; Williams, 2008; Rawlins, 2009; Schnackenberg & Tomlinson, 2016). This idea was
supported by the view of Zhu (2004), who suggested that unobtainable information restricted
the consumers' capabilities to obtain a complete picture of organisations. Each dimension
of transparency, unique in its way, contributed to higher levels of transparency by raising
29
confidence levels of consumers regarding the quality of information provided by
organisations (Schnackenberg & Tomlinson, 2016).
It was contended that organisations had to make an effort to warrant that the provided
information was precise and would benefit the consumer (Men & Hung-Baesecke, 2015).
The intention of organisational information and communication necessitated being built on
the requirements of consumers, and not only on increasing the quantity of available
information. As previously argued by Oehler and Wendt (2017), consumers utilised
information with which they were more familiar with instead of all the available information.
In addition to this, bounded rationality limited the cognitive ability of consumers and confined
timeframes in which they could assess and consume information (Kahneman & Tversky,
1979; Dubbink et al., 2008; Oehler & Wendt, 2017). Therefore, information that was
disclosed also to fulfil the criteria of being truthful and complete (Men, 2014),
understandable, relevant and precise (Philippe & Durand, 2011).
2.5.3 Measurements and determinants of transparency
In research, the evaluation and measurement of transparency were predominantly studied
as the rate of information disclosure (Albu & Flyverbom, 2016). Contradictory to Albu and
Flyverbom (2016), Men and Hung-Baesecke (2015) stated that transparency was not merely
disclosure and supply of information. They introduced three more measurable
characteristics that measured the quality of information: truthful, substantial information;
consumer involvement; and objectivity and accountability (Men, 2014; Men & Hung-
Baesecke, 2015).
Rawlins (2009) further identified four measurement factors, see Table 6 for a brief
discussion, that affected communication transparency: consumer involvement or
participation (Men, 2014), accountability (Men, 2014; Men & Hung-Baesecke, 2015; Parris
et al., 2016), provision of substantial information (Men, 2014; Men & Hung-Baesecke, 2015)
and secrecy (Granados et al., 2010).
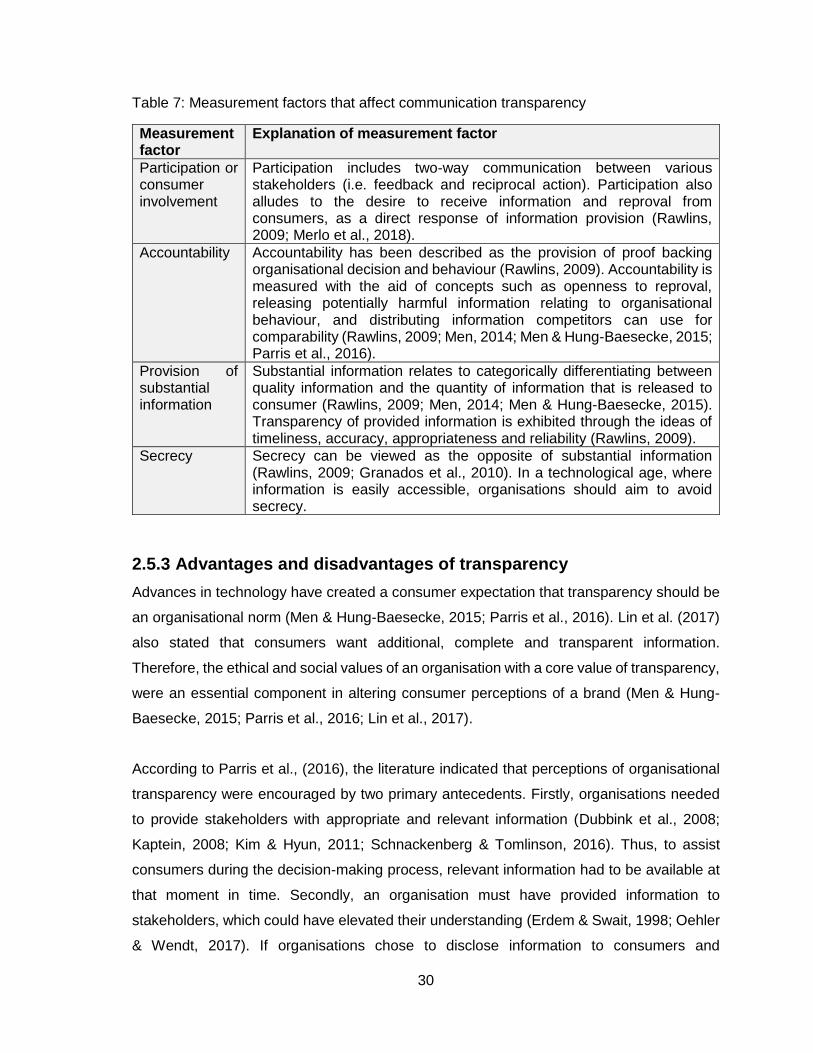
30
Table 7: Measurement factors that affect communication transparency
Measurement factor
Explanation of measurement factor
Participation or consumer involvement
Participation includes two-way communication between various stakeholders (i.e. feedback and reciprocal action). Participation also alludes to the desire to receive information and reproval from consumers, as a direct response of information provision (Rawlins, 2009; Merlo et al., 2018).
Accountability Accountability has been described as the provision of proof backing organisational decision and behaviour (Rawlins, 2009). Accountability is measured with the aid of concepts such as openness to reproval, releasing potentially harmful information relating to organisational behaviour, and distributing information competitors can use for comparability (Rawlins, 2009; Men, 2014; Men & Hung-Baesecke, 2015; Parris et al., 2016).
Provision of substantial information
Substantial information relates to categorically differentiating between quality information and the quantity of information that is released to consumer (Rawlins, 2009; Men, 2014; Men & Hung-Baesecke, 2015). Transparency of provided information is exhibited through the ideas of timeliness, accuracy, appropriateness and reliability (Rawlins, 2009).
Secrecy Secrecy can be viewed as the opposite of substantial information (Rawlins, 2009; Granados et al., 2010). In a technological age, where information is easily accessible, organisations should aim to avoid secrecy.
2.5.3 Advantages and disadvantages of transparency
Advances in technology have created a consumer expectation that transparency should be
an organisational norm (Men & Hung-Baesecke, 2015; Parris et al., 2016). Lin et al. (2017)
also stated that consumers want additional, complete and transparent information.
Therefore, the ethical and social values of an organisation with a core value of transparency,
were an essential component in altering consumer perceptions of a brand (Men & Hung-
Baesecke, 2015; Parris et al., 2016; Lin et al., 2017).
According to Parris et al., (2016), the literature indicated that perceptions of organisational
transparency were encouraged by two primary antecedents. Firstly, organisations needed
to provide stakeholders with appropriate and relevant information (Dubbink et al., 2008;
Kaptein, 2008; Kim & Hyun, 2011; Schnackenberg & Tomlinson, 2016). Thus, to assist
consumers during the decision-making process, relevant information had to be available at
that moment in time. Secondly, an organisation must have provided information to
stakeholders, which could have elevated their understanding (Erdem & Swait, 1998; Oehler
& Wendt, 2017). If organisations chose to disclose information to consumers and
31
stakeholders, it was seen as a signal of transparency (Erdem & Swait, 1998; Parris et al.,
2016; Pecot et al., 2018). Therefore, to have increased the perception of transparency,
organisations must have shared relevant, appropriate and understandable information
(Rawlins, 2009; Men, 2014; Men & Hung-Baesecke, 2015; Schnackenberg & Tomilinson,
2016).
Dubbink et al. (2008) offered various economic and ethical arguments about why
transparency was important. Consumers and stakeholders were entitled to information
about organisational behaviour and activities which might have encroached on their welfare
and interest (Keller, 1993; Dubbink et al., 2008; Chaudhuri & Holbrook, 2001; Rawlins; 2008;
Men; 2014). Accordingly, transparency strengthened the attitudes and perceptions of
consumers towards honesty, openness and trustworthiness (Erdem & Swait, 1998; Dubbink
et al., 2008; Rawlins, 2009; Öberseder, Schlegelmilch & Murphy, 2013; Parris et al., 2016;
Oehler & Wendt, 2017).
Furthermore, Men (2014) indicated that transparency was necessary for communication and
signals during the establishment of a strong reputation and consumer-brand relationships
(Keller, 2009; Vaccaro & Echeverri, 2010; Parris et al., 2016). Transparency also raised the
awareness of organisational accountability (Men, 2014; Men & Hung-Baesecke, 2015;
Parris et al., 2016) and responsibility (Kaptein, 2008; Vaccaro & Echeverri et al., 2010).
Moreover, Nyilasy et al. (2014), exhibited the notion that transparency was a key element in
generating favourable consumer response (Öberseder et al., 2013; Parris et al., 2016;
Iglesias et al., 2017).
The interpretation and understanding of transparency were created around the consumers'
proficiency to search for the required information about an organisation (Erdem & Swait,
1998; Zhu, 2004; Williams, 2008; Rawlins, 2009; Schnackenberg & Tomlinson, 2016). Given
the likely benefits brands offer as signals, the quality of the signal was an essential factor
that had a favourable influence on consumer choice within an environment where
uncertainty occurs.
However, Dubbink et al. (2008) also mentioned that increasing transparency had potential
drawbacks for an organisation. Firstly, they argued, that transparency would impact on
information costs of the organisations (Dubbink et al., 2008). Secondly, transparency could
32
not be measured accurately due to divergent and contradictory viewpoints available in the
literature about the definition and dimensions (Schnackenberg & Tomlison, 2016). Finally,
Vaccaro and Echeverri et al. (2010) mentioned several arguments which stated that
disclosure of information would present organisations with a problem. Transparency incited
consumer reproval (Merlo et al., 2018), and therefore have minimal influence on consumer
behaviour. It was also proposed that consumers used information to pressure organisations
(Vaccaro & Echeverri, 2010). Organisations that chased the idea of transparency could
become undistinguished because transparency and disclosure of more information
diminished the tendency of consumers to associate or cooperate with the organisation;
which curtailed future efforts of transparency and disclosure (Vaccaro & Echeverri, 2010).
Dubbink, Graafland and van Liedekerke (2008), substantiated the argument of Vaccaro &
Echeverri (2010) and argued that necessitating full transparency led to organisations not
participate in transparency or reduce compliance.
2.6 Conclusion
The concept of brand equity has been studied from various perspectives and found to be
important in various fields (Keller, 1993; De Chernatony, Harris & Christodoulides, 2004;
Shankar, Azar & Fuller, 2008; Kim & Hyun, 2011; Baalbaki & Guzmán, 2016; Farjam &
Hongyi, 2015; Iglesias et al., 2017; Datta, Ailawadi & van Heerde, 2017). Following the
conceptual work of Keller (1993) and Aaker (1996) on CBBE, substantial advancements
have been made with reference to how consumers define and analyse brands, as well as
consumer perceptions relating to the same brands (De Chernatony et al., 2004; Erdem &
Swait, 1998; Christodoulides, Cadogan & Veloutsou, 2015; Çifci, Ekinci, Whyatt, Japurta,
Molinillo & Siala, 2016; Baalbaki & Guzman, 2016).
It was necessitated by Kim and Hyun (2011) to understand that the individual decision-
making process involved understanding or interpretation of knowledge related to the brands.
Baalbaki and Guzmán (2016) also accentuated that drivers of CBBE were important
characteristics consumer considered when they assessed information. It was also stated
that during uncertainty, consumers were inclined to look for information about brands and
product characteristics prior to making a decision (Chaudhuri & Holbrook, 2001; Hyun Baek
& Whitehill King, 2011).
33
It was further argued that consumers' uncertainty increased, affecting consumer behaviour
and decision-making, if the amount of information available was unnecessary or if the
information was complicated to understand (Erdem & Swait, 1998; Chaudhuri & Holbrook,
2001; Hyun Baek & Whitehill King, 2011), that necessitated clarity. Moreover, as stated by
Erdem et al. (2006), uncertainty arose due to the occurrence of asymmetrical information
between organisations and consumers, which necessitated disclosure.
Hence, the argument is brought forward that transparency, through communication and
information that functions as signals, contributed to brand knowledge through the creation
of consumer awareness and positive associations (Westberg & Pope, 2014). Thus,
transparency, through its dimensions of disclosure, clarity and accuracy, was inferred to aid
consumers’ by increasing their knowledge and decreasing uncertainty during the decision-
making process, ultimately impacting CBBE through consumer behaviour and consumer
perceptions. This research hope to offer an understanding of how consumers consider and
perceive transparent organisations and brands in the food and beverage sector of the FMCG
industry. Research relating to and possible identification of new drivers in the field of CBBE,
along with a review of existing relationships with confirmed drivers can contribute towards
practical implications and provide future scientific purpose (Veloutsou et al., 2013).
34
CHAPTER 3: RESEARCH QUESTION AND HYPOTHESES
Chapter two reviewed literature to date relating to drivers of CBBE and provided an in-depth
discussion of the key construct for this research, transparency. Transparency has not been
favoured in CBBE literature as a construct of choice when studying relationships or impact
various drivers have on CBBE. Therefore, this research study aims to address that gap.
The primary objective of this research was to determine whether transparency was a
significant driver of CBBE within the food and beverage sector of the FMCG industry. In
order to validate transparency as a driver, the researcher chose to compare and measure it
in relation to other drivers. Although the chosen drivers (brand trust, brand image and brand
credibility) was previously already researched as drivers of CBBE, their applicability within
the food and beverage sector of the FMCG industry needed to be established. This was
achieved by examining the strength of the relationships the chosen drivers had with CBBE.
Subsequently, the significance of the relationship between transparency and CBBE was
examined and measured in relation to these drivers.
The following research question was formulated for this study:
Research question: What is the extent to which transparency, relative to drivers identified
in literature, predict CBBE within the food and beverage sector of the FMCG industry?
Hypothesis 1: There is a significant, positive relationship between brand trust and CBBE in
the food and beverage sector of the FMCG environment.
Hypothesis 2: There is a significant, positive relationship between brand image and CBBE
in the food and beverage sector of the FMCG environment.
Hypothesis 3: There is a significant, positive relationship between brand credibility and
CBBE in the food and beverage sector of the FMCG environment.
Hypothesis 4: There is a significant, positive relationship between transparency and CBBE
in the food and beverage sector of the FMCG environment.
35
CHAPTER 4: RESEARCH METHODOLOGY
4.1 Choice of methodology
The primary objective of this research was to determine whether transparency is a significant
driver of CBBE within the food and beverage sector of the FMCG industry. In order for the
researcher to have validated transparency as a driver, it was measured in comparison to
other drivers. Although the chosen drivers (brand trust, brand image and brand credibility)
have been researched as drivers of CBBE, their applicability within the food and beverage
sector of the FMCG industry had to be established. The research was based on the
philosophy of positivism. Positivism permitted the research question to be examined in a
methodical way and in a manner, which could be duplicated, to validate the outcomes
(Saunders, Lewis, & Thornhill, 2009).
A deductive, cross-sectional quantitative research approach was used. The deductive
approach allowed the hypotheses to be formulated using existing theory to test and interpret
various relationships between variables (Saunders, Lewis, & Thornhill, 2009). This research
approach enabled the researcher to set out an explanation of the relationships that exist
between the independent variables (brand trust, brand image, brand credibility and
transparency) and the dependent variable (CBBE). The research was further defined as
quantitative and due to time constraints, cross-sectional. Cross-sectional research allowed
data to be quantified from the chosen sample in a population, at one particular point in time
(Burns & Bush, 2014).
4.2 Population
Burns and Bush (2014) defined a population as the complete group of individuals defined
by the research objectives. According to Zikmund and Babin (2010), to generate beneficial
results, the population had to be interpreted and described accurately. The research
problem defined the universe as food and beverage products within the FMCG sector in the
retail industry. The population for the proposed research was defined as all individual
respondents who were knowledgeable, based on two criteria (i.e. screening questions),
about food and beverage products classified as FMCG in the retail industry. The first was
whether they buy their food and beverage products and the second was how often they
purchase items from this FMCG category. These criteria ensured that respondents were
familiar with brands (Diallo & Lambey-Checchin, 2017).
36
For this study, varied responses were favoured to ensure a combination of different
viewpoints and perceptions (Brunk, 2010) because demographic variables and personality
were said to affect consumer judgements and behaviour (Ingram et al., 2005).
4.3 Scope and unit of analysis
The proposed unit of analysis for this study was brands operating within the food and
beverage category of the fast-moving consumer goods (FMCG) sector in the retail industry.
4.4 Sample size and method
4.4.1 Sample size
A sample, as explained by Burns and Bush (2014), was a sub-section of the population
which was representative of the entire population. The sample size was a small
representation of the population, and was reasoned to be an important element to ensure
that sampling errors were decreased. The FMCG sector was characterised as one of the
biggest industries globally because most of the basic societal needs were met with the
products within the categories. Consequently, the total population knowledgeable about food
and beverage products in the FMCG environment was not possible to determine.
Respondent data was captured in Excel during the duration of the survey, where after IBM
SPSS 25.0 was used for statistical analysis. The number of respondents that gave consent
to participate in the study was 195. The sample, however, as stated in the sample size, must
only include respondents who are active participants in the purchasing process of the
targeted FMCG product category. The first screening question (see Appendix A: Section A:
A1) eliminated six respondents because they did not purchase their food and beverage
products. The second screening question (see Appendix A: Section A: A2) eliminated three
respondents because they indicated that they only buy food and beverage products
occasionally or seldom.
Statistically, according to Hair, Black, Babin and Anderson (2010) the ideal sample size must
be at least 180 respondents. The sample upon which the analysis was conducted was 186.
However, obtaining a larger sample size would have been more representative. A sample
error could not be reported, because the methods employed for data collection (i.e.
convenience and snowball sampling) could not track the amount of initial potential
respondents that forwarded the questionnaire.

37
4.4.2 Sample method
For this research, non-probability convenience and snowball sampling were used, because
the population or sample frame knowledgeable about food and beverage products in the
FMCG environment was unknown. Non-probability sampling eluded to respondents being
selected based on the personal, subjective judgement of the researcher, and the probability
of choosing a respondent from the population to represent the sample was unknown (Burns
& Bush, 2014; Zikmund & Babin, 2010). The method and selection technique were debated
as innately biased. Convenience sampling was described as a method which involved
selecting and sampling respondents that were conveniently available. Snowball sampling
was also used to gather a more significant number of completed questionnaires quicker and
more economically (Zikmund & Babin, 2010). The sample of respondents required variation
by age, gender, population group, education and income (Brunk & Blumelhuber, 2011).
However, the sampling method did not facilitate an entirely diverse socio-demographic
sample size.
The number of respondents that gave consent to participate in the study was 195. The
sample size only included respondents who are active participants in the purchasing process
of the targeted FMCG product category. The first screening question (see Appendix A:
Section A: A1) eliminated six respondents because they did not purchase their food and
beverage products. The second screening question (see Appendix A: Section A: A2)
eliminated three respondents because they indicated that they only buy food and beverage
products occasionally or seldom. Therefore, the sample upon which the analysis was
conducted was 186, which is above the calculated sample-size value.
4.5 Measurement Instrument
Due to limited time frames, financial considerations, and the amounts of data required, the
researcher made use of an online, self-administered survey questionnaire. A copy of the
questionnaire used for the research is included in Appendix A.
According to Zikmund and Babin (2010) various biases, such as self-selection and response
bias, impact the quality of data collected. During the design phase of the questionnaire,
various constituents were implemented to minimise the likelihood of response biases
(Dwivedi, Wilkie, Johnson & Weerawardena, 2016). Response bias was reduced by the pre-
test and taking various other factors into account; these included correct phrasing of
38
questions, using simple and clear language, avoid leading, ambiguous and difficult
questions and considering question placement (Zikmund & Babin, 2010; Morhart et al.,
2015). To prevent common method bias, the Likert scale included an option of “neutral”, if
respondents felt incapable of accurately answering a specific question (Nierobisch et al.,
2017).
Subject bias, explained as unreliable information provided by respondents due to their fear
of how the information they have given will represent them, could influence the results of the
research. This bias was reduced by stating in the consent form that all data collected was
anonymous, and it was not possible to identify individual respondents.
4.5.1 Design and pre-test of the questionnaire
The self-administered questionnaire was the pivotal element in this research. As already
mentioned, the design of the questionnaire could affect the quality of the collected data
(Zikmund & Babin, 2010). To ensure the validity of the questionnaire, all constructs and
scale measurements were obtained from previous literature and adapted for this research.
The questionnaire was also assessed using a pre-test, which was conducted using a
convenience sample of ten predetermined representative respondents (Westberg & Pope,
2014). It was expected of pre-test respondents to identify terms, expressions, requirements
and question placements which create difficulty in understanding the questionnaire by
respondents (Morhart et al., 2015; Holland et al., 2018).
Feedback from the pre-test highlighted the fact that not all respondents understood and
knew the concepts, which decreased understanding and would reduce data quality. To
negate this, a short explanation was added above each section within the questionnaire.
Various questions were also flagged as repetitive and subsequently omitted from the final
questionnaire. While the length of the questionnaire was not considered a problem during
the pilot-study, during analysis of the data missing values increased during the final sections
which might indicate respondent fatigue.
4.5.2 Construct and scales
For this research, transparency and various drivers of CBBE were measured. The
measurement scales selected for the survey were adapted from literature, which were
extensively researched and used, to fit the context of this research. However, reliability and
39
validity of the items needed to be evaluated during analysis to ensure scale validity after
adaptation.
The questionnaire consisted of the following sections (see Appendix A):
Section A: Screening questions
Section B: Socio-demographic characteristics - Adapted from Diallo and Lambey-Checchin,
(2017),
Section C: Customer-based brand equity - Adapted from Çifci et al. (2016),
Section D: Brand loyalty - Adapted from Christodoulides et al. (2015),
Section E: Brand awareness - Adapted from Christodoulides et al. (2015),
Section F: Brand associations - Adapted from Christodoulides et al. (2015),
Section G: Perceived quality - Adapted from Christodoulides et al. (2015),
Section H: Brand trust - Adapted from Kang and Hustvedt (2014),
Section I: Brand image - Adapted from Iglesias et al. (2017),
Section J: Brand credibility - Adapted from Ng et al. (2014),
Section K: Transparency - Adapted from Kang and Hustvedt (2014),
All respondents initially answered screening or filtering questions (see Appendix A: Section
A), which were intended to ensure that they have purchased food and beverage products
within the FMCG industry (Iglesias et al., 2017; Ng et al., 2014). The questionnaire further
consisted of the ten sections (see Appendix A); however, only a few selected drivers of
CBBE, which included brand trust, brand image, brand credibility and transparency, were
selected for the analysis process.
Section B included a socio-demographic scale, adapted from Diallo and Lambey-Checchin,
(2017). This scale measurement only included properties of characteristic description,
classified as a nominal scale, which aimed to identify and describe each respondent (Burns
& Bush, 2014). The objective of the socio-demographic measurement scale was binary.
Foremost, to screen respondents, ensuring that respondents met the prerequisites
stipulated in the sample. Additionally, to describe the characteristics of the chosen
population through statistical analysis (Iglesias et al., 2017; Dwivedi et al., 2016).
The remaining sections contained questions with Likert scale answers. All constructs in this
research were completed by selecting between various degrees of agreement on 5-point
40
Likert scales, ranging from 1 (“strongly disagree”) to 5 (“strongly agree”). Likert scale use is
commonplace, and respondents were instructed to exhibit their level of agreement on a
Likert scale according to the level of agreement or disagreement with the provided
questions.
4.6 Data collection
Data collection involved sending out the self-administered, online questionnaire. A survey
(i.e. questionnaire) was explained by Zikmund and Babin (2010), as a technique for
gathering primary data from the selected sample at a specific point in time. Data collection
could not commence before ethical clearance was obtained from the research committee
(see Appendix B) The research aimed to cover a wide geographical area, hence, an online,
self-administered questionnaire was the selected method of data collection. According to
Burns and Bush (2014), employing the survey technique provided the researcher with the
ability to collect considerable quantities of data covering a wide geographical area in an
inexpensive and effectual way.
The respondents were selected using convenience, non-probability sampling. Respondents
formed part of the researcher’s network and associates because it provided the easiest and
most convenient way to gather the primary data needed. Low response rates, created the
possibility that the results were not relevant, and was mitigated through individual contact
with respondents within the researcher’s network via instant messaging and email,
requesting participation in the research as well as assistance in reaching more respondents
by sending on the request.
4.7 Data Analysis
4.7.1 Descriptive statistics
To enable the researcher to describe the characteristics of the population, basic descriptive
statistics were utilised to translate the data. Simple statistical analysis methods and
descriptive statistics allowed the researcher to represent and condense the large volumes
of data collected (Zikmund & Babin, 2010). These basic descriptive characteristics included
measures of the mean, standard deviations and medians for each construct. It further
allowed inferences to be made about the validity and reliability of the measuring instruments
and variables.
41
4.7.2 Exploratory factor analysis
Factor analysis was a statistical technique employed by the researcher to explain the
variability of empirical correlated variables, and had the ability to reduce the number of
variables used in the regression model (Yoo et al., 2000; Ng et al., 2014). The items for each
scale were adapted from existing scales, altering their validity and reliability, causing the
scale to become new. Therefore, exploratory factor analysis (EFA) was used.
The assumptions of factor analysis were as follow: the sample size must be above 150.
Review of the correlation matrix must reveal coefficients with values of 0.3 and higher. The
Keiser-Meyer-Olkin (KMO) value must be greater than the prescribed value of 0.6 and
Bartlett’s Test for Sphericity must be significant (Sig. < .05), which will support the
factorability of the of the data (Pallant, 2013; Ng et al., 2014).
4.7.3 Validity
Validity was described as the measure of how precise a measurement scale was (Saunders,
Lewis, & Thornhill, 2009). The content validity of the questionnaire was assessed in the pre-
test to ensure that all the constructs, the format and the various measurements represented
each construct. To validate the suitability of the scale items, the researcher also considered
the convergent validity through item reliability and construct reliability as suggested by
Zikmund and Babin (2010). Factor analysis was employed to evaluate convergent validity,
during which the item reliability was evaluated in accordance with the factor loadings of each
item on the particular constructs. Construct reliability was evaluated using Cronbach’s Alpha
coefficients.
4.7.4 Reliability
Reliability was defined as a marker of measurement scales internal consistency (Zikmund
& Babin, 2010). A measure could only be reliable when it was measured using various
attempts, and the results coincided. Pallant (2013) discussed that the reliability of a
measurement scale was dependent on the sample in which it was used. It was consequently
required to measure the reliability of each scale within the FMCG industry sample obtained.
Internal consistency was measured using Cronbach’s Alpha (Ingram et al., 2005; He & Lai,
2014, Iglesias et al., 2017; Kang & Hustvedt, 2014). Cronbach’s alpha compared responses
to the various items of a construct to the other items measuring the same construct.
42
Research studies implied that a level greater than 0.70 is adequate, although higher levels
are preferred (Ingram, et al., 2005; He & Lai, 2014).
However, it was indicated that Cronbach’s alpha values were sensitive to the number of
items relating to individual constructs of the measurement scale. Scales with fewer than ten
items, such as used in this research, commonly presented values lower than 0.7 (Pallant,
2013). Consequently, the interim correlation output had to be analysed, whereby it was
implied by Pallant (2013), that the output values must fall inside the range of 0.2 to 0.4.
4.7.5 Correlation analysis
Correlation analysis was used to quantify the relationship between the selected variables,
in addition to measurement the strength of that relationship (Cretu & Brodie, 2007; Rawlins,
2008; Saunders, Lewis, & Thornhill, 2009; Pappu & Quester, 2016). Correlation analysis
explained the extent to which shifts in one variable were associated with shifts in another
(Saunders et al., 2009) using the Pearson correlation coefficient. The Pearson correlation
coefficient could solely be represented by values between -1 and 1. Positive values indicate
a positive correlation (if one variable increases, the other also increases) and negative
values indicate a negative correlation (if one variable increases the other decreases). A
coefficient of zero indicates that no linear relationship existed amid chosen constructs.
Correlation analysis was performed using brand trust, brand image, brand credibility and
transparency as independent variables to establish and understand the nature of their
relationships with CBBE, the dependent variable.
The following assumptions were a pre-requisite for correlation analysis and were tested for
as part of the analysis. Pallant (2013) addressed the assumption that the two variables
tested need to have a linear relationship. Furthermore, there must be no significant outliers;
no multicollinearity must exist between variables and data must be normally distributed. The
correlation analysis results can be found in Chapter five (Section 5.5).
4.7.6 Multiple regression analysis
Regression analysis was defined as a statistical technique used to examine and estimate
the relationship between a dependent and an independent variable (Burns & Bush, 2014;
Davari & Strutton, 2014). In this research, multiple linear regression was used to calculate
the relationship that existed between the identified independent variables and the
43
dependent variable (Men & Hung-Baesecke, 2015). Multiple regression aided the
researcher in determining if brand trust, brand image, brand credibility and transparency (i.e.
independent variables) adequately predicted the outcome of CBBE (i.e. dependent
variable). It also allowed the researcher to identify which of the independent variables were
significant drivers of the CBBE (Delgado-Ballester & Luis Munuera-Alemán, 2001).
Regression analysis had the following assumptions, which were tested for as part of the
analysis. Pallant (2013) addressed sample size, multicollinearity, outliers, distribution and
normality, homogeneity of variances and linearity as assumptions of multiple regression
analysis. Any case with missing data on any variable was omitted during the regression
analysis. Multiple regression also required non-violation of the multicollinearity assumption
which was confirmed through variance inflation factor (VIF) values above 10 and tolerance
values higher than 0.1 (Pallant, 2013). Normal distribution of data was confirmed through
histograms (see Appendix C) and scatter plots (see Appendix D).
The results were explained by referring to the standardised regression coefficient (β), which
provided a standard metric for the comparison of regression results regardless of the original
scale range (Zikmund et al., 2009). All assumptions were addressed as a means to confirm
the validity of the regression analysis. The multiple regression results for the assumptions
mentioned above can be found in Chapter five (Section 5.6). Testing was done at a 95%
confidence interval.
4.8 Limitations
Given that it was imperative that the methodology used by the researcher is suitable and
explained by means of logical and compelling explanations, it was recognised that there
were certain circumstances in which the context and the method used to put forward
limitations of the study. These limitations are discussed below.
Research design: Due to the research design employing non-probability sampling, the
results of the research were not generalisable. Further, because of convenience sampling,
self-selection bias was a limitation caused by the data being overrepresented by
respondents who were indifferent. The method of convenience sampling also excluded
households with a lower income due to inaccessibility, although their consumption of and
44
spending on food and beverages in the FMCG environment might represent a higher share
of their total monthly expenses.
Data collection method: With self-administered online questionnaires, there was a likelihood
of response errors (i.e., non-response bias and response bias) being present in the data.
Although the self-administered questionnaire was anonymous, consumers perceive
themselves to be loyal to a brand, in the current uncertain economic conditions response
bias could have (i.e. deliberate falsification of responses) occurred. Consumers could
deliberately falsify answers to hide personal information and to circumvent embarrassment.
45
CHAPTER 5: RESULTS
5.1 Introduction
This chapter recapitulates the results of the research in accordance with the responses
received from the online self-administered questionnaire. This research sought to determine
whether transparency is a significant driver, relative to other drivers, of CBBE within the food
and beverage sector of the FMCG industry. This chapter provides insights into the context
of the respondent population through sample distributions of the demographic variables and
descriptive statistics, with a subsequent analysis of the reliability and validity of the items of
the measurement scale and concludes with the output of the multiple regression analysis.
The number of respondents that gave consent to participate in the study was 195. The
sample size as stipulated in Chapter four, however, should only include respondents who
are active participants in the purchasing process of the targeted FMCG product category.
The first screening question (see Appendix A: Section A: A1) eliminated six respondents
because they did not purchase their food and beverage products. The second screening
question (see Appendix A: Section A: A2) eliminated three respondents because they
indicated that they only buy food and beverage products occasionally or seldom. Therefore,
the sample upon which the analysis was conducted was 186.
5.2 Descriptive statistics
Descriptive statistics enabled the researcher to generate context with regard to the sample.
The purpose of the descriptive analysis was to demonstrate that the sample obtained during
data collection was a good representation of the target population.
5.2.1 Sample socio-demographic characteristics
Section 5.2.1 exhibits the sample distribution using the socio-demographic characteristics
of gender, age, population group, income and education. The distribution of socio-
demographic characteristics is attributed to the sampling methods (convenience and
snowball sampling) used. The data reflects the researcher’s network, which mainly consists
of industry professionals and specialists.
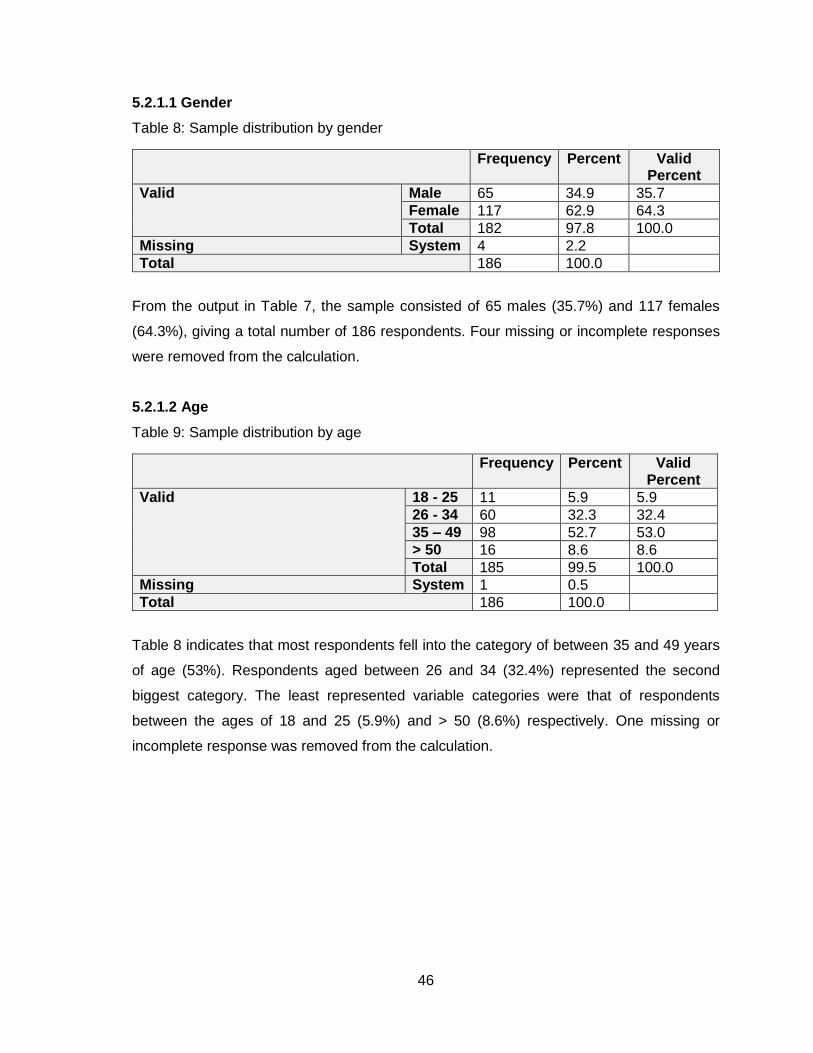
46
5.2.1.1 Gender
Table 8: Sample distribution by gender
Frequency Percent Valid Percent
Valid Male 65 34.9 35.7
Female 117 62.9 64.3
Total 182 97.8 100.0
Missing System 4 2.2
Total 186 100.0
From the output in Table 7, the sample consisted of 65 males (35.7%) and 117 females
(64.3%), giving a total number of 186 respondents. Four missing or incomplete responses
were removed from the calculation.
5.2.1.2 Age
Table 9: Sample distribution by age
Frequency Percent Valid Percent
Valid 18 - 25 11 5.9 5.9
26 - 34 60 32.3 32.4
35 – 49 98 52.7 53.0
> 50 16 8.6 8.6
Total 185 99.5 100.0
Missing System 1 0.5
Total 186 100.0
Table 8 indicates that most respondents fell into the category of between 35 and 49 years
of age (53%). Respondents aged between 26 and 34 (32.4%) represented the second
biggest category. The least represented variable categories were that of respondents
between the ages of 18 and 25 (5.9%) and > 50 (8.6%) respectively. One missing or
incomplete response was removed from the calculation.
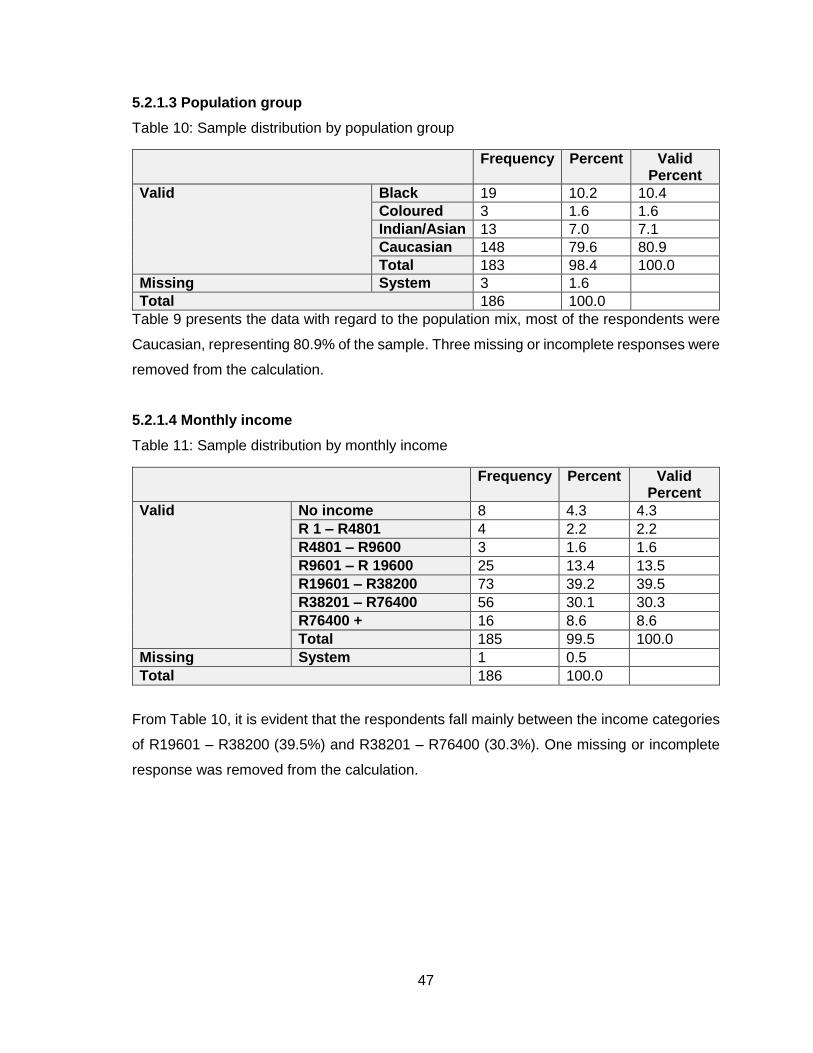
47
5.2.1.3 Population group
Table 10: Sample distribution by population group
Frequency Percent Valid Percent
Valid Black 19 10.2 10.4
Coloured 3 1.6 1.6
Indian/Asian 13 7.0 7.1
Caucasian 148 79.6 80.9
Total 183 98.4 100.0
Missing System 3 1.6
Total 186 100.0
Table 9 presents the data with regard to the population mix, most of the respondents were
Caucasian, representing 80.9% of the sample. Three missing or incomplete responses were
removed from the calculation.
5.2.1.4 Monthly income
Table 11: Sample distribution by monthly income
Frequency Percent Valid Percent
Valid No income 8 4.3 4.3
R 1 – R4801 4 2.2 2.2
R4801 – R9600 3 1.6 1.6
R9601 – R 19600 25 13.4 13.5
R19601 – R38200 73 39.2 39.5
R38201 – R76400 56 30.1 30.3
R76400 + 16 8.6 8.6
Total 185 99.5 100.0
Missing System 1 0.5
Total 186 100.0
From Table 10, it is evident that the respondents fall mainly between the income categories
of R19601 – R38200 (39.5%) and R38201 – R76400 (30.3%). One missing or incomplete
response was removed from the calculation.
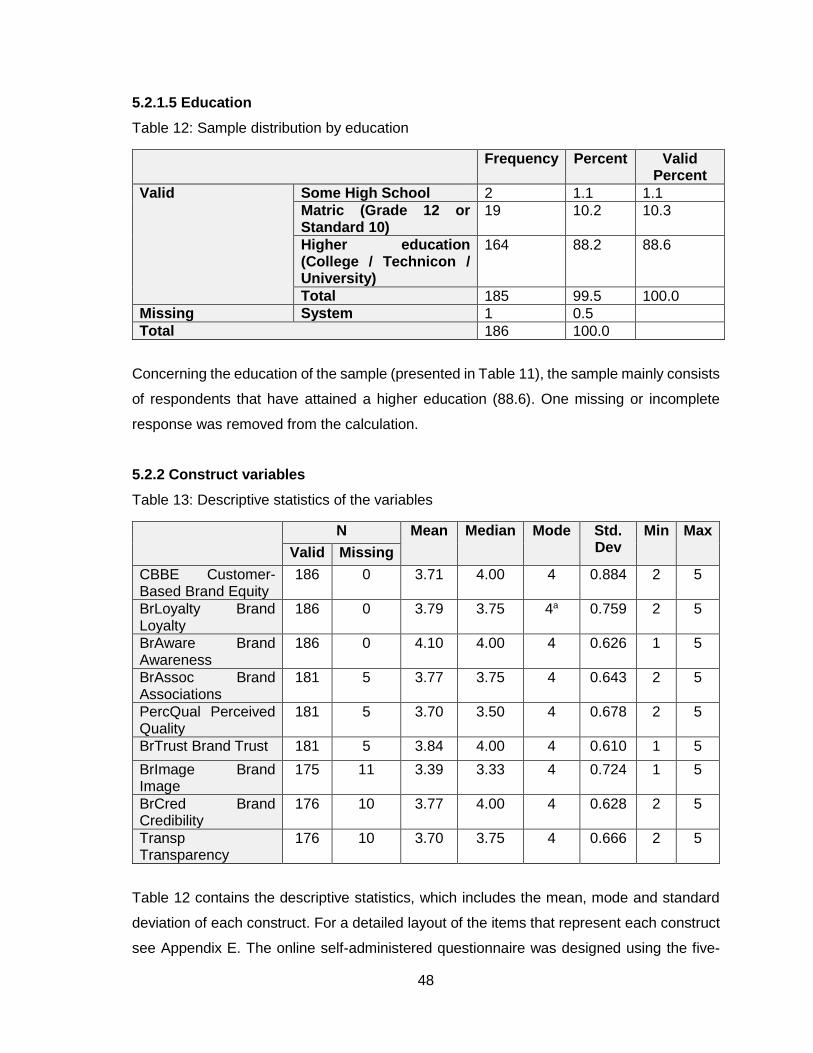
48
5.2.1.5 Education
Table 12: Sample distribution by education
Frequency Percent Valid Percent
Valid Some High School 2 1.1 1.1
Matric (Grade 12 or Standard 10)
19 10.2 10.3
Higher education (College / Technicon / University)
164 88.2 88.6
Total 185 99.5 100.0
Missing System 1 0.5
Total 186 100.0
Concerning the education of the sample (presented in Table 11), the sample mainly consists
of respondents that have attained a higher education (88.6). One missing or incomplete
response was removed from the calculation.
5.2.2 Construct variables
Table 13: Descriptive statistics of the variables
N Mean Median Mode Std. Dev
Min Max
Valid Missing
CBBE Customer-Based Brand Equity
186 0 3.71 4.00 4 0.884 2 5
BrLoyalty Brand Loyalty
186 0 3.79 3.75 4a 0.759 2 5
BrAware Brand Awareness
186 0 4.10 4.00 4 0.626 1 5
BrAssoc Brand Associations
181 5 3.77 3.75 4 0.643 2 5
PercQual Perceived Quality
181 5 3.70 3.50 4 0.678 2 5
BrTrust Brand Trust 181 5 3.84 4.00 4 0.610 1 5
BrImage Brand Image
175 11 3.39 3.33 4 0.724 1 5
BrCred Brand Credibility
176 10 3.77 4.00 4 0.628 2 5
Transp Transparency
176 10 3.70 3.75 4 0.666 2 5
Table 12 contains the descriptive statistics, which includes the mean, mode and standard
deviation of each construct. For a detailed layout of the items that represent each construct
see Appendix E. The online self-administered questionnaire was designed using the five-
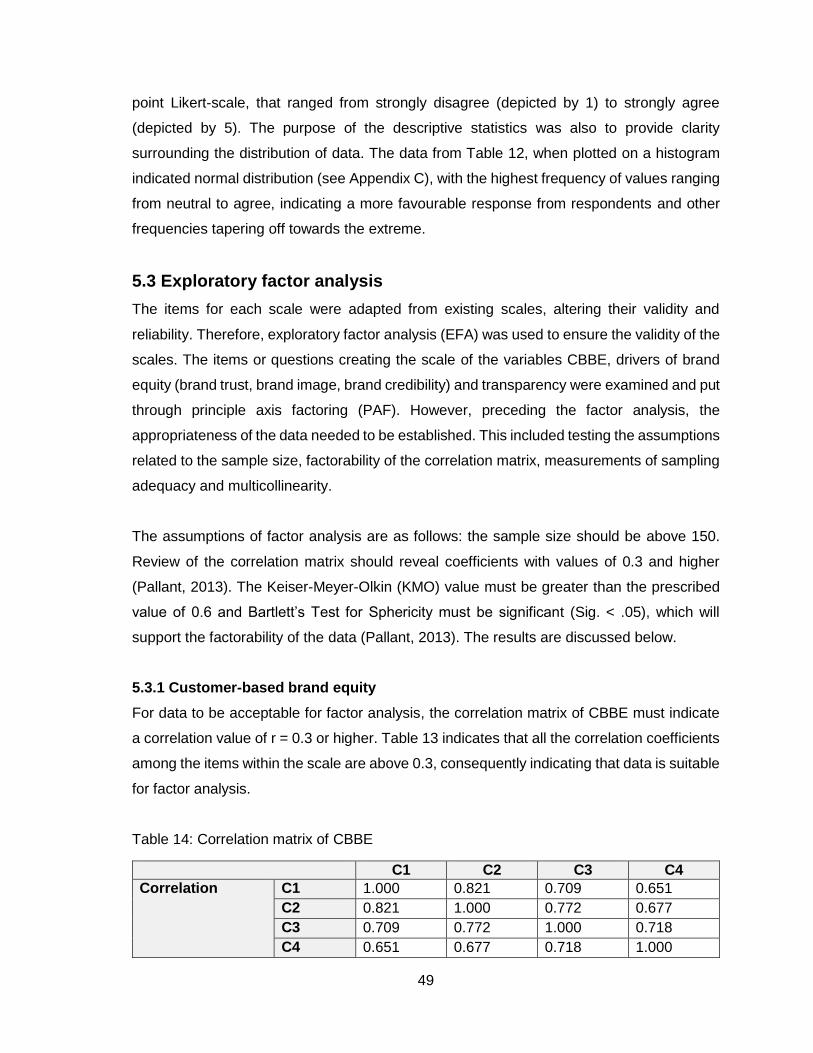
49
point Likert-scale, that ranged from strongly disagree (depicted by 1) to strongly agree
(depicted by 5). The purpose of the descriptive statistics was also to provide clarity
surrounding the distribution of data. The data from Table 12, when plotted on a histogram
indicated normal distribution (see Appendix C), with the highest frequency of values ranging
from neutral to agree, indicating a more favourable response from respondents and other
frequencies tapering off towards the extreme.
5.3 Exploratory factor analysis
The items for each scale were adapted from existing scales, altering their validity and
reliability. Therefore, exploratory factor analysis (EFA) was used to ensure the validity of the
scales. The items or questions creating the scale of the variables CBBE, drivers of brand
equity (brand trust, brand image, brand credibility) and transparency were examined and put
through principle axis factoring (PAF). However, preceding the factor analysis, the
appropriateness of the data needed to be established. This included testing the assumptions
related to the sample size, factorability of the correlation matrix, measurements of sampling
adequacy and multicollinearity.
The assumptions of factor analysis are as follows: the sample size should be above 150.
Review of the correlation matrix should reveal coefficients with values of 0.3 and higher
(Pallant, 2013). The Keiser-Meyer-Olkin (KMO) value must be greater than the prescribed
value of 0.6 and Bartlett’s Test for Sphericity must be significant (Sig. < .05), which will
support the factorability of the data (Pallant, 2013). The results are discussed below.
5.3.1 Customer-based brand equity
For data to be acceptable for factor analysis, the correlation matrix of CBBE must indicate
a correlation value of r = 0.3 or higher. Table 13 indicates that all the correlation coefficients
among the items within the scale are above 0.3, consequently indicating that data is suitable
for factor analysis.
Table 14: Correlation matrix of CBBE
C1 C2 C3 C4
Correlation C1 1.000 0.821 0.709 0.651
C2 0.821 1.000 0.772 0.677
C3 0.709 0.772 1.000 0.718
C4 0.651 0.677 0.718 1.000
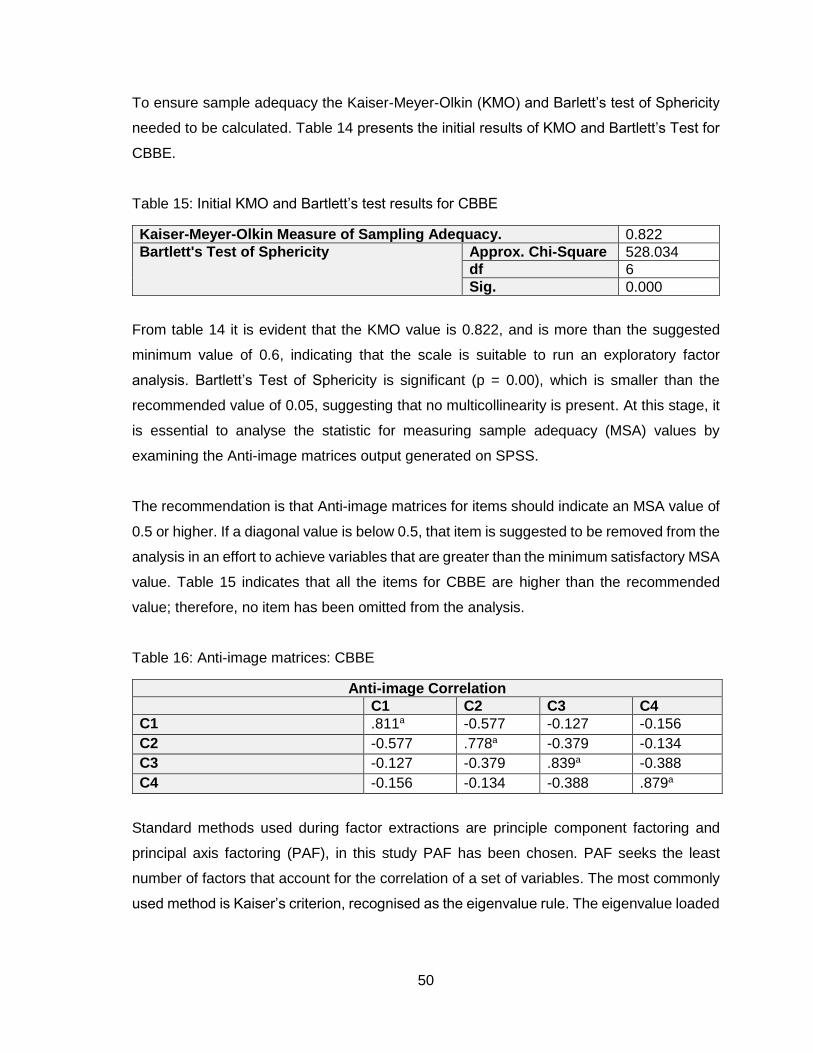
50
To ensure sample adequacy the Kaiser-Meyer-Olkin (KMO) and Barlett’s test of Sphericity
needed to be calculated. Table 14 presents the initial results of KMO and Bartlett’s Test for
CBBE.
Table 15: Initial KMO and Bartlett’s test results for CBBE
Kaiser-Meyer-Olkin Measure of Sampling Adequacy. 0.822
Bartlett's Test of Sphericity Approx. Chi-Square 528.034
df 6
Sig. 0.000
From table 14 it is evident that the KMO value is 0.822, and is more than the suggested
minimum value of 0.6, indicating that the scale is suitable to run an exploratory factor
analysis. Bartlett’s Test of Sphericity is significant (p = 0.00), which is smaller than the
recommended value of 0.05, suggesting that no multicollinearity is present. At this stage, it
is essential to analyse the statistic for measuring sample adequacy (MSA) values by
examining the Anti-image matrices output generated on SPSS.
The recommendation is that Anti-image matrices for items should indicate an MSA value of
0.5 or higher. If a diagonal value is below 0.5, that item is suggested to be removed from the
analysis in an effort to achieve variables that are greater than the minimum satisfactory MSA
value. Table 15 indicates that all the items for CBBE are higher than the recommended
value; therefore, no item has been omitted from the analysis.
Table 16: Anti-image matrices: CBBE
Anti-image Correlation
C1 C2 C3 C4
C1 .811a -0.577 -0.127 -0.156
C2 -0.577 .778a -0.379 -0.134
C3 -0.127 -0.379 .839a -0.388
C4 -0.156 -0.134 -0.388 .879a
Standard methods used during factor extractions are principle component factoring and
principal axis factoring (PAF), in this study PAF has been chosen. PAF seeks the least
number of factors that account for the correlation of a set of variables. The most commonly
used method is Kaiser’s criterion, recognised as the eigenvalue rule. The eigenvalue loaded
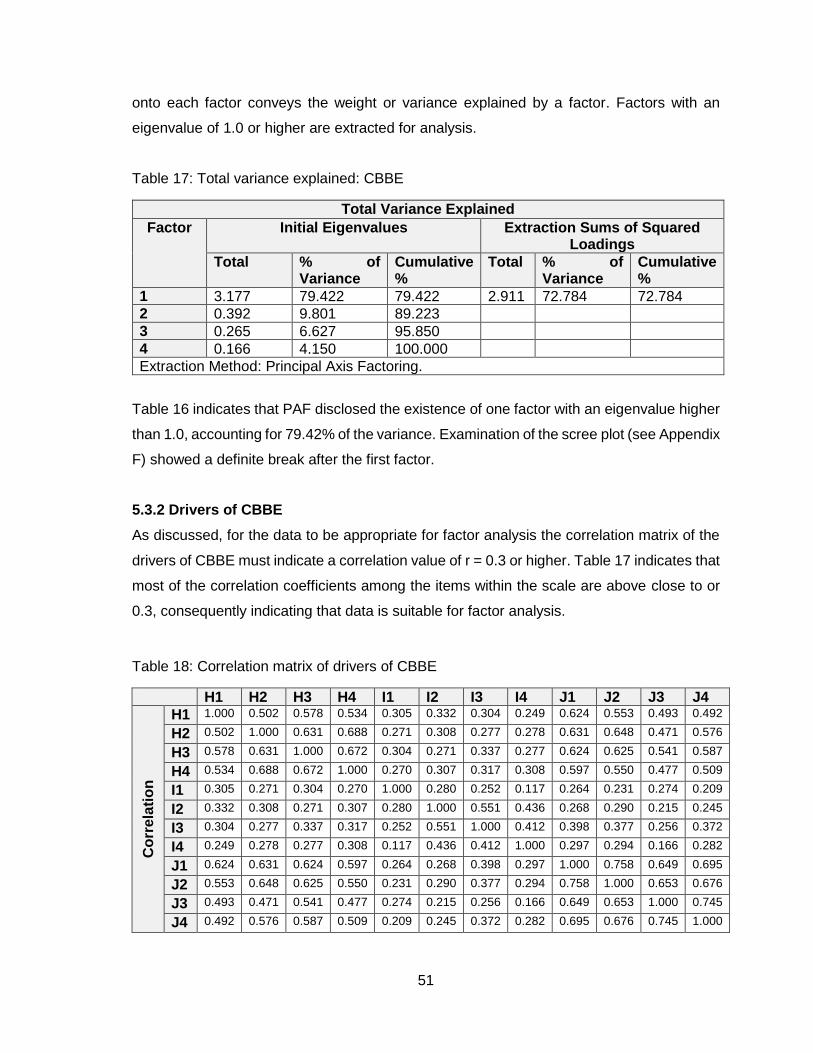
51
onto each factor conveys the weight or variance explained by a factor. Factors with an
eigenvalue of 1.0 or higher are extracted for analysis.
Table 17: Total variance explained: CBBE
Total Variance Explained
Factor Initial Eigenvalues Extraction Sums of Squared Loadings
Total % of Variance
Cumulative %
Total % of Variance
Cumulative %
1 3.177 79.422 79.422 2.911 72.784 72.784
2 0.392 9.801 89.223
3 0.265 6.627 95.850
4 0.166 4.150 100.000
Extraction Method: Principal Axis Factoring.
Table 16 indicates that PAF disclosed the existence of one factor with an eigenvalue higher
than 1.0, accounting for 79.42% of the variance. Examination of the scree plot (see Appendix
F) showed a definite break after the first factor.
5.3.2 Drivers of CBBE
As discussed, for the data to be appropriate for factor analysis the correlation matrix of the
drivers of CBBE must indicate a correlation value of r = 0.3 or higher. Table 17 indicates that
most of the correlation coefficients among the items within the scale are above close to or
0.3, consequently indicating that data is suitable for factor analysis.
Table 18: Correlation matrix of drivers of CBBE
H1 H2 H3 H4 I1 I2 I3 I4 J1 J2 J3 J4
Co
rre
lati
on
H1 1.000 0.502 0.578 0.534 0.305 0.332 0.304 0.249 0.624 0.553 0.493 0.492
H2 0.502 1.000 0.631 0.688 0.271 0.308 0.277 0.278 0.631 0.648 0.471 0.576
H3 0.578 0.631 1.000 0.672 0.304 0.271 0.337 0.277 0.624 0.625 0.541 0.587
H4 0.534 0.688 0.672 1.000 0.270 0.307 0.317 0.308 0.597 0.550 0.477 0.509
I1 0.305 0.271 0.304 0.270 1.000 0.280 0.252 0.117 0.264 0.231 0.274 0.209
I2 0.332 0.308 0.271 0.307 0.280 1.000 0.551 0.436 0.268 0.290 0.215 0.245
I3 0.304 0.277 0.337 0.317 0.252 0.551 1.000 0.412 0.398 0.377 0.256 0.372
I4 0.249 0.278 0.277 0.308 0.117 0.436 0.412 1.000 0.297 0.294 0.166 0.282
J1 0.624 0.631 0.624 0.597 0.264 0.268 0.398 0.297 1.000 0.758 0.649 0.695
J2 0.553 0.648 0.625 0.550 0.231 0.290 0.377 0.294 0.758 1.000 0.653 0.676
J3 0.493 0.471 0.541 0.477 0.274 0.215 0.256 0.166 0.649 0.653 1.000 0.745
J4 0.492 0.576 0.587 0.509 0.209 0.245 0.372 0.282 0.695 0.676 0.745 1.000
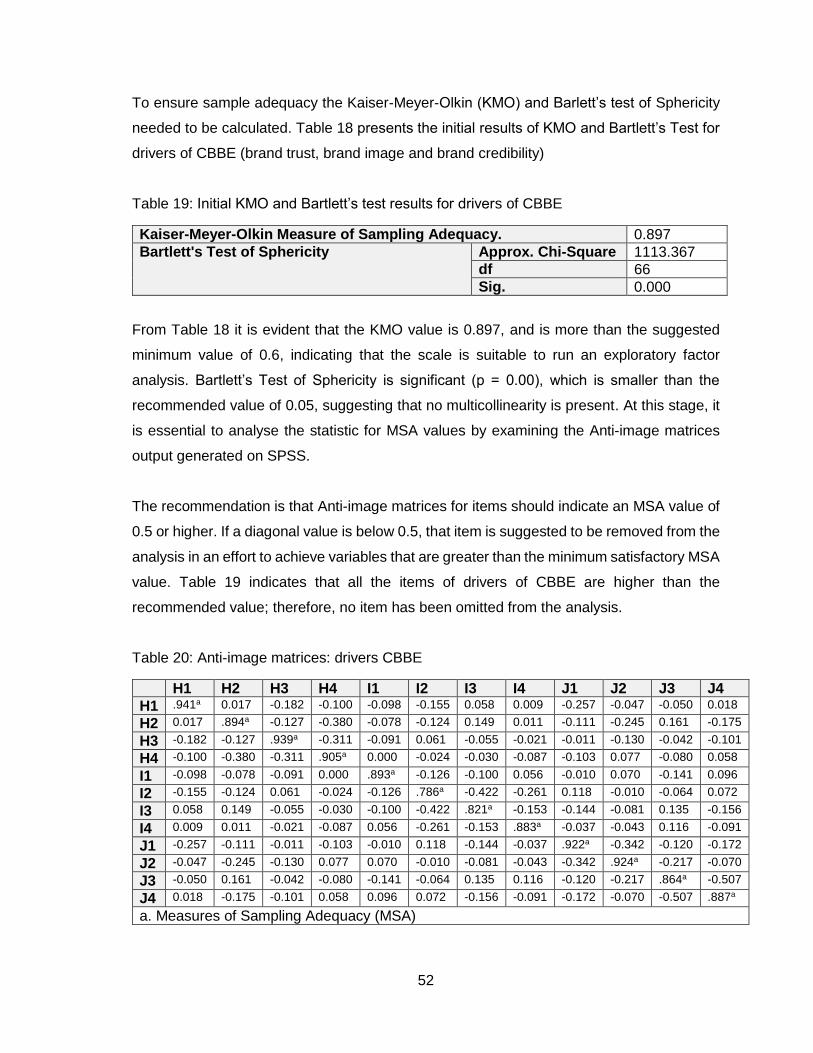
52
To ensure sample adequacy the Kaiser-Meyer-Olkin (KMO) and Barlett’s test of Sphericity
needed to be calculated. Table 18 presents the initial results of KMO and Bartlett’s Test for
drivers of CBBE (brand trust, brand image and brand credibility)
Table 19: Initial KMO and Bartlett’s test results for drivers of CBBE
Kaiser-Meyer-Olkin Measure of Sampling Adequacy. 0.897
Bartlett's Test of Sphericity Approx. Chi-Square 1113.367
df 66
Sig. 0.000
From Table 18 it is evident that the KMO value is 0.897, and is more than the suggested
minimum value of 0.6, indicating that the scale is suitable to run an exploratory factor
analysis. Bartlett’s Test of Sphericity is significant (p = 0.00), which is smaller than the
recommended value of 0.05, suggesting that no multicollinearity is present. At this stage, it
is essential to analyse the statistic for MSA values by examining the Anti-image matrices
output generated on SPSS.
The recommendation is that Anti-image matrices for items should indicate an MSA value of
0.5 or higher. If a diagonal value is below 0.5, that item is suggested to be removed from the
analysis in an effort to achieve variables that are greater than the minimum satisfactory MSA
value. Table 19 indicates that all the items of drivers of CBBE are higher than the
recommended value; therefore, no item has been omitted from the analysis.
Table 20: Anti-image matrices: drivers CBBE
H1 H2 H3 H4 I1 I2 I3 I4 J1 J2 J3 J4
H1 .941a 0.017 -0.182 -0.100 -0.098 -0.155 0.058 0.009 -0.257 -0.047 -0.050 0.018
H2 0.017 .894a -0.127 -0.380 -0.078 -0.124 0.149 0.011 -0.111 -0.245 0.161 -0.175
H3 -0.182 -0.127 .939a -0.311 -0.091 0.061 -0.055 -0.021 -0.011 -0.130 -0.042 -0.101
H4 -0.100 -0.380 -0.311 .905a 0.000 -0.024 -0.030 -0.087 -0.103 0.077 -0.080 0.058
I1 -0.098 -0.078 -0.091 0.000 .893a -0.126 -0.100 0.056 -0.010 0.070 -0.141 0.096
I2 -0.155 -0.124 0.061 -0.024 -0.126 .786a -0.422 -0.261 0.118 -0.010 -0.064 0.072
I3 0.058 0.149 -0.055 -0.030 -0.100 -0.422 .821a -0.153 -0.144 -0.081 0.135 -0.156
I4 0.009 0.011 -0.021 -0.087 0.056 -0.261 -0.153 .883a -0.037 -0.043 0.116 -0.091
J1 -0.257 -0.111 -0.011 -0.103 -0.010 0.118 -0.144 -0.037 .922a -0.342 -0.120 -0.172
J2 -0.047 -0.245 -0.130 0.077 0.070 -0.010 -0.081 -0.043 -0.342 .924a -0.217 -0.070
J3 -0.050 0.161 -0.042 -0.080 -0.141 -0.064 0.135 0.116 -0.120 -0.217 .864a -0.507
J4 0.018 -0.175 -0.101 0.058 0.096 0.072 -0.156 -0.091 -0.172 -0.070 -0.507 .887a
a. Measures of Sampling Adequacy (MSA)
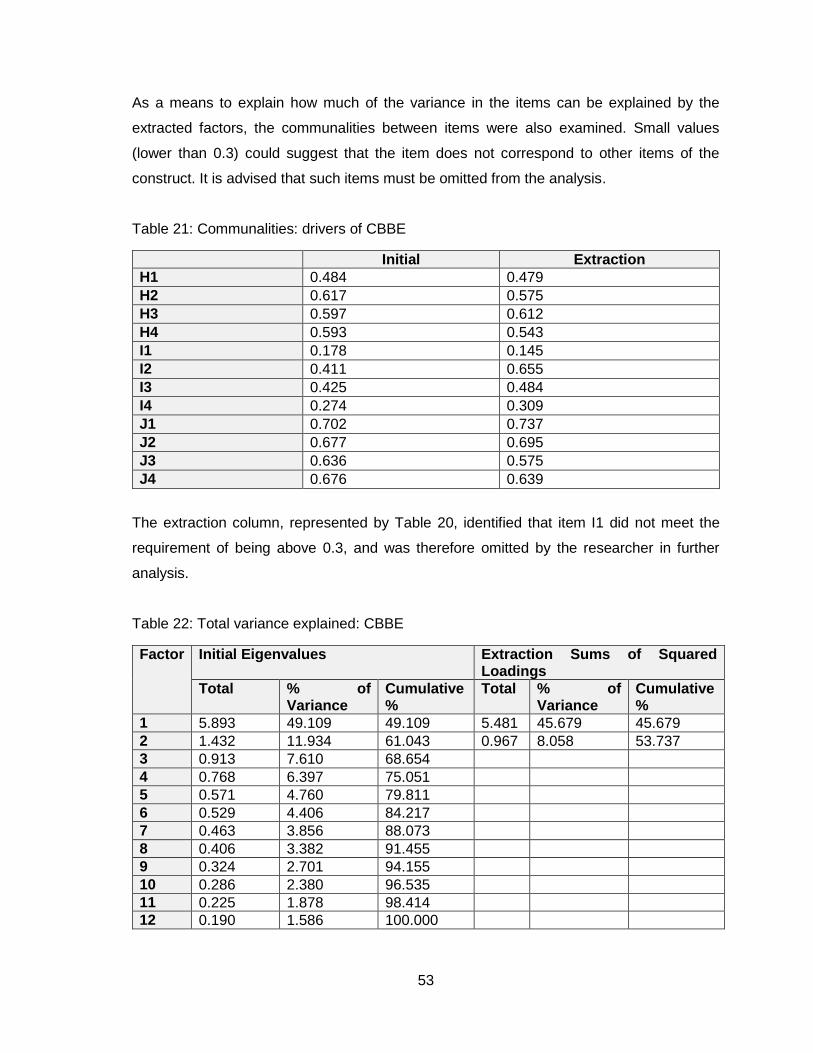
53
As a means to explain how much of the variance in the items can be explained by the
extracted factors, the communalities between items were also examined. Small values
(lower than 0.3) could suggest that the item does not correspond to other items of the
construct. It is advised that such items must be omitted from the analysis.
Table 21: Communalities: drivers of CBBE
Initial Extraction
H1 0.484 0.479
H2 0.617 0.575
H3 0.597 0.612
H4 0.593 0.543
I1 0.178 0.145
I2 0.411 0.655
I3 0.425 0.484
I4 0.274 0.309
J1 0.702 0.737
J2 0.677 0.695
J3 0.636 0.575
J4 0.676 0.639
The extraction column, represented by Table 20, identified that item I1 did not meet the
requirement of being above 0.3, and was therefore omitted by the researcher in further
analysis.
Table 22: Total variance explained: CBBE
Factor Initial Eigenvalues Extraction Sums of Squared Loadings
Total % of Variance
Cumulative %
Total % of Variance
Cumulative %
1 5.893 49.109 49.109 5.481 45.679 45.679
2 1.432 11.934 61.043 0.967 8.058 53.737
3 0.913 7.610 68.654
4 0.768 6.397 75.051
5 0.571 4.760 79.811
6 0.529 4.406 84.217
7 0.463 3.856 88.073
8 0.406 3.382 91.455
9 0.324 2.701 94.155
10 0.286 2.380 96.535
11 0.225 1.878 98.414
12 0.190 1.586 100.000
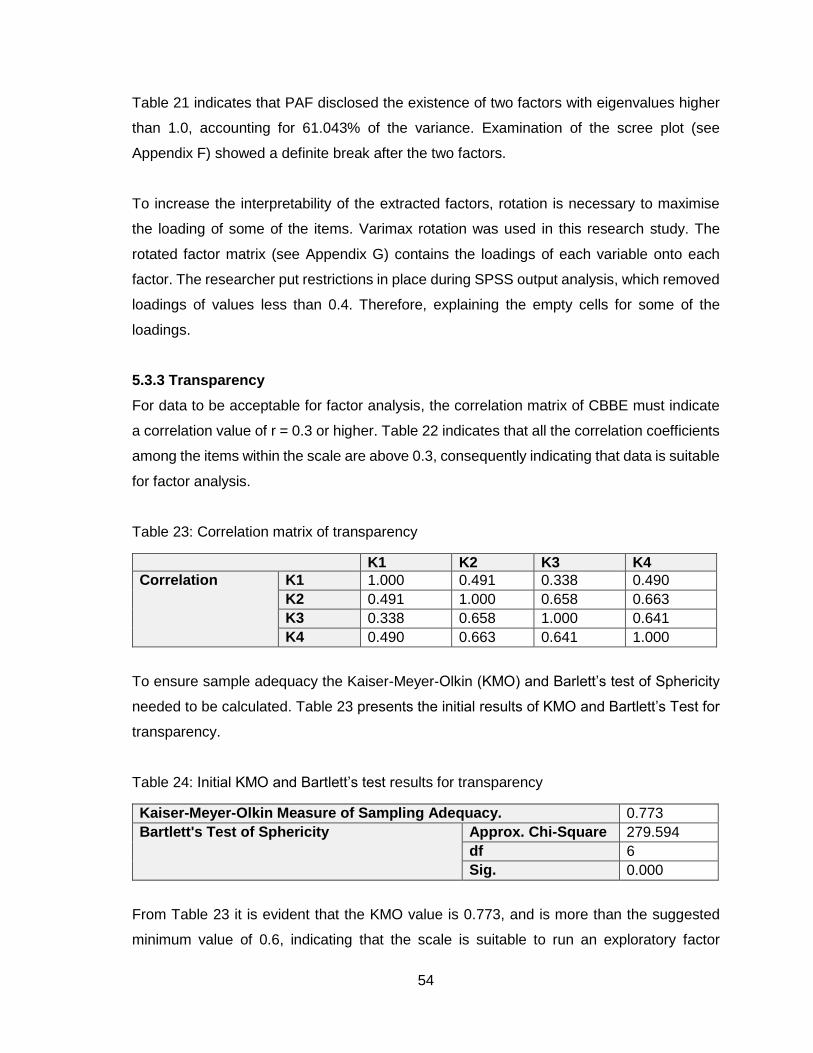
54
Table 21 indicates that PAF disclosed the existence of two factors with eigenvalues higher
than 1.0, accounting for 61.043% of the variance. Examination of the scree plot (see
Appendix F) showed a definite break after the two factors.
To increase the interpretability of the extracted factors, rotation is necessary to maximise
the loading of some of the items. Varimax rotation was used in this research study. The
rotated factor matrix (see Appendix G) contains the loadings of each variable onto each
factor. The researcher put restrictions in place during SPSS output analysis, which removed
loadings of values less than 0.4. Therefore, explaining the empty cells for some of the
loadings.
5.3.3 Transparency
For data to be acceptable for factor analysis, the correlation matrix of CBBE must indicate
a correlation value of r = 0.3 or higher. Table 22 indicates that all the correlation coefficients
among the items within the scale are above 0.3, consequently indicating that data is suitable
for factor analysis.
Table 23: Correlation matrix of transparency
K1 K2 K3 K4
Correlation K1 1.000 0.491 0.338 0.490
K2 0.491 1.000 0.658 0.663
K3 0.338 0.658 1.000 0.641
K4 0.490 0.663 0.641 1.000
To ensure sample adequacy the Kaiser-Meyer-Olkin (KMO) and Barlett’s test of Sphericity
needed to be calculated. Table 23 presents the initial results of KMO and Bartlett’s Test for
transparency.
Table 24: Initial KMO and Bartlett’s test results for transparency
Kaiser-Meyer-Olkin Measure of Sampling Adequacy. 0.773
Bartlett's Test of Sphericity Approx. Chi-Square 279.594
df 6
Sig. 0.000
From Table 23 it is evident that the KMO value is 0.773, and is more than the suggested
minimum value of 0.6, indicating that the scale is suitable to run an exploratory factor
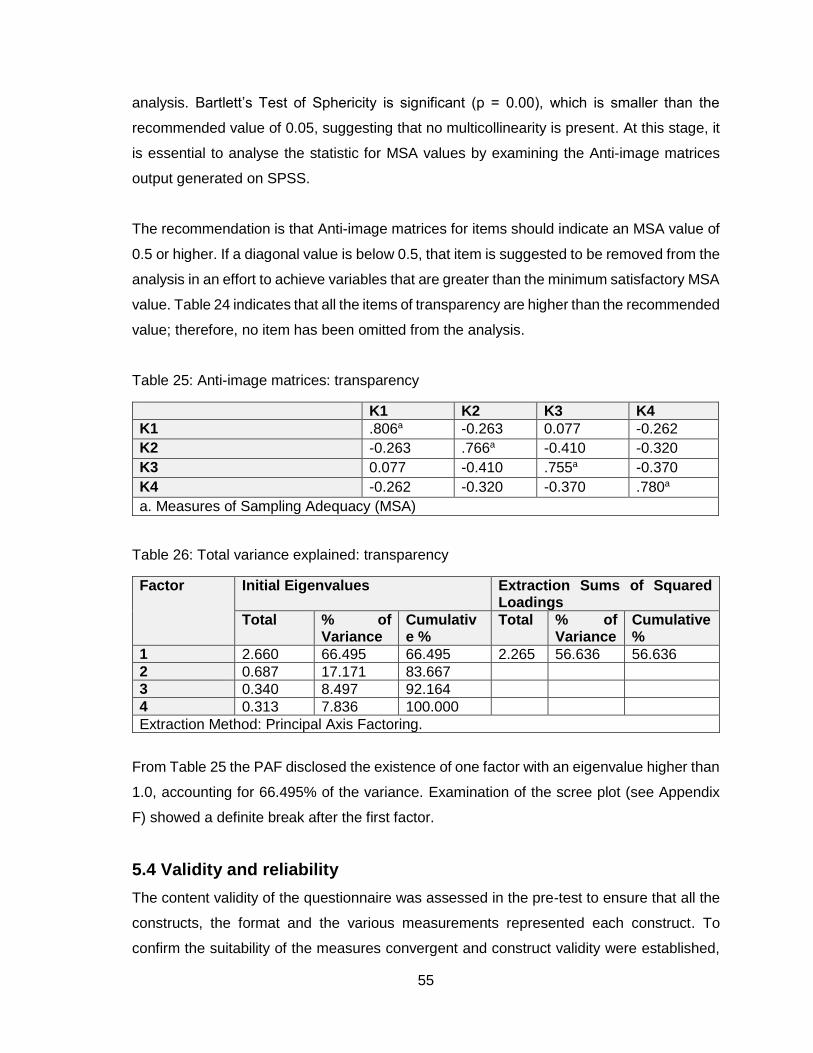
55
analysis. Bartlett’s Test of Sphericity is significant (p = 0.00), which is smaller than the
recommended value of 0.05, suggesting that no multicollinearity is present. At this stage, it
is essential to analyse the statistic for MSA values by examining the Anti-image matrices
output generated on SPSS.
The recommendation is that Anti-image matrices for items should indicate an MSA value of
0.5 or higher. If a diagonal value is below 0.5, that item is suggested to be removed from the
analysis in an effort to achieve variables that are greater than the minimum satisfactory MSA
value. Table 24 indicates that all the items of transparency are higher than the recommended
value; therefore, no item has been omitted from the analysis.
Table 25: Anti-image matrices: transparency
K1 K2 K3 K4
K1 .806a -0.263 0.077 -0.262
K2 -0.263 .766a -0.410 -0.320
K3 0.077 -0.410 .755a -0.370
K4 -0.262 -0.320 -0.370 .780a
a. Measures of Sampling Adequacy (MSA)
Table 26: Total variance explained: transparency
Factor Initial Eigenvalues Extraction Sums of Squared Loadings
Total % of Variance
Cumulative %
Total % of Variance
Cumulative %
1 2.660 66.495 66.495 2.265 56.636 56.636
2 0.687 17.171 83.667
3 0.340 8.497 92.164
4 0.313 7.836 100.000
Extraction Method: Principal Axis Factoring.
From Table 25 the PAF disclosed the existence of one factor with an eigenvalue higher than
1.0, accounting for 66.495% of the variance. Examination of the scree plot (see Appendix
F) showed a definite break after the first factor.
5.4 Validity and reliability
The content validity of the questionnaire was assessed in the pre-test to ensure that all the
constructs, the format and the various measurements represented each construct. To
confirm the suitability of the measures convergent and construct validity were established,
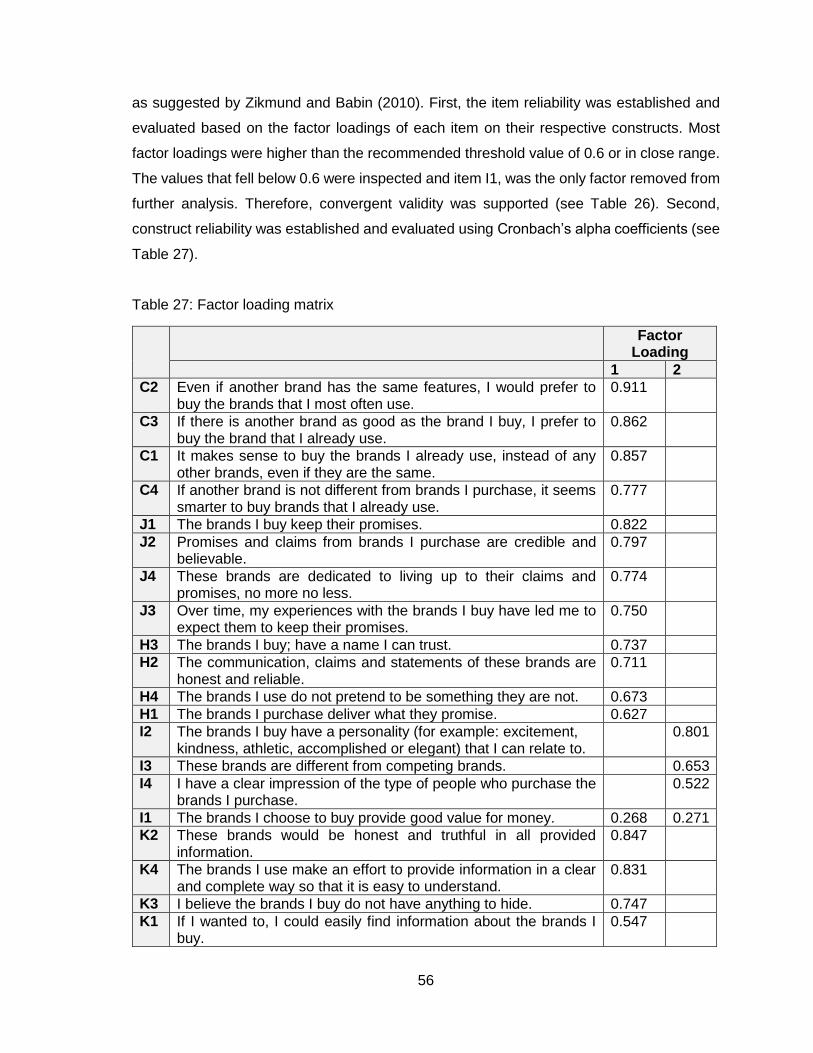
56
as suggested by Zikmund and Babin (2010). First, the item reliability was established and
evaluated based on the factor loadings of each item on their respective constructs. Most
factor loadings were higher than the recommended threshold value of 0.6 or in close range.
The values that fell below 0.6 were inspected and item I1, was the only factor removed from
further analysis. Therefore, convergent validity was supported (see Table 26). Second,
construct reliability was established and evaluated using Cronbach’s alpha coefficients (see
Table 27).
Table 27: Factor loading matrix
Factor Loading
1 2
C2 Even if another brand has the same features, I would prefer to buy the brands that I most often use.
0.911
C3 If there is another brand as good as the brand I buy, I prefer to buy the brand that I already use.
0.862
C1 It makes sense to buy the brands I already use, instead of any other brands, even if they are the same.
0.857
C4 If another brand is not different from brands I purchase, it seems smarter to buy brands that I already use.
0.777
J1 The brands I buy keep their promises. 0.822
J2 Promises and claims from brands I purchase are credible and believable.
0.797
J4 These brands are dedicated to living up to their claims and promises, no more no less.
0.774
J3 Over time, my experiences with the brands I buy have led me to expect them to keep their promises.
0.750
H3 The brands I buy; have a name I can trust. 0.737
H2 The communication, claims and statements of these brands are honest and reliable.
0.711
H4 The brands I use do not pretend to be something they are not. 0.673
H1 The brands I purchase deliver what they promise. 0.627
I2 The brands I buy have a personality (for example: excitement, kindness, athletic, accomplished or elegant) that I can relate to.
0.801
I3 These brands are different from competing brands. 0.653
I4 I have a clear impression of the type of people who purchase the brands I purchase.
0.522
I1 The brands I choose to buy provide good value for money. 0.268 0.271
K2 These brands would be honest and truthful in all provided information.
0.847
K4 The brands I use make an effort to provide information in a clear and complete way so that it is easy to understand.
0.831
K3 I believe the brands I buy do not have anything to hide. 0.747
K1 If I wanted to, I could easily find information about the brands I buy.
0.547
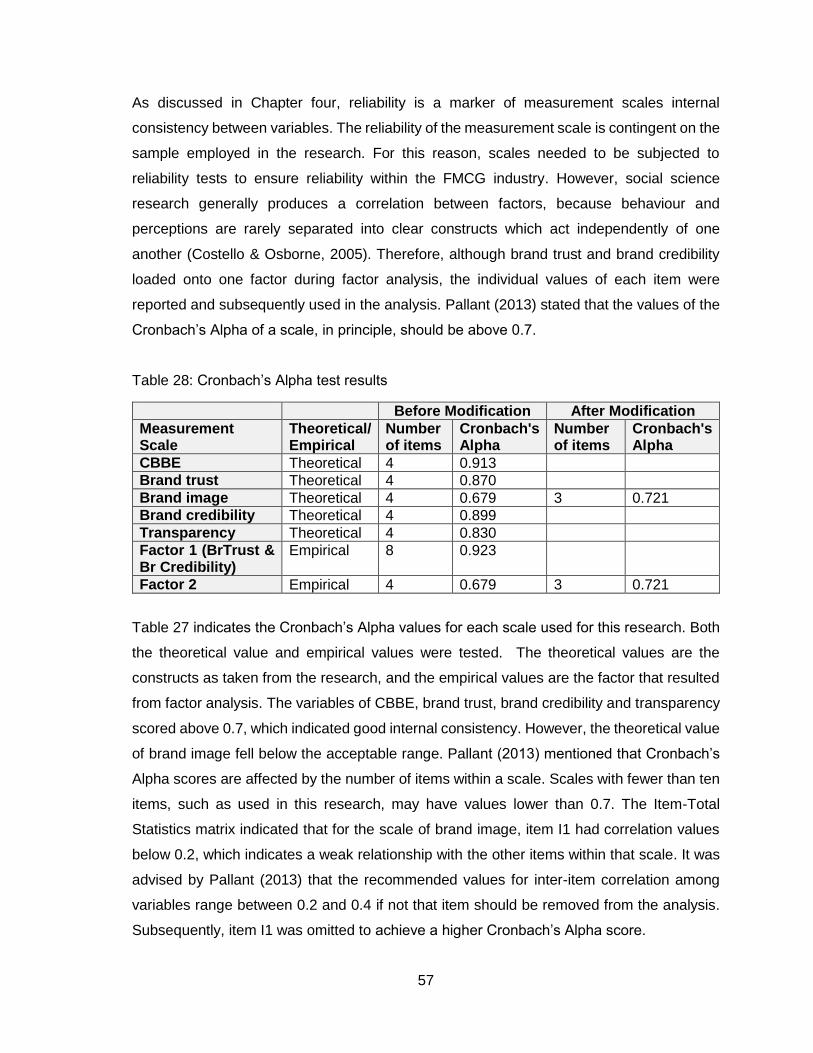
57
As discussed in Chapter four, reliability is a marker of measurement scales internal
consistency between variables. The reliability of the measurement scale is contingent on the
sample employed in the research. For this reason, scales needed to be subjected to
reliability tests to ensure reliability within the FMCG industry. However, social science
research generally produces a correlation between factors, because behaviour and
perceptions are rarely separated into clear constructs which act independently of one
another (Costello & Osborne, 2005). Therefore, although brand trust and brand credibility
loaded onto one factor during factor analysis, the individual values of each item were
reported and subsequently used in the analysis. Pallant (2013) stated that the values of the
Cronbach’s Alpha of a scale, in principle, should be above 0.7.
Table 28: Cronbach’s Alpha test results
Before Modification After Modification
Measurement Scale
Theoretical/ Empirical
Number of items
Cronbach's Alpha
Number of items
Cronbach's Alpha
CBBE Theoretical 4 0.913
Brand trust Theoretical 4 0.870
Brand image Theoretical 4 0.679 3 0.721
Brand credibility Theoretical 4 0.899
Transparency Theoretical 4 0.830
Factor 1 (BrTrust & Br Credibility)
Empirical 8 0.923
Factor 2 Empirical 4 0.679 3 0.721
Table 27 indicates the Cronbach’s Alpha values for each scale used for this research. Both
the theoretical value and empirical values were tested. The theoretical values are the
constructs as taken from the research, and the empirical values are the factor that resulted
from factor analysis. The variables of CBBE, brand trust, brand credibility and transparency
scored above 0.7, which indicated good internal consistency. However, the theoretical value
of brand image fell below the acceptable range. Pallant (2013) mentioned that Cronbach’s
Alpha scores are affected by the number of items within a scale. Scales with fewer than ten
items, such as used in this research, may have values lower than 0.7. The Item-Total
Statistics matrix indicated that for the scale of brand image, item I1 had correlation values
below 0.2, which indicates a weak relationship with the other items within that scale. It was
advised by Pallant (2013) that the recommended values for inter-item correlation among
variables range between 0.2 and 0.4 if not that item should be removed from the analysis.
Subsequently, item I1 was omitted to achieve a higher Cronbach’s Alpha score.
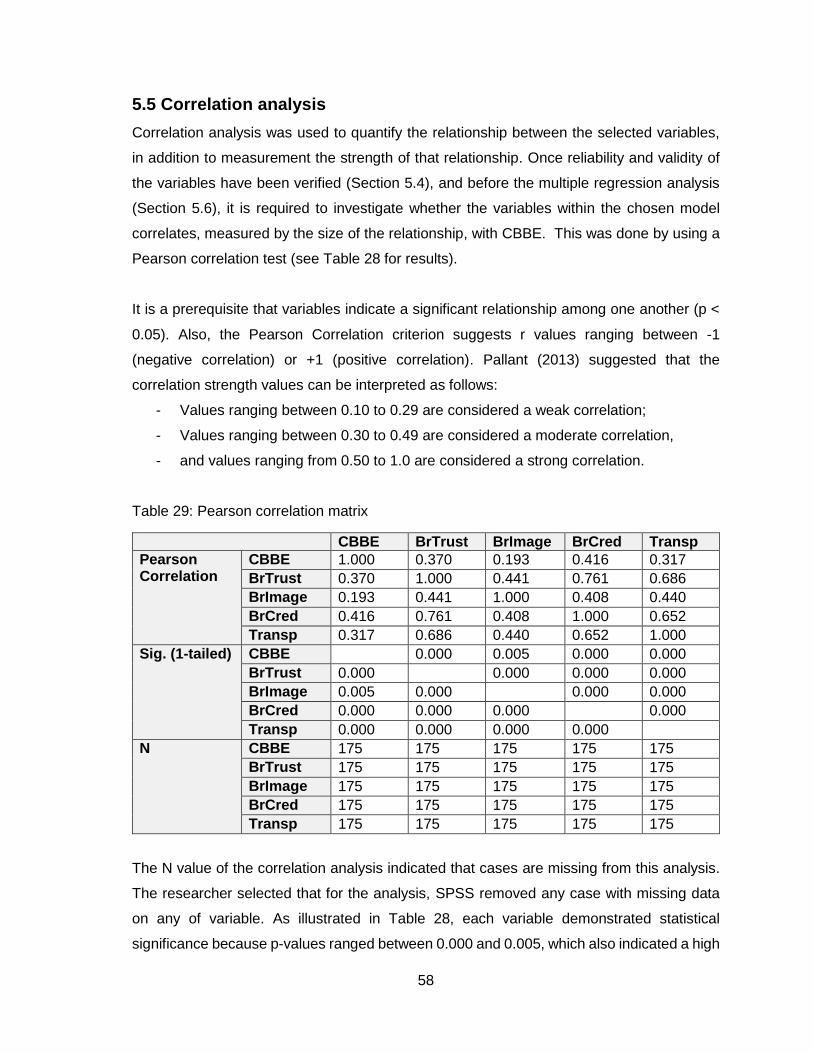
58
5.5 Correlation analysis
Correlation analysis was used to quantify the relationship between the selected variables,
in addition to measurement the strength of that relationship. Once reliability and validity of
the variables have been verified (Section 5.4), and before the multiple regression analysis
(Section 5.6), it is required to investigate whether the variables within the chosen model
correlates, measured by the size of the relationship, with CBBE. This was done by using a
Pearson correlation test (see Table 28 for results).
It is a prerequisite that variables indicate a significant relationship among one another (p <
0.05). Also, the Pearson Correlation criterion suggests r values ranging between -1
(negative correlation) or +1 (positive correlation). Pallant (2013) suggested that the
correlation strength values can be interpreted as follows:
- Values ranging between 0.10 to 0.29 are considered a weak correlation;
- Values ranging between 0.30 to 0.49 are considered a moderate correlation,
- and values ranging from 0.50 to 1.0 are considered a strong correlation.
Table 29: Pearson correlation matrix
CBBE BrTrust BrImage BrCred Transp
Pearson Correlation
CBBE 1.000 0.370 0.193 0.416 0.317
BrTrust 0.370 1.000 0.441 0.761 0.686
BrImage 0.193 0.441 1.000 0.408 0.440
BrCred 0.416 0.761 0.408 1.000 0.652
Transp 0.317 0.686 0.440 0.652 1.000
Sig. (1-tailed) CBBE 0.000 0.005 0.000 0.000
BrTrust 0.000 0.000 0.000 0.000
BrImage 0.005 0.000 0.000 0.000
BrCred 0.000 0.000 0.000 0.000
Transp 0.000 0.000 0.000 0.000
N CBBE 175 175 175 175 175
BrTrust 175 175 175 175 175
BrImage 175 175 175 175 175
BrCred 175 175 175 175 175
Transp 175 175 175 175 175
The N value of the correlation analysis indicated that cases are missing from this analysis.
The researcher selected that for the analysis, SPSS removed any case with missing data
on any of variable. As illustrated in Table 28, each variable demonstrated statistical
significance because p-values ranged between 0.000 and 0.005, which also indicated a high
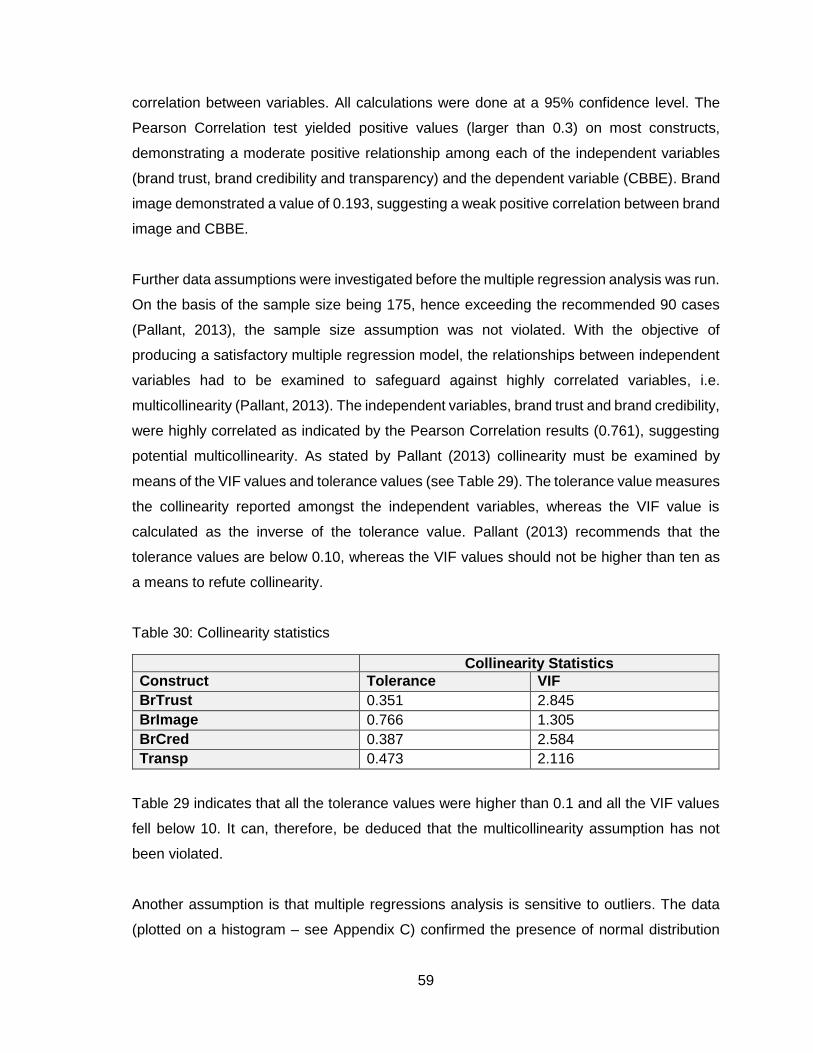
59
correlation between variables. All calculations were done at a 95% confidence level. The
Pearson Correlation test yielded positive values (larger than 0.3) on most constructs,
demonstrating a moderate positive relationship among each of the independent variables
(brand trust, brand credibility and transparency) and the dependent variable (CBBE). Brand
image demonstrated a value of 0.193, suggesting a weak positive correlation between brand
image and CBBE.
Further data assumptions were investigated before the multiple regression analysis was run.
On the basis of the sample size being 175, hence exceeding the recommended 90 cases
(Pallant, 2013), the sample size assumption was not violated. With the objective of
producing a satisfactory multiple regression model, the relationships between independent
variables had to be examined to safeguard against highly correlated variables, i.e.
multicollinearity (Pallant, 2013). The independent variables, brand trust and brand credibility,
were highly correlated as indicated by the Pearson Correlation results (0.761), suggesting
potential multicollinearity. As stated by Pallant (2013) collinearity must be examined by
means of the VIF values and tolerance values (see Table 29). The tolerance value measures
the collinearity reported amongst the independent variables, whereas the VIF value is
calculated as the inverse of the tolerance value. Pallant (2013) recommends that the
tolerance values are below 0.10, whereas the VIF values should not be higher than ten as
a means to refute collinearity.
Table 30: Collinearity statistics
Collinearity Statistics
Construct Tolerance VIF
BrTrust 0.351 2.845
BrImage 0.766 1.305
BrCred 0.387 2.584
Transp 0.473 2.116
Table 29 indicates that all the tolerance values were higher than 0.1 and all the VIF values
fell below 10. It can, therefore, be deduced that the multicollinearity assumption has not
been violated.
Another assumption is that multiple regressions analysis is sensitive to outliers. The data
(plotted on a histogram – see Appendix C) confirmed the presence of normal distribution
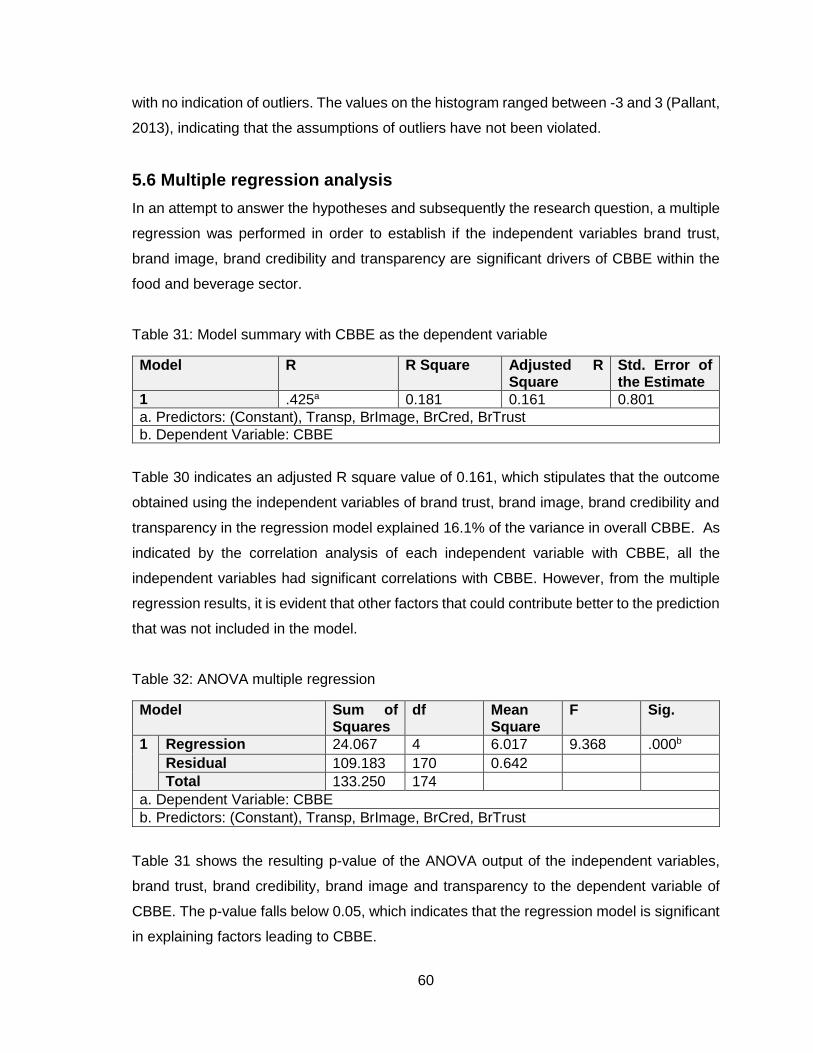
60
with no indication of outliers. The values on the histogram ranged between -3 and 3 (Pallant,
2013), indicating that the assumptions of outliers have not been violated.
5.6 Multiple regression analysis
In an attempt to answer the hypotheses and subsequently the research question, a multiple
regression was performed in order to establish if the independent variables brand trust,
brand image, brand credibility and transparency are significant drivers of CBBE within the
food and beverage sector.
Table 31: Model summary with CBBE as the dependent variable
Model R R Square Adjusted R Square
Std. Error of the Estimate
1 .425a 0.181 0.161 0.801
a. Predictors: (Constant), Transp, BrImage, BrCred, BrTrust
b. Dependent Variable: CBBE
Table 30 indicates an adjusted R square value of 0.161, which stipulates that the outcome
obtained using the independent variables of brand trust, brand image, brand credibility and
transparency in the regression model explained 16.1% of the variance in overall CBBE. As
indicated by the correlation analysis of each independent variable with CBBE, all the
independent variables had significant correlations with CBBE. However, from the multiple
regression results, it is evident that other factors that could contribute better to the prediction
that was not included in the model.
Table 32: ANOVA multiple regression
Model Sum of Squares
df Mean Square
F Sig.
1 Regression 24.067 4 6.017 9.368 .000b
Residual 109.183 170 0.642
Total 133.250 174
a. Dependent Variable: CBBE
b. Predictors: (Constant), Transp, BrImage, BrCred, BrTrust
Table 31 shows the resulting p-value of the ANOVA output of the independent variables,
brand trust, brand credibility, brand image and transparency to the dependent variable of
CBBE. The p-value falls below 0.05, which indicates that the regression model is significant
in explaining factors leading to CBBE.
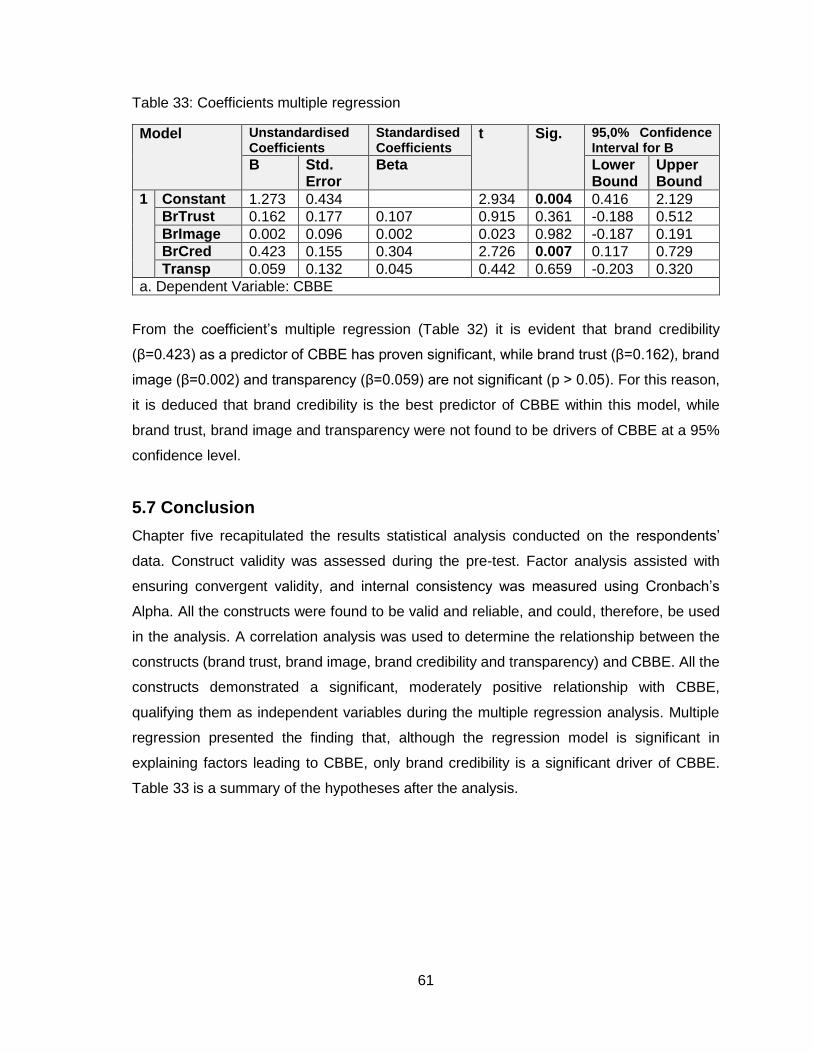
61
Table 33: Coefficients multiple regression
Model Unstandardised Coefficients
Standardised Coefficients
t Sig. 95,0% Confidence Interval for B
B Std. Error
Beta Lower Bound
Upper Bound
1 Constant 1.273 0.434 2.934 0.004 0.416 2.129
BrTrust 0.162 0.177 0.107 0.915 0.361 -0.188 0.512
BrImage 0.002 0.096 0.002 0.023 0.982 -0.187 0.191
BrCred 0.423 0.155 0.304 2.726 0.007 0.117 0.729
Transp 0.059 0.132 0.045 0.442 0.659 -0.203 0.320
a. Dependent Variable: CBBE
From the coefficient’s multiple regression (Table 32) it is evident that brand credibility
(β=0.423) as a predictor of CBBE has proven significant, while brand trust (β=0.162), brand
image (β=0.002) and transparency (β=0.059) are not significant (p > 0.05). For this reason,
it is deduced that brand credibility is the best predictor of CBBE within this model, while
brand trust, brand image and transparency were not found to be drivers of CBBE at a 95%
confidence level.
5.7 Conclusion
Chapter five recapitulated the results statistical analysis conducted on the respondents’
data. Construct validity was assessed during the pre-test. Factor analysis assisted with
ensuring convergent validity, and internal consistency was measured using Cronbach’s
Alpha. All the constructs were found to be valid and reliable, and could, therefore, be used
in the analysis. A correlation analysis was used to determine the relationship between the
constructs (brand trust, brand image, brand credibility and transparency) and CBBE. All the
constructs demonstrated a significant, moderately positive relationship with CBBE,
qualifying them as independent variables during the multiple regression analysis. Multiple
regression presented the finding that, although the regression model is significant in
explaining factors leading to CBBE, only brand credibility is a significant driver of CBBE.
Table 33 is a summary of the hypotheses after the analysis.
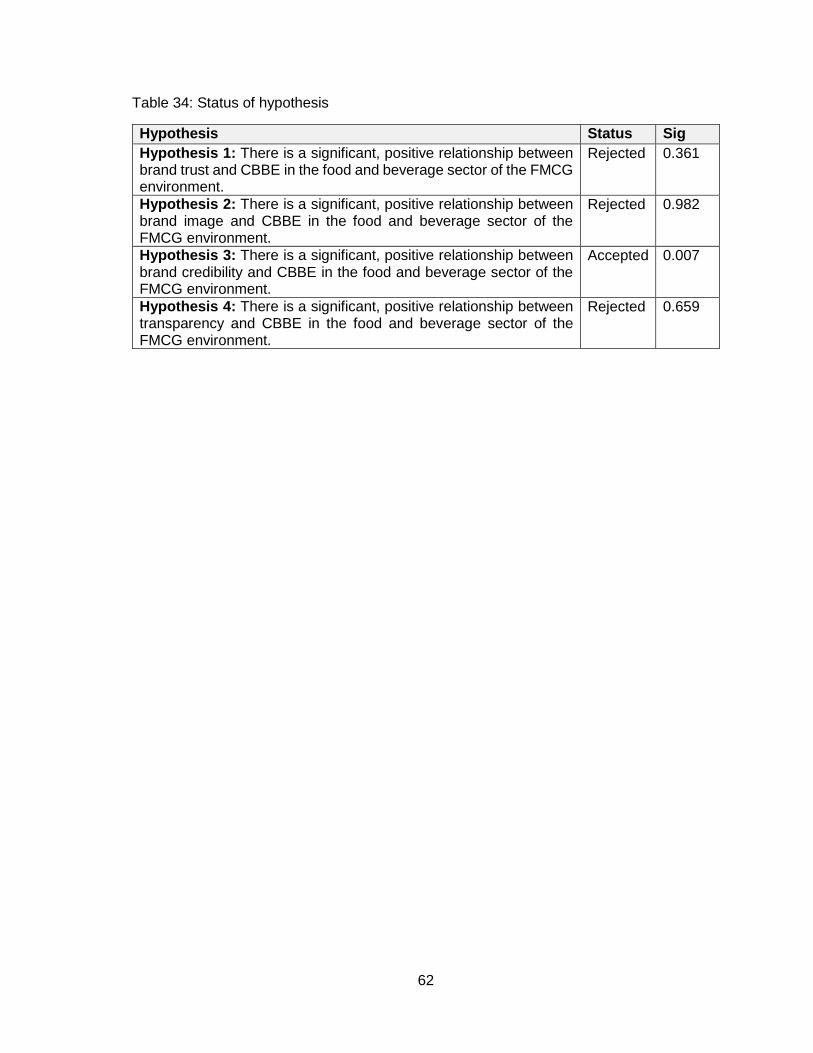
62
Table 34: Status of hypothesis
Hypothesis Status Sig
Hypothesis 1: There is a significant, positive relationship between brand trust and CBBE in the food and beverage sector of the FMCG environment.
Rejected 0.361
Hypothesis 2: There is a significant, positive relationship between brand image and CBBE in the food and beverage sector of the FMCG environment.
Rejected 0.982
Hypothesis 3: There is a significant, positive relationship between brand credibility and CBBE in the food and beverage sector of the FMCG environment.
Accepted 0.007
Hypothesis 4: There is a significant, positive relationship between transparency and CBBE in the food and beverage sector of the FMCG environment.
Rejected 0.659
63
CHAPTER 6: DISCUSSION OF RESULTS
6.1 Introduction
The research question, tested using multiple regression, sought to determine the extent to
which transparency, relative to the drivers selected from literature, predict CBBE within the
food and beverage sector of the FMCG industry. This chapter presents a discussion relating
to the findings presented in Chapter five within the framework of the research objectives and
the literature review presented in Chapter two.
6.2 Hypothesis 1
H1: There is a significant, positive relationship between brand trust and CBBE in the
food and beverage sector of the FMCG environment.
The hypothesis proposed a significant, positive relationship between brand trust and CBBE
in the food and beverage sector of the FMCG environment. The Pearson Correlation yielded
a value of r = 0.370, demonstrating a moderate positive relationship between brand trust
and CBBE. The multiple regression model indicated that brand trust is not a significant
predictor of CBBE, with a p-value of 0.361 and a Beta value of 0.162. Therefore, in the
context of this research, brand trust is not a significant driver of CBBE in the food and
beverage sector of the FMCG environment.
The research results are inconsistent with the literature. Empirical research by Delgado-
Ballester and Munuera-Aleman (2001), relating to product choices and substitute products,
indicated that CBBE was explained when brand trust was taken into consideration because
perceptions about the dependability and integrity of brands form the creation of trust in
consumers’ minds (Chaudhuri & Holbrook, 2001; Davari & Strutton, 2014). It can be inferred,
that based on different consumer values and norms, consumer perceptions relating to
dependability and integrity also differ. Thus suggesting that consumers will also have varying
degrees of trust. Which will lead to contradicting evaluations and expectations of trust held
towards a brand if consumers are asked for an opinion.
According to Burmann et al. (2009), consumer trust is the expectation of a brand to deliver
on the promises communicated to them through information, communications and
64
behaviours, and it was inferred that consumers do not purchase functionality, they purchase
a promise. However, although improved technology and methods used for communication,
gave an opportunity for consumers to seek more information related to brands (Men, 2014;
Parris et al., 2016), the possibility of secrecy and selective information relating to
communication and behaviour of organisation have made it more arduous for consumers to
determine if information is true and candid. Therefore, creating uncertainty, which will impact
their purchase and decision making, process. It is also reasoned that if consumers do not
trust a brand because the behaviour does not reflect the brand promise consumers have the
option to switch to another brand, because the FMCG industry is classified by homogenous
products from competitors (Nierobisch et al., 2017). Consequently, from this research, it is
reasoned that brand trust is not a characteristic consumers consider a necessity during their
decision-making process and evaluation of benefits related to a product.
In today’s connected world, consumers have the right to make informed decisions, thus
necessitating information from brands, even if it might have an unfavourable effect on them
(Keller, 1993; Chaudhuri & Holbrook, 2001; Rawlins; 2008; Dubbink et al., 2008; Men; 2014).
Also, technology, various communication methods and consumers’ ability to search for
information created the caveat that no information can be kept a secret (Rawlins, 2009;
Granados et al., 2010). However, following signalling theory, asymmetric information is
central to circumstances and situations where trust is required. Therefore, because it is
inferred that asymmetric information is always present in the market, it may impede
consumers from forming a precise evaluation of the conditions on which they base their
purchase decision, discouraging them from the actual purchase because they are cautious
of unethical behaviour or misleading information that is provided by the sender or the
organisation (Connelly et al., 2011). Suggesting that the inability to access and utilise all the
information relating to a product, rather than brand trust may impact CBBE.
Additionally, even though the influence of brand trust was suggested to increase during
circumstances in which consumers were compelled to make decisions in an environment of
uncertainty; research conducted by Davari and Strutton (2014), revealed that information
signals are frequently unsuccessful in prompting consumers to trust brands. From
observations, brands within the food and beverage sector, rarely market and communicate
the benefits of their products directly to the consumer on a multitude of platforms, the main
marketing initiatives are from the distributors which are mostly related to price. Providing a
65
possible explanation as to why brand trust is not a significant driver of CBBE in the FMCG
industry. This argument also makes sense because Oehler and Wendt (2017) suggested
that the information currently provided to consumers does not fulfil conditions of quality
information, which sequentially impedes the trustworthiness of the information consumers
base their decisions on. Furthermore, the communications environment has enabled
consumers to choose the signals they wish to receive (Keller, 2009); suggesting that
organisations might not be using the right communication channels to influence consumer
knowledge and associations to building trust in relation to their information, subsequently
not having the desired impact on CBBE.
Sichtmann’s (2007) research affirmed that trust is usually an efficient method which can be
used to reduce consumer uncertainty, therefore resulting in a positive influence on
consumers’ perceptions. Nonetheless, evaluating risk requires information or knowledge of
the brand so that an informed judgment can be made (Connelly et al., 2011). Extending on
the views of Connelly et al. (2011) relating to the quality of information, Oehler and Wendt
(2017), although considering the limitations of consumer cognitive function, suggested that
consumer information needed to fulfil certain quality conditions for the consumer to use it. It
was required that information needed to be guided by the consumers' ability to utilise the
available information to make just decisions (Rawlins, 2009; Men, 2014; Men & Hung-
Baesecke, 2015; Schnackenberg & Tomilinson, 2016). It is inferred that due to consumers
limited cognitive function it is difficult to quantify and define the requirements of information
consumers will be able to utilise. This can subsequently increase uncertainty and consumers
will refrain from purchasing a product, based on the premise that they do not know if they
can trust the brand.
Furthermore, it was disputed that the current quality of information that consumers have
access to, do not satisfy consumer needs, which in turn affected the trustworthiness of the
organisation (Chaudhuri & Holbrook, 2001; Guckian et al., 2018). To that end, it is implied
that consumers cannot depend on provided information and that the available information,
due to the possibility that the information does not comply with the necessary conditions of
understandability and clarity (Oehler & Wendt, 2017), creating doubt in the consumer’s mind,
which will prevent them from making appropriate decisions when taking given information
into consideration.
66
6.3 Hypothesis 2
H2: There is a significant, positive relationship between brand image and CBBE in the
food and beverage sector of the FMCG environment.
The hypothesis proposed a positive relationship between brand image and CBBE in the food
and beverage sector of the FMCG environment. The Pearson Correlation yielded a value of
r = 0.193, demonstrating a weak positive relationship between brand image and CBBE. The
multiple regression model indicated that brand image is not a significant predictor of CBBE
with a p-value of 0.982 and a Beta value of 0.002. Therefore, in the context of this research,
brand image is not a significant driver of CBBE in the food and beverage sector of the FMCG
environment.
This hypothesis is not consistent with literature. In the conceptual brand equity model
proposed by Keller (1993), it was reasoned that brand image, through various brand
associations, impacts CBBE through the antecedent of consumer perceptions (i.e. brand
knowledge). As mentioned, brand image was explained as the way consumers think about
a brand, instead of what the brand does (Keller, 2001). According to Keller (1993, 2001), a
fundamental requirement in the formation of a positive brand image necessitates that the
brand is entrenched in the consumer's subconscious. Effective marketing signals were
argued to be valuable in creating brand associations (Davari & Strutton, 2014; Iglesias et
al., 2017).
However, it is inferred that due to advances in technology and communication methods and
platforms, consumer expectation relating to sharing of knowledge and information by
organisations has been raised (Men & Tsai, 2014; Men & Hung-Baesecke, 2015; Parris et
al., 2016). Also, these advances have empowered consumers to choose the signals they
wish to receive (Keller, 2009). Therefore, an assumption made is that current signals within
the food and beverage sector are not reaching consumers as intended due to the wrong
communication platform used, or organisations do not understand the perceptions or needs
of consumers, thus impacting awareness and the creation of consumer knowledge needed
to affect CBBE, thus explaining the results of the research.
67
Furthermore, effective marketing signals (which include information and communication)
were suggested to be valuable in the formation of brand associations (Davari & Strutton,
2014). However, Cretu and Brodie (2007) mentioned that marketing signals and
communications are not always effective in altering the associations of brand images (i.e.
cognitive, emotional or sensory associations of consumers). It can be inferred that brands
within the food and beverage sector, do not rely on constant marketing initiatives to stimulate
awareness and sales, because these products are seen as necessities instead of must have
items. This argument made sense because it was reasoned that for consumers to use
information during decision-making, the information needed to be noticed and understood
(Connelly et al., 2011; Rawlins, 2009; Men, 2014; Men & Hung-Baesecke, 2015;
Schnackenberg & Tomilinson, 2016). This suggests that organisations are failing to provide
consumers with signals that can positively influence their associations, leading to a brand
not being fixed in the consumer’s subconscious, explaining why brand image is not a
significant driver of CBBE within the food and beverage sector in the FMCG industry.
FMCG products are goods that are purchased on a regular basis at a comparatively low
cost, thus being classified as low-involvement goods (Menidjel et al., 2017). Low-
involvement goods are suggested to present a low risk to consumers, due to the negligible
amount of information required and effort a consumer has to exert during the purchasing
process. McWilliam (1997) argued that the majority of consumers consider FMCG products
as unimportant, along with the low-involvement required during the decision-making
process, as well as in terms of personal importance to consumers. The above suggestion
has two possible implications.
First, behavioural economics suggested that consumers evaluate information by making use
of heuristics, based on beliefs and values, gained through experience (Oehler & Wendt,
2017). Consumers also follow their self-interest which they base either on personal benefits
or through avoidance of personal cost (Davari & Strutton, 2014). These evaluations aid them
in their decision-making process (Davari & Strutton, 2014; Bhaduri & Ha-Brookshire, 2017).
It is inferred that these coping mechanisms lead to increased risks because consumers are
not concentrating on the relevant information with which to satisfy their requirements;
instead consumers tend to concentrate on information that is readily accessible and
delivered in the most conspicuous manner (Oehler & Wendt, 2017).
68
Second, literature stipulated that brand image is a primary element consumers consider
when they make a purchasing decision relating to a brand (Keller, 1993, 2001). Yoo et al.
(2000) contended that consumers also buy brands because of the eminence, prestige and
perceived benefits. It was argued that these intangible traits relating to brand image could
build CBBE (Yoo et al., 2000). However, products consumed within the FMCG industry are
predominantly personal, and Nierobisch et al. (2017) inferred that consumers tend to not
make a statement about themselves through low-involvement brands. Furthermore, food
and beverage product purchases are seen as frequent, routine repeat behaviour of
consumers, which assumes low-involvement. The repeat purchase behaviour is established
through past experiences (Oehler & Wendt, 2017), and it can also be argued that food and
beverage products do not provide status and distinction for the consumer as would high-
involvement goods. Thereby, providing a possible explanation as to why brand image, in
spite of the fact that marketing researchers advocated it to be an important component of
CBBE (Keller, 1993; Iglesias et al., 2017), is not a significant driver of CBBE within the food
and beverage sector of the FMCG industry.
6.4 Hypothesis 3
H3: There is a significant, positive relationship between brand credibility and CBBE
in the food and beverage sector of the FMCG environment.
The hypothesis proposed a significant, positive relationship between brand credibility and
CBBE in the food and beverage sector of the FMCG environment. Brand credibility had a
significant relationship with CBBE (p < 0.05). The Pearson Correlation yielded a value of r =
0.416, demonstrating a moderate positive relationship between brand credibility and CBBE.
Brand credibility is the only predictor of CBBE within the multiple regression model, with a
p-value of 0.007 and a Beta value of 0.423. Therefore, in the context of this research, brand
credibility is the only significant driver of CBBE in the food and beverage sector of the FMCG
environment.
The findings support past research, with results confirming the significant positive
relationship between brand credibility and CBBE. Ng et al. (2014) contended that brand
credibility had a significant effect on CBBE. Moreover, brand credibility was considered a
noteworthy quality organisations needed to establish a strong brand (Baek et al., 2010).
69
Hyun Baek and Whitehill King (2011) mentioned that during uncertainty, consumers tend to
gather additional information about products prior to decision-making and that credible
brands are perceived as a source of knowledge which consumers use to reduce information
costs. It is, therefore, reasoned that the consideration choice set of consumers is influenced
if credibility is present, which will subsequently improve likelihood that the brand will be
preferred during the purchasing process. If this is the case, it is proposed that brand
credibility impacts CBBE through the antecedents of consumer behaviour (i.e. brand
response) and consumer perception (i.e. consumer knowledge) as conceptualised by Keller
(1993). Therefore, substantiating the outcome of this research.
Brand credibility was suggested to have a favourable influence on consumer repurchase
behaviour (Hyun Baek & Whitehill King, 2011). This argument makes sense because,
credibility was reasoned to be the main element of a brand signal for effective information
delivery (Erdem & Swait, 1998). And according to Erdem et al. (2002), brand credibility was
also regarded as the cumulative effect of past marketing initiatives which would impact the
chance that the brand will be incorporated in future consideration sets of consumers.
Literature also suggested that brand credibility was a signal related to the quality of a brand
(Erdem & Swait, 2004). Although we previously inferred that the signal quality of goods
within the FMCG industry is insufficient, the brand itself in this case is a signal of product
quality. It is therefore assumed, based on the results, that consumers would rather spend
their money and time on a quality product, which is beneficial to them instead of looking at
other characteristics which might not offer them any tangible benefits. Thus, implying that
brand credibility is influential in consumer behaviour and decision-making of consumers, and
subsequently a significant driver of CBBE in the food and beverage industry. Given this, it
is true that, brands have an important role because it permits consumers to recognise a
product and it also aids consumers in distinguishing between brands of competing
organisations (Keller, 2001).
Consumers tend to look for information to avoid uncertain situations and decrease the
perceived risks. A potential explanation for credibility being a significant driver of CBBE,
although low-involvement products present a low risk to consumers, may relate to brand
knowledge. Credible brands are regarded as sources of knowledge, which will reduce
consumer efforts and information costs during the decision-making process (Hyun Baek &
Whitehill King, 2011; Davari & Strutton, 2014; Bhaduri & Ha-Brookshire, 2017). Food and
70
beverage products are bought frequently, and it is inferred that consumers rely on repeat
purchase behaviour or knowledge during the decision-making process. The repeat purchase
behaviour is also commonly established through past experiences (Oehler & Wendt, 2017),
suggesting that consumers who have used a certain brand before and found it credible, will
repurchase the product to due to past experience and to possibly avoid personal and
information costs.
Moreover, information asymmetry alters the decision-making process of consumers (Erdem
& Swait, 1998; Erdem et al., 2006). Because certain information within organisations is
confidential, information asymmetries develops amongst organisations, that hold
information, and consumers that could use that information to make more informed
decisions (Connelly et al., 2011). According to Erdem and Swait (2004) and Aaker (1996),
brands that are seen as credible have reduced information gathering and processing costs
in addition to decreased perceived risks. FMCG goods, as low-involvement products, are
generally from various competitors and are near-identical. Therefore, it can be implied that
food and beverage products within the FMCG environment already require reduced
information gathering and processing costs, which decreases the risks perceived by
consumers. Thereby, the argument of Aaker (1996) which considered that by lowering
perceived risks and information costs, brand credibility increases, substantiates the results
of this research.
6.5 Hypothesis 4
H4: There is a significant, positive relationship between transparency and CBBE in
the food and beverage sector of the FMCG environment.
The hypothesis proposed a significant, positive relationship between transparency and
CBBE in the food and beverage sector of the FMCG environment. The Pearson Correlation
yielded a value of r = 0.317, demonstrating a moderate positive relationship between
transparency and CBBE. The multiple regression model indicated that transparency is not
a significant predictor of CBBE with a p-value of 0.659 and a Beta value of 0.059. In the
context of this research, transparency is not a significant driver of CBBE in the food and
beverage sector of the FMCG environment, therefore accepting the null hypothesis.
71
This hypothesis is not supported by literature although various authors suggested that
transparency strengthens the attitudes and perceptions of consumers (Erdem & Swait,
1998; Dubbink et al., 2008; Rawlins, 2009; Öberseder et al., 2013; Parris et al., 2016; Oehler
& Wendt, 2017). Lin et al. (2017) also stated that consumers require transparent information
and that it is an essential component in altering consumer perceptions of a brand (Men &
Hung-Baesecke, 2015; Parris et al., 2016; Lin et al., 2017). Research indicated that
transparency was also a key element in generating favourable consumer response
(Öberseder et al., 2013; Nyilasy et al., 2014; Parris et al., 2016; Iglesias et al., 2017). Which
suggested that transparency should influence CBBE through the antecedents of brand
response and consumer perceptions, as per the conceptualisation of Keller (1993).
The business environment is full of scandals and include prominent food and beverage
organisations such as Nestle (Brunk, 2010), Starbucks various companies that source palm
oil for use in their products, and more recently Enterprise Food (a subsidiary of Tiger Brands
in South Africa). Matters relating to ethical business practices and transparency has
consequently become more prominent, and organisations are more aware of consumer
perception and image towards their brands (James & Montgomery, 2017). This awareness,
however, does not always support their marketing campaigns, communication methods,
availability of information and behaviours. Transparency is not a driver of CBBE because it
is inferred that organisations are attempting to engage consumers’ perceptions with
signalling efforts which are not always as authentic, transparent and credible. Partial
disclosure, or only disclosing information that will not enable consumers to view
transparency as a characteristic when they purchase food, based on the premise that partial
disclosure or disclosing only certain information does not constitute as transparency,
therefore leading consumers to mistrust or be sceptical about information organisations
release.
Research by Bordalo et al. (2013) proposed that salient product characteristics are the main
focal point of consumers during the decision-making process, as opposed to utilising all the
available and relevant information. It is assumed that this created the opportunity for
organisations to give preference to information that highlights a specific product
characteristic and to be less transparent regarding other characteristics to capture market
share and retain customers. It can also be inferred that consumers base their decisions on
the most noticeable product characteristics, consequently leading consumers to overlook
72
important pieces of information which can alter their final purchase decision, therefore not
necessitating transparency. Incomplete and deceptive information and contentious
marketing activities have been identified as reasons for reducing consumer trust and
credibility of brands (Oehler & Wendt, 2017). If people mistrust the information, it could be
inferred that they would rather base their decisions on other characteristics, which they feel
would provide them with reduced uncertainty.
Literature advised that transparency must be framed around consumers' capability to
search, collect and understand the necessary information provided by organisations (Erdem
& Swait, 1998; Williams, 2008; Rawlins, 2009; Schnackenberg & Tomlinson, 2016). The
intention of information and communication should be therefore built on the requirements of
consumers, and not only on increasing the quantity of available information (Oehler &
Wendt, 2017). However, in a global environment where technology has created
unprecedented access to information, consumers have the power and autonomy to search
for information relating to good and brands. Consequently, consumers created their own
information paradigms which was suggested by, Granados et al. (2010) the way to increase
transparency. The information paradigm stated that it was possible to encourage consumer
decision-making by merely increasing the quantity of information. As mentioned, the FMCG
environment is unpredictable and classified as the most difficult sector in which to thrive,
rivalry amongst competitors are always intense because the products are near identical.
Thereby, it is contested that brands must be able to reduce the dissonance increased
information availability created, in order to relate and interact with consumers in a more
meaningful way.
Moreover, based on the conceptualisation of Keller (1993), brand knowledge is an
antecedent of CBBE. Transparency, through its dimensions of disclosure, clarity and
accuracy (Schnackenberg & Tomlinson, 2016), can aid consumers by increasing consumer
knowledge and decreasing uncertainty. It is argued however that based on bounded
rationality, consumers’ cognitive abilities are limited during their assessment and
consumption of information (Kahneman & Tversky, 1979; Dubbink et al., 2008; Oehler &
Wendt, 2017), reducing the consumers’ ability to improve their knowledge structures,
although they have increased quantities of information. Which could be an explanation to
why transparency is not a significant driver of CBBE.
73
6.6 Conclusion
Chapter six presented a discussion relating to the results obtained from chapter five. Each
hypothesis was respectively rationalised in terms of the beta analysis output and the p-value
output with the aim of explaining the strength of the relationships and the statistical
significance thereof. Moreover, discussions and possible reasons related to the results were
associated with every hypothesis and was considered in the context of the food can
beverage sector of the FMCG industry. It was also collated with literature from chapter one
and chapter two.
This study provided the researcher with an opportunity to identify transparency as a
significant driver of CBBE. Conversely, even though transparency was said to have
developed into a meaningful communication topic (Men & Hung-Baesecke, 2015) and
although Dubbink et al. (2008) offered various economic and ethical arguments about why
transparency is important to brands and organisations; the results of this research study
indicated that it could not be considered a significant driver of CBBE. Furthermore, well-
established drivers from literature, brand trust and brand image, were also found not to be
significant drivers of CBBE. However, brand credibility was the only construct found to be a
significant driver of CBBE.
Brand credibility was regarded as the cumulative effect of past marketing initiatives which
would impact the chance that the brand will be incorporated in future consideration sets of
consumers (Erdem et al., (2002). Literature also suggested that brand credibility was a
signal related to the quality of a brand (Erdem & Swait, 2004). Although the researcher
inferred that the signal quality of goods within the FMCG industry is insufficient, the brand
itself in this case is a signal of product quality. Which led to the assumption that consumers
would rather spend their money and time on a quality product, which is beneficial to them
from a quality point of view instead of looking at other characteristics which might not offer
them any tangible benefits. It is an assumption of the researcher that the drivers of brand
trust, brand image and transparency, could only offer intangible benefits to consumers,
which is why, relative to credibility they are not drivers of CBBE in the food and beverage
sector.
Moreover, bounded rationality and limited cognitive consumer ability to process the vast
amounts of information available in today’s hyper-connected world, were highlighted as
74
some of the reasons the selected drivers were not significant drivers of CBBE. Also,
uncertainty and inadequate signalling efforts within the FMCG environment were also
suggested to contribute to the lack of significance relating to the influence of some drivers
on CBBE.
Brand credibility was suggested to have a favourable influence on consumer repurchase
behaviour (Hyun Baek & Whitehill King, 2011). This argument makes sense because,
credibility was reasoned to be the main element of a brand signal for effective information
delivery (Erdem & Swait, 1998).
75
CHAPTER 7: CONCLUSION
7.1 Introduction
This chapter begins with a brief description of the results represented as the principal
findings of the research. Followed by a brief discussion concerning the implications of the
findings, concentrating on the managerial and theoretical implications respectively and
suggesting possible limitations to the research, as well as recommending avenues for future
research.
7.2 Principle findings
The primary objective of this research was to determine whether transparency is a significant
driver of CBBE within the food and beverage sector of the FMCG industry. In order for the
researcher to validate transparency as a driver, it was measured in comparison to other well-
established drivers. Although the chosen drivers were already researched as drivers of
CBBE, their applicability within the food and beverage sector of the FMCG industry needed
to be established. This was achieved by examining the strength and direction of the
relationships various drivers, identified in the literature, had with CBBE. Subsequently, the
relationship between transparency and CBBE was examined and measured in relation to
these drivers.
Although the correlation analysis aided in the determination of the strength and direction of
the relationships the independent variables had with CBBB; the regression model,
explaining only 16.1% of the variance in overall CBBE, indicated that in the context of this
research and based on the independent variables chosen by the researcher only brand
credibility was a significant driver of CBBE in the food and beverage sector of the FMCG
environment. Based on these findings, only hypothesis 3 was supported. Therefore, the
research question is not supported, because transparency was not a significant driver of
CBBE, in relation to the other drivers.
7.3 Theoretical implications
Brand equity is a concept that has been researched from various perspectives and the
importance thereof in diverse fields have been suggested by numerous authors (Keller,
1993; De Chernatony & Christodoulides, 2004; Shankar et al., 2008; Kim & Hyun, 2011;
Baalbaki & Guzmán, 2016; Farjam & Hongyi, 2015; Iglesias et al., 2017; Datta et al., 2017).
76
Therefore, the outcome of this research offered an additional, yet diverse, understanding of
how consumers consider and perceive organisations and their brand communications in the
FMCG industry.
This research contributed to the theory of brand equity by exploring already well-researched
drivers and transparency, a less explored driver, as an additional driver of CBBE within the
FMCG industry. The FMCG industry is seldom the unit of analysis in research relating to
brand equity; most research focused on high value items, technology (Yoo, et al., 2000; Ng
et al.,2014) and fashion and footwear (Kang & Hustvedt, 2014; James & Montgomery,
2017). The first contribution to literature was the establishment of a multiple regression
model that correlated well-established drivers (brand trust, brand image and brand
credibility) and transparency as a possible driver of CBBE in the FMCG environment. The
multiple regression model results, however, contradicted previous findings in the literature
that suggested brand trust and brand image were significant drivers of CBBE. Furthermore,
despite transparency evolving into a catchphrase in business practices, it was also not
identified as a significant driver of CBBE. Although it raises the question whether there are
more dimensions or drivers in empirical research that will reflect the same non-significant
results, it can be inferred that each previously tested construct has the possibility to indicate
different results in different populations.
Yoo et al. (2000) articulated that the ability to understand the drivers of brand equity and
leveraging it in business can increase the competitive advantage of the organisation and
increase brand prosperity. Although the statement justified the research for identifying
additional drivers of CBBE, the results of this research, however, highlighted the question
as to why established drivers were found not to be significant drivers of CBBE (within the
multiple regression model) in the food and beverage sector of the FMCG industry. It also
emphasised the need for continuous evaluation of previous constructs and
conceptualisations in keeping with an ever-changing environment.
7.4 Implications for management
The FMCG industry is one of the biggest industries globally, and these goods are accessible
to most of the population, which generates an appropriate context to research this industry.
Additionally, the FMCG environment is unpredictable and is classified as the most difficult
sector in which to thrive. Because FMCG goods are commonly indistinguishable, on account
77
of existing competition in the FMCG industry, the principle of CBBE, due to its relationship
with consumer purchase behaviour, market share, and financial performance, is a vital
concept for any organisation to comprehend (Anselmsson et al., 2017).
Therefore, the findings of the research concerning the impact of brand credibility on CBBE
recommend that brand managers are purposeful with guiding and safeguarding the brand
credibility. Management must be able to take into account all aspects of credibility, which
includes consistency of marketing mix initiatives, marketing strategies, information and
communication as well as the various communication platforms and methods available.
This research provided an improved comprehension of brand credibility as a driver of CBBE
within the food and beverage sector of the FMCG industry, and the possibility that
consumers regard this as an important reference point in their consideration set and during
their decision-making process. It is suggested that marketing initiatives might benefit from
promotions relating to the brands’ expertise and trustworthiness. It is also suggested, given
the significance of credibility as a driver of CBBE in an environment of low-involvement, low
self-expressive goods and availability of many homogenous substitutions products, that
marketers could highlight communication and information strategies that accentuates
reduced risk and a decrease of information cost to aid credible brand positioning.
Thus, organisational communication, marketing mix initiatives and information still portray a
fundamental role in steering sales and building CBBE (Keller, 2009). However, Melewar,
Foroudi, Gupta, Kitchen and Foroudi (2017) indicated that advances in technology and new
media platforms altered the current marketing environment. These changes created the
need for organisations to use more effective and economical communication methods.
Which also suggests that marketing initiatives and strategies must be amalgamated and
aligned through all platforms to provide the intended purpose through consistency and
believability. Although the effectiveness of communication is related to consumers’
awareness of the brand, it is still essential that marketing managers understand the needs
of the consumers. The managers must ultimately also recognise which communication
platforms and signals are responsible for altering consumer perceptions.
78
7.5 Limitations of research
Given that it is imperative that the methodology used by the researcher is suitable and
explained by means of logical and compelling explanations, it is recognised that there are
certain circumstances in which the context and the method used to put forward limitations
the study. These limitations are discussed below.
Research theory: this research only concentrated on three well researched constructs,
which were chosen based on the suggested relationship and influence they have on
asymmetrical information, however additional research could identify several more drivers
that could impact the outcome of the research in a more significant way.
The population: The FMCG industry includes substantial categories and products which, if
researched as a whole, was complex and demanding. The category researched was
therefore narrowed down to one sector (food and beverage). This creates an opportunity for
future research to be conducted on the various other categories in the FMCG environment.
Also, because products in the FMCG industry are classified as low-involvement goods
(Menidjel et al., 2017; Nierobisch et al., 2017), it might be possible that the constructs could
have a more significant influence on brands that do not form part of this environment such
as durable and luxury goods.
Research design: because of convenience sampling, self-selection bias is suggested as a
limitation because the data was overrepresented by respondents who are indifferent. The
method of convenience sampling might also exclude households with a lower income due
to inaccessibility, although their consumption of and spending on food and beverages in the
FMCG environment represents a higher share of their total monthly expenses.
Data collection method: With self-administered online questionnaires, there is a likelihood
of response errors (i.e., non-response bias and response bias) being present in the data.
Although the self-administered questionnaire was anonymous, consumers perceive
themselves to be loyal to a brand, in the uncertain economic conditions they face there is a
chance that deliberate falsification (response bias) could have occurred. Consumers can
deliberately falsify answers to hide personal information and to circumvent embarrassment.
79
Analysis method: correlation and multiple regression were basic statistical analysis
techniques used for the purpose of this research. Using a structural equation model might
have allowed better quality characteristics of the impacts on CBBE, which might have led to
a greater understanding of the techniques through which the independent variables affect
CBBE.
7.6 Recommendations for future research
While this research did not support the overarching research question, the researcher
recognises and suggests that in other circumstances there may be support for it. According
to Veloutsou et al. (2013), most of the empirical literature on brand equity was developed in
the USA. Also, according to Paul, Modi and Patel (2016), increased awareness and interest
relating to the triple bottom line is dependent on the country of origin, where developed
countries are far more conscious of their behaviour and impact on society in general. This
research was conducted in an emerging market, whereby the results may differ in an
established market. It can be inferred that in an emerging market people do not have the
access to technology or infrastructure to enable them to look for information relating to
products. Furthermore, it can be implied that organisations are not held accountable for
behaviour and information discretions in emerging markets as would be the case in
established markets.
Only a few selected drivers were selected for this research, based on their possible
relationship or association each construct had within the framework of information. However,
literature is inundated with various constructs or dimensions which could impact CBBE
within the food and beverage sector of the FMCG industry.
The unit of analysis was brands operating within the food and beverage category of the
FMCG industry. However, fast-moving consumer goods are defined as frequently
purchased, low-involvement goods that are sold at relatively low costs (Menidjel et al.,
2017). Low-involvement goods pose a low risk, due to the negligible amount of information
required and effort a consumer has to exert during the purchasing process.
McWilliam (1997) argued that for the majority of consumers, fast-moving consumer products
are unimportant with low-involvement required during the decision-making process, and in
terms of personal importance to consumers (Nierobisch et al., 2017). It is suggested that,
even though transparency is not a significant driver of CBBE in the food and beverage sector
80
of the FMCG industry, other industries might benefit from such research. It can still be
argued that transparency will allow consumers to make faster and more informed decisions,
also reducing the level of uncertainty concerning the reliability of an organisation.
The respondents were mainly Caucasian, with high incomes and higher education. It is
suggested that future research establish a relationship between demographic variables and
the independent variables tested in this research. Hetze (2016) reinforced the need for
organisations to understand the various perceptions and drivers, due to distinct individual
values and norms that determine consumer behaviour. It is therefore implied that consumers
as stakeholders have inconsistent, divergent and contradictive expectations and
perceptions of organisations due to their varying interests.
Instead of establishing a direct relationship between transparency and CBBE (as is the case
for this research), the influence of transparency on the drivers, antecedents and dimensions
of CBBE could be explored. The effect of transparency in various communication channels
and the influence on consumer knowledge, associations and CBBE can also be considered.
The relationship between transparency, risk perceptions and low-involvement goods can be
challenged. These suggestions for further research will aid organisations in the
understanding of consumers and how communication and information strategies can
influence the perceptions and behaviour of consumers.
Given that the literature alluded to the benefits brands can offer as signals, the quality of the
signal is a factor that could be considered for future research. Because in an environment
where uncertainty is common, communication and information represent a central role in
steering sales. It is recommended that the dimensions of transparency (i.e. disclosure, clarity
and accuracy) could also be researched in relation to organisational communications, which
will potentially provide practical suggestions which organisations and brands alike can use
to communicate their values, beliefs and benefits to consumers in such a manner that will
aid the consumer in their decision-making process.
7.7 Conclusion
This research sought to determine whether transparency was a significant driver, relative to
other drivers, of CBBE within the food and beverage sector of the FMCG industry. The
results of this research were inconsistent with the expectation of the researcher in regards
to how transparency within the FMCG industry could be a driver CBBE. The research found
81
that brand trust, brand image, brand credibility and transparency have significant
relationships with CBBE. Although this is in line with the literature on drivers of CBBE, further
multiple regression analysis indicated that only brand credibility was a significant driver of
CBBE within the model. The overarching research question was therefore, not supported.
However, brand credibility was highlighted by the results of the study to be a more significant
driver.
Although this research indicated that transparency is not a significant driver of CBBE, it does
not dissociate the importance of the concept in business. Consumers are permitted to
search for information relating to organisational behaviour and activities which might
encroach on their welfare and interest and the environment defined by asymmetrical
information will not abate. However, it was inferred that consumers within the food and
beverage sector of the FMCG industry would rather look at tangible benefits, which brand
credibility could provide through constant quality and experience. Instead of intangible
benefits provided by brand trust, brand image and transparency.
82
8. REFERENCES
Aaker, D. A. (1996). Measuring brand equity across products and markets. California
Management Review, 38(3), 102. Retrieved from https://search-proquest-
com.uplib.idm.oclc.org/docview/216148797?accountid=14717
Albu, O. B., & Flyverbom, M. (2016). Organizational transparency: Conceptualizations,
conditions, and consequences. Business & Society, 1-30. Retrieved from https://doi-
org.uplib.idm.oclc.org/10.1177/0007650316659851
Anselmsson, J., Burt, S., & Tunca, B. (2017). An integrated retailer image and brand equity
framework: Re-examining, extending, and restructuring retailer brand equity. Journal
of Retailing and Consumer Services, 38, 194-203. Retrieved from
https://doi.org/10.1016/j.jretconser.2017.06.007.
Baalbaki, S., & Guzmán, F. (2016). A consumer-perceived consumer-based brand equity
scale. Journal of Brand Management, 23(3), 229-251. doi: 10.1057/bm.2016.11
Baek, T. H., Kim, J., & Yu, J. H. (2010). The differential roles of brand credibility and brand
prestige in consumer brand choice. Psychology & Marketing, 27(7), 662-678. doi:
10.1002/mar.20350
Bhaduri, G., & Ha-Brookshire, J. (2017). The role of brand schemas, information
transparency, and source of message on apparel brands' social responsibility
communication. Journal of Marketing Communications, 23(3), 293-310.
doi:10.1080/13527266.2015.1040441
Bordalo, P., Gennaioli, N., & Shleifer, A. (2013). Salience and consumer choice. Journal of
Political Economy, 121(5), 803-843. doi:10.1086/673885.
Brunk, K. H. (2010). Exploring origins of ethical company/brand perceptions—A consumer
perspective of corporate ethics. Journal of Business Research, 63(3), 255-262. 2009
doi: 10.1016/j.jbusres.2009.03.011
83
Brunk, K. H., & Blümelhuber, C. (2011). One strike and you're out: Qualitative insights into
the formation of consumers' ethical company or brand perceptions. Journal of
Business Research, 64(2), 134-141. doi: 10.1016/j.jbusres.2010.02.009
Burmann, C., Jost-Benz, M., & Riley, N. (2009). Towards an identity-based brand equity
model. Journal of Business Research, 62(3), 390-397. doi:
10.1016/j.jbusres.2008.06.009
Burns, A. C., & Bush, R. F. (2014). Marketing Research (7th ed.). New Jersey: Pearson.
Bushman, R. M., Piotroski, J. D., & Smith, A. J. (2004). What determines corporate
transparency?. Journal of accounting research, 42(2), 207-252. Retrieved from
https://www.jstor.org/stable/3542360
Chaudhuri, A., & Holbrook, M. B. (2001). The chain of effects from brand trust and brand
affect to brand performance: The role of brand loyalty. Journal of Marketing, 65(2), 81-
93. Retrieved from https://search-proquest-
com.uplib.idm.oclc.org/docview/227777217?accountid=14717
Cho, E., & Fiore, A. M. (2015). Conceptualization of a holistic brand image measure for
fashion-related brands. Journal of Consumer Marketing, 32(4), 255–265. Retrieved
from https://doi.org/10.1108/JCM-07-2014-1063
Christodoulides, G., & De Chernatony, L. (2010). Consumer-based brand equity
conceptualization and measurement: A literature review. International Journal of
Market Research, 52(1), 43-66. doi: 10.2501/S1470785310201053
Christodoulides, G., Cadogan, J. W., & Veloutsou, C. (2015). Consumer-based brand equity
measurement: lessons learned from an international study. International Marketing
Review, 32(3/4), 307-328. doi:10.1108/IMR-10-2013-0242
Çifci, S., Ekinci, Y., Whyatt, G., Japutra, A., Molinillo, S., & Siala, H. (2016). A cross
validation of Consumer-Based Brand Equity models: Driving customer equity in retail
84
brands. Journal of Business Research, 69(9), 3740-3747. Retrieved from
https://doi.org/10.1016/j.jbusres.2015.12.066.
Connelly, B. L., Certo, S. T., Ireland, R. D., & Reutzel, C. R. (2011). Signaling theory: A
review and assessment. Journal of management, 37(1), 39-67. doi:
10.1177/0149206310388419
Costello, A. B., & Osborne, J. W. (2005). Best practices in exploratory factor analysis: Four
recommendations for getting the most from your analysis. Practical assessment,
research & evaluation, 10(7), 1-9. Retrieved from
https://www.pareonline.net/pdf/v10n7.pdf
Cretu, A. E., & Brodie, R. J. (2007). The influence of brand image and company reputation
where manufacturers market to small firms: A customer value perspective. Industrial
Marketing Management, 36(2), 230-240. doi: 10.1016/j.indmarman.2005.08.013
Datta, H., Ailawadi, K. L., & van Heerde, H. J. (2017). How well does consumer-based brand
equity align with sales-based brand equity and marketing-mix response?. Journal of
Marketing, 81(3), 1-20. Retrieved from http://dx.doi.org/10.1509/jm.15.0340
Davari, A., & Strutton, D. (2014). Marketing mix strategies for closing the gap between green
consumers' pro-environmental beliefs and behaviors. Journal of Strategic
Marketing, 22(7), 563-586. doi: 10.1080/0965254X.2014.914059
De Chernatony, L., Harris, F., & Christodoulides, G. (2004). Developing a brand
performance measure for financial services brands. The Service Industries
Journal, 24(2), 15-33. doi: 10.1080/02642060412331301232
Delgado-Ballester, E., & Luis Munuera-Alemán, J. (2001). Brand trust in the context of
consumer loyalty. European Journal of marketing, 35(11/12), 1238-1258. Retrieved
from https://search-proquest-
com.uplib.idm.oclc.org/docview/237021507/79F9E63920264613PQ/1?accountid=14
717
85
Delgado-Ballester, E., & Luis Munuera-Alemán, J. (2005). Does brand trust matter to brand
equity?. Journal of product & brand management, 14(3), 187-196. Retrieved from doi:
10.1108/10610420510601058
Diallo, M. F., & Lambey-Checchin, C. (2017). Consumers’ Perceptions of Retail Business
Ethics and Loyalty to the Retailer: The Moderating Role of Social Discount Practices.
Journal of business ethics, 141(3), 435-449. Retrieved from
https://doi.org/10.1007/s10551-015-2663-8
Dögl, C., & Holtbrügge, D. (2014). Corporate environmental responsibility, employer
reputation and employee commitment: An empirical study in developed and emerging
economies. The International Journal of Human Resource Management, 25(12),
1739-1762. doi: 10.1080/09585192.2013.859164
Dubbink, W., Graafland, J., & Van Liedekerke, L. (2008). CSR, transparency and the role of
intermediate organisations. Journal of Business Ethics, 82(2), 391-406.
doi:10.1007/s10551-008-9893-y
Dwivedi, A., Wilkie, D., Johnson, L., & Weerawardena, J. (2016). Establishing measures and
drivers of consumer brand engagement behaviours. Journal of Brand
Management, 23(5), 41-69. doi:10.1057/s41262-016-0001-9
Erdem, T., & Swait, J. (1998). Brand equity as a signaling phenomenon. Journal of consumer
Psychology, 7(2), 131-157. Retrieved from
https://search-proquest-
com.uplib.idm.oclc.org/docview/1839798877?accountid=14717
Erdem, T., Swait, J., & Louviere, J. (2002). The impact of brand credibility on consumer price
sensitivity. International journal of Research in Marketing, 19(1), 1-19. Retrieved from
https://doi-org.uplib.idm.oclc.org/10.1016/S0167-8116(01)00048-9
Erdem, T., & Swait, J. (2004). Brand credibility, brand consideration, and choice. Journal of
Consumer Research, 31(1), 191–198. Retrieved from
86
http://web.a.ebscohost.com.uplib.idm.oclc.org/pfi/pdfviewer/pdfviewer?vid=5&sid=07
0016f0-895a-497b-9747-85a652b10549%40sessionmgr4008
Erdem, T., Swait, J., & Valenzuela, A. (2006). Brands as signals: A cross-country validation
study. Journal of Marketing, 70(1), 34-49. Retrieved from
https://www.jstor.org/stable/30162071
Farjam, S., & Hongyi, X. (2015). Reviewing the concept of brand equity and evaluating
consumer-based brand equity (CBBE) models. International Journal of Management
Science and Business Administration, 1(8), 14-29. Retrieved from
https://pdfs.semanticscholar.org/11c7/70708b7f8d4e43c7c9afa4c47a19c0627905.pd
f
Granados, N., Gupta, A., & Kauffman, R. J. (2010). Research commentary—information
transparency in business-to-consumer markets: Concepts, framework, and research
agenda. Information Systems Research, 21(2), 207-226. doi 10.1287/isre.1090.0249
Grappi, S., Romani, S., & Bagozzi, R. P. (2013). Consumer response to corporate
irresponsible behavior: Moral emotions and virtues. Journal of business research,
66(10), 1814-1821. Retrieved from http://dx.doi.org/10.1016/j.jbusres.2013.02.002
Guckian, M. L., Chapman, D. A., Lickel, B., & Markowitz, E. M. (2018). “A few bad apples”
or “rotten to the core”: Perceptions of corporate culture drive brand engagement after
corporate scandal. Journal of Consumer Behaviour, 17(1). doi: 10.1002/cb.1672
Hair, J. F., Black, W. C., Babin, B. J., & Anderson, R. E. (2010). Multivariate Data Analysis
(7th ed.). New Jersey: Pearson Prentice Hall.
He, Y., & Lai, K. K. (2014). The effect of corporate social responsibility on brand loyalty: the
mediating role of brand image. Total Quality Management & Business
Excellence, 25(3-4), 249-263. doi: 10.1080/14783363.2012.661138
87
Hetze, K. (2016). Effects on the (CSR) reputation: CSR reporting discussed in the light of
signalling and stakeholder perception theories. Corporate Reputation Review, 19(3),
281-296. doi: 10.1057/s41299-016-0002-3
Holland, D., Krause, A., Provencher, J., & Seltzer, T. (2018). Transparency tested: The
influence of message features on public perceptions of organizational
transparency. Public Relations Review, 44(2), 256-264. Retrieved from
https://doi.org/10.1016/j.pubrev.2017.12.002
Hyun Baek, T., & Whitehill King, K. (2011). Exploring the consequences of brand credibility
in services. Journal of Services Marketing, 25(4), 260-272. doi:
10.1108/08876041111143096
Iglesias, O., Markovic, S., Singh, J. J., & Sierra, V. (2017). Do customer perceptions of
corporate services brand ethicality improve brand equity? Considering the roles of
brand heritage, brand image, and recognition benefits. Journal of Business Ethics, 1-
19. doi: 10.1007/s10551-017-3455-0
Ingram, R., Skinner, S. J., & Taylor, V. A. (2005). Consumers’ evaluation of unethical
marketing behaviors: The role of customer commitment. Journal of Business Ethics,
62(3), 237-252. doi: 10.1007/s10551-005-1899-0
James, A. M., & Montgomery, B. (2017). Engaging the fashion consumer in a transparent
business model. International Journal of Fashion Design, Technology and Education,
10(3), 287-299. doi: 10.1080/17543266.2017.1378730
Jordan, J. S., Peek, J., & Rosengren, E. S. (2000). The market reaction to the disclosure of
supervisory actions: Implications for bank transparency. Journal of Financial
Intermediation, 9(3), 298-319.
Kahneman, D., & Tversky, A. (1979). Prospect theory: an analysis of decision under risk.
Econometrica (Pre-1986), 47(2), 263. Retrieved from https://search-proquest-
com.uplib.idm.oclc.org/docview/214665840?accountid=14717
88
Kang, J., & Hustvedt, G. (2014). Building trust between consumers and corporations: The
role of consumer perceptions of transparency and social responsibility. Journal of
Business Ethics, 125(2), 253-265. doi: 10.1007/s10551-013-1916-7
Kaptein, M. (2008). Developing and testing a measure for the ethical culture of
organizations: The corporate ethical virtues model. Journal of Organizational
Behavior: The International Journal of Industrial, Occupational and Organizational
Psychology and Behavior, 29(7), 923-947. Retrieved from
http://hdl.handle.net/1765/10770
Keller, K. L. (2001). Building customer-based brand equity. Marketing Management, 10(2),
14-19. Retrieved from https://search-proquest-
com.uplib.idm.oclc.org/docview/194194945/26335F6539B04256PQ/8?accountid=14
717
Keller, K. L. (2009). Building strong brands in a modern marketing communications
environment. Journal of marketing communications, 15(2-3), 139-155. doi:
10.1080/13527260902757530
Keller, K.L. (1993). Conceptualizing, measuring, and managing customer-based brand
equity. Journal of Marketing, 57(1). Retrieved from https://search-proquest-
com.uplib.idm.oclc.org/docview/227794112/fulltextPDF/3F46BE506BB241D7PQ/1?a
ccountid=14717
Kim, J. H., & Hyun, Y. J. (2011). A model to investigate the influence of marketing-mix efforts
and corporate image on brand equity in the IT software sector. Industrial marketing
management, 40(3), 424-438. doi: 10.1016/j.indmarman.2010.06.024
Lassar, W., Mittal, B., & Sharma, A. (1995). Measuring customer-based brand
equity. Journal of consumer marketing, 12(4), 11-19. Retrieved from
https://doi.org/10.1108/07363769510095270
Lin, J., Lobo, A., & Leckie, C. (2017). The role of benefits and transparency in shaping
consumers’ green perceived value, self-brand connection and brand loyalty. Journal
89
of Retailing and Consumer Services, 35, 133-141. Retrieved from
http://dx.doi.org/10.1016/j.jretconser.2016.12.011
McWilliam, G. (1997). Low involvement brands: is the brand manager to blame?. Marketing
Intelligence & Planning, 15(2), 60-70. Retrieved from
https://doi.org/10.1108/02634509710165867
Melewar, T. C., Foroudi, P., Gupta, S., Kitchen, P. J., & Foroudi, M. M. (2017). Integrating
identity, strategy and communications for trust, loyalty and commitment. European
Journal of Marketing, 51(3), 572-604. doi: 10.1108/EJM-08-2015-0616
Men, L. R. (2014). Internal reputation management: The impact of authentic leadership and
transparent communication. Corporate Reputation Review, 17(4), 254-272. doi:
10.1057/crr.2014.14
Men, L. R., & Hung-Baesecke, C. J. F. (2015). Engaging employees in China: The impact
of communication channels, organizational transparency, and authenticity. Corporate
Communications: An International Journal, 20(4), 448-467. doi: 10.1108/CCIJ-11-
2014-0079
Men, L. R., & Tsai, W. H. S. (2014). Perceptual, attitudinal, and behavioral outcomes of
organization–public engagement on corporate social networking sites. Journal of
Public Relations Research, 26(5), 417-435. doi: 10.1080/1062726X.2014.951047
Merlo, O., Eisingerich, A., Auh, S., & Levstek, J. (2018). The benefits and implementation of
performance transparency: The why and how of letting your customers ‘see
through’your business. Business Horizons, 61(1), 73-84. Retrieved from
http://dx.doi.org/10.1016/j.bushor.2017.09.007
Menidjel, C., Benhabib, A., & Bilgihan, A. (2017). Examining the moderating role of
personality traits in the relationship between brand trust and brand loyalty. Journal of
Product & Brand Management, 26(6), 631-649. Retrieved
from https://doi.org/10.1108/MIP-04-2016-0064
90
Morhart, F., Malär, L., Guèvremont, A., Girardin, F., & Grohmann, B. (2015). Brand
authenticity: An integrative framework and measurement scale. Journal of Consumer
Psychology, 25(2), 200-218. doi: 10.1016/j.jcps.2014.11.006
Ng, P. F., Butt, M. M., Khong, K. W., & Ong, F. S. (2014). Antecedents of green brand equity:
An integrated approach. Journal of Business Ethics, 121(2), 203-215. doi:
10.1007/s10551-013-1689-z
Nierobisch, T., Toporowski, W., Dannewald, T., & Jahn, S. (2017). Flagship stores for FMCG
national brands: Do they improve brand cognitions and create favorable consumer
reactions?. Journal of Retailing and Consumer Services, 34, 117-137. Retrieved from
http://dx.doi.org/10.1016/j.jretconser.2016.09.014
Nyilasy, G., Gangadharbatla, H., & Paladino, A. (2014). Perceived greenwashing: The
interactive effects of green advertising and corporate environmental performance on
consumer reactions. Journal of Business Ethics, 125(4), 693-707. doi:
10.1007/s10551-013-1944-3
Öberseder, M., Schlegelmilch, B. B., & Murphy, P. E. (2013). CSR practices and consumer
perceptions. Journal of Business Research, 66(10), 1839-1851. Retrieved from
http://dx.doi.org/10.1016/j.jbusres.2013.02.005
Oehler, A., & Wendt, S. (2017). Good consumer information: The Information Paradigm at
its (dead) end?. Journal of Consumer Policy, 40(2), 179-191. doi: 10.1007/s10603-
016-9337-5
Pallant, J. (2013). SPSS survival manual. McGraw-Hill Education (UK). Retrieved from
http://www.mheducation.co.uk/openup/chapters/0335208908.pdf
Pappu, R., & Quester, P. G. (2016). How does brand innovativeness affect brand
loyalty?. European Journal of Marketing, 50(1/2), 2-28. doi: 10.1108/EJM-01-2014-
0020
91
Park, S. H. (2009). The antecedents and consequences of brand image: Based on Keller’s
customer-based brand equity (Order No. 3393245). Available from ABI/INFORM
Collection. (304985734). Retrieved from https://search-proquest-
com.uplib.idm.oclc.org/docview/304985734?accountid=14717
Parris, D. L., Dapko, J. L., Arnold, R. W., & Arnold, D. (2016). Exploring transparency: a new
framework for responsible business management. Management Decision, 54(1), 222-
247. doi: 10.1108/MD-07-2015-0279
Paul, J., Modi, A., & Patel, J. (2016). Predicting green product consumption using theory of
planned behavior and reasoned action. Journal of Retailing and Consumer Services,
29, 123-134. Retrieved from http://dx.doi.org/10.1016/j.jretconser.2015.11.006
Pecot, F., Merchant, A., Valette-Florence, P., & De Barnier, V. (2018). Cognitive outcomes
of brand heritage: A signaling perspective. Journal of Business Research, 85, 304-
316. Retrieved from https://doi.org/10.1016/j.jbusres.2018.01.016
Philippe, D., & Durand, R. (2011). The impact of norm‐conforming behaviors on firm
reputation. Strategic Management Journal, 32(9), 969-993. doi: 10.1002/smj.919
Rawlins, B. L. (2008). Measuring the relationship between organizational transparency and
employee trust. Public Relations Journal, 2(2): 1-21. Retrieved from
https://scholarsarchive.byu.edu/facpub/885
Rawlins, B. (2009). Give the Emperor a Mirror: Toward Developing a Stakeholder
Measurement of Organizational Transparency. Journal of Public Relations
Research, 21(1), 71–99. doi: 10.1080/10627260802153421
Saunders, M., Lewis, P., & Thornhill, A. (2009). Research methods for business students.
Essex: Pearson Education.
Schnackenberg, A. K., & Tomlinson, E. C. (2016). Organizational transparency: A new
perspective on managing trust in organization-stakeholder relationships. Journal of
Management, 42(7), 1784-1810. doi: 10.1177/0149206314525202
92
Shankar, V., Azar, P., & Fuller, M. (2008). Practice Prize Paper—BRAN* EQT: A
Multicategory Brand Equity Model and Its Application at Allstate. Marketing
Science, 27(4), 567-584. Retrieved from https://doi.org/10.1287/mksc.1070.0320
Sichtmann, C. (2007). An analysis of antecedents and consequences of trust in a corporate
brand. European Journal of Marketing, 41(9/10), 999-1015. doi:
10.1108/03090560710773318
Singh, J. J., Iglesias, O., & Batista-Foguet, J. M. (2012). Does having an ethical brand
matter? The influence of consumer perceived ethicality on trust, affect and
loyalty. Journal of Business Ethics, 111(4), 541-549. doi: 10.1007/s10551-012-1216-
7
Stigler, G. (1961). The Economics of Information. Journal of Political Economy, 69(3), 213-
225. Retrieved from http://www.jstor.org.uplib.idm.oclc.org/stable/1829263
Street, C. T., & Meister, D. B. (2004). Small Business Growth and Internal Transparency:
The Role of Information Systems. MIS Quarterly, 28(3), 473–506. Retrieved from
http://search.ebscohost.com.uplib.idm.oclc.org/login.aspx?direct=true&db=bth&AN=
14406336&site=ehost-live&scope=site
Taj, S. A. (2016). Application of signaling theory in management research: Addressing major
gaps in theory. European Management Journal, 34(4), 338-348. Retrieved from
http://dx.doi.org/10.1016/j.emj.2016.02.001
Tanner, J., & Raymond, M. (2015). Principles of marketing. University of Minnesota Libraries
Publishing. Retrieved from http://lib.hpu.edu.vn/handle/123456789/21516
Vaccaro, A., & Echeverri, D. P. (2010). Corporate transparency and green
management. Journal of business ethics, 95(3), 487-506. doi: 10.1007/s10551-010-
0435-z
93
Veloutsou, C., Christodoulides, G., & de Chernatony, L. (2013). A taxonomy of measures
for consumer-based brand equity: drawing on the views of managers in Europe.
Journal of Product & Brand Management, 22(3), 238-248. doi: 10.1108/JPBM-02-
2013-0256
Walumbwa, F. O., Luthans, F., Avey, J. B., & Oke, A. 2011. Authentically leading groups:
The mediating role of collective psychological capital and trust. Journal of Organization
Behavior, 32: 4-24. doi: 10.1002/job.653
Warren, H., Burns, D., & Tackett, J. (2012). The Likelihood of Deception in Marketing: A
Criminological Contextualization. Business & Professional Ethics Journal, 31(1), 109-
134. Retrieved from http://www.jstor.org.uplib.idm.oclc.org/stable/41705472
World Bank, Global consumption database (2018). Retrieved from
http://datatopics.worldbank.org/consumption/country/South-Africa
Westberg, K., & Pope, N. (2014). Building brand equity with cause-related marketing: A
comparison with sponsorship and sales promotion. Journal of Marketing
Communications, 20(6), 419-437. doi:10.1080/13527266.2012.723025
Williams, C. C. 2008. Toward a taxonomy of corporate reporting strategies. Journal of
Business Communication, 45(3): 232-264. doi: 10.1177/0021943608317520
Yoo, B., Donthu, N., & Lee, S. (2000). An examination of selected marketing mix elements
and brand equity. Journal of the academy of marketing science, 28(2), 195-211.
Retrieved from
http://web.a.ebscohost.com.uplib.idm.oclc.org/pfi/pdfviewer/pdfviewer?vid=8&sid=03
18b741-8f65-4c62-9aec-17674f1ad11f%40sessionmgr4007
Zhu, K. (2004). Information transparency of business-to-business electronic markets: A
game-theoretic analysis. Management Science, 50(5), 670-685. doi:
10.1287/mnsc.1040.0226

94
Zikmund, W. G., & Babin, B. J. (2010). Essentials of Marketing Research (4th ed.). South-
Western Cengage Learning.
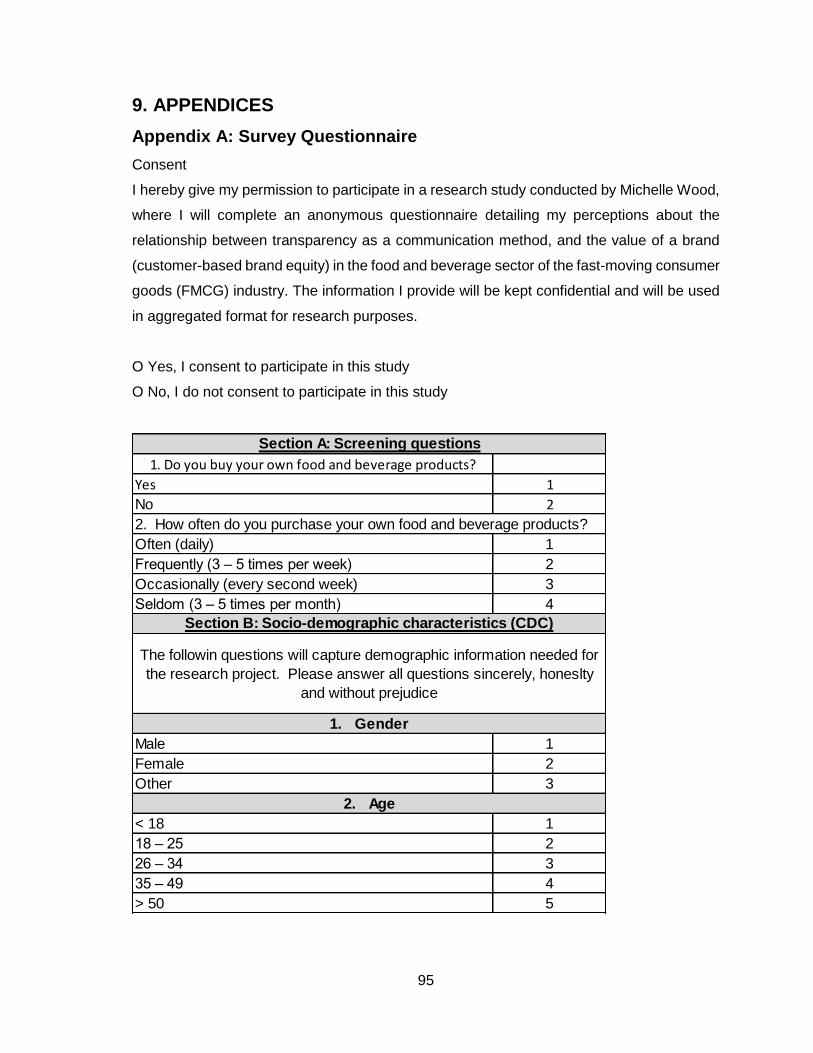
95
9. APPENDICES
Appendix A: Survey Questionnaire
Consent
I hereby give my permission to participate in a research study conducted by Michelle Wood,
where I will complete an anonymous questionnaire detailing my perceptions about the
relationship between transparency as a communication method, and the value of a brand
(customer-based brand equity) in the food and beverage sector of the fast-moving consumer
goods (FMCG) industry. The information I provide will be kept confidential and will be used
in aggregated format for research purposes.
O Yes, I consent to participate in this study
O No, I do not consent to participate in this study
1. Do you buy your own food and beverage products?
Yes 1
No 2
2. How often do you purchase your own food and beverage products?
Often (daily) 1
Frequently (3 – 5 times per week) 2
Occasionally (every second week) 3
Seldom (3 – 5 times per month) 4
Male 1
Female 2
Other 3
< 18 1
18 – 25 2
26 – 34 3
35 – 49 4
> 50 5
2. Age
1. Gender
Section B: Socio-demographic characteristics (CDC)
Section A: Screening questions
The followin questions will capture demographic information needed for
the research project. Please answer all questions sincerely, honeslty
and without prejudice
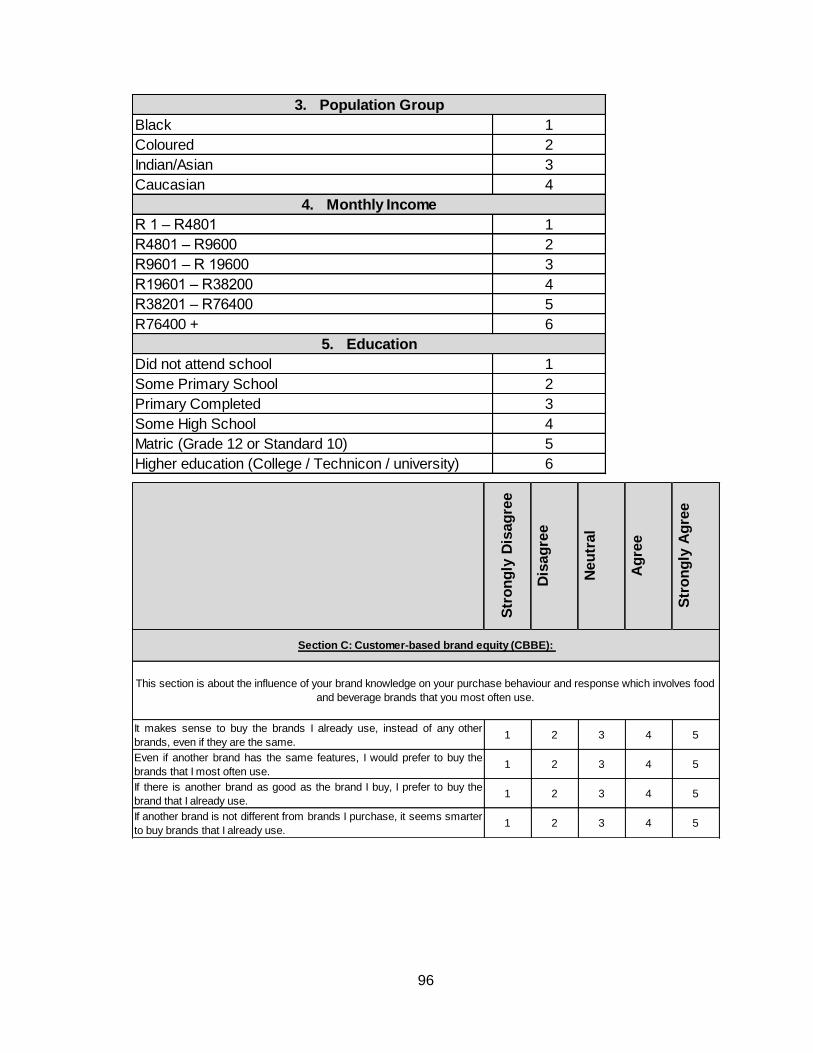
96
Black 1
Coloured 2
Indian/Asian 3
Caucasian 4
R 1 – R4801 1
R4801 – R9600 2
R9601 – R 19600 3
R19601 – R38200 4
R38201 – R76400 5
R76400 + 6
Did not attend school 1
Some Primary School 2
Primary Completed 3
Some High School 4
Matric (Grade 12 or Standard 10) 5
Higher education (College / Technicon / university) 6
5. Education
3. Population Group
4. Monthly Income
Str
on
gly
Dis
ag
ree
Dis
ag
ree
Neu
tral
Ag
ree
Str
on
gly
Ag
ree
It makes sense to buy the brands I already use, instead of any other
brands, even if they are the same.1 2 3 4 5
Even if another brand has the same features, I would prefer to buy the
brands that I most often use.1 2 3 4 5
If there is another brand as good as the brand I buy, I prefer to buy the
brand that I already use.1 2 3 4 5
If another brand is not different from brands I purchase, it seems smarter
to buy brands that I already use.1 2 3 4 5
Section C: Customer-based brand equity (CBBE):
This section is about the influence of your brand knowledge on your purchase behaviour and response which involves food
and beverage brands that you most often use.
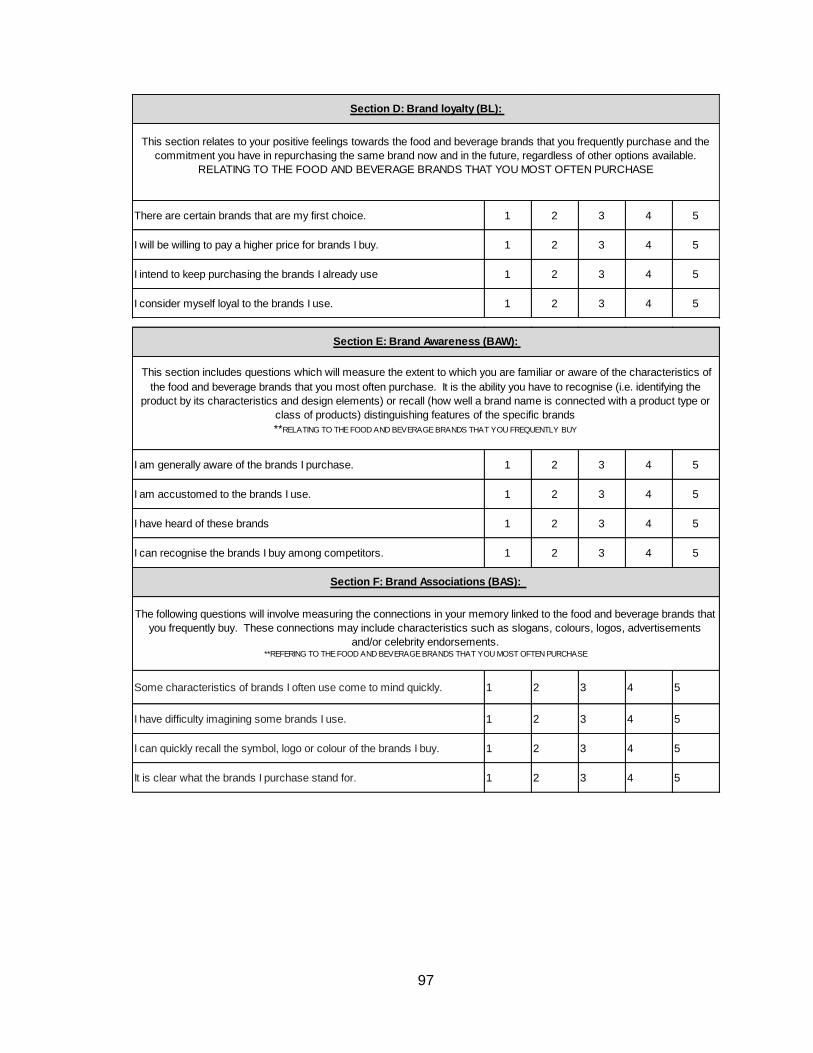
97
There are certain brands that are my first choice. 1 2 3 4 5
I will be willing to pay a higher price for brands I buy. 1 2 3 4 5
I intend to keep purchasing the brands I already use 1 2 3 4 5
I consider myself loyal to the brands I use. 1 2 3 4 5
This section relates to your positive feelings towards the food and beverage brands that you frequently purchase and the
commitment you have in repurchasing the same brand now and in the future, regardless of other options available.
RELATING TO THE FOOD AND BEVERAGE BRANDS THAT YOU MOST OFTEN PURCHASE
Section D: Brand loyalty (BL):
I am generally aware of the brands I purchase. 1 2 3 4 5
I am accustomed to the brands I use. 1 2 3 4 5
I have heard of these brands 1 2 3 4 5
I can recognise the brands I buy among competitors. 1 2 3 4 5
Some characteristics of brands I often use come to mind quickly. 1 2 3 4 5
I have difficulty imagining some brands I use. 1 2 3 4 5
I can quickly recall the symbol, logo or colour of the brands I buy. 1 2 3 4 5
It is clear what the brands I purchase stand for. 1 2 3 4 5
Section F: Brand Associations (BAS):
Section E: Brand Awareness (BAW):
This section includes questions which will measure the extent to which you are familiar or aware of the characteristics of
the food and beverage brands that you most often purchase. It is the ability you have to recognise (i.e. identifying the
product by its characteristics and design elements) or recall (how well a brand name is connected with a product type or
class of products) distinguishing features of the specific brands
**RELATING TO THE FOOD AND BEVERAGE BRANDS THAT YOU FREQUENTLY BUY
The following questions will involve measuring the connections in your memory linked to the food and beverage brands that
you frequently buy. These connections may include characteristics such as slogans, colours, logos, advertisements
and/or celebrity endorsements.**REFERING TO THE FOOD AND BEVERAGE BRANDS THAT YOU MOST OFTEN PURCHASE
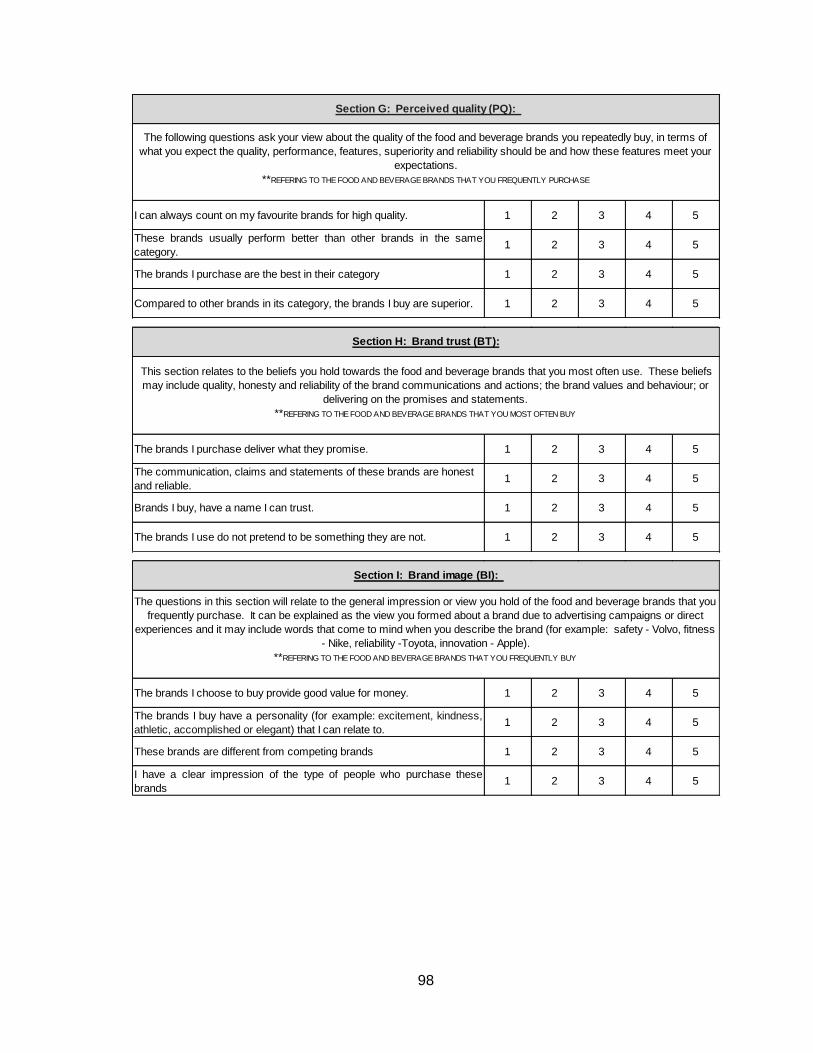
98
I can always count on my favourite brands for high quality. 1 2 3 4 5
These brands usually perform better than other brands in the same
category.1 2 3 4 5
The brands I purchase are the best in their category 1 2 3 4 5
Compared to other brands in its category, the brands I buy are superior. 1 2 3 4 5
Section G: Perceived quality (PQ):
The following questions ask your view about the quality of the food and beverage brands you repeatedly buy, in terms of
what you expect the quality, performance, features, superiority and reliability should be and how these features meet your
expectations.
**REFERING TO THE FOOD AND BEVERAGE BRANDS THAT YOU FREQUENTLY PURCHASE
The brands I purchase deliver what they promise. 1 2 3 4 5
The communication, claims and statements of these brands are honest
and reliable.1 2 3 4 5
Brands I buy, have a name I can trust. 1 2 3 4 5
The brands I use do not pretend to be something they are not. 1 2 3 4 5
Section H: Brand trust (BT):
This section relates to the beliefs you hold towards the food and beverage brands that you most often use. These beliefs
may include quality, honesty and reliability of the brand communications and actions; the brand values and behaviour; or
delivering on the promises and statements.
**REFERING TO THE FOOD AND BEVERAGE BRANDS THAT YOU MOST OFTEN BUY
The brands I choose to buy provide good value for money. 1 2 3 4 5
The brands I buy have a personality (for example: excitement, kindness,
athletic, accomplished or elegant) that I can relate to.1 2 3 4 5
These brands are different from competing brands 1 2 3 4 5
I have a clear impression of the type of people who purchase these
brands1 2 3 4 5
The questions in this section will relate to the general impression or view you hold of the food and beverage brands that you
frequently purchase. It can be explained as the view you formed about a brand due to advertising campaigns or direct
experiences and it may include words that come to mind when you describe the brand (for example: safety - Volvo, fitness
- Nike, reliability -Toyota, innovation - Apple).
**REFERING TO THE FOOD AND BEVERAGE BRANDS THAT YOU FREQUENTLY BUY
Section I: Brand image (BI):
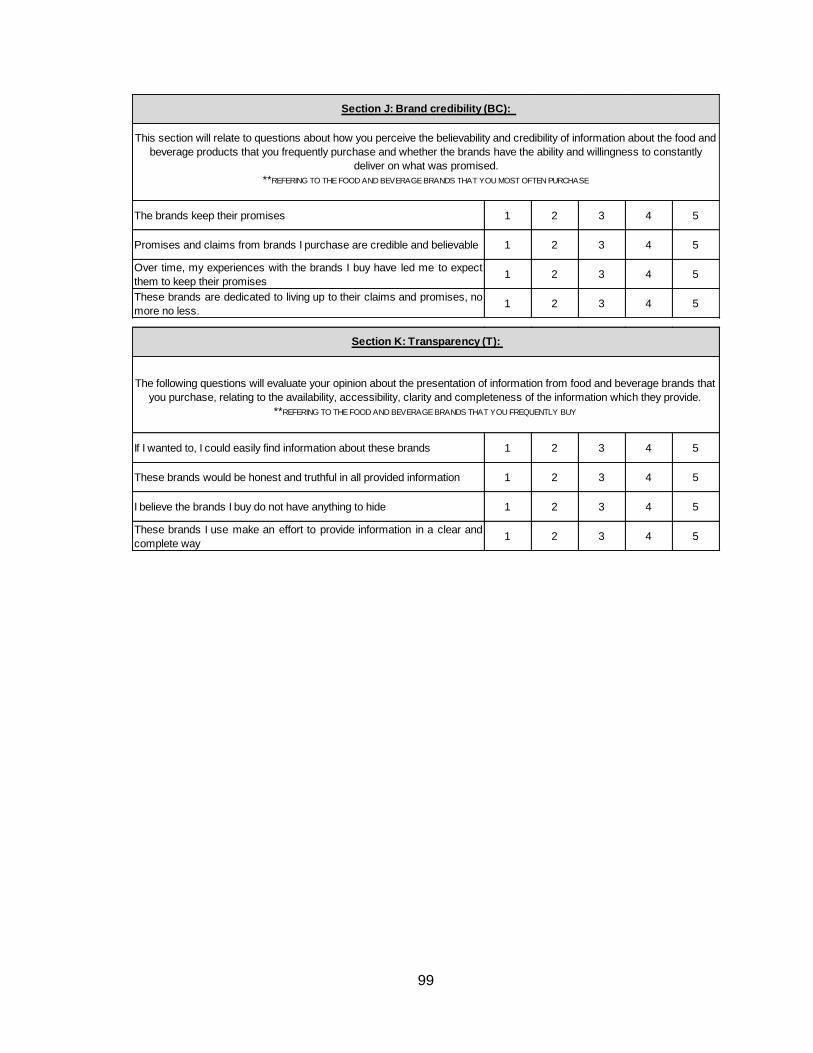
99
The brands keep their promises 1 2 3 4 5
Promises and claims from brands I purchase are credible and believable 1 2 3 4 5
Over time, my experiences with the brands I buy have led me to expect
them to keep their promises1 2 3 4 5
These brands are dedicated to living up to their claims and promises, no
more no less.1 2 3 4 5
This section will relate to questions about how you perceive the believability and credibility of information about the food and
beverage products that you frequently purchase and whether the brands have the ability and willingness to constantly
deliver on what was promised.
**REFERING TO THE FOOD AND BEVERAGE BRANDS THAT YOU MOST OFTEN PURCHASE
Section J: Brand credibility (BC):
If I wanted to, I could easily find information about these brands 1 2 3 4 5
These brands would be honest and truthful in all provided information 1 2 3 4 5
I believe the brands I buy do not have anything to hide 1 2 3 4 5
These brands I use make an effort to provide information in a clear and
complete way1 2 3 4 5
Section K: Transparency (T):
The following questions will evaluate your opinion about the presentation of information from food and beverage brands that
you purchase, relating to the availability, accessibility, clarity and completeness of the information which they provide.
**REFERING TO THE FOOD AND BEVERAGE BRANDS THAT YOU FREQUENTLY BUY
100
Appendix B: GIBS ethical clearance approval
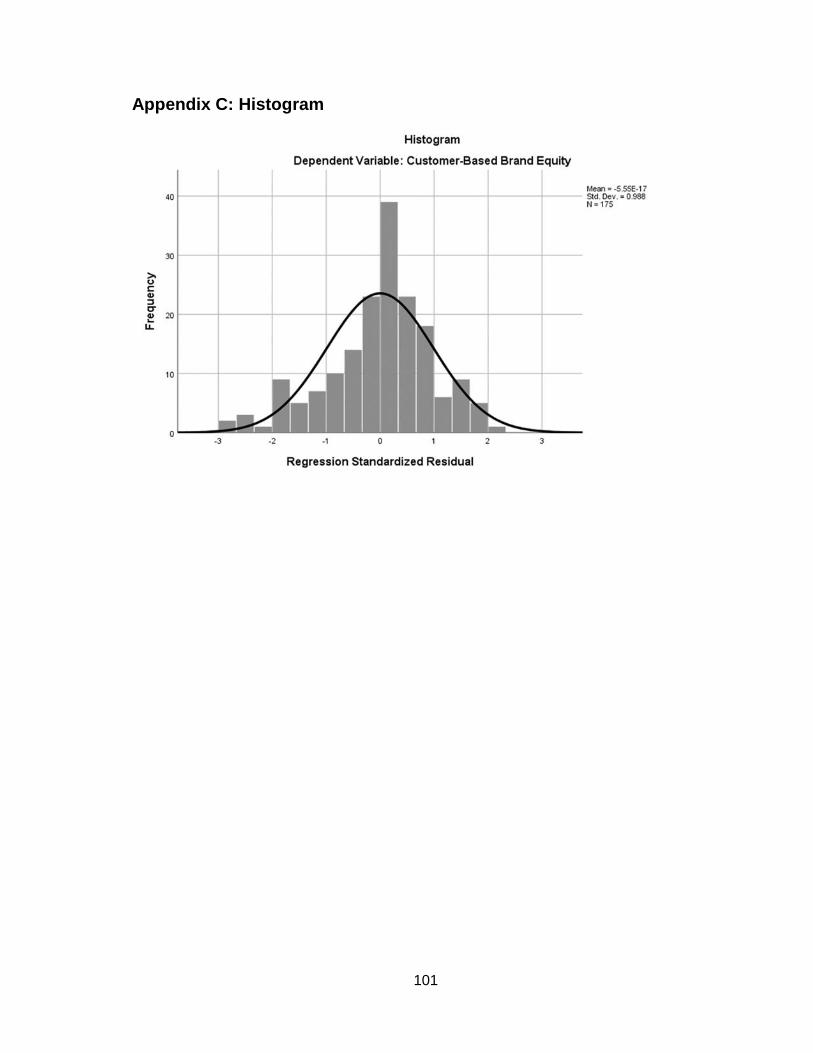
101
Appendix C: Histogram
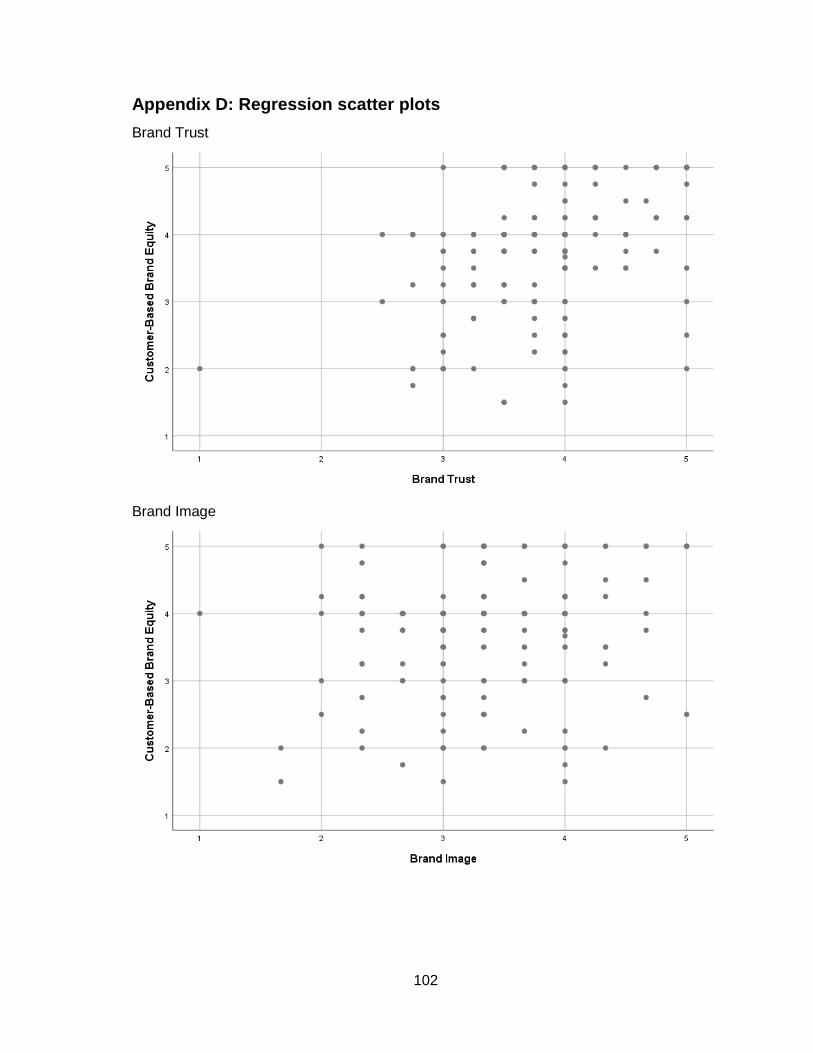
102
Appendix D: Regression scatter plots
Brand Trust
Brand Image
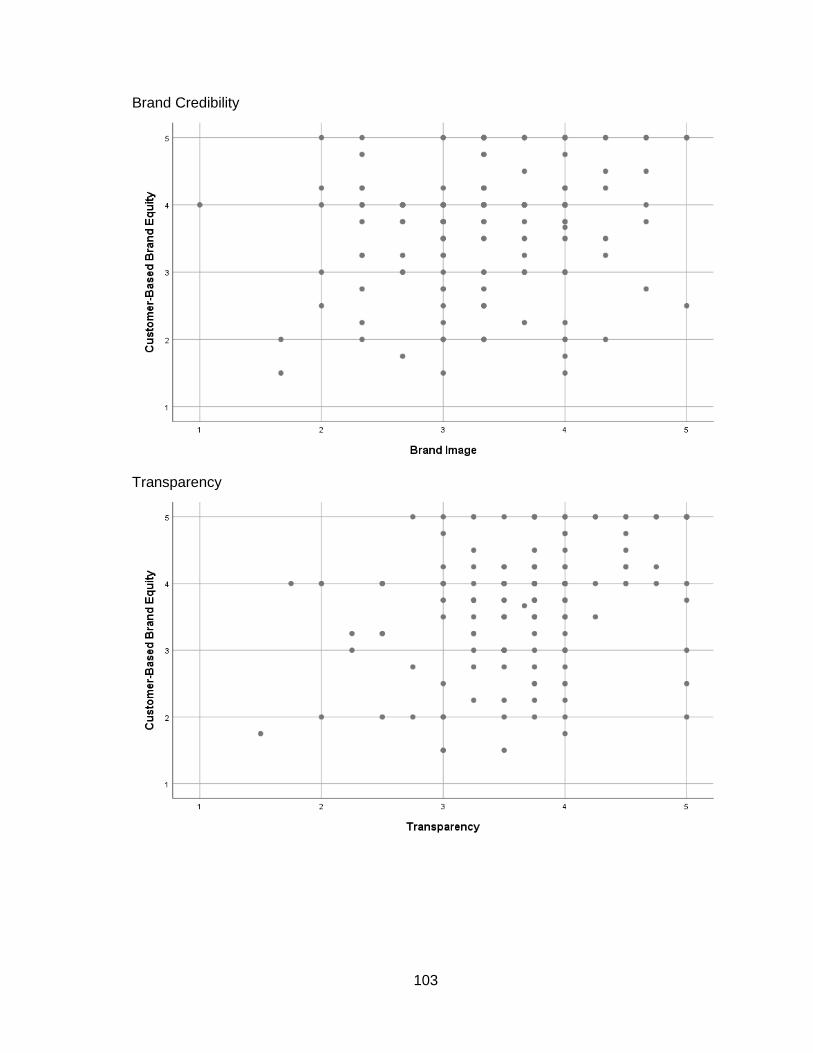
103
Brand Credibility
Transparency
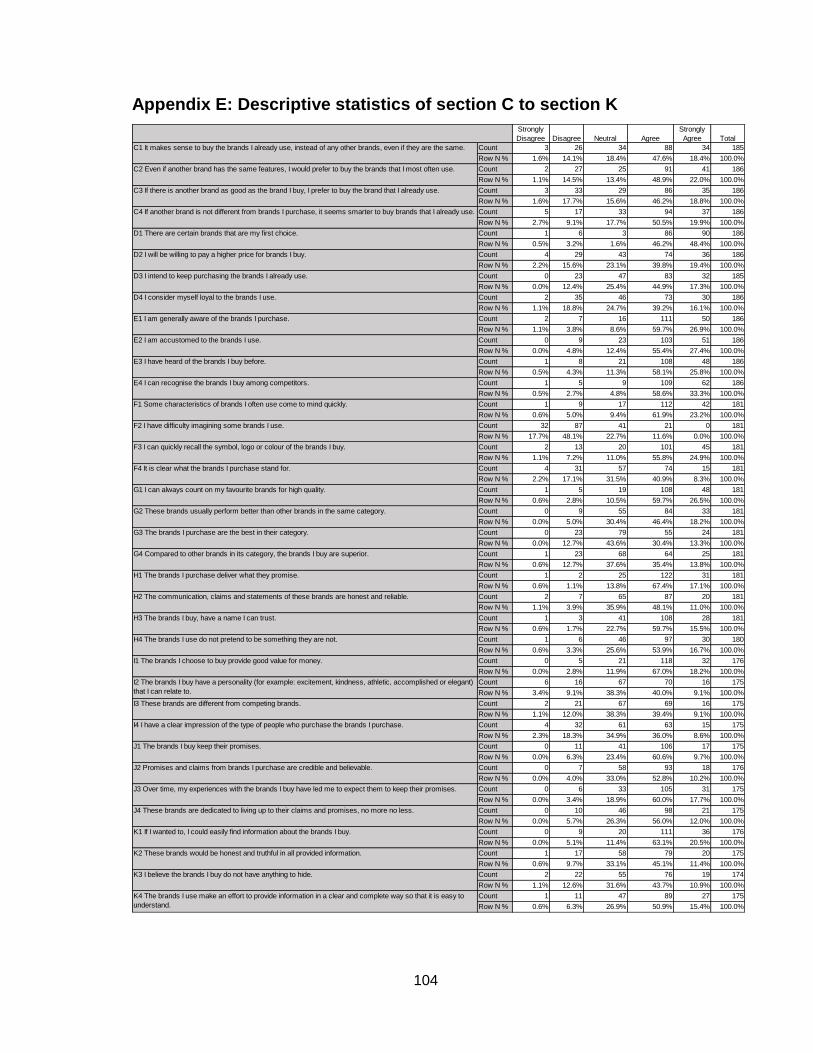
104
Appendix E: Descriptive statistics of section C to section K
Strongly
Disagree Disagree Neutral Agree
Strongly
Agree Total
Count 3 26 34 88 34 185
Row N % 1.6% 14.1% 18.4% 47.6% 18.4% 100.0%
Count 2 27 25 91 41 186
Row N % 1.1% 14.5% 13.4% 48.9% 22.0% 100.0%
Count 3 33 29 86 35 186
Row N % 1.6% 17.7% 15.6% 46.2% 18.8% 100.0%
Count 5 17 33 94 37 186
Row N % 2.7% 9.1% 17.7% 50.5% 19.9% 100.0%
Count 1 6 3 86 90 186
Row N % 0.5% 3.2% 1.6% 46.2% 48.4% 100.0%
Count 4 29 43 74 36 186
Row N % 2.2% 15.6% 23.1% 39.8% 19.4% 100.0%
Count 0 23 47 83 32 185
Row N % 0.0% 12.4% 25.4% 44.9% 17.3% 100.0%
Count 2 35 46 73 30 186
Row N % 1.1% 18.8% 24.7% 39.2% 16.1% 100.0%
Count 2 7 16 111 50 186
Row N % 1.1% 3.8% 8.6% 59.7% 26.9% 100.0%
Count 0 9 23 103 51 186
Row N % 0.0% 4.8% 12.4% 55.4% 27.4% 100.0%
Count 1 8 21 108 48 186
Row N % 0.5% 4.3% 11.3% 58.1% 25.8% 100.0%
Count 1 5 9 109 62 186
Row N % 0.5% 2.7% 4.8% 58.6% 33.3% 100.0%
Count 1 9 17 112 42 181
Row N % 0.6% 5.0% 9.4% 61.9% 23.2% 100.0%
Count 32 87 41 21 0 181
Row N % 17.7% 48.1% 22.7% 11.6% 0.0% 100.0%
Count 2 13 20 101 45 181
Row N % 1.1% 7.2% 11.0% 55.8% 24.9% 100.0%
Count 4 31 57 74 15 181
Row N % 2.2% 17.1% 31.5% 40.9% 8.3% 100.0%
Count 1 5 19 108 48 181
Row N % 0.6% 2.8% 10.5% 59.7% 26.5% 100.0%
Count 0 9 55 84 33 181
Row N % 0.0% 5.0% 30.4% 46.4% 18.2% 100.0%
Count 0 23 79 55 24 181
Row N % 0.0% 12.7% 43.6% 30.4% 13.3% 100.0%
Count 1 23 68 64 25 181
Row N % 0.6% 12.7% 37.6% 35.4% 13.8% 100.0%
Count 1 2 25 122 31 181
Row N % 0.6% 1.1% 13.8% 67.4% 17.1% 100.0%
Count 2 7 65 87 20 181
Row N % 1.1% 3.9% 35.9% 48.1% 11.0% 100.0%
Count 1 3 41 108 28 181
Row N % 0.6% 1.7% 22.7% 59.7% 15.5% 100.0%
Count 1 6 46 97 30 180
Row N % 0.6% 3.3% 25.6% 53.9% 16.7% 100.0%
Count 0 5 21 118 32 176
Row N % 0.0% 2.8% 11.9% 67.0% 18.2% 100.0%
Count 6 16 67 70 16 175
Row N % 3.4% 9.1% 38.3% 40.0% 9.1% 100.0%
Count 2 21 67 69 16 175
Row N % 1.1% 12.0% 38.3% 39.4% 9.1% 100.0%
Count 4 32 61 63 15 175
Row N % 2.3% 18.3% 34.9% 36.0% 8.6% 100.0%
Count 0 11 41 106 17 175
Row N % 0.0% 6.3% 23.4% 60.6% 9.7% 100.0%
Count 0 7 58 93 18 176
Row N % 0.0% 4.0% 33.0% 52.8% 10.2% 100.0%
Count 0 6 33 105 31 175
Row N % 0.0% 3.4% 18.9% 60.0% 17.7% 100.0%
Count 0 10 46 98 21 175
Row N % 0.0% 5.7% 26.3% 56.0% 12.0% 100.0%
Count 0 9 20 111 36 176
Row N % 0.0% 5.1% 11.4% 63.1% 20.5% 100.0%
Count 1 17 58 79 20 175
Row N % 0.6% 9.7% 33.1% 45.1% 11.4% 100.0%
Count 2 22 55 76 19 174
Row N % 1.1% 12.6% 31.6% 43.7% 10.9% 100.0%
Count 1 11 47 89 27 175
Row N % 0.6% 6.3% 26.9% 50.9% 15.4% 100.0%
C1 It makes sense to buy the brands I already use, instead of any other brands, even if they are the same.
C2 Even if another brand has the same features, I would prefer to buy the brands that I most often use.
C3 If there is another brand as good as the brand I buy, I prefer to buy the brand that I already use.
C4 If another brand is not different from brands I purchase, it seems smarter to buy brands that I already use.
D1 There are certain brands that are my first choice.
D2 I will be willing to pay a higher price for brands I buy.
D3 I intend to keep purchasing the brands I already use.
D4 I consider myself loyal to the brands I use.
E1 I am generally aware of the brands I purchase.
E2 I am accustomed to the brands I use.
E3 I have heard of the brands I buy before.
E4 I can recognise the brands I buy among competitors.
F1 Some characteristics of brands I often use come to mind quickly.
F2 I have difficulty imagining some brands I use.
F3 I can quickly recall the symbol, logo or colour of the brands I buy.
F4 It is clear what the brands I purchase stand for.
G1 I can always count on my favourite brands for high quality.
G2 These brands usually perform better than other brands in the same category.
G3 The brands I purchase are the best in their category.
G4 Compared to other brands in its category, the brands I buy are superior.
H1 The brands I purchase deliver what they promise.
H2 The communication, claims and statements of these brands are honest and reliable.
H3 The brands I buy, have a name I can trust.
H4 The brands I use do not pretend to be something they are not.
I1 The brands I choose to buy provide good value for money.
I2 The brands I buy have a personality (for example: excitement, kindness, athletic, accomplished or elegant)
that I can relate to.
I3 These brands are different from competing brands.
I4 I have a clear impression of the type of people who purchase the brands I purchase.
J1 The brands I buy keep their promises.
J2 Promises and claims from brands I purchase are credible and believable.
J3 Over time, my experiences with the brands I buy have led me to expect them to keep their promises.
J4 These brands are dedicated to living up to their claims and promises, no more no less.
K1 If I wanted to, I could easily find information about the brands I buy.
K2 These brands would be honest and truthful in all provided information.
K3 I believe the brands I buy do not have anything to hide.
K4 The brands I use make an effort to provide information in a clear and complete way so that it is easy to
understand.
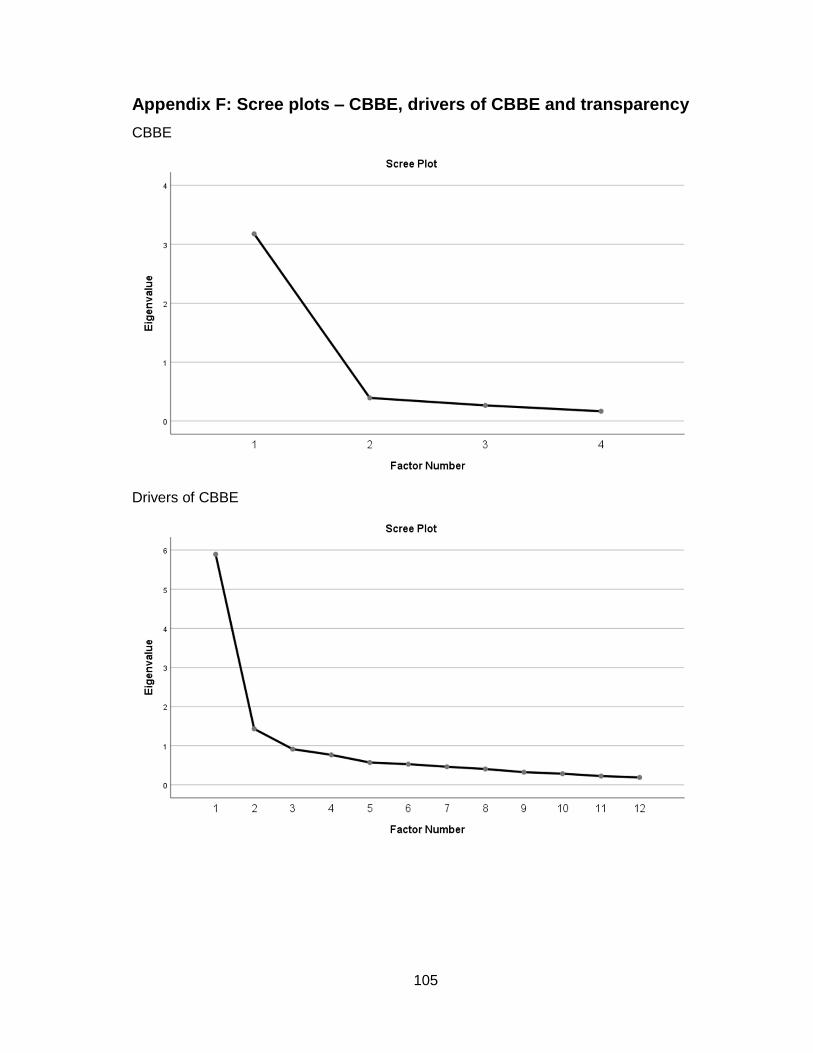
105
Appendix F: Scree plots – CBBE, drivers of CBBE and transparency
CBBE
Drivers of CBBE
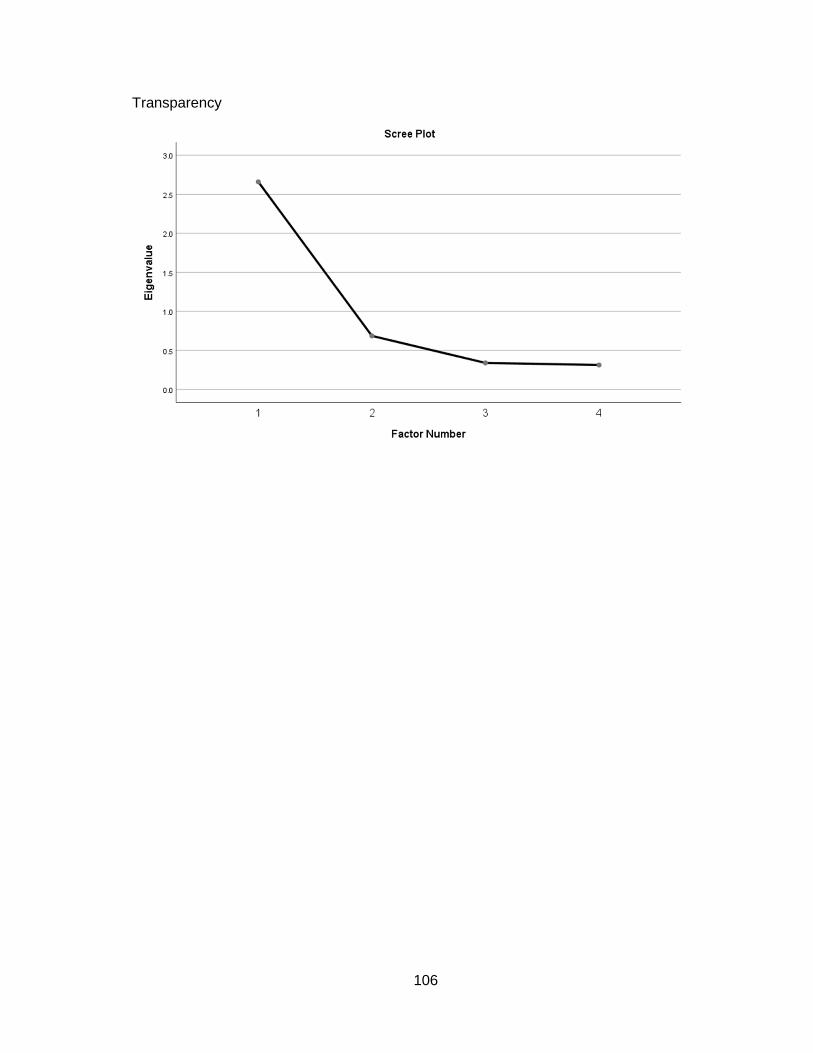
106
Transparency
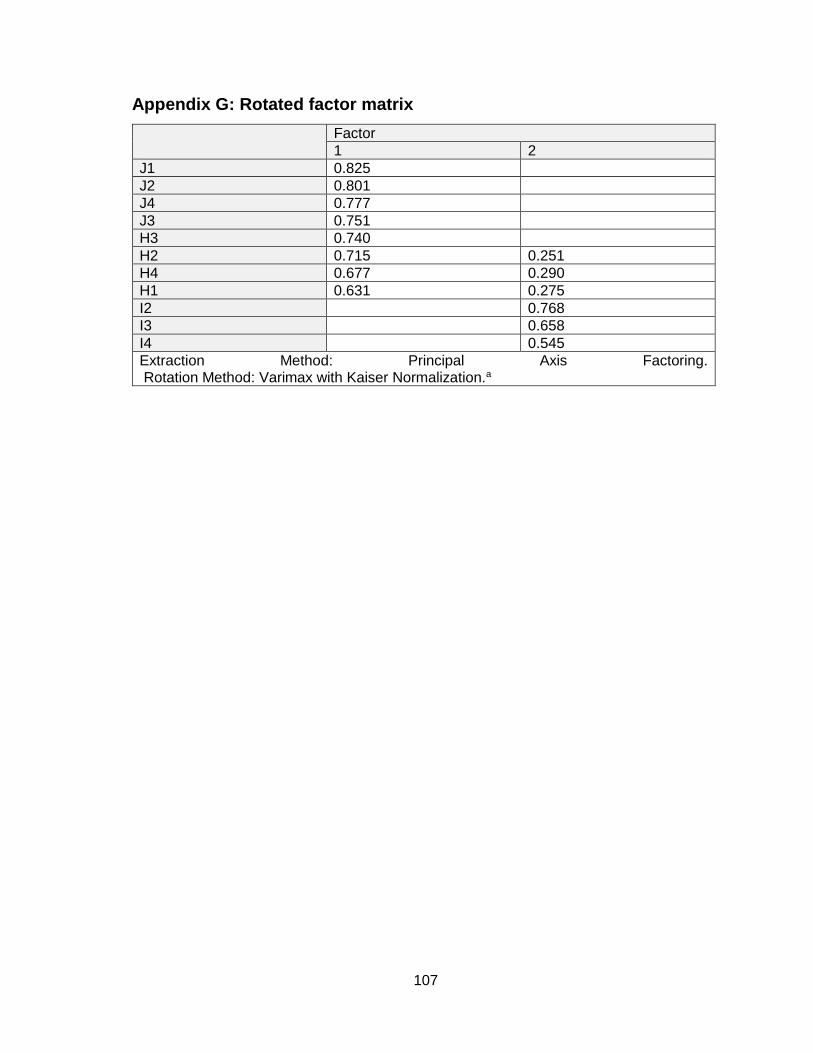
107
Appendix G: Rotated factor matrix
Factor
1 2
J1 0.825
J2 0.801
J4 0.777
J3 0.751
H3 0.740
H2 0.715 0.251
H4 0.677 0.290
H1 0.631 0.275
I2 0.768
I3 0.658
I4 0.545
Extraction Method: Principal Axis Factoring. Rotation Method: Varimax with Kaiser Normalization.a