the relationship between work-life balance, stress, and
TRANSCRIPT
The Relationship Between Work-life Balance, Stress, and Injury in Construction
Trade Workers
Leanna L Gordon
A thesis
submitted in partial fulfillment of the
requirements for the degree of
Master of Public Health
University of Washington
2019
Committee:
June Spector
Noah Seixas
Hannah Curtis
Paul Faestel
Program Authorized to Offer Degree:
Occupational and Environmental Health Services

© Copyright 2019
Leanna L Gordon
University of Washington
Abstract
The Relationship Between Work-life Balance, Stress, and Injury in Construction Trade Workers
Leanna L Gordon
Chair of the Supervisory Committee:
June Spector, MD, MPH
Department of Occupational and Environmental Health Services
Objectives: The construction industry is characterized by a high burden of occupational injuries.
In addition to physical risk factors, psychosocial risk factors such as work-life balance can increase
the risk for injury. Women, who are underrepresented in the construction trades, are
disproportionally affected by these factors, which may increase the risk for adverse health
outcomes. Women within the trades have been shown to struggle with work-life balance due to a
number of factors including long work hours, difficulty finding child care, and ongoing
responsibility for unpaid labor in the home. The purpose of this study was to investigate the
association between work-life balance, stress, and injury in construction trades workers in order to
pave the way for changes in policy and practices within the trades that will allow for a safe working
environment for all workers.
Methods: We performed a cross-sectional analysis of data from the Safety and Health
Empowerment for Women in Trades (SHEWT) study. We studied data obtained from 291
construction workers in Washington State who participated in the SHEWT survey. We used
logistic regression to assess the association between: 1) work-life balance and perceived stress;
and 2) the association between perceived stress and injury, adjusted for relevant confounders.
Perceived stress was measured using the validated Perceived Stress Scale, and work-life balance
was assessed using questions from the NIOSH Quality of Work Life Questionnaire. The presence
or absence of injury was determined using questions which assessed whether or not trades workers
had an injury in the last year which required medical attention, first aid, or time off work. In both
analyses, we assessed for effect modification by gender.
Results: Reporting poor work-life balance was associated with 4.38 (95% CI 1.87, 10.61) times
the odds of high perceived stress, after adjustment for trade, age, and gender. Additionally, being
a woman was associated with 2.38 (95% CI 1.23, 4.76) times the odds of high perceived stress
when compared to being a man, after adjustment for work-life balance, trade, and age. High
perceived stress was associated with 1.96 (95% CI 1.08-3.54) times the odds of injury, after
adjustment for trade and gender. Additionally, being a woman was associated with 2.94 (95% CI
1.49-6.25) times the odds of injury when compared to being a man, after adjustment for stress and
trade. There was no evidence of effect modification by gender in either analysis.
Conclusions: This study demonstrated an association between poor work-life balance and
perceived stress and between perceived stress and injury in construction trades workers. Women
were at higher risk of high stress and injury compared to men, after adjustment for other factors.
Future work should evaluate the effectiveness of efforts to address work-life balance and perceived
stress in injury prevention efforts and to foster safe participation of women, in addition to men, in
the construction trades.

INTRODUCTION:
A. Women as a minority in the construction trades
Women account for only 3.4% of construction workers in the United States, a percentage
that has not changed over the last 40 years (United States Department of Labor, 2019) (Hegewisch
& O'Farrell, 2015). Due to a growing shortage of skilled workers in the construction trades and a
thriving economy, there has been a push to draw in new workers, including women (Institute for
Women's Policy Research, 2014). While research has shown that women enjoy working within
the construction trades (due to high pay, family benefits, ability to learn tangible skills, etc.) and
are able to perform these skilled jobs, they continue to face a variety of barriers to entering and
staying in the field which include isolation, intimidation, concern for slow career progression,
difficulty achieving work-life balance, an unwelcoming, male-dominated culture, discrimination,
and harassment (Hegewisch & O'Farrell, 2015) (Menches & Abraham, 2007) (Moir, Thomson, &
Kelleher, 2001). Despite their working status, the social expectation that women will continue to
perform the majority of unpaid labor at home (e.g. housework, child care, shopping) still exists
(Walters & Whitehouse, 2012) (Hunt & Annandale, 1993). This places women in a difficult
situation, as women who have to adjust their work schedules to complete their home
responsibilities may be perceived as less committed to their jobs (Watts, 2009). The relationship
between work-life balance and gender will be discussed further below in section E.
The way in which these factors contribute to health, particularly levels of perceived stress
and injuries, is not yet well understood. While these are concerns for all working persons,
tradeswomen are a unique population in that they work in a high demand, male-dominated industry
that historically does not adequately support women (Hegewisch & O'Farrell, 2015).

B. Injury as a problem in the construction trades
The construction industry is characterized by a high burden of occupational injuries. In
2013, the construction trades were identified in a Washington State Department of Labor and
Industries’ report as one of the highest risk industries for workers’ health and were prioritized for
further research into prevention strategies (Anderson, Bonauto, & Adams, 2013). In this report,
Anderson et al described the distribution of injuries, including by National Occupational Research
Agenda (NORA) sectors, which classify industries into 10 different sectors. Using Washington
State Fund (SF) workers’ compensation compensable injury claims data from 2002-2010, workers
in the NORA sector “construction” had 477.5 injury claims per 10,000 full-time equivalents
(compared to 19.1/10,000 FTE in all sectors combined) with a median cost per claim of $14,828,
the highest of any sector. Additionally, the construction sector had a median of 69 days of work
time lost per claim, compared to an average of 43 days of time lost in all sectors combined.
Nationally, in 2017, the most common causes of death in the construction industry were falls,
being struck by an object, electrocution, and being caught in or between an object or equipment
(Occupational Health and Safety Administration., 2018). This information suggests a need for
ongoing research into the reason for the high prevalence of injury within the construction trades
and ways that injuries can be prevented. While there are no data available that describe the injury
rates for women in the trades, as they are so under-represented, studies do suggest that they may
be more at risk of injury due to the numerous stressors they experience (Curtis, Meischke, Stover,
Simcox, & Seixas, 2018).

C. Risk factors for poor health outcomes in the construction trades
Workers in the construction trades are at risk for poor health outcomes due to a variety of
different factors. These factors include working at high heights, improper fall protection measures,
use of heavy machinery (Occupational Health and Safety Administration., 2018), lifting
requirements, awkward postures, and vibration exposures (Schneider, 2001).
In addition to physical factors, there are a variety of psychosocial factors these workers
face. These include job strain, gender discrimination, racial discrimination, age discrimination,
bullying, sexual harassment, overcompensation (pushing ones’ body past its physical comfort to
get the job done ), suboptimal work-life balance, isolation, tokenism, negative safety climate, and
lack of social support (Curtis, Meischke, Stover, Simcox, & Seixas, 2018). These psychosocial
factors have been shown to adversely affect workers’ health and safety as they have been shown
to be associated with stress and both psychological and physical strain. For example, work by
Goldenhar et al in 2003 described how some of these factors (overcompensation, safety climate,
social support, harassment, discrimination) can lead to an increase in psychological symptoms,
which have been associated with near miss incidents at work. Their work showed how both
harassment and discrimination were associated with both physical and psychological symptoms in
both men and women (Goldenhar, Williams, & Swanson, 2003). Researchers have also found that
higher level of social support from supervisors and peers was associated with improved job
satisfaction (Goldenhar, Williams, & Swanson, 2003) (Boschman, van der Molen, Sluiter, &
Frings-Dresen, 2013). Multiple studies have shown a relationship between job satisfaction with
both mental and physical health, and an especially strong association has been seen between
decreased job satisfaction and depression, anxiety, and burnout (Faragher, Cass, & Cooper, 2005).

A number of these psychosocial factors, such as gender discrimination, sexual harassment,
tokenism, and isolation, disproportionately affect women. Previous work has shown that sexual
harassment, which disproportionately affects women, in the workplace affects job satisfaction and
is associated with depression and threatened physical health (Fitzgerald, Drasgow, Hulin, Gelfand,
& Magley, 1997). Studies have also shown that sexism and discrimination within the workplace
affect one’s job satisfaction and psychological well-being (Bond, Punnett, Pyle, Cazeca, &
Cooperman, 2004). In addition to being a minority within the construction trades, women also
disproportionately face these risk factors, which threaten their health.
D. Perceived stress in the construction trades
As discussed above, many of the psychosocial exposures discussed above have been
associated with an increase in psychological symptoms, including stress. Elevated stress has been
shown to play a role in diseases, including depression, cardiovascular disease (CVD), human
immunodeficiency virus (HIV), and cancer (Cohen, Janicki-Deverts, & Miller, 2007). Work by
Burns et al. in 2019 showed a relationship between increased levels of perceived stress and injury
in recycling workers in Ghana (Burns, Sayler, & Neitzel, 2019). A study by Wilkins et al. showed
a significantly increased odds of injury in working women who reported stress compared to those
who did not (Wilkins & Mackenzie, 2007). A large prospective study in Denmark showed that
higher perceived stress was associated with a higher incidence of sickness absence, a relationship
that was much stronger for women than for men (Vester Thorsen, et al., 2019).
Factors such as job strain, gender discrimination, age discrimination, bullying, poor work-
life balance, isolation, sexual harassment, poor safety climate, and inadequate social support have
been reported by Curtis et al. to be associated with higher levels of perceived stress in women

construction trades workers (Curtis, Meischke, Stover, Simcox, & Seixas, 2018). In the same
study, the only exposure significantly associated with elevated perceived stress in men was poor
work-life balance. Given the various negative health outcomes associated with stress, it is
important to continue to research the potential causes for, and outcomes of, increased perceived
stress in construction trades workers.
E. Work-life balance in the construction trades
With the high demands of their careers, construction trades workers may find it difficult to
find adequate work-life balance. Identified stressors for construction workers include long work
hours, extensive commuting to jobs, a “hire and fire culture”, and tight deadlines (Beswick,
Rogers, Corbett, Binch, & Jackson, 2007). Women often bear the burden of unpaid labor at home
(household chores, childcare, etc.), which may lead to even more difficulty for women to achieve
adequate work-life balance (Walters & Whitehouse, 2012). A study specifically looking at
construction workers found that work-to-family conflict and family-to-work conflict were
associated with elevated blood pressure, missing work for injury, and reports of pain (Bodner,
Kraner, Bradford, Hammer, & Truxillo, 2014). One study of workers in various industries showed
that the presence of work-family conflict, when work demands interfere with one’s abilities to
address family demands and vice-versa, is associated with depression, poor physical health, and
heavy alcohol use (Frone, Russell, & Barnes, 1996). Work-family conflict has also been associated
with a variety of psychosocial outcomes, including job dissatisfaction, burnout, life dissatisfaction,
and marital dissatisfaction (Allen, Herst, Bruck, & Sutton, 2000). While these factors indicate there
is a relationship between work-life balance and psychosocial stress and health, the relationship of
work-life balance with stress and occupational injury has not been fully explored.
G. Specific Aims
The specific aims of this study are:
Aim 1: To determine the association between work-life balance and perceived stress in
construction trades workers. The working hypothesis is that poor work-life balance is associated
with higher levels of perceived stress.
Sub-aim 1: To determine how this association differs between men and women. The
working hypothesis is that poor work-life balance is associated with higher levels of
perceived stress in both men and women, but that the magnitude of this relationship is
higher in women than in men.
Aim 2: To determine the association between perceived stress and injury in construction trades
workers. The working hypothesis is that higher levels of perceived stress are associated with higher
risk of injury.
Sub-aim 2: To determine how this association differs between men and women. The
working hypothesis is that higher levels of perceived stress are associate with a higher risk
of injury in both men and women, but the magnitude of this relationship is higher in women
than in men.
The long-term goal of this study is to better understand risk factors for adverse occupational health
outcomes that construction trades workers, especially women, face and how these risk factors can
be addressed through prevention strategies. The ultimate goal of this research is to decrease
occupational injuries and work-related stress. Based on information in the literature, it appears that

stress may be a mediator between a work-life balance and injury, and this relationship could be
further explored in future studies.
METHODS
A. Study Design, Survey Tool, and Study Subjects
In order to investigate the relationships between injury, stress, and work-life balance in
construction trade workers, a secondary analysis of cross-sectional survey data from the Safety
and Health Empowerment for Women in Trades (SHEWT) study was performed (Curtis,
Meischke, Stover, Simcox, & Seixas, 2018).
1. The parent study: Safety and Health Empowerment for Women in Trades
(SHEWT)
As described by Curtis et al., the purpose of the SHEWT study was to investigate the
difference in occupational exposures, including psychosocial exposures, between women
and men and to see how the exposures are associated with stress and injury (Curtis,
Meischke, Stover, Simcox, & Seixas, 2018). Curtis et al. focused on how these differences
between women and men could negatively affect the health of women in the trades due to
concerns raised by community partners regarding women as a minority in the trades and
the risk of negative safety outcomes. The multi-phase SHEWT study was performed in
collaboration with the University of Washington Department of Environmental and
Occupational Health Sciences, Washington Women in Trades, and Washington State
Labor and Education Research Center (University of Washington, 2019). The study was
promoted by the research team through apprenticeship classes, contractor safety events,
union meetings, and social media. Any women and men who were currently working in

construction trades in Washington State were eligible to participate in the study. There
were 34 unions, 22 apprenticeship programs, 9 trade associations, and 20 contractors who
participated in the study (Curtis, Meischke, Stover, Simcox, & Seixas, 2018). In total, 291
workers completed the study: 198 women (68%) and 93 men (32%). Study procedures
were reviewed and approved by the Washington State Institutional Review Board.
2. SHEWT survey
Participants in the SHEWT study completed a survey that was developed using
subsets of questions from different existing scales and questions drawn from pilot focus
groups (See Appendix A). The questions were pilot tested with workers and revisions were
made as needed. The original analysis of the survey focused on eight physical and 12
psychosocial exposures. The physical exposures included: dust or fumes,
chemicals/acids/solvents, high noise, traffic or moving vehicles, being struck by
materials/tools/equipment, working at heights without barriers, electric shocks, and fit of
personal protective equipment (PPE). The questions asked participants how often they
encountered the various hazards, and choices ranged from “never” to “always”.
Psychosocial exposure question topics included: job strain and social support using the
NIOSH Generic Job Stress Questionnaire (GJSQ) (Hurrell & McLaney, 1988); gender
discrimination, racial discrimination, age discrimination, and work-life balance, using the
NIOSH Quality of Work Life Questionnaire (NIOSH, 2010); and bullying, sexual
harassment, overcompensation, isolation, tokenism, and safety climate. The NIOSH
Quality of Work Life Questionnaire was developed by NIOSH and the National Science
Foundation as part of the General Social Survey (GSS). The portion addressing quality of

work life is administered every other year to participants of the GSS, which is a nationally
representative personal interview survey of U.S. households. The NIOSH GJSQ is a tool
initially described by Hurrell and McLaney in 1988 and has been used frequently since that
time. The survey also asked about perceived stress using the Perceived Stress Scale, a well-
established scale which measures the degree to which someone perceives a situation as
stressful (Cohen, Kamarck, & Mermelstein, A Global Measure of Perceived Stress, 1983).
Subjects answer questions regarding their various experiences, selecting from five choices
ranging from “never” to “very often”. Questions regarding additional psychosocial
exposures were obtained either from other pre-existing surveys, researcher knowledge, or
focus groups. Questions pertaining to the injuries were developed by the study team, who
had expertise in occupational safety.
3. Exposures and outcomes
The perceived stress variable, used as the outcome variable in Aim 1 and exposure
variable in Aim 2 of the present study, was created using the method employed in the
SHEWT study. The responses were dichotomized at the 75th percentile to determine low
(lower 75%) versus high (upper 25%) stress. The injury (in the past year) outcome variable
was created using the same method as that used in the parent study. An injury was defined
as an injury requiring first aid or medical attention or requiring time off work.
Work-life balance was used as the exposure variable in Aim 1. The section of the
survey addressing work-life balance included questions from the NIOSH Quality of Work
Life Questionnaire. The work-life balance variable was created using the responses to the
questions “How often do the demands of your job interfere with your family or personal

life?” (Often, Sometimes, Rarely, Never, Prefer not to answer) and “How often do the
demands of your family interfere with your work on the job?” (Often, Sometimes, Rarely,
Never, Prefer not to answer). The average answer to these two questions was used. In the
original analysis of the data, the question “How hard is it to take time off during your work
to take care of personal or family matters?” was used in addition to the other two question
to define the work-life balance variable. In this study, it was felt that this question may be
a confounder, rather than a determinant of work-life balance, and was evaluated as such.
Those who answered below the 25th percentile (more frequently answered often or
sometimes) as an average of the two questions were considered to have poor work-life
balance, and the remainder were considered to have good work-life balance.
4. Covariates
Other covariates in this study included gender, trade, career level, age, education
level, and household income. In the survey, participants were asked "What is your gender
identity?” with the option to answer woman or man. This was asked in such a way as to be
inclusive of transgender workers. The options in the survey for trade included boilermaker,
carpenter, electrician, ironworker, laborer, mason, operating engineer, painter, pile driver,
plasterer, plumber/pipefitter, welder, other, and prefer not to answer. For this study, the
trades were categorized into four categories: electrician, laborer, plumber/pipefitter, and
other. These categories were developed based on the distribution of the data. Career level
was a categorical variable as asked in the survey: apprentice or journey. Apprentices are
workers who are in training, and journey-level workers are those who have finished a
formal apprenticeship program. Age was categorized as less than 30 years, 30-40 years,

41-50 years, and greater than 50 years. Education level was divided into four categories:
less than or finished high school or GED, finished trade/vocational school, some college,
and finished college. Household income was dichotomized in the same manner as the
parent study: <$75,000 and >$75,000. Additionally, the variable work related social
support was created using the same method as the original study. Those answering below
the 25th percentile as an average of the social support questions were considered to have
low social support, and the remainder were considered to have high social support. The
question regarding dependents was dichotomized as yes or no. For the question regarding
ability to take time off work, those who answered very hard or somewhat hard were
considered to have low ability to take time off of work, and those who answered not too
hard or not hard at all were considered to have a high ability to take time off work. The
question regarding the number of hours doing housework allowed for a free text answer on
the survey. These answers were categorized into ≤ 1 hour, > 1 hours to ≤ 2 hours, > 2 hours
to ≤ 3 hours, and > 3 hours.
See Appendix B for further description of the variables used in this study.
B. Statistical Analysis
1. Descriptive Analysis
The distributions of all variables were examined in a univariate analysis. A bivariate
analysis was then performed to see how the variables related to each other (Appendix C).
Chi square tests were used to compare categorical variables to each other. Before
performing the analysis, the assumptions for running this test were assessed. There were
several Chi square tests that could not be performed because the expected values of at least

one of the cells was less than five. For these cases, the Fisher Exact Test was used to assess
the relationship between variables.
Descriptive statistics (percentages) were computed, and stratified by gender, injury
status, and perceived stress level.
2. Inferential Analysis
The relationship between exposures and outcomes were assessed using logistic
regression. For both aims, an unadjusted logistic regression model (Model 1) was initially
created, and further adjustments were made for a total of five models for each aim.
Covariates were selected a priori based on the literature. In order to avoid collinearity,
variables that were closely related in the bivariate analysis were not included in the same
model. Notable examples include the relationships between age and career level, education,
and income. Given this, age was selected to be used in the adjusted models and the other
highly related variables were omitted. In Aim 1, Model 2 was adjusted for trade and age.
In Aim 2, Model 2 was adjusted for trade only. Model 3 for each aim was ultimately
considered the main model. In Aim 1, the main model was adjusted for trade, age, and
gender. In Aim 2, the main model was adjusted for trade and gender. Model 4 for each aim
evaluated for effect modification by gender. In Aim 1, Model 5 was additionally adjusted
for trade, age, gender, ability to take time off work, number of hours spent doing
housework, presence of dependents, and social support. In Aim 2, Model 5 was additionally
adjusted for trade, gender, and age. Two additional models were done for Aim 1 to more
specifically investigate the relationship between both “ability to take time off work” and
level of social support on the relationship between work-life balance and stress. One model
adjusted for the previous potential confounders (trade, age, and gender) and “ability to take
time off work” without adjusting for the other variables used in Model 5. The other model
adjusted for social support with the previous confounders (trade, age, and gender), again,
without the other variables used in Model 5.
See Appendix D for further description of the models used in Aims 1 and 2.
RESULTS
A. Descriptive Analysis
Table 1 shows the distribution of the variables assessed in this study, stratified by gender.
A significantly higher percentage of women reported an injury in the last year compared to men
(31.3% vs 11.9%, respectively). A higher percentage of women also reported high perceived stress
compared to men (31.5% vs 17.8%). Additionally, a higher percentage of women reported having
difficulty taking time off work to deal with personal/family issues compared to men (46.2% vs
25.3%).
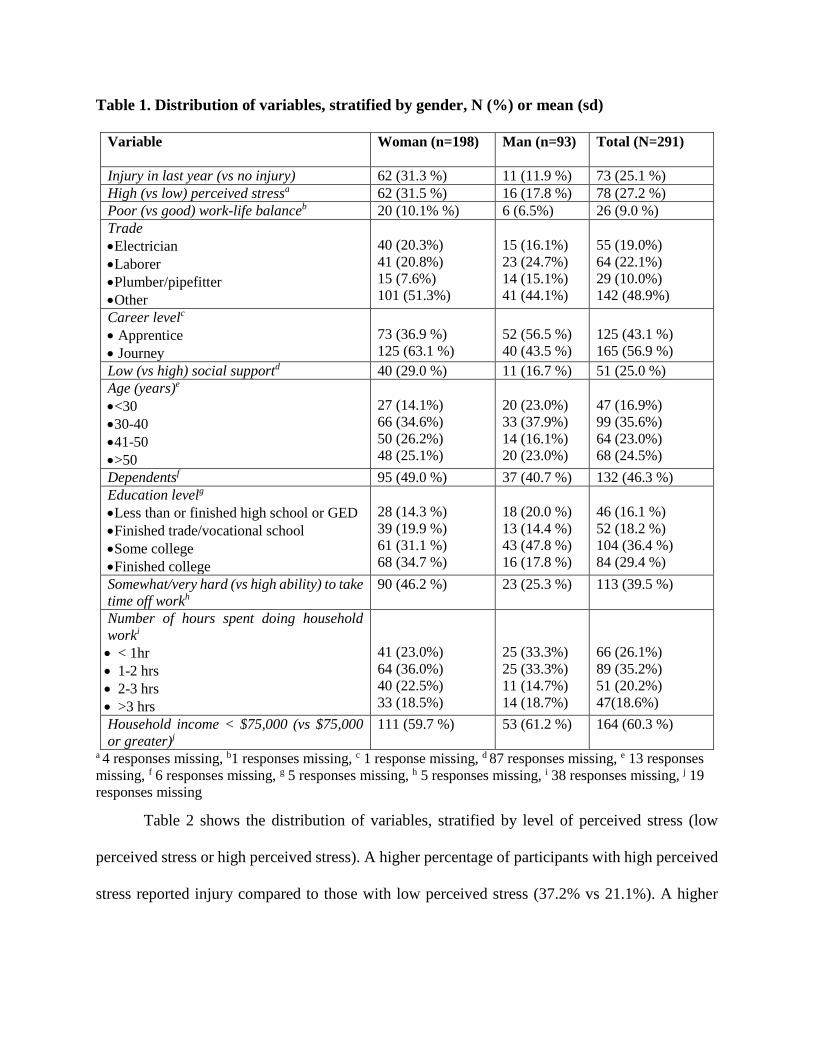
Table 1. Distribution of variables, stratified by gender, N (%) or mean (sd)
Variable Woman (n=198)
Man (n=93)
Total (N=291)
Injury in last year (vs no injury) 62 (31.3 %) 11 (11.9 %) 73 (25.1 %)
High (vs low) perceived stressa 62 (31.5 %) 16 (17.8 %) 78 (27.2 %)
Poor (vs good) work-life balanceb 20 (10.1% %) 6 (6.5%) 26 (9.0 %)
Trade
Electrician
Laborer
Plumber/pipefitter
Other
40 (20.3%)
41 (20.8%)
15 (7.6%)
101 (51.3%)
15 (16.1%)
23 (24.7%)
14 (15.1%)
41 (44.1%)
55 (19.0%)
64 (22.1%)
29 (10.0%)
142 (48.9%)
Career levelc
Apprentice
Journey
73 (36.9 %)
125 (63.1 %)
52 (56.5 %)
40 (43.5 %)
125 (43.1 %)
165 (56.9 %)
Low (vs high) social supportd 40 (29.0 %) 11 (16.7 %) 51 (25.0 %)
Age (years)e
<30
30-40
41-50
>50
27 (14.1%)
66 (34.6%)
50 (26.2%)
48 (25.1%)
20 (23.0%)
33 (37.9%)
14 (16.1%)
20 (23.0%)
47 (16.9%)
99 (35.6%)
64 (23.0%)
68 (24.5%)
Dependentsf 95 (49.0 %) 37 (40.7 %) 132 (46.3 %)
Education levelg
Less than or finished high school or GED
Finished trade/vocational school
Some college
Finished college
28 (14.3 %)
39 (19.9 %)
61 (31.1 %)
68 (34.7 %)
18 (20.0 %)
13 (14.4 %)
43 (47.8 %)
16 (17.8 %)
46 (16.1 %)
52 (18.2 %)
104 (36.4 %)
84 (29.4 %)
Somewhat/very hard (vs high ability) to take
time off workh
90 (46.2 %) 23 (25.3 %) 113 (39.5 %)
Number of hours spent doing household
worki
< 1hr
1-2 hrs
2-3 hrs
>3 hrs
41 (23.0%)
64 (36.0%)
40 (22.5%)
33 (18.5%)
25 (33.3%)
25 (33.3%)
11 (14.7%)
14 (18.7%)
66 (26.1%)
89 (35.2%)
51 (20.2%)
47(18.6%)
Household income < $75,000 (vs $75,000
or greater)j
111 (59.7 %) 53 (61.2 %) 164 (60.3 %)
a 4 responses missing, b1 responses missing, c 1 response missing, d 87 responses missing, e 13 responses
missing, f 6 responses missing, g 5 responses missing, h 5 responses missing, i 38 responses missing, j 19
responses missing
Table 2 shows the distribution of variables, stratified by level of perceived stress (low
perceived stress or high perceived stress). A higher percentage of participants with high perceived
stress reported injury compared to those with low perceived stress (37.2% vs 21.1%). A higher

percentage of those with high perceived stress reported poor work-life balance, compared to those
with low perceived stress (19.2% vs 5.3%). A higher percentage of those with high perceived stress
reported low social support compared to those with low perceived stress (43.6% vs 18.2%). Lastly,
those with high perceived stress reported a more difficult time taking off work compared to those
with low perceived stress (62.3% vs 31.1%).

Table 2. Distribution of variables, stratified by level of perceived stress, N(%) or mean (sd)
Variable High
Perceived
Stress (n=78)
Low Perceived
Stress (n=209)
Total (n=287)
Injury in last year (vs no injury) 29 (37.2 %) 44 (21.1 %) 73 (25.4 %)
Poor (vs good) work-life balancea 15 (19.2 %) 11 (5.3 %) 26 (9.1 %)
Woman (vs man) 62 (79.5 %) 135 (64.6 %) 197 (68.6 %)
Trade
Electrician
Laborer
Plumber/pipefitter
Other
18 (23.1%)
14 (17.9%)
11 (14.1%)
35 (44.9%)
37 (17.8%)
50 (24.0%)
17 (8.2%)
104 (50.0%)
55 (19.2%)
64 (22.4%)
28 (9.8%)
139 (48.6%)
Career levelb
Apprentice
Journey
34 (43.6%)
44 (56.4%)
89 (42.8 %)
119 (57.2 %)
123 (43.0 %)
163 (57.0%)
Low (vs high) social supportc 24 (43.6 %) 27 (18.2 %) 51 (25.1 %)
Age (years)d
<30
30-40
41-50
>50
16 (21.6%)
28 (37.8%)
17 (23.0%)
13 (17.6%)
31 (15.3%)
70 (34.5%)
47 (23.2%)
55 (27.1%)
47 (17.0%)
98 (35.4%)
64 (23.1%)
68 (24.5%)
Dependentse 40 (54.1 %) 91 (43.8 %) 131 (46.5 %)
Education levelf
Less than or finished high school or GED
Finished trade/vocational school
Some college
Finished college
14 (17.9 %)
13 (16.7 %)
30 (38.5 %)
21 (26.9 %)
30 (14.6 %)
39 (19.0 %)
73 (35.6 %)
63 (30.7 %)
44 (15.5%)
52 (18.4%)
103 (36.4%)
84 (29.7%)
Somewhat/very hard (vs high ability) to take time
off workg
48 (62.3%) 64 (31.1 %) 112 (39.6%)
Number of hours spent doing household workh
< 1hr
1-2 hrs
2-3 hrs
>3 hrs
12 (17.9%)
24 (35.8%)
17 (25.4%)
14 (20.9%)
53 (29.0%)
64 (35.0%)
33 (18.0%)
33 (18.0%)
65 (26.0%)
88 (35.2%)
50 (20.0%)
47 (18.8%)
Household income < $75,000 vs $70,000 or
greateri
42 (56.0 %) 120 (61.9 %) 162 (60.2 %)
a 1 response missing, b 1 response missing, c 87 responses missing, d 13 responses missing, e 6 responses
missing, f 5 responses missing, g 5 responses missing, h 38 responses missing, i 19 responses missing
Table 3 shows the distribution of variables, stratified by presence of injury (injury or no
injury). A higher percentage of those reporting injury were electricians, compared to those
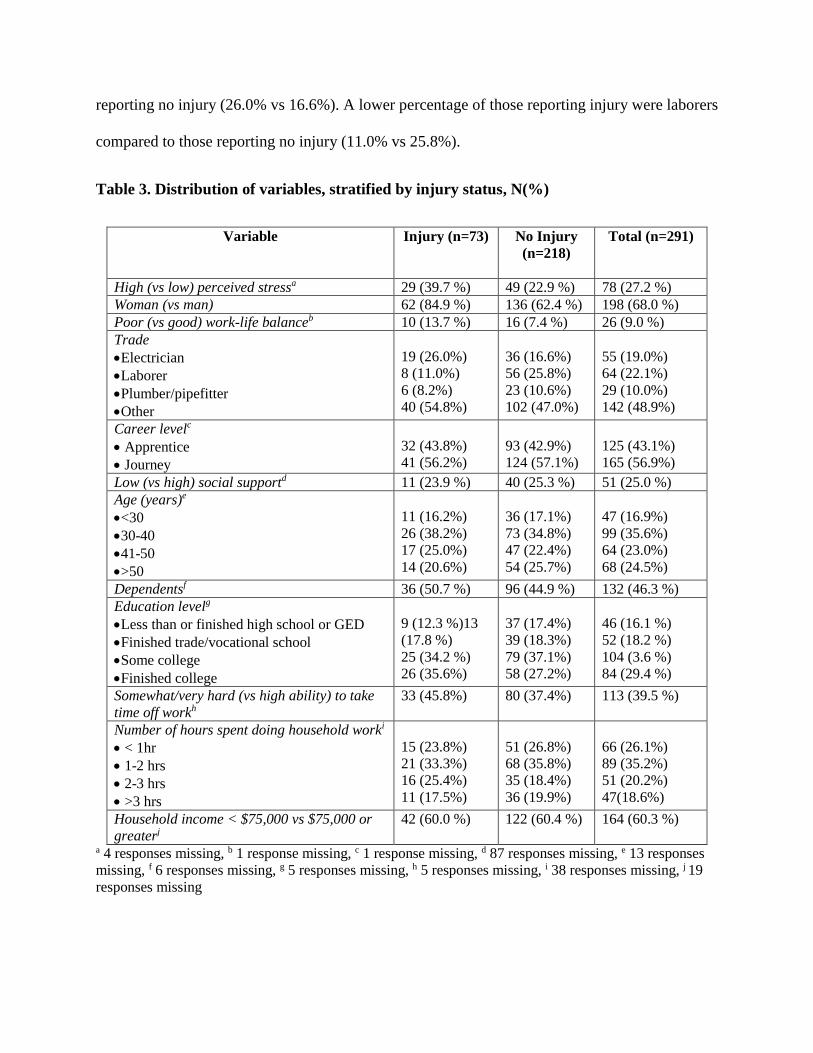
reporting no injury (26.0% vs 16.6%). A lower percentage of those reporting injury were laborers
compared to those reporting no injury (11.0% vs 25.8%).
Table 3. Distribution of variables, stratified by injury status, N(%)
Variable Injury (n=73)
No Injury
(n=218)
Total (n=291)
High (vs low) perceived stressa 29 (39.7 %) 49 (22.9 %) 78 (27.2 %)
Woman (vs man) 62 (84.9 %) 136 (62.4 %) 198 (68.0 %)
Poor (vs good) work-life balanceb 10 (13.7 %) 16 (7.4 %) 26 (9.0 %)
Trade
Electrician
Laborer
Plumber/pipefitter
Other
19 (26.0%)
8 (11.0%)
6 (8.2%)
40 (54.8%)
36 (16.6%)
56 (25.8%)
23 (10.6%)
102 (47.0%)
55 (19.0%)
64 (22.1%)
29 (10.0%)
142 (48.9%)
Career levelc
Apprentice
Journey
32 (43.8%)
41 (56.2%)
93 (42.9%)
124 (57.1%)
125 (43.1%)
165 (56.9%)
Low (vs high) social supportd 11 (23.9 %) 40 (25.3 %) 51 (25.0 %)
Age (years)e
<30
30-40
41-50
>50
11 (16.2%)
26 (38.2%)
17 (25.0%)
14 (20.6%)
36 (17.1%)
73 (34.8%)
47 (22.4%)
54 (25.7%)
47 (16.9%)
99 (35.6%)
64 (23.0%)
68 (24.5%)
Dependentsf 36 (50.7 %) 96 (44.9 %) 132 (46.3 %)
Education levelg
Less than or finished high school or GED
Finished trade/vocational school
Some college
Finished college
9 (12.3 %)13
(17.8 %)
25 (34.2 %)
26 (35.6%)
37 (17.4%)
39 (18.3%)
79 (37.1%)
58 (27.2%)
46 (16.1 %)
52 (18.2 %)
104 (3.6 %)
84 (29.4 %)
Somewhat/very hard (vs high ability) to take
time off workh
33 (45.8%) 80 (37.4%) 113 (39.5 %)
Number of hours spent doing household worki
< 1hr
1-2 hrs
2-3 hrs
>3 hrs
15 (23.8%)
21 (33.3%)
16 (25.4%)
11 (17.5%)
51 (26.8%)
68 (35.8%)
35 (18.4%)
36 (19.9%)
66 (26.1%)
89 (35.2%)
51 (20.2%)
47(18.6%)
Household income < $75,000 vs $75,000 or
greaterj
42 (60.0 %) 122 (60.4 %) 164 (60.3 %)
a 4 responses missing, b 1 response missing, c 1 response missing, d 87 responses missing, e 13 responses
missing, f 6 responses missing, g 5 responses missing, h 5 responses missing, i 38 responses missing, j 19
responses missing
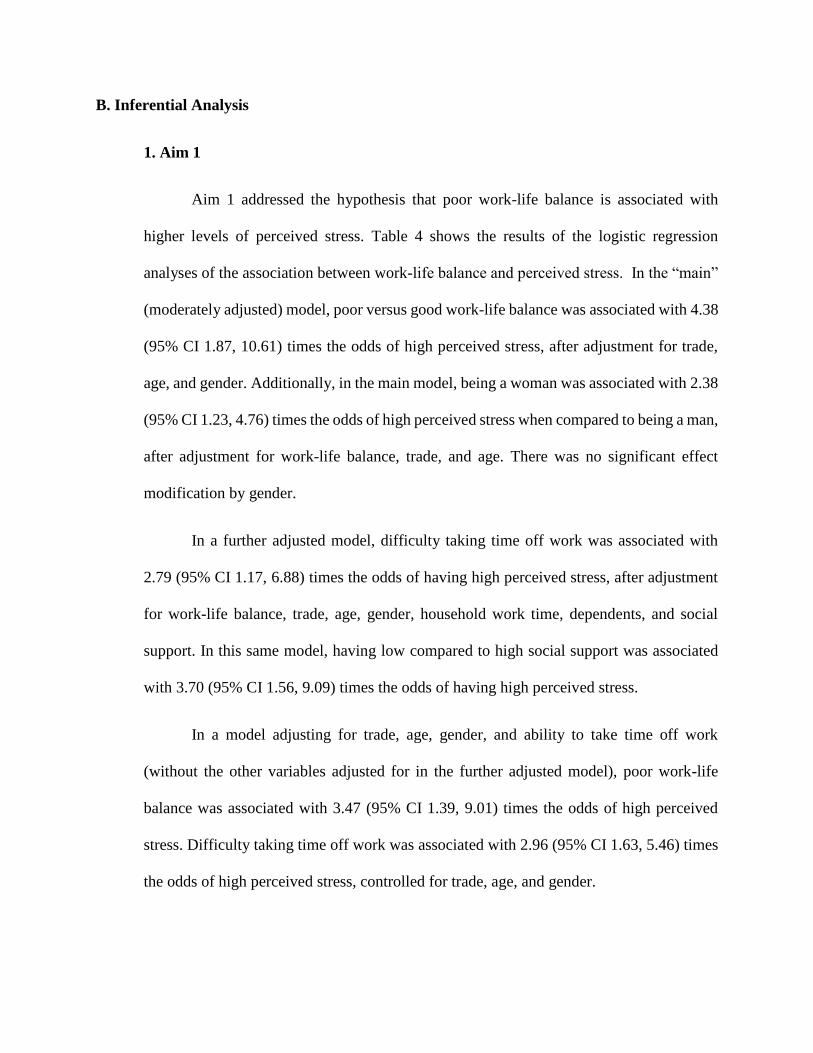
B. Inferential Analysis
1. Aim 1
Aim 1 addressed the hypothesis that poor work-life balance is associated with
higher levels of perceived stress. Table 4 shows the results of the logistic regression
analyses of the association between work-life balance and perceived stress. In the “main”
(moderately adjusted) model, poor versus good work-life balance was associated with 4.38
(95% CI 1.87, 10.61) times the odds of high perceived stress, after adjustment for trade,
age, and gender. Additionally, in the main model, being a woman was associated with 2.38
(95% CI 1.23, 4.76) times the odds of high perceived stress when compared to being a man,
after adjustment for work-life balance, trade, and age. There was no significant effect
modification by gender.
In a further adjusted model, difficulty taking time off work was associated with
2.79 (95% CI 1.17, 6.88) times the odds of having high perceived stress, after adjustment
for work-life balance, trade, age, gender, household work time, dependents, and social
support. In this same model, having low compared to high social support was associated
with 3.70 (95% CI 1.56, 9.09) times the odds of having high perceived stress.
In a model adjusting for trade, age, gender, and ability to take time off work
(without the other variables adjusted for in the further adjusted model), poor work-life
balance was associated with 3.47 (95% CI 1.39, 9.01) times the odds of high perceived
stress. Difficulty taking time off work was associated with 2.96 (95% CI 1.63, 5.46) times
the odds of high perceived stress, controlled for trade, age, and gender.
In a model adjusting for trade, age, gender, and level of social support (without the
other variables adjusted for in the further adjusted model), poor work-life balance was
associated with 2.01 (95% CI 0.70, 5.61) times the odds of high perceived stress. Low
social support was associated with 3.13 (95% CI 1.52, 6.67) times the odds of high
perceived stress, controlled for trade, age, and gender.
See Appendix E for results of all models.
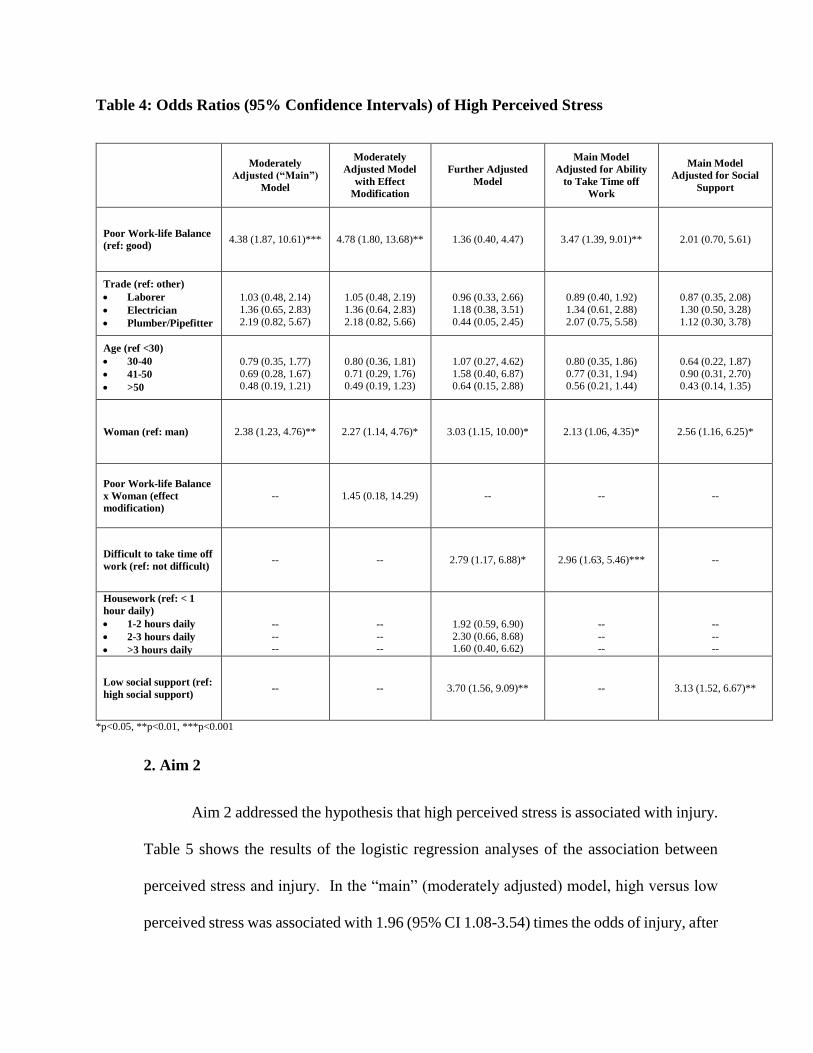
Table 4: Odds Ratios (95% Confidence Intervals) of High Perceived Stress
Moderately
Adjusted (“Main”)
Model
Moderately
Adjusted Model
with Effect
Modification
Further Adjusted
Model
Main Model
Adjusted for Ability
to Take Time off
Work
Main Model
Adjusted for Social
Support
Poor Work-life Balance
(ref: good) 4.38 (1.87, 10.61)*** 4.78 (1.80, 13.68)** 1.36 (0.40, 4.47) 3.47 (1.39, 9.01)** 2.01 (0.70, 5.61)
Trade (ref: other)
Laborer
Electrician
Plumber/Pipefitter
1.03 (0.48, 2.14)
1.36 (0.65, 2.83)
2.19 (0.82, 5.67)
1.05 (0.48, 2.19)
1.36 (0.64, 2.83)
2.18 (0.82, 5.66)
0.96 (0.33, 2.66)
1.18 (0.38, 3.51)
0.44 (0.05, 2.45)
0.89 (0.40, 1.92)
1.34 (0.61, 2.88)
2.07 (0.75, 5.58)
0.87 (0.35, 2.08)
1.30 (0.50, 3.28)
1.12 (0.30, 3.78)
Age (ref <30)
30-40
41-50
>50
0.79 (0.35, 1.77)
0.69 (0.28, 1.67) 0.48 (0.19, 1.21)
0.80 (0.36, 1.81)
0.71 (0.29, 1.76) 0.49 (0.19, 1.23)
1.07 (0.27, 4.62)
1.58 (0.40, 6.87) 0.64 (0.15, 2.88)
0.80 (0.35, 1.86)
0.77 (0.31, 1.94) 0.56 (0.21, 1.44)
0.64 (0.22, 1.87)
0.90 (0.31, 2.70) 0.43 (0.14, 1.35)
Woman (ref: man) 2.38 (1.23, 4.76)** 2.27 (1.14, 4.76)* 3.03 (1.15, 10.00)* 2.13 (1.06, 4.35)* 2.56 (1.16, 6.25)*
Poor Work-life Balance
x Woman (effect
modification)
-- 1.45 (0.18, 14.29) -- -- --
Difficult to take time off
work (ref: not difficult) -- -- 2.79 (1.17, 6.88)* 2.96 (1.63, 5.46)*** --
Housework (ref: < 1
hour daily)
1-2 hours daily
2-3 hours daily
>3 hours daily
--
-- --
--
-- --
1.92 (0.59, 6.90)
2.30 (0.66, 8.68) 1.60 (0.40, 6.62)
--
-- --
--
-- --
Low social support (ref:
high social support) -- -- 3.70 (1.56, 9.09)** -- 3.13 (1.52, 6.67)**
*p<0.05, **p<0.01, ***p<0.001
2. Aim 2
Aim 2 addressed the hypothesis that high perceived stress is associated with injury.
Table 5 shows the results of the logistic regression analyses of the association between
perceived stress and injury. In the “main” (moderately adjusted) model, high versus low
perceived stress was associated with 1.96 (95% CI 1.08-3.54) times the odds of injury, after

adjustment for trade and gender. Additionally, in the main model, being a woman was
associated with 2.94 (95% CI 1.49-6.25) times the odds of injury when compared to being
a man. There was no significant effect modification by gender noted. After adjustment for
age in the further adjusted model, the association between perceived stress and injury was
similar (OR 1.80) but no longer statistically significant (95% CI 0.97-3.32). In the main
model, being a laborer was associated with 0.37 (95% CI 0.15-0.82) times the odds of
injury when compared to the other trades categories. This relationship remained
statistically significant in the further adjusted model as well.
See Appendix E for results of all models.
Table 5: Odds Ratios (95% Confidence Intervals) of Injury
Moderately
Adjusted
(“Main”) Model
Moderately Adjusted
Model with Effect
Modification
Further Adjusted
Model
High Perceived Stress
(ref: low) 1.96 (1.08, 3.54)* 1.83 (0.95, 3.51) 1.80 (0.97, 3.32)
Trade (ref: other)
Laborer
Electrician
Plumber/Pipefitter
0.37 (0.15, 0.82)*
1.26 (0.63, 2.50) 0.74 (0.25, 1.97)
0.37 (0.15, 0.83)*
1.26 (0.62, 2.49) 0.74 (0.25, 1.97)
0.43 (0.17, 0.97)*
1.36 (0.66, 2.75) 0.82 (0.26, 2.27)
Woman (ref: man) 2.94 (1.49, 6.25)** 3.33 (1.47, 9.09)** 2.78 (1.37, 5.88)**
Poor Work-life Balance
x Woman (effect
modification)
-- 1.49 (0.30, 6.76) --
Age (ref <30)
30-40
41-50
>50
-- --
1.16 (0.50, 2.79)
0.94 (0.37, 2.44) 0.83 (0.32, 2.19)
*p<0.05, **p<0.01

DISCUSSION
In this cross-sectional survey study of construction trades workers, poor work-life balance
was associated with higher levels of perceived stress after controlling for trade, age, and gender.
Additionally, after controlling for work-life balance, trade, and age, women had a higher odds of
having high perceived stress when compared to men. High perceived stress was associated with a
higher odds of injury compared to low perceived stress. Being a woman was associated with a
higher odds of injury when compared to being a man, after adjustment for trade and perceived
stress. There was no effect modification by gender for either of the aims evaluated.
The observed relationship between poor work-life balance and perceived stress in our main
model is consistent with the existing literature. Curtis et al reported poor work-life balance,
difficulty taking time off work, and low levels of social support to be associated with higher levels
of perceived stress in both men and women (Curtis, Meischke, Stover, Simcox, & Seixas, 2018).
We defined work-life balance differently than the original analysis, using the “ability to take time
off work” question as a confounder rather than a determinant of work-life balance. The original
analysis adjusted for trade, career level, and age. We adjusted for trade, age, and gender. Despite
these differences, the same association was seen, although the magnitude was different. This
relationship has also been seen in previous work where work-family conflict has been shown to be
related to both burnout and work-related stress (Allen, Herst, Bruck, & Sutton, 2000).
We found no evidence of effect modification by gender. Curtis et al reported poor work-
life balance was associated with 7.78 times the odds of high perceived stress in women and 4.70
times the odds of high perceived stress in men, though there was no formal evaluation for effect
modification. The difference in our findings compared to those of Curtis et al may be the result of
the different definition used for work-life balance in this analysis compared to the original analysis.
In our further adjusted model for Aim 1, we noted that the association between work-life
balance and perceived stress was attenuated and was no longer statistically significant. As this
model adjusted for multiple potential confounders, it is possible that there was not adequate power
to evaluate for this association. Interestingly, in this further adjusted model, adjustment for “ability
to take time off work” resulted in attenuation of the main effect estimate, and the association
between difficulty taking time off work and perceived stress was statistically significant in the
further adjusted model. The original analysis by Curtis et al used “ability to take time off work”
as a determinant of work-life balance and saw a stronger association between work-life balance
and perceived stress. To investigate this further, we ran a separate model, with adjustment of the
main model for “ability to take time off work” but not “social support”. In this model, poor work-
life balance was associated with stress, though the effect was slightly attenuated, and this effect
was statistically significant. “Ability to take time off work” was also associated with an increased
odds of high perceived stress, independent of the other variables. This finding suggests that there
may be some confounding of the main effect by “ability to take time off work” and/or that “ability
to take time off work” may be measuring a somewhat different construct than work-life balance
(as defined in our study), as it was independently associated with stress.
The findings in this study suggest that low social support is associated with higher odds of
high perceived stress is also consistent with previous work. Cohen et al reported that having good
social support is beneficial for coping with the effects of stress on one’s level of psychological
well-being (Cohen, Social Relationships and Health, 2004) (Vermeulen & Mustard, 2000). In the
further adjusted model, low social support was associated with higher levels of stress, but the
relationship between poor work-life balance and stress was attenuated. An additional model was
run, adjusting the main model for social support, without the other variables used in the further
adjusted model. This analysis also showed an attenuated relationship between poor work-life
balance and stress, though this relationship was not statistically significant, and a statistically
significant relationship between low levels of social support and high stress. It is plausible that
having good social support could confound the relationship between poor work-life balance and
stress. These findings point towards the possibility that level of social support is an important
factor in relation to stress, and should be further explored.
We found that, after controlling for trade and gender, higher levels of perceived stress were
associated with a higher odds of injury. When further adjusted for age in the final model, the effect
estimate was similar but was no longer statistically significant, likely due to the decreased power
associated with the addition of another variable. Previous studies have identified factors associated
with injury in construction trades, but few other studies have focused on the relationship between
perceived stress and injury. Curtis et al. reported that gender discrimination, bullying,
overcompensation, and sexual harassment were all related to an increased odds of injury in women
(Curtis, Meischke, Stover, Simcox, & Seixas, 2018). In men, the only psychosocial factor
significantly related to injury was safety climate. A 2007 cross-sectional study did show a three-
fold increase in the odds of injury in women who reported their jobs as stressful compared to those
who did not, but this relationship did not hold for men (Wilkins & Mackenzie, 2007). While this
study did include trades workers in the sample, this finding was not unique for trades workers. A
small study among electronic waste recycling workers in Ghana recently showed a correlation
between high perceived stress and injury (Burns, Sayler, & Neitzel, 2019). The relationship
between higher levels of perceived stress and injury in construction trades workers deserves further
exploration in order to determine whether injury prevention interventions that address perceived
stress may be more effective than those that do not address perceived stress.
Our findings of an increased odds of injury in women compared to men, after adjustment
for levels of perceived stress and trade, are not entirely consistent with the literature. Previous
work comparing injury rates between men and women have shown that overall, men have a higher
rate of injury than women in the construction trades (Islam, Velilla, Doyle, & Ducatman, 2001).
When further evaluated by injury type, women did have a higher occurrence of some types of
injuries, such as sprains, when compared to men. There are several reasons why women may have
reported a higher rate of injury than men in our study. These reasons may include lack of
appropriate hands on training, lack of adequate PPE that fits properly, gendered division of tasks,
and psychosocial exposures. Further research is warranted to better understand the factors
influencing injury in women construction workers in order to appropriately target injury
prevention efforts.
An additional interesting finding in this analysis was that laborers appeared to be at lower
risk of injury when compared to the other trade categories. This relationship was noted to be
statistically significant in all four of the adjusted models. While the reason for this may not be
readily apparent, there are some potential explanations. Laborers typically do not have the same
exposure to some of the physical risk factors that are present in other trade categories, such as
electricity and heights. Additionally, in this study, many of the laborers who participated were in
apprenticeship training and therefore potentially did not have the same level of exposure to hazards
as those who were not in training.
A. Strengths and Limitations
This study has some notable strengths. While women have continued to be exposed to the
same occupational risks for decades, little work has been done to better understand these risks and
the effects they have on health and safety. The SHEWT survey was specifically designed to look
at the difference between workplace exposures for men and women in order to gain understanding
into problems that women in the construction trades face. The findings from original analysis of
this study were used to create an evidence based pilot mentoring program which aimed to reduce
the negative health and safety outcomes that have been seen in women working in the trades.
This study also has several limitations. This is a cross-sectional study, which only allows
conclusions to be drawn about correlations between different variables, but does not allow for any
determination of causation. Additionally, participants in the study self-selected into the study, and
there may be some inherent traits present in those who opted to participate compared to those who
did not which could introduce selection bias. Our results may also not be generalizable, as this
study population may not be entirely representative of the population of construction trades
workers in Washington state or the United States. The data obtained in this survey is all self-
reported, which may lend itself to recall bias from the participants. Given the culture of
discrimination towards women in the trades, women may have under-reported their actual levels
of these exposures and outcomes in order to give the appearance that they can “keep up” with their
men peers. This would be expected to bias the results towards the null. All of the participants in
this study were currently working, and a “healthy worker bias” or “survivor bias” may have been
present, where trades workers with more severe injuries or exposures were no longer working and
therefore their information was never collected. The survey was designed using a combination of
questions obtained from existing validated surveys as well as questions developed by the original
research group for the purposes of this study. As some of these questions are not previously
validated, they may not adequately represent the true exposures and outcomes evaluated. Another
limitation of this study is the fact that it is a secondary analysis that is not part of the original study
plan. The study therefore may not be adequately powered to answer the questions of interest in
this analysis. Finally, another potential limitation to this study is the idea that there may be a
difference in the perception of stress between men and women which may have impacted their
reporting in the survey. According to the American Psychological Association, men and women
report similar levels of stress, but women are more likely to report that their stress levels are
increasing (American Psychological Association, 2010). Additionally, women are more likely than
men to report having physical symptoms related to their stress. This indicates that there may be a
difference in the perception of stress between men and women, which may affect the results of this
study, as men and women were evaluated using the same perceived stress scale without any
controls for gender.
B. Conclusions and Implications
In conclusion, this study demonstrated an association between poor work-life balance and
perceived stress. It also demonstrated an independent effect of being a women on higher risk of
stress. Perceived stress was associated with an increased injury risk, and women had a higher risk
of injury compared to men, independent of perceived stress level. Further research is needed to
formally examine whether perceived stress is a mediator between work-life balance and injury
risk. In order to evaluate for mediation, the relationship between work-life balance and injury
would first need to be assessed. If a relationship is noted, an analysis looking at the effect of
perceived stress on the relationship between work-life balance and injury would need to be
performed. If a decrease or elimination in the relationship between work-life balance and injury is
seen with the addition of stress, mediation is likely. As with any analysis of cross-sectional data,
this mediation analysis would only be able to show correlation, but not causation. Longitudinal
data would need to be collected to confirm these relationships.
Injuries are an ongoing problem within the construction trades with consequences to
include lost work time and income, medical costs, and long term health and disability outcomes.
This analysis demonstrates an association between injury and stress as well as a relationship
between stress and work-life balance, along with other psychosocial exposures. Women continue
to be a minority within the construction trades with unique risks and outcomes compared to men.
Ongoing research on these topics is needed to better understand these relationships, allow for
changes in policies and practices within these trades, and foster safe participation of women in the
industry. Our findings suggest a need for injury and stress prevention efforts that address work-
life balance and perceived stress within the construction trades.
1
Department of Environmental and Occupational Health Sciences
Safety and Health Empowerment for Women in Trades (SHEWT) Questionnaire
Thank you for your interest in the SHEWT (Safety and Health Empowerment for Women in Trades) study! This study aims to improve the well-being of women in the construction trades by identifying their key health and safety risks. By completing this survey you are helping us work towards solutions. The survey should take approximately 30 minutes to complete. Before you begin, please answer the following questions to determine your eligibility for this study.
SCREENING QUESTIONS:
1. Are you currently doing direct construction tradeswork?
Yes, currently working
No, temporarily not working
No, permanently left
Do not complete this survey if you are no longer working in the trades
2. What is your gender identity? Woman
Man
INFORMED CONSENT
Safety and Health Empowerment for Women in Trades
Researchers Noah Seixas, PhD, Professor, 206-685-7189, [email protected] Hendrika Meischke, PhD, Professor, 206-616-2945, [email protected] Nancy Simcox, Continuing Education Programs Outreach Manager, 206-221-7107, [email protected] Hannah Curtis, MPH, Research Coordinator, 206-543-2384, [email protected] University of Washington Department of Environmental and Occupational Health Sciences, 4225 Roosevelt Way NE Suite 100, Seattle, WA 98105
Researcher’s Statement Why is the research taking place?
You are invited to participate in a research study being conducted by the University of Washington becauseyou are someone who works in the trades in Washington State.
This study is being done to identify and understand the risks that women working in construction trades faceon the job.
The study will include approximately 300 women and 100 men working in construction trades.
Appendix A. SHEWT Survey

2
The study is being funded by the Washington State Department of Labor and Industries’ Safety and Health Investment Projects Grant Program.
What would I be asked to do? The study involves completing a one-time survey, which includes questions about your exposure to chemical
and physical hazards, stress, discrimination, and support at work. The survey can be completed online, over the phone with an interviewer, or by a mailed hard copy. You only
need to complete the survey one time. The most personal question asked will be “In the past year, have you experienced losing a job, getting into
debt beyond means of repayment, or a period of homelessness?” You may refuse to answer any questions without being penalized. All questions will have a “Prefer not to
answer” option.
What are the possible risks or harms if I take part?
Some people may feel that questions about their work are an invasion of their privacy. It is possible that questions about certain topics, including sexual harassment at work, may cause some people
to feel discomfort while completing the survey. The research team is willing to answer any questions you have about the research. If you think you have a problem related to this research, contact Hannah Curtis (206-543-2384,
[email protected]) right away. She will address the relevant issue or refer you for assistance.
What are the possible benefits? You will not directly benefit from this research. However, your participation will help increase our
understanding of the health and safety risks to women working in construction trades so that researchers can develop programs to reduce risks.
What are my choices if I don’t take part?
Taking part in this research study is completely voluntary. You have the right to refuse to complete the survey at any time.
If you do not take part in this study you will not lose any benefits, and it will not have any effect on any part of your job.
Who would see study information about me?
Survey data are confidential. Personal information collected during the screening process will be stored separately from survey data. The Research Coordinator will use your mailing address to send you the gift card.
Only research staff members employed by the University of Washington will have access to the data. Washington Women in Trades members trained by the University of Washington will conduct the phone
interview version of the survey. Interviewers will read survey questions aloud and enter your data into the online survey. They will not record any identifying information or have access to the data after they have been entered online. If you choose to take the survey over the phone there is a chance that you may know the interviewer. You may request a different interviewer or complete the online version of the survey without penalty. We will do our best to match you with an unknown interviewer or with the Research Coordinator.
No identification of individual workers will be made in any summaries, reports, or articles that come out of this study.
All data will be destroyed no later than June 2022.
Would I be paid for my time? Will the study cost me anything?

3
The first 400 eligible participants will receive a $20 gift card after they have completed the survey. Payment will be given regardless of the information you provide.
Participating in the study will not cost you anything. In order to receive the gift card, you will have to provide us with your mailing address. This contact
information will not be linked to any of your survey data.
What else do I need to know? You are not required to answer all questions or complete all study procedures. If you are willing to be contacted again for future research, you will have the opportunity to check a box at the
end of the survey. To help us reach as many tradeswomen as possible, you will be asked at the end of the survey to forward the
survey link to other people who might be interested in the study. Helping with recruitment is completely voluntary and will not affect your own participation.
If you have concerns about this study or your participation, you may contact the study staff at the phone numbers listed above.
You can save and print a copy of this consent form for your records.
If you agree to participate: The study described above has been explained to me. By checking the box below, I voluntarily consent to take part in this research. I have been told that I can refuse to answer any questions. I have been told that I may call the researchers if I have any questions about the research.
Yes
No
***PLEASE CONSENT TO THE STUDY BEFORE CONTINUING WITH THE SURVEY***
Please answer the following questions to the best of your ability. Your answers are confidential and will not be shared with your coworkers or supervisor. You can choose not to answer specific questions by selecting “Prefer not to answer.” However, we rely on your input to understand the health and safety risks of women and men working in the trades, so please answer all items.
3. Are you completing this survey by phone interview? Yes
No

4
WORK INFORMATION In this section, we would like to know a little bit about your work history and training.
4. What is your current trade? Boilermaker
Carpenter
Electrician
Ironworker
Laborer
Mason (Brick, Cement, Tile setter, etc.)
Operating engineer
Painter
Pile Driver
Plasterer
Plumber/Pipefitter
Welder
Other:___________________________
Prefer not to answer
5. How many years have you worked in the trades? Less than 1 year
1-3
4-6
7-10
11-20
More than 20 years
Prefer not to answer
6. How many women, including yourself, are working at your current or most recent jobsite?
__________ women
Don’t know
Prefer not to answer
7. Did you go through an apprenticeship training program?
Yes, completed program
Yes, currently in program
No skip to question 13
Prefer not to answer

5
APPRENTICESHIP TRAINING
In this section, we would like to know about your apprenticeship or training experience.
8. How many women, including yourself, were in the apprenticeship training class in your first year?
Number of women: ______________
Don’t know
Prefer not to answer
9. How many women, including yourself, graduated from the apprenticeship program in your class?
Number of women: ______________
Don’t know
Currently in the program/haven’t graduated yet
Prefer not to answer
10. Did/do you have a journey-level worker who acted/acts as your mentor while you were/are an apprentice?
Yes, one individual
Yes, more than one
No
Prefer not to answer
11. Did/do you experience any hazing (humiliating or dangerous tasks that are part of an initiation) during your apprenticeship?
Yes
No
Prefer not to answer
12. Did/do you receive sufficient hands-on training to feel confident in your work?
Yes
No
Prefer not to answer

6
GENERAL HEALTH
This section includes a couple of questions about your general health.
13. How many days of work have you missed because of personal illness in the past six months?
None
1
2-5
More than 5
Prefer not to answer
14. How many days in the past six months have you gone to work even though you were feeling sick?
None
1
2-5
6-10
More than 10
Prefer not to answer
15. In general, how would you rate your health? Excellent
Very good
Good
Fair
Poor
Prefer not to answer
7
OCCUPATIONAL EXPOSURES In this section, we would like to know more about your exposure to some traditional occupational health hazards on your current or most recent jobsite.
16. How often do you work near dust or welding fumes? 1 (Never)
2
3 (About half of the time)
4
5 (Always)
Prefer not to answer
17. How often do you work with or near chemicals, acids, or solvents that you could breathe in or get on your skin?
1 (Never)
2
3 (About half of the time)
4
5 (Always)
Prefer not to answer
18. How often are you exposed to high levels of noise?
“High noise” means louder than a noisy bar or restaurant, or loud enough that a person has to raise his or her voice to talk to someone 3 feet away or less.
1 (Never)
2
3 (About half of the time)
4
5 (Always)
Prefer not to answer
19. How often do you work near traffic or moving vehicles?
Includes site vehicles such as forklifts or manlifts
1 (Never)
2
3 (About half of the time)
4
5 (Always)
Prefer not to answer

8
20. How often do you work near materials/tools/equipment that could hit or strike you in the head or body?
1 (Never)
2
3 (About half of the time)
4
5 (Always)
Prefer not to answer
21. How often do you work at heights (at 4 feet or higher) without barriers to prevent you from falling?
1 (Never)
2
3 (About half of the time)
4
5 (Always)
Prefer not to answer
22. How often do you work with/near materials that could electrocute/shock you?
1 (Never)
2
3 (About half of the time)
4
5 (Always)
Prefer not to answer

9
PERSONAL PROTECTIVE EQUIPMENT
This set of questions asks about your experience using personal protective equipment on the job.
How often do you use the following when exposed to the relevant hazard at your current or most recent jobsite?
1 (Never) 2 3
(About half of the time)
4
5 (Always)
Not needed on
my job
Prefer not to
answer
23. Coveralls
24. Hard hat
25. Eye protection
26. Hearing protection (e.g. ear muff, plugs)
27. Gloves
28. Fall harness
29. Respiratory protection (e.g. filtering face piece or half-mask)
Do the following PPE provided at your current jobsite fit you properly?
Yes No
Sometimes Not needed on my job
Prefer not to answer
30. Coveralls
31. Hearing protection
32. Gloves
33. Fall harness
34. Respiratory protection

10
35. If PPE does not fit, what do you do? Use the closest fit
Ask for PPE that fits
Don’t use any protection
Use my own PPE
Other:_________________________________
Prefer not to answer
36. Do you feel comfortable asking for better PPE or PPE that fits you better?
Yes Skip to question 38
No
Prefer not to answer
37. Why don’t you feel comfortable asking for better fitting PPE?
Select the most important reason
Nobody else is using PPE
Don’t want to bother supervisor
Fear of layoff
Fear of being labeled as complainer by co-workers
Other:_________________________________
Prefer not to answer
11
WORK ORGANIZATION The following questions deal with how your work is structured in terms of hours worked, tasks, and changes to your crew.
38. Which of the following best describes your usual work schedule?
Day shift
Afternoon shift
Night shift
Split shift
Irregular shift/on-call
Rotating shifts
Prefer not to answer
39. How many hours per week do you work at your current or most recent jobsite?
_________ hours/week
Prefer not to answer
40. How many hours per week do you spend doing secondary work (e.g. cleaning, running errands, etc.) at your current jobsite?
_________ hours/week
Prefer not to answer
41. At your current or most recent jobsite, are there opportunities for applying the skills of your trade?
Yes
No
Prefer not to answer
42. How many times in the past year have you changed jobsites?
Never Skip to question 44
Once
Twice
3 times
More than 3 times
Prefer not to answer
43. When you change jobsites, do you change crews? Yes
No
Sometimes
Prefer not to answer
12
44. When changing crews, do you feel you need to prove your ability to do the work?
Yes
No
Sometimes
Prefer not to answer
45. In the past month, have you been asked to work overtime?
Yes
No
Prefer not to answer
46. How many hours of overtime have you worked in the past month?
Please enter 0 if you have not worked overtime
_____________ hours
We know that working overtime can be welcome or unwelcome. Please rate how much you AGREE or DISAGREE with the following statements:
Strongly
Agree Agree
Neither agree nor disagree Disagree
Strongly Disagree
Prefer not to answer
47. Thinking only about overtime, the benefits outweigh the drawbacks
48. I welcome the opportunity to work any overtime
13
JOB DEMANDS The following questions address the demands that your job places on you.
49. How often do you have to work very fast on the job? 1 (Never)
2
3 (Sometimes)
4
5 (Always)
Prefer not to answer
50. How often do you have to work very hard on the job? 1 (Never)
2
3 (Sometimes)
4
5 (Always)
Prefer not to answer

14
JOB CONTROL These questions deal with your perceived level of control at your current or most recent jobsite.
51. How much control do you have over the types of tasks you are assigned to do during a work day?
1 (Very little control)
2
3 (Some control)
4
5 (A great deal of control)
Prefer not to answer
52. How much control do you have over how fast or slow you work?
1 (Very little control)
2
3 (Some control)
4
5 (A great deal of control)
Prefer not to answer
53. How much control do you have over when you can take a bathroom break?
1 (Very little control)
2
3 (Some control)
4
5 (A great deal of control)
Prefer not to answer

15
OVERCOMPENSATION The following questions deal with how you respond to your physical workload.
54. At your current jobsite, how often do you push yourself
past your physical comfort to get the job done? 1 (Never)
2
3 (About half of the time)
4
5 (Always)
Prefer not to answer
55. How often do you not have the physical strength to
complete the tasks you are assigned? 1 (Never)
2
3 (About half of the time)
4
5 (Always)
Prefer not to answer
56. How often do you take special actions to work around
problems involving physical strength? 1 (Never)
2
3 (About half of the time)
4
5 (Always)
Prefer not to answer
16
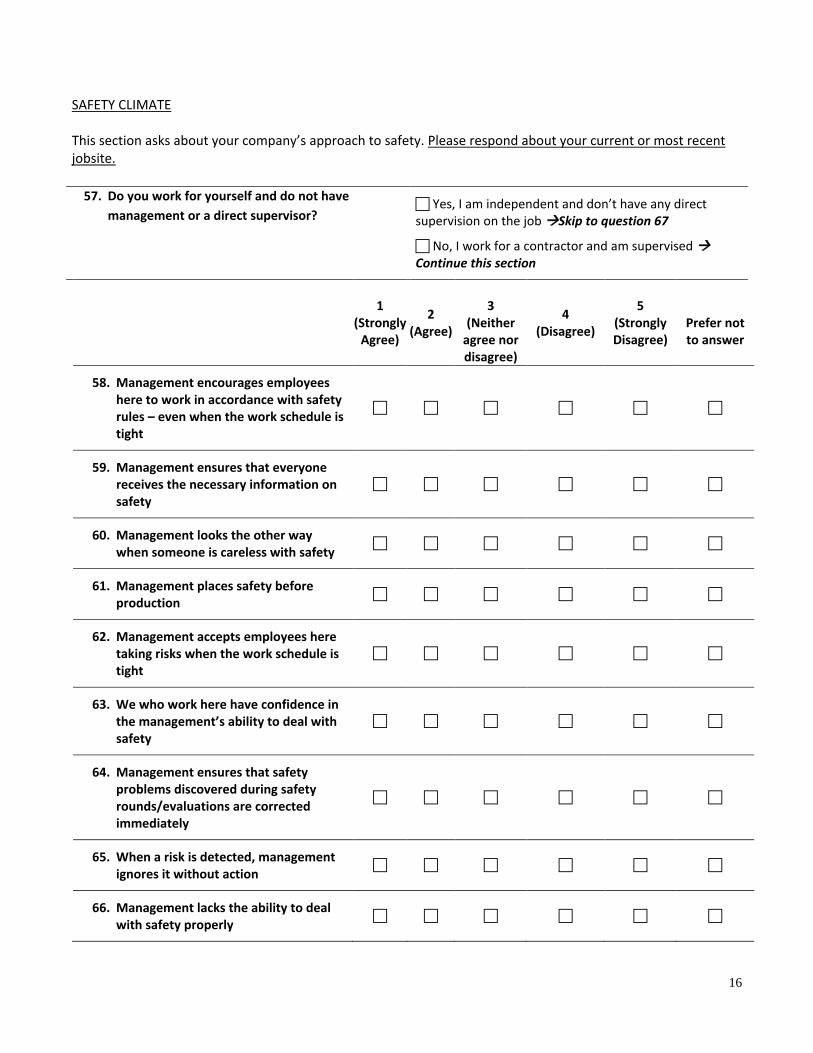
SAFETY CLIMATE This section asks about your company’s approach to safety. Please respond about your current or most recent jobsite.
57. Do you work for yourself and do not have
management or a direct supervisor? Yes, I am independent and don’t have any direct supervision on the job Skip to question 67
No, I work for a contractor and am supervised Continue this section
1
(Strongly Agree)
2 (Agree)
3
(Neither agree nor disagree)
4 (Disagree)
5 (Strongly Disagree)
Prefer not to answer
58. Management encourages employees here to work in accordance with safety rules – even when the work schedule is tight
59. Management ensures that everyone receives the necessary information on safety
60. Management looks the other way when someone is careless with safety
61. Management places safety before production
62. Management accepts employees here taking risks when the work schedule is tight
63. We who work here have confidence in the management’s ability to deal with safety
64. Management ensures that safety problems discovered during safety rounds/evaluations are corrected immediately
65. When a risk is detected, management ignores it without action
66. Management lacks the ability to deal with safety properly

17
UNSANITARY FACILITIES The next couple of questions ask about restroom availability at your current or most recent jobsite.
67. Are the number of restrooms provided adequate for the number of people working at the site?
Yes
No
Prefer not to answer
68. Are the restrooms provided sufficiently sanitary? Yes
No
Prefer not to answer
69. Is running water available at the site for cleaning? Yes
No
Prefer not to answer
18
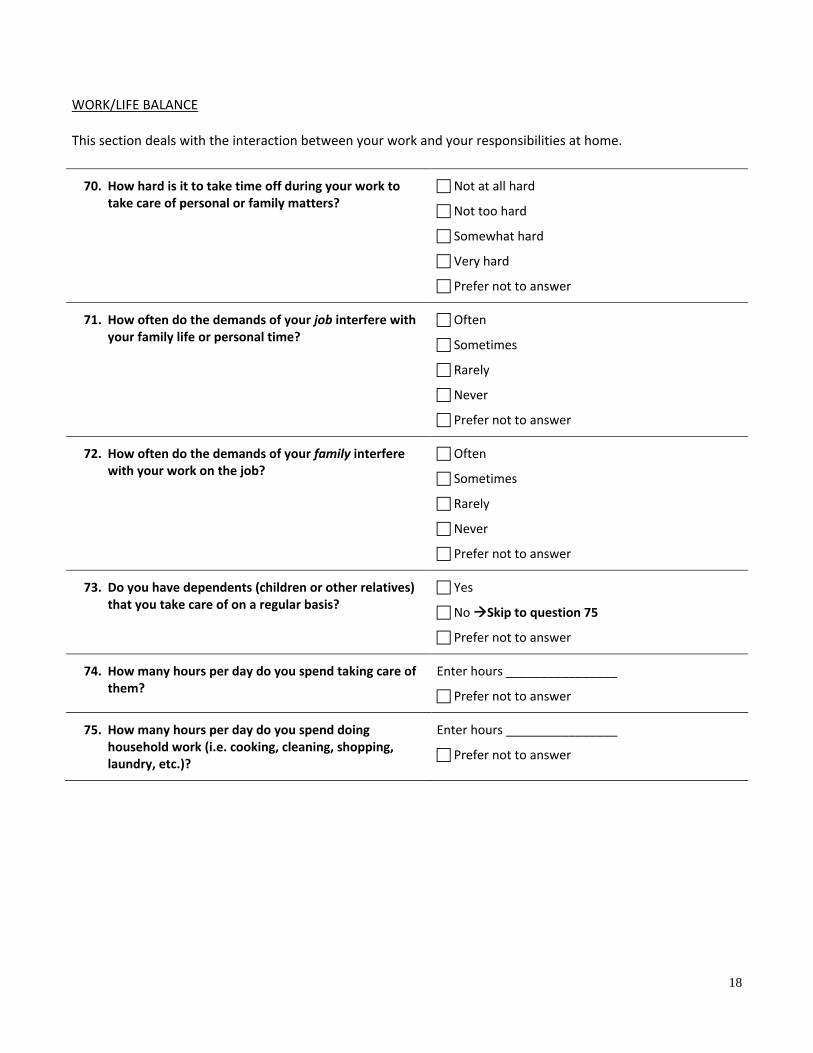
WORK/LIFE BALANCE This section deals with the interaction between your work and your responsibilities at home.
70. How hard is it to take time off during your work to take care of personal or family matters?
Not at all hard
Not too hard
Somewhat hard
Very hard
Prefer not to answer
71. How often do the demands of your job interfere with your family life or personal time?
Often
Sometimes
Rarely
Never
Prefer not to answer
72. How often do the demands of your family interfere with your work on the job?
Often
Sometimes
Rarely
Never
Prefer not to answer
73. Do you have dependents (children or other relatives) that you take care of on a regular basis?
Yes
No Skip to question 75
Prefer not to answer
74. How many hours per day do you spend taking care of them?
Enter hours ________________
Prefer not to answer
75. How many hours per day do you spend doing household work (i.e. cooking, cleaning, shopping, laundry, etc.)?
Enter hours ________________
Prefer not to answer

19
ISOLATION
The following questions address perceptions of isolation at your current, or most recent jobsite.
Strongly Disagree
Disagree Neutral Agree Strongly
Agree
Prefer not to
answer
76. I often feel alienated from my co-workers
77. There is someone at work I can talk to about my day to day work problems if I need to

20
SOCIAL SUPPORT
These questions concern your relationship with your supervisor and co-workers.
At your current or most recent jobsite, how often does YOUR IMMEDIATE SUPERVISOR:
1
(Never) 2
3 (Sometimes)
4
5 (Always)
Prefer not to
answer
78. Make an extra effort to make your work life easier for you?
79. Make an extra effort to make your work life safer for you?
80. Be relied upon to help you when a difficult situation arises at work?
At your current or most recent jobsite, how often do your MALE CO-WORKERS:
1
(Never) 2
3 (Sometimes)
4
5 (Always)
Prefer not to answer
81. Make an extra effort to make your work life easier for you?
82. Make an extra effort to make your work life safer for you?
83. Be relied upon to help you when a difficult situation arises at work?
At your current or most recent jobsite, how often do your FEMALE CO-WORKERS:
1
(Never) 2
3 (Sometimes)
4
5 (Always)
Not applicable (no female
co-workers)
Prefer not to
answer
84. Make an extra effort to make your work life easier for you?
85. Make an extra effort to make your work life safer for you?
86. Be relied upon to help you when a difficult situation arises at work?
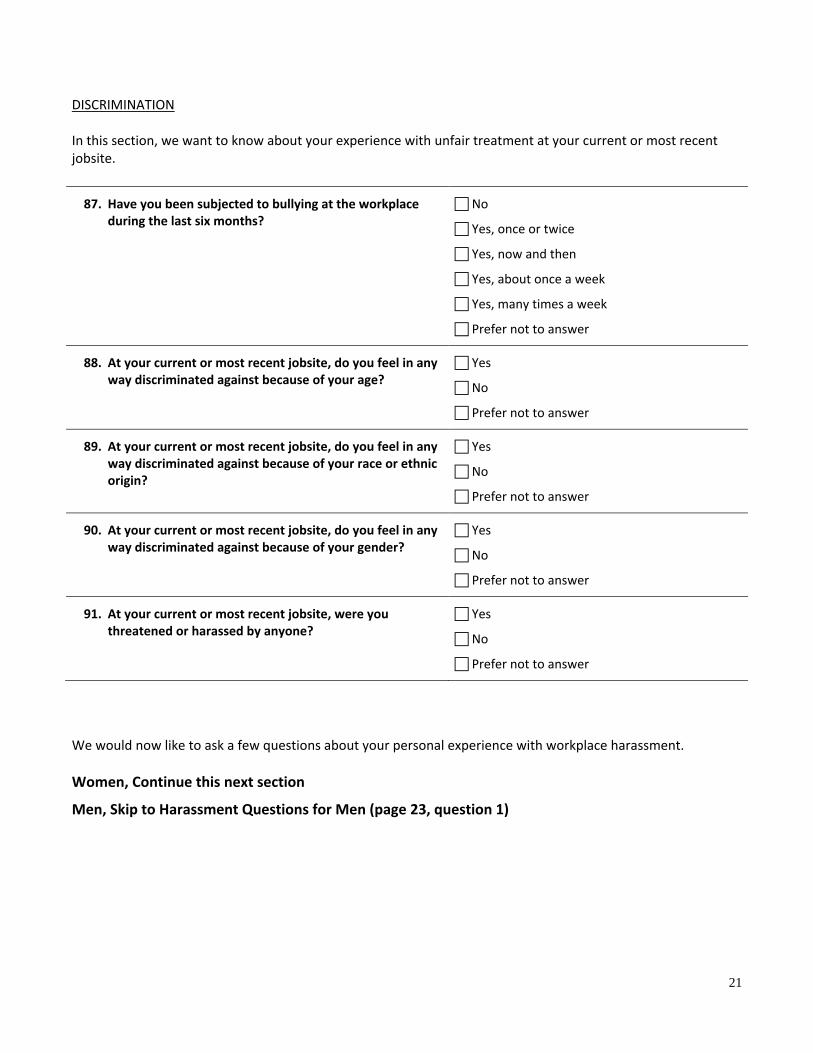
21
DISCRIMINATION In this section, we want to know about your experience with unfair treatment at your current or most recent jobsite.
87. Have you been subjected to bullying at the workplace during the last six months?
No
Yes, once or twice
Yes, now and then
Yes, about once a week
Yes, many times a week
Prefer not to answer
88. At your current or most recent jobsite, do you feel in any way discriminated against because of your age?
Yes
No
Prefer not to answer
89. At your current or most recent jobsite, do you feel in any way discriminated against because of your race or ethnic origin?
Yes
No
Prefer not to answer
90. At your current or most recent jobsite, do you feel in any way discriminated against because of your gender?
Yes
No
Prefer not to answer
91. At your current or most recent jobsite, were you threatened or harassed by anyone?
Yes
No
Prefer not to answer
We would now like to ask a few questions about your personal experience with workplace harassment.
Women, Continue this next section
Men, Skip to Harassment Questions for Men (page 23, question 1)

22
TOKENISM AND HARASSMENT (women only) The following questions deal with the issue of being underrepresented as a woman in construction. Please answer about your current or most recent jobsite.
Strongly Disagree
Disagree Neutral Agree Strongly
Agree
Prefer not to
answer
92. I feel I have to represent all women at my job
93. I feel accepted by my male colleagues
For the following items, please check the box that most closely describes your own experience with MALE instructors, supervisors, or coworkers at your current or most recent jobsite over the past month.
Never Once or Twice
Sometimes Often Many Times
Prefer not to
answer
94. …habitually told suggestive stories or offensive jokes?
95. …made offensive remarks about your appearance, body, or sexual activities?
96. …gave you unwanted sexual attention?
97. …displayed, used, or distributed sexist or suggestive materials (e.g., pictures, stories, or pornography)?
98. …frequently make sexist remarks (e.g., suggesting that women are too emotional to assume leadership roles)?
99. …made you feel subtly threatened with some sort of retaliation for not being sexually cooperative (e.g., the mention of an upcoming evaluation, review, etc.)?
100. …touched you (e.g., laid a hand on your bare arm, put an arm around your shoulders) in a way that made you feel uncomfortable?
101. …made it necessary for you to respond positively in sexual or social invitations in order to be well treated on the job?
102. …treated you badly for refusing to have sex with a coworker or supervisor?

23
HARRASMENT QUESTIONS FOR MEN (men only)
For the following items, please check the box that most closely describes experiences you have WITNESSED with MALE instructors, supervisors, or coworkers at your current or most recent jobsite over the past month.
Never Once or Twice
Sometimes Often Many Times
Prefer not to
answer
1. …habitually told suggestive stories or offensive jokes?
2. …made offensive remarks about a female co-worker’s appearance, body, or sexual activities?
3. …gave a female co-worker unwanted sexual attention?
4. …displayed, used, or distributed sexist or suggestive materials (e.g., pictures, stories, or pornography)?
5. …frequently make sexist remarks (e.g., suggesting that women are too emotional to assume leadership roles)?
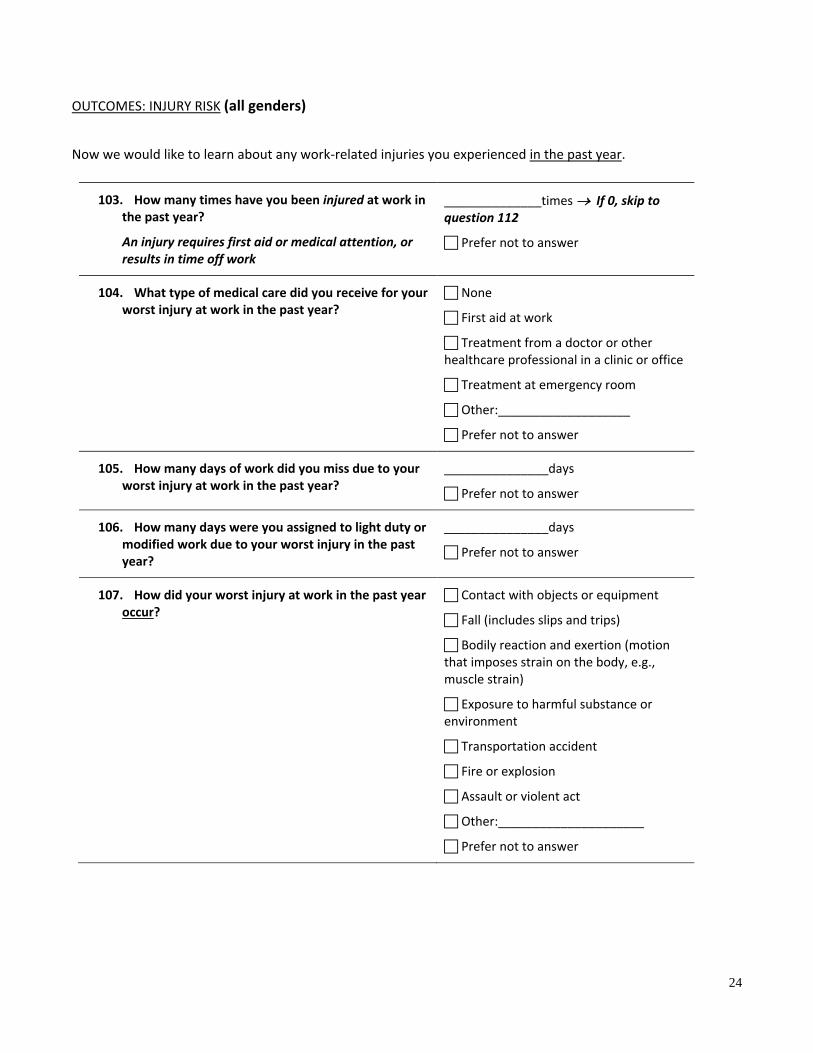
24
OUTCOMES: INJURY RISK (all genders)
Now we would like to learn about any work-related injuries you experienced in the past year.
103. How many times have you been injured at work in the past year?
An injury requires first aid or medical attention, or results in time off work
______________times If 0, skip to question 112
Prefer not to answer
104. What type of medical care did you receive for your worst injury at work in the past year?
None
First aid at work
Treatment from a doctor or other healthcare professional in a clinic or office
Treatment at emergency room
Other:___________________
Prefer not to answer
105. How many days of work did you miss due to your worst injury at work in the past year?
_______________days
Prefer not to answer
106. How many days were you assigned to light duty or modified work due to your worst injury in the past year?
_______________days
Prefer not to answer
107. How did your worst injury at work in the past year occur?
Contact with objects or equipment
Fall (includes slips and trips)
Bodily reaction and exertion (motion that imposes strain on the body, e.g., muscle strain)
Exposure to harmful substance or environment
Transportation accident
Fire or explosion
Assault or violent act
Other:_____________________
Prefer not to answer

25
108. What body part was affected by your worst injury at work in the past year?
Head
Neck (including throat)
Trunk
Upper extremities
Lower extremities
Body systems
Multiple body parts
Other body parts
Prefer not to answer
109. Did you report your worst injury at work in the past year?
Yes
NoSkip to question 111
Prefer not to answer
110. To whom did you report your worst injury?
(Can select more than one)
Skip to next section after answering
Supervisor
Co-worker
Health and safety representative at company
Filed an injury claim with Washington State Department of Labor & Industries
Prefer not to answer
111. What prevented you from reporting? Pain is a natural part of the job
Reporting process is too complicated
Fear of layoff
Fear of being labeled as complainer
Other:___________________
Prefer not to answer
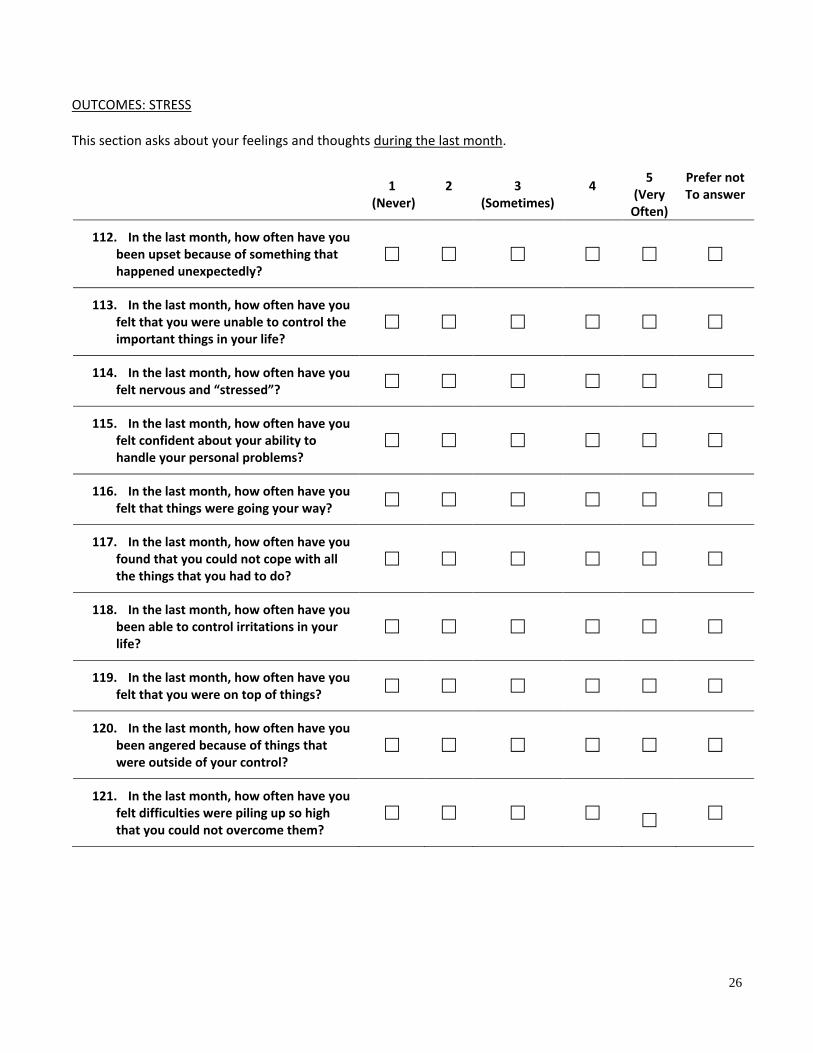
26
OUTCOMES: STRESS
This section asks about your feelings and thoughts during the last month.
1
(Never) 2
3 (Sometimes)
4
5 (Very
Often)
Prefer not To answer
112. In the last month, how often have you been upset because of something that happened unexpectedly?
113. In the last month, how often have you felt that you were unable to control the important things in your life?
114. In the last month, how often have you felt nervous and “stressed”?
115. In the last month, how often have you felt confident about your ability to handle your personal problems?
116. In the last month, how often have you felt that things were going your way?
117. In the last month, how often have you found that you could not cope with all the things that you had to do?
118. In the last month, how often have you been able to control irritations in your life?
119. In the last month, how often have you felt that you were on top of things?
120. In the last month, how often have you been angered because of things that were outside of your control?
121. In the last month, how often have you felt difficulties were piling up so high that you could not overcome them?

27
122. Stress means a situation in which a person feels tense, restless, nervous or anxious or is unable to sleep at night because his/her mind is troubled all the time.
Do you feel this kind of stress these days?
Not at all (1)
2
Sometimes (3)
4
Very much (5)
Prefer not to answer
123. How often do you find your work stressful? Always
Often
Sometimes
Hardly ever
Never
Prefer not to answer
In the past year have you experienced any of the following:
Yes No Prefer not to
answer
124. Death of a spouse or immediate family member?
125. Divorce, marital separation, or marriage?
126. Losing a job, getting into debt beyond means of repayment, or a period of homelessness?

28
ADDITIONAL COMMENTS
We are very interested in your opinions regarding workplace health and safety for tradeswomen. Please answer the following open-ended questions to help us work towards effective solutions.
127. Are there other experiences you’ve had at work as a construction worker that you think are relevant for
this research?
__________________________________________________________________________________________________________________________________________________________________________________________________________________________________________________________________________________________________________________________________________________________________
128. What do you think is the number one problem currently facing women in the construction industry?
_______________________________________________________________________________________________________________________________________________________________________________________________________________________________________________________________________________________________________
129. What changes could the industry make to help solve this problem?
__________________________________________________________________________________________________________________________________________________________________________________________________________________________________________________________________________________________________________________________________________________________________
130. Is there anything else you would like us to know about workplace stressors for women?
_____________________________________________________________________________________________________________________________________________________________________________________________________________________________________________________________________________________________________________________________________________________________________________________________________________________________
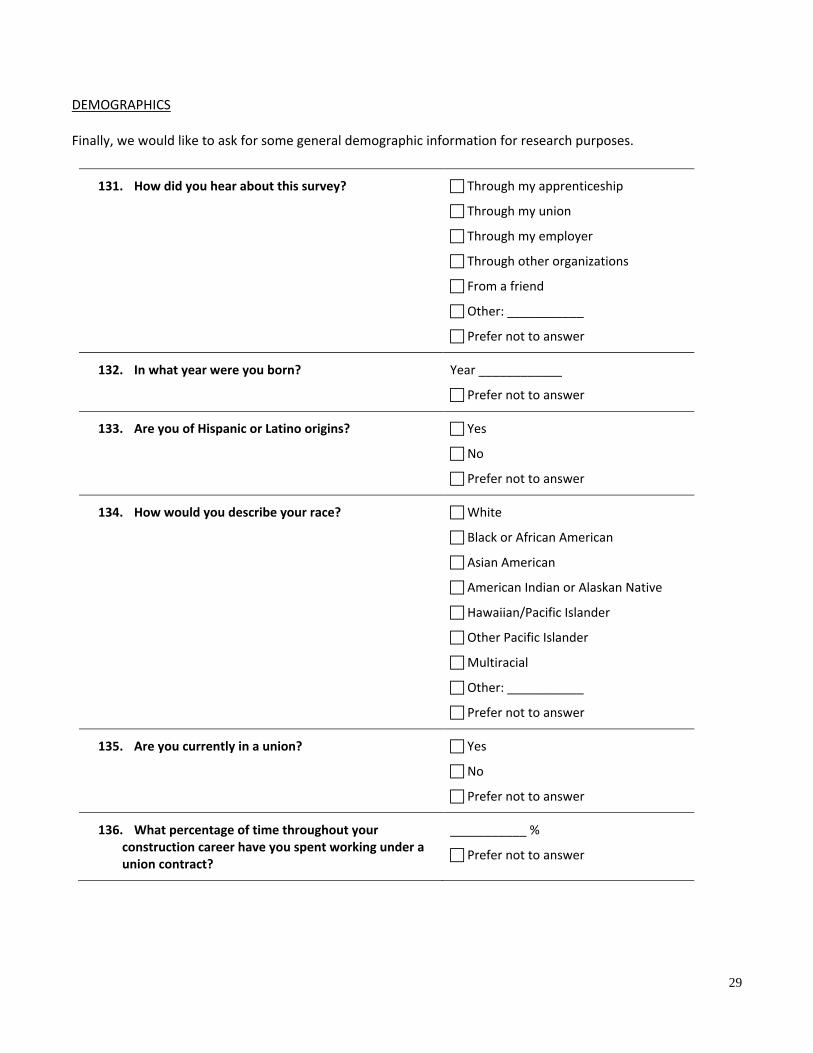
29
DEMOGRAPHICS Finally, we would like to ask for some general demographic information for research purposes.
131. How did you hear about this survey? Through my apprenticeship
Through my union
Through my employer
Through other organizations
From a friend
Other: ___________
Prefer not to answer
132. In what year were you born? Year ____________
Prefer not to answer
133. Are you of Hispanic or Latino origins? Yes
No
Prefer not to answer
134. How would you describe your race? White
Black or African American
Asian American
American Indian or Alaskan Native
Hawaiian/Pacific Islander
Other Pacific Islander
Multiracial
Other: ___________
Prefer not to answer
135. Are you currently in a union? Yes
No
Prefer not to answer
136. What percentage of time throughout your construction career have you spent working under a union contract?
___________ %
Prefer not to answer
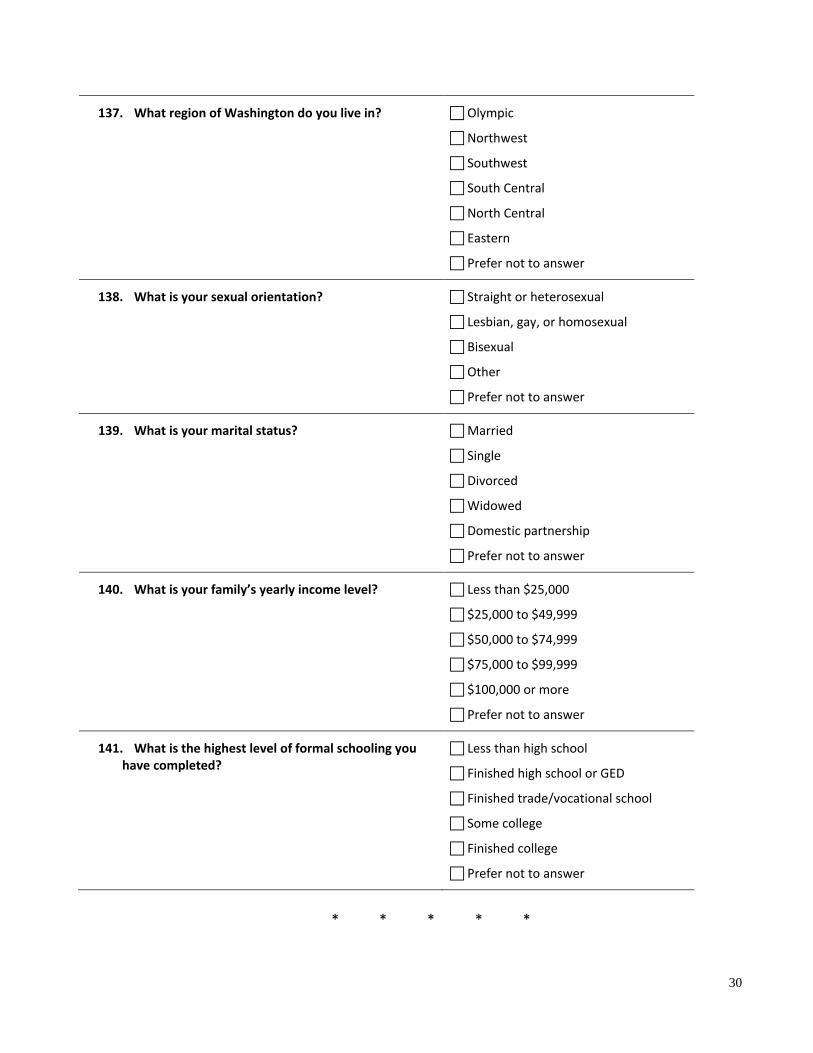
30
137. What region of Washington do you live in? Olympic
Northwest
Southwest
South Central
North Central
Eastern
Prefer not to answer
138. What is your sexual orientation? Straight or heterosexual
Lesbian, gay, or homosexual
Bisexual
Other
Prefer not to answer
139. What is your marital status? Married
Single
Divorced
Widowed
Domestic partnership
Prefer not to answer
140. What is your family’s yearly income level? Less than $25,000
$25,000 to $49,999
$50,000 to $74,999
$75,000 to $99,999
$100,000 or more
Prefer not to answer
141. What is the highest level of formal schooling you have completed?
Less than high school
Finished high school or GED
Finished trade/vocational school
Some college
Finished college
Prefer not to answer
* * * * *
31
Thank you so much for taking the time to complete this survey! Please contact your doctor if any of the questions made you concerned about your health. If you need additional support, please contact your local Regional Support Network: https://www.dshs.wa.gov/bha/division-behavioral-health-and-recovery/regional-support-networks-rsns-services-information. In order to receive the $20 gift card you will need to provide us with your mailing address. Gift cards will only be sent to participants who completed the entire survey and only to mailing addresses in Washington State. Please put “N/A” below if you do not want to receive a gift card. Your address is confidential and will be stored separately from your survey data. The card will be mailed to the address below within one week of this survey being received by University of Washington.
What is your mailing address?
__________________________________________
Are you interested in being re-contacted by the University of Washington for future research?
Yes
No
Thank you again for helping with our study! If you know other tradeswomen who might be interested in taking the survey, please tell them to visit the SHEWT website: http://deohs.washington.edu/shewt

Appendix B. Variables Table
Variable Scientific
Meaning
Use in
Analysis
Measurement Units Data Type Other Variable
Name in Data
#
Missing
Coding
Injury Measurement of outcome
Outcome variable
(Aim 2)
Yes (injury in past year requiring first
aid, medical
attention, or time off of work)
No
Binary We will use the same criteria for
injury as used in
the original study with an
injury in the last
year that required either
first aid or
medical attention or
required time off
of work. This will allow for
comparison with
the original study.
injured 0 Injury
No injury
Perceived
stress
Measurement
of outcome (Aim 1) and
exposure (Aim
2)
Outcome
variable (Aim 1)
and
exposure variable
(Aim 2)
High (< 25th
percentile)
Low (≥ 75th
percentile)
Binary High stress will
be considered those <25th
percentile,
averaged over all perceived
stress scale
questions.
stress2cat 4 High
Low
Work-life
balance
Measurement
of exposure
Exposure
variable
(Aim 1)
Low (< 25th
percentile)
High (≥ 75th
percentile)
Binary Poor work-life
balance will be
considered answers <25th
percentile for the
questions: How often do the
demands of your
job interfere
with your family
life or personal
time? And How often do the
demands of your
family interfere with your work
on the job?
wlbalancecat 1 Poor
Not poor
Gender Demographic Potential
effect modifier
(Aims 1
and 2)
Woman
Man
Binary a002sex 0 Woman
Man
Trade
industry
Demographic Potential
confounde
r (Aims 1 and 2)
Electrician
Laborer
Plumber/pipefitter
Other
Categorical *May consider
changing these
to dummy variables if we
can determine an
appropriate way to group them.
tradecat 0 Electrician
Laborer
Plumber/pipefitter
Other
Career level Demographic Potential
confounder (Aims 1
and 2)
Apprentice
Journey
Categorical apprentice 1 Apprentic
e
Journey
Social
support
Baseline
psychosocial information
Potential
confounder or
precision
Low (< 25th
percentile)
High (≥ 75th
percentile)
Binary Low social
support is considered
answers
averaged <25th
socialcombcat 87 Low
High
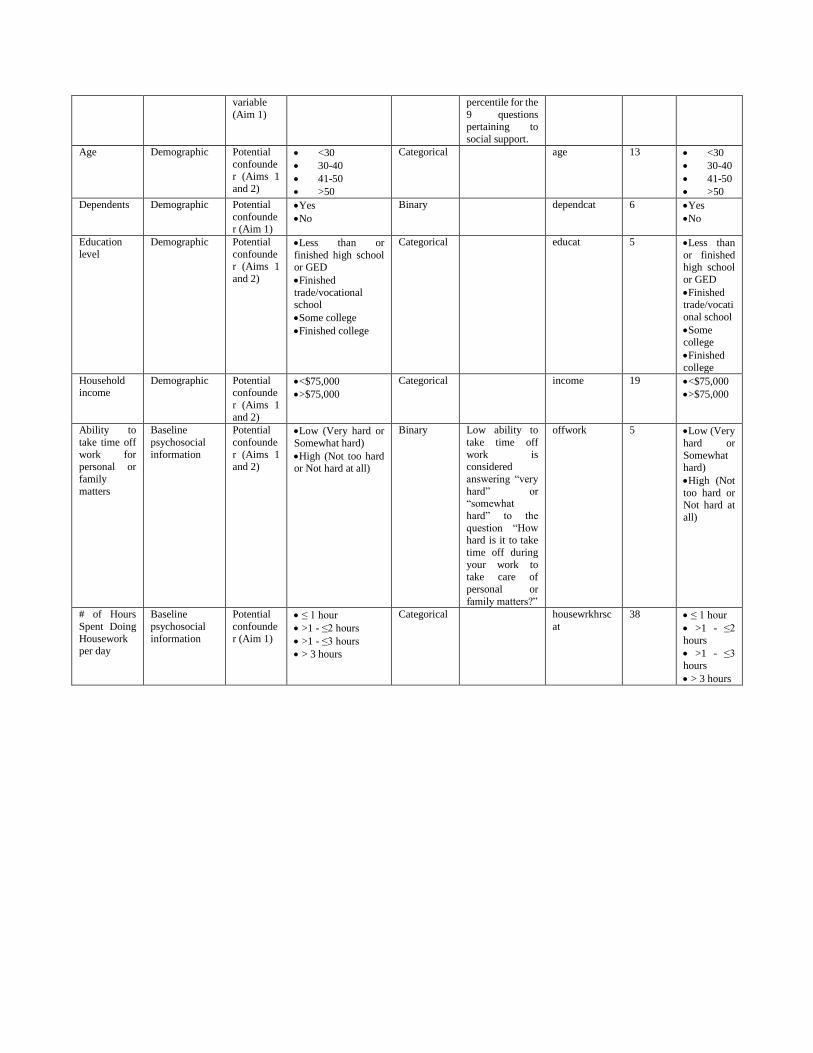
variable
(Aim 1)
percentile for the
9 questions pertaining to
social support.
Age Demographic Potential
confounder (Aims 1
and 2)
<30
30-40
41-50
>50
Categorical age 13 <30
30-40
41-50
>50
Dependents Demographic Potential
confounder (Aim 1)
Yes
No
Binary
dependcat 6 Yes
No
Education
level
Demographic Potential
confounder (Aims 1
and 2)
Less than or
finished high school or GED
Finished
trade/vocational school
Some college
Finished college
Categorical educat 5 Less than
or finished high school
or GED
Finished trade/vocati
onal school
Some
college
Finished
college
Household income
Demographic Potential confounde
r (Aims 1
and 2)
<$75,000
>$75,000
Categorical income 19 <$75,000
>$75,000
Ability to
take time off
work for personal or
family
matters
Baseline
psychosocial
information
Potential
confounde
r (Aims 1 and 2)
Low (Very hard or
Somewhat hard)
High (Not too hard or Not hard at all)
Binary Low ability to
take time off
work is considered
answering “very
hard” or “somewhat
hard” to the
question “How hard is it to take
time off during
your work to
take care of
personal or
family matters?”
offwork 5 Low (Very
hard or
Somewhat hard)
High (Not
too hard or Not hard at
all)
# of Hours
Spent Doing
Housework per day
Baseline
psychosocial
information
Potential
confounde
r (Aim 1)
≤ 1 hour
>1 - ≤2 hours
>1 - ≤3 hours
> 3 hours
Categorical housewrkhrsc
at
38 ≤ 1 hour
>1 - ≤2
hours
>1 - ≤3
hours
> 3 hours
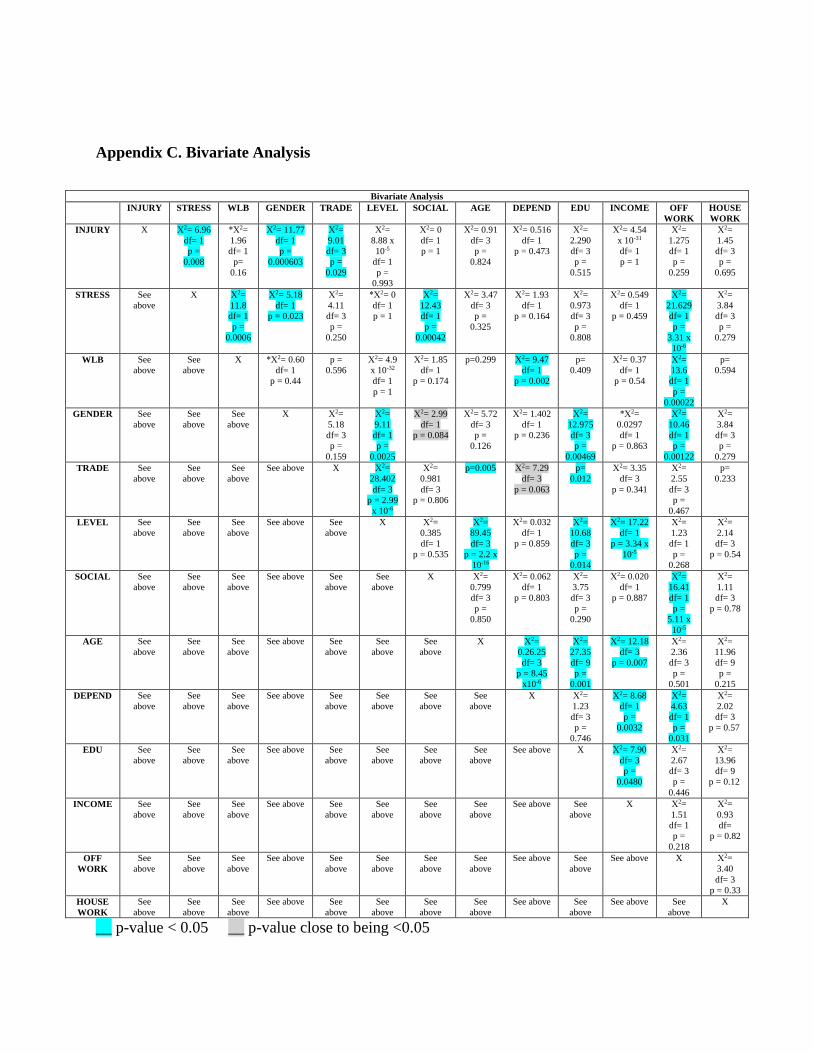
Appendix C. Bivariate Analysis
Bivariate Analysis
INJURY STRESS WLB GENDER TRADE LEVEL SOCIAL AGE DEPEND EDU INCOME OFF
WORK
HOUSE
WORK
INJURY X Χ2= 6.96
df= 1
p =
0.008
*Χ2=
1.96
df= 1
p=
0.16
Χ2= 11.77
df= 1
p =
0.000603
Χ2=
9.01
df= 3
p =
0.029
Χ2=
8.88 x
10-5
df= 1
p =
0.993
Χ2= 0
df= 1
p = 1
Χ2= 0.91
df= 3
p =
0.824
Χ2= 0.516
df= 1
p = 0.473
Χ2=
2.290
df= 3
p =
0.515
Χ2= 4.54
x 10-31
df= 1
p = 1
Χ2=
1.275
df= 1
p =
0.259
Χ2=
1.45
df= 3
p =
0.695
STRESS See
above
X Χ2=
11.8
df= 1
p =
0.0006
Χ2= 5.18
df= 1
p = 0.023
Χ2=
4.11
df= 3
p =
0.250
*Χ2= 0
df= 1
p = 1
Χ2=
12.43
df= 1
p =
0.00042
Χ2= 3.47
df= 3
p =
0.325
Χ2= 1.93
df= 1
p = 0.164
Χ2=
0.973
df= 3
p =
0.808
Χ2= 0.549
df= 1
p = 0.459
Χ2=
21.629
df= 1
p =
3.31 x
10-6
Χ2=
3.84
df= 3
p =
0.279
WLB
See
above
See
above
X *Χ2= 0.60
df= 1
p = 0.44
p =
0.596
Χ2= 4.9
x 10-32
df= 1
p = 1
Χ2= 1.85
df= 1
p = 0.174
p=0.299 Χ2= 9.47
df= 1
p = 0.002
p=
0.409
Χ2= 0.37
df= 1
p = 0.54
Χ2=
13.6
df= 1
p =
0.00022
p=
0.594
GENDER See
above
See
above
See
above
X Χ2=
5.18
df= 3
p =
0.159
Χ2=
9.11
df= 1
p =
0.0025
Χ2= 2.99
df= 1
p = 0.084
Χ2= 5.72
df= 3
p =
0.126
Χ2= 1.402
df= 1
p = 0.236
Χ2=
12.975
df= 3
p =
0.00469
*Χ2=
0.0297
df= 1
p = 0.863
Χ2=
10.46
df= 1
p =
0.00122
Χ2=
3.84
df= 3
p =
0.279
TRADE See
above
See
above
See
above
See above X Χ2=
28.402
df= 3
p = 2.99
x 10-6
Χ2=
0.981
df= 3
p = 0.806
p=0.005 Χ2= 7.29
df= 3
p = 0.063
p=
0.012
Χ2= 3.35
df= 3
p = 0.341
Χ2=
2.55
df= 3
p =
0.467
p=
0.233
LEVEL See
above
See
above
See
above
See above See
above
X Χ2=
0.385
df= 1
p = 0.535
Χ2=
89.45
df= 3
p = 2.2 x
10-16
Χ2= 0.032
df= 1
p = 0.859
Χ2=
10.68
df= 3
p =
0.014
Χ2= 17.22
df= 1
p = 3.34 x
10-5
Χ2=
1.23
df= 1
p =
0.268
Χ2=
2.14
df= 3
p = 0.54
SOCIAL See
above
See
above
See
above
See above See
above
See
above
X Χ2=
0.799
df= 3
p =
0.850
Χ2= 0.062
df= 1
p = 0.803
Χ2=
3.75
df= 3
p =
0.290
Χ2= 0.020
df= 1
p = 0.887
Χ2=
16.41
df= 1
p =
5.11 x
10-5
Χ2=
1.11
df= 3
p = 0.78
AGE See
above
See
above
See
above
See above See
above
See
above
See
above
X Χ2=
0.26.25
df= 3
p = 8.45
x10-6
Χ2=
27.35
df= 9
p =
0.001
Χ2= 12.18
df= 3
p = 0.007
Χ2=
2.36
df= 3
p =
0.501
Χ2=
11.96
df= 9
p =
0.215
DEPEND See
above
See
above
See
above
See above See
above
See
above
See
above
See
above
X Χ2=
1.23
df= 3
p =
0.746
Χ2= 8.68
df= 1
p =
0.0032
Χ2=
4.63
df= 1
p =
0.031
Χ2=
2.02
df= 3
p = 0.57
EDU See
above
See
above
See
above
See above See
above
See
above
See
above
See
above
See above X Χ2= 7.90
df= 3
p =
0.0480
Χ2=
2.67
df= 3
p =
0.446
Χ2=
13.96
df= 9
p = 0.12
INCOME See
above
See
above
See
above
See above See
above
See
above
See
above
See
above
See above See
above
X Χ2=
1.51
df= 1
p =
0.218
Χ2=
0.93
df=
p = 0.82
OFF
WORK
See
above
See
above
See
above
See above See
above
See
above
See
above
See
above
See above See
above
See above X Χ2=
3.40
df= 3
p = 0.33
HOUSE
WORK
See
above
See
above
See
above
See above See
above
See
above
See
above
See
above
See above See
above
See above See
above
X
__ p-value < 0.05 __ p-value close to being <0.05
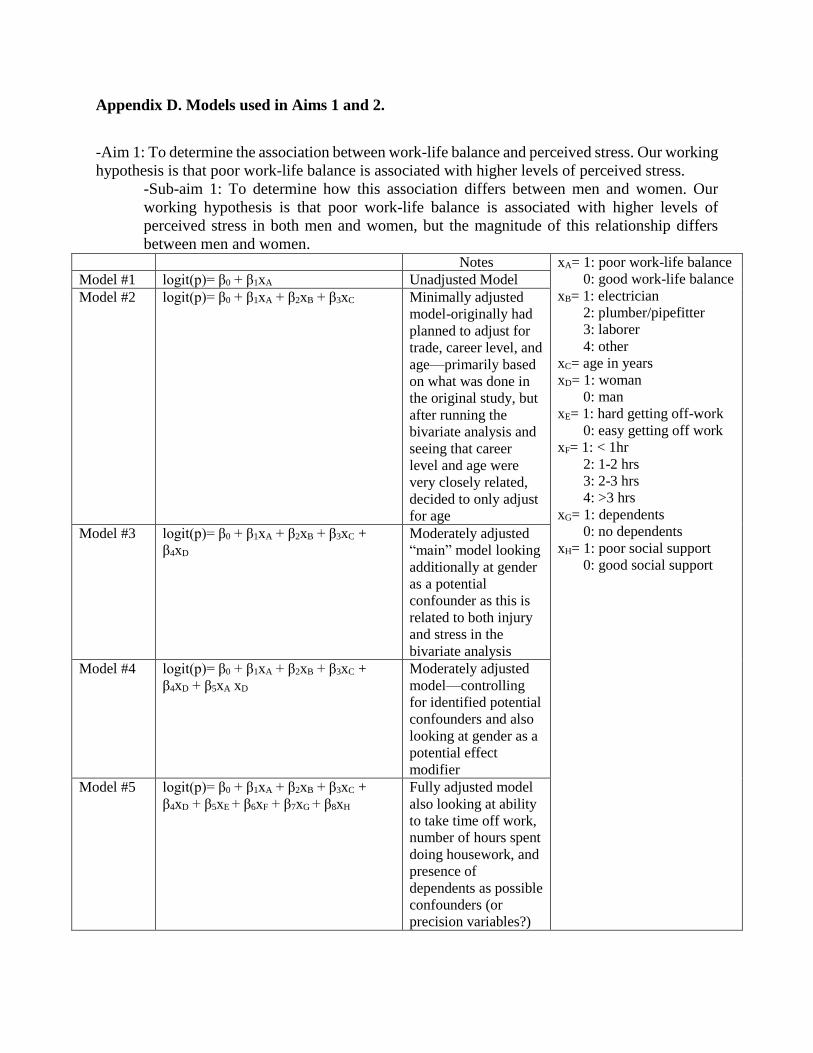
Appendix D. Models used in Aims 1 and 2.
-Aim 1: To determine the association between work-life balance and perceived stress. Our working
hypothesis is that poor work-life balance is associated with higher levels of perceived stress.
-Sub-aim 1: To determine how this association differs between men and women. Our
working hypothesis is that poor work-life balance is associated with higher levels of
perceived stress in both men and women, but the magnitude of this relationship differs
between men and women. Notes xA= 1: poor work-life balance
0: good work-life balance
xB= 1: electrician
2: plumber/pipefitter
3: laborer
4: other
xC= age in years
xD= 1: woman
0: man
xE= 1: hard getting off-work
0: easy getting off work
xF= 1: < 1hr
2: 1-2 hrs
3: 2-3 hrs
4: >3 hrs
xG= 1: dependents
0: no dependents
xH= 1: poor social support
0: good social support
Model #1 logit(p)= β0 + β1xA Unadjusted Model
Model #2 logit(p)= β0 + β1xA + β2xB + β3xC Minimally adjusted
model-originally had
planned to adjust for
trade, career level, and
age—primarily based
on what was done in
the original study, but
after running the
bivariate analysis and
seeing that career
level and age were
very closely related,
decided to only adjust
for age
Model #3 logit(p)= β0 + β1xA + β2xB + β3xC +
β4xD
Moderately adjusted
“main” model looking
additionally at gender
as a potential
confounder as this is
related to both injury
and stress in the
bivariate analysis
Model #4 logit(p)= β0 + β1xA + β2xB + β3xC +
β4xD + β5xA xD
Moderately adjusted
model—controlling
for identified potential
confounders and also
looking at gender as a
potential effect
modifier
Model #5 logit(p)= β0 + β1xA + β2xB + β3xC +
β4xD + β5xE + β6xF + β7xG + β8xH
Fully adjusted model
also looking at ability
to take time off work,
number of hours spent
doing housework, and
presence of
dependents as possible
confounders (or
precision variables?)

-Aim 2: To determine the association between perceived stress and injury. We will test the
hypothesis that higher levels of perceived stress are associated with higher risk of injury.
-Sub-aim 2: To determine how this association differs between men and women. Our
working hypothesis is that higher levels of perceived stress are associated with a higher
risk of injury in both men and women, but the magnitude of this relationship differs
between men and women.
Notes xA= 1: high perceived stress
0: low perceived stress
xB= 1: electrician
2: plumber/pipefitter
3: laborer
4: other
xC= 1: woman
0: man
xD= age in years
Model #1 logit(p)= β0 + β1xA Unadjusted Model
Model #2 logit(p)= β0 + β1xA + β2xB Minimally adjusted
model-originally had
planned to adjust for
trade, career level, and
age—primarily based
on what was done in
the original study, but
after running the
bivariate analysis and
seeing that career
level and age were
very closely related
and neither were
related to injury,
decided to leave these
out
Model #3 logit(p)= β0 + β1xA + β2xB + β3xC Moderately adjusted
“main” model adding
gender into the
models, gender is
related to both injury
and stress
Model #4 logit(p)= β0 + β1xA + β2xB + β3xC +
β4xD + β5xA xC
Moderately adjusted
model controlling for
identified potential
confounders and also
looking at gender as a
potential effect
modifier
Model #5 logit(p)= β0 + β1xA + β2xB + β3xC +
β4xD ……
Further adjusted
model

Appendix E. Logistic Regression Analysis Results
Table 1: Odds Ratios (95% Confidence Intervals) of High Perceived Stress (Original 5
Models)
Unadjusted Model Minimally Adjusted
Model
Moderately
Adjusted (“Main”)
Model
Moderately
Adjusted Model
with Effect
Modification
Further Adjusted
Model
Poor Work-life Balance
(ref: good) 4.20 (1.88, 10.04)*** 4.49 (1.95, 10.66)*** 4.38 (1.87, 10.61)*** 4.78 (1.80, 13.68)** 1.36 (0.40, 4.47)
Trade (ref: other)
Laborer
Electrician
Plumber/Pipefitter
-- --
--
0.95 (0.44, 1.97) 1.34 (0.64, 2.76)
1.90 (0.73, 4.79)
1.03 (0.48, 2.14) 1.36 (0.65, 2.83)
2.19 (0.82, 5.67)
1.05 (0.48, 2.19) 1.36 (0.64, 2.83)
2.18 (0.82, 5.66)
0.96 (0.33, 2.66) 1.18 (0.38, 3.51)
0.44 (0.05, 2.45)
Age (ref <30)
30-40
41-50
>50
--
0.85 (0.39, 1.87)
0.80 (0.34, 1.91)
0.54 (0.22, 1.33)
0.79 (0.35, 1.77)
0.69 (0.28, 1.67)
0.48 (0.19, 1.21)
0.80 (0.36, 1.81)
0.71 (0.29, 1.76)
0.49 (0.19, 1.23)
1.07 (0.27, 4.62)
1.58 (0.40, 6.87)
0.64 (0.15, 2.88)
Woman (ref: man) -- -- 2.38 (1.23, 4.76)** 2.27 (1.14, 4.76)* 3.03 (1.15, 10.00)*
Poor Work-life Balance
x Woman (effect
modification)
-- -- -- 1.45 (0.18, 14.29) --
Difficult to take time off
work (ref: not difficult) -- -- -- -- 2.79 (1.17, 6.88)*
Housework (ref: < 1
hour daily)
1-2 hours daily
2-3 hours daily
>3 hours daily
--
-- --
--
-- --
--
-- --
--
-- --
1.92 (0.59, 6.90)
2.30 (0.66, 8.68) 1.60 (0.40, 6.62)
Low social support (ref:
high social support) -- -- -- -- 3.70 (1.56, 9.09)**
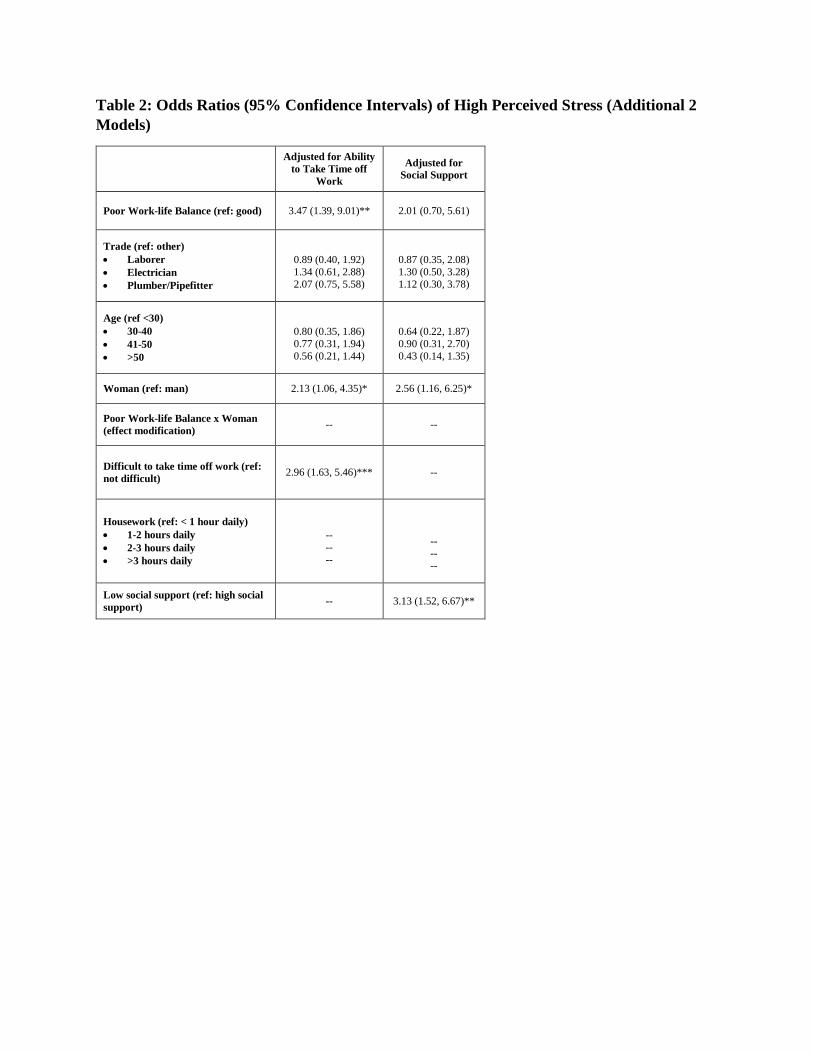
Table 2: Odds Ratios (95% Confidence Intervals) of High Perceived Stress (Additional 2
Models)
Adjusted for Ability
to Take Time off
Work
Adjusted for
Social Support
Poor Work-life Balance (ref: good) 3.47 (1.39, 9.01)** 2.01 (0.70, 5.61)
Trade (ref: other)
Laborer
Electrician
Plumber/Pipefitter
0.89 (0.40, 1.92)
1.34 (0.61, 2.88)
2.07 (0.75, 5.58)
0.87 (0.35, 2.08)
1.30 (0.50, 3.28)
1.12 (0.30, 3.78)
Age (ref <30)
30-40
41-50
>50
0.80 (0.35, 1.86)
0.77 (0.31, 1.94)
0.56 (0.21, 1.44)
0.64 (0.22, 1.87)
0.90 (0.31, 2.70)
0.43 (0.14, 1.35)
Woman (ref: man) 2.13 (1.06, 4.35)* 2.56 (1.16, 6.25)*
Poor Work-life Balance x Woman
(effect modification) -- --
Difficult to take time off work (ref:
not difficult) 2.96 (1.63, 5.46)*** --
Housework (ref: < 1 hour daily)
1-2 hours daily
2-3 hours daily
>3 hours daily
--
--
--
-- --
--
Low social support (ref: high social
support) -- 3.13 (1.52, 6.67)**
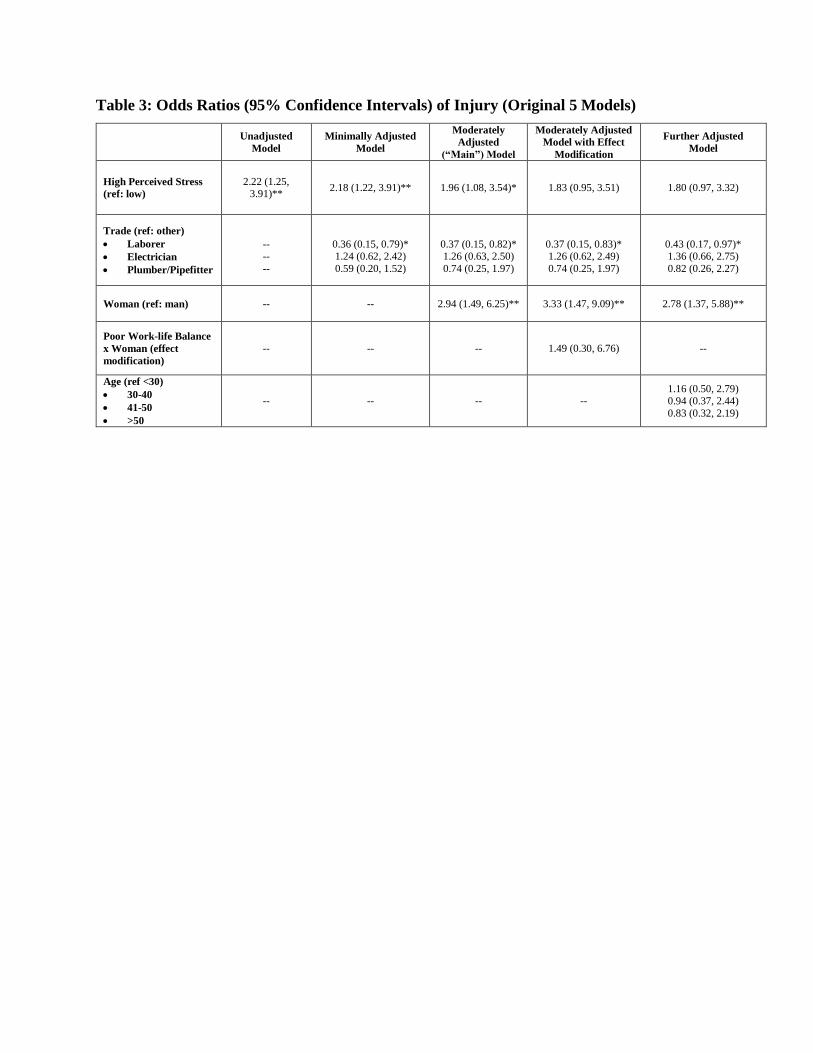
Table 3: Odds Ratios (95% Confidence Intervals) of Injury (Original 5 Models)
Unadjusted
Model
Minimally Adjusted
Model
Moderately
Adjusted
(“Main”) Model
Moderately Adjusted
Model with Effect
Modification
Further Adjusted
Model
High Perceived Stress
(ref: low)
2.22 (1.25, 3.91)**
2.18 (1.22, 3.91)** 1.96 (1.08, 3.54)* 1.83 (0.95, 3.51) 1.80 (0.97, 3.32)
Trade (ref: other)
Laborer
Electrician
Plumber/Pipefitter
-- --
--
0.36 (0.15, 0.79)* 1.24 (0.62, 2.42)
0.59 (0.20, 1.52)
0.37 (0.15, 0.82)* 1.26 (0.63, 2.50)
0.74 (0.25, 1.97)
0.37 (0.15, 0.83)* 1.26 (0.62, 2.49)
0.74 (0.25, 1.97)
0.43 (0.17, 0.97)* 1.36 (0.66, 2.75)
0.82 (0.26, 2.27)
Woman (ref: man) -- -- 2.94 (1.49, 6.25)** 3.33 (1.47, 9.09)** 2.78 (1.37, 5.88)**
Poor Work-life Balance
x Woman (effect
modification)
-- -- -- 1.49 (0.30, 6.76) --
Age (ref <30)
30-40
41-50
>50
-- -- -- -- 1.16 (0.50, 2.79) 0.94 (0.37, 2.44)
0.83 (0.32, 2.19)
REFERENCES
Allen, T. D., Herst, D. E., Bruck, C. S., & Sutton, M. (2000). Consequences Associated With
Work-to-Family Conflict: A Review and Agenda for Future Research. Journal of
Occupational Health Psychology, 5(2), 278-308.
American Psychological Association. (2010). Stress and Gender. Retrieved from
https://www.apa.org/news/press/releases/stress/2010/gender-stress.pdf
Anderson, N. J., Bonauto, D. K., & Adams, D. (2013). Prioritizing Industries for Occupational
Injury and Illness Prevention and Research, Washington State Workers' Compensation
Claims Data, 2002-2010. Washington State Department of Labor and Industries , Safety
and Health Assessment and Research for Prevention (SHARP) Program. Olympia :
Washington State Department of Labor and Industries. Retrieved May 10, 2018
Beswick, J., Rogers, K., Corbett, E., Binch, S., & Jackson, K. (2007). An analysis of the
prevalence and distribution of stress in the construction industry. Berkshire: Health and
Safety Laboratory.
Bodner, T., Kraner, M., Bradford, B., Hammer, L., & Truxillo, D. (2014). Safety, Health, and
Well-Being of Municipal Utility and Construction Workers. Journal of Occupational and
Environmental Medicine, 56(7), 771-778.
Bond, M. A., Punnett, L., Pyle, J. L., Cazeca, D., & Cooperman, M. (2004). Gendered Work
Conditions, Health, and Work Outcomes. Journal of Occupational Health Psychology,
9(1), 28-45.
Boschman, J., van der Molen, H., Sluiter, J., & Frings-Dresen, M. (2013). Psychosocial work
environment and mental health among construction workers. Applied Ergonomics, 44(5),
748-755.
Burns, K. N., Sayler, S. K., & Neitzel, R. L. (2019). Stress, health, noise exposures, and injuries
among electronic waste recycling workers in Ghana. Journal of Occupational Medicine
and Toxicology, 14(1), 1-11.
Cohen, S. (2004). Social Relationships and Health. American Psychologist, 676-684.
Cohen, S., Janicki-Deverts, D., & Miller, G. E. (2007). Psychological Stress and Disease.
Journal of the American Medical Association, 298(14), 1685-1687.
Cohen, S., Kamarck, T., & Mermelstein, R. (1983). A Global Measure of Perceived Stress.
Journal of Health and Social Behavior, 24(4), 385-396.
Curtis, H. M., Meischke, H., Stover, B., Simcox, N. J., & Seixas, N. S. (2018). Gendered Safety
and Health Risks in the Construction Trades. Annals of Work Exposures and Health, 1-
12. doi:10.1093/annweh/wxy006

Faragher, E., Cass, M., & Cooper, C. (2005). The relationship between job satisfaction and
health: a meta-analysis. Occupational and Environmental Medicine, 62, 105-112.
Fitzgerald, L. F., Drasgow, F., Hulin, C. L., Gelfand, M. J., & Magley, V. J. (1997). Antecedents
and Consequences of Sexual Harassment in Organizations: A Test of an Integrated
Model. Journal of Applied Psychology, 82(4), 578-589.
Frone, M. R., Russell, M., & Barnes, G. M. (1996). Work-Family Conflict, Gender, and Health-
Related Outcomes: A Study of Employed Parents in Two Community Samples. Journal
of Occupational Health Psychology, 1(1), 57-69.
Goldenhar, L. M., Williams, L. J., & Swanson, N. G. (2003). Modelling relationships between
job stressors and injury and near-miss outcomes for construction labourers. Work &
Stress, 17(3), 218-240.
Goldnehar, L. M., Swanson, N. G., Hurrell, J. J., Ruder, A., & Deddens, J. (1998). Stressors and
Adverse Outcomes for Female Construction Workers. Journal of Occupational Health
Psychology , 3(1), 19-32.
Hegewisch, A., & O'Farrell, B. (2015). Women in the Construction Trades: Earnings, Workplace
Discrimination, and the Promise of Green Jobs. Institute for Women's Policy Research.
Hunt, K., & Annandale, E. (1993). Just the job? Is the relationship between health and domestic
and paid work gender-specific? Sociology of Health and Illness, 15(5), 632-664.
Hurrell, J. J., & McLaney, M. A. (1988). Exposure to job stress-A new psychometric instrument.
Scandinavian Journal of Work Environmental Health, 14, 27-28.
Institute for Women's Policy Research. (2014). Untapped Resources, Untapped Labor Pool .
Institute for Women's Policy Research, Green Ways Jobs for the Future.
Islam, S. S., Velilla, A. M., Doyle, E. J., & Ducatman, A. M. (2001). Gender differences in
Work-Related Injury/Illness: Analysis of Workers Compensation Claims. American
Journal of Industrial Medicine, 39, 84-91.
Kim, H.-C., Park, S.-G., Min, K.-B., & Yoon, K.-J. (2008). Depressive symptoms and self-
reported occupational injury in small and medium sized companies. International Archive
of Occupational and Environmental Health, 82, 715-721.
Menches, C. L., & Abraham, D. M. (2007). Women in Construction-Tapping the Untapped
Resource to Meet Future Demands. Journal of Construction Engineering and
Management, 133(9), 701-707.
Moir, S., Thomson, M., & Kelleher, C. (2001). Unfinished Business: Building Equality for
Women in the Construction Trades. Boston: Labor Resource Center Publications.
NIOSH. (2010). General social survey 2010, section D: quality of worklife module: the National
Institute for Occupational Safety and Health (NIOSH). Atlanta : NIOSH.

Occupational Health and Safety Administration. (2018, December 18). Commonly Used
Statistics. Retrieved March 13, 2019, from Occupational Health and Safety
Administration: https://www.osha.gov/ohstats/commonstats.html
Ringen, K., Seegal, J., & Englund, A. (1995). Safety and Health in the Construction Industry.
Annual Review of Public Health, 16, 165-188.
Schneider, S. P. (2001). Musculoskeletal Injuries in Construction: A Review of the Literature.
Applied Occpational and Environmental Hygeine, 16(11), 1056-1064.
United States Department of Labor. (2019, January 18). Labor Force Statistics From the Current
Population. Retrieved from Bureau of Labor Statistics :
https://www.bls.gov/cps/cpsaat11.htm
University of Washington. (2019). Safety and Health Empowerment for Women in the Trades.
Retrieved May 20, 2018, from https://deohs.washington.edu/shewt
Vermeulen, M., & Mustard, C. (2000). Gender differences in job strain, social support at work,
and psychological distress. Journal of Occupational Health Psychology, 5(4), 428-440.
Vester Thorsen, S., Pedersen, J., Flyvholm, M.-A., Kristiansen, J., Rugulies, R., & Bultmann, U.
(2019). Perceived stress and sickness absence: a prospectie study of 17,795 employees in
Denmark. International Archives of Occpational and Environmental Health.
Walters, P., & Whitehouse, G. (2012). A Limit to Reflexivity: The Challenge for Working
Women of Negotiating Sharing of Household Labor. Journal of Family Issues, 33(8),
1117-1139.
Watts, J. H. (2009). 'Allowed into a Man's World' Meanings of Work-Life Balance: Perspectives
of Women Civil Engineers as 'Minority' Workers in Construction. Gender, Work, and
Organization, 16(1), 37-57.
Wilkins, K., & Mackenzie, S. G. (2007). Work Injuries. Health Reports, 18(3), 1-18.