the relationship of biochemical markers of bone turnover to bone density changes in postmenopausal...
TRANSCRIPT
The Relationship of Biochemical Markers of BoneTurnover to Bone Density Changes in Postmenopausal
Women: Results from the PostmenopausalEstrogen/Progestin Interventions (PEPI) Trial
ROBERT MARCUS,1 LEAH HOLLOWAY,1 BRADLEY WELLS,2 GAIL GREENDALE,3
MARGARET K. JAMES,2 CAROL WASILAUSKAS,2 and JOSEPH KELAGHAN4
ABSTRACT
We assessed the associations of eight bone turnover markers (BTMs) with baseline and 1-year percentage changesin lumbar spine and hip bone mineral density (BMD) of 293 postmenopausal women undergoing treatment withhormone replacement therapy (HRT) or placebo using squared correlation coefficients (R2). In 239 women as-signed to treatment with estrogen alone or with with estrogen plus progestins (active treatment), mean percentagechanges for all markers decreased significantly and remained below baseline values through 3 years of study,whereas mean percentage changes for 54 women assigned to the placebo group showed no significant change frombaseline in any marker. At baseline, age and body mass index (BMI) together accounted for 16% and 25% of thevariance in spine and hip BMD, respectively. The telopeptide resorption marker, cross-linked N-telopeptide of typeI collagen (NTX), alone accounted for 12% and 8% of variance, respectively. Another telopeptide, carboxy-terminal telopeptide of type I collagen (Crosslaps), accounted for 8% and 7% of variance, respectively. A bone-specific alkaline phosphatase (BALP-2) accounted for 8% of variance at the spine and 5% at the hip. No othermarker accounted for more than 5% of total variance at either site; adding either baseline NTX, Crosslaps, orBAP-2 to regressions containing age and BMI increasedR2 values at the spine and hip to about 22% and 28%,respectively. In the placebo group, baseline spine BMD accounted for 4% of the variance in 1-year spine BMDpercentage change, whereas baseline values for age and BMI accounted for 1% and 0% of the variance, respec-tively; none of the three accounted for more than 0% of hip BMD percentage change; Crosslaps and NTXcontributed 5% and 4% to the variance in 1-year spine BMD percentage change, but other markers accounted for< 2% of variance at the spine. At the hip, another BALP (BALP-1) accounted for 4% of variance, but no otherbaseline marker except NTX accounted for more than 1% of variance. In the active treatment group, baselinevalues for age, BMI, and spine BMD together accounted for 13% of the percentage change in spine BMD and for4% of the BMD change at the hip. No individual or pair of baseline markers significantly enhanced theseR2 values,but addition of 1-year percentage changes in some individual markers did significantly increase it. The largestR2
value was obtained by adding the percentage change in BALP-2, which increased theR2 in spine BMD percentagechange to 20% and that at the hip to 8%. Adding baseline and change variables for all eight markers to theregression increasedR2 to 28% at the spine and 12% at the hip. Restricting the set of analyses to individuals whosuppressed marker activity beyond the precision error for the measurement did not improveR2s for the regres-sions. When baseline marker values were stratified into quartiles, only NTX and osteocalcin showed significant
1Department of Medicine, Stanford University and the Geriatrics Research, Education & Clinical Center, Veterans Affairs MedicalCenter, Palo Alto, California, U.S.A.
2Biostatistics Section, Department of Public Health Sciences, Wake Forest University School of Medicine, Winston Salem, NorthCarolina, U.S.A.
3Department of Medicine, UCLA School of Medicine, Los Angeles, California, U.S.A.4Contraception & Reproductive Health Branch, National Institute of Child Health & Development, National Institutes of Health,
Bethesda, Maryland, U.S.A.
JOURNAL OF BONE AND MINERAL RESEARCHVolume 14, Number 9, 1999Blackwell Science, Inc.© 1999 American Society for Bone and Mineral Research
1583

relationships between quartile and change in spine BMD, and these did not reach significance at the hip. When the1-year change in markers was stratified into quartiles, significant relationships with percentage change in spineBMD were observed only for BALP phosphatases. We conclude that BTMs are not a surrogate for BMD to identifywomen with low bone mass and that they offer little useful information for predicting BMD changes for individualuntreated or HRT-treated postmenopausal women. (J Bone Miner Res 1999;14:1583–1595)
INTRODUCTION
BIOCHEMICAL MARKERS of bone turnover are chemicalentities whose appearance in the circulation or excre-
tion in the urine mirrors the contemporaneous whole bodyrate of bone turnover. Introduction of these markers asaccurate, noninvasive, and relatively simple diagnostic testshas routinized the assessment of bone turnover and its com-ponents, resorption and formation.(1) Proper use of thesetests in the clinical setting, rather than in population studies,remains an issue of great interest and some controversy.Several potential applications for turnover markers havealready been proposed. These include the diagnosis of highremodeling states; characterizing the pathogenesis of skel-etal disorders (e.g., defining the relative activity of resorp-tion vs. formation); obtaining information about remodel-ing dynamics that might otherwise require a bone biopsy;monitoring the response to therapy; predicting fracture risk;and early prediction of changes in bone mass. The latterapplication, if validated, would be particularly useful tophysicians who currently must wait to determine by densi-tometry whether bone is being conserved or lost. This isparticularly true in the case of women at the time of meno-pause, in whom the time required for bone density follow-up may exceed 1 year because the actual rate of change inbone mineral density (BMD) may not be much greater thanthe precision error of the measurement itself. To date, onlylimited evaluation of turnover markers for this applicationhas been reported, and the utility of bone markers, particu-larly for individual patients, remains uncertain. The recentPostmenopausal Estrogen/Progestin Interventions Trial(PEPI) allowed us to examine relationships between bonemass and several different bone turnover markers (BTMs),either alone or in combination, in a large group of womenwho underwent menopause 1–10 years previously. In thispaper, we focused on three issues: the cross-sectional rela-tionship between baseline turnover marker concentrationsand baseline BMD, the degree to which baseline values ofturnover markers predict rates of change in BMD forwomen assigned either to placebo or to active hormonaltherapy, and the relationship between changes in turnovermarkers and changes in BMD over time.
MATERIALS AND METHODS
Design, overview, and participants
The rationale, design, and background of the PEPI trialhave been described in detail elsewhere.(2–5) Briefly, PEPIwas a 3-year randomized, double-blinded, placebo-controlled clinical trial conducted in 7 United States clinical
centers. The primary goal of PEPI was to compare the ef-fects of selected hormonal regimens on coronary heart dis-ease risk factors in healthy postmenopausal women.(2,3) Asecond purpose was to assess long-term effects of thesehormonal regimens on BMD at clinically relevant sites.
Between December 1989 and February 1991, 875 womenbetween the ages of 45 and 64 years were randomized. Eli-gible women were stratified by clinical center and hyster-ectomy (with or without uterus) status, and randomized atbaseline to one of five treatment groups. Women had to besurgically or naturally menopausal (longer than 1 year butless than 10 years since the last menstrual period), not tak-ing estrogen or progestin for at least 2 months prior to thefirst screening visit (4 months before randomization), and, iftreated with thyroid hormone replacement, to have been ona stable dose for at least 3 months prior to initial screening.Medical exclusions included one or more of the following:extreme hyperlipidemia, marked obesity, severe hyperten-sion, recent myocardial infarction, congestive heart failure,stroke (or transient ischemic attack), antiarrhythmia medi-cation use, diabetes mellitus requiring insulin, prior breastor endometrial cancer, melanoma, any nonbasal cell skincancer in the previous 5 years, an elevated highly sensitivethyroid-stimulating hormone concentration, a history oftrauma to the lower spine or hip fracture, chronic glucocor-ticosteroid use, and severe menopausal symptoms.
Participants returned biannually for 3 years. The follow-ing were assessed at every clinic visit: symptoms; medica-tion use; adherence to assigned medication; adverse expe-riences, including fractures; blood pressure; weight; andheight. BMD was assessed three times during the trial: priorto or at the randomization visit, at the 12-month visit, and atthe 36-month visit.
Three PEPI clinical centers (University of California, LosAngeles, CA, George Washington University, Washington,DC, and Stanford University, Palo Alto, CA) were desig-nated for special studies which required the collection andrepository storage of additional urine and blood specimens.Three hundred and eighty-three participants were random-ized at these centers. Most of the analyses reported hererepresent 293 of these women who took more than 80% oftheir assigned study medication and for whom completebone turnover and BMD data are available for the baselineand 1 year of observation (the study group). A few analysesapply to 212 of those adherent women with complete boneturnover and BMD data available for the entire 3-year trial.
Treatment
Participants were assigned to one of the following treat-ment arms in 28-day cycles: placebo; conjugated equine es-
MARCUS ET AL.1584

trogens (CEE), 0.625 mg daily (estrogen only); CEE, 0.625mg/day plus medroxyprogesterone acetate (MPA), 10 mg/day for days 1–12; CEE, 0.625 mg/day + MPA, 2.5 mg/day(MPAC); and CEE, 0.625 mg/day daily + micronized pro-gesterone (MP), 200 mg/day for days 1–12. All study medi-cations were taken orally as pills (CEE and MPA) or cap-sules (MP). Active medications and placebo were preparedto appear identical; additionally, the two doses of MPAwere prepared to be indistinguishable in appearance. Fur-ther details on the design, rationale, conduct, and safetymonitoring are provided elsewhere.(3,4)
Measurements
Bone mineral density: BMD in the lumbar spine (L2–L4)and hip was measured using dual-energy X-ray absorptiom-etry (QDR 1000; Hologic, Waltham, MA, U.S.A.). Withfew exceptions, scans were performed in duplicate at base-line, 12 months, and 36 months. Calibration of densitom-eters, scan quality control, and scan review were centrallycoordinated by the PEPI Bone Scan Quality Control Cen-ter at the Mayo Clinic, as detailed previously.(4,5)
Bone turnover markers: Participants in the study groupprovided early morning fasting samples of urine and bloodat baseline and periodically thereafter. Aliquots of urineand serum were stored at –70°C in a central facility andshipped at the conclusion of the study to the laboratory foranalysis. Both urine and serum markers were assayed atbaseline, 12 months, and 36 months; serum markers werealso assayed on 24-month samples. All turnover measure-ments were made in the laboratory of R.M. (VA MedicalCenter Palo Alto, CA, U.S.A.). All specimens for each par-ticipant were thawed only once and processed batchwise insingle assay runs. Specimens were identified by a studynumber without reference to treatment assignment. Assayresults were forwarded to the PEPI Coordinating Center(B.W.) for entry into the PEPI database and statisticalanalysis. The following bone turnover markers were as-sayed.
Bone resorption markers: Intra/interassay coefficients ofvariation (CVs) in our laboratory are expressed as percentin the parentheses. Carboxy-terminal telopeptide of type Icollagen (Crosslaps; Osteometer, obtained through Diag-nostic Systems Laboratories, Inc., Webster TX, U.S.A.; 7.1/7.2%); amino-terminal telopeptide of type I collagen(NTX) (Ostex, Seattle, WA, U.S.A.; 8.1/9.0%); total anddeoxypyridinolines (Pyrilinks 3.4/9.5%, Pyrilinks-D 1.3/8.3%; Metra Biosystems, Mountain View, CA, U.S.A.) (ab-breviated Pyr and Dpyr).
Bone formation markers: Two assays for bone-specificalkaline phosphatase (termed BALP-1 and BALP-2, re-spectively): Ostase (Hybritech, San Clemente, CA, U.S.A.;6.8/7.5%) and Alkphase-B (Metra Biosystems; 8.0/8.5%),carboxy-terminal extension peptide for type I collagen(Prolagen-C; Metra Biosystems; 4.2/8.5%) (abbreviatedC1CP), human intact osteocalcin (immunoradiometric as-say; Diagnostic Systems Labs, Inc.; 4.7/4.9%). All reagentswere the generous gifts of the manufacturers, and all assayswere run precisely according to written manufacturer speci-fications.
Statistical methods
Observed repeated measures of BMD (means of repli-cate measurements for spine and total hip) and single BTMmeasures (four formation and four resorption markers) foreach woman were used to calculate the following responsevariables at each follow-up assessment: annualized actualchange (DBMD) and annualized percentage change (%D)from baseline values. The focus here is on %D for BMDand BTM measures and on their longitudinal relationships.Cross-sectional product moment correlations at baseline forthe BTM cohort were also examined, as well as cross-sectional correlations within placebo and active treatmentgroups at 1 year and 3 years. For correlations and as base-line covariates, natural logarithms of observed BTMs wereused because observed BTM distributions were skewed to-ward high values.
Baseline and %D BTM measures were modeled both asresponse variables to examine the effect of adhering tostudy regimens on BTMs and as time-dependent “explana-tory” covariables for %D BMD measures in general linearmodels. SAS software (SAS Institute, Cary, NC, U.S.A.)was used for computation.(6) Squared correlation coeffi-cients, R2, both simple and partial, were used to estimatestrength of relationships.
The basic linear model for testing the strength of addedvariables included baseline age, BMD (spine or hip), andbody mass index (BMI, weight/height2) as independentvariables. The five protocol treatment regimens were addedto the basic model to test pairwise differences among regi-mens on the response variables. %DBMD (spine and hip)and %DBTM (eight variables) were each analyzed as singleresponse (dependent) variables. For each of the 10 vari-ables, every active arm had a significantly different effectfrom placebo and no active arm differed significantly fromanother. Excluding the placebo group and rerunning theanalysis with the four active arms yielded the same result.Hence, all active arms were pooled into a single “active”group.
For each group (active and placebo), the logarithms ofbaseline BTMs were added to the basic model, first singlyand then in combinations to test the significance of theadditional R2 for “explaining” %DBMD at 1 year. Then, forthe active group, %DBTM values at 1 year were added in asimilar manner to obtain estimates of additional R2 as ameasure of the “strength” of the relationship of %DBTM astime varying covariates with %DBMD.
t-tests were used to test placebo versus active group pair-wise comparisons at baseline. “F” or t-tests were used totest the significance of additions to R2. In general, the prob-ability value, p # 0.05 was considered significant when test-ing the hypothesis that R2 addition(s) 4 0. No adjustmentswere made for multiple comparisons.
Precision characteristics were estimated for each of theBTM assays by two methods. To determine the interassayCV (or index of precision) for these assays in our labora-tory, daily blood and urine samples were collected from0600–0800 h for 6 successive days for a group of 10 post-menopausal women participants in an inpatient metabolicprotocol. These women had been equilibrated to a constant
BONE TURNOVER MARKERS AND BONE DENSITY CHANGE IN PEPI 1585
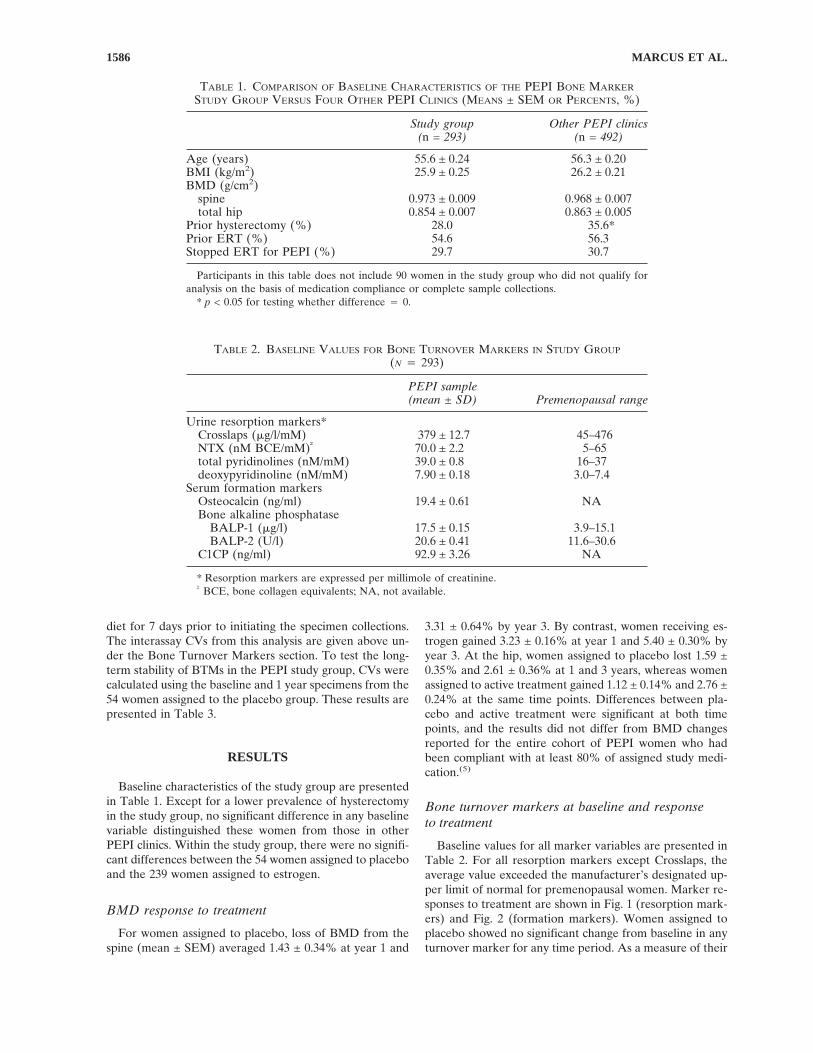
diet for 7 days prior to initiating the specimen collections.The interassay CVs from this analysis are given above un-der the Bone Turnover Markers section. To test the long-term stability of BTMs in the PEPI study group, CVs werecalculated using the baseline and 1 year specimens from the54 women assigned to the placebo group. These results arepresented in Table 3.
RESULTS
Baseline characteristics of the study group are presentedin Table 1. Except for a lower prevalence of hysterectomyin the study group, no significant difference in any baselinevariable distinguished these women from those in otherPEPI clinics. Within the study group, there were no signifi-cant differences between the 54 women assigned to placeboand the 239 women assigned to estrogen.
BMD response to treatment
For women assigned to placebo, loss of BMD from thespine (mean ± SEM) averaged 1.43 ± 0.34% at year 1 and
3.31 ± 0.64% by year 3. By contrast, women receiving es-trogen gained 3.23 ± 0.16% at year 1 and 5.40 ± 0.30% byyear 3. At the hip, women assigned to placebo lost 1.59 ±0.35% and 2.61 ± 0.36% at 1 and 3 years, whereas womenassigned to active treatment gained 1.12 ± 0.14% and 2.76 ±0.24% at the same time points. Differences between pla-cebo and active treatment were significant at both timepoints, and the results did not differ from BMD changesreported for the entire cohort of PEPI women who hadbeen compliant with at least 80% of assigned study medi-cation.(5)
Bone turnover markers at baseline and responseto treatment
Baseline values for all marker variables are presented inTable 2. For all resorption markers except Crosslaps, theaverage value exceeded the manufacturer’s designated up-per limit of normal for premenopausal women. Marker re-sponses to treatment are shown in Fig. 1 (resorption mark-ers) and Fig. 2 (formation markers). Women assigned toplacebo showed no significant change from baseline in anyturnover marker for any time period. As a measure of their
TABLE 2. BASELINE VALUES FOR BONE TURNOVER MARKERS IN STUDY GROUP
(N 4 293)
PEPI sample(mean ± SD) Premenopausal range
Urine resorption markers*Crosslaps (mg/l/mM) 379 ± 12.7 45–476NTX (nM BCE/mM)† 70.0 ± 2.2 5–65total pyridinolines (nM/mM) 39.0 ± 0.8 16–37deoxypyridinoline (nM/mM) 7.90 ± 0.18 3.0–7.4
Serum formation markersOsteocalcin (ng/ml) 19.4 ± 0.61 NABone alkaline phosphatase
BALP-1 (mg/l) 17.5 ± 0.15 3.9–15.1BALP-2 (U/l) 20.6 ± 0.41 11.6–30.6
C1CP (ng/ml) 92.9 ± 3.26 NA
* Resorption markers are expressed per millimole of creatinine.† BCE, bone collagen equivalents; NA, not available.
TABLE 1. COMPARISON OF BASELINE CHARACTERISTICS OF THE PEPI BONE MARKER
STUDY GROUP VERSUS FOUR OTHER PEPI CLINICS (MEANS ± SEM OR PERCENTS, %)
Study group(n = 293)
Other PEPI clinics(n = 492)
Age (years) 55.6 ± 0.24 56.3 ± 0.20BMI (kg/m2) 25.9 ± 0.25 26.2 ± 0.21BMD (g/cm2)
spine 0.973 ± 0.009 0.968 ± 0.007total hip 0.854 ± 0.007 0.863 ± 0.005
Prior hysterectomy (%) 28.0 35.6*Prior ERT (%) 54.6 56.3Stopped ERT for PEPI (%) 29.7 30.7
Participants in this table does not include 90 women in the study group who did not qualify foranalysis on the basis of medication compliance or complete sample collections.
* p < 0.05 for testing whether difference 4 0.
MARCUS ET AL.1586

long-term stability, the annual percentage mean change andestimates of interassay precision were made for eachmarker using single samples obtained at baseline and atyear 1 from women in the placebo group. These are pre-sented in Table 3.
Women assigned to active treatments showed significantreductions in all markers (Figs. 1 and 2). Maximum sup-pression was observed at 12 months with subsequent returntoward baseline by 3 years in all cases. Because urine andserum were not available between baseline and the 12-month visit, no statement can be made regarding the tempoof response during the first year. The magnitude of markersuppression varied highly among markers. For resorptionmarkers, the greatest suppression was obtained with thetwo telopeptides, Crosslaps (60%) and NTX (50%), withless suppression for the pyridinolines (30% Dpyr, 25%Pyr). Similar variability was observed with formation mark-ers, ranging from 60% suppression for osteocalcin to 8%for BAP-1. For an apparent change in turnover marker foran individual to be statistically significant with 95% confi-dence the degree of suppression must exceed twice the SDof the compounded precision error for change (i.e., 2 × √2× CV). The following proportion of women in the activetreatment groups suppressed marker activity to that degreeor greater: Pyr 4 45.7%; Dpyr 4 48.4%; NTX 4 59.0%;Crosslaps 4 72.2%; osteocalcin 4 47.6%; BAP-1 4 30.2;BAP-2 4 62.5%; C1CP 4 49.0%.
Relationship of baseline markers to baseline BMD
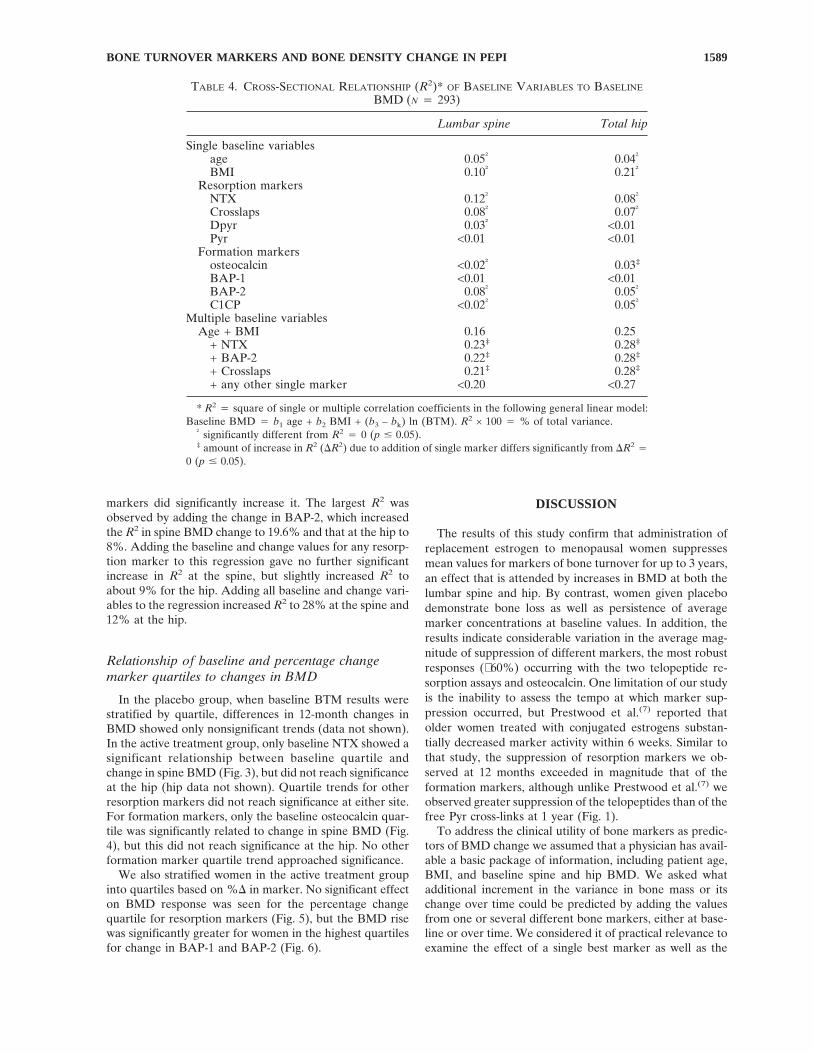
Age and BMI together accounted for 16% of the vari-ance in baseline spine BMD and 25% of the variance in hipBMD, respectively (Table 4). NTX alone contributed 12%of R2 for spine BMD and 8% at the hip, with values forCrosslaps of 8% and 7%, respectively. BAP-2 accountedfor 8% of variance at the spine and 5% at the hip. No otherresorption or formation marker by itself accounted formore than 5% of total variance at either site. Adding eitherbaseline NTX or Crosslaps to regressions containing ageand BMI increased R2 values at the spine and hip to about22% and 28%, respectively (Table 4).
Relationship of bone turnover markers to 1-yearBMD change
Placebo group: Baseline spine BMD accounted for 4.4%of the variance in 1-year spine BMD change, whereas base-line values for age and BMI accounted for 1.3% and 0.2%of the variance, respectively (Table 5-IA). Individual valuesfor Crosslaps and NTX accounted for 5.3% and 4.1% of thevariance in 1-year spine BMD change (Table 5-IB). Noother single marker accounted for as much as 2% of vari-ance at the spine. At the hip, BAP-1 accounted for 3.6% ofvariance, but no other baseline marker except NTX ac-counted for as much as 1.3% of variance (Table 5-IB).
FIG. 1. Change over time in resorption markers. Dotted lines 4 placebo; solid lines 4 active treatments.
BONE TURNOVER MARKERS AND BONE DENSITY CHANGE IN PEPI 1587
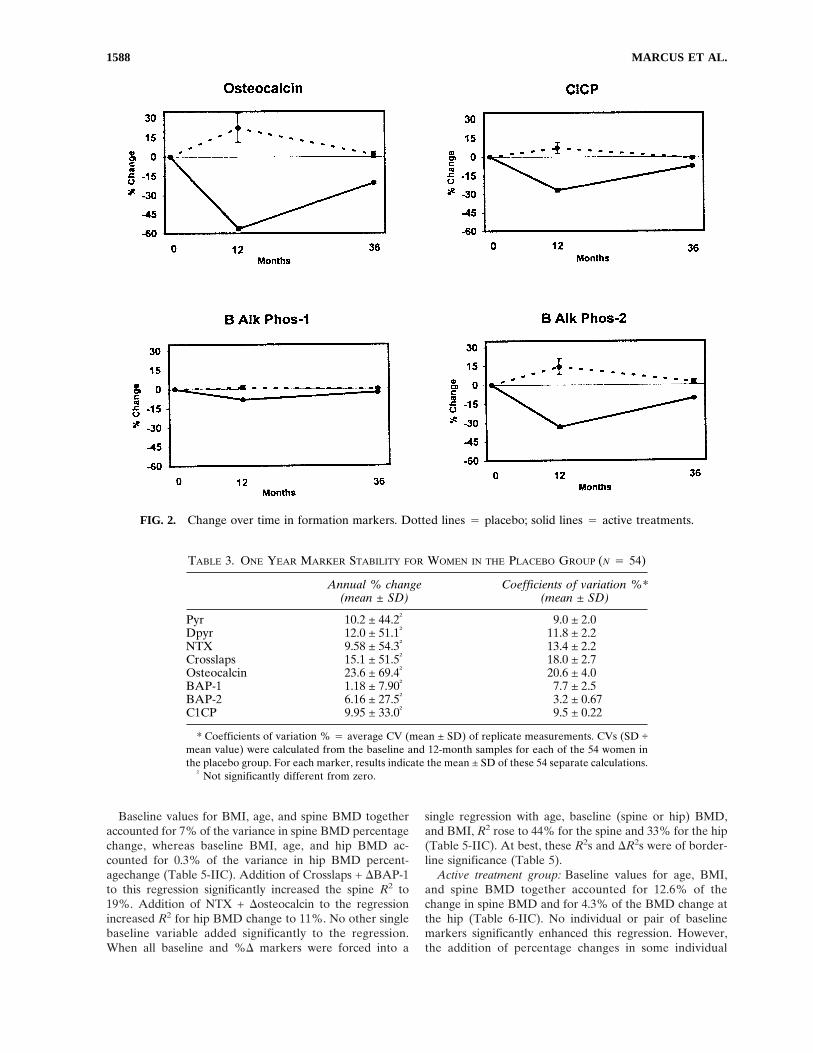
Baseline values for BMI, age, and spine BMD togetheraccounted for 7% of the variance in spine BMD percentagechange, whereas baseline BMI, age, and hip BMD ac-counted for 0.3% of the variance in hip BMD percent-agechange (Table 5-IIC). Addition of Crosslaps + DBAP-1to this regression significantly increased the spine R2 to19%. Addition of NTX + Dosteocalcin to the regressionincreased R2 for hip BMD change to 11%. No other singlebaseline variable added significantly to the regression.When all baseline and %D markers were forced into a
single regression with age, baseline (spine or hip) BMD,and BMI, R2 rose to 44% for the spine and 33% for the hip(Table 5-IIC). At best, these R2s and DR2s were of border-line significance (Table 5).
Active treatment group: Baseline values for age, BMI,and spine BMD together accounted for 12.6% of thechange in spine BMD and for 4.3% of the BMD change atthe hip (Table 6-IIC). No individual or pair of baselinemarkers significantly enhanced this regression. However,the addition of percentage changes in some individual
FIG. 2. Change over time in formation markers. Dotted lines 4 placebo; solid lines 4 active treatments.
TABLE 3. ONE YEAR MARKER STABILITY FOR WOMEN IN THE PLACEBO GROUP (N 4 54)
Annual % change(mean ± SD)
Coefficients of variation %*(mean ± SD)
Pyr 10.2 ± 44.2† 9.0 ± 2.0Dpyr 12.0 ± 51.1† 11.8 ± 2.2NTX 9.58 ± 54.3† 13.4 ± 2.2Crosslaps 15.1 ± 51.5† 18.0 ± 2.7Osteocalcin 23.6 ± 69.4† 20.6 ± 4.0BAP-1 1.18 ± 7.90† 7.7 ± 2.5BAP-2 6.16 ± 27.5† 3.2 ± 0.67C1CP 9.95 ± 33.0† 9.5 ± 0.22
* Coefficients of variation % 4 average CV (mean ± SD) of replicate measurements. CVs (SD ÷mean value) were calculated from the baseline and 12-month samples for each of the 54 women inthe placebo group. For each marker, results indicate the mean ± SD of these 54 separate calculations.
† Not significantly different from zero.
MARCUS ET AL.1588
markers did significantly increase it. The largest R2 wasobserved by adding the change in BAP-2, which increasedthe R2 in spine BMD change to 19.6% and that at the hip to8%. Adding the baseline and change values for any resorp-tion marker to this regression gave no further significantincrease in R2 at the spine, but slightly increased R2 toabout 9% for the hip. Adding all baseline and change vari-ables to the regression increased R2 to 28% at the spine and12% at the hip.
Relationship of baseline and percentage changemarker quartiles to changes in BMD
In the placebo group, when baseline BTM results werestratified by quartile, differences in 12-month changes inBMD showed only nonsignificant trends (data not shown).In the active treatment group, only baseline NTX showed asignificant relationship between baseline quartile andchange in spine BMD (Fig. 3), but did not reach significanceat the hip (hip data not shown). Quartile trends for otherresorption markers did not reach significance at either site.For formation markers, only the baseline osteocalcin quar-tile was significantly related to change in spine BMD (Fig.4), but this did not reach significance at the hip. No otherformation marker quartile trend approached significance.
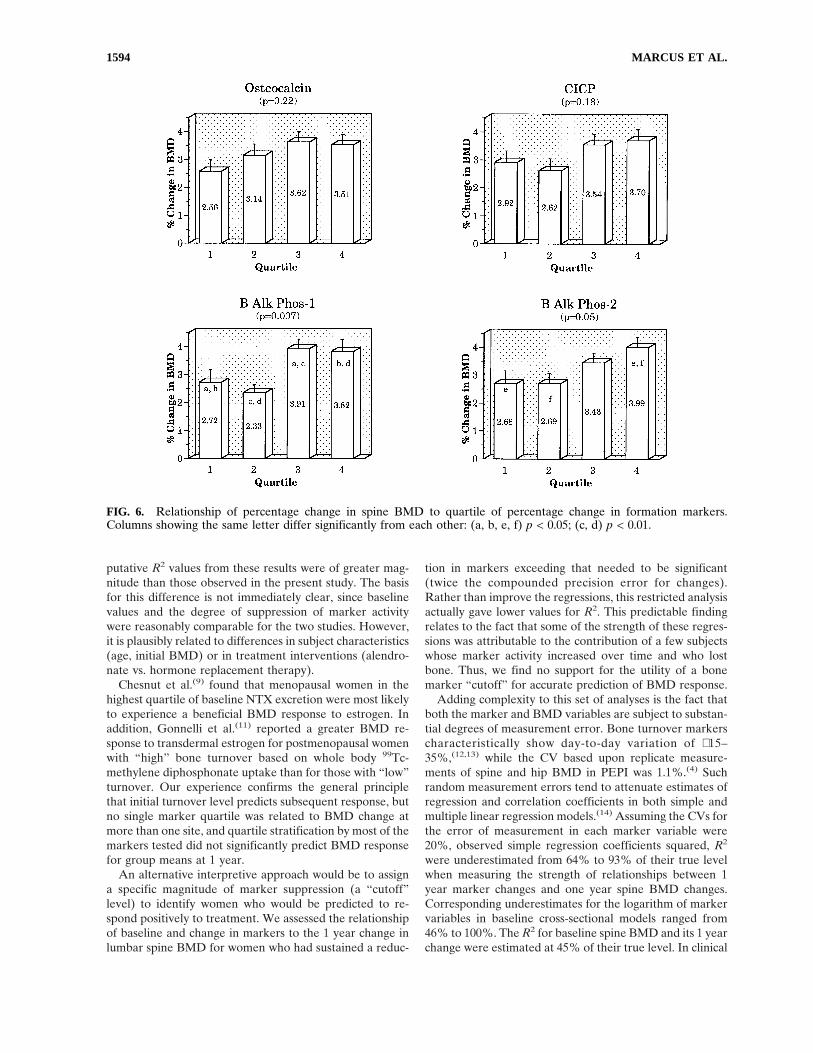
We also stratified women in the active treatment groupinto quartiles based on %D in marker. No significant effecton BMD response was seen for the percentage changequartile for resorption markers (Fig. 5), but the BMD risewas significantly greater for women in the highest quartilesfor change in BAP-1 and BAP-2 (Fig. 6).
DISCUSSION
The results of this study confirm that administration ofreplacement estrogen to menopausal women suppressesmean values for markers of bone turnover for up to 3 years,an effect that is attended by increases in BMD at both thelumbar spine and hip. By contrast, women given placebodemonstrate bone loss as well as persistence of averagemarker concentrations at baseline values. In addition, theresults indicate considerable variation in the average mag-nitude of suppression of different markers, the most robustresponses (∼60%) occurring with the two telopeptide re-sorption assays and osteocalcin. One limitation of our studyis the inability to assess the tempo at which marker sup-pression occurred, but Prestwood et al.(7) reported thatolder women treated with conjugated estrogens substan-tially decreased marker activity within 6 weeks. Similar tothat study, the suppression of resorption markers we ob-served at 12 months exceeded in magnitude that of theformation markers, although unlike Prestwood et al.(7) weobserved greater suppression of the telopeptides than of thefree Pyr cross-links at 1 year (Fig. 1).
To address the clinical utility of bone markers as predic-tors of BMD change we assumed that a physician has avail-able a basic package of information, including patient age,BMI, and baseline spine and hip BMD. We asked whatadditional increment in the variance in bone mass or itschange over time could be predicted by adding the valuesfrom one or several different bone markers, either at base-line or over time. We considered it of practical relevance toexamine the effect of a single best marker as well as the
TABLE 4. CROSS-SECTIONAL RELATIONSHIP (R2)* OF BASELINE VARIABLES TO BASELINE
BMD (N 4 293)
Lumbar spine Total hip
Single baseline variablesage 0.05† 0.04†
BMI 0.10† 0.21†
Resorption markersNTX 0.12† 0.08†
Crosslaps 0.08† 0.07†
Dpyr 0.03† <0.01Pyr <0.01 <0.01
Formation markersosteocalcin <0.02† 0.03‡
BAP-1 <0.01 <0.01BAP-2 0.08† 0.05†
C1CP <0.02† 0.05†
Multiple baseline variablesAge + BMI 0.16 0.25
+ NTX 0.23‡ 0.28‡
+ BAP-2 0.22‡ 0.28‡
+ Crosslaps 0.21‡ 0.28‡
+ any other single marker <0.20 <0.27
* R2 4 square of single or multiple correlation coefficients in the following general linear model:Baseline BMD 4 b1 age + b2 BMI + (b3 – bk) ln (BTM). R2 × 100 4 % of total variance.
† significantly different from R2 4 0 (p # 0.05).‡ amount of increase in R2 (DR2) due to addition of single marker differs significantly from DR2 4
0 (p # 0.05).
BONE TURNOVER MARKERS AND BONE DENSITY CHANGE IN PEPI 1589

single best resorption and formation markers in combina-tion. Certainly, no physician in a clinical setting would likelyrequest more than one resorption and one formationmarker. We also carried out multiple regressions by forcingall available marker data into the analysis to determine themaximum amount of additional variance in bone densitychange that could be accounted for by turnover markers.
In our correlation analysis, the combined baseline valuesfor age and BMI accounted for the greatest portion of vari-ance in baseline BMD (16% at the spine, 25% at the hip).Only NTX, Crosslaps, and BAP-2 singly “explained” morethan 5% of total variance at either site. Adding the singlemost robust resorption and formation markers to age andBMI increased R2 to no more than 23% of the variance at
the spine and 28% at the hip. Thus, bone turnover markers,even when combined with anthropometric measures, of-fered little practical information for estimating BMD in in-dividual women, and certainly did not qualify as a surrogatemeasure to identify patients with low bone mass.
We considered women in the placebo group to provide areasonable model for menopausal women who are not pre-scribed estrogen. Baseline BMI, age, and spine BMD ac-counted for 7% of the variance in subsequent 1-year changeat the spine, and, substituting hip BMD, accounted for 0.3%of change at the hip. Adding either of the telopeptide re-sorption markers or C1CP modestly increased the R2 to19% (spine) and 5.5% (hip). Adding a combination of oneresorption and one formation marker did not lead to fur-
TABLE 5. ESTIMATED PROPORTION OF VARIABILITY, R2, IN ONE YEAR PERCENT BMDCHANGE “EXPLAINED BY” BONE TURNOVER MARKERS (BTMS) IN THE PLACEBO
GROUP (N 4 54).
Variables Spine Hip
I. Individual baseline variablesA. Nonmarker covariates
BMD 0.044 0.000age 0.013 0.002BMI 0.002 0.001
B. Ln Baseline BTMsCrosslaps 0.053 0.003NTX 0.041 0.013Pyr 0.006 0.001Dpyr 0.007 0.001BAP-2 0.013 0.003C1CP 0.009 0.002osteocalcin 0.001 0.003BAP-1 0.001 0.036
C. % change (0–12 months) BTMsDCrosslaps 0.007 0.004DNTX 0.012 0.008DPyr 0.000 0.000DDpyr 0.001 0.005DBAP-2 0.024 0.011DC1CP 0.040 0.007Dosteocalcin 0.017 0.081DBAP-1 0.059 0.021
II. Selected combinations of variablesA. One resorption + one formation BTM (at baseline)
Crosslaps + BAP-1 0.065 0.051Crosslaps + Osteocalcin 0.059 0.007Crosslaps + BAP-2 0.055 0.004NTX + BAP-1 0.054 0.038Pyr + BAP-1 0.008 0.040any other combination #0.053 #0.038
B. One resorption + one formation BTM (% change 0–12 months)DNTX + DBAP-1 0.077 0.026DDpyr + DBAP-1 0.064 0.023DCrosslaps + DBAP-1 0.063 0.023DPyr + DBAP-1 0.059 0.021
C. Selected combinationsbaseline (spine or hip) BMD + age + BMI 0.07 0.003+ Crosslaps + DBAP-1 0.192 0.055+ NTX + Dosteocalcin 0.133 0.114any other combination of two markers #0.188 #0.104+ all baseline and all % change markers 0.442 0.325
MARCUS ET AL.1590

TABLE 6. ESTIMATED PROPORTION OF VARIABILITY, R2, IN ONE YEAR PERCENT BMDCHANGE “EXPLAINED BY” BONE TURNOVER MARKERS (BTMS), ACTIVE TREATMENT
GROUP (N 4 239)
Spine Hip
I. Individual variablesA. Baseline nonmarker covariates
BMD 0.086 0.007age 0.067 0.041BMI 0.006 0.000
B. Ln baseline BTMsNTX 0.026 0.004osteocalcin 0.021 0.001any other <0.008 <0.003
C. % change (0–12 months) BTMsDCrosslaps 0.042 0.003DNTX 0.038 0.008DPyr 0.018 0.005DDpyr 0.016 0.007DBAP-2 0.090 0.041DC1CP 0.072 0.006Dosteocalcin 0.051 0.022DBAP-1 0.031 0.032
II. Selected combinations of variablesA. One resorption + one formation BTM (at baseline)
BAP-2 + NTX 0.027 0.004C1CP + NTX 0.027 0.007BAP-1 + NTX 0.042 0.009osteocalcin + NTX 0.040 0.004Any other combination #0.022 #0.004
B. One resorption + one formation BTM (% change, 0–12 months)DBAP-2 + DPyr 0.096 0.042DBAP-2 + DNTX 0.103 0.042DBAP-2 + DCrosslaps 0.104 0.041DBAP-2 + DDyr 0.095 0.043any other combination <0.092 <0.033
C. (Spine or hip) BMD + age + BMI (baseline) 0.126 0.043+ Crosslaps baseline 0.126 0.043+ NTX baseline 0.134 0.048+ Pyr baseline 0.126 0.045+ Dpyr baseline 0.127 0.045+ BAP-2 baseline 0.127 0.044+ C1CP baseline 0.128 0.044+ osteocalcin baseline 0.136 0.043+ BAP-1 baseline 0.134 0.044+ any combination of 2 baseline 0.189 <0.080+ DCrosslaps 0.156* 0.045+ DNTX 0.154* 0.052+ DPYD 0.146* 0.052+ DDpyr 0.147* 0.054+ DBAP-2 0.196* 0.081*+ DC1CP 0.173* 0.047+ Dosteocalcin 0.172* 0.067*+ DBAP-1 0.145* 0.076*+ DBAP-2 + DPyr 0.205 0.083+ DBAP-2 + DNTX 0.205 0.082+ DBAP-2 + DCrosslaps 0.205 0.081+ DBAP-2 + DDpyr 0.204 0.085+ DBAP-2 + Dosteocalcin 0.219* 0.092+ DBAP-2 + BAP-2 (baseline) 0.217* 0.085any other combination of two <0.198 <0.079+ all baseline and change variables 0.284 0.123
* p < 0.05 for increase in R2 due to added variables.
BONE TURNOVER MARKERS AND BONE DENSITY CHANGE IN PEPI 1591

FIG. 3. Relationship of percentage change in spine BMD to quartile of baseline resorption markers.
FIG. 4. Relationship of percentage change in spine BMD to quartile of baseline formation markers.
MARCUS ET AL.1592

ther improvement in R2 although inclusion of all eight base-line and all 8% change markers increased R2 to 44%(spine) and 33% (hip). Thus, even when the maximumavailable marker information is utilized, 60% of the vari-ance in bone mass change remained unexplained. Conse-quently, use of markers to predict the magnitude of changein bone mass for an individual woman who does not receiveestrogen also appears to be of limited practical value.
For women receiving active treatment, change in BMDover 1 year was best predicted by a combination of vari-ables, including baseline age, BMI, and BMD, plus both thebaseline and change in two markers, NTX and skeletalALP-2. Although this result was plausible, since it is basednot only on baseline data but also the response to therapy,the achieved R2 values were still quite low, ∼20% at thespine and 8% at the hip. Entering all baseline and changevariables into the regression resulted in R2 values of only28% (spine) and 12% (hip). Once again, therefore, additionof bone marker data contributed very little to the predictionof BMD change in women treated with estrogen. We em-phasize that most of the results presented here representthe prediction of 1 year changes in BMD. Associations de-termined for 3-year BMD changes proved to be of evenlesser magnitude.
Although significant relationships between marker activ-ity and bone loss have been shown in longitudinal popula-tion studies,(8) relatively few clinical trials have relatedbone turnover markers to changes in BMD following inter-vention. Chesnut et al.(9) described their experience with
NTX in monitoring the response to therapy and predictingthe change in BMD for a large group of recently postmeno-pausal women. Estrogen therapy markedly decreased NTXexcretion, and women in the highest quartiles for baselineNTX, or whose excretion values decreased the most,showed the greatest gain in BMD. A significant relationshipwas observed between the baseline NTX value and subse-quent change in bone mass for women who received pla-cebo, and between the degree of NTX suppression andchange in bone mass for women who received active treat-ment. That report has been interpreted to indicate a goodcorrespondence of NTX change with the response to estro-gen in postmenopausal women. Although the results of thatstudy and ours differ, a component of this difference isrelated to the fact that Chesnut et al.(9) reported correlationcoefficients (r) rather than r2 (or R2 values). Thus, their rvalues of ∼0.35 between marker and changes in BMD,would correspond to an R2 of 11%.
In another study, Greenspan et al.(10) published the re-sults of a clinical trial using the bisphosphonate Alendro-nate in elderly women. In that study, baseline activity of afew, but not all, markers were reported to be associatedwith subsequent changes in BMD. The correlation coeffi-cients of baseline marker with change in BMD were notreported, but baseline NTX was moderately correlated (r4 0.28) with spine BMD at 12 months. In that same report,changes in several markers, particularly NTX and osteocal-cin, were associated with increases in BMD at both thespine (r 4 –0.41) and hip (r 4 –0.35) at 2.5 years. The
FIG. 5. Relationship of percentage change in spine BMD to quartile of percentage change in resorption markers.
BONE TURNOVER MARKERS AND BONE DENSITY CHANGE IN PEPI 1593
putative R2 values from these results were of greater mag-nitude than those observed in the present study. The basisfor this difference is not immediately clear, since baselinevalues and the degree of suppression of marker activitywere reasonably comparable for the two studies. However,it is plausibly related to differences in subject characteristics(age, initial BMD) or in treatment interventions (alendro-nate vs. hormone replacement therapy).
Chesnut et al.(9) found that menopausal women in thehighest quartile of baseline NTX excretion were most likelyto experience a beneficial BMD response to estrogen. Inaddition, Gonnelli et al.(11) reported a greater BMD re-sponse to transdermal estrogen for postmenopausal womenwith “high” bone turnover based on whole body 99Tc-methylene diphosphonate uptake than for those with “low”turnover. Our experience confirms the general principlethat initial turnover level predicts subsequent response, butno single marker quartile was related to BMD change atmore than one site, and quartile stratification by most of themarkers tested did not significantly predict BMD responsefor group means at 1 year.
An alternative interpretive approach would be to assigna specific magnitude of marker suppression (a “cutoff”level) to identify women who would be predicted to re-spond positively to treatment. We assessed the relationshipof baseline and change in markers to the 1 year change inlumbar spine BMD for women who had sustained a reduc-
tion in markers exceeding that needed to be significant(twice the compounded precision error for changes).Rather than improve the regressions, this restricted analysisactually gave lower values for R2. This predictable findingrelates to the fact that some of the strength of these regres-sions was attributable to the contribution of a few subjectswhose marker activity increased over time and who lostbone. Thus, we find no support for the utility of a bonemarker “cutoff” for accurate prediction of BMD response.
Adding complexity to this set of analyses is the fact thatboth the marker and BMD variables are subject to substan-tial degrees of measurement error. Bone turnover markerscharacteristically show day-to-day variation of ∼15–35%,(12,13) while the CV based upon replicate measure-ments of spine and hip BMD in PEPI was 1.1%.(4) Suchrandom measurement errors tend to attenuate estimates ofregression and correlation coefficients in both simple andmultiple linear regression models.(14) Assuming the CVs forthe error of measurement in each marker variable were20%, observed simple regression coefficients squared, R2
were underestimated from 64% to 93% of their true levelwhen measuring the strength of relationships between 1year marker changes and one year spine BMD changes.Corresponding underestimates for the logarithm of markervariables in baseline cross-sectional models ranged from46% to 100%. The R2 for baseline spine BMD and its 1 yearchange were estimated at 45% of their true level. In clinical
FIG. 6. Relationship of percentage change in spine BMD to quartile of percentage change in formation markers.Columns showing the same letter differ significantly from each other: (a, b, e, f) p < 0.05; (c, d) p < 0.01.
MARCUS ET AL.1594

practice, compromise of fastidious attention to timing ofcollections and sample processing would magnify the errorsof measurement, limiting further the applicability of bonemarker results to predict changes in BMD.
This analysis of the PEPI experience addressed the utilityof bone turnover markers as predictors of BMD change inrecently menopausal individual women. The results do notconfirm an important clinical role for markers in this re-gard. The possibility that markers can be usefully appliedfor other purposes in individual patients, such as document-ing states of high bone turnover, as surrogate measures forbone histomorphometry, as independent estimates of frac-ture risk,(15) or as documentation of treatment compliance,requires further prospective evaluation.
ACKNOWLEDGMENTS
The authors wish to express their gratitude to the follow-ing individuals for their cooperation and generosity in pro-viding reagents necessary to conduct this study: Mr. GopalSavjani and Dr. Paul Walton (Diagnostics Systems Labo-ratories), Ms. Karen Shepard ( Metra Biosystems, Inc.), Ms.Karen Armour and Dr. Isaac Mizrahi (Hybritech, Inc.).
REFERENCES
1. Delmas PD, Garnero P 1996 Utility of biochemical markers ofbone turnover in osteoporosis. In: Marcus R, Feldman D, Kel-sey J (eds.) Osteoporosis. Academic Press, San Diego, CA,U.S.A., pp. 1075–1088.
2. The Postmenopausal Estrogen/Progestin Interventions (PEPI)Trial Investigators 1995 Rationale, design, and conduct of thePEPI Trial. Control Clin Trials 16:3S–19S.
3. The Postmenopausal Estrogen/Progestin Interventions (PEPI)Trial Investigators 1995 Effects of estrogen/progestin regimenson heart disease risk factors in postmenopausal women: ThePostmenopausal Estrogen/Progestin Interventions (PEPI)Trial. JAMA 273:199–208.
4. Marcus R, Greendale G, Blunt BA, Bush TL, Sherman S,Sherwin R, Wahner H, Wells B 1994 Correlates of bone min-eral density in the Postmenopausal Estrogen/Progestin Inter-ventions (PEPI) Trial. J Bone Miner Res 9:1467–1476.
5. The Writing Group for the PEPI Trial 1996 Effects of hormonetherapy on bone mineral density: Results from the Postmeno-
pausal Estrogen/Progestin Interventions (PEPI) Trial. JAMA276:1389–1396.
6. SAS, Institute Inc. 1989 SAS/STAT User’s Guide, Version 6,4th Ed., Vol. 2. SAS Institute Inc., Cary, NC, U.S.A.
7. Prestwood K, Pilbeam CC, Burleson JA, Woodiel FN, DelmasPD, Deftos LJ, Raisz LG 1994 The short term effects of con-jugated estrogen on bone turnover in older women. J ClinEndocrinol Metab 79:366–371.
8. Ross PD, Knowlton W 1998 Rapid bone loss is associated withincreased levels of biochemical markers. J Bone Miner Res13:297–302.
9. Chesnut CH III, Bell NH, Clark GS, Drinkwater BL, EnglishSC, Johnston CC Jr, Notelovitz M, Rosen C, Cain DF, Fless-land KA, Mallinak NJS 1997 Hormone replacement therapy inpostmenopausal women: Urinary N-telopeptide of type I col-lagen monitors therapeutic effect and predicts response ofbone mineral density. Am J Med 102:29–37.
10. Greenspan SL, Parker RA, Ferguson L, Rosen HN, Maitland-Ramsey L, Karpf DB 1998 Early changes in biochemical mark-ers of bone turnover predict the long-term response to alen-dronate therapy in in representative elderly women: arandomized clinical trial. J Bone Miner Res 13:1431–1438.
11. Gonnelli S, Cepollaro C, Pondrelli C, Martini S, Monaco R,Gennari C 1997 The usefulness of bone turnover in predictingthe response to transdetmal estrogen therapy in postmeno-pausal osteoporosis. J Bone Miner Res 12:624–631.
12. Ju H-SJ, Leung S, Brown B, Stringer MA, Leigh S, Scherrer C,Shepard K, Jenkins D, Knudsen J, Cannon R 1997 Comparisonof analytical performance and biological variability of threebone resorption assays. Clin Chem 43:1570–1576.
13. Hannon R, Blumsohn A, Naylor K, Eastell R 1998 Responseof biochemical markers of bone turnover to hormone replace-ment therapy: Impact of biological variability. J Bone MinerRes 13:1124–1133.
14. Caroll RJ, Rupert D, Stephanski LA 1995 Measurement Errorin Nonlinear Models. Chapman & Hall, New York, NY,U.S.A.
15. Garnero P, Hausherr E, Chapuy M-C, Marcelli G, GrandjeanH, Muller C, Cormier C, Breart G, Meunier PJ, Delmas PD1996 Markers of bone resorption predict hip fracture in elderlywomen: The EPIDOS prospective study. J Bone Miner Res11:1531–1538.
Address reprint requests to:Robert Marcus, M.D.
GRECC 182-BVeterans Affairs Medical Center
3801 Miranda AvenuePalo Alto, CA 94304 U.S.A.
Received in original form October 16, 1998; in revised form March19, 1999; accepted April 29, 1999.
BONE TURNOVER MARKERS AND BONE DENSITY CHANGE IN PEPI 1595