the relationships absorbing aerosols and over the hi ... m kim umbc goddard earth sciences and...
TRANSCRIPT
The 15th APN Inter-Governmental Meeting
The relationships between absorbing aerosols and The relationships between absorbing aerosols and /i /i th Hi l d th t th Hi l d th t snow snow cover/ice cover/ice over the Himalayas and the western over the Himalayas and the western Tibetan Plateau during boreal springTibetan Plateau during boreal spring
Woo‐Seop LeeWoo‐Seop LeeKongju National University
A k l dAcknowledgmentsMaeng‐Ki Kim and Sung Kim, Kongju National University, Korea
William K. M. Lau, NASA/GSFC, Laboratory for Atmospheres, USAK M Kim UMBC Goddard Earth Sciences and Technology Center USA
APEC Climate Center, March 15 to 19, 2010, Pusan
K. M. Kim, UMBC Goddard Earth Sciences and Technology Center, USA

Climate Change is already happening in high-t i imountain regions
• Sixty-seven percent of glaciers are retreating at a startling rate Sixty seven percent of glaciers are retreating at a startling rate in the Himalayas, and the major causes have been identified as global warming ( Ageta and Kadota 1992, Yamada et al., 1996, Fushinmi 2000)
• Glaciers in the region(Himalayas) will vanish within the next 40 years as a result of global warming, and the flow of the Himalayan years as a result of global warm ng, and the flow of the H malayan rivers will eventually diminish, resulting in wide spread water shortage ..
• Over the Himalayas, from 1990 to 2000, simulated snow/ice cover decreases by 0.9% due to aerosols. The contribution of the enhanced Indian BC to this decline is 30%, similar to that , msimulated for 2000 to 2010 (menon et al., 2010)
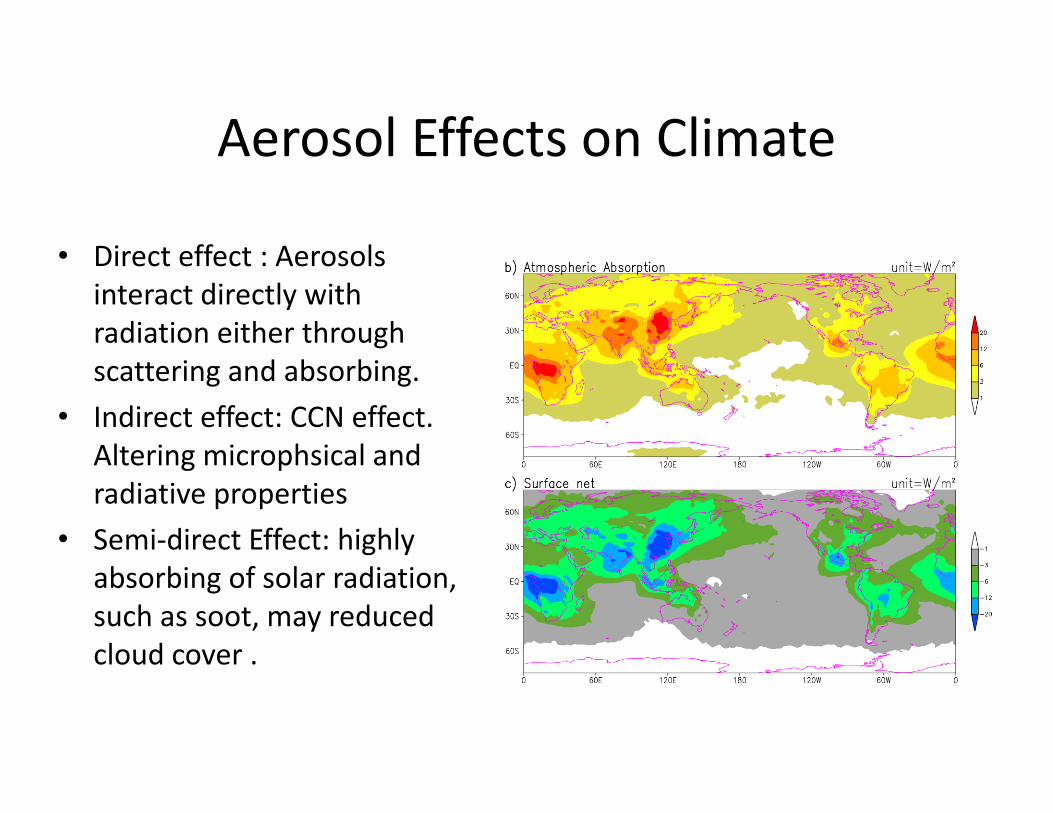
Aerosol Effects on ClimateAerosol Effects on Climate
• Direct effect : Aerosols• Direct effect : Aerosols interact directly with radiation either through scattering and absorbing.
• Indirect effect: CCN effect. Altering microphsical andAltering microphsical and radiative properties
• Semi‐direct Effect: highly absorbing of solar radiation, such as soot, may reduced cloud cover .cloud cover .

Figure SPM.2. Global average radiative forcing (RF) estimates and ranges in 2005 for anthropogenic carbon dioxide (CO2 ), methane(CH4 ), nitrous oxide (N2O) and other p g ( ), ( ), ( )important agents and mechanisms, together with the typical geographical extent (spatial scale) of the forcing and the assessed level of scientific understanding (LOSU).
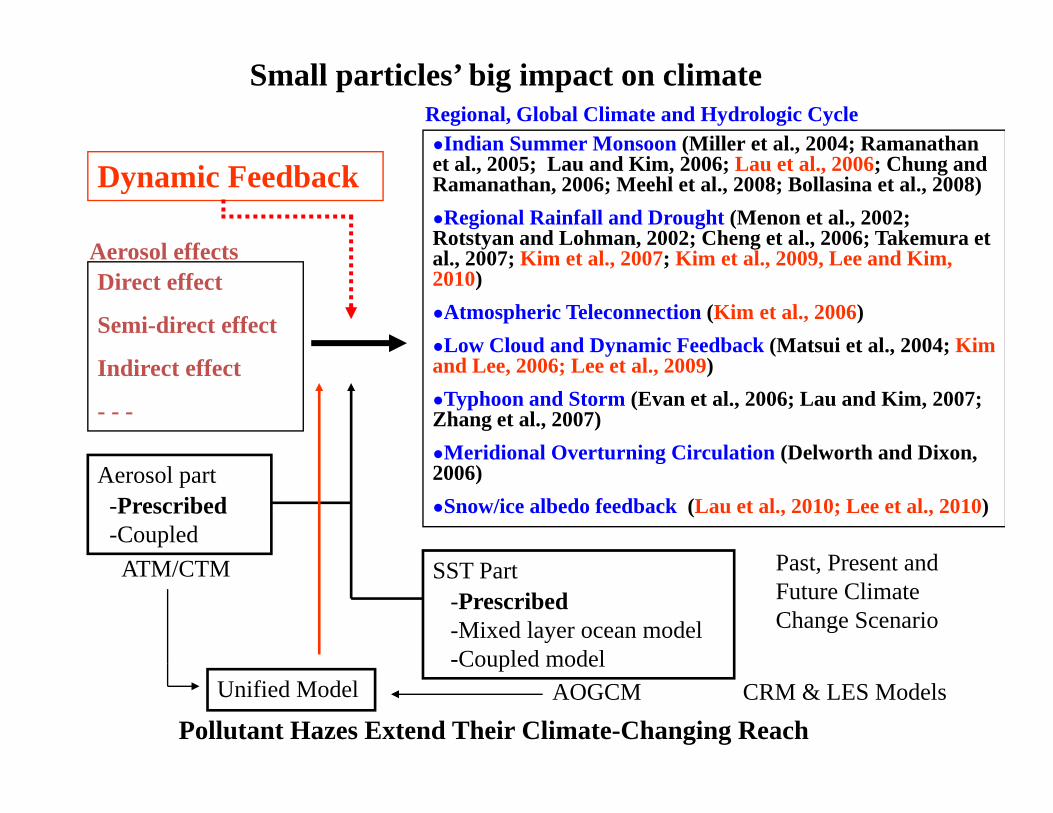
Regional, Global Climate and Hydrologic Cycle●Indian Summer Monsoon (Miller et al., 2004; Ramanathan
Small particles’ big impact on climate
Aerosol effects
Indian Summer Monsoon (Miller et al., 2004; Ramanathanet al., 2005; Lau and Kim, 2006; Lau et al., 2006; Chung and Ramanathan, 2006; Meehl et al., 2008; Bollasina et al., 2008)●Regional Rainfall and Drought (Menon et al., 2002; Rotstyan and Lohman, 2002; Cheng et al., 2006; Takemura et
l 2007 Ki t l 2007 Ki t l 2009 L d Ki
Dynamic Feedback
Aerosol effects al., 2007; Kim et al., 2007; Kim et al., 2009, Lee and Kim, 2010)●Atmospheric Teleconnection (Kim et al., 2006)●Low Cloud and Dynamic Feedback (Matsui et al., 2004; Kim
Direct effect
Semi-direct effecty ( , ;
and Lee, 2006; Lee et al., 2009)●Typhoon and Storm (Evan et al., 2006; Lau and Kim, 2007; Zhang et al., 2007)●Meridional Overturning Circulation (Delworth and Dixon,
Indirect effect
- - -
●Meridional Overturning Circulation (Delworth and Dixon, 2006)●Snow/ice albedo feedback (Lau et al., 2010; Lee et al., 2010)
Aerosol part-Prescribed-Coupled
A /C Past Present andSST Part-Prescribed-Mixed layer ocean model-Coupled model
ATM/CTM Past, Present and Future Climate Change Scenario
Coupled model
Pollutant Hazes Extend Their Climate-Changing ReachAOGCMUnified Model CRM & LES Models

The Elevated Heat Pump (EHP) hypothesis (Lau et al. 2006, Lau and Kim 2006)
WarmNormal monsoonWater cycle (mid‐May to id J )
Wwarm
mid‐June)
θe
WarmerEHP‐accelerated
lWarmerWarm
W
Monsoon water cycle(mid‐May –June)
Coolθe
EHP postulates:EHP postulates: a) warming and moistening of the upper troposphere over the Tibetan Plateaub) an advance of the rainy season in northern India/Napal region in May‐Junec) In June‐July, the increased convection spreads from the foothills of the Himalayas to central I di lti i i t ifi ti f th I diIndia, resulting in an intensification of the Indian monsoon. d) Subsequent reduction of monsoon rain in central India in Auguste) Enhanced snowmelt and rapid retreat of mountain glacier
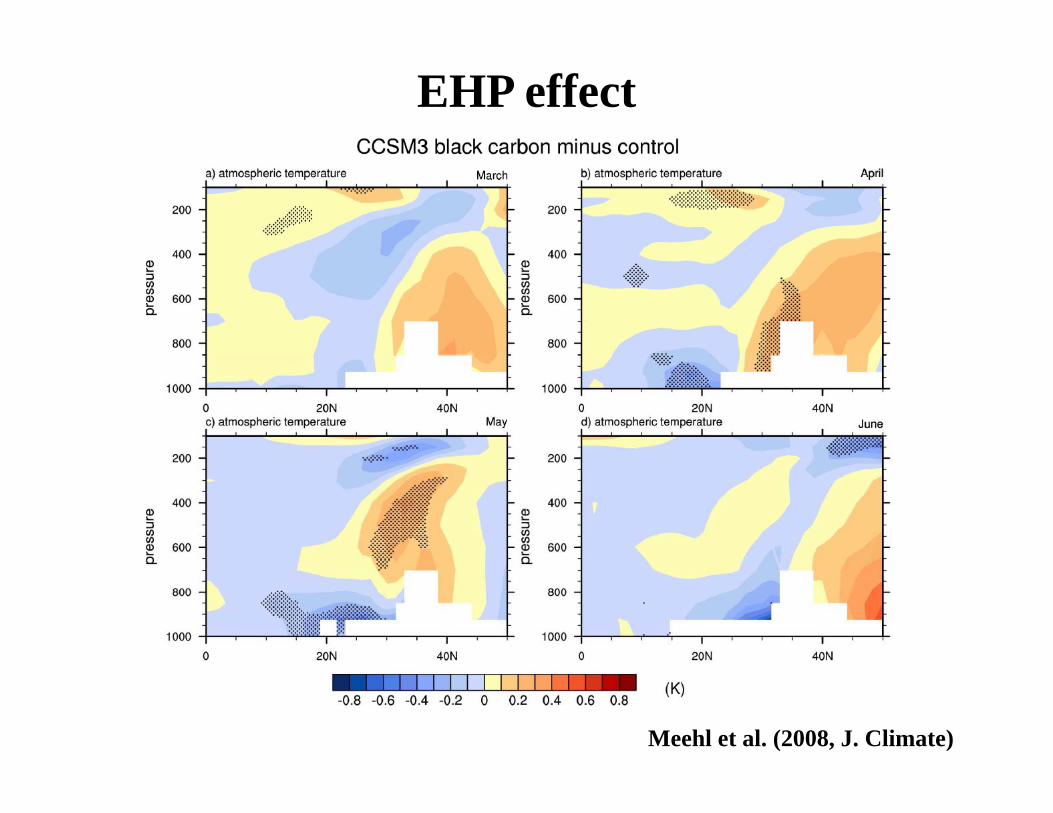
EHP effect
Meehl et al. (2008, J. Climate)

Gautam et al. (2009)
The purpose of this study is to investigate the impact of atmospheric heating (EHP effect) by dust and black carbon g ( ) yin possibly leading to enhanced pre-summer monsoon surface warming and early snow melt in the Himalayas and TP region.

Model ExperimentsNASA fvGCM• Dynamic core (Lin and Rood, 1996; Lin and Rood, 1997 ; Lin, 1997)
• Physics
Microphysics of clouds with the relaxed Arakawa-Schubert scheme (McRAS)
(Sud and Walker 1999a; 1999b)(Sud and Walker, 1999a; 1999b)
Radiative transfer model (Chou and Suarez,1999; Chou et al., 2001)
Land surface (Bonan, 1996) and PBL processes (Holtsage and Boville, 1992) vs. CLM2
• Resolution 2*2.5 degree (horizontal) and 55 layers (vertical)
• Ocean: coupled Slab Ocean Model

SulfateTotal
A th i
BC+OC
Anthropogenic
Dust
NaturalNatural
GOCART model uses the assimilated meteorological fields of the GEOS DAS

Comparison between models and observations
Model
Observation
MODIS AIRS
Observation
Spatial distribution of aerosol optical Depth (AOD) by (a) GOCART and (b) MODIS observation (2000 to 2009), (c) air temperature in NA run and (d) for observation (AIRS, 2003 to 2009) for May.

Table 1 May mean aerosol optical depth (AOD) and the percentageTable 1 May mean aerosol optical depth (AOD) and the percentage contributions from each of five aerosol species used in this study averaged over Indo-Gangetic Plain (IGP), Tibetan Plateau (TP), and the Central China.
IGP[25~30°N, 75~85°E]
Tibetan Plateau[30~35°N, 80~95°E]
Central China[25~35°N, 105~120°E]
GOCART 0.41 0.14 0.73
MODIS 0.65 - 0.61
Black Carbon 11.6% 10.4% 8.0%
Dust 45.2% 44.4% 16.8%
Sulfate 16.7% 22.2% 62.0%
Organic Carbon 24.1% 19.4% 12.3%
Sea salt 2.5% 2.1% 1.0%

Surface skin temperature anomaly ( AA – NA)
AOD Temperature
Simulated difference of surface skin temperature( ) (AA minus NA runs) for May. Grid points with statistical confidence level exceeding 5% and 1% are indicated by small and large close circles.
The warming regions are not anywhere near the centers of high AOD, and have much larger spatial scale than the aerosol direct forcing. The warming cannot be attributed to direct aerosol radiative forcing alone, but rather arises from atmospheric feedback processes, associated with the EHP mechanism.

Difference (AA NA) averaged between 70 and 100E for May
Warming over the TP and EHP effect Difference (AA-NA) averaged between 70 and 100E for May.
The elevated dust and black carbon absorbs solar radiation and heats the atmospherearound the slopes of the TP (a) ,enhancing the
Temperature & SW heating
p ( ) , gmotion up and along the TP slopes.
As the late spring and early summer (April through mid-June) approaches, the increased low-level southwesterly brings in additional moisture from the Arabian Sea and the Indian Ocean to northern India and the Himalayan
Specific humidity & SW heating
foothills (b).
The enhanced moisture increases convective instability and deep convection and cloudiness over northern India
The condensation heating from deep convection lifi th l i th TP
Latitude–height cross-section of the simulated difference (AA–NA) of the short-wave radiative forcing (contour ◦C/day) amplifies the seasonal warming over the TP,
resulting in a widespread upper troposphericwarming anomaly over the TP.
(AA–NA) of the short-wave radiative forcing (contour, ◦C/day) and (a) temperature (◦C) and (b) specific humidity (g kg−1) averaged between 70 and 100◦ E for May.

Associated with the aerosol-induced pre-monsoon surface warming over TP are significant changes in the large-scale environment.(AA minus NA)
2m temperature (K) Precipitation (mm/day)
Specific humidity (700 to 300 hPa:g/kg) Total cloud cover (%)
Simulated differences defined as the monthly mean difference between AA and NA runs for May. Gray line outlines the boundary of Tibetan Plateau. Grid points with statistical confidence level exceeding 5% and 1% are indicated by small and large close circles.

EHP-induced accelerated snow melt occurs in May over the TP
WTP ETP
Snow cover change (AA –NA)Table 2 Area mean snow depth anomalies, defined as monthly mean difference between AA and NA runs, in May over the Tibetan Plateau (TP), the western TP, and the eastern TP. Climatological mean values of snow depth from the control experiment are shown in parentheses. The western and eastern TP are defined with respect to 90E longitude line Units are cm Numbers in bold mean that significant WTP
Tibetan Plateau W. Tibetan Plateau E. Tibetan Plateau
respect to 90E longitude line. Units are cm. Numbers in bold mean that significant level higher than 5%
The surface warming (>1◦C) over the WTP and the Himalayas is directly linked
April -0.81 (33.82) -1.27 (62.12)# -0.05 (0.81)
May -2.24* (13.22) -3.63* (24.47) -0.01 (0.09) WTP and the Himalayas is directly linked to the accelerated snow melt over that region.June -0.73* ( 2.03) -1.18* ( 3.76) -0.00 (0.01)
* 1% significance
EHP-induced accelerated snow melt occurs in May over the TP, with almost all contribution from the western Tibetan Plateau (WTP), and a relatively very small amount from the eastern Tibetan Plateau (ETP).
The decrease in effective surface albedo is due to both reduction in snow depth and snow aging, as well as the exposure of the underlying darker soil when snow is melted.

The decrease in effective surface albedo
Phase I : The anomalous melting of snow cover starts slowly in early April, and grows steadily through the beginning of Mayy
Phase IIA : From around 3 May, the snow melt accelerates, reaching a maximum in mid-melt accelerates, reaching a maximum in midMay
Phase IIB : The snow melt slows down, and the snow cover reaches a minimum, from 18May to 11 June.
a) Surface albedo in NA run, and b) relative percentage change of surface albedoin AA run as compared to NA run over the western Tibetan Plateau (WTP, solid line). Dotted and dashed lines are albedo changes from the region where the climatological snow depths are larger than equal to 10 cm (dotted line) or 30cm (dashed line), respectively.
Phase III : the aerosol effect diminishes, and snow cover recovers in response to enhanced cold precipitation over the TP.

Surface air temperature ( )
AA minus NA
Surface skin temperature ( )
Specific humidity (700 to 300hPa) (g/Kg)
Precipitation (mm/day)
Total cloud fraction (%)
The rapid snow melt during Phase IIA occurs as the monsoon season approaches, and more moisture is available to fuel the EHP effect as can be seen by the rapid rise inmore moisture is available to fuel the EHP effect, as can be seen by the rapid rise in atmosperic and land surface temperature and available moisture

Net shortwave flux AA minus NA
Net longwave flux
Net radiative flux
Latent heat flux
Sensible heat flux
ate t eat u
Net surface flux
During the Phase III, SH from atmosphere to land continues to maintain the surface warming process, which is damped by evaporative cooling, and net radiative cooling
⇒ Net heat gain by the land surface⇒ The net heat gained is used for melting more snow over the TP and the Himalayas.

ConclusionsIn this study, we investigated the impacts of absorbing aerosols on snow/ice melting over the TP and Himalayas based on EHP effects.
To s mmari eTo summarize,1. As a response to radiative forcing by dust and black carbon in the Indo-
Gangetic Plain and Himalaya foothills, the atmosphere over the TP is anomalously heated and moistened via the EHP effectanomalously heated, and moistened via the EHP effect.
2. The warm and moist atmosphere overlying the TP land surface causes a reduction in surface sensible and latent heat fluxes from land to atmosphere.p⇒ Net heat gain by the land surface
3. The net heat gained is used for melting more snow over the TP and the Himalayas.
Therefore,Th l h h i d d b l h i f l iThe anomalous atmosphere heat energy induced by solar heating of aerosol is
transfer from atmosphere to land to enhance the seasonal warming of the land surface and the melting of snow in the region.
`
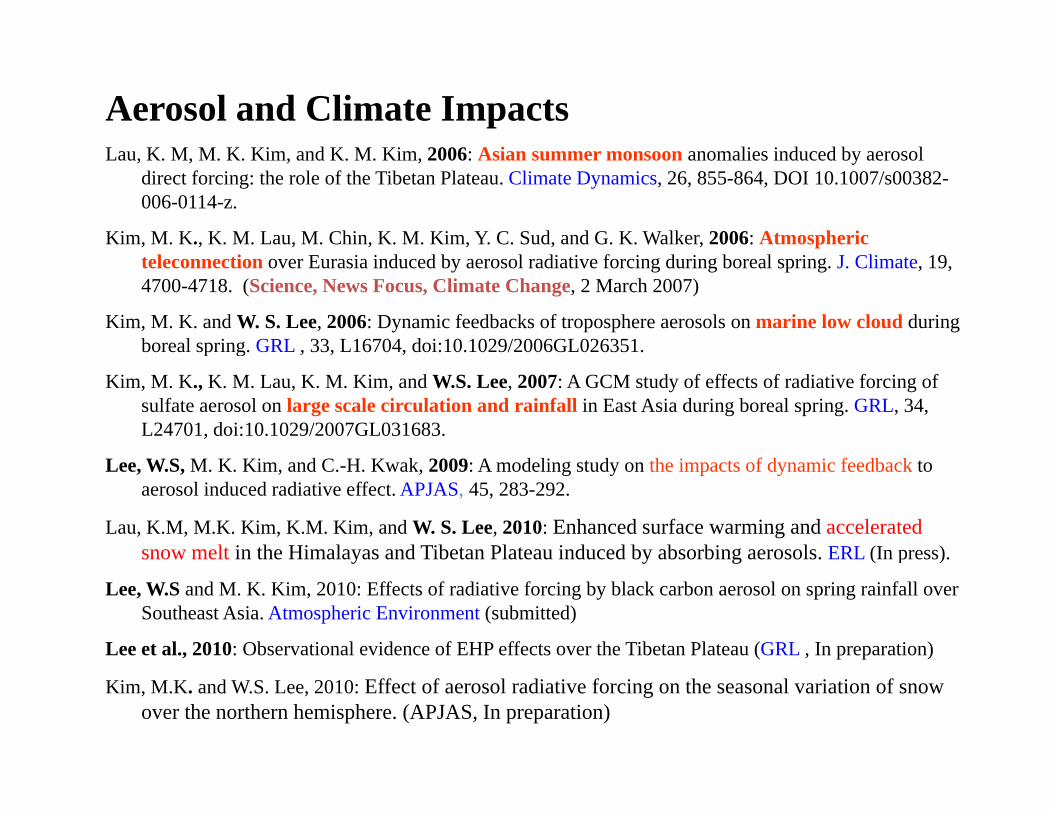
Aerosol and Climate ImpactsL K M M K Ki d K M Ki 2006 A i li i d d b lLau, K. M, M. K. Kim, and K. M. Kim, 2006: Asian summer monsoon anomalies induced by aerosol
direct forcing: the role of the Tibetan Plateau. Climate Dynamics, 26, 855-864, DOI 10.1007/s00382-006-0114-z.
Kim, M. K., K. M. Lau, M. Chin, K. M. Kim, Y. C. Sud, and G. K. Walker, 2006: Atmospheric teleconnection over Eurasia induced by aerosol radiative forcing during boreal spring. J. Climate, 19, 4700-4718. (Science, News Focus, Climate Change, 2 March 2007)
Kim, M. K. and W. S. Lee, 2006: Dynamic feedbacks of troposphere aerosols on marine low cloud during boreal spring. GRL , 33, L16704, doi:10.1029/2006GL026351.p g
Kim, M. K., K. M. Lau, K. M. Kim, and W.S. Lee, 2007: A GCM study of effects of radiative forcing of sulfate aerosol on large scale circulation and rainfall in East Asia during boreal spring. GRL, 34, L24701, doi:10.1029/2007GL031683.
i d k d li d h i f d i f db kLee, W.S, M. K. Kim, and C.-H. Kwak, 2009: A modeling study on the impacts of dynamic feedback to aerosol induced radiative effect. APJAS, 45, 283-292.
Lau, K.M, M.K. Kim, K.M. Kim, and W. S. Lee, 2010: Enhanced surface warming and accelerated snow melt in the Himalayas and Tibetan Plateau induced by absorbing aerosols. ERL (In press).y y g ( p )
Lee, W.S and M. K. Kim, 2010: Effects of radiative forcing by black carbon aerosol on spring rainfall over Southeast Asia. Atmospheric Environment (submitted)
Lee et al., 2010: Observational evidence of EHP effects over the Tibetan Plateau (GRL , In preparation)
Kim, M.K. and W.S. Lee, 2010: Effect of aerosol radiative forcing on the seasonal variation of snowover the northern hemisphere. (APJAS, In preparation)

April-May mean aerosol optical depth(AOD) from 2000 to 2009
The dusts in IGP are coated with black carbon produced from local emissions and become alocal emissions and become a strong absorber of solar radiation and an efficient source of atmosphere heating( Lau and p gKim, 2006).
[70~90E, 20~30N]Area mean monthly AOD anomaly over IGP
• High AOD : 2004
L AOD 2005
April to May
• Low AOD : 2005

Snow Water Equivalent(mm) change (2004 minus 2005)
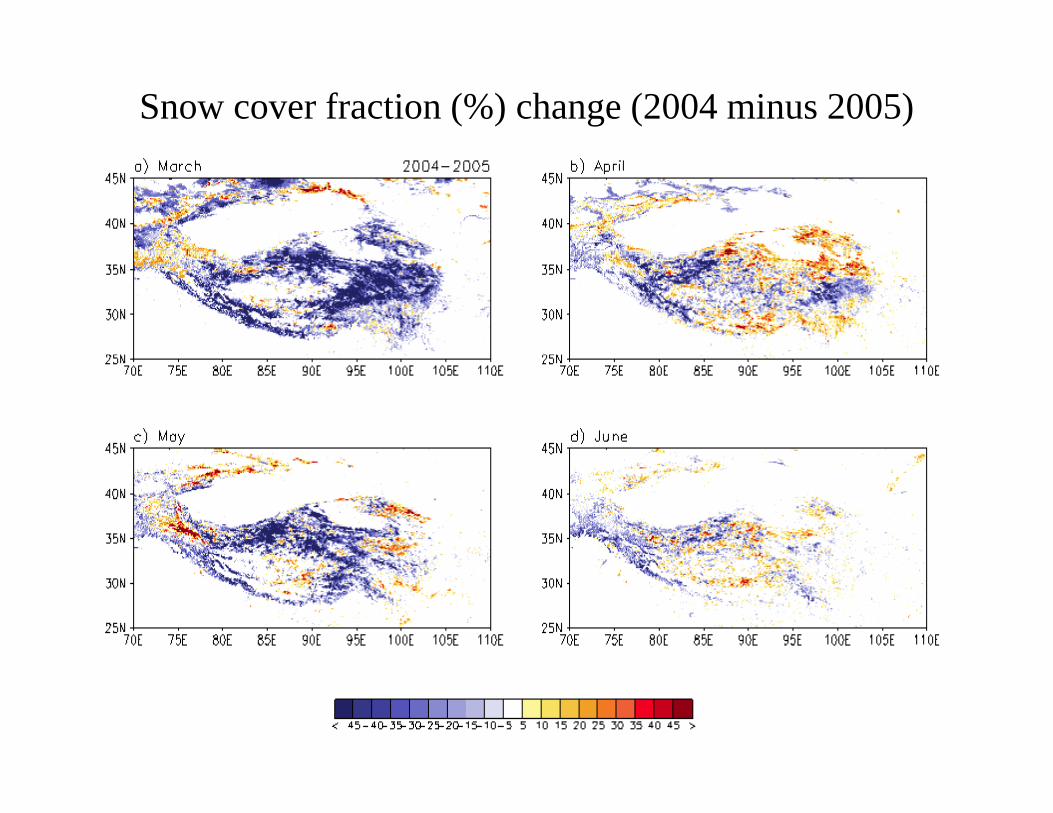
Snow cover fraction (%) change (2004 minus 2005)

Snow Cover Fraction change (2004 minus 2005) in different longitude sector during pre-monsoon season

Temperature (April-May) : 2004 - 2005

Temperature, Precipitation and Relative Humidity change in May( 2004 minus 2005)

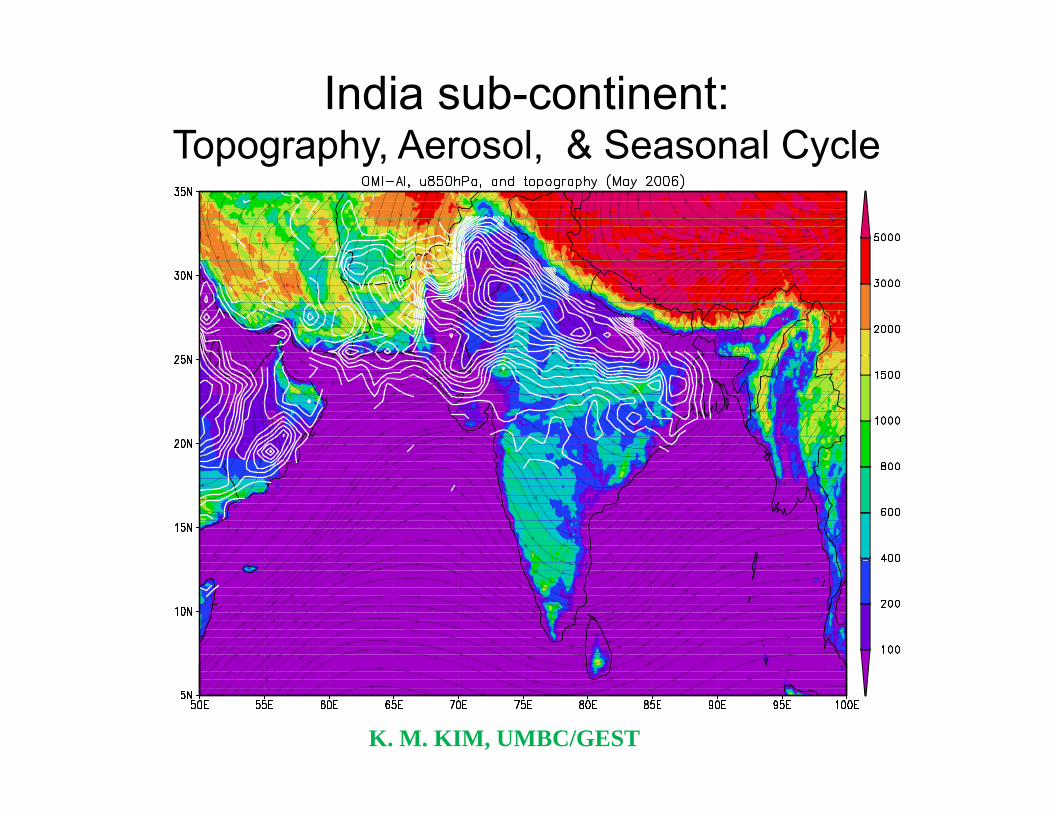
India sub-continent:Topography Aerosol & Seasonal CycleTopography, Aerosol, & Seasonal Cycle
K. M. KIM, UMBC/GEST