the relationships between food security status, dietary patterns
TRANSCRIPT

THE RELATIONSHIPS BETWEEN FOOD SECURITY STATUS, DIETARY
PATTERNS AND OVERWEIGHT IN APPALACHIAN ADOLESCENTS
A Senior Honors Thesis
Presented in Partial Fulfillment of the Requirements
for Graduation with Distinction in Nutrition
in the College of Human Ecology
at the Ohio State University
By:
Carolyn Wait
The Ohio State University
May 2008
Project Advisors:
Christopher Taylor, Assistant Professor, School of Allied Medical Professions, Division
of Medical Dietetics
Anne Smith, Associate Professor, College of Education and Human Ecology, Department
of Human Nutrition

1
Table of Contents Page
Acknowledgements ..............................................................................................................2
Abstract ................................................................................................................................3
Introduction .........................................................................................................................4
Methods................................................................................................................................7
Background and IRB Approval ................................................................................7
Recruitment .............................................................................................................7
Procedures for Administration ................................................................................9
The Survey and Interviews ....................................................................................10
Data Collection and Management ........................................................................11
Data Analysis ........................................................................................................12
Results ................................................................................................................................14
Survey Data ............................................................................................................14
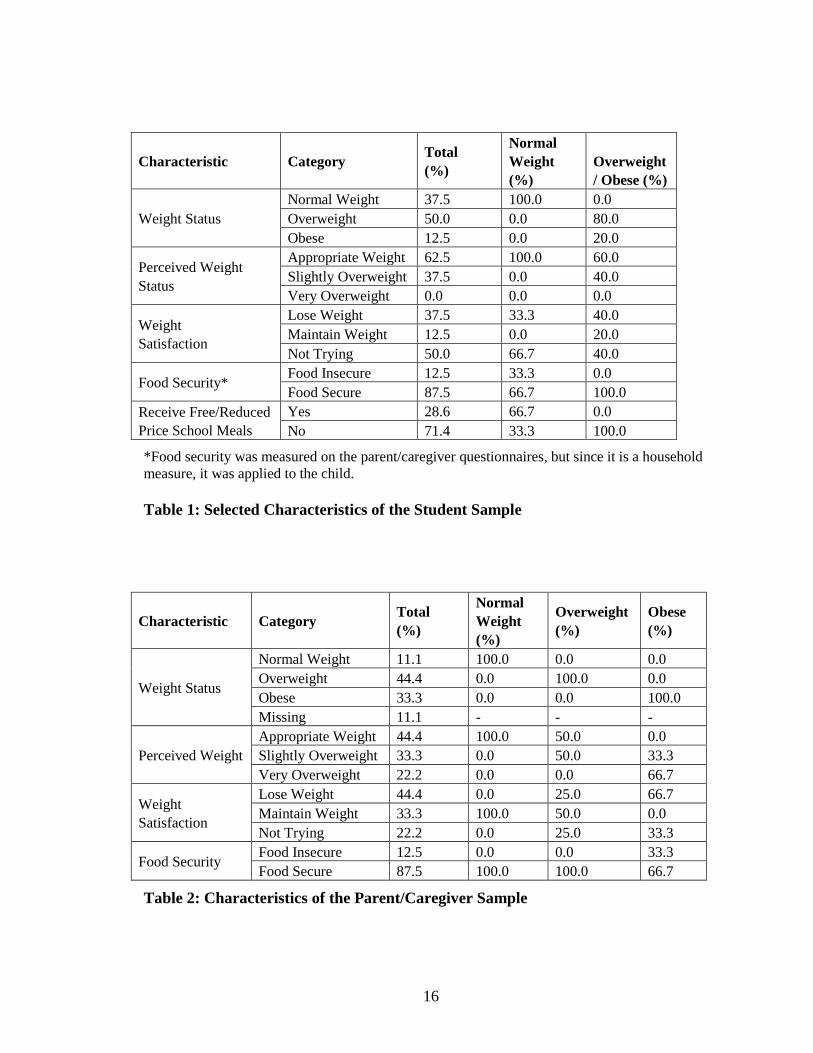
Table 1: Selected Characteristics of the Student Sample .......................................16
Table 2: Selected Characteristics of the Parent/Caregiver Sample ........................16
Table 3: Selected Student Behaviors Relating to Diet and Lifestyle .....................17
Table 4: Selected Parent/Caregiver Behaviors Relating to Diet and Lifestyle .....18
Focus Group Data ................................................................................................18
Discussion .........................................................................................................................19
Limitations .........................................................................................................................23
Conclusion ........................................................................................................................25
References .........................................................................................................................27
Appendix A: Cover Letter/Contact Form and Study Information Summary ....................30
Appendix B: Study Information for Selected Participants ................................................33
Appendix C: Informed Consent/Assent Materials
for Parents/Caregivers and Students .....................................................................35
Appendix D: Questionnaires for Parents/Caregivers and Students ...................................48
Appendix E: Focus Group Discussion Guide Questions ...................................................58

2
Acknowledgements
To Dr. Taylor, for all of your advice and support throughout this long process.
To Jonathan Scott, Erin Korp and especially Natalie Eader for all of your help in
recruitment, data collection and data entry.
To the OSU Area Health Education Center (AHEC) for funding this project through their
grants program.
3
Abstract
Rates of childhood overweight and obesity continue to be high, particularly
among rural Appalachian children and adolescents. Specific information about current
eating behaviors and their relationship to possible economic barriers is necessary to
develop interventions and educational programs that will effectively reduce rates of
overweight and improve the health of Appalachian children and adolescents. This study
aims to elucidate the interrelationships between food security, dietary patterns and
overweight among Appalachian adolescents. Students in the ninth grade at participating
southeastern Ohio high schools were recruited for this study. Students and their parents or
primary caregivers completed surveys and participated in focus groups. All surveys asked
for demographic information as well as weight and height, which were used to calculate
weight status. Student surveys included the Early Childhood Longitudinal Study Food
Frequency Questionnaire and the physical activity questions from the 2003-2004
National Health and Nutrition Examination Study. Parent surveys included the U.S.
Household Food Security Survey Module Short Form, used to assess food security status,
in addition to questions on income and educational attainment. Separate focus groups for
students and parents were conducted to probe participants for their perceptions of healthy
weight, healthy diet and barriers to health. Data was collected from eight student-
caregiver pairs at three Appalachian Ohio high schools. Overweight and obesity were
found to be widespread among both adolescents and adults, although food insecurity was
not prevalent in this sample. Overweight in adolescents does not appear to be linked to
household food insecurity. Fast food, snack and sugar-sweetened beverage consumption
were high among adolescents, while fruit and vegetable consumption was low. In focus
groups, lack of time, desire and ability to prepare healthy meals along with the greater
availability of unhealthy foods were cited as barriers to consuming a more nutritious diet.
Further research is needed to elaborate on these relationships and determine the most
promising areas for intervention.

4
Introduction
Overweight and obesity are important problems in the United States today,
especially among children. Data from the National Health and Nutrition Examination
Survey (NHANES) indicate that rates of obesity1 increased by 285% among twelve to
nineteen year olds between 1971-1974 and 2003-2004, and by an astounding 482%
among six to eleven year olds over the same period (2-3). According to the 2003-2004
data, 17.4% of children aged twelve to nineteen are obese, and another 16.9% are
overweight. Among children aged six to eleven, 18.8% are obese, and another 18.4% are
overweight (3). Other research has shown that rates of childhood overweight and obesity
are even higher in rural communities, and specifically rural Appalachian communities (4-
9). In Ohio, for example, a recent statewide study of third graders found that while the
overall rate of overweight and obesity was 37.6%, the rates tended to be much higher in
rural counties as compared to urban or suburban counties. In nearly all Appalachian
counties, the rate exceeded the state average, and in several it approached or exceeded
50% (10).
High rates of childhood overweight and obesity are particularly concerning
because of the problems associated with excess weight in childhood, including an
increased risk of chronic diseases like diabetes, high cholesterol, and obesity in adulthood
(11-12). These conditions have severe economic consequences in terms of health care
costs and missed days of school or work (13-14). Childhood obesity also carries a social
stigma, causing worry about the impact on psychological well-being (15).
1 In accordance with 2005 American Medical Association guidelines, childhood obesity is defined as BMI-
for age ≥95th
percentile, and childhood overweight is defined as BMI-for-age ≥85th
percentile but <95th
percentile. Previously, obesity was termed ―overweight,‖ and ―overweight‖ was called ―risk of overweight‖
(1).

5
To combat these rising rates, it is important to understand the causes behind
childhood obesity. For example, the Youth Risk Behavior Survey shows that nationally,
fewer than 65% of adolescents were physically active for more than twenty minutes on
three or more days of the week (16). There is also the obvious possibility of poor dietary
quality; indeed, poor dietary patterns have been noted among Appalachian children and
adolescents (6,17). However, it is also necessary to look deeper for possible explanations
for poor food choices, such as cultural preferences or environmental barriers. The issues
surrounding food security shows particular promise in explaining high rates of obesity.
Food security is defined as having access, at all times, to enough food for an
active, healthy life without resorting to using emergency food supplies, begging, stealing,
or scavenging for food. Food insecurity means that the availability of food is limited, the
individual or family has limited access to food, or the individual or family has a limited
or uncertain ability to acquire food in socially acceptable ways (18). Food insecurity in
adults has been associated with less-healthy diets (19) and lower intakes of essential
nutrients (20-23), fruits and vegetables (21-22), and milk and milk-based products (21).
This is likely due to the higher cost of these items. Food insecurity has been linked with
overweight and obesity in adults, particularly women (24-30). Food insecurity, and more
generally, poverty, has also been associated with overweight and obesity in children and
adolescents (31-32). However, research in this area is conflicting (33-35).
In 2005, 11% of households were classified as food insecure, with twelve of
households in non-metropolitan areas suffering from food insecurity (36). However, the
prevalence has been found to be even higher in rural Appalachian communities, with
27.2% of households qualifying as food insecure, with or without hunger, which has been

6
associated with lower health status (37-38). More importantly, people in the Appalachian
community tend to adopt more extreme food-stretching strategies than other food-
insecure populations, such as buying less nutritious foods and serving children
unbalanced meals (39). Even food secure households adopt some of these strategies to a
lesser extent.
The aim of this study is to more fully elucidate the relationship between
overweight and food insecurity in Appalachian school children. More specifically, the
study examined specific dietary and behavioral patterns that are associated with both food
insecurity and overweight. Combined with the qualitative investigation of perceptions of
a healthy diet and a healthy weight being conducted simultaneously, there should be a
wealth of data concerning overweight and obesity in the study population. Despite the
availability of research on dietary patterns in food-insecure populations, it is important to
explore the specific implications of food insecurity among children in Appalachia due to
possible cultural and environmental differences. This is especially crucial since research
suggests that Appalachian children are not as insulated from food insecurity as they are in
the general population (39). The study also aims to determine the impact of participation
in food assistance programs and school lunch programs on food intake and overweight.
Put together, the information gathered as part of this study attempts to characterize the
barriers to consuming a healthy diet and thus achieving a healthy weight, whether those
barriers are economic, cultural and/or environmental. This knowledge will be invaluable
to the government, schools and other groups in creating and revising nutrition education
and food assistance programs to benefit the Appalachian community. A more solid

7
understanding of the causes of obesity in this unique population will allow for better
tailored, culturally sensitive, and therefore more effective, programs.
Methods
Background and IRB Approval
This study occurred in conjunction with a study being conducted by The Ohio
State University School of Allied Medicine. Dr. Chris Taylor was the principal
investigator. The larger study explored perceptions of a healthy weight and healthy diet
amongst Appalachian schoolchildren and their parents or primary caregivers. The
protocol included both a survey and focus group sessions with the study participants. The
study was conducted in West Virginia prior to being carried out in Appalachian Ohio.
This research was part of the study in Appalachian Ohio only. The study in West Virginia
was approved by the Ohio State University Institutional Review Board (IRB), and the
updated project plan for this combined study was approved in January 2008. All research
project team members completed Collaborative IRB Training Initiative (CITI) training,
and everyone was registered as an investigator on the study.
Recruitment
The study participants, Appalachian adolescents and their parents/caregivers,
were recruited through the school system. Schools in Southeast Ohio were contacted and
given details about the study. Once a school agreed to participate, adolescents were
recruited from the ninth grade student body. A member of the project team visited each
participating school to introduce the study. The students were given written information
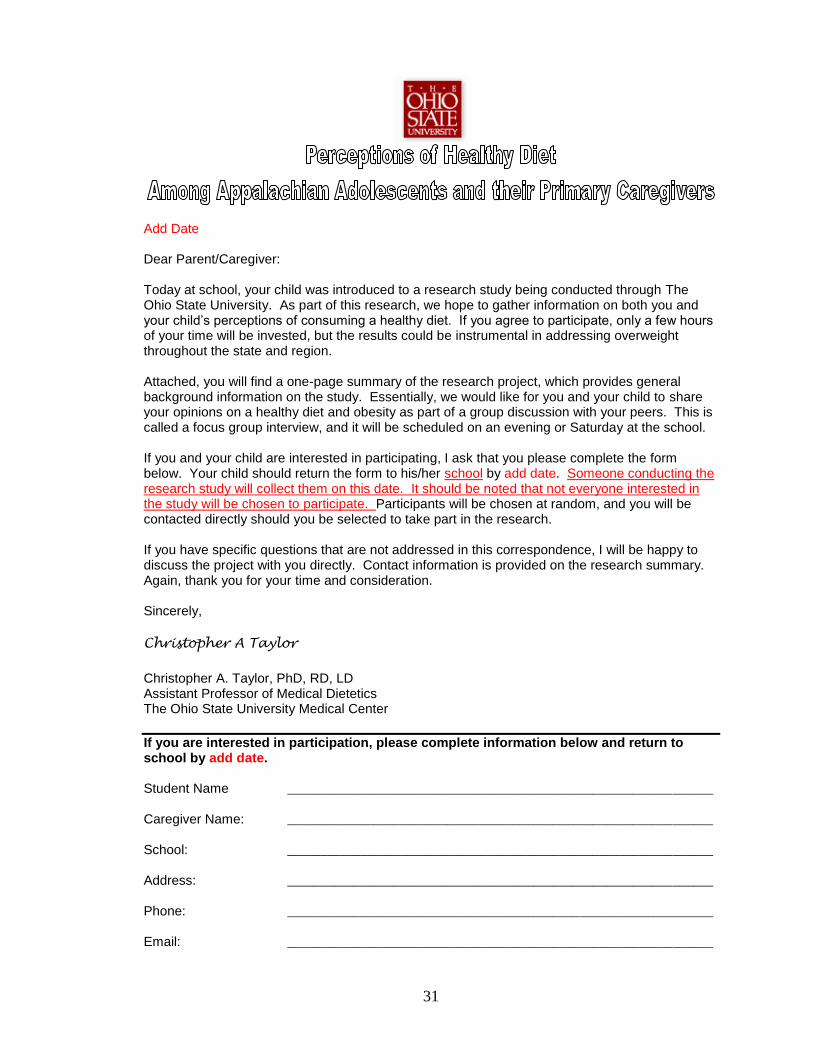
for themselves and their parent/primary caregiver to review. The cover letter introduced
the study and also served as a contact form that those interested in participating could

8
return to the school by a given deadline, which in turn was returned to a project team
member. The written materials also included a summary of the study with contact
information for the parent/caregiver to keep. The cover letter/contact form and study
information summary can be found in Appendix A. Both the student and the
parent/caregiver had to sign the form to indicate their interest; however, those signatures
did not constitute informed consent/assent. Only if both indicated interest was the
student-parent pair considered for inclusion in the study.
The expectation was that many people would return the contact information form,
and of those interested student-caregiver pairs, twelve from each school would be
randomly selected to participate in the study. It was anticipated that only six to ten of
those pairs would actually attend the focus group session and complete the study,
although all who attended would be included. When fewer than twelve student-caregiver
pairs returned the completed contact information form, all those who submitted one were
contacted to participate in the study.
The selected pairs were notified via electronic mail and telephone. Participants
were provided with a detailed description of the project, which can be found in Appendix
B. Contact information was also provided in case any questions arose. By providing the
study information in writing, potential participants had the opportunity to thoughtfully
consider whether they wished to take part in the study. Time was also made available at
each focus group session, before any other study material were distributed, to further
explain the project and answer any remaining questions that participants had.

9
Procedures for Administration
Refreshments were offered at each focus group session to allow for participants to
become acquainted with the research team. To begin the session, Dr. Taylor described the
study and the consent form procedures. Natalie Eader, a graduate research associate
working with Dr. Taylor, was in charge of making sure that each parent/caregiver
completed an informed consent form for him or herself as well as for his or her child, and
that each student completed an informed assent form prior to beginning the study. Copies
of the informed consent/assent materials can be found in Appendix C.
After the informed consent process was completed, one of the focus group
moderators distributed a confidential survey form to both the students and
parents/caregivers. A specific form of the survey was given to the students and another
form to the parents/caregivers. Each student-caregiver pair was given a randomly
assigned code so that their surveys could be linked later. The codes did not identify the
participants. Before participants began filling out the questionnaire, the moderator
provided information on the survey and its intended uses as well as detailed directions for
its completion. For those requiring assistance, the survey could be administered privately,
with a member of the research team reading aloud the questions and recording the
participant’s answers. Once the surveys were completed, the students were taken to a
different room so that separate focus group interviews could take place.
After the focus group interviews were completed, students received $25 in the
form of a prepaid debit card to compensate them for their time. Parents/caregivers
received $50 prepaid debit cards to compensate them for their time as well as travel and
childcare expenses incurred as a result of participation in the study.

10
The Survey and Interviews
The survey was originally intended to gather information on demographics of
interest, including but not limited to age, gender, height and weight, and level of
education and income. Several sections were added to the protocol for the purposes of
this study of food security and dietary patterns. The lengthened survey served as the
primary source of the data for this study.
The students were given a survey that included the Early Childhood Longitudinal
Study Food Frequency Questionnaire and the physical activity questions from the 2003-
2004 NHANES protocol. The student survey also included a question about receiving
food from assistance programs or discounted meals at school. The parents/caregivers
were given a different survey that included the six-item U.S. Household Food Security
Survey Short Module. The complete questionnaires for both students and
parents/caregivers are provided in Appendix D.
The results of the surveys were best understood and interpreted in the context of
the information obtained during the focus group interviews. The focus group entails a
systematic interview of a small group to elicit participants’ perceptions of the topic of
interest, which in this case was the perception of a healthy weight and healthy diets
among Appalachian adolescents and their parents/caregivers. As previously mentioned,
the students were separated from the parents/caregivers, with the interviews occurring
simultaneously in different rooms, to ensure honest and unbiased responses. Similar
questions were addressed in each group. These questions were developed using grounded
theory, which allowed the investigators to establish a priori dominant concepts to receive
information. The focus group discussion guide questions are provided in Appendix E.

11
Data Collection and Management
The focus group sessions were held at each of the participating schools at a
predetermined date and time. The specific date and time for each school was arranged
through key informants at the schools, taking into account special events and regular
after-school activities.
Ms. Eader and another Medical Dietetics graduate student, Jonathan Scott, led the
focus group for students. Dr. Taylor and two undergraduate students, Erin Korp and
myself, took turns leading the parent/caregiver focus group interviews at different
schools. Dr. Taylor has experience in conducting focus groups, and trained these students
to stimulate conversation and probe for more detailed information. The moderators were
certain to encourage all subjects to participate and ensure that particularly talkative
subjects did not dominate the conversation.
Each focus group interview was recorded digitally as well as on a tape recorder.
Notes were also taken during the interview in the event of technological failure.
Participants were made aware of the presence of the audio recording device prior to the
start of the interview. After each focus group session was completed, a debriefing session
with Dr. Taylor and all of the moderators occurred to summarize the finding and clarify
any points of confusion.
The audio recordings were secured after each focus group session and
subsequently transcribed verbatim by Ms. Eader. The tape was used when the digital
recording was unintelligible, and the written notes were utilized to ensure accurate
transcription. The transcribed document from the audio tapes was checked against the
written log to ensure its accuracy.

12
Data Analysis
Data from the surveys was coded and entered into a SPSS 15.0 (SPSS Inc,
Chicago, IL) for data analysis.
The body mass index (BMI) of each adult was calculated using the self-reported
height and weight given on the survey with the formula:
BMI = ( weight in pounds / [height in inches]2
) × 703.
Their weight status was then classified as normal (BMI ≥ 18.5 but < 25), overweight
(BMI ≥ 25 but < 30) or obese (BMI ≥ 30).
The BMI-for-age percentile of each student was determined using Epi Info
(Centers for Disease Control and Prevention, Atlanta, GA) based on the self-reported age,
sex, height and weight given on the survey. Their weight status was then categorized
according to the criteria previously described.
Food security score was determined by totaling the number of affirmative
responses to the six questions in the U.S. Household Food Security Short Module.
Respondents were classified as either food secure (0-2 affirmative responses) or food
insecure (3-6 affirmative responses). For the purposes of this small study, respondents
were not further classified as low food security (3-4 affirmative responses) or very low
food security (5-6 affirmative responses).
Each student’s approximate average daily fruit and vegetable intake was
determined using the responses to the food frequency questionnaire items regarding
consumption of green salad, carrots, other vegetables and fruits (refer to the student
questionnaire in Appendix D). Totals were determined by adding the average number of
servings per day of each item. The average of the range provided in the answer choice

13
divided by seven was used if response options B or C were selected. If options D-G were
selected for any of the questions, those values were simply added to the total.
Snack intake was categorized in a similar manner. Responses to the items on the
survey regarding the purchase of sweet and salty snacks were used to determine overall
average frequency of buying snacks at school. Students were classified as never
purchasing snacks, occasionally purchasing snacks (a few times per week), frequently
purchasing snacks (most or all days of the week), or purchasing snacks multiple times per
day.
Frequencies were generated for all variables to describe the sample and assess
overall weight status, food security, dietary patterns and other lifestyle measures. Cross
tabulations were run on the parent/caregiver data and the student data to compare food
security status and weight status to the other variables and identify possible relationships.
On the student data, cross tabulations were used to evaluate differences in intake and
weight status in student who received free or discounted meals at school. Cross
tabulations were also used to compare the parent/caregiver’s weight status with the
weight status of their children. Due to the small amount of data and therefore difficulty in
achieving statistical significance, more complex statistical analyses were not performed.
The survey data were enriched by the information from the interviews. Focus
groups transcripts were assessed for dominant themes. These data were compared to
questionnaire results to triangulate findings.
Results
Data was gathered at three high schools in three southeastern Ohio counties from
a total of eight student-caregiver pairs. In one of the eight cases, a student had two

14
caregivers present to complete the survey and participate in the focus group session,
yielding a total of nine data points for the parents/caregivers.
Survey Data
The student sample was 75% male (n=6) and 25% female (n=2). The students
were all either 14 or 15 years old, and they all identified themselves as White. The
parent/caregiver sample was 33.3% male (n=3) and 66.7% female (n=6). The
parents/caregivers ranged in age from 30 to 43 years with a mean of 37.8 (±4.8) years. As
with the students, everyone identified themselves as White. All of the parents/caregivers
were employed full-time, and 55.6% (n=5) reported a gross household income of over
$50,000 per year. Only 11.1% (n=1) earned under $15,000 per year. Two-thirds (n=6)
completed at least some college or technical school, while only 11.1% (n=1) had not
completed high school. Only 12.5% (n=1) of households were food insecure. Household
food security status was inversely related to household income level, but there was no
apparent association with the parent/caregiver’s educational attainment or employment
status.
Overweight and obesity were highly prevalent among this sample of Appalachian
adolescents, with 62.5% categorized as overweight or obese. Rates were also high among
their parents/caregivers, with 77.7% classified as overweight or obese. Overweight and
obesity in adolescents did not appear to be related to food security status or the weight
status of their parent/caregiver. More promising relationships were found between
adolescent weight status and parental weight perception as well as participation in family
food selection. Parents/caregivers who perceived their own weight as normal were more

15
likely to have a normal weight child, and adolescents who were involved in family food
choices were more likely to be normal weight.
Few adolescents met recommendations for daily consumption of fruits or
vegetables (25.5%) or milk (37.5%). Some association was seen between low fruit and
vegetable consumption, normal weight status and receiving free or reduced price meals at
school. At the same time, purchasing snacks at school and consuming of sugar-sweetened
beverages was common among adolescents. Half of all adolescents consumed sugar-
sweetened beverages at least once per day, and 75.0% reported purchasing sweet or salty
snacks at least once in the previous week. Interestingly, there were no associations
between these behaviors and weight status, and even students who reported wanting to
lose weight did not necessarily consume less of these foods. Both adolescents and
parents/caregivers frequently dined at restaurants. Three-fourths of adolescents reported
having fast food at least once in the previous week, and one quarter had consumed fast
food on four or more occasions. Similarly,
High rates of vigorous physical activity were a positive attribute of this sample.
All of the students and a third of the adults reported being physically active at least five
days per week.
Complete survey results for students and parents/caregivers can be found in
Tables 1-4.
16
Characteristic Category Total
(%)
Normal
Weight
(%)
Overweight
/ Obese (%)
Weight Status
Normal Weight 37.5 100.0 0.0
Overweight 50.0 0.0 80.0
Obese 12.5 0.0 20.0
Perceived Weight
Status
Appropriate Weight 62.5 100.0 60.0
Slightly Overweight 37.5 0.0 40.0
Very Overweight 0.0 0.0 0.0
Weight
Satisfaction
Lose Weight 37.5 33.3 40.0
Maintain Weight 12.5 0.0 20.0
Not Trying 50.0 66.7 40.0
Food Security* Food Insecure 12.5 33.3 0.0
Food Secure 87.5 66.7 100.0
Receive Free/Reduced
Price School Meals
Yes 28.6 66.7 0.0
No 71.4 33.3 100.0
*Food security was measured on the parent/caregiver questionnaires, but since it is a household
measure, it was applied to the child.
Table 1: Selected Characteristics of the Student Sample
Characteristic Category Total
(%)
Normal
Weight
(%)
Overweight
(%)
Obese
(%)
Weight Status
Normal Weight 11.1 100.0 0.0 0.0
Overweight 44.4 0.0 100.0 0.0
Obese 33.3 0.0 0.0 100.0
Missing 11.1 - - -
Perceived Weight
Appropriate Weight 44.4 100.0 50.0 0.0
Slightly Overweight 33.3 0.0 50.0 33.3
Very Overweight 22.2 0.0 0.0 66.7
Weight
Satisfaction
Lose Weight 44.4 0.0 25.0 66.7
Maintain Weight 33.3 100.0 50.0 0.0
Not Trying 22.2 0.0 25.0 33.3
Food Security Food Insecure 12.5 0.0 0.0 33.3
Food Secure 87.5 100.0 100.0 66.7
Table 2: Characteristics of the Parent/Caregiver Sample

17
Behavior Frequency Total
(%)
Normal
Weight (%)
Overweight/
Obese (%)
Participate in
Family Food
Choices
Most of Time 25.0 33.3 20.0
Some of Time 37.5 66.7 20.0
Not Very Often/Never 37.5 0.0 60.0
Eat at
Restaurant
2-4 Times/Week 25.0 0.0 20.0
Once/week 37.5 33.3 60.0
1-3 Times/Month 37.5 66.7 20.0
Eat Fast Food
4-6 Times/ Week 25.0 0.0 40.0
1-3 Times/Week 50.0 100.0 20.0
Not in Past Week 25.0 0.0 40.0
Buy Snacks at
School
4-6 Times/Week 25.0 33.3 20.0
1-2 Times/ Week 50.0 33.3 60.0
Not in Past Week 25.0 33.3 20.0
Drink Milk
3 Times/Day or More 37.5 33.3 40.0
1-2 Times/Day 37.5 33.3 40.0
1-3 Times/Week 25.0 33.3 20.0
Drink Sugar-
Sweetened
Beverages
3 Times/Day 12.5 33.3 0.0
1-2 Times/Day 37.5 33.3 40.0
1-3 Times/Week 37.5 0.0 60.0
Not in Past Week 12.5 33.3 0.0
Drink 100%
Juice
4 Times/Week or More 25.0 33.3 20.0
1-3 Times/Week 62.5 66.6 60.0
Not in Past Week 12.5 0.0 20.0
Eat Fruits*
3 Times/Day 12.5 0.0 20.0
1-2 Times/Day 25.0 33.3 20.0
4-6 Times/Week 37.5 33.3 40.0
1-3 Times/Week 25.0 33.3 20.0
Eat Vegetables*
5 Times/Day or More 12.5 0.0 20.0
3-5 Times/Day 0.0 0.0 0.0
1-3Times/Day 50.0 66.7 40.0
Less Than 1 Time/Day 37.5 33.3 40.0
Eat Fruits or
Vegetables*
5 Times/Day or More 25.0 0.0 40.0
3-5 Times/Day 25.0 33.3 20.0
1-3 Times/Day 50.0 66.7 40.0
Physically
Active 5 days/Week or more 100.0 100.0 100.0
*Potatoes and 100% fruit juice were not included in these measures. If both items were included,
overall prevalence of 5 times/day or more of fruits or vegetables would be 37.5%, prevalence of
3-5 times/day would remain at 25%, and prevalence of 1-3 times/day would be 37.5%.
Table 3: Selected Student Behaviors Relating to Diet and Lifestyle

18
Behavior Frequency Total
(%)
Normal
Weight
(%)
Overweight
(%)
Obese
(%)
Eat at
Restaurant
5-6 Times/Week 11.1 0.0 0.0 33.3
2-4 Times/Week 11.1 0.0 25.0 0.0
Once/Week 33.3 100.0 50.0 0.0
1-3 Times/Month 44.4 0.0 25.0 66.7
Physically
active
5 Times/Week or More 33.3 0.0 50.0 0.0
2-4 Times/Week 44.4 0.0 50.0 66.7
Once/Week or Less 22.2 100.0 0.0 33.3
Table 4: Parent/Caregiver Behaviors Relating to Diet and Lifestyle
Focus Group Data
In the parent/caregiver focus group interviews, lack of time was the most
frequently cited barrier to consuming a healthier diet. Parents/caregivers felt that they and
other adults they knew had little time or desire to prepare a healthy family meal after
work and after-school activities. Eating out, particularly at fast food restaurants, was the
most commonly mentioned alternative to cooking. Access to healthy foods, especially
fresh produce, was another barrier mentioned frequently in the parent/caregiver
interviews. Grocery stores in the area tend to have a poor and overpriced selection, they
said, while better stores with a wider and more affordable selection are far away. Lack of
time and also the high cost of fuel were seen as barriers to shopping at these stores.
Poverty and reliance on food assistance programs were not primary issues among the
sample population, but respondents acknowledged that it was a problem in the area.
Respondents described the less varied and more processed diets adopted by those with a
smaller food budget, such as consuming more Ramen noodles and macaroni and cheese.

19
Along with this, parents/caregivers felt that the loss of the area’s farming culture was
contributing to poorer diets and higher rates of overweight.
Common themes in both the parent/caregiver and student focus group interviews
include the poor quality of foods offered in work and school cafeterias as well as at
special events. They perceived this as a barrier to a healthier diet because fried foods,
processed foods and sweets are more readily available in these venues. Respondents
thought that there is a poor selection of healthier foods, especially fruits and vegetables,
and that these items are often less appetizing. Parents/caregivers and students also
seemed to agree that lack of physical activity contributes to overweight and that physical
activity must be part of the solution.
The parents/caregivers voiced concern over pressure on their children from peers
and the media to be thin. Students had a similar perspective, saying that teasing and the
desire to fit in made students very aware of being overweight; however, students overall
seemed more concerned with eating what they saw on advertisements, in the store, or
preferred in terms of taste.
Discussion
Contrary to expectations, food security was actually associated more with
overweight and obesity among adolescents than was food insecurity. However, it is
impossible to say based on the quantitative data whether or not food insecurity is
associated with overweight in adults or adolescents due to the small sample size; many
other factors may have come into play in the case of the single food insecure household.
Based on information provided in focus groups about diet quality of the ―poorer people‖

20
in the area, it seems likely that malnutrition and overweight are indeed problems among
the food insecure in Appalachia.
The lack of association between the weight status of the parent/caregiver and the
weight status of the student was also unexpected, especially considering the fairly close
relationship between the reported frequency of dining at restaurants between
parent/caregiver and child. If anything, adolescents appear to eat more frequently at
restaurants, especially fast food restaurants, and yet there is a lower rate of overweight
and obesity among. Of course, frequency of eating at restaurants was the only dietary
behavior assessed in both groups, so it is possible that other dietary patterns are more
predictive of differences in overweight between parents/caregivers and their children.
Physical activity could also help to explain the observed differences; all of the
adolescents reported regular, vigorous physical activity, whereas there was greater
variability among the adults. More research is needed on parental dietary and lifestyle
behaviors in order to determine their relationship to those same behaviors in their
children as well as weight status.
This data suggests that parents/caregivers, regardless of their own weight status,
may positively influence the weight status of their own children by having a positive
perception of their own weight and including them in family food selection and
preparation. It appears that parents continue to have both direct and indirect roles in
teaching their children about nutrition and health, even in adolescence. Unfortunately,
many parents/caregivers mentioned in the focus groups that they do have trouble
accepting their own weight and that they have little time to plan and prepare meals at all,
much less with their children. This may be part of the reason for high rates of overweight

21
and obesity among the adolescents. However, more investigation of adult behaviors and
perspectives on health is necessary to determine the strength of this relationship,
especially in those parents who are overweight or obese. Nonetheless, this is a promising
area that could yield effective interventions, such as educating caregivers on quick and
healthy meals that they can make with their children.
Although little association was seen between dietary patterns typically viewed as
unhealthy, such as sugar-sweetened beverage consumption, it should still be a goal to
change these behaviors. Such habits could lead to overweight as the students get older or
decrease their level of physical activity. Likewise, consuming more fruits and vegetables,
particularly whole fruits and non-starchy vegetables, has greater benefits beyond just
promoting healthy weight.
As would be hoped, receiving free and reduced price meals at school appeared to
be related to normal weight in adolescents. However, this did not appear to reduce the
frequency of purchasing snacks at school or consuming sugar-sweetened beverages, and
it did not increase milk consumption, which indicates that differences in weight status
may not be related to dietary changes brought about by the program. Even more
concerning is the association with lower fruit and vegetable consumption. Specifically,
adolescents who received free or discounted meals at school tended to consume fruit and
―other vegetables‖ fewer times per week than did other adolescents. Information provided
during the focus groups suggests that this may indeed be a causal and not just
coincidental relationship. Salads and carrots were reported to be common options in the
lunch room. Thus, it seems plausible that students who receive meals at school consume
only those vegetables available in the cafeteria since income-eligible students may not

22
have access to a wide variety of fresh produce at home. In contrast, students who do not
receive free or reduced price meals may come from families that can better afford a
broader selection of fruits and vegetables. Likewise, students who do not receive free or
reduced price meals may bring their own fruits and vegetables to school for lunch, which
might result in higher consumption than those who do receive lunches. Students reported
in the focus groups that the vegetables offered at school were unusually unappealing,
which likely leads to students not actually consuming them.
This goes along with another problem cited in the focus groups, which is the poor
quality of school lunches. The school districts do not have enough money to support a
lunch program in which students enjoy participating. One parent/caregiver mentioned
that the school had received a grant last year to serve new kinds of fruits and vegetables,
and students were very receptive to trying them when they were deliberately introduced
and well prepared. This parent/caregiver lamented the loss of the grant since the school
could not afford to keep up such a positive program. Even more importantly, it appears
that resources are not available to get healthy foods to the students who rely on them
most. Schools in Appalachia could benefit from programs that take advantage of the local
farming culture, such as planting a school garden or teaming up with a local farmer to
provide seasonal produce. This might be a more cost effective way to get fresh fruits and
vegetables to students. Furthermore, teaching students where their food comes from may
have a positive effect similar to participating in family meal planning.
Lack of funding also came up in focus groups in relation to athletics and physical
activity. All of the students who participated in this study are involved in school-
sponsored athletics, which is almost certainly why the prevalence of physical activity was

23
so high. At the same time, parents/caregivers mentioned that children and adolescents are
very sedentary; the children want to stay in and play video games, and there are very few
active outdoor activities in which young people can safely engage. Thus, it seems that
school-sponsored athletics are crucial in keeping adolescents active and healthy.
However, at least one school is moving towards a ―pay to play‖ policy in which families
are required to bear the financial burden of a child playing sports. This could lead to
declining participation in school athletics and significantly reduce the number of
adolescents who are regularly physically active.
Limitations
One of the most significant limitations to this study was the small sample size.
This was the result of difficulties recruiting schools and participants as well as scheduling
focus group sessions that accommodated those interested in the study. Some schools were
not very responsive; perhaps an incentive to the school would have made the
administration and faculty more willing to accommodate the research team during the
recruitment process. In terms of the student-parent/caregiver pairs, there were many
possible barriers to participation. The students and adults who attended the focus groups
discussed being busy with work and activities, so it is likely that other families are just as
busy, if not busier, and thus not able to come. After all, in rural areas such as those
studied, it is a long distance for parents to make a special trip in the evening. Similarly,
although both students and adults were compensated, it is possible that potential
participants did not feel that the money adequately compensated them in light of
increasing fuel prices.
24
In addition to being a small sample, it was a potentially biased sample because it
was self-selected. As previously mentioned, the students all participated in school-
sponsored athletics, which is probably not representative of the entire student body.
Along with this, people with healthier habits or more knowledge of health and nutrition
may have been more likely to participate because they were more comfortable with the
topic. This may have biased the study against the poorest and least educated people in the
target population. Also, fewer girls participated in the study, which could be due to girls
being more self-conscious about discussing weight. The promise of single-sex student
focus groups may have enticed more girls to participate, although this would have
significantly increased the burden on the research team to conduct and transcribe
interviews.
Other possible ways to overcome these problems would be to mail the survey to a
random sample of students and their families. Although mailed surveys do not have a
high return rate, this method probably would have provided more survey data than was
obtained in this study. More quantitative data would allow for greater certainty in
drawing conclusions and generalizing findings, and the information obtained could still
be enriched by qualitative data from focus group interviews. Another option would be to
do in-home interviews, which would reduce participant burden and possibly induce more
people to participate. However, the research team would have to overcome much greater
time and financial demands.
Another weak aspect of the study was the reliance on self-reported data. The
classification of weight status is particularly likely to be incorrect since it is based upon
self-reported height and weight, which respondents may deliberately or accidentally

25
misreport. Likewise, dietary and lifestyle data is based upon reported frequencies, and
respondents may not remember such specific information. Conversely, they may
remember but report differently based upon what they perceive as the ―correct‖ or desired
answer. Reporting of food security status is also vulnerable to the social desirability bias,
as parents may not want to admit that they struggle to provide food for their families.
Along with this, the food frequency questionnaire does not provide the most
accurate assessment of typical dietary intake. Although it was validated and used in other
studies, it has definite limitations, and not just reliance on the respondent’s memory. For
example, it asks for the number of ―times‖ that the respondent ate a given food, which
does not correspond to an actual quantity. Each ―time‖ could be multiple servings or less
than one serving, and it is impossible to say in which direction the bias goes. A possible
solution would be to provide pictures of common serving sizes to guide students in their
selections. Also, some of the responses to survey questions are conflicting; students put
different frequencies for eating at restaurants versus eating at fast food restaurants. It may
have been better to specify non-fast food restaurants versus fast food restaurants or
consolidate them into one question.
Conclusion
Overweight and obesity are significant concerns among Appalachian adolescents
and their parents/caregivers. The home, school and community environments all contain
potential barriers to consuming a healthy diet and maintaining a healthy body weight. In
the home environment, parental outlook on weight and diet along with lack of time to
prepare healthy meals appear to be most significant. In the school environment,
inadequate funding for athletics and the lunch program is a significant barrier to instilling

26
healthy habits in adolescents. In the broader community environment, it is difficult to
access healthy and reasonably priced foods. Food insecurity is still a promising construct
that may operate at multiple levels in the problem of overweight and obesity. For
example, community factors like the number of grocery stores may hinder access to
affordable food, which could jeopardize household food security. Or, an unsupportive
school environment may exacerbate food insecurity among its students. However, further
research with a larger sample is needed to more conclusively determine the leading
causes of overweight and obesity in this population. Such research would provide a
stronger basis for specific interventions to target overweight and obesity in Appalachia.

27
References
1. Spear BA, Barlow SE, Ervin C, Ludwig DS, Saelens BE, Schetzina KE, Taveras EM.
Recommendations for Treatment of Child and Adolescent Overweight and Obesity.
Pediatrics. 2007;120:S254-S288.
2. Jolliffe D. Extent of overweight among US children and adolescents from 1971-2000.
Int J Obes. 2004;28(1):4-9.
3. Ogden CL, Carroll MD, Curtin LR, McDowell MA, Tabak CJ, Flegal, KM.
Prevalence of overweight and obesity in the United States, 1999-2004. JAMA. 2006;
295(13):1549-1555.
4. Gauthier BM, Hickner JM, Noel MM. High prevalence of overweight children in
Michigan primary care practices: an UPRNet study: Upper Peninsula Research
Network. J Fam Pract. 2000;49:73–76.
5. Gustafson-Larson AM, Terry RD. Weight-related behaviors and concerns of fourth-
grade children. J Am Diet Assoc. 1992;92:818–822.
6. Crooks DL. Food consumption, activity, and overweight among elementary school
children in an Appalachian Kentucky community. Am J Phys Anthropol.
2000;112:159–170
7. McMurray RG, Harrell JS, Bangdiwala SI, et al. Cardiovascular disease risk factors
and obesity of rural and urban elementary school children. J Rural Health.
1999;15:365–374.
8. Neal WA, Demerath E, Gonzales E, et al. Coronary artery risk detection in
Appalachian communities (CARDIAC): preliminary findings. WV Med J.
2001;97:102–105.
9. Felton GM, Pate RR, Parsons MA, et al. Health risk behaviors of rural sixth graders.
Res Nurs Health. 1998;21:475–485.
10. Ohio Department of Health, Division of Family and Community Health Services,
School and Adolescent Health Section. A report on body mass index of Ohio’s third
graders: 2004-2005. Columbus, OH: Ohio Department of Health; 2006.
11. Edmunds L, Waters E, Elliott EJ. Evidence based management of childhood obesity.
BMJ. 2001; 323: 916-919.
12. Fowler-Brown A, Kahwati LC. Prevention and treatment of overweight in children
and adolescents. Am Fam Physician. 2004;69:2591-2598.

28
13. US Department of Health and Human Services. Prevention makes common "cents."
2003. Available at: http://aspe.hhs.gov/health/prevention/. Accessed October 24,
2006.
14. Brownell KD, Stuckler D, Yach D. Epidemiologic and economic consequences of the
global epidemics of obesity and diabetes. Nat Med. 2006; 12: 62-66.
15. Mullen MK, Shield J. Childhood and Adolescent Overweight: the Health
Professional’s Guide to Identification, Treatment and Prevention. Chicago, IL:
American Dietetic Association; 2004.
16. Adams J. Trends in physical activity and inactivity amongst US 14–18 year olds by
gender, school grade and race, 1993–2003: evidence from the youth risk behavior
survey. BMC Public Health. 2006;6:57.
17. Wu T, Stoots JM, Florence JE, Floyd MR, Snider JB, Ward RD. Eating habits among
adolescents in rural southern Appalachia. J Adol Health. 2007;40:577-580.
18. Core indicators of nutritional state for difficult-to-sample populations. J Nutr.
1990;120:1559–1600.
19. Bhattacharya J, Currie J, Haider S. Poverty, food insecurity, and nutritional outcomes
in children and adults. J Health Econ. 2004; 23: 839–862.
20. Rose D, Oliveira V. Nutrient intakes of individuals from food insufficient households
in the United States. Am J Public Health. 1997; 87: 1956–1961.
21. Dixon LB, Winkleby M, Radimer K. Dietary intakes and serum nutrients differ
between adults from food-insufficient and food-sufficient families: third National
Health and Nutrition Examination Survey, 1988-1994. J Nutr. 2001;131:1232–1246.
22. Kendell A, Olson CM, Frongillo EA Jr. Relationship of hunger and food insecurity to
food availability and consumption. J Am Diet Assoc. 1996;96:1019–1024.
23. Tarasuk VS, Beaton GH. Women's dietary intakes in the context of household food
insecurity. J Nutr. 1999;129:672–679.
24. Frongillo, EA., Jr;Olson, CM.;Raschenbach, BS.; Kendall, A. Nutritional
Consequences of Food Insecurity in a Rural New York County (discussion paper no.
1120-97). Madison, WI: Institute for Research on Poverty, University of Wisconsin-
Madison; 1997.
25. Olson CM. Nutrition and health outcomes associated with food insecurity and hunger.
J Nutr. 1999;129:521S–524S.
26. Adams EJ, Grummer-Strawn L, Chavez G. Food insecurity is associated with
increased risk of obesity in California women. J Nutr. 2003;133:1070–1074.

29
27. Townsend MS, Peerson J, Love B, Achterberg C, Murphy SP. Food insecurity is
positively related to overweight in women. J Nutr. 2001;131:1738–1745.
28. Basiotis PP, Lino M. Food insufficiency and prevalence of overweight among adult
women. Fam Econ Nutr Rev. 2003;15(2):55–57.
29. VanEenwyk J. Self-reported concern about food security associated with obesity —
Washington, 1995-1999. MMWR Morb Mortal Wkly Rep. 2003;52(35):840–842.
30. Crawford PB, Townsend MS, Metz DL, Smith D, Espinosa-Hall G, Donahue S, et al.
How can Californians be overweight and hungry? California Agriculture.
2004;58(1):12–17.
31. Casey PH; Simpson PM; Gossett JM; Bogle ML; Champagne CM; Connell
C; Harsha D; McCabe-Sellers B; Robbins JM; Stuff JE; Weber J. The association of
child and household food insecurity with childhood overweight status. Pediatrics.
2006;118(5):e1406-1413
32. Miech RA, Kumanyika SK, Stettler N, Link BG, Phelan JC, Chang VW. Trends in
the association of poverty with overweight among US adolescents, 1971-2004. J Am
Med Assoc. 2006;295(20):2385-93.
33. Rose D, Bodor JN. Household food insecurity and overweight status in young school
children: results from the Early Childhood Longitudinal Study. Pediatrics.
2006;117(2):464-73.
34. Gulliford MC, Nunes C, Rocke B. Food insecurity, weight control practices and body
mass index in adolescents. Public Health Nutr. 2006;9(5):570-4.
35. Whitaker RC, Orzol SM. Obesity among US urban preschool children: relationships
to race, ethnicity, and socioeconomic status. Arch Pediatr Adolesc Med.
2006;160(6):578-84.
36. United States Department of Agriculture Economic Research Service. Food security
in the United States: condition and trends. Washington, DC; 2006. Available at:
http://www.ers.usda.gov/Briefing/FoodSecurity/trends.htm. Accessed January 28,
2007.
37. Holben DH, Pheley AM. Diabetes risk and obesity in food-insecure households in
rural Appalachian Ohio. Prev Chronic Dis. 2006;3:A82.
38. Pheley AM, Holben DH, Graham AS, Simpson C. Food security and perceptions of
health status: a preliminary study in rural Appalachia. J Rural Health. 2002; 18: 447–
454.
39. Hamler-Podolski LM, Marino DD. Hunger in the Heart of It All: Ohio Community
Childhood Hunger Identification Project: A Study of Childhood Hunger is Athens and
Franklin Counties. Columbus, OH: Ohio Hunger Task Force; 1995.

30
Appendix A
Cover Letter/Contact Form and Study Information Summary
31
Add Date Dear Parent/Caregiver: Today at school, your child was introduced to a research study being conducted through The Ohio State University. As part of this research, we hope to gather information on both you and your child’s perceptions of consuming a healthy diet. If you agree to participate, only a few hours of your time will be invested, but the results could be instrumental in addressing overweight throughout the state and region. Attached, you will find a one-page summary of the research project, which provides general background information on the study. Essentially, we would like for you and your child to share your opinions on a healthy diet and obesity as part of a group discussion with your peers. This is called a focus group interview, and it will be scheduled on an evening or Saturday at the school. If you and your child are interested in participating, I ask that you please complete the form below. Your child should return the form to his/her school by add date. Someone conducting the research study will collect them on this date. It should be noted that not everyone interested in the study will be chosen to participate. Participants will be chosen at random, and you will be contacted directly should you be selected to take part in the research. If you have specific questions that are not addressed in this correspondence, I will be happy to discuss the project with you directly. Contact information is provided on the research summary. Again, thank you for your time and consideration. Sincerely,
Christopher A Taylor
Christopher A. Taylor, PhD, RD, LD Assistant Professor of Medical Dietetics The Ohio State University Medical Center
If you are interested in participation, please complete information below and return to school by add date. Student Name ________________________________________________________________
Caregiver Name: ________________________________________________________________
School: ________________________________________________________________
Address: ________________________________________________________________
Phone: ________________________________________________________________
Email: ________________________________________________________________

32
What is it? It is a research study looking at the perceptions of Appalachian adolescents and their parents toward health, obesity, and consuming a healthy diet.
Who is conducting it?
The study is being conducted in a joint effort by investigators at The Ohio State University with expertise in nutrition, education, research, and public health.
Chris Taylor, a faculty member in the Department of Medical Dietetics at The Ohio State University, is completing the research to better understand the role diet plays in health and obesity.
Funding for the research is being provided by The Area Health Education Centers in The Ohio State University College of Medicine.
Why is it important?
Adolescent obesity has reached epidemic magnitude throughout the country.
In Ohio, overweight among youth is a minimally researched problem of great concern.
Studies have indicated that Ohio adolescents consume a diet inconsistent with national guidelines.
In order for successful nutrition programs to be designed for Ohio adolescents, it is vitally important to learn how a healthy diet is perceived.
Who can participate?
All students enrolled in a ninth grade health class will be given equal opportunity to participate in the study, along with their parent or primary caregiver. While all students are eligible for participation, only 12 student/parent pairs will be selected for participation in the study.
Research participants will be chosen at random from those student/parent pairs expressing interest.
Student/parent pairs selected for participation will contacted directly.
What will be asked of participants?
All participants (students and parents/caregivers) will be asked to take part in a focus group interview process and to complete a questionnaire.
Focus groups will be held for each parent and student group separately but simultaneously during an evening or Saturday event at the school.
The focus group interview and brief survey is expected to last no more than 3 hours.
How will it benefit students, parents, and schools?
Information gained will be utilized to design appropriate nutrition interventions throughout the state and region.
It is anticipated that the results will be helpful for designing programs to combat the adolescent obesity in Ohio. Such programs would provide a physical and economic benefit the entire state, its schools, and its residents.
How can I take part?
If you are interested in learning more about the project and/or taking part in the study, please contact Dr. Taylor, study coordinator, at 614.688.7972 or [email protected].

33
Appendix B
Study Information for Selected Participants

34
Insert Date Insert Name Insert Address Dear Insert Name: Thank you for taking the time recently to review information on our research study and also for expressing an interest in participation. We are excited to inform you that you and your child have been randomly selected to take part in the project. The focus group interviews for your child’s school will be held on insert date, time, and place. We sincerely hope that you will make every effort to attend. Refreshments will be served, and it should only take, at most, a few hours of your time. Additionally, all student participants will receive $20.00 and parents will receive $50.00 as compensation for the generous donation of your time. It should be noted that compensation is not contingent on completion of the focus groups or questionnaires. All who attend will receive the incentive. Enclosed you will find three consent forms. One is consenting to your participation in the study. The others regard permission for your child to participate. The student assent form addresses your child’s willingness to participate in the study. The caregiver consent form must be signed by you providing parental permission for your child to participate, as your child is considered a minor. These consent forms provide detailed information on the study methods, purposes, benefits, and risks. I ask that you review them closely and remember that participation is strictly voluntary. If, after reading, you wish to participate, you will need to bring the signed consent forms with you to the focus group interview. Prior to the interview, an information session will be conducted to answer any of your questions regarding consent and/or the research. You may wish to sign after this meeting. Either way, signed consent forms must be on file prior to focus group participation. Should you have any questions, please feel free to contact me at 614.688.7972 or [email protected]. I look forward to meeting you and working with you in the weeks to come. Sincerely,
Christopher A Taylor
Christopher A. Taylor, PhD, RD, LD Assistant Professor of Medical Dietetics The Ohio State University Medical Center

35
Appendix C
Informed Consent/Assent Materials for Parents/Caregivers and Students

36
CONSENT TO PARTICIPATE IN RESEARCH FOR PARENT/CAREGIVER
This is a consent form for research participation. It contains important information about
the study and what to expect if you decide to participate. Please consider the information
carefully. Feel free to discuss the study with your friends and family and to ask questions
before making your decision whether or not to participate.
Your participation is voluntary. You may refuse to participate in this study. If you decide
to take part in the study, you may leave the study at any time. No matter what decision you
make, there will be no penalty to you or your child. Your decision will not affect current or
future relationships with The Ohio State University.
You will be provided with any new information that develops during the study that may
affect your decision whether or not to continue to participate. If you decide to
participate, you will be asked to sign this form and will receive a copy of the signed form.
You are being asked to consider participating in this study for the reasons explained below.
1. Why is this study being done?
Obesity and healthy eating among rural, Appalachian youth are problems of great
concern, especially in Ohio; however, little research has been conducted in these areas.
To design appropriate nutrition education programs for Appalachian adolescents, it is
important to investigate their perceptions of and attitude toward healthy eating and
obesity. Because parents and caregivers continue to influence food choices through
adolescence, it is equally important that their perceptions be explored.
2. How many people will take part in this study?
The study targets ninth grade students in five Ohio middle/ high schools. All students
participating in a health class in one of these schools will be eligible for inclusion. In
order to participate, the student and one parent or primary caregiver must consent to take
part in the research. Twelve student/parent pairs will be randomly selected from each
school, with a maximum total of 120 total participants (60 students and 60
parents/caregivers).

37
3. What will happen if I take part in this study?
If you decide to take part in the study, you will be asked to come to the school for an
evening or Saturday interview. Students and parents will be interviewed simultaneously
in separate groups. These interviews, known as focus groups, will be conducted by
trained moderators and will last approximately two hours. During this time, you will be
asked to share your opinions about healthy eating.
Additionally, all participants will be asked to complete a brief survey prior to the focus
group. The demographic survey is designed to gather information such as age, gender,
education completed, and other things of that nature. The information will be used to
describe the participant groups, but your responses will remain confidential.
4. How long will I be in the study?
It is anticipated that your participation in the study will be limited to the time designated
for the focus group interview/ demographic survey (approximately 2 ½ hours). However,
it may be necessary to contact you at a later time to follow-up on focus group responses
for clarification purposes. If additional contact is necessary, it will require minimal time
and could be completed by phone. Therefore, total participation time should not exceed
four hours.
5. Can I stop being in the study?
You may leave the study at any time. If you decide to stop participating in the study,
there will be no penalty to you, and you will not lose any benefits to which you are
otherwise entitled. Your decision will not affect your current or future relationship with
The Ohio State University.
6. What risks, side effects or discomforts can I expect from being in the study?
There are no anticipated risks to taking part in the study. You will be placed in a non-
threatening group setting where you will be asked to share your opinions with your peers
and a group moderator. If you are uncomfortable with discussions of health, obesity, or
food behaviors, you will be able to withdrawl from the focus group interview without
penalty.
7. What benefits can I expect from being in the study?
The results obtained from the focus groups will be utilized to design and implement
nutrition education programs targeting rural, Appalachian adolescents. Your input will
be invaluable in making future nutrition education programs in Ohio a success. Student
participants should also be able to benefit directly from these programs, once
implemented, during the remainder of their public school education.
8. What other choices do I have if I do not take part in the study?
You may choose not to participate without penalty or loss of benefits to which you are
otherwise entitled.

38
9. Will my study-related information be kept private?
Every effort will be made to keep your study-related information confidential. However,
there may be circumstances where this information must be released. For example,
personal information regarding your participation in this study may be disclosed if
required by state law. Also, your records may be reviewed by certain groups, such as
The Ohio State University Institutional Review Board.
10. What are the costs of taking part in this study?
Transportation costs are the only ones you will incur by taking part in the study. Each
student/caregiver pair will be expected to provide their own transportation to the school
for the focus group interviews. However, free refreshments will be provided for all in
attendance.
11. Will I be paid for taking part in this study?
You will receive monetary compensation for taking part in the study. All participants
will receive $50.00 for participation in this vital study.
12. What are my rights if I take part in this study?
If you choose to participate in the study, you may discontinue participation at any time
without penalty or loss of benefits. By signing this form, you do not give up any personal
legal rights you may have as a participant in this study.
You will be provided with any new information that develops during the course of the
research that may affect your decision whether or not to continue participation in the
study. You may refuse to participate in this study without penalty or loss of benefits to
which you are otherwise entitled.
Institutional Review Board responsible for human subject research at The Ohio State
University has reviewed this research project and found it to be acceptable, according to
applicable state and federal regulations and University policies designed to protect the
rights and welfare of participants in research.
13. Who can answer my questions about the study?
For questions, concerns, or complaints about the study you may contact Chris Taylor, in
the Department of Medical Dietetics at The Ohio State University. He may be reached
by phone at 614.688.7972 or via email at [email protected].
For questions about your rights as a participant in this study or to discuss other study-
related concerns or complaints with someone who is not part of the research team, you
may contact Ms. Sandra Meadows in the Office of Responsible Research Practices at The
Ohio State University at 1.800.678.6251.
39
14. Signing the consent form
Participant
I have read (or someone has read to me) this document and I am aware that I am being asked
to participate in a research study. I have had the opportunity to ask questions and have had
them answered to my satisfaction. I voluntarily agree to participate in this study.
I am not giving up any legal rights by signing this consent form. I will be given a copy of this
signed document.
________________________________ ________________________________ Printed Name of Subject Signature of Subject
_______________________ AM/PM Date and Time
Investigator/Research Staff
I have explained the research to the participant or his/her representative before requesting the
signature(s) above. There are no blanks in this document. A signed copy of this consent
form has been given to the participant or his/her representative.
________________________________ ________________________________ Printed Name of Person Obtaining Consent Signature of Person Obtaining Consent
_______________________ AM/PM Date and Time
Witness(es) - May be left blank if not required by the IRB
________________________________ ________________________________ Printed Name of Witness Signature of Witness
_______________________ AM/PM Date and Time
________________________________ ________________________________ Printed Name of Witness Signature of Witness
_______________________ AM/PM Date and Time

40
CONSENT FOR CHILD TO PARTICIPATE IN RESEARCH
This is a consent form for research participation. It contains important information about
the study and what to expect if your child decides to participate. Please review the
information carefully. Feel free to discuss the study with your friends and family and to ask
questions before making a decision to participate.
Participation is voluntary. Your child does not have to be in the study. No one will be
upset if he/she does not want to participate. They can say yes now and change their mind
later. His/her decision will not affect current or future relationships with The Ohio State
University.
Your child will be provided with any new information that develops during the study
that may affect your decision whether or not to continue to participate. If your child
decides to participate, you will be asked to sign this form and will receive a copy of the
signed form. Your child is being asked to consider participating in this study for the reasons
explained below.
1. Why is this study being done?
Obesity and healthy eating among rural, Appalachian youth is a problem, especially in
Ohio; however, not much research has been conducted in these areas. In order to develop
nutrition education programs for Appalachian students, it is important to look at their
attitude toward healthy eating and obesity
2. How many people will take part in this study?
The study targets ninth grade students in five Ohio middle/ high schools. All students
participating in a health class in one of these schools can potentially be included. In
order to participate, the student and one parent must consent to take part in the research.
Twelve student/parent pairs will be randomly selected from each school, with a
maximum total of 120 total participants (60 students and 60 parents/caregivers).

41
3. What will happen if I take part in this study?
If your child decides to take part in the study, he/she will be asked to come to the school
for an evening or Saturday interview. Students and parents will be interviewed at the
same time in separate groups. These interviews, known as focus groups, will be
conducted by trained moderators and will last approximately two hours. During this
time, your child will be asked to share your opinions about healthy eating.
Additionally, all participants will be asked to complete a brief survey prior to the focus
group. The demographic survey is designed to gather information such as age, gender,
education completed, and other things of that nature. The information will be used to
describe the participant groups, but your child’s responses will remain confidential.
4. How long will I be in the study?
It is believed that your child’s participation will be limited to the time allowed for the
focus group interview/ demographic survey (approximately 2 ½ hours). However, it
might be necessary to contact him or her at a later time to follow-up on focus group
responses. If additional contact is necessary, it will require minimal time and could be
completed by phone. Therefore, total participation time should not be more than four
hours.
6. Can I stop being in the study?
Your child may leave the study at any time. No one will be upset if he/she decides to quit
participating, and there will be no penalty to you. His/her decision will not affect your
current or future relationship with The Ohio State University.
6. What risks, side effects or discomforts can I expect from being in the study?
There are no anticipated risks to taking part in the study. Your child will be placed in a
non-threatening group setting where he/she will be asked to share opinions with peers
and a group moderator. If he/she is uncomfortable with discussions of health, obesity, or
food behaviors, he/she will be able to withdrawl from the focus group interview without
penalty.
7. What benefits can I expect from being in the study?
The results obtained from the focus groups will be utilized to design and implement
nutrition education programs targeting rural, Appalachian adolescents. Your child’s
input will be invaluable in making future nutrition education programs in Ohio a success.
Student participants should also be able to benefit directly from these programs, once
implemented, during the remainder of their public school education.
8. What other choices do I have if I do not take part in the study?
Your child may choose not to participate without penalty or loss of benefits to which you
are otherwise entitled.

42
9. Will my study-related information be kept private?
Every effort will be made to keep your child’s study-related information confidential.
However, there may be circumstances where this information must be released. For
example, personal information regarding your participation in this study may be disclosed
if required by state law. Also, your child’s records may be reviewed by certain groups,
such as The Ohio State University Institutional Review Board.
10. What are the costs of taking part in this study?
Transportation costs are the only ones you will incur by taking part in the study. Each
student/caregiver pair will be expected to provide their own transportation to the school
for the focus group interviews. However, free refreshments will be provided for all in
attendance.
11. Will I be paid for taking part in this study?
Your child will receive monetary compensation of $20.00 for participation in this vital
study.
12. What are my rights if I take part in this study?
If your child chooses to participate in the study, he/she may discontinue participation at
any time without penalty or loss of benefits.
Your child will be provided with any new information that develops during the course of
the research that may affect his/her decision whether or not to continue participation in
the study.
Your child may refuse to participate in this study without penalty or loss of benefits to
which he/she is otherwise entitled.
Institutional Review Board responsible for human subject research at The Ohio State
University has reviewed this research project and found it to be acceptable, according to
applicable state and federal regulations and University policies designed to protect the
rights and welfare of participants in research.
13. Who can answer my questions about the study?
For questions, concerns, or complaints about the study you may contact Chris Taylor, in
the Department of Medical Dietetics at The Ohio State University. He may be reached
by phone at 614.688.7972 or via email at [email protected].
For questions about your rights as a participant in this study or to discuss other study-
related concerns or complaints with someone who is not part of the research team, you
may contact Ms. Sandra Meadows in the Office of Responsible Research Practices at The
Ohio State University at 1.800.678.6251.

43
14. Signing the consent form
Parent/Caregiver
I have read this document and am aware that my child is being asked to participate in a
research study. I have had the opportunity to ask questions and have had them answered
to my satisfaction. I voluntarily agree for my child to participate.
_____________________________ ____________________________ Printed Name of Parent/Caregiver Signature of Parent/Caregiver
_______________________AM/PM
Date and Time
Investigator/Research Staff
I have explained the research to the participant and his/her representative before
requesting the signature(s) above. There are no blanks in this document. A signed copy
of this consent form has been given to the participant or his/her representative.
_____________________________ _____________________________ Printed Name of Person Obtaining Consent Signature of Person Obtaining Consent
_______________________AM/PM Date and Time

44
ASSENT TO PARTICIPATE IN RESEARCH FOR STUDENT
This is an assent form for research participation. It contains important information about
the study and what to expect if you decide to participate. Please review the information
carefully. Feel free to discuss the study with your friends and family and to ask questions
before making a decision to participate.
Your participation is voluntary. You do not have to be in the study. No one will be upset
if you don’t want to participate. You can say yes now and change your mind later. Your
decision will not affect current or future relationships with The Ohio State University.
You will be provided with any new information that develops during the study that may
affect your decision whether or not to continue to participate. If you decide to
participate, you will be asked to sign this form and will receive a copy of the signed form.
You are being asked to consider participating in this study for the reasons explained below.
1. Why is this study being done?
Obesity and healthy eating among rural, Appalachian youth is a problem, especially in
Ohio; however, not much research has been conducted in these areas. In order to develop
nutrition education programs for Appalachian students, it is important to look at their
attitude toward healthy eating and obesity
2. How many people will take part in this study?
The study targets ninth grade students in five Ohio middle/ high schools. All students
participating in a health class in one of these schools can potentially be included. In
order to participate, the student and one parent must consent to take part in the research.
Twelve student/parent pairs will be randomly selected from each school, with a
maximum total of 120 total participants (60 students and 60 parents/caregivers).
3. What will happen if I take part in this study?
If you decide to take part in the study, you will be asked to come to the school for an
evening or Saturday interview. Students and parents will be interviewed at the same time
in separate groups. These interviews, known as focus groups, will be conducted by
trained moderators and will last approximately two hours. During this time, you will be
asked to share your opinions about healthy eating.
45
Additionally, all participants will be asked to complete a brief survey prior to the focus
group. The demographic survey is designed to gather information such as age, gender,
education completed, and other things of that nature. The information will be used to
describe the participant groups, but your responses will remain confidential.
4. How long will I be in the study?
It is believed that your participation will be limited to the time allowed for the focus
group interview/ demographic survey (approximately 2 ½ hours). However, it might be
necessary to contact you later time to follow-up on focus group responses. If additional
contact is necessary, it will require minimal time and could be completed by phone.
Therefore, total participation time should not be more than four hours.
7. Can I stop being in the study?
You may leave the study at any time. No one will be upset if you decide to quit
participating, and there will be no penalty to you. Your decision will not affect your
current or future relationship with The Ohio State University.
6. What risks, side effects or discomforts can I expect from being in the study?
There are no anticipated risks to taking part in the study. You will be placed in a non-
threatening group setting where you will be asked to share your opinions with your peers
and a group moderator. If you are uncomfortable with discussions of health, obesity, or
food behaviors, you will be able to withdrawl from the focus group interview without
penalty.
7. What benefits can I expect from being in the study?
The results obtained from the focus groups will be utilized to design and implement
nutrition education programs targeting rural, Appalachian adolescents. Your input will
be invaluable in making future nutrition education programs in Ohio a success. Student
participants should also be able to benefit directly from these programs, once
implemented, during the remainder of their public school education.
8. What other choices do I have if I do not take part in the study?
You may choose not to participate without penalty or loss of benefits to which you are
otherwise entitled.
9. Will my study-related information be kept private?
Every effort will be made to keep your study-related information confidential. However,
there may be circumstances where this information must be released. For example,
personal information regarding your participation in this study may be disclosed if
required by state law. Also, your records may be reviewed by certain groups, such as
The Ohio State University Institutional Review Board.

46
10. What are the costs of taking part in this study?
Transportation costs are the only ones you will incur by taking part in the study. Each
student/caregiver pair will be expected to provide their own transportation to the school
for the focus group interviews. However, free refreshments will be provided for all in
attendance.
11. Will I be paid for taking part in this study?
You will receive monetary compensation for taking part in the study. All participants
will receive $20.00 for participation in this vital study.
12. What are my rights if I take part in this study?
If you choose to participate in the study, you may discontinue participation at any time
without penalty or loss of benefits.
You will be provided with any new information that develops during the course of the
research that may affect your decision whether or not to continue participation in the
study.
You may refuse to participate in this study without penalty or loss of benefits to which
you are otherwise entitled.
Institutional Review Boards responsible for human subject research at The Ohio State
University has reviewed this research project and found it to be acceptable, according to
applicable state and federal regulations and University policies designed to protect the
rights and welfare of participants in research.
13. Who can answer my questions about the study?
For questions, concerns, or complaints about the study you may contact Chris Taylor, in
the Department of Medical Dietetics at The Ohio State University. He may be reached
by phone at 614.688.7972 or via email at [email protected].
For questions about your rights as a participant in this study or to discuss other study-
related concerns or complaints with someone who is not part of the research team, you
may contact Ms. Sandra Meadows in the Office of Responsible Research Practices at The
Ohio State University at 1.800.678.6251.
47
14. Signing the consent form
Participant
I have read (or someone has read to me) this document and I am aware that I am being
asked to participate in a research study. I have had the opportunity to ask questions and
have had them answered to my satisfaction. I voluntarily agree to participate in this
study.
I am not giving up any legal rights by signing this consent form. I will be given a copy of
this signed document.
________________________________ ________________________________ Printed Name of Subject Signature of Subject
______________________ AM/PM Date and Time
Investigator/Research Staff
I have explained the research to the participant and his/her representative before
requesting the signature(s) above. There are no blanks in this document. A signed copy
of this consent form has been given to the participant or his/her representative.
________________________________ ________________________________ Printed Name of Person Obtaining Consent Signature of Person Obtaining Consent
______________________ AM/PM Date and Time

48
Appendix D
Questionnaires for Parents/Caregivers and Students

49
Parent Questionnaire
The following is a short survey to gather some information about you. Your responses will be kept confidential, and no one will know how you answered. Please skip any questions you are not comfortable answering. Using a pen or pencil, please place an “X” next to the answer that best describes you for each question. You should only have one answer marked per box. If more than one answer is possible, it will be noted. Thank you for your assistance, and please ask for help if you have any questions.
1. What is your current age?
____________ years old (please fill in blank)
2. What is your gender?
_____ A. Male _____ B. Female
3. How would you describe your racial or ethnic background?
_____ A. White _____ B. Black or African American _____ C. Hispanic or Latino _____ D. Other/____________________ (please fill in blank)
4. What is the highest level of education you completed?
_____ A. Some high school or less _____ B. High school graduation or GED _____ C. Some college or some technical school _____ D. College Degree (Bachelor’s) _____ E. Master’s or Doctoral Degree
5. What is your current work status?
_____ A. Employed Full Time _____ B. Employed Part Time _____ C. Homemaker/Stay at Home parent _____ D. Not Employed _____ E. Other/______________________ (please fill in blank)

50
6. Has the doctor ever told you that you have any of the following conditions? Please mark all that apply.
_____ A. Diabetes _____ B. High blood Pressure _____ C. Heart disease _____ D. High cholesterol _____ E. Other/__________________ (please fill in blank)
7. How would you describe your weight?
_____ A. Very underweight _____ B. Slightly underweight _____ C. Appropriate weight _____ D. Slightly overweight _____ E. Very overweight
8. Which of the following are you trying to do about your weight?
_____ A. Lose weight _____ B. Gain weight _____ C. Maintain current weight _____ D. Not trying to do anything about my weight
9. How much do you weigh? (please fill in the blank)
________________ pounds
10. How tall are you? (please fill in the blanks)
_______________ feet _____________ inches
11. Which category best represents your total earned household income (gross)
over the past year?
_____ A. Less than $10,000 _____ B. $10,000 to $14,999 _____ C. $15,000 to $19,999 _____ D. $20,000 to $24,999 _____ E. $25,000 to $29,999 _____ F. $30,000 to $34,999 _____ G. $35,000 to $39,999 _____ H. $40,000 to $44,999 _____ I. $45,000 to $49,999 _____ J. $50,000 or greater
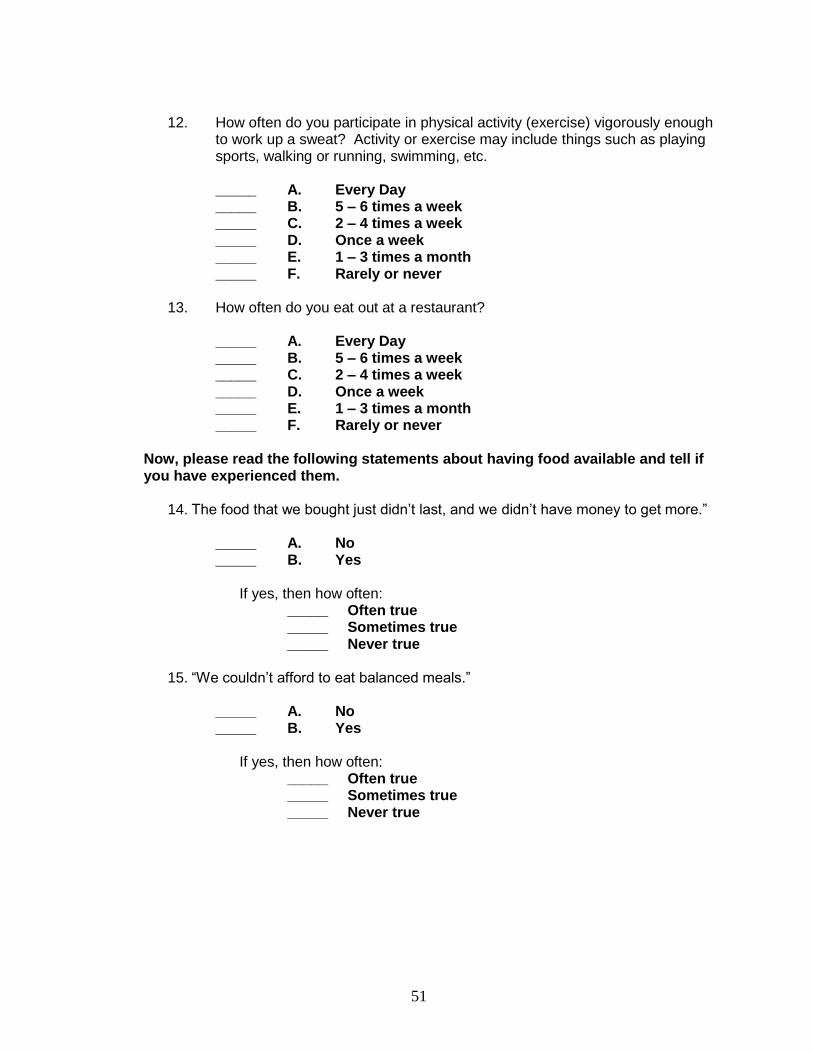
51
12. How often do you participate in physical activity (exercise) vigorously enough
to work up a sweat? Activity or exercise may include things such as playing sports, walking or running, swimming, etc.
_____ A. Every Day _____ B. 5 – 6 times a week _____ C. 2 – 4 times a week _____ D. Once a week _____ E. 1 – 3 times a month _____ F. Rarely or never
13. How often do you eat out at a restaurant?
_____ A. Every Day _____ B. 5 – 6 times a week _____ C. 2 – 4 times a week _____ D. Once a week _____ E. 1 – 3 times a month _____ F. Rarely or never
Now, please read the following statements about having food available and tell if you have experienced them.
14. The food that we bought just didn’t last, and we didn’t have money to get more.”
_____ A. No _____ B. Yes
If yes, then how often:
_____ Often true _____ Sometimes true _____ Never true
15. “We couldn’t afford to eat balanced meals.”
_____ A. No _____ B. Yes
If yes, then how often: _____ Often true
_____ Sometimes true _____ Never true

52
16. In the last 12 months, did you or other adults in your household ever cut the size of your meals because there wasn't enough money for food?
_____ A. No _____ B. Yes
If yes, then how often: _____ Often true
_____ Sometimes true _____ Never true
17. In the last 12 months, did you or other adults in your household ever skip meals because there wasn't enough money for food?
_____ A. No _____ B. Yes
If yes, then how often:
_____ Often true _____ Sometimes true _____ Never true
18. In the last 12 months, did you ever eat less than you felt you should because there wasn't enough money to buy food?
_____ A. No _____ B. Yes
If yes, then how often:
_____ Often true _____ Sometimes true _____ Never true
19. In the last 12 months, were you every hungry but didn't eat because there wasn't
enough money for food?
_____ A. No _____ B. Yes
If yes, then how often:
_____ Often true _____ Sometimes true _____ Never true
This concludes the survey. Thank you for your participation!

53
Student Questionnaire
The following is a short survey to gather some information about you. Your responses will be kept confidential, and no one will know how you answered. You may skip any questions you are not comfortable answering. Using a pen or pencil, please place an “X” next to the answer that best describes you for each question. You should only have one answer marked per box. If more than one answer is possible, it will be noted. Thank you for your assistance, and please ask for help if you have any questions.
1. What is your current age? _______________ years old
2. What is your gender?
_____ A. Male _____ B. Female
3. How would you describe your ethnicity?
_____ A. White _____ B. Black or African American _____ C. Hispanic or Latino _____ D. Other/__________________________ (please fill in blank)
4. Do you receive free or discounted meals at school?
_____ A. Yes _____ B. No _____ C. Don’t Know
5. What is your grade point average in school?
_____ A. Less than or equal to 1.5 _____ B. 1.6 to 2.5 _____ C. 2.6 to 3.0 _____ D. 3.1 to 3.5 _____ E. Greater than 3.5

54
6. How would you describe your weight?
_____ A. Very underweight _____ B. Slightly underweight _____ C. Appropriate weight _____ D. Slightly overweight _____ E. Very overweight
7. Which of the following are you trying to do about your weight?
_____ A. Lose weight _____ B. Gain weight _____ C. Maintain current weight _____ D. Not trying to do anything about my weight
8. How much do you weigh? (please fill in the blank)
________________ pounds
9. How tall are you? (please fill in the blanks)
_______________ feet _____________ inches
10. How often do you participate in physical activity (exercise) vigorously enough
to work up a sweat? Activity or exercise may include things such as playing sports, walking or running, swimming, etc.
_____ A. Every Day _____ B. 5 – 6 times a week _____ C. 2 – 4 times a week _____ D. Once a week _____ E. 1 – 3 times a month _____ F. Rarely or never
11. How often do you participate in making food choices for your family? This
may include shopping for groceries by yourself or with a parent, choosing foods to prepare for meals, etc.
_____ A. Most of the time _____ B. Some of the time _____ C. Not very often _____ D. Never
12. How often do you eat out at a restaurant?
_____ A. Every Day _____ B. 5 – 6 times a week _____ C. 2 – 4 times a week _____ D. Once a week _____ E. 1 – 3 times a month _____ F. Rarely or never

55
These questions are about buying food and drinks at your school. Please only think about buying things at school; do not think about eating at school. 17. During the last week that you were in school, how many times did you buy candy, ice cream, cookies, cakes, brownies or other sweets at school?
_____ A. I did not buy any at school during the last week _____ B. 1 or 2 times during the last week in school. _____ C. 3 or 4 times during the last week in school. _____ D. 1 time per day _____ E. 2 times per day _____ F. 3 times per day _____ G. 4 or more times per day
18. During the last week that you were in school, how many times did you buy salty snack foods at school?
_____ A. I did not buy any at school during the last week _____ B. 1 or 2 times during the last week in school. _____ C. 3 or 4 times during the last week in school. _____ D. 1 time per day _____ E. 2 times per day _____ F. 3 times per day _____ G. 4 or more times per day
The next questions ask about food you ate or drank during the past 7 days. Think about all the meals and snacks you had from the time you got up until you went to bed. Be sure to include food you ate at home, at school, at restaurants, or anywhere else. 19. During the past 7 days, how many glasses of milk did you drink? (Include all types of milk, including cow’s milk, soy milk or any other kind of milk; include the milk you drank in a glass or cup, from a carton, or with cereal. Count the half pint of milk served at school as equal to one glass.)
_____ A. I did not drink milk during the past 7 days _____ B. 1 to 3 glasses during the past 7 days _____ C. 4 to 6 glasses during the past 7 days _____ D. 1 glass per day _____ E. 2 glasses per day _____ F. 3 glasses per day _____ G. 4 or more glasses per day
20. During the past 7 days, how many times did you drink 100% fruit juices such as orange juice, apple juice, or grape juice? (Do not count punch, Kool-Aid, sports drinks, or other fruit-flavored drinks.)
_____ A. I did not drink 100% fruit juice during the past 7 days _____ B. 1 to 3 times during the past 7 days _____ C. 4 to 6 times during the past 7 days _____ D. 1 time per day _____ E. 2 times per day _____ F. 3 times per day _____ G. 4 or more times per day

56
21. During the past 7 days, how many times did you drink Soda pop (EXAMPLES Coke, Pepsi, Mountain Dew), sports drinks (EXAMPLE Gatorade), or fruit drinks that are not 100% fruit juice (EXAMPLES Kool-Aid, Hi-C, Fruitopia, Fruitworks)?
_____ A. I did not drink any during the past 7 days _____ B. 1 to 3 times during the past 7 days _____ C. 4 to 6 times during the past 7 days _____ D. 1 time per day _____ E. 2 times per day _____ F. 3 times per day _____ G. 4 or more times per day
22. During the past 7 days, how many times did you eat green salad?
_____ A. I did not eat green salad during the past 7 days _____ B. 1 to 3 times during the past 7 days _____ C. 4 to 6 times during the past 7 days _____ D. 1 time per day _____ E. 2 times per day _____ F. 3 times per day _____ G. 4 or more times per day
23. During the past 7 days, how many times did you eat potatoes? (Do not count french fries, fried potatoes, or potato chips.)
_____ A. I did not eat potatoes during the past 7 days _____ B. 1 to 3 times during the past 7 days _____ C. 4 to 6 times during the past 7 days _____ D. 1 time per day _____ E. 2 times per day _____ F. 3 times per day _____ G. 4 or more times per day
24. During the past 7 days, how many times did you eat carrots?
_____ A. I did not eat carrots during the past 7 days _____ B. 1 to 3 times during the past 7 days _____ C. 4 to 6 times during the past 7 days _____ D. 1 time per day _____ E. 2 times per day _____ F. 3 times per day _____ G. 4 or more times per day
25. During the past 7 days, how many times did you eat other vegetables? (Do not count green salad, potatoes, or carrots.)
_____ A. I did not eat other vegetables during the past 7 days _____ B. 1 to 3 times during the past 7 days _____ C. 4 to 6 times during the past 7 days _____ D. 1 time per day _____ E. 2 times per day _____ F. 3 times per day _____ G. 4 or more times per day

57
26. During the past 7 days, how many times did you eat fruit, such as apples, bananas, oranges, berries or other fruit? (Do not count fruit juice.)
_____ A. I did not eat fruit during the past 7 days _____ B. 1 to 3 times during the past 7 days _____ C. 4 to 6 times during the past 7 days _____ D. 1 time per day _____ E. 2 times per day _____ F. 3 times per day _____ G. 4 or more times per day
27. During the past 7 days, about how many times did you eat a meal or snack from a fast food restaurant such as McDonald’s, Pizza Hut, Burger King, KFC (Kentucky Fried Chicken), Taco Bell, Wendy’s and so on?
_____ A. I did not eat food from a fast food restaurant during the past 7 days _____ B. 1 to 3 times during the past 7 days _____ C. 4 to 6 times during the past 7 days _____ D. 1 time per day _____ E. 2 times per day _____ F. 3 times per day _____ G. 4 or more times per day
This concludes the survey. Thank you for your participation!

58
Appendix E
Focus Group Discussion Guide Questions for Parents/Caregivers and Students

59
Focus Group Discussion Guide for Parent/Caregiver
1. Please tell us your first name and your very favorite food.
(Food is important to all of us and impacts our life daily. Today, we want to find out what you think about healthy eating and weight.)
2. What is the first thing you think about when you hear the words “healthy diet”?
3. Share with me what you believe is a “healthy diet”.
4. Do you think that most people in this area eat healthy? (Probes: Why or why not? Is healthy eating a consideration?)
5. Sometimes, do you find there are barriers to consuming a healthy diet? If so, can you list and describe some of those for me?
6. What would make it easier for you and your family to eat a healthy diet?
7. What does “healthy weight” mean to you? (Probes: Do you think of a number, size, or body shape? If so, what is it?)
8. Do you think overweight and fear of overweight are problems among your peers? (Probes: Why is/isn’t it a problem? What kind of fears do they have?)
9. What do you think it means to your child? (Probe: Why or why not? Examples of barriers may include not enough time to cook, healthy choices not available, don’t know how to cook healthy, etc.)
10. Where do you get information on healthy eating and weight?
11. Is there anything else that you would like to tell us about healthy eating or weight that you weren’t able to share earlier?

60
Focus Group Discussion Guide
for Adolescents
1. Please tell us your first name and your very favorite food.
(Food is important to all of us and impacts our life daily. Today, we want to find out what you think about healthy eating and weight.)
2. What is the first thing you think about when you hear the words “healthy diet”?
3. Share with me what you believe is a “healthy diet”.
4. Do you think that most kids in your school eat healthy? (Probes: Why or why not? Is healthy eating a consideration?)
5. What keeps teenagers from eating healthy? (Probe: Why or why not? Examples of barriers may include eating out, not available in cafeteria, parents purchase foods, media promotes “unhealthy” food choices, etc.)
6. What would make it easier for kids your age to eat a healthy diet? 7. Describe to me what you believe is a “healthy weight”.
(Probes: Do you think of a number, size, or body shape? If so, what is it?)
8. What does “healthy weight” mean to you? 9. Do you think overweight and fear of overweight are problems among
teenagers in your school? (Probes: Why is/isn’t it a problem? What kind of fears do they have?)
10. Where do you go to get information about what is a healthy diet or a healthy weight?
11. Is there anything else that you would like to tell us about healthy eating or weight that you weren’t able to share earlier?