the reliability of block triangulation · the reliability of block triangulation theoretical...
TRANSCRIPT

WOLFGANG FORSTNER Institut fur Photograinmetrie der Unicersitat Stuttgart
D-7000 Stuttgart 1 , Federal Republic of Germany
The Reliability of Block Triangulation Theoretical studies on the reliability of photogrammetric blocks give clear guidelines for project planning, leading to coordinates of high quality.
D WRING THE LAST ten years aerial triangulation has become a powerful tool for point deter-
mination. The main reason is the rigorous applica- tion of adjustment theory, which enabled a simul- taneous orientation of images and thus increased the accuracy by an order of magnitude. The refinement of the mathematical model based on this develop- ment, with the aim to compensate systematic er- rors, lead to a further increase in the accuracy by a factor of two to three. Today one can reach a pre- cision of the adjusted coordinates of 2 to 3 pin, mea- sured at the photoscale, if the full potential is used to advantage. This result has been confirmed by var- ious controlled tests.
It is at the same time pleasing and amazing that
"cleaned" a block, there does not exist an objective and coinmonly accepted criterion about when to stop the process of elimination of possibly erroneous observations. Thus, undetected gross errors may still remain which it is hoped do not deteriorate the result too much. This immediately leads to the re- liability of adjusted coordinates being the intrinsic problem of point determination.
Two tasks have to be solved:
One needs methocls for the detection and elimi- nation of gross errors. Automatic procedures have to take into consideration the different types of gross errors and, thus, have to be able also to handle large gross errors. They therefore cannot be reduced to the application of a statistical test. The developnlent of efficient strategies seetns to con-
ABSTRACT: The theory of reliability treats the ability to detect gross errors by using statistical tests and the sensitir;ity of the result with respect to non-detectable gross errors. The theory deceloped by W . Baarda, Delft, for use in geodetic networks is outlined. In an extensioe in~estigation it was applied to photograinmetric point determination. The study results in clear reco~nnzendations for project planning, consisting in the appropriate choice of the block parameters as overlap, and in the distribution of control and tie points, which leads to a hoinogeneous precision as well as to a high reliability of block triangulation.
these accuracies have also been achieved in normal application, as the theoretical studies on the preci- sion of block triangulation were based on very sim- plified assumptions about the stochastical properties of the image or model coordinates. I t is true that the discrepancies between theoretical predictions and empirical results have pushed forward the de- velopment of methods for compensation of system- atic errors and have lead to a deeper insight into the powerful tool of self calibration. But the effects of unmodeled errors, especially gross errors, on the adjustment of photogrammetric blocks had not been studied thoroughly until a few years ago.
However, each block adjustment has to cope with a certain percentage of gross errors, which in gen- eral are found and eliminated by an analysis of the residuals. But, as known to everybody who has once
PHOTOGRA~~ME'I'R~C ENGI~EERIN(; A N D REMOTE SE~SINC:, Vol. 51, No. 6, August 1985, pp. 1137-1149
verge to a three-step procedure treating large, me- dium-sized, and stnall gross errors by pre-error de- tection, automatic weighting, and statistical pro- cedures, respectively (cf. the papers presented at the Colnmission 111 Sylnposiu~n of ISP, 1982, in Helsinki and at the ISP Congress in Rio de Janeiro, 1984). The detectability of gross errors and the influence of non-detectable gross errors on the result of the block adjustment, i.e., the reliability according to Baarda (1967, 1968, 1973, 1976). has to be inves- tigated with respect to the project planning. Here the type of test for detecting very small gross errors will have a large influence and will require a sta- tistical description of reliability.
This paper is supposed to motivate and describe the concept of reliability. Based on the result of com- prehensive studies, recommendations for the
0099-1112/85/5108-1137 $02.2510 0 1985 American Society of Photogratnnletry
and Retnote Sensing

PHOTOGRAMMETRIC ENGINEERING & REMOTE SENSING, 1985
project planning are given, which complete the known methods for improving the precision of pho- togrammetric coordinates.
The theory of reliability is part of a concept for evaluating the quality of adjustment results, which was developed by W. Baarda (1967, 1968, 1973, 1976) for use in geodetic networks. The notion of quality, according to Baarda, includes precision and reliability. Figure 1 shows the interrelations be- tween the different parts of the theory.
Reliability
I I
i~xterna; 1 1 Intet-"a: Reliabilit Reliability
Sensitivity Controllability
FIG. 1. Evaluation of quality according to W. Baarda (1967, 1968, 1973, 1976).
The evaluation of precision consists in comparing the covariance matrix Qkr of the adjusted coordi- nates with a given matrix Hkk, also called criterion matrix. It is required that the error ellipsoid de- scribed by Q k k lies inside the error ellipsoid de- scribed by Hkk and that it is as similar to Hkk as pos- sible. This results in a check as to whether a re- quired measure of precision is reached.
We are only concerned here with reliability. Baarda distinguishes internal and external reli- ability. Internal reliability is the controllability of the observations, described by lower bounds for gross errors, which can just be detected with a given probability. The effect of non-detectable gross errors on the result is described by factors for the standard errors of the coordinates, which indicate by what amount the coordinates may be deteriorated in the worst case. These factors describe the external re- liability or the sensitivity of the unknown coordi- nates. Obviously, there is a close connection to the evaluation of precision.
Remark: Baarda himself used the notion "accuracy" for describing precision and reliability. As in photo- grammetric applications, the notion accuracy is too much associated with the specification of estimated standard deviations; quality seems to be a more proper term for also describing non-detectable errors in the mathematical model and their effects.
Before a mathematical definition of reliability is given, three examples show that the conditions for
FIG. 2. Forward intersections with daerent redundancy, good geometry, and redundancy numbers. In all direc- tions of Figure 2c, errors are locatable.
good reliability are closely related to the local ge- ometry. Figure 2 shows network diagrams of for- ward intersections, which differ by one observation each. They are to demonstrate the influence of ad- ditional observations on the strength of the geom- etry. In Figure 2a the observations are not control- lable, i.e., they are necessary for the determination of the coordinates. In Figure 2b each observation is controllable, i.e., it is not necessary for the deter- mination of the coordinates. On the other hand, er- rors in the observation are not locatable or identi- fiable, i.e., each is necessary for the control of the others. In Figure 2c, finally, errors in the observa- tions are locatable, i.e., each is not necessary for the control of the others. Any further observation would be supelfluous for the detection of a single gross error. The increase in the number of rays goes along with an increase in the strength of the ge- ometry, which inay be described by the sequence of the common terms: determination-control-loca- tion or identification.
Obviously the network design in Figure 2c is chosen appropriately to reach a reliable determi- nation of the coordinates. This is different in Figures 3 and 4.
In Figure 3a the determination of point P is weak; therefore, the direction D in Figure 3b is not con- trollable. The directions A and B control each other. As a consequence, gross errors in directions C and D in Figure 3c and in all directions of Figure 4 practically cannot be located. Any additional direc- tion in Figure 4c cutting the existing directions with an angle of about 45' enables a location of a gross error in any of the directions.
As these configurations may occur also in net-
FIG. 3. Forward intersections with different redundancy, poor geometry, and redundancy numbers. Errors in di- rections C and D in Figure 3c not locatable.

RELIABILITY OF BLOCK TRIANGULATION
FIG. 4. Cf. Figure 3, but errors in directions A , B, C, and D in Figure 4c are not locatable.
works with high redundancy, it is obvious that the local geometry is decisive for the reliability of the point determination. Such situations also arise in bundle blocks with 20 percent sidelap where the points in the middle of the strips are measured only in three images. The x-coordinates (x parallel to di- rection of flight) are controllable here, but possibly wrong image rays cannot be identified (cf. geometry of Figure 2b). "
This discussion of the geometric properties of a network design can be rendered precise using the information that adjustment theory and mathemat- ical statistics offer.
Notation: Scalars and vectors are written in small let- ters, matrices in capital letters, A' is the transpse of A, stochastical values are underscored, 5 and are estimates for x and VI, respectively.
Let the block adjustment be given by the linear- ized error equations
with the vector = ( I , ) containing the observations I , the corresponding vector _v = (g,) of the resid- uals, the error equation or design matrix A with the error equation vectors a:, the estimated vector 4 of the unknown parameters (coordinates, transforma- tion parameters, and, possibly, additional parame- ters), and a constant vector a,, resulting from the linearization. The weight matrix PI!, being the in- verse of the weight-coefficient matrix Qll, is sup- posed to be known.
From the solution = (A' PI! A)-' A' Pi, (1 - a,) and the weight coefficient matrix
Q,, = Qll - A (A' P, A)- A' (2) of the residuals _v (which are used for error detec- tion), the direct relationship between residuals and observations can be derived:
The matrix Q,, Pit is idempotent, i.e., (Q,, Pll)' = Q,, Pll. Using the eigenvalue decomposition of Q,, PI[, it can be shown that the rank and the trace of Q,, Pa are equal to the redundancy r = n - u of the system: i.e.,
The diagonal elements (Q,, P),, obviously show the distribution of the redundancy onto the observa- tions. The redundancv number
I ri d=d (Q,, P,Oij I (5) is the contribution of li to the total redundancy r (cf. Forstner, 1979).
The redundancy numbers range from 0 to 1. Ob- servations with ri = 1 are fully controllable, whereas observations with ri = 0 cannot be checked at all. The average value, the relative redundancy p = rln, for photogrammetric blocks is about 0.2 to 0.5. An average value of 0.5 already indicates a rather stable block. Single redundancy numbers, however, easily reach values below 0.1, indicating a very weak local geometry.
Using the r , , we are now able to calculate the influence V o , of a single gross error V1, in the obser- vation !, on the corresponding residual II,: i.e.,
(V designates "gross error" or, more generally, a de- viation from the assumed mathematical model).
Equation 6 shows that only a small part (from about 50 percent down to less than 10 percent) of the original gross error V1, is revealed in the residual 2,. However, only in case the diagonal element (QLL P),, = r, of QLL PI! (cf. equation 2) is larger than all other elements of the i-th column, a gross error in 1, will influence ij, more than the other residuals, i.e:, only in that case can V1, be expected to be lo- catable using the largest residual as indicator.
Equation 6, furthermore, can be used in practical error detection procedures. With the knowledge of the local geometry, i.e., with r,, one can obtain an estimate 3, for the size of the original gross error Vl,: i.e.,
A
Vl, = - El 1 r , . - (7) This simplifies the evaluatipn of the residuals. It can be shown that the value V1, equals the residual in an adjustment without !,, iT., in an adjustment with p, = 0. The spatial distribution of the redundancy onto the block can be described using the redun- dancy numbers and gives a first insight into the con- trollability of the observations. Figures 2 to 4 show the values r,, which demonstrate that the visual evaluation of the design quality is confirmed by the numerical values (cf. also Kavouras, 1982).
Remark: The redundancy numbers r, do not give any information about the ability to identify or locate gross errors. In general, however, gross errors in an obser- vation are locatable if 1, is not necessary for the control of the other obsewatibns. In this case all correlation coefficients p, of - v, and g (j f i ) are f 2 1.
Testing the observations based on the residuals has to consider the different precision of the resid- uals. With the standard deviation
PHOTOGRAMMETRIC ENGINEERING & REMOTE SENSING, 1985
U', = g o cl= g,, G (' provided P = diag(p,))
of the i-th residual v;, we obtain the standardized residual
A
- 2)i V - l i -
ai* w. = - = - - - - - -1
- - N(0,l) aCi u< rr,
(9) which is used as the test statistk It is at the same time a test of the estimated size g, of the gross error (cf. Equation 7)! Here u, is assunied to be known. Moreover, if it is assumed that the observations are normally distributed, then the test statistic wi also is normally distributed with expectation O anavari- ance 1.
Remark: If there is no a priori information about the precision of the observations and, thus, if a. is not known, then instead of w,, the test statistic
can be used, which follows a student distribution with r - 1 degrees of freedom. The variance
is an estimate for a; and is identical to 6 in an ad- justment without observation 1, (cf. Foraner, 1980, Equation 12). This test statisticE, is functionally de- pendent on the one given by Pope (1975), which is T- distributed (cf. Griin, 1982, Equation 22b). E,, how- ever, is as well suited as w, for the folloiGng deriva- tions, as in both cases the non-central distribution is known.
The test of the observations, the "data-snooping" proposed by Baarda, now consists in comparing the absolute value I~, i , l of the test statistic with the crit- ical value k, which depends on the present signifi- cance level S = 1 - a,. If the standardized residual exceeds the critical value k, the corresponding ob-
servation 1, is suspected to be erroneous. In a prac- tical procedure one of course will only check the observations with the largest test statistics and take into consideration the interrelation between the re- siduals, as a single large gross error in general will lead to many test statistics which exceed the critical value. As can be seen from Equation 9, a large to, also can be caused by a wrong weight. Therefore, w not necessarily must be rejected, if only being a Gtle larger than the critical value k.
The normal distribution-at least in principal- allows deviations of any size from the mean value. The probability that the test statistic exceeds the critical value, if the observations are not erroneous, and therefore leads to an erroneous decision of type I , is the significance number a,, which usually is chosen small (e.g., 5 percent, 1 percent, or 0.1 per- cent).
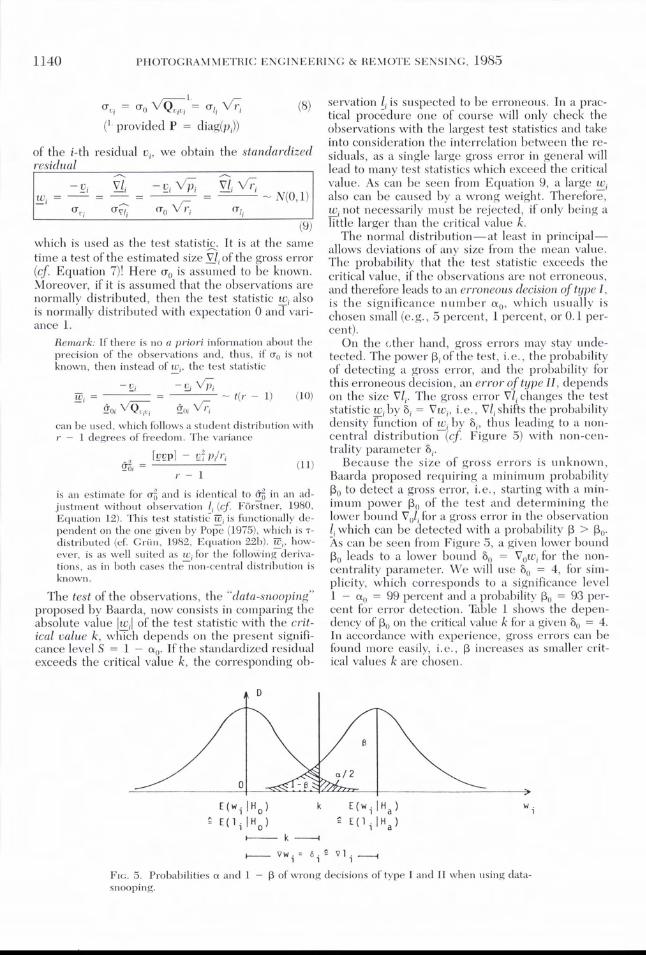
On the cther hand, gross errors may stay unde- tected. The power p, of the test, i. e., the probability of detecting a gross error, and the pobability for this erroneous decision, an error of t ~ p e 11, depends on the size V1,. The gross error Vl, changes the test statistic w, by 6, = V w , , i.e., Vli shlfts the probability density function of w, by 6,, thus leading to a non- central distribution (cf. Figure 5) with non-cen- trality parameter 6,.
Because the size of gross errors is unknown, Baarda proposed requiring a minimum probability p, to detect a gross error, i.e., starting with a min- imum power p, of the test and determining the lower bound Volt for a gross error in the observation 1 which can be detected with a probability P > Po. i s can be seen from Figure 5, a given lower bound p, leads to a lower bound 6, = Vow, for the non- centrality parameter. We will use So = 4, for sim- plicity, which corresponds to a significance level 1 - a, = 99 percent and a probability po = 93 per- cent for error detection. Table 1 shows the depen- dency of p, on the critical value k for a given 6 , = 4. In accordance with experience, gross errors can be found more easily, i.e., P increases as smaller crit- ical values k are chosen.
E N i IH,) k E(wilHa) 6 E ( l i l H o ) E(li IH,) - k ---I - Vwi = 6. 2 V1.
1 - FIG. 5. Probabilities a and 1 - P of wrong decisions of type I and I1 when using data- snooping.

RELIABILITY O F BI ,OCK TRIANGULATION
TABLE 1. SICNIFIC:ANCE LEVEL S = 1 - ao. CRITICAL
VALUE k, A N D POWER Po OF TEST FOR GIVEN NON-CENTRALIlY PARAMETER 6n = 4
From Equation 9 now the lower bound Voli for 1 gross errors, which are detectable with a probability >Pn, can be derived:
The value ti,!,, is the factor for all giving a minimum size Val, of a just detectable gross error in I,. The lower bounds Vol, or the factors 66, designate the con- trollability of the observations or the internal reli- ability according to Baarda. They essentially depend on the redundancy numbers r,, i.e., on the local geometry. Redundancy numbers between 0.1 and 0.5 lead to lower bounds for detectable gross errors
<>
between Vol, = 6 all and V,l, = 13 u,, or to control- lability factors between ti;, = 6 and ti,!,, = 13. Thus, gross errors much larger than the three-fold stan- dard deviation may stay undetected and may falslfy the result.
Remark: A similar line of thought leads to the notion of locatability or identifiability, describing the ability to correctly locate or identify gross errors. Require- ments for a high locatability analogously lead to re- quirements for the correlation coefficients of the re- siduals. This aspect will not be treated here (cf. Fiirstner, 1983).
All not-detected gross errors contaminate the re- sult of the adjustment. The influence Vo,x, of a gross error of size V,l, on the unknown $ can directly be obtained using - f = (AfPI,A)-I A' Pll ( I - ao):
VolxJ = ((A' P// A)- ' A' P ~ ) J # Voll ( I 3 ) The values Vo,x, give conspicuous insight into the sensitivity of the result and may be useful in small systems. There are, however, several reasons to use a different measure:
The calculation of all n x u values VaxJ is prohibi- tive in large blocks. In most cases the influence of non-detectable gross errors on the orientation parameters or even on additional parameters is of no interest. In free blocks, without any control points, the in- fluence values Voix, depend on the coordinate system.
Therefgre, Baarda proposed using the standardized length 6,, of the vector Voik, a subvector ~f Voix, con- taining the influence on the coordinates _k of the new points
- 6Oi = llVo,kll = dVotkl Qii V,MU~. (14)
It is a measure for the total deformation of the block, caused by a gross error Vol, in observation 1,. This seemingly abstract measure for the defognation gives at the same time an upper bound V, f for the influence of grpss errors V1, < V,l, on an arbitrary
function -& = A_k) of the coordinates k. Using auchy-Schwarz's identity, 3 can be shown
that, with the standard deviation ufoff, the influ- ence is bounded: i. e.,
-1 (15) For the special functions f = x,, f = z;,, f = z, one obtains
Voi9 5 Foi - Voi f Voiyj 5 Foi . a,,,
and Voiz, 5 $i . u3 (16)
Thus, the coordinat_es x , y, and z are not contam- inated by more t h g tioi times their standard devia- tion. The factors so, describe the sensitivity of the result or the external reliability according to Baarda. A practical formula for calculating the values SOi is given by KleinIForstner in Seminar (1981) (cf. also Schwarz et al . , 1982).
The previous section has provided three mea- sures for describing the reliability of an adjustment, which are based on the theory of Baarda (1967, 1968, 1976):
The redundancy nutnber r, (cf. Equation 5) is the contribution of observation I , to the total redun- dancy r, as Zr, = r. They ena%le the calculation of the influence Vo, of a gross error V1, in observation I, on the corresponding residual 1;,. Vo, = - r, V,, {cf. Equation (6)). The controUability factor 66, (cf. Equation 12) is the factor for the standard deviation ul giving a lower bound V,l, = 6; a,, for just detectable gross errors (cf. Equation 12) in 1,. Gross errors in observation 1, which are smaller than the 6;,-fold standard deviation ul,, cannot be detected by a statistical test, e.g., the "data-snoopingm-test (Equation 9).
Both ri and 6& describe the internal reliability ac- cording to Baarda.
The sensitivity factor 8% (cf. Equation 14) is the factor for the standard deviation ux of an arbitrary unknown x giving an upper hound Vo,x 6, . u,for the influence of nondetectable gross errors. Thus, the adjusted coordinates-x, y, and z are not con- taminated by more than 6, times their standard de- viation, if a statistical test has been applied.
The values 6,, describe the external reliability ac- cording to Baarda.
Table 2 gives an indication how to evaluate the different reliability measures.
On the basis of the reliability theory described in the previous section, several photogrammetric blocks were investigated at the Institute of Photo-

PHOTOGRAMMETRIC ENGINEERING & REMOTE SENSING, 1985
TABLE 2. ON THE EVALUATION OF RELIABILIT~41EASURES: ri, REDUNDANCY NLIHBER; CONTROLLABILITY FACTOR;
ijOir SENSITI\,IIY FACTOR
Good Acceptable Bad Not Acceptable
grammetry, Stuttgart, in order to obtain information about the dependency of the internal and external reliability on different project parameters. These were, in particular, especially
the control point distribution, the degree of overlap, the density and the distribution of the, tie points, and the size of the blocks.
The investigation used simulated regular square shaped blocks with bundles and independent models, single blocks (designated with S ) with 20 percent sidelap and double blocks (designated with D) with either 60 percent sidelap or consisting of two single blocks flown crosswise. The blocks with independent models use four or six single or twin points per model. The bundle blocks have nine single or twin points and 25 single points per image. The number of points per unit is added to the S or D to describe the block concerned. The horizontal control points are situated at the perimeter of the blocks (cf. Figure 6). The vertical control varies for single and double blocks. The height of single blocks is stabilized by chains, while the vertical control points in double blocks form a regular grid. The control point interval varies from 2 to 20 baselengths b . The precision of all observations, including the coordinates of the control points, is assumed to be equal, with one exception: the x- and y-coordinates of the projection centers in independent model blocks are assumed to have double the standard de- viation.
Before investigating the influence of the daerent block parameters on the reliability, two examples are examined. Figures 7 to 9 show two represen- tative blocks with independent models and with bundles, respectively. For symmetry reasons only
one-fourth of each of the blocks is plotted. The re- dundancy nuibers r,, the cofitrollability factors ti;,, and the sensitivity factors 6,, are shown in each block. The values are given separately for the pla- nimetry and height of independent model blocks and for the x- and y-coordinates of the bundle block.
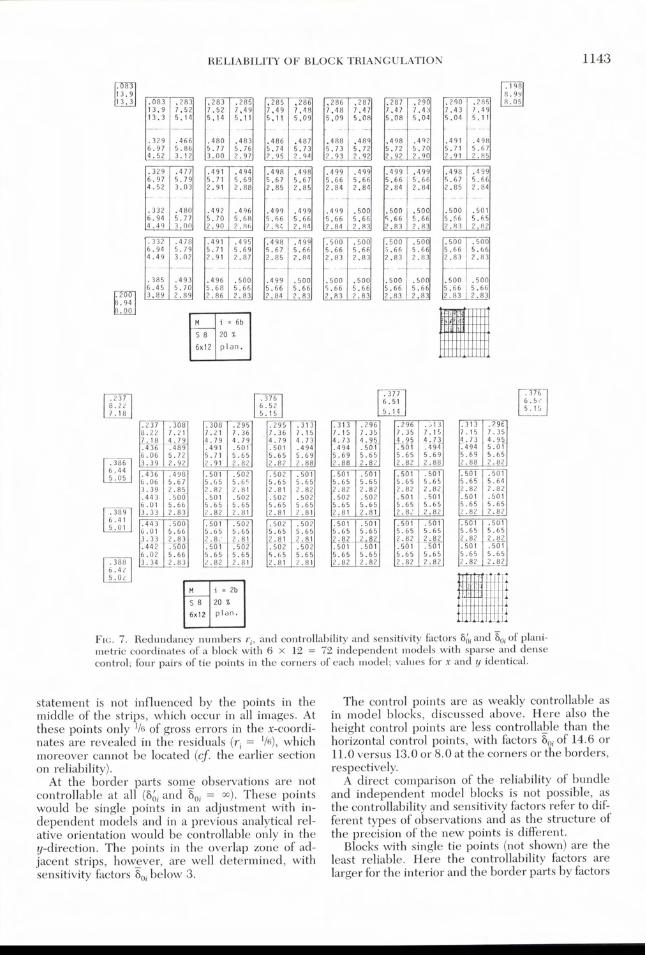
The model blocks S8 with sparse and dense con- trol (i = 2b and i = 6b) (cf. Figures 7 and 8) have four twin points in the corner of each model. The reliability figures are identical for the two points of a group and are, therefore, only &ven once. The figures suggest the interior parts, the border parts, and the control points be considered separately.
The redundancy numbers r, in the interior of the blocks are about 0.5. This proves the block to be very stable. Gross errors larger than 6;, . a, = 5.6 . cr,, can be detected with the data snooping. bn- detectable gross errors, however, falsify the coor- dinates of the new points only up to 3 times their standard deviation (ti,, 5 3). The reliability is filly acceptable.
This is different at the border parts of the blocks, especially at the borders with the short model sides. They are determined-as being not very reliable, with sensitivity factors &,of around 5. The influence of the control points on the reliability is negligible.
The coordinates of the control points, which are introduced as observations, are the most poorly con- trolled. Already with moderate control point dis- tance i = 6b, only 7 or 12 percent of the size of the gross errors show up in the residuals (r, = 0.07 or 0.12, respectively). Gross errors must be larger than 6 or 15 ( ! ) times the standard deviation a,, or uZ of the model coordinates to be detectable.
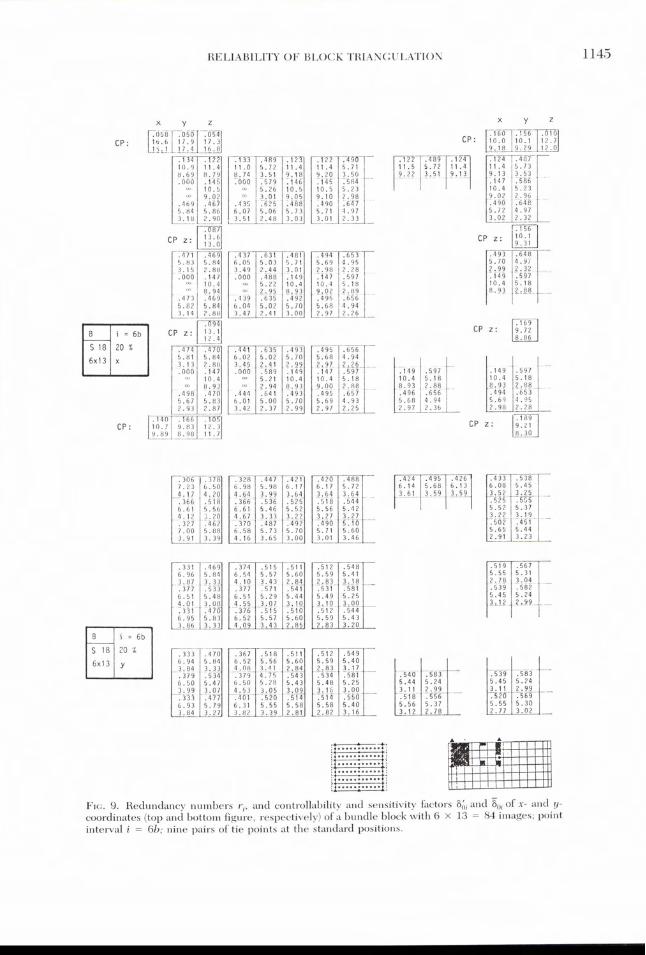
Bundle blocks reveal a similar reliability struc- ture. In the images of block S18 shown in Figure 9 double points are measured at the nine standard positions. Again, the values suggest that the interior and the border parts be considered separately. This
A planimetry and he ight
o he ight
FIG. 6. Control point distribution.
RELIABILITY OF BLOCK TFUANGULATION
Fl 6x12 plan.
Frc. 7. Redundancy numbers r,, and controllability and sensitivity factors 6& and 80, of plani- metric coordinates of a block with 6 x 12 = 72 independent models with sparse and dense control; four pairs of tie points in the corners of each model, values for x and y identical.
statement is not influenced by the points in the middle of the strips, which occur in all images. At these points only '16 of gross errors in the x-coordi- nates are revealed in the residuals (ri = 'Is), which moreover cannot be located (cf the earlier section on reliability).
At the border parts somz observations are not controllable at all (6& and tioi = w). These points would be single points in an adjustment with in- dependent models and in a previous analytical rel- ative orientation would be controllable only in the y-direction. The points in the overlap zone of ad- jacent strips, howzver, are well determined, with sensitivity factors 8, below 3.
The control points are as weakly controllable as in model blocks, discussed above. Here also the height control points are less controllable than the horizontal control points, with factors 8, of 14.6 or 11.0 versus 13.0 or 8.0 at the corners or the borders, respectively.
A direct comparison of the reliability of bundle and independent model blocks is not possible, as the controllability and sensitivity factors refer to dif- ferent types of observations and as the structure of the precision of the new points is different.
Blocks with single tie points (not shown) are the least reliable. Here the controllability factors are larger for the interior and the border parts by factors

PHOTOGRAMMETRIC ENGINEERING & REMOTE SENSING, 1985
MP model p o i n t , z-coordinate PCx pro ject ion cent re , x-coordinate CPz control p o i n t , z-coordinate
Frc. 8. Redundancy numbers r,, and controllability and sensitivity factors 6; and Sa of height coordinates and of x- coordinates of projection centers of a block with 6 X 12 = 72 models, control point interval i = 6b, four pairs of tie points in the comers and projection centers (x, y, and z) per model. Comment: The values for the y- and z-coordinates of the projection centers are nearly independent of the location
within the block: i.e., y: ri = 0.44, 6& = 6.0, 6, = 1.6; z: ri = 0.40, 6; = 6.3, 6, = 0.3.
of 1.2 to 1.5 and 2, respectively. In blocks with in- dependent models with only four tie points, the lower bounds for detectable gross errors reach values of 22u, a_t the borders of the blocks. The sen- sitivity factors &,, of blocks with single tie points are larger by factors of about 1.1 to 1.5 and 1.5 to 3.0 for the interior and the border parts, respectively. The measurement of double tie points thus leads to a rather high reliability. Moreover, in case a tie point has to be eliminated, the connection is not lost and still can be controlled.
The two examples give a first impression about the reliability of photogrammetric coordinates, but provide no information about the dependency on the block parameters. The main result, however, is the high homogeneity of the values in the interior of the blocks. This indicates that the values are in- dependent of the block size and also of the shape of the block. It can be expected that the reliability will be affected by an increase in the tie point density or the overlap and that the controllability of the control points will also depend on the control point interval ilb.
Figure 10 summarizes the main results of the in- vestigation with regard to the reliability of the pho- togrammetric tie points. Here the maximum con- trollabiljty factors &d and the maximum sensitivity factors So, are given for the three areas of interest, the values for the comers being given separately.
The controllability of model coordinates obviously is increased when using more tie points, especially at the corner and the border parts. Changing from four tie points (S4) to double points (S8) already leads to an acceptable reliability of the coordinates (E,,, 5 5). Double blocks cannot really be made more reliable by increasing the tie point density.
The situation is different for bundle blocks. Using more tie points (S9 -* S18) does not increase the reliability, due to the already mentioned points in the middle of the strips, where additional points do not change the weak local geometry. The reliability of bundle blocks can be improved only by using higher coverage, i.e., 60 percent sidelap or two single blocks flown crosswise. Figure 11 shows that in all cases sensitivity values of 6, < 4 are achieved, even with single tie points.
The controllability of horizontal and vertical con- trol points is given in Figures 12 and 13 for single blocks. Double blocks will usually be applied in spe- cial cases in which high precision is demanded and the reliability of the control points will (hopefully) be guaranteed by geodetic means. Table 3 also con- tains approximations for the values of control points in the other areas of the blocks. The sensitivity values, which are not shown, can easily be obtained from S2, = 8;); - 8; and in most cases 8, = 6; as 6, << ti;,. The dependency of the reliability on the control point interval ilb is different for horizontal
RELIABILITY OF BLOCK TRIANGULATION
C P z : I n
FIG. 9. Redundancy numbers r,, and controllability and sensitivity factors ti;, and so, of x- and y- coordinates (top and bottom figure, respectively) of a bundle block with 6 x 13 = 84 images; point interval i = 6b; nine pairs of tie points at the standard positions.

PHOTOGRAMMETRIC ENGINEERING & REMOTE SENSING, 1985
6Ai f . ,O1independent models bundles
I single- double- single- double-block
- corner ---. ...... border
interior
FIG. 10. Maximum values 86, and of controllability and sensitivity of photogrammetric blocks (from Forstner, 1980).
and vertical control points. The factors 6; of hori- zontal control points increase approximately pro- portionally to the control point interval, whereas the controllability of vertical control points increases only with the square root of the interval ilb. This can be explained by the different control point pat- terns: single horizontal control points at the perim- eter versus chains of vertical control points across the block. The absolute values are rather high (8; > 10) even for small distances ilb.
Photogrammetric point determination can reach a high reliability. Summarizing, this is the conclu- sion which can be drawn from this investigation. The stable geometry of photogrammetric blocks is the reason for the good experiences gained in prac- tical application. The results, however, show the weak areas in photogrammetric blocks: the geodetic control, the perimeter of the blocks, and the points with only a few rays in bundle blocks.
The main result for project planning is the inde- pendence of the reliability on the block size and the block form and the moderate influence of the dif- ferent block parameters on each other. This could allow a separate discussion, especially of photograin- metric and geodetic observations. But, also, two dif- ferent types of application have to be distinguished: the determination of pass points for a subsequent mapping and the densification of highly accurate point fields.
Block triangulation as a basis for mapping needs only 20 percent sidelap. Because only pass points in the edges of the images are needed, also the bundle (only with self calibration) method can be used. The points in the middle of the strips than are no longer anymore used after the adjustment. Double points are reco~nmended in any case. This increases the reliability, while not requiring much additional effort for targeting or point transfer and for measuring. But what is more important, this
remedy also simplifies the error detection proce- dure, because the elimination of points does not weaken the connection. In blocks with independent models four pairs of tie points are sufficient. If, how- ever, self calibration is applied, tie points in the middle of the strips are also necessary in order to guarantee the determinability of the additional pa- rameters. Here single points suffice.
There are several possibilities to strengthen the border areas of the blocks:
Increasing of the tie point density at the perimeter of the block. Especially in independent model blocks this is a very effective action. Increasing of the block size by one strip or two base lengths in the strip direction, in order to keep the area of interest within the interior of the block, i .e . , one base length at the perimeter is not used for mapping. Bordering the block by a strip, which strengthens the perimeter. This is a variant of the previous remedy against the weak geometry (cf. Ackermann, 1966).
In all cases a high reliability can be obtained with sensitivity factors 6,, G 3, which guarantee the quality of the result.
In contrast to mapping applications, aerotrian- gulation for purposes of photogrammetric network dens$cation requires at least a four-fold overlap. With regard to reliability, 60 percent sidelap and cross flights are equivalent; cross flights, however, have advantages in compensating systematic errors. Because of the high overlap, each point can be mea- sured in at least four images, which guarantees a location of gross errors. Thus, no points are lost by the elimination of a single observation. Here the increase of the block by one base length is best for strengthening the border. The low sensitivity values - 6,, 4 achieved then make photograinmetric point determination comparable to geodetic densification, if not superior.
The reliability of the control points will always cause problems. Even for small control point inter- vals only controllability values around 86, = 10 are reached. Thus, it appears i~npossible to check the coordinates of the ground control during the ad- justment. This check has to be done and docu- mented by the geodesist.
Then only the targeting has to be kept under con- trol. Groups of control points are excellent for this purpose, too. The distribution of the points within the groups may consider the following recommen- dations:
The points should be determined as independently as possible and therefore may be laid wide apart. The points should belong to at least two models or three images in order to be able to distinguish pho- togrammetric and geodetic errors. Thus, one should avoid using a point in the corner of the block as a control point, but rather use some tie points at the border possibly together with a point more inside the block.

vertical control points.
9
30-
:
CP:
6'
54
, .* s9 50- . . s 11 ..F>s18 40-
Hes8 30-
CP:
a s i b l 4 * v. . r-
FIG. 11. Controllability factors 66 of horizontal control 2 4 6 1 +J i2 ir 16 11 20i lb
points, single blocks, corners.* FIG. 12. Controllability factors 66, of vertical control points, single blocks, corners.*
* The end points of the dashed lines result from blocks with only four horizontal control points and two chains of
CP:
FIG. 13. Redundancy numbers r i , and controllability and sensitivity factors 66, and SOi for the x-coordinates of the image points and for the x-, y-, and z-coordinates of the control points in a bundle block with 49 images; sidelap 60 percent, control point interval i = 2 base lengths, nine tie points and nine pairs of tie points pet. image. The values for the y-coordinates are achieved by mirroring the values at the 1ni1i11 tliugo~ii~l.
1147

Position of CP Block Type Tie Points within Block (6;),y2 Horiz. CP (8i,,)"ert. CP
Independent models
Bundles
corner border interior corner border interior corner border interior corner border interior
64 + 8 (ilb)" 56 + 1.9 (ilbY2
64 + 4 (ilb)" 40 + 1.2 (ilb)"
42 + 12.8 (db)" 30 + 3.7 (ilb)"
48 + 6.9 (ilb)" 30 + 2.1 (ilb)"
50 + 51 (ilb) 37 + 27 (ilb) 19 + 14 (ilb) 58 + 30 (ilb) 38 + 16 (ilb) 24 + 10 (ilb)
80 (ilb) 42 (ilb) 21 (ilb)
42 + 42 (ilb) 22 + 22 (ilb) 11 + 11 (ilb)
At least three points should be targeted, in order to be able to control the targeting by checking the similarity of triangles, thus to be independent of the local scale. If remeasurements are not possible or not wanted, one should use at least four points. Then a single gross error can be located without additional information. In case the distances be- tween the points within a group are small, the con- trollability is higher (due to the s~naller influence of the local scale). Then one needs one point less, i.e., two or three points at least, provided the points are rather independent.
When using groups of points, one must realize that a joint shift of the group is more difficult to detect than if one would use a single point, due to the higher weight of the group.
The joint effect of bordering, using double tie points and groups of control points, on the reliability is shown in Figure 14, which suinlnarizes the result of this investigation.
Thus, compared to the expedients which are nec- essary to reach a high precision, only a few addi- tional remedies have to be considered in order to guarantee a high quality of aerial triangulation.
Ackermann, F., 1966. On the Theoretical Accuracy of Pla- nimetric Block Triangulation, Photograininetria. 21, p p 145-170.
, 1979. The Concept of Reliability in Aerial Trian- gulation. Ricerche di Geodesia, Topografia e Foto- grammetria, cooperativa libraria universitaria del Po- lytecnico, Milano, N. l.
, 1981. Zuverllssigkeit photograrnmetrischer Blocke, Zeitschrift fiir Vennessungsu:esen, 106, pp. 401-410.
Baarda, W., 1967. Statistical Concepts in Geodesy, Neth- erlands Geodetic Coininission, New Series, Vol. 2, No. 4. Delft.
, 1968. A Testing Procedure for Use in Geodetic Networks, Netlz. Geod. Comm., Vol. 2, No. 5.
, 1973. S-Transformations and Criterion Matrices, Neth. Geod. Coinin., Vol. 5, No. 1.
, 1976. Reliability and Precision of Networks, Pres. Paper to VIIth Int. Course for Eng. Surveys of High Precision, Darmstadt.
Forstner, W., 1976. Statistical Test Methods for Blunder Detection in Plani~netric Block Adjustment, Pres. Paper Comtn. 111, ISP Congress, Helsinki 1976.
, 1978. Die Suche nach groben Fehlern in photo- 6 grain~netrischen Blocken, DGK C 240, Miinchen.
, 1979. On Internal and External Reliability of Pho- togra~ntnetric Coordinates, ASP-ASCM Convention, Washington.
, 1980. The Theoretical Reliability of Photogram- metric Coordinates, ISP Congress, Hamburg.
FIG. 14. Opti~nization of the reliability of a plani~netric block with independent models, four tie points per nod el - , 1983. Reliability and Discernability of Extended (a) given block, external reliability at control points, at Gauss-Markot; Models, DGK A98, Miinchen, pp. 79- border and interior of block; (b) optimized block, external 103. reliability at control points, border and interior of block Griin, A., 1982. The Accuracy Potential of the Modern
using groups of control points Bundle Block Adjustment in Aerial Photogrammetry, usine airs of tie ~ o i n t s Photograminetric Engineering and Remote Sensing, not ;ing the hatihed parts of the block VOI. 48, NO. 1, pp. 45-54.

RELIABILITY OF BLOCK TRIANGULATION
Kavouras, M., 1982. On the detection of outliers and the 1982. FOTEF-Data Snooping in Independent Model determination of reliability in geodetic networks, Triangulation; ISP Comm. 111 Symposium 1982, Hel- Techn. Rep. No. 87, Dept. of Surv. & Eng., Univer- sinki, Int. Arch. of Photogr., Vol. 24-111. sity of New Brunswick, Fredericton N.B. Canada. seminar, 1981. crobe ~ ~ t ~ ~ f ~ h l ~ ~ und die ~ ~ ~ ~ ~ l ~ ~ ~ i ~ -
pope, A., 1975. ~h~ statistics ~ ~ ~ i d ~ ~ l ~ and the D ~ - keit der photogram~netrischen Punktbestimmung. tection of outliers. presented paper to the X V I ~ ~ Schrijtenreihe des lnstituts fur Photogramtnetrie General Assembly of the IAG, Grenoble. Stuttgart, Heft 7.
Schwarz, P. G., M. Joosse, and G. M. W. J. Melissen, (Received 18 March 1983; accepted 11 March 1985)
Third International Colloquium Spectral Signature of Objects in Remote Sensing
Les Arcs, Bourg-Saint-Maurice, France 16-20 December 1985
This Colloquiuln of Working Group 3, Colninission VII, of the International Society for Photogrammetry and Remote Sensing-sponsored by the Association QuCbCcoise de TClCdCtection, Canadian Relnote Sensing Society, European Association of Keinote Sensing Laboratories, I.E. E.E. Ceoscience and Relnote Sensing Society, Remote Sensing Society, and SociCt6 Franpise de PhotograinnlCtrie et d e TClCdCtection and supported by the Centre National d'Etudes Spatiales (C.N. E. S.), European Space Agency (E. S.A.), and Institut National d e la Recherche Agronomique-has as its ol~jective to reunite specialists from different fields of study-physicists, agronomists, foresters, hydrologists, oceanologists-who are inter- ested in analyzing relationships between specific properties of a target (vegetative canopy, soil, rocks, water surfaces, snow, ice, etc.) and its spectral characteristics in different wavelength bands from ultra- violet to microwaves.
For further inforlnation please contact
M. Gerard Guyot or M. Michel Verbrugghe INRA Bioclilnatologie B.P. 91 F. 84140 Montfavet, France Tele. (90) 88 91 45