the representativeness heuristic - … the representativeness heuristic the a, b, c's of...
TRANSCRIPT

109
THE REPRESENTATIVENESSHEURISTIC
THE A, B, C's OF REPRESENTATIVENESS
According to Tversky and Kahneman (1974, p. 1124), people often judgeprobabilities "by the degree to which A is representative of B, that is, bythe degree to which A resembles B." Tversky and Kahneman called thisrule of thumb the "representativeness heuristic."
What are "A" and "B"? It depends on the judgment you are making. If
10
How do people come to their decisions? How do they choose among different options? And how do they form judgments of the value or likelihood of particular events or outcomes? This section of the book focuseson two related issues: the processes by which decision makers reachtheir conclusions, and the biases that can result as a consequence ofthese processes.
Amos Tversky and Daniel Kahneman (1974) have proposed that decision makers use "heuristics," or general rules of thumb, to arrive at theirjudgments. The advantage of heuristics is that they reduce the time andeffort required to make reasonably good judgments and decisions. Forexample, it is easier to estimate how likely an outcome is by using aheuristic than by tallying every past occurrence of the outcome anddividing by the total number of times the outcome could have occurred.In most cases, rough approximations are sufficient (just as people oftensatisfice rather than optimize).
Normally, heuristics yield fairly good estimates. The disadvantageof using heuristics, however, is that there are certain instances inwhich they lead to systematic biases (Le., deviations from normativelyderived answers). The heuristic discussed in this chapter is known as"representativeness," and it leads to very predictable biases in certainsituations. As mentioned earlier, the reason for focusing on biasesrather than successes is that biases usually reveal more of the underlying processes than do successes. In fact, virtually all current theories ofdecision making are based on the results of research concerning biasesin judgment.
CHAPTER

110 HEURISTICS AND BIASES
you are estimating the probability that A came from B, then A might bean instance or a sample, and B might be a category or a parent population. For example, A might be a person, B might be a group, and thejudgment in question might be the probability that A is a member of B.On the other hand, if you are trying to estimate the probability that Awas produced by B, then A might be an event or an effect, and B mightbe a process or cause. For instance, B might be the process of flippingan unbiased coin, A might be the event of getting six Heads in a row,and the judgment might concern the chances of observing such an eventwith an unbiased coin. Because this definition of representativeness isabstract and a little hard to understand, let's consider some concreteexamples of how the representativeness heuristic works and how it canlead to biases in certain situations.
Item #1 of the Reader Survey provides one example. This problem,taken from a study by Tversky and Kahneman (1982), reads as follows:
Linda is 31 years old, single, outspoken, and very bright. She majoredin philosophy. As a student, she was deeply concerned with issues ofdiscrimination and social justice, and also participated in antinucleardemonstrations. Please check off the most likely alternative:
o Linda is a bank teller.o Linda is a bank teller and is active in the feminist movement.
Most people feel that Linda is more likely to be a feminist bank tellerthan a bank teller. When Tversky and Kahneman (1982) put this question to 86 people, nearly 9 of every 10 respondents answered this way. Ifyou think about it, though, this response violates a fundamental rule ofprobability. The conjunction, or co-occurrence, of two events (e.g.,"bank teller" and "feminist") cannot be more likely than the probabilityof either event alone (e.g., "bank teller"). For this reason, Tversky andKahneman (1983) called this phenomenon the "conjunction fallacy" (seealso Leddo, Abelson, & Gross, 1984; Morier & Borgida, 1984).
You can verify the conjunction rule by looking at Figure 10.1. The circle on the left represents the universe of all bank tellers, the circle on theright represents the universe of all feminists, and the shaded area represents all banle tellers who are feminists. Because some bank tellers arenot feminists, the chances of being a bank teller (whether feminist ornot) will always be greater than the chances of being a bank teller whois feminist.
Just to make sure that people were not interpreting "bank teller" tomean "banle teller who is not active in the feminist movement," Tverskyand Kahneman (1982) ran additional experiments in which differentgroups of subjects were presented with a set of alternatives that included one of the alternatives from Item #1 but not the other (so that thetwo alternatives were never directly compared). Even in these experi-

THE ltEPRESENTATIVENESS HEURISTIC 111
Feminist bank tellers
Banktellers
FIGURE 10.1The overlapping worlds of bank tellers and feminists.
ments, subjects assigned a higher probability to Linda being a feministbanle teller than to Linda being a banlc teller.
Tversky and Kahneman (1982) also found similar results with problems about "Bill" (who was thought more likely to be an accountant andjazz player than simply a jazz player), a Wimbledon tennis player (whowas thought more likely to lose the first set but win the match than simply to lose the first set), and a former president of the United States(who was thought more likely to provide federal support for unwedmothers and to cut federal support to local governments than simply toprovide federal support for unwed mothers).
From results such as these, Tversky and Kahneman (1982, p. 98) concluded: "As the amount of detail in a scenario increases, its probabilitycan only decrease steadily, but its representativeness and hence itsapparent likelihood may increase. The reliance on representativeness,we believe, is a primary reason for the unwarranted appeal of detailedscenarios and the illusory sense of insight that such constructions oftenprovide.... For example, the hypothesis 'the defendant left the sceneof the crime' may appear less plausible than the hypothesis 'the defendant left the scene of the crime for fear of being accused of murder,'although the latter account is less probable than the former."
This conclusion is further supported by the way that most peoplerespond to Item #11 of the Reader Survey. This question asked which ofthe following two scenarios was more likely:

112 HEURISTICS AND BIASES
As with the bank teller pt'oblem, most people feel that the more specific event (an all-out war triggered by a third country) is more probablethan the more general everlt (an all-out war). Indeed, the Pentagon hasspent decades developing war plans and procuring weapons to handlehighly detailed but extremely improbable scenarios. According to Tversky and Kahnemanl specific scenarios appear more likely than generalones because they are more representative of how we imagine particularevents.
THE LAW OF SMALL NUMBERS
Another consequence of the representativeness heuristic is that peopletend to believe in what Tversky and Kahneman (1971) call "the law ofsmall numbers." The law of small numbers is a tongue-in-cheek reference to a law in statistics known as the law of large numbers (a law stating that the larger a sample you draw from a population, the closer itsaverage will be to the population average). A belief in the law of smallnumbers is a belief that random samples of a population will resembleeach other and the population more closely than statistical samplingtheory would predict.
For example, when people are asked to write down a randomsequence of coin tosses without actually flipping a coin, they often try tomake the string look random at every point (Kahneman and Tversky,1972, call this "local representativeness"). As a consequence, they tendto exclude long runs and include more alternations between Headsand Tails than you would normally find in a chance sequence. In achance sequence, there are many points at which the series does notlook random at all. To verify this fact, you can approximate a chancesequence by tossing a coin 100 times and recording the pattern of Headsand Tails.
An illustration of the law of small numbers is given in Item #15 of theReader Survey. This problem comes from a study by Tversky and Kahneman (1971), and it runs as follows:
THE REPRESENTATIVENESS HEURISTIC 113
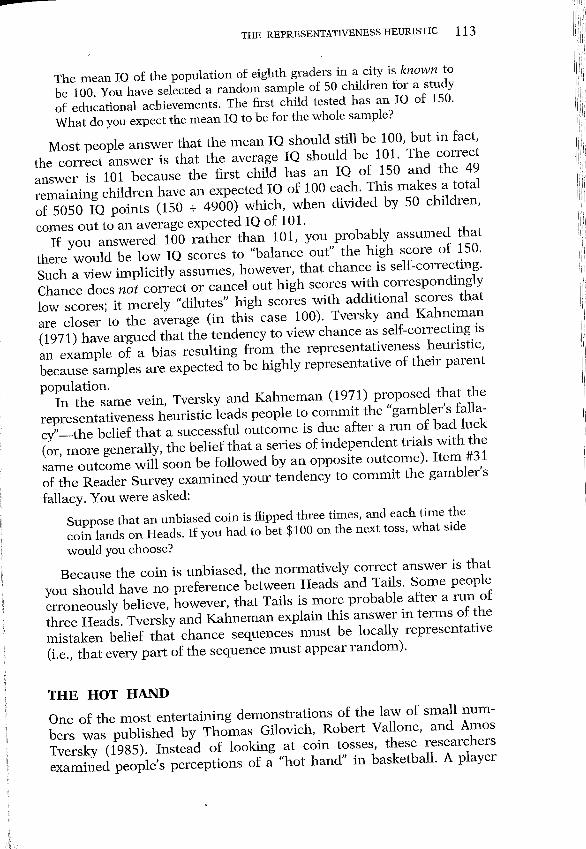
The mean 10 of the population of eighth graders in a city is known tobe 100. You have selected a random sample of 50 children for a studyof educational achievements. The first child tested has an 10 of 150.What do you expect the mean 10 to be for the whole sample?
Most people answer that the mean 10 should still be 100, but in fact,the correct answer is that the average 10 should be 101. The correctanswer is 101 because the first child has an 10 of 150 and the 49remaining children have an expected 10 of 100 each. This makes a totalof 5050 10 points (150 + 4900) which, when divided by 50 children,comes out to an average expected 10 of 101.
If you answered 100 rather than 101, you probably assumed thatthere would be low 10 scores to "balance out" the high score of 150.Such a view implicitly assumes, however, that chance is self-correcting.Chance does not correct or cancel out high scores with correspondinglylow scores; it merely "dilutes" high scores with additional scores thatare closer to the average (in this case 100). Tversky and Kahneman(1971) have argued that the tendency to view chance as self-correcting isan example of a bias resulting from the representativeness heuristic,because samples are expected to be highly representative of their parent
population.In the same vein, Tversky and Kahneman (1971) proposed that the
representativeness heuristic leads people to commit the "gambler's fallacy"-the belief that a successful outcome is due after a run of bad luck(or, more generally, the belief that a series of independent trials with thesame outcome will soon be followed by an opposite outcome). Item #31of the Reader Survey examined your tendency to commit the gambler's
fallacy. You were asked:Suppose that an unbiased coin is flipped three times, and each time thecoin lands on Heads. If you had to bet $100 on the next toss, what sidewould you choose?
Because the coin is unbiased, the normatively correct answer is thatyou should have no preference between Heads and Tails. Some peopleerroneously believe, however, that Tails is more probable after a run ofthree Heads. Tversky and Kahneman explain this answer in terms of themistaken belief that chance sequences must be locally representative(i.e., that every part of the sequence must appear random).
THE HOT HANDOne of the most entertaining demonstrations of the law of small numbers was published by Thomas Gilovich, Robert Vallone, and AmosTversky (1985). Instead of looking at coin tosses, these researchersexamined people's perceptions of a "hot hand" in basketball. A player

114 HEURISTICS AND BIASES
with a hot hand (also known as a "streak shooter" or an atWete "on aroll") is a player who has a better chance of making a basket after one ormore successful shots than after having missed a shot.
What Gilovich, Vallone, and Tversky discovered is that Philadelphia76er basketball fans-and several players and coaches as well-perceived streak shooting when statistical analyses showed that none existed. That is, people thought that the chances of making a basketincreased after a player had made several successful shots, when intruth the chances of making the next basket were not significantly different from the player's overall probability of making a basket. Gilovichand his associates found the same results with free-throw records fromthe Boston Celtics and with laboratory experiments (or, more precisely,gymnasium experiments) on men and women from Cornell's varsity basketball teams.
For a short time, these findings created a national uproar in thesports community. How could Gilovich, Vallone, and Tversky say thatstreak shooting was simply an illusion? Anyone who has played orwatched basketball knows that players are sometimes hot or cold! Basketball teams even alter their strategies in order to defend against streakshooters. The idea that basketball shots made by the same player arestatistically unrelated seems very hard to swallow.
In order to find out why people strongly perceive streak shootingwhen successes and failures are statistically independent of one another, Gilovich, Vallone, and Tversky (1985) conducted an experiment inwhich subjects viewed six different series of X's and O's (which youmight think of as "hits" or "misses" in a basketball game). Each seriescontained 11 X's and 10 O's, and the probability of alternating betweenthe two letters was set at 040, .50, .60, .70, .80, or .90. For example, thestring "xoxoxoooxxoxoxooxxxox" represented an alternationprobability of .70 (because it alternated between X and 0 on 14 of 20possible alternations).
Gilovich, Vallone, and Tversky found that subjects selected the .70and .80 sequences as the best examples of a chance series, rather thancorrectly selecting the .50 sequence. The sequence with a .50 probabilityof alternation was classified as a chance series by only 32 percent of thesubjects. Indeed, 62 percent of the subjects classified the .50 sequence as"streak shooting."
To see how you would have performed on this task, take a look atyour answer to Item #38 of the Reader Survey. The first string(XOXXXOOOOXOXXOOOXXXOX) alternates on half of all possibleoccasions (similar to what might be expected from a chance series).In contrast, the second sequence (XOXOXOOOXXOXOXOOXXXOX)represents an alternation probability of .70-far higher than the .50expected by chance alone. If you thought that the first sequence contained runs that were too long to have been generated randomly, you
THE REPRESENTATIVENESS HEURISTIC 115
NEGLECTING BASE RATES
were expecting too many alternations between X and 0 in theseries (just as people do when they see "streak shooting" in chancesequences). Chapter 14 discusses the perception of randomness ingreater detail.
In some instances, a reliance on representativeness leads people toignore "base rate" information (a base rate is the relative frequency withwhich an event occurs). Kahneman and Tversky have demonstrated thistendency in a series of experiments. In one study, for example, Kahneman and Tversky (1973, p. 241) told subjects that:
A panel of psychologists have [sic] interviewed and administeredpersonality tests to 30 engineers and 70 lawyers, all successful in theirrespective fields. On the basis of this information, thumbnaildescriptions of the 30 engineers and 70 lawyers have been written. Youwill find on your forms five descriptions, chosen at random fromthe 100 available descriptions. For each description, please indicateyour probability that the person described is an engineer, on a scalefrom 0 to 100.
For example, here is a thumbnail description that Kahneman andTversky intended to be fairly representative of an engineer:
Jack is a 45-year-old man. He is married and has four children. He isgenerally conservative, careful, and ambitious. He shows no interest inpolitical and social issues and spends most of his free time on his manyhobbies which include home carpentry, sailing, and mathematicalpuzzles.
Using the same five thumbnail descriptions, Kahneman and Tverskyalso gave a second group of subjects identical instructions with the proportion of engineers and lawyers reversed (that is, 70 engineers and 30lawyers), but because the results are comparable, we will focus exclusively on the condition with 30 engineers.
Once subjects rated the probability that each of the five people mightbe an engineer, they were asked to estimate the probability that someone randomly selected from the pool of 100 descriptions (a personabout whom they were given no information) would be an engineer. Notsurprisingly, on average subjects rated the chances that a randomly chosen person would be an engineer as roughly 30 percent. In other words,they used the base rate given in the problem.
On the other hand, when subjects were provided with descriptiveinformation-even information that had nothing to do with being anenginee, or lawyer-they tended to ignore base rates. For example, Kahneman and Tversky (1973) deliberately constructed the following portrait to be equally descriptive of an engineer or a lawyer:

116 HEURISTICS AND BIASES
Dick is a 30-year-old man. He is married with no children. A man ofhigh ability and high motivation, he promises to be quite successful inhis field. He is well liked by his colleagues.
Such a description is entirely uninformative with respect to Dick'sprofession; consequently, the probability of being an engineer in thiscase should be equal to the base rate of 30 percent. Kahneman andTversky (1973) found, however, that subjects given this description gavea median probability estimate of 50 percent. Apparently, subjectsignored the base rate information and simply judged the description asequally representative of an engineer or a lawYer.
A good deal of research has investigated the conditions under whichpeople tend to use or neglect base rate information (Bar-Hillel, 1980,1990; Fischhoff & Bar-Hillel, 1984; Osberg & Shrauger, 1986). Forexample, leek Ajzen (1977) found that people often use base rate information when it is consistent with their intuitive theories of cause andeffect. In one experiment, Ajzen asked subjects to predict a student'sgrade point average based on either causal factors (such as the numberof hours per week the student studied) or noncausal information (suchas the student's weekly income). Ajzen found that people used base ratesmore often when the information was causal than when it was noteven when they were told that the noncausal factors predicted gradepoint average just as well as the causal factors.
NONREGRESSIVE PREDICTION
People also tend to neglect the diagnosticity of the information onwhich they base their predictions, and as a result, they make "nonregressive" predictions. For example, Item #35 of the Reader Survey(based on a problem from Kahneman and Tversky, 1973) posed the following question:
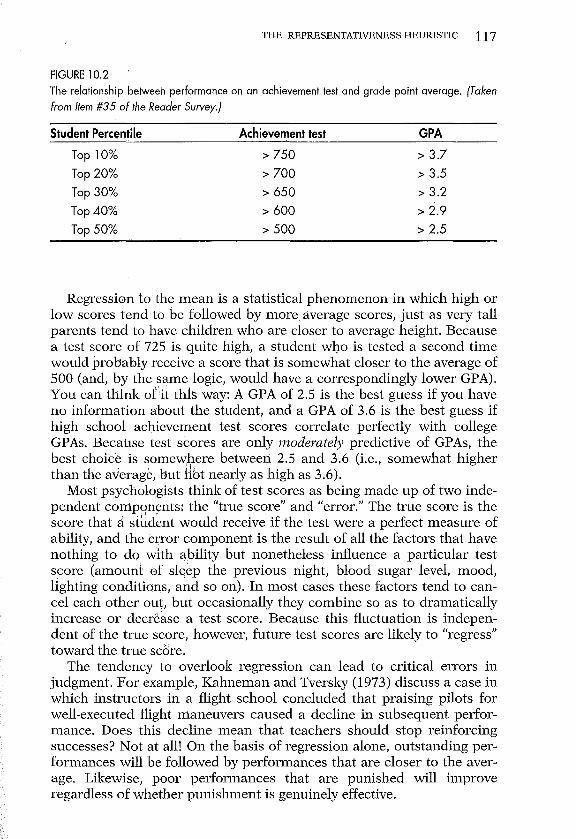
Suppose that scores on a high school academic achievement test aremoderately related to college grade point averages (GPAs). Given thepercentiles below [shown in Figure 10.2], what GPA would you predictfor a student who scored 725 on the test?
How did you respond? Most people predict a GPA between 3.5 and3.7 (a GPA highly "representative" of a 725 test score). This answermakes sense if the achievement test is perfectly diagnostic of a student'sGPA. If there is an exact correspondence between test scores and GPAs,then a score of 725 would translate into a GPA of about 3.6. Accordingto the problem, though, scores on the achievement test are not perfectpredictors of GPA. The problem states that scores on the test are only"moderately related to college grade point average." Because test scoresare only moderately predictive of GPA, the best GPA prediction liesbetween 3.6 and the average GPA of 2.5-thereby allowing for "regression to the mean."
THE REPRESENTATIVENESS HEURISTIC 117
FIGURE 10.2The relationship between performance on an achievement test and grade point average. (Takenfrom Item #35 of the Reader Survey.)
Student Percentile Achievement test GPA
Top 10% > 750 >3.7
Top 20% > 700 > 3.5
Top 30% > 650 > 3.2
Top 40% > 600 > 2.9
Top 50% > 500 > 2.5
Regression to the mean is a statistical phenomenon in which high orlow scores tend to be followed by more average scores, just as very tallparents tend to have children who are closer to average height. Becausea test score of 725 is quite high, a student w1}.o is tested a second timewould probably receive a score that is somewhat closer to the average of500 (and, by the same logic, would have a correspondingly lower GPA).You can think ofit this way: A GPA of 2.5 is the best guess if you haveno information about the student, and a GPA of 3.6 is the best guess ifhigh school achievement test scores correlate perfectly with collegeGPAs. Becatlse test scores are only moderately predictive of GPAs, thebest choice is somewhere between 2.5 and 3.6 (i.e., somewhat higherthan the aVerage, but Hbt nearly as high as 3.6).
Most psych~logists think of test scores as being made up of two independent components. the "true score" and "error." The true score is thescore that a st~d~nt would receive if the test were a perfect measure ofability, and the error component is the result of all the factors that havenothing to do with ability but nonetheless influence a particular testscore (amount of sleep the previous night, blood sugar level, mood,lighting conditions, and so on). In most cases these factors tend to cancel each other out, but occasionally they combine so as to dramaticallyincrease or decrease a test score. Because this fluctuation is independent of the true score, however, future test scores are likely to "regress"toward the true score.
The tendency to overlook regression can lead to critical errors injudgment. For example, Kahneman and Tversky (1973) discuss a case inwhich instructors in a flight school concluded that praising pilots forwell-executed flight maneuvers caused a decline in subsequent performance. Does this decline mean that teachers should stop reinforcingsuccesses? Not at all! On the basis of regression alone, outstanding performances will be followed by performances that are closer to the average. Likewise, poor performances that are punished will improveregardless of whether punishment is genuinely effective.

118 HEURISTICS AND BIASES
In their book on human inference, Richard Nisbett and Lee Ross(1980, pp. 163, 165) describe some additional consequences of misinterpreting regression:
Such mislabeling of simple regression phenomena (whereby extremelygood or bad performances will, on the average, be followed by lessextreme performances whenever there is an element of chance in suchperformances) is common in everyday experience. One disconcertingimplication of such mislabeling is that measures designed to stem a"crisis" (a sudden increase in crime, disease, or bankruptcies, or asudden decrease in sales, rainfall, or Olympic gold medal winners) will,on the average, seem to have greater impact than there actually hasbeen. . . . Superstitions about what one must change to end a "badstreak" of outcomes, or must not change for fear of ending a "goodstreak," will arise from the observation of simple regressionphenomena.
George Gmelch (1978, August), a professional baseball player wholater became a social science researcher, chronicled several examples ofsuch superstition in an article entitled "Baseball Magic." According toGmelch, the New York Giants refused to clean their uniforms during a16-game winning streak for fear of "washing away" their good fortune.Similarly, Leo Durocher wore the same black shoes, grey slacks, bluecoat, and knotted tie for three and a half weeks while the BrooklynDodgers clinched a pennant victory in 1941.
Regression toward the mean can also explain why highly successfulathletes and teams tend to experience a drop in performance immediately after appearing on the cover of Sports Illustrated magazine. Athletes typically appear on the cover following an unusually good performance, and from regression alone, a decline in performance would beexpected. The "Sports Illustrated Jinx," as it is known, is not a jinx atall-most likely, it is nothing more than regression to the mean.
CLINICAL VERSUS ACTUARIAL PREDICTION
The tendency people have to neglect information on base rates and diagnosticity contributes to a very surprising and embarrassing state ofaffairs. As documented in nearly 100 studies in the social sciences(Dawes, Faust, & Meehl, 1989), the accuracy of "actuarial" predictions(predictions based solely on empirical relations between a given set ofvariables and an outcome) is equal to or better than the accuracy of"clinical" predictions (predictions based on the judgment of humanbeings). In other words, contrary to common sense, predictions are usually more accurate when they are not made by a human decisionmaker-even when the decision maker has full access to actuarial information.

THE REPRESENTATIVENESS HEURISTIC 119
CONCLUSION
Research on the representativeness heuristic suggests several ways toimprove judgment and decision making skills, including the followingtips:
For example, in one study on clinical prediction, the judgments of 21psychiatric staff members were compared with the weight of patients'compensation claim files in predicting readmission for psychiatric care(Lasky, Hover, Smith, Bostian, Duffendack, & Nord, 1959). The weightof claim files was used as a crude measure of past hospitalizations. As itturned out, staff judgments were not significantly more accurate in predicting readmission than were folder weights (the correlations were .62and .61, respectively).
Apparently, the expertise of staff members and the advantage of having additional information were more than offset by other factors.Because clinical judges generally rely on heuristics such as representativeness-and are therefore susceptible to a variety of biases-their predictions are rarely more accurate than predictions based exclusively onactuarial relations.
Y' Don't Be Misled by Highly Detailed Scenarios. The very specificity that makes detailed scenarios seem representative alsolessens their likelihood. In general, the more specific a scenario is,the lower its chances are of occurring-even when the scenarioseems perfectly representative of the most probable outcome.
Y' Whenever Possible, Pay Attention to Base Rates. Base rates areparticularly important when an event is very rare or very common. For example, because the base rate is so low, many talentedapplicants never get admitted to graduate school (and it would bea mistake to interpret nonadmission as indicating that an applicant lacks academic ability). Conversely, because the base rate isso high, many unskilled drivers are awarded a driver's license.When base rates are extreme, representativeness is often a fallibleindicator of probability.
Y' Remember That Chance Is Not Self-Correcting. A run of badluck is just that: a run of bad luck. It does not mean that an equivalent run of good luck is bound to occur, and it does not meanthat things are doomed to stay the same. If a chance process (liketossing an unbiased coin) has a certain probability of producing acertain outcome, past events will have no effect on future outcomes.
Y' Don't Misinterpret Regression Toward the Mean. Even thougha run of bad luck is not necessarily balanced by a run of good luck(or vice versa), /extreme performances tend to be followed by more

120 HEURISTICS AND BIASES
average performances. Regression toward the mean is typical whenever an outcome depends in part upon chance factors. Every once inawhile these factors combine to produce an unusual performance,but on subsequent occasions, performance usually returns to normal.
By keeping these suggestions in mind, it is possible to avoid many ofthe biases that result from a reliance on the representativeness heuristic. Chapter 11 focuses on another well-known heuristic, I~availability,"
and the biases that often result from it.