the republic of the philippines - iro.phiro.ph/article_doc/f23d9444_rop us ndr - roadshow...
TRANSCRIPT

December 2013
Resilient Against All Odds
The Republic of the Philippines

This document does not constitute or form part of and should not be construed as an offer to sell or issue or the solicitation of an offer to buy or acquire securities of the Republic of the Philippines (the “Republic ”) or as an inducement to enter into investment activity. No part of this document, nor the fact of its distribution should form the basis of, or be relied on in connection with, any contract or commitment or investment decision whatsoever. This document is not financial, legal, tax or other product advice.
This document has been prepared by the Republic based on information available to them for use at a non-deal road show presentation by the Republic for selected recipients for information purposes only and does not constitute a recommendation regarding any securities of the Republic. The information has not been independently verified. No representation, warranty or undertaking, express or implied, is made as to, and no reliance should be placed on, the fairness, accuracy, completeness or correctness of the information or the opinions contained herein. None of the Republic or any of its advisors or representatives shall have any liability whatsoever (in negligence or otherwise) for any loss howsoever arising from any use of this document or its contents or otherwise arising in connection with the document.
This document is being given solely for your information and for your use and this document, or any portion thereof, may not be shared, copied, reproduced or redistributed to any other person in any manner.
The statements contained in this document speak only as at the date as of which they are made, and the Republic expressly disclaims any obligation or undertaking to supplement, amend or disseminate any revisions to any statements contained herein to reflect any change in events, conditions or circumstances on which any such statements are based. By preparing this document, none of the Republic, its representatives or their respective advisors undertakes any obligation to provide the recipient with access to any additional information or to update this document or to correct any inaccuracies in any such information which may become apparent.
This document may contain forward-looking statements based on the currently held beliefs and assumptions of the Republic, which are expressed in good faith and, in their opinion, reasonable. Forward-looking statements involve known and unknown risks, uncertainties and other factors, which may cause the actual economic results, financial condition, performance, or achievements of the Republic to differ materially from the economic results, financial condition, performance or achievements expressed or implied by such forward-looking statements Given these risks, uncertainties and other factors, recipients of this document are cautioned not to place undue reliance on these forward-looking statements.

Outline
I. Update – Typhoon Yolanda and Impact on the Philipp ines ........................4
II. Investment Grade Philippines – Sovereign Credi t Highlights ……………..6
III. Powerful Reform Momentum – Gains in Governance and Supportive Political Backdrop ………………………………………………….26

I. Update – Typhoon Yolanda and Impact on the Philipp ines

� Landfall on 11/8/2013
� Sustained winds of 270kph (168mph) with gusts up to 312kph (194mph)
� State of National Calamity declared by the President. Local governments units of Samar, Leyte, Cebu, Iloilo, Capiz, Aklan & Palawan have also declared state of calamity in their respective areas
� Estimated damage over PHP 27.8 billion (USD 634.4m) to date*
� PHP 15.6bn (USD 354.5m) to infrastructure
� PHP 12.3bn (USD 279.9m) to agriculture
� PHP 631.0m (USD 14.4m) worth of relief assistance has been provided to affected families*
Impact and Response to Super Typhoon Yolanda (Haiya n)Assessment of the damage and funding the recovery
5
� Power has been restored in 33% of municipalities and the Government targets to restore power in all municipalities before Christmas
� All air and sea ports affected are open for commercial flights and sea vessels except Tacloban airport
� All national roads in affected areas have been cleared and are now passable
� The government is implementing cash for work program which employs Yolanda victims for clearing and cleaning operations, and reconstruction of schools and government buildings
� DPWH has started to construct bunkhouses in Tacloban City and Palo, Leyte as temporary shelter for disaster victims
Super Typhoon Yolanda: Immediate Response
� 5,598 reported dead*
� 1,759 persons missing*
� 26,136 injured*
� 1,095 evacuation centers sheltering 48,239 families (219,158 people )*
The government has imposed price controls on basic goods and
commodities in the affected areas and is in charge of the use of funds
for rescue, recovery, relief, and rehabilitation efforts
ROP Response: Progress in Impacted Areas
Funding the Recovery
Sources: Bangko Sentral ng Pilipinas (BSP), National Economic and Development Authority (NEDA), and National Disaster Risk Reduction and Management Council (NDRRMC)* Figures as of November 29, 2013, 6:00 a.m. Exchange rate used is USD1=PHP43.884
� Foreign nations and international organizations have pledged USD 414.6 million (PHP 18.2bn) in cash and kind.* Status of donations can be viewed in www.gov.ph under the Foreign Aid Transparency Hub (FAiTH)
� ROP has ample fiscal space to spend for relief efforts. Actual expenditure for Jan-Sep 2013 was 5.0% below program; overall fiscal deficit for Jan-Sep 2013 was PHP 101.2bn, well within the program of PHP 144.5bn for the same period and PHP 238.0bn for 2013
� Under the proposed 2014 budget, PHP 55.5 billion (USD 1.26bn) will be earmarked for reconstruction of affected areas

II. Investment Grade Philippines – Sovereign Credit Highlights

2005 vs. Latest
2005 Latest Change
Sovereign Credit Ratings
Fitch Ratings BB BBB- (Mar 2013)
Standard and Poor’s BB- BBB- (May 2013)
Moody’s Investors Service B1 Baa3 (Oct 2013)
GDP Growth Rate 4.8 7.4 (Jan-Sep 2013)
GDP Per Capita1 (USD), PPP concept 3,061 4,381 (2012)
GNI Per Capita1 (USD), PPP concept 3,855 5,770 (2012)
National Government Interest (% of Revenue) 36.7 20.4 (Jan-Sep 2013)
Fiscal Balance (% of GDP) (2.6) (1.2) (Jan-Sep 2013)
General Government Debt (% of GDP) 59.2 38.5 (end-Mar 2013)
Gross International Reserves (USD bn) 18.5 83.6 (end-Oct 2013)
Import Cover (months) 3.8 11.9 (end-Oct 2013)
OF Remittances (USD bn) 10.7 18.2 (end-Sep 2013)
External Debt Service Burden (% of CAR) 12.6 7.6 (Jan-Aug 2013)
Current Account (% of GDP) 1.9 4.2 (Jan-Jun 2013)
Sources: BSP, NEDA, Department of Finance (DOF)1/ At current prices
ROP Achieves Investment Grade from Fitch, S&P and M oody'sImproved credit metrics over the past 7 years
7

6.87.7 7.67.0
0
1
2
3
4
5
6
7
8
Singapore Taiwan Korea India Thailand Malaysia Vietnam Indonesia Philippines China
FY 2012
Q1 2013
Q2 2013
Q3 2013
Sources: National Statistical Coordination Board (NSCB)
The Philippines is one of the fastest growing and m ost dynamic economies in Asia
Real GDP Growth (%)
Robust Economic Outperformance in AsiaROP’s economy has grown faster than most peers
8
2012 Q1-Q3 2012 Q1-Q3 2013GDP Growth (constant, base year = 2000) 6.8% 6.7% 7.4%
By Industrial Origin Share to GDPGrowth Share Growth
Share to GDPGrowth
Rate to GDP Rate RateAgri, Fishery, Forestry and Hunting 11.1 2.8 10.7 2.0 10.1 1.1Industry 32.0 6.8 31.8 6.1 32.5 9.8
Of which: Manufacturing 22.1 5.4 21.8 5.4 22.3 9.8Services 56.9 7.6 57.5 8.0 57.4 7.3By ExpenditureHousehold Final Consumption 70.4 6.6 69.0 6.7 67.8 5.6Government Final Consumption 10.3 12.2 11.1 13.0 11.6 12.3Capital Formation 18.5 -3.2 16.9 -8.5 19.6 24.4
Of which: Fixed Capital 20.3 10.4 19.9 17.2 21.1 14.0
of which: Public Construction 1.8 29.8 1.7 37.0 2.1 31.8
Private Construction 6.4 11.5 6.1 3.7 4.3 11.5Exports 48.4 8.9 52.6 8.9 48.3 -1.4Imports 47.6 5.3 49.5 4.5 48.0 4.4

443.1
299.5
506.5
657.3 672.3
281.3
384.5
0
100
200
300
400
500
600
700
800
2008 2009 2010 2011 2012 Jan-Jul 2012 Jan-Jul 2013
Broad-based growth highlights overall health of the economy
Sources: NSCB, Department of Trade and Industry (DTI)*Philippines, Indonesia, Malaysia, Thailand, Vietnam
Decade of rapid and sustained economic growth is se t to continue
Strong and Consistent Growth
� The Philippines is one of the fastest growing nations in Asia, GDP growth in the first nine months of 2013 is 7.4%
� Philippine growth is increasingly broad based with particular strength coming from services and the resurgence of the industry sector led by construction and manufacturing
� Government’s focus on attracting investment and facilitating infrastructure development coupled with the nation’s favourable demographics will help propel economic growth in the long term
Real GDP Growth (% yoy)
9
Continued increase in foreign investment inflows in to the Philippines
BOI-PEZA Approved Investments (PHP bn) � Investors are beginning to take note of improving investment climate
and governance in the ROP
� Infrastructure development is accelerating with private and public construction increasing 16.3% in the first nine months of 2013
� Budgetary allocation for public infrastructure increased by 17.7% in 2013
� ROP posted the highest FDI growth rate of 54% in ASEAN* in 2012
Note: Figures are at constant 2000 prices
5.0
6.7
4.85.2
6.6
4.2
1.1
7.6
3.9
6.6 6.77.4
012345678
2003 2004 2005 2006 2007 2008 2009 2010 2011 2012 1Q-3Q
2012
1Q-3Q
2013
2003 - 2012Average: 5.2%
+36.7% yoy

201520102010
20052005
19951990
198519801980
1965
20502050
204520402040
20302025
202020152015
1995
1950 1970 1990 2010 2030 2050 2070
PhilippinesIndia
MalaysiaVietnam
IndonesiaThailand
ChinaKorea
SingaporeHong Kong
Japan
� The median age in the Philippines is only 22.2 years, well below other “young” countries in Asia, such as Malaysia (25), India (25.1), Indonesia (27.8) and Vietnam (28.2)
� According to United Nations’ population projections, in 2015 the Philippines will enter its Demographic Window, when the proportion of the population that is of working age is particularly prominent
� The Philippines is the last major Asian economy to benefit from this demographic dividend, which is typically associated with accelerated economic growth
� Extended periods of high GDP growth in Asia’s fastest-growing economies have coincided with countries entering their Demographic Windows. On average, growth over the 10-year period following the beginning of the Demographic Window has been 7.3%
Sources: UN World Population to 2030, UN World Population Prospects (2010 Revision)IMF World Economic Outlook
1/ Defined as the period when population under 15 years old drops below 30% and population over 65 years old is less than 15%.
Youngest population in Asia supports a strong mediu m-term economic growth outlook
Philippines has the youngest population in Asia
Demographic Windows1 in Asia
Poised for strong future GDP growth
Avg. GDP Growth for First 10-years in Dem. Window (%)*
10.3
9.08.2 8.1 7.8 7.4 7.0
6.25.4
3.3
0
2
4
6
8
10
12
Chi
na
Kor
ea
Indi
a
Japa
n
Sin
gapo
re
Hon
g K
ong
Vie
tnam
Indo
nesi
a
Mal
aysi
a
Tha
iland
10
Demographics to Support Continued Fast GrowthReaping the demographic dividend will help medium-t erm growth
*For nations that have not yet been in their demographic windows for 10 years, the figure is an average of their growth rate for the time in the window

Less Vulnerable to External Trade Shocks Diversified export markets and ROP is well-position ed to benefit from US and Japan recovery
ROP’s export markets are well diversified with Euro pe and China accounting for only a small portion of total exports
Exports by Destination (USD bn)
� The Republic, while remaining less trade dependent than most countries in Asia, has diversified its exports markets and is therefore less exposed to the lower consumption and slower growth experienced in much of Europe and a slowing China
� In addition to being less trade dependent, exports to both China and Europe account for only a small portion of total exports for the ROP, further insulating the economy from growth uncertainties emanating from those two regions
� Despite marginal decline of exports to Europe in 2012, ROP’s total volumes of exports have actually increased, highlighting the nation’s strong resiliency
� ROP is well-positioned to benefit from economic recoveries in the U.S. and Japan, the Philippines’ major exports markets
Source: National Statistics Office (NSO)11
8.5 8.4 7.9 6.6 5.9 5.9 4.6 4.7
5.7 5.5 2.9 5.7 6.1 6.2
4.8 4.8
7.3 7.7 6.2
7.8 8.9 9.8 7.7 8.2
8.6 8.2
6.8 7.6 7.1 7.4
5.8 5.5
20.4 19.3
14.6
23.8 20.0 22.7
17.2 16.8
0
10
20
30
40
50
60
2007 2008 2009 2010 2011 2012 Jan-Sep 2012 Jan-Sep 2013
Others United States Japan China Europe
Ability to Meet Debt Obligations
2
34
1
Automatic Appropriation for Public Debt
Service
Sound Debt Management
Strategy
Strengthening Fiscal
Framework
Bond Sinking Fund
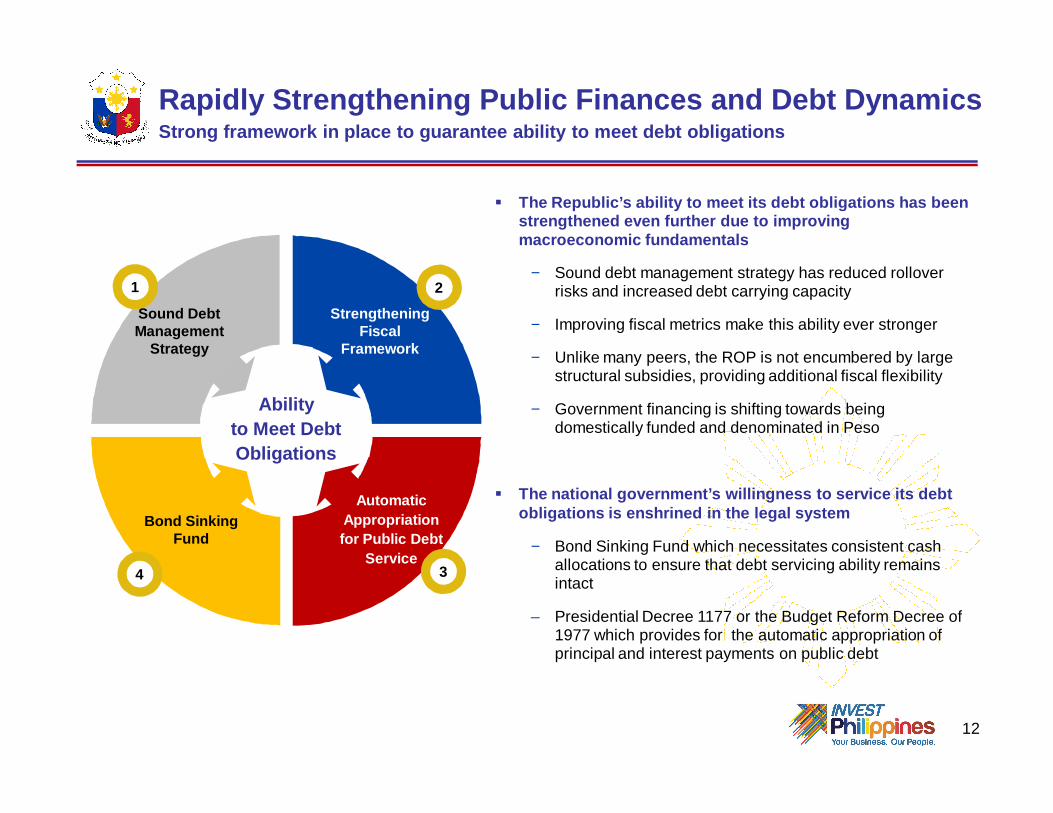
� The Republic’s ability to meet its debt obligations has been strengthened even further due to improving macroeconomic fundamentals
− Sound debt management strategy has reduced rollover risks and increased debt carrying capacity
− Improving fiscal metrics make this ability ever stronger
− Unlike many peers, the ROP is not encumbered by large structural subsidies, providing additional fiscal flexibility
− Government financing is shifting towards being domestically funded and denominated in Peso
� The national government’s willingness to service it s debt obligations is enshrined in the legal system
− Bond Sinking Fund which necessitates consistent cash allocations to ensure that debt servicing ability remains intact
– Presidential Decree 1177 or the Budget Reform Decree of 1977 which provides for the automatic appropriation of principal and interest payments on public debt
Rapidly Strengthening Public Finances and Debt Dyna micsStrong framework in place to guarantee ability to m eet debt obligations
12

On track to meet 2013 deficit target
Sources: Bureau of the Treasury (BTr), Department of Budget and Management (DBM) *Note: Some values may not sum up to exact figure due to rounding
Improved Fiscal Metrics Creating a sustainable fiscal revenue and spending path
(in Billion Pesos)Jan-Sep 2013
ActualJan-Sep 2012
Actual% Growth
2012 v. 20132013
% of GDP
Total Revenues 1,266.6 1,118.9 13.2 15.3
Tax Revenues 1,134.1 996.8 13.8 13.7
Bureau of Internal Revenues
898.0 772.5 16.2 10.8
Bureau of Customs 224.6 213.7 5.1 2.7
Non-Tax Revenues 132.4 122.1 8.4 1.6
Bureau of the Treasury 68.1 65.1 4.6 .8
Privatization .3 .5 (40.0) 0
Expenditure 1,367.8 1,222.9 11.8 16.5
Surplus/(Deficit) (101.2) (103.9 ) (2.6) (1.2)
Primary Surplus 156.9 141.3 11.0 1.9
13

14
Fiscal Consolidation On TrackFiscal performance further solidifies under the Aqu ino Administration
2013 Deficit-to-GDP is expected to be lower than pr ogram
Fiscal Performance (PHP bn) and Deficit/GDP (%)
1,13
7
1,20
3
1,12
3
1,20
8 1,36
0
1,53
5
1,26
7
1,14
9
1,27
1
1,42
2
1,52
2 1,55
8
1,77
8
1368
0.20.9
3.73.5
2.02.3
1.20
1
2
3
4
5
0
300
600
900
1,200
1,500
1,800
2007 2008 2009 2010 2011 2012 Jan-Sep 2013
Revenues (LHS) Expenditures (LHS) Deficit/GDP (RHS)
Aquino Administration Takes Office June 2010
Improving revenue buoyancy due to rapid revenue gro wth
12-Month Rolling Revenue Growth (%)
17.2%
5.9%
8.9%
-20%
-10%
0%
10%
20%
30%
Feb
-09
Mar
-09
Apr
-09
May
-09
Jun-
09Ju
l-09
Aug
-09
Sep
-09
Oct
-09
Nov
-09
Dec
-09
Jan-
10F
eb-1
0M
ar-1
0A
pr-1
0M
ay-1
0Ju
n-10
Jul-
10A
ug-1
0S
ep-1
0O
ct-1
0N
ov-1
0D
ec-1
0Ja
n-11
Feb
-11
Mar
-11
Apr
-11
May
-11
Jun-
11Ju
l-11
Aug
-11
Sep
-11
Oct
-11
Nov
-11
Dec
-11
Jan-
12F
eb-1
2M
ar-1
2A
pr-1
2M
ay-1
2Ju
n-12
Jul-
12A
ug-1
2S
ep-1
2O
ct-1
2N
ov-1
2D
ec-1
2Ja
n-13
Feb
-13
Mar
-13
Apr
-13
May
-13
Jun-
13Ju
l-13
Aug
-13
Sep
-13
Bureau of Internal Revenue Bureau of Customs Other Offices
Sources: DOF

10 4
90 96 100 100 100 100
0
20
40
60
80
100
2003 2005 2010 2011 2012Long-term: >10yrs Medium-term: 1yr to 10yrShort-term: <1yr
Increasing reliance on domestic financing sources
Sources: DBCC (as of Feb 2013), BTr*Pertains to National Government debt
Share of external debt to national government debt has been gradually declining over the years
Debt Breakdown (% of total)*
Domestic debt mix has become longer dated
Domestic Debt Breakdown (% of total)*
External debt is all long-dated with maturity profi les exceeding 10 years
External Debt Breakdown (% of total)*
ROP Funding Becoming Increasingly Domestic
Jan-Sep 2013
15
Financing increasingly completed domestically, enha ncing ROP’s debt sustainability
Financing by Domestic and Foreign Sources (% of total)*
5666 65
84 94 86
4434 35
166
14
0
20
40
60
80
100
2009 2010 2011 2012 Jan-Sep 2013
2013 Program
Foreign Domestic
51 52 56 56 59 57 56 58 5864 65
49 48 44 44 41 43 44 42 4236 35
0
20
40
60
80
100
2003 2004 2005 2006 2007 2008 2009 2010 2011 2012 Jan-Sep 2013External Domestic
3225
1910 8 9
3431
2620 14 11
3544
54
7078 80
0
20
40
60
80
100
2008 2009 2010 2011 2012 Jan-Sep 2013
Long-term: >10yrs Medium-term: 1yr to 10yr Short-term: <1yr

Sources: BTr, DOF, Standard & Poors 16
Sustained declines in ROP’s government debt ratios
Debt- to-GDP Ratio (%)
54.8
52.450.9 51.5
48.9 49.5
44.3 43.541.4 40.6
38.5
30
40
50
60
2009 2010 2011 2012 Q1 2013 Q2 2013
National Gov't Debt General Gov't Debt
35.436.9 36.7
31.7
23.6 22.624.8 24.4
20.5 20.4
0
5
10
15
20
25
30
35
40
2003 2004 2005 2006 2007 2008 2009 2010 2011 2012
Increased ability to service debt
Interest Payments/Revenue (%)
Strengthening Government FinancesDeclining debt ratios and interest payments support ROP’s credit
� Government finances in the Philippines continue to strengthen with sustained and rapid declines in government debt ratios
� ROP’s general government debt ratio of 38.5% as of Q1 2013 is below S&P’s BBB category median of 41%
� The Republic’s effective debt management strategy resulted in increased ability to service debt as the portion of revenue that goes to interest payments has drastically declined over the years from a high of 36.9% in 2004 to 20.4% at end Q32013.

Key Fiscal Reforms
Bureau of Internal Revenue’s
Administrative Reforms
� Run After Tax Evaders (RATE) Program
� Re-engineering of business processes
� Electronic Tax Information Systems (eTIS) Project
� Organizational and Management Development Program/Rationalization Plan (RATPLAN)
Bureau of Customs’
Administrative Reforms
� Run After The Smugglers (RATS) Program
� Cleansing of the List of Accredited Importers and Consignees by the Interim Customs Accreditation and Registration unit (ICARE)
� Integrate National Single Window (NSW) with Electronic to Mobile System (E2M)
� Intensive utilization of the Post Entry Audit Group (PEAG)
� Strengthening the Valuation Reference Information System
Sources: DOF, BIR and BOC 17
� Fiscal Incentives Rationalization
� Review of the Fiscal Regime of the Mining Sector
� Tax Incentives Management and Transparency Act
� The Customs Modernization and Tariff Bill
Legislative Agenda
Fiscal Reforms and Programs for 2013 and BeyondFocus to ensure that positive momentum in governmen t finances will continue

Gen. Public Service17.3%
Defense4.5%
Social Service34.9%
Economic Service25.4%
Debt Burden18.0%
2013 Empowerment Budget for Inclusive DevelopmentThe PHP 2.006 trillion 2013 budget prioritizes inves tments on Social Services
By Sector By Expense Class
Greater and deeper commitment to empowering the peo ple as nation-builders through transparent, account able and participatory governance
2013 Adjusted Budget (%)
18
� Record 2013 PHP 2,006 billion “Empowerment Budget” is 10.5% larger than the 2012 “Results-Focused Budget” of PHP 1,816 billion. The budget includes increased spending on public services that provide jobs, education, health care, housing and empowering each Filipino to participate in economic activity
� Social services sector received the biggest share of the budget at PHP 699.4 billion, growing by 14.0% from 2012
� Greater openness and deeper public engagement transpired in crafting the budget by involving members of civil society, people’s groups, and communities representing the country’s most marginalized and impoverished
Sources: Office of the President
Personal Services
31.9%
Maintenance & Other
Expenditures17.2%
Other Current Operating
Expenditures12.4%
Capital Outlays20.5%
Debt Burden18.0%

0%
2%
4%
6%
8%
10%
12%
14%
Headline Inflation Lower Bound of Target Upper Bound of Target
0%
2%
4%
6%
8%
10%
12%
14%
0
1,000
2,000
3,000
4,000
5,000
6,000
7,000
2002 2003 2004 2005 2006 2007 2008 2009 2010 2011 2012 2013
M3 (LHS) Bank lending rates (RHS) Reverse repurchase rate (RHS)
Sound and Stable Inflation EnvironmentMonetary policy settings remain supportive of robus t and non-inflationary growth
Sources: BSP 19
Firm control over inflation has proven the effectiv eness and credibility of monetary policy
Headline Inflation (%)
Ample liqidity and low interest-rate environment supportive of healthy economic growth
Money Supply and Interest Rates (PHP bn, %)
September 2013: PHP 6,202.6bn
Jan-September 2013: 5.81%
September 2013: 3.50%
Jan - Oct 2013 – 2.8%
October 2013 – 2.9%
2002 2003 2013201220112010200920082007200620052004
Global inflationary cycle

38
39
40
41
42
43
44
45
46
Jan-
12F
eb-1
2M
ar-1
2A
pr-1
2M
ay-1
2Ju
n-12
Jul-
12A
ug-1
2
Sep
-12
Oct
-12
Nov
-12
Dec
-12
Jan-
13F
eb-1
3M
ar-1
3
Apr
-13
May
-13
Jun-
13Ju
l-13
Aug
-13
Sep
-13
Oct
-13
Nov
-13
Peso Performance Supports Macroeconomic StabilityEffective monetary policy contributes to low PHP vo latility
20Sources: Bloomberg as of 24 November 2013
PHP 43.86
-19.4%
-15.0%
-7.0%
-5.2%
-4.0%
2.4%
-20% -15% -10% -5% 0% 5%
IDR
INR
PHP
MYR
THB
CNY
PHP performance remains broadly in line with other regional currencies
2013 YTD Change vs USD
PHP has stabilized since potential QE tapering was f irst announced in May 2013
USD/PHP Exchange Rate

3,818
2.7
0%
2%
4%
6%
8%
10%
12%
14%
16%
0
500
1,000
1,500
2,000
2,500
3,000
3,500
4,000
4,500
2004
2005
2006
2007
2008
2009
2010
2011
2012
Aug
-13
Loans Outstanding (LHS) (PHP bn) NPL Ratio (RHS) (%)
Prudent NPL coverage ratios will ensure that the ba nking system is well–prepared for any unforeseen shocks
NPL Coverage Ratio (%)
Banks continue to fortify their balance sheets with increased capitalization, well above international norms
Capital Adequacy Ratio (%)
� The Philippines’ banking system remains healthy
� The banking system continues to improve its asset quality, with the universal and commercial banks’ NPL ratio at 2.7% as of Aug 2013
� Bank balance sheet continues to strengthen through increased capitalization and high loan-loss reserves
� Banks remain funded predominately through domestic deposits and not through wholesale channels, reducing liquidity and funding risk and minimizing potential contagion from the lingering uncertainty in the Euro-zone
Sources: BSP*Banking system statistics refers to Universal and commercial banks data
Healthy Banking System a Key IG CredentialROP exhibits an exceptionally healthy and resilient banking system
Asset quality of the banking system remains extreme ly strong with an NPL ratio of only 2.7%
Gross Loans (PHP bn) and NPL Ratios (%)
21
18%19%
5%
7%
9%
11%
13%
15%
17%
19%
2004 2005 2006 2007 2008 2009 2010 2011 2012 1Q2013CAR, solo CAR, consolidated
BSP Regulatory Requirement: 10%
International Standard: 8%
129%
40%
60%
80%
100%
120%
140%
160%
2004
2005
2006
2007
2008
2009
2010
2011
2012
Sep
-13

Banking System Poses Minimal RiskRelatively smaller banking system limits potential contingent liabilities
Potential contingent liabilities of the banking sec tor is smaller than peers given relatively smaller size
Domestic Credit to Private Sector (% of GDP)1
Strong deposit base supports banking sector funding
Gross Loans-to-Deposits Ratio (%)
� Banking sector remains well-funded through domestic deposits – prudent and conservative underwriting standards and credit have kept system loans-to-deposit ratio low at 68.7% as of June 2013
� Reduces the probability of banks seeking emergency funding from the sovereign in times of stress
� Minimal risk of credit-fueled asset bubbles that threaten many other Asian nations with high growth rates
� Banking system assets remain small relative to the total size of the economy compared to major peers - even in the extremely unlikely scenario that a banking system crisis were to occur, potential government contingent liabilities for the ROP would still be lower than peers
Sources: BSP, World Bank1Based on 2012 World Bank data
22
73.372.4
69.3
70.969.7
68.1
64.5
70.0
73.5
68.7
60
62
64
66
68
70
72
74
76
2004
2005
2006
2007
2008
2009
2010
2011
2012
Jun-
13147.6
131.6
118.2
148.0
33.4
34.9
0 50 100 150 200
Thailand
China
Malaysia
Korea
Philippines
Indonesia

Sources: BSP, NSCB
Robust External Profile Despite External ChallengesStructurally strong balance of payments bolsters ex ternal finances
The Philippines enjoys a structurally positive BOP
Balance of Payments (USD m)
� ROP’s current account continues to be in surplus supported by robust remittances from overseas Filipino workers (“OFWs”), substantial Business Process Outsourcing (“BPO”) revenues and increasing tourism receipts
� BOP surplus sustained at USD 3.8bn as of end-Oct 2013
� While exports remain relatively subdued due to the global economic environment, the Philippines nonetheless posted a 7.6% yoy growth of total exports in 2012, highlighting the relative resiliency of exports despite global uncertainty
� In 2012, FDI grew 54% to USD 2.8bn from USD 1.8bn in 2011, the sharpest rise among ASEAN countries
-202 810 115-280
2,4103,769
8,557
89
6,421
14,308
-5,000
0
5,000
10,000
15,000
20,000
2001 2002 2003 2004 2005 2006 2007 2008 2009 2010
Capital and Financial Accounts
Current Account
Net Unclassified Items
Balance of Payments
BOP Statistics beginning in 2011 are based on IMF’s BPM6
BOP Statistics for 2001 to 2010 are based on IMF’s BPM5
23
11,400
9,236
1,3162,577
2011 2012 1H 2012 1H 2013 p/

2.53.0
3.8
1.2 1.3
0.0
0.5
1.0
1.5
2.0
2.5
3.0
3.5
4.0
2010 2011 2012 Q1 2012 Q1 2013
Structural Consistent Current Account SurplusesStrong support provided by remittances, tourism, an d BPO
Sources: BSP, Department of Tourism, Information Technology and Business Processing Association of the Philippines 24
Strong and stable rise in remittances over the year s
Overseas Filipinos’ Cash Remittances (USD bn)
Tourism is a growing source for national growth
International Visitor Receipts (USD bn)
BPO – a strong driver of employment and revenues
BPO Employment (‘000s) and Revenues (USD bn)
� The Republic’s balance of payments is supported by a structural current account surplus due to robust OF emittances as well as rapidly expanding tourism and BPO sectors
8.6
10.7
12.8
14.5
16.417.3
18.8
20.1
21.4
15.616.5
0
5
10
15
20
25
2004
2005
2006
2007
2008
2009
2010
2011
2012
Jan-
Sep
20
12
Jan-
Sep
20
13
+5.8% yoy
1.52.4
3.24.8
6.17.1
8.9
11.0
13.4
0
2
4
6
8
10
12
14
16
0
100
200
300
400
500
600
700
800
900
2004 2005 2006 2007 2008 2009 2010 2011 2012Employment ('000) (LHS) Revenues (USD bn) (RHS)

Sources: BSPNote: October GIR preliminary
International reserves provide strong buffers to an y BOP problems
Adequate International Reserves and Declining Debt Ratios
25
ROP is effectively protected against any balance of payment shocks through adequate international reserves
FX Reserves (USD Bn) and Months of Import Cover
� ROP currently enjoys a healthy level of international reserves of USD 83.6bn as of end-October 2013, enough to cover 11.9 months of total imports
� The Republic’s foreign exchange reserves now exceeds gross external debt
� Strong reserve buildup is a prudent measure to guard against external shocks and underscores the ability of ROP to pay back any foreign currency denominated debt
� The Philippines is now a net external creditor nation to the IMF, a relatively rare occurrence for a nation at the Philippines level of development
� Furthermore, the Philippines is a fully participating member of the Chiang Mai Initiative and the BSP has in addition negotiated several large bilateral foreign currency swap agreements with China, Korea, and Japan, enhancing the strength of ROP’s external and FX positions
External debt-to-GDP ratio has significantlydeclined, underscoring the health of external finan ces
External Debt (USD Bn) and External Debt / GDP (%)
17.1 16.2 18.523.0
33.837.6
44.2
62.4
75.3
83.8 83.6
4.0x 3.6x 3.8x 4.2x
5.8x 6.0x
8.7x 9.5x
12.1x 11.9x 11.9x
–
2x
4x
6x
8x
10x
12x
14x
16x
18x
20x
0
10
20
30
40
50
60
70
80
90
2003
2004
2005
2006
2007
2008
2009
2010
2011
2012
Oct
-13
FX Reserves (LHS) # Months of Import Cover (RHS)
5554
54 5554
55
6060 60
6160.2
52.7
44.137.1
31.3 32.630.1
27.024.1 21.8
0
10
20
30
40
50
60
70
50
52
54
56
58
60
62
2004
2005
2006
2007
2008
2009
2010
2011
2012
Aug
-13
External Debt (USD bn) (LHS) External Debt/GDP (RHS)

III. Powerful Reform Momentum – Gains in Governance a nd Supportive Political Backdrop

Real progress being made in helping the poor
Net Satisfaction with the National Administration on Helping the Poor (%)
Administration has a strong national mandate and vi ewed as sincere in fighting graft and corruption
Net Satisfaction with the National Administration on Eradicating Graft and Corruption (%)
C.AQUINO RAMOS ESTRADA ARROYO B.AQUINO
Widespread Support for the Aquino AdministrationStrong mandate by the public to improve governance
Record satisfaction rankings for the Aquino Adminis tration provide popular backing for reforms
Net Satisfaction with General Performance of the National Administration (%)
27Sources: 2013 SWS Survey Review (23 September 2013), Social Weather Station National SurveysNet figures (% Satisfied minus % Dissatisfied) correctly rounded.
-60
-40
-20
0
20
40
60
80
1989 1990 1991 1992 1993 1994 1995 1996 1997 1998 1999 2000 2001 2002 2003 2004 2005 2006 2007 2008 2009 2010 2011 2012 2013
+66

Delivery of Public Services Improved
Legislation and Policy Review
Transparency
Disclosure of Official Acts
Public Access to Information
Punitive Measures
Anti-Corruption Efforts
Performance Management
Preventive Measures
Improving Public
ReSourcesManagement
Citizen Engagement
Participation in Governance
Partnership & Constituency
Building
Establishing Results-Oriented
Management
Enhancing Frontline & Regulator Processes
Good Governance and Anti-Corruption
Accountability
Corruption CurbedBusiness
Environment Enhance
Enforcement of LawsDigitization and
InnovationAdvocacy and
Communication
Good Governance and Anti-Corruption remain front an d center
Improving Governance Framework
Continued focus on Good Governance and Anti-Corrupt ion is already reaping results, with more to come
Sources: DBM 28

ROP has shown improvements in governance and compet itiveness indicators
• Zero Based Budgeting to improve expenditure management
• Pocket Open Skies to support tourism potential
• Peace Agreement to unleash Mindanao’s potential
• Sin Tax Law to further strengthen the fiscal position
• Reproductive Health Act to improve family health planning
• Judicial Reform to enhance the regulatory environment and ensure level playing field
Strong political will to
pursue and implement
difficult reforms
Results are Significant - Good Governance is Winning Out
The reforms that the Republic has been implementing in past years are already bearing fruit as confirm ed by improved rankingsof the country from third party assessors
29
Third Party Report Latest Previous Change
World Bank’s 2014 Ease of Doing Business Report
108 /189 133/185 +25
Transparency International 2012 Corruption Perception Index
105/179 129/183 +24
World Bank 2013 Worldwide Governance Indicators’Regulatory Quality*
52 45 +7
IMD 2013 World Competitiveness Report
38/60 43/59 +5
Heritage Foundation 2013 Economic Freedom Index
97/177 107/179 +10
Thomson Reuters/INSEADAsia Business Sentiment Survey** (Q3 2013 vs Q2 2013)
100 94 +6
Grant Thornton 2013 Global Dynamism Index
21/60 46/50 +25
* Percentile Ranking
* * % of Respondents with positive outlook on the Philippines

GlobalCompetitiveness Rankings
2010 - 2011 2011 - 2012 2012 - 2013 2013 - 2014
Overall Rank 85 10 75 10 65 6 59
Institutions 125 8 117 23 94 17 79
Infrastructure 104 -1 105 7 98 2 96
MacroeconomicEnvironment
68 14 54 18 36 -4 40
Health and Primary Education
90 -2 92 -6 98 2 96
Higher Education and Training
73 2 71 7 64 -3 67
Goods Market Efficiency
97 9 88 2 86 4 82
Labor Market Efficiency
111 -2 113 10 103 3 100
Financial Market Development
75 4 71 13 58 10 48
Technological Readiness
95 12 83 4 79 2 77
Market Size 37 1 36 1 35 2 33
Business Sophistication
60 3 57 8 49 - 49
Innovation 111 3 108 14 94 25 69
� The Philippines has improved by 26 spots in the WEF Global Competitiveness Rankings over the past four years, making it one of the most improved countries in the world during this period
� Sub-rankings in Institutions and Innovation have in particular improved dramatically, improving 46 and 42 positions, respectively, over the past 3 years
� Improving governance and the economy have been key areas of focus for the Aquino Administration
� Proof that ROP is making real progress in improving governance and institutions
� Strong improvement in Innovation implies a bright future for the Philippines andhigher value-added services
SIgnificant improvements for the Republic in the W orld Economic Forum Global Competitiveness Rankings
30Sources: World Economic Forum Global Competitiveness Rankings
A Structurally More Competitive NationConsistent improvements in competitiveness
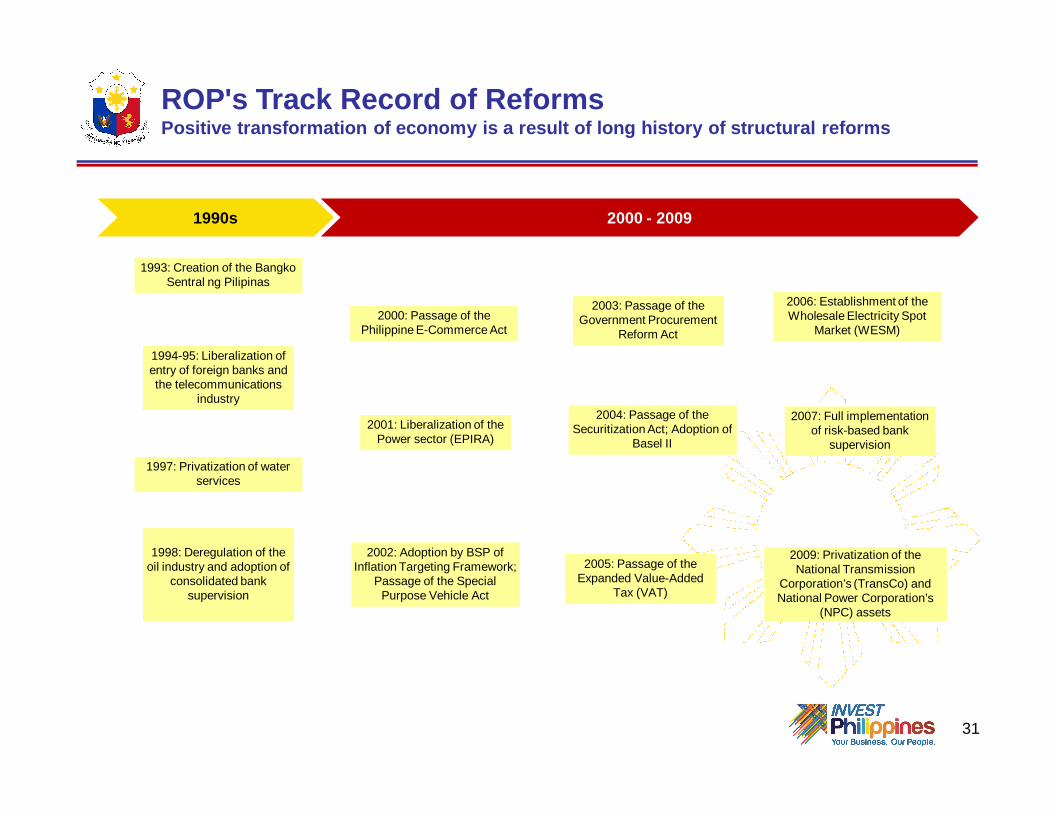
1997: Privatization of water services
1997: Privatization of water services
2002: Adoption by BSP of Inflation Targeting Framework;
Passage of the Special Purpose Vehicle Act
2002: Adoption by BSP of Inflation Targeting Framework;
Passage of the Special Purpose Vehicle Act
2001: Liberalization of the Power sector (EPIRA)
2001: Liberalization of the Power sector (EPIRA)
2000: Passage of the Philippine E-Commerce Act
2000: Passage of the Philippine E-Commerce Act
2007: Full implementation of risk-based bank
supervision
2007: Full implementation of risk-based bank
supervision
2006: Establishment of the Wholesale Electricity Spot
Market (WESM)
2006: Establishment of the Wholesale Electricity Spot
Market (WESM)
2003: Passage of the Government Procurement
Reform Act
2003: Passage of the Government Procurement
Reform Act
2004: Passage of the Securitization Act; Adoption of
Basel II
2004: Passage of the Securitization Act; Adoption of
Basel II
1998: Deregulation of the oil industry and adoption of
consolidated bank supervision
1998: Deregulation of the oil industry and adoption of
consolidated bank supervision
2005: Passage of the Expanded Value-Added
Tax (VAT)
2005: Passage of the Expanded Value-Added
Tax (VAT)
1994-95: Liberalization of entry of foreign banks and the telecommunications
industry
1994-95: Liberalization of entry of foreign banks and the telecommunications
industry
31
1990s 2000 - 2009
1993: Creation of the BangkoSentral ng Pilipinas
1993: Creation of the BangkoSentral ng Pilipinas
2009: Privatization of the National Transmission
Corporation’s (TransCo) and National Power Corporation’s
(NPC) assets
2009: Privatization of the National Transmission
Corporation’s (TransCo) and National Power Corporation’s
(NPC) assets
ROP's Track Record of ReformsPositive transformation of economy is a result of l ong history of structural reforms

ROP's Track Record of Recent ReformsProven ability to institute critical reforms
Reinvigorated implementation of programs against corrupt
officials, tax evaders and smugglers
Reinvigorated implementation of programs against corrupt
officials, tax evaders and smugglers
Set up the Debt Management Office at the
Department of Finance
Set up the Debt Management Office at the
Department of Finance
Applied Zero Based Budgeting Approach in
preparing the 2011 Budget
Applied Zero Based Budgeting Approach in
preparing the 2011 Budget
Launched PPP Program Launched PPP Program
Implementation by the Bureau of Customs (BOC)
of Electronic to Mobile System; Enhancement of the agency’s post-entry
audit capability
Implementation by the Bureau of Customs (BOC)
of Electronic to Mobile System; Enhancement of the agency’s post-entry
audit capability
Issued guidelines on the adoption of Philippine
Financial Report Standards (PFRS) 9: Adopted phased-
immigration to Basel III
Issued guidelines on the adoption of Philippine
Financial Report Standards (PFRS) 9: Adopted phased-
immigration to Basel III
Passage of the Government-Owned-and-Controlled Corporations
(GOCCs) Governance Act of 2011
Passage of the Government-Owned-and-Controlled Corporations
(GOCCs) Governance Act of 2011
Bureau of Customs National Single Window
Bureau of Customs National Single Window
Enhanced Business Name Registration System
Enhanced Business Name Registration System
Program Budgeting ApproachProgram Budgeting Approach
Nationwide Launch of Philippine Business
Registry Facility
Nationwide Launch of Philippine Business
Registry Facility
Launched Food Staples Sufficiency Program
Launched Food Staples Sufficiency Program
Passage of Amendments to Sin Tax Law; Amendments
to the Anti-Money Laundering
Act of 2001, and Reproductive Health Law
Passage of Amendments to Sin Tax Law; Amendments
to the Anti-Money Laundering
Act of 2001, and Reproductive Health Law
Issued EO 29 on Open Skies Policy
Issued EO 29 on Open Skies Policy
Issued EO 79 Institutionalizing and Implementing Reforms in the Philippine Mining Sector
Providing Policies and Guidelines to Ensure
Environmental Protection and Responsible Mining in the
Utilization of Mineral Resources
Issued EO 79 Institutionalizing and Implementing Reforms in the Philippine Mining Sector
Providing Policies and Guidelines to Ensure
Environmental Protection and Responsible Mining in the
Utilization of Mineral Resources
Enacted RA 10574 "An Act Allowing the Infusion of
Foreign Equity in the Capital of Rural Banks
Enacted RA 10574 "An Act Allowing the Infusion of
Foreign Equity in the Capital of Rural Banks
Bangsamoro Peace Framework SignedBangsamoro Peace Framework Signed
2010 2011 2012 2013
32

Pipeline Developmental Reforms and Programs Accelerating reforms to achieve sustainable and inc lusive growth
Amendments to the Build Operate Transfer Law or RA
7718
Amendments to the Build Operate Transfer Law or RA
7718
Amendments to the Anti-Money Laundering Act
Amendments to the Anti-Money Laundering Act
Amendments to the Bangko Sentral ng Pilipinas
Charter
Amendments to the Bangko Sentral ng Pilipinas
Charter
Customs Modernization andTariff Act (CMTA)
Customs Modernization andTariff Act (CMTA)
Full implementation of the Government Integrated Financial Management Information Systems
(GIFMIS) in 2013
Full implementation of the Government Integrated Financial Management Information Systems
(GIFMIS) in 2013
Site or Location for National Government Infrastructure
Projects
Site or Location for National Government Infrastructure
Projects
Removal of Investment Restrictions in Specific
Laws cited in the Foreign Investment Negative List
(FINL)
Removal of Investment Restrictions in Specific
Laws cited in the Foreign Investment Negative List
(FINL)
Amendments to RA8974 or the Act to Facilitate the Acquisition
of Right-of-Way
Amendments to RA8974 or the Act to Facilitate the Acquisition
of Right-of-Way
Rationalization of the Mining Fiscal RegimeRationalization of the Mining Fiscal Regime
Amendments to the Cabotage Law
Amendments to the Cabotage Law
Tax Incentives Management and Transparency Act
Tax Incentives Management and Transparency Act
33
2013 & Beyond January 2014
Rationalization of Fiscal Incentives Law
Rationalization of Fiscal Incentives Law
January 2014: Implementation of
Basel III
January 2014: Implementation of
Basel III
December 2013
Resilient Against All Odds
The Republic of the Philippines