the results of the current curriculum student survey spring 2002 department of planning and research
TRANSCRIPT

The Results of The Results of The Current Curriculum The Current Curriculum
Student Survey Student Survey Spring 2002Spring 2002
Department of Planning and ResearchDepartment of Planning and Research

MethodologyMethodology
Two Surveys were done:Two Surveys were done: The first was a paper survey and The first was a paper survey and
distributed by faculty through curriculum distributed by faculty through curriculum classesclasses
2,464 were distributed, 1,187 were completed 2,464 were distributed, 1,187 were completed (return rate 48.2%)(return rate 48.2%)
The second was an HTML survey and The second was an HTML survey and distributed via email to all distance distributed via email to all distance education students for whom CWW had education students for whom CWW had emailsemails
Surveys were distributed to all 2,304 students Surveys were distributed to all 2,304 students in distance courses and 362 were completed in distance courses and 362 were completed and submitted (return rate 16%)and submitted (return rate 16%)

Survey HighlightsSurvey Highlights Overall, students were satisfied with Overall, students were satisfied with
instructional elements and instructional elements and student/college servicesstudent/college services
There was great variation in what There was great variation in what students considered importantstudents considered important
Students at South and West Campus Students at South and West Campus were more satisfied than students at were more satisfied than students at other campusesother campuses
College without Walls students rated College without Walls students rated elements of instruction and elements of instruction and student/college services higher than student/college services higher than traditional classroom studentstraditional classroom students

Specific HighlightsSpecific Highlights Approximately 10% of curriculum Approximately 10% of curriculum
students use a language other than students use a language other than English in their homesEnglish in their homes
46.3% of CPCC curriculum students 46.3% of CPCC curriculum students are fist generation college studentsare fist generation college students
22% of students attended classes at 22% of students attended classes at more than one campusmore than one campus
The majority of curriculum students The majority of curriculum students are attending CPCC to earn a are attending CPCC to earn a credential (associate degree, credential (associate degree, certificate or diploma)certificate or diploma)

Specific Highlights, continuedSpecific Highlights, continued
Curriculum students are getting Curriculum students are getting youngeryounger 58.2% were under 25 in 2002 compared to 58.2% were under 25 in 2002 compared to
45.2% in 200045.2% in 2000 Fewer curriculum students are Fewer curriculum students are
employed compared to two years ago employed compared to two years ago unemployment rose over the past two unemployment rose over the past two
years from 16.5% 2000 to 21.5% in 2002years from 16.5% 2000 to 21.5% in 2002 the percentage of students working full-the percentage of students working full-
time decreased from 47.8% in 2000 to time decreased from 47.8% in 2000 to 34.4% in 200234.4% in 2002

Specific Highlights, continuedSpecific Highlights, continued Curriculum students are earning less Curriculum students are earning less
moneymoney The percentage of CPCC students The percentage of CPCC students
earning less than $20,000 per year earning less than $20,000 per year increased from 42% in Spring 2000 to increased from 42% in Spring 2000 to 54.4% in 200254.4% in 2002
A greater percentage of College A greater percentage of College Without Walls students are Without Walls students are employed fulltime, have college employed fulltime, have college degrees and are interested in degree degrees and are interested in degree programs when compared to programs when compared to traditional studentstraditional students
22% of students attend classes at 22% of students attend classes at more than one campusmore than one campus

Recommending CPCCRecommending CPCC
97.4% would recommend CPCC 97.4% would recommend CPCC to a friend, family member or to a friend, family member or colleague colleague 70.1% without reservation and 70.1% without reservation and
27.3% with some reservation27.3% with some reservation 97.1% were somewhat to very 97.1% were somewhat to very
satisfied with their overall satisfied with their overall experience at CPCCexperience at CPCC

Demographic CharacteristicsDemographic CharacteristicsCurriculumCurriculum CWWCWW
Gender:Gender: MaleMale 47.7%47.7% 22.3%22.3%FemaleFemale 52.3% 52.3% 77.7%77.7%
Age:Age: <21 <21 33.4%33.4% 17.0%17.0%21-2521-25 24.5%24.5% 0 026-3026-30 13.4%13.4% 20.4% 20.4% 31-4031-40 15.1%15.1% 36.1% 36.1% 41-5041-50 9.4% 9.4% 2.1% 2.1%51+51+ 4.1% 4.1% 5.4% 5.4%
Race:Race: WhiteWhite 65.0%65.0% 73.7%73.7%BlackBlack 23.5%23.5% 18.5%18.5%AsianAsian 4.0% 4.0% 3.4% 3.4%HispanicHispanic 3.5% 3.5% 1.7% 1.7%Native Amer.Native Amer. 1.2% 1.2% .9% .9%OtherOther 2.8% 2.8% 2.8% 2.8%

Level of Education Prior to Level of Education Prior to Enrolling at CPCCEnrolling at CPCC
CurriculumCurriculumCWWCWW
StudentsStudentsStudentsStudents
< 12 years< 12 years 4.0% 4.0% .6% .6%HS/GEDHS/GED 50.7% 50.7% 33.7%33.7%Some collegeSome college 31.5% 31.5% 41.2%41.2%AA or ASAA or AS 5.6% 5.6% 9.2% 9.2%BA or BSBA or BS 6.1% 6.1% 10.9%10.9%Some grad school 1.2%Some grad school 1.2% 1.4% 1.4%MastersMasters .5% .5% 3.1% 3.1%Doctorate/ProfDoctorate/Prof .3% .3% 0 0

When Students Prefer to When Students Prefer to Attend ClassAttend Class
CurriculumCurriculum CWWCWW
StudentsStudentsStudentsStudents
DaytimeDaytime 72.7%72.7% 45.5%45.5%
EveningEvening 51.9%51.9% 48.6%48.6%
WeekendWeekend 5.9% 5.9% 6.0% 6.0%
Both Day/Eve.Both Day/Eve. 26.8%26.8% NANAParticipants could select more than one answerParticipants could select more than one answer

Student’s Goal in AttendingStudent’s Goal in AttendingPercentPercent
PercentPercentGoal Statement Goal Statement CurriculumCurriculum CWWCWWObtain 2 yr. degree and Obtain 2 yr. degree and
enter the workforceenter the workforce 32.4%32.4% 36.1%36.1%Obtain 2 yr. degree andObtain 2 yr. degree and
transfer to a 4 yr. schooltransfer to a 4 yr. school28.1%28.1% 39.7%39.7%Take courses and transferTake courses and transfer
to a 4 yr. Collegeto a 4 yr. College 24.9%24.9% 16.9%16.9%Obtain a diploma or certificateObtain a diploma or certificate 16.3%16.3% 15.3%15.3%Prepare for a different jobPrepare for a different job 12.7%12.7% 15.0%15.0%Personal interest/enrichmentPersonal interest/enrichment 12.4%12.4% 12.5%12.5%Update skills for current jobUpdate skills for current job10.0%10.0% 16.1%16.1%Improve reading, writing and Improve reading, writing and
math skillsmath skills 5.1% 5.1% 2.8% 2.8%Prepare for first jobPrepare for first job 4.2% 4.2% 1.4% 1.4%
Participants could select more than one answerParticipants could select more than one answer

Employment StatusEmployment Status
CurriculumCurriculumCWWCWW
Full time Full time
(40 hrs. per wk.)(40 hrs. per wk.) 34.4%34.4%53.8%53.8%
Part-time Part-time
(21-39 hrs. per wk.)(21-39 hrs. per wk.) 29.1%29.1% 17.2%17.2%
Part-time Part-time
(< 20 hrs. per wk.)(< 20 hrs. per wk.) 15.0%15.0% 9.0%9.0%
UnemployedUnemployed 21.5%21.5%20.0%20.0%

Importance of the Following in Importance of the Following in Receiving Information about CPCCReceiving Information about CPCC
% Indicating Important % Indicating Important to Very Importantto Very Important
Schedule of classesSchedule of classes 922 (79.1%)922 (79.1%)College catalogCollege catalog 912 (77.7%)912 (77.7%)Internet CPCC web pageInternet CPCC web page 760 (65.1%)760 (65.1%)--------------------------------------------------------------------------------------------------------------------------Articles in the newspaperArticles in the newspaper 338 (29.8%)338 (29.8%)High school counselorHigh school counselor 331 (28.7%)331 (28.7%)Circulars mailed to youCirculars mailed to you 445 (28.3%)445 (28.3%)High school teacherHigh school teacher 300 (26.0%)300 (26.0%)Newspaper adsNewspaper ads 298 (25.6%)298 (25.6%)Television adsTelevision ads 268 (23.1%)268 (23.1%)Radio adsRadio ads 253 (21.8%)253 (21.8%)

Factors Determining the Factors Determining the Decision to Attend CPCCDecision to Attend CPCC
% Scoring Factor as Important% Scoring Factor as Important or Very Importantor Very Important
Academic reputation Academic reputation 87.6%87.6%Academic courses/programs offered Academic courses/programs offered 84.5%84.5%Low tuition costs Low tuition costs 80.9%80.9%Convenient locations Convenient locations 79.7%79.7%Easy transfer of credits Easy transfer of credits 78.3%78.3%Class schedules that allow for work Class schedules that allow for work 77.7%77.7%Relevance to job Relevance to job 64.1%64.1%Small class sizesSmall class sizes 59.3%59.3%------------------------------------------------------------------------------------------------------------------------------------------------------------------Appearance of grounds/facilities Appearance of grounds/facilities 47.6%47.6%Admission regardless of grades Admission regardless of grades 45.0%45.0%Availability of financial aidAvailability of financial aid 41.9%41.9%Availability of job placement/career counseling Availability of job placement/career counseling 45.6%45.6%Availability of coops, internships, etc. Availability of coops, internships, etc. 40.5%40.5%Accessibility by public transportationAccessibility by public transportation 18.218.2%%

Satisfaction with Elements of Satisfaction with Elements of InstructionInstruction
% Satisfied % Satisfied ((Somewhat to Very)Somewhat to Very)
CurriculumCurriculum CWWCWW
Quality of instructionQuality of instruction 93.5%93.5% 97.1%97.1%Classroom facilitiesClassroom facilities 93.6% 93.6% 90.8%90.8%Times classes are offeredTimes classes are offered 89.7%89.7% 83.3%83.3%Campus/site where classes Campus/site where classes
were offeredwere offered 87.2%87.2% 80.3%80.3%Availability of instructorsAvailability of instructors 91.3% 91.3% 92.8%92.8%Quality of faculty advisor Quality of faculty advisor 88.0%88.0% 83.6%83.6%Availability of classesAvailability of classes 88.3%88.3% 85.7%85.7%Library resourcesLibrary resources 88.1% 88.1% 89.1%89.1%Format in which classes are Format in which classes are
offeredoffered 87.5%87.5%Location for materials pick-upLocation for materials pick-up 85.5%85.5%Technical facilitiesTechnical facilities 83.6%83.6%

Curriculum Student Satisfaction Curriculum Student Satisfaction with College and Student Services with College and Student Services (rank ordered by what students (rank ordered by what students think is most important) think is most important)
% scoring Factor % Satisfied % scoring Factor % Satisfied as Important or (Somewhat as Important or (Somewhat
Very Important Very Important to Very) to Very)
ParkingParking 91.7%91.7% 83.3%83.3%Registration servicesRegistration services 84.9%84.9% 92.2%92.2%
Testing/assessment centerTesting/assessment center 82.3%82.3% 91.1%91.1%
SecuritySecurity 79.5%79.5% 91.2%91.2%
Student career servicesStudent career services 78.6%78.6% 90.9%90.9%
Records/transcriptsRecords/transcripts 78.5%78.5% 92.1%92.1%
LibraryLibrary 77.6%77.6% 79.6%79.6%
Computer labsComputer labs 77.3%77.3% 93.2%93.2%
Instructional labsInstructional labs 73.2%73.2% 90.5%90.5%
Bookstore Bookstore 76.6%76.6% 76.5%76.5%

Satisfaction with College and Satisfaction with College and Student Services (rank ordered by Student Services (rank ordered by what students think is most what students think is most important), cont.important), cont.
% scoring Factor % Satisfied % scoring Factor % Satisfied as Important or (Somewhat as Important or (Somewhat Very Important to Very) Very Important to Very)
CPCC.CC.NC.USCPCC.CC.NC.US 70.9%70.9% 92.6%92.6%CounselingCounseling 69.9%69.9% 85.2%85.2%
Academic advisementAcademic advisement 69.8%69.8% 84.2%84.2%
Welcome/Information centerWelcome/Information center 68.9%68.9% 93.5% 93.5% Telephone informationTelephone information 68.0%68.0% 88.2% 88.2% Financial aidFinancial aid 64.4%64.4% 80.6%80.6%Academic Learning/TutoringAcademic Learning/Tutoring 59.6%59.6% 89.5%89.5%Food service/VendingFood service/Vending 58.7%58.7% 85.3%85.3%
Student life activitiesStudent life activities 53.3%53.3% 86.9%86.9%Fitness/Weight roomFitness/Weight room 48.3%48.3% 75.1%75.1%

Satisfaction with College/ Student Satisfaction with College/ Student Services for Those Ranking Items Services for Those Ranking Items as Important/Very Importantas Important/Very Important
Mean Satisfaction Mean Satisfaction Score Score
Computer labsComputer labs 4.284.28CPCC.CC.NC.USCPCC.CC.NC.US 4.274.27Welcome/information centerWelcome/information center 4.234.23SecuritySecurity 4.164.16Testing/assessment centersTesting/assessment centers 4.144.14Registration servicesRegistration services 4.124.12Instructional labsInstructional labs 4.114.11Student career servicesStudent career services 4.104.10Records/transcriptsRecords/transcripts 4.084.08Student life activitiesStudent life activities 4.064.06LibraryLibrary 4.004.00

Satisfaction with College/ Student Satisfaction with College/ Student Services for Those Ranking Items Services for Those Ranking Items as Important or Very Importantas Important or Very Important
Mean Mean Satisfaction Satisfaction
ScoreScore
Academic Learning/TutoringAcademic Learning/Tutoring 3.983.98Telephone informationTelephone information 3.973.97ParkingParking 3.903.90Financial aid/Veterans Benefits Financial aid/Veterans Benefits 3.863.86Food service/vendingFood service/vending 3.793.79Academic advisingAcademic advising 3.763.76CounselingCounseling 3.763.76Fitness/Weight roomFitness/Weight room 3.693.69BookstoreBookstore 3.593.59

Student Satisfaction with College and Student Services
…………
Versus Perceptions of Importance by Campus

Scaling Importance and Scaling Importance and SatisfactionSatisfaction
Students rated importance according to the Students rated importance according to the following scale:following scale: 1-very unimportant1-very unimportant 2-unimportant2-unimportant 3-somewhat important3-somewhat important 4-important4-important 5-very important5-very important
Students rated satisfaction according to the Students rated satisfaction according to the following scale:following scale: 1-very dissatisfied1-very dissatisfied 2-dissatisfied2-dissatisfied 3-somewhat satisfied3-somewhat satisfied 4-satisfied4-satisfied 5-very satisfied5-very satisfied

Importance Versus Satisfaction Importance Versus Satisfaction with Academic Advisingwith Academic Advising
4.113.783.864.04 3.91
3.893.533.67
3.17
3.5
1
2
3
4
5
Central North South Southwest West
Importance
Satisfaction

Importance Versus Satisfaction Importance Versus Satisfaction with The Academic Learning with The Academic Learning Center and TutoringCenter and Tutoring
3.89
3.393.53
3.54
3.74
3.78 3.98
3.593.73
3.28
1
2
3
4
5
Central North South Southwest West
Importance
Satisfaction

Importance Versus Satisfaction Importance Versus Satisfaction with the Bookstorewith the Bookstore
4.334.074.12
4.014.19
3.023.12
3.81
3.19
3.55
1
2
3
4
5
Central North South Southwest West
Importance
Satisfaction

Importance Versus Satisfaction Importance Versus Satisfaction with Computer Labswith Computer Labs
4.13 4.05 4.234.04
4.29
4.273.92
4.23.82
4.03
1
2
3
4
5
Central North South Southwest West
Importance
Satisfaction

Importance Versus Satisfaction Importance Versus Satisfaction with the College Websitewith the College Website
4.193.943.913.88
4.16
4.113.934.043.81
4.04
1
2
3
4
5
Central North South Southwest West
Importance
Satisfaction

Importance Versus Importance Versus Satisfaction with CounselingSatisfaction with Counseling
4.053.813.893.774.04
3.823.653.72
3.14
3.63
1
2
3
4
5
Central North South Southwest West
Importance
Satisfaction

Importance Versus Satisfaction Importance Versus Satisfaction with Financial Aid/Veterans Affairswith Financial Aid/Veterans Affairs
3.24
4.053.81
3.693.92
3.623.733.58
3.253.68
1
2
3
4
5
Central North South Southwest West
Importance
Satisfaction

Importance Versus Satisfaction Importance Versus Satisfaction with the Fitness/Weight Roomwith the Fitness/Weight Room
3.68
2.98
3.243.35
3.21
3.59
3.35
3.13.34
3.53
1
2
3
4
5
Central North South Southwest West
Importance
Satisfaction

Importance Versus Satisfaction Importance Versus Satisfaction with Food Services/Vendingwith Food Services/Vending
3.683.43
3.62 3.653.91
3.783.47
3.653.59 3.43
1
2
3
4
5
Central North South Southwest West
Importance
Satisfaction

Importance Versus Satisfaction Importance Versus Satisfaction with Instructional Labswith Instructional Labs
3.973.74 3.91 4.01
4.22
4.13.843.85
3.533.86
1
2
3
4
5
Central North South Southwest West
Importance
Satisfaction

Importance Versus Importance Versus Satisfaction with ParkingSatisfaction with Parking
4.6
4.184.294.174.38
4.053.873.96
3.69
3.28
1
2
3
4
5
Central North South Southwest West
Importance
Satisfaction

Importance Versus Importance Versus Satisfaction with LibrarySatisfaction with Library
4.193.96 3.99 3.95
4.31
3.783.823.81
3.4
3.96
1
2
3
4
5
Central North South Southwest West
Importance
Satisfaction

Importance Versus Satisfaction Importance Versus Satisfaction with Records/Transcriptswith Records/Transcripts
4.23 4.134.01
4.22
3.61
4.18
3.963.77
4.033.92
1
2
3
4
5
Central North South Southwest West
Importance
Satisfaction

Importance Versus Satisfaction Importance Versus Satisfaction with Registration Serviceswith Registration Services
4.354.244.244.184.37
4.023.923.823.93 4.13
1
2
3
4
5
Central North South Southwest West
Importance
Satisfaction

Importance Versus Satisfaction Importance Versus Satisfaction with Student Life/Activitieswith Student Life/Activities
3.86
3.383.333.33.6
3.953.65
3.33
3.843.61
1
2
3
4
5
Central North South Southwest West
Importance
Satisfaction

Importance Versus Satisfaction Importance Versus Satisfaction with Securitywith Security
4.31 4.07 4.15 4.064.46
4.29
3.9843.683.88
1
2
3
4
5
Central North South Southwest West
Importance
Satisfaction
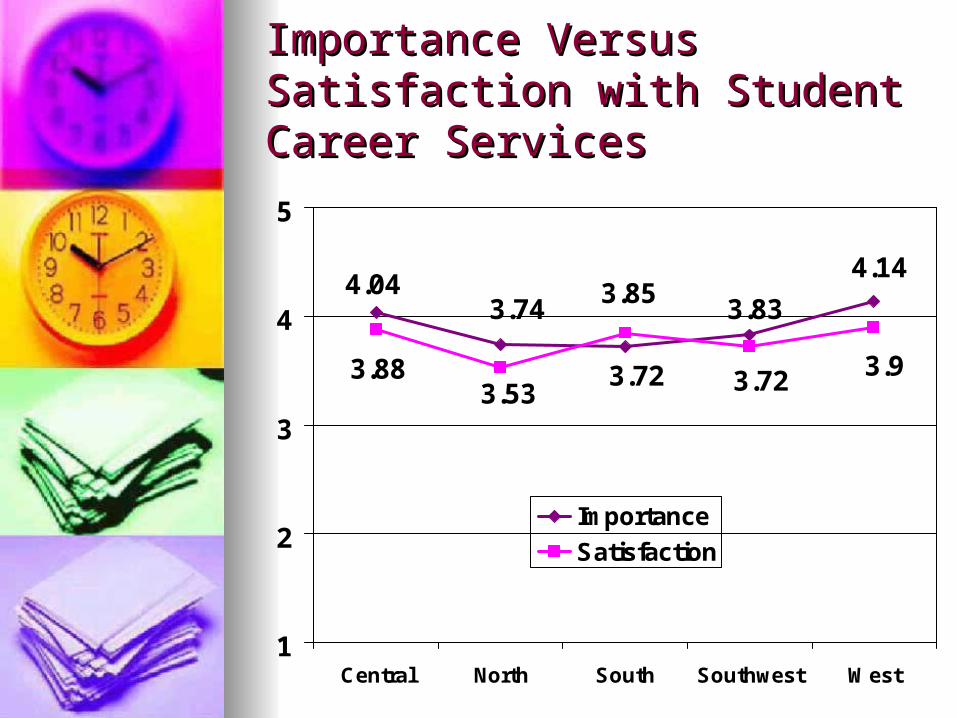
Importance Versus Satisfaction Importance Versus Satisfaction with Student Career Serviceswith Student Career Services
4.14
3.83
3.72
3.744.04
3.93.72
3.85
3.533.88
1
2
3
4
5
Central North South Southwest West
Importance
Satisfaction

Importance Versus Satisfaction Importance Versus Satisfaction with Telephone Informationwith Telephone Information
4.16
3.753.743.54
3.94
3.93.633.65
3.383.72
1
2
3
4
5
Central North South Southwest West
Importance
Satisfaction

Importance Versus Satisfaction Importance Versus Satisfaction with Testing/Assessment Centerwith Testing/Assessment Center
4.143.783.783.89
4.09
43.853.783.663.93
1
2
3
4
5
Central North South Southwest West
Importance
Satisfaction

Importance Versus Satisfaction Importance Versus Satisfaction with Welcome/Information Centerwith Welcome/Information Center
3.98
3.623.74
3.89
4.11
4.09
3.94.02
3.673.99
1
2
3
4
5
Central North South Southwest West
Importance
Satisfaction

The Best Evaluation of
Distance Education
We Have Done to Date……..

HighlightsHighlights
92.8% of students taking distance 92.8% of students taking distance education courses are using their education courses are using their home computers to complete their home computers to complete their coursecourse
75.1% of distance ed students 75.1% of distance ed students access their email every dayaccess their email every day
50.8% have dial-up modems and 50.8% have dial-up modems and 45.5% have DSL or cable modems45.5% have DSL or cable modems
51.1% use instant messaging 51.1% use instant messaging

How Distance Ed Students How Distance Ed Students Prefer to Receive ServicesPrefer to Receive Services
Everything at a distance Everything at a distance (services, advising, instruction)(services, advising, instruction) 145 (40.3%)145 (40.3%)
Student Services on Campus Student Services on Campus (instruction at a distance)(instruction at a distance) 43 (11.9%) 43 (11.9%)
Instruction on Campus Instruction on Campus (student services at a distance)(student services at a distance) 53 (14.7%) 53 (14.7%)Everything in personEverything in person 58 (16.1%) 58 (16.1%)
OtherOther 48 (13.3%) 48 (13.3%)

Number of Distance Education Number of Distance Education Classes You Have TakenClasses You Have Taken
Number (percent) Number (percent) Taken Taken
1 Class1 Class 122 (34.4%)122 (34.4%)2 Classes2 Classes 70 (19.7%) 70 (19.7%)3 Classes3 Classes 45 (12.7%) 45 (12.7%)4 Classes4 Classes 42 (11.8%) 42 (11.8%)5 or more Classes5 or more Classes 76 (21.4%) 76 (21.4%)
Have You Taken Traditional ClassroomHave You Taken Traditional ClassroomCourses at CPCCCourses at CPCC
YesYes 312 (88.4%) 312 (88.4%) No No 41 (11.6%) 41 (11.6%)

Students were asked…Students were asked…
To compare their satisfaction To compare their satisfaction between distance education between distance education courses and traditional courses and traditional classroom courses based on the classroom courses based on the following scale:following scale: 1-very dissatisfied1-very dissatisfied 2-dissatisfied2-dissatisfied 3-somewhat satisfied3-somewhat satisfied 4-satisfied4-satisfied 5-very satisfied5-very satisfied

Responsiveness of the Instructor Responsiveness of the Instructor to Your Questions and Needsto Your Questions and Needs
0.00%
10.00%
20.00%
30.00%
40.00%
50.00%
60.00%
1 2 3 4 5
CWW Class
TraditionalClass

Content Preparation Content Preparation Demonstrated by the Instructor Demonstrated by the Instructor
0.00%
10.00%
20.00%
30.00%
40.00%
50.00%
60.00%
1 2 3 4 5
CWW Class
TraditionalClass
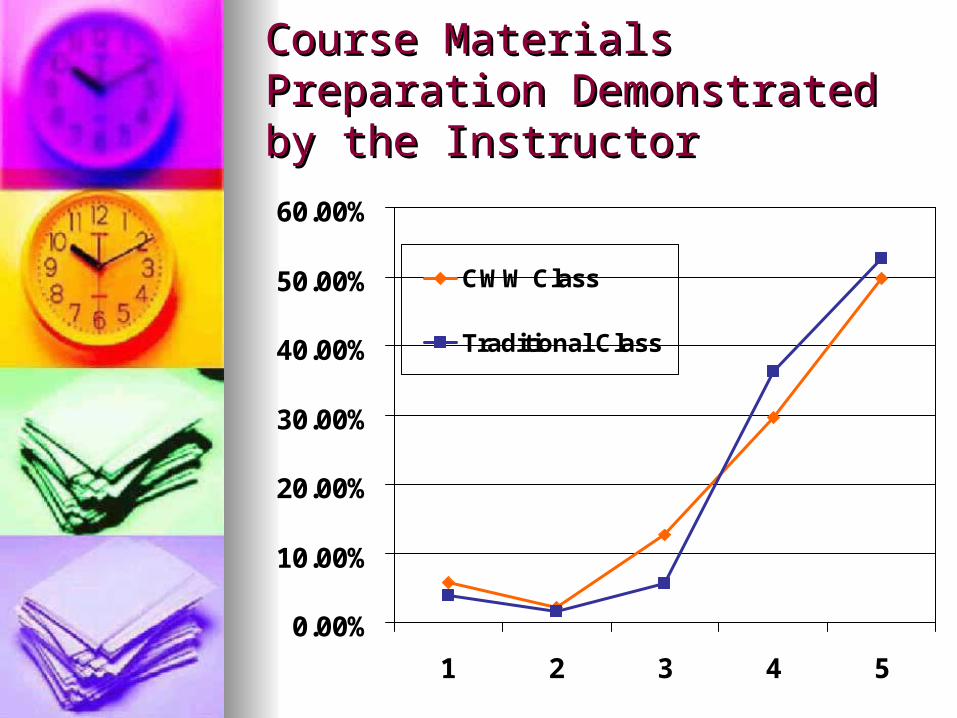
Course Materials Preparation Course Materials Preparation Demonstrated by the Instructor Demonstrated by the Instructor
0.00%
10.00%
20.00%
30.00%
40.00%
50.00%
60.00%
1 2 3 4 5
CWW Class
Traditional Class

Course Website or Classroom Course Website or Classroom Preparation Demonstrated by the Preparation Demonstrated by the InstructorInstructor
0.00%
10.00%
20.00%
30.00%
40.00%
50.00%
60.00%
1 2 3 4 5
CWW Class
Traditional Class

Degree to Which the Instructor Degree to Which the Instructor Encouraged/Supported Interaction Encouraged/Supported Interaction with Other Studentswith Other Students
0.00%
10.00%
20.00%
30.00%
40.00%
50.00%
60.00%
1 2 3 4 5
CWW Class
Traditional Class

Productivity of Course TimeProductivity of Course Time
0.00%
10.00%
20.00%
30.00%
40.00%
50.00%
60.00%
1 2 3 4 5
CWW Class
Traditional Class

Convenience of Convenience of Testing/Assessment MethodsTesting/Assessment Methods
0.00%
10.00%
20.00%
30.00%
40.00%
50.00%
60.00%
1 2 3 4 5
CWW Class
Traditional Class

Overall Learning ExperienceOverall Learning Experience
0.00%
10.00%
20.00%
30.00%
40.00%
50.00%
60.00%
1 2 3 4 5
CWW Class
Traditional Class

Distance Ed Students’ Satisfaction Distance Ed Students’ Satisfaction with Student/College Serviceswith Student/College Services
% Satisfied% Satisfied ItemItem Used ServiceUsed Service(somewhat to (somewhat to MeanMean Face to FaceFace to Face very)very)
Registration Registration servicesservices 94.3%94.3% 4.324.32 20 ( 5.7%)20 ( 5.7%)
Security/Privacy Security/Privacy IssuesIssues 95.1%95.1% 4.324.32 12 ( 3.5%)12 ( 3.5%)
Records/Records/transcriptstranscripts 95.7%95.7% 4.204.20 34 ( 9.8%)34 ( 9.8%)
College College webpagewebpage 93.2%93.2% 4.164.16 2 ( .6%) 2 ( .6%)
On-line On-line LibraryLibrary 97.4%97.4% 4.094.09 11 ( 3.1%)11 ( 3.1%)
Computer Computer labslabs 97.2%97.2% 4.074.07 24 ( 6.8%)24 ( 6.8%)
Instructional Instructional labslabs 96.8%96.8% 3.923.92 23 ( 6.6%)23 ( 6.6%)

Distance Ed Students’ Satisfaction Distance Ed Students’ Satisfaction with Student/College Serviceswith Student/College Services
% Satisfied% Satisfied ItemItem Used ServiceUsed Service(somewhat to (somewhat to MeanMean Face to FaceFace to Face very)very)
Student career Student career servicesservices 96.0%96.0% 3.813.81 24 ( 6.9%)24 ( 6.9%)
Telephone Telephone informationinformation 91.7%91.7% 3.863.86 11 ( 3.1%)11 ( 3.1%)
Testing/assessment Testing/assessment centercenter 90.5%90.5% 3.843.84 24 ( 6.9%)24 ( 6.9%)
BookstoreBookstore 88.1%88.1% 3.663.66 75 (21.2%)75 (21.2%)Academic Academic
AdvisingAdvising 78.8%78.8% 3.543.54 51 (14.4%)51 (14.4%)Financial Financial
aidaid 92.8%92.8% 3.383.38 26 ( 7.5%)26 ( 7.5%)CounselingCounseling 91.7%91.7% 3.293.29 59 (17.0%)59 (17.0%)

Other Services Distance Ed Other Services Distance Ed Students RequestedStudents Requested Advisors dedicated to online studentsAdvisors dedicated to online students Chat rooms once a week with the instructorChat rooms once a week with the instructor Chat rooms with the Deans to make Chat rooms with the Deans to make
suggestions for program improvementsuggestions for program improvement Posting of campus events on a virtual Posting of campus events on a virtual
bulletin boardbulletin board More courses onlineMore courses online A virtual testing centerA virtual testing center A place to post questions about the College A place to post questions about the College
and college servicesand college services Counseling services onlineCounseling services online

The End