the revenue functions of a monopoly micro... · advanced placement economics microeconomics:...
TRANSCRIPT

Advanced Placement Economics Microeconomics: Teacher Resource Manual © Council for Economic Education, New York, N.Y. 297
3 Microeconomics
The Revenue Functions of a Monopoly
At the opposite end of the market spectrum from perfect competition is monopoly. A monopoly exists when only one firm sells the good or service. This means the monopolist faces the market demand curve since it has no competition from other firms. If the monopolist wants to sell more of its product, it will have to lower its price. As a result, the price (P) at which an extra unit of output (Q) is sold will be greater than the marginal revenue (MR) from that unit.
Student Alert: P is greater than MR for a monopolist.
1. Table 3-10.1 has information about the demand and revenue functions of the MoonglowMonopoly Company. Complete the table. Assume the monopoly charges each buyer the same P(i.e., there is no price discrimination). Enter the MR values at the higher of the two Q levels. Forexample, since total revenue (TR) increases by $37.50 when the firm increases Q from two to threeunits, put “+$37.50” in the MR column for Q = 3.
Table 3-10.1 The Moonglow Monopoly Company
Q P TR MRAverage revenue
(AR)
0 $100.00 $0.00 – –
1 $87.50 $87.50 +$87.50 $87.50
2 $75.00 $150.00 +$62.50 $75.00
3 $62.50 $187.50 +$37.50 $62.50
4 $50.00 $200.00 +$12.50 $50.00
5 $37.50 $187.50 –$12.50 $37.50
6 $25.00 $150.00 –$37.50 $25.00
7 $12.50 $87.50 –$62.50 $12.50
8 $0.00 $0.00 –$87.50 $0.00
2. Draw the demand (D), AR, and MR curves in Figure 3-10.1. Plot the MR values at the higher ofthe two Q levels.
SOLUTIONS
ACTIVITY 3-10
CEE-APE_MACROSE-12-0101-MITM-Book.indb 297 26/07/12 5:26 PM
Purchase your 4th Edition AP Microeconomics and Macroeconomics Teacher Resources and Student workbooks today!
298 Advanced Placement Economics Microeconomics: Teacher Resource Manual © Council for Economic Education, New York, N.Y.
3 Microeconomics
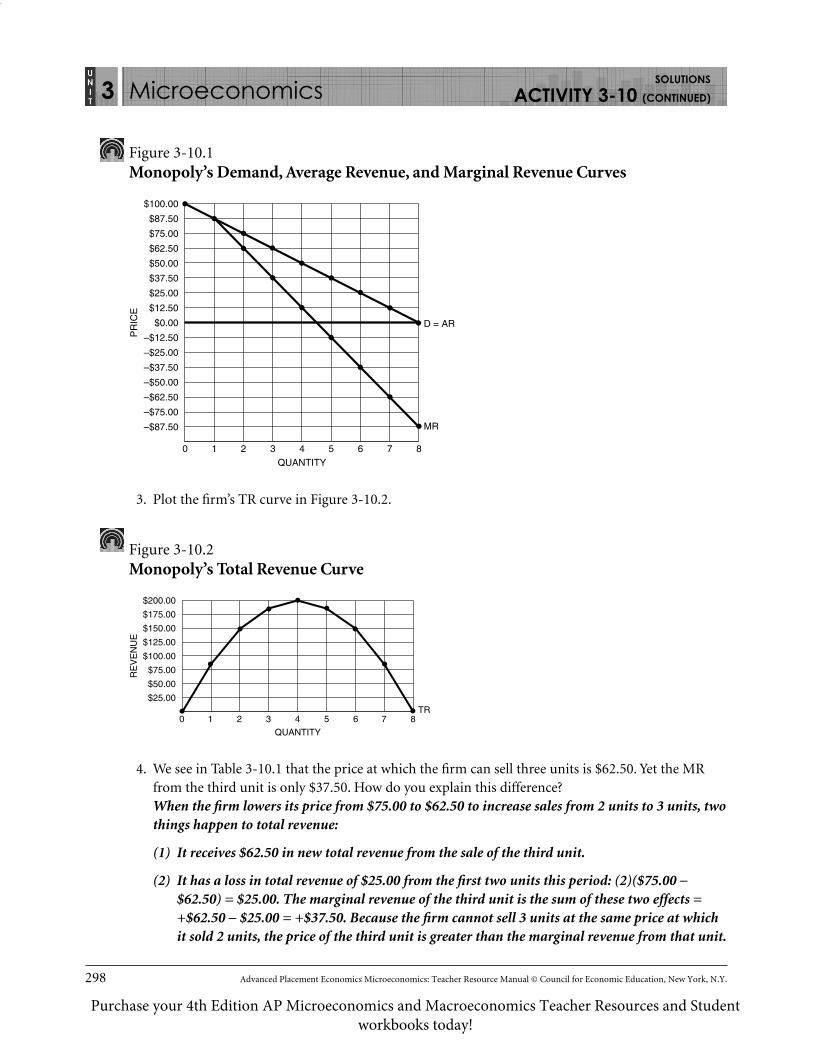
Figure 3-10.1 Monopoly’s Demand, Average Revenue, and Marginal Revenue Curves
QUANTITY
PR
ICE
–$75.00
–$50.00
–$25.00
10 2 3 4 5 6
$0.00
$25.00
$50.00
$75.00
–$87.50
–$62.50
–$37.50
–$12.50
$12.50
$37.50
$62.50
$87.50
$100.00
7 8
MR
D = AR
3. Plot the firm’s TR curve in Figure 3-10.2.
Figure 3-10.2 Monopoly’s Total Revenue Curve
QUANTITY
RE
VE
NU
E
$50.00
$100.00
$150.00
10 2 3 4 5 6
$200.00
$25.00
$75.00
$125.00
$175.00
7 8TR
4. We see in Table 3-10.1 that the price at which the firm can sell three units is $62.50. Yet the MRfrom the third unit is only $37.50. How do you explain this difference?When the firm lowers its price from $75.00 to $62.50 to increase sales from 2 units to 3 units, twothings happen to total revenue:
(1) It receives $62.50 in new total revenue from the sale of the third unit.
(2) It has a loss in total revenue of $25.00 from the first two units this period: (2)($75.00 −$62.50) = $25.00. The marginal revenue of the third unit is the sum of these two effects = +$62.50 − $25.00 = +$37.50. Because the firm cannot sell 3 units at the same price at which it sold 2 units, the price of the third unit is greater than the marginal revenue from that unit.
SOLUTIONS
ACTIVITY 3-10 (CONTINUED)
CEE-APE_MACROSE-12-0101-MITM-Book.indb 298 26/07/12 5:26 PM
Purchase your 4th Edition AP Microeconomics and Macroeconomics Teacher Resources and Student workbooks today!

Advanced Placement Economics Microeconomics: Teacher Resource Manual © Council for Economic Education, New York, N.Y. 299
3 Microeconomics
5. Why does the vertical gap between the firm’s D curve and MR curve get larger as the firm sellsmore output?This is because the loss in total revenue from the first units resulting from lowering the price tosell one more unit gets larger as the firm’s total output increases. In other words, the value inPart (2) of the solution to Question 4 gets bigger as the firm’s output gets bigger.
Table 3-10.1 is an example of a discrete case because it has a small number of observations (output varies from zero to eight units). Figure 3-10.3 is an example of a continuous case because it is based on a large number of observations. Answer Questions 6–8 based on Figure 3-10.3.
Figure 3-10.3 A Continuous Example of a Monopoly’s Revenue Curves
QUANTITY
QUANTITY
5000
$40
RE
VE
NU
E
1,000
TR
MR
5000
$80
RE
VE
NU
E
1,000
D = ARInelastic
Unitary elastic
Elastic
6. Indicate clearly in the top graph of Figure 3-10.3 the elastic, unitary elastic, and inelastic portionsof the D curve. Explain your answer.Based on the total revenue test, we know demand is elastic if total revenue rises when price isreduced. Total revenue does not change if demand is unitary elastic. Demand is inelastic if totalrevenue falls when price is lowered. If the demand curve is linear and downward sloping, thenthe upper half of the demand curve is elastic, the midpoint is unitary elastic, and the lower halfis inelastic.
SOLUTIONS
ACTIVITY 3-10 (CONTINUED)
CEE-APE_MACROSE-12-0101-MITM-Book.indb 299 26/07/12 5:26 PM
Purchase your 4th Edition AP Microeconomics and Macroeconomics Teacher Resources and Student workbooks today!

300 Advanced Placement Economics Microeconomics: Teacher Resource Manual © Council for Economic Education, New York, N.Y.
3 Microeconomics
7. Marginal revenue is found using the ratio MR = DTR/DQ. This is also the formula for the slope ofthe TR curve. Thus, MR = slope of the TR curve.
(A) Over what range of output is the slope of the TR curve positive? Over what range of output isthe firm’s MR positive? Over the first 499 units
(B) Over what range of output is the firm’s MR negative? Over what range of output is the slope of the TR curve negative? Over those units from 501 to 1,000
(C) Over what range of output is the slope of the TR curve equal to zero? Over what range of output is the firm’s MR equal to zero?At the 500th unit
8. What is the maximum dollar value of TR this firm can receive?500 × $40 = $20,000.
Bonus Question!
9. When the Galaxy Firm lowers its price from $60 to $57, the number of units it sells increases from36 to 39. What is the value of MR? How should you interpret this value?As a result of selling three extra units, the firm’s total revenue increases by $63 ($2,160 to$2,223). Since marginal revenue refers to the extra revenue from one more unit of output, youneed to use the MR formula: MR = DTR/DQ = +$63/+3 units = +$21. The interpretation of thisMR value is that the firm’s total revenue increases by $21 for each of the three extra units.
SOLUTIONS
ACTIVITY 3-10 (CONTINUED)
CEE-APE_MACROSE-12-0101-MITM-Book.indb 300 26/07/12 5:26 PM
Purchase your 4th Edition AP Microeconomics and Macroeconomics Teacher Resources and Student workbooks today!

Advanced Placement Economics Microeconomics: Teacher Resource Manual © Council for Economic Education, New York, N.Y. 301
3 Microeconomics
Profit Maximization by a Monopoly
The profit-maximizing monopolist works with the same key rules as any firm:
1. The optimal output level (Q*) is the one where marginal revenue equals marginal cost (MR = MC).
2. The optimal price (P*) is found on the demand curve at output Q*.
3. The firm should shut down if at Q* it finds its total revenue is less than its total variable cost(TR < TVC).
Because price (P) and MR were equal for a perfectly competitive firm, that firm could also find its Q* by setting P = MC. But that is not the case for a monopoly since P and MR will be different. The monopolist will find its profit-maximizing output (Q) where MR = MC, not where P = MC. This activity shows how a monopolist finds the output at which it will maximize its total profit and the price it should charge for that output.
Part A: Determining the Optimal Output and Price for a Monopoly
Table 3-11.1 provides some revenue, cost, and profit data for a monopoly.
1. Complete Table 3-11.1. Enter the MR and MC values at the higher of the two output levels. Forexample, the MR value of $300 is placed at Q = 4 rather than at Q = 3.
Be sure to distinguish between total profit (TP), average profit (AP), and marginal profit (MP):
(A) TP = TR – TC = (Q) (AP)
(B) AP = AR – ATC = TP/Q
(C) MP = MR – MC = DTP/DQ
Table 3-11.1 Revenue, Cost, and Profit Values for a Monopoly
Q P TR TC TP AR ATC AP MR MC MP
0 $1,350 $0 $100 –$100 – – – – – –
1 $1,200 $1,200 $900 $300 $1,200 $900 $300 +$1,200 +$800 +$400
2 $1,050 $2,100 $1,600 $500 $1,050 $800 $250 +$900 +$700 +$200
3 $900 $2,700 $2,100 $600 $900 $700 $200 +$600 +$500 +$100
4 $750 $3,000 $2,400 $600 $750 $600 $150 +$300 +$300 $0
5 $600 $3,000 $2,800 $200 $600 $560 $40 $0 +$400 –$400
6 $450 $2,700 $3,600 –$900 $450 $600 –$150 –$300 +$800 –$1,100
SOLUTIONS
ACTIVITY 3-11
CEE-APE_MACROSE-12-0101-MITM-Book.indb 301 26/07/12 5:26 PM
Purchase your 4th Edition AP Microeconomics and Macroeconomics Teacher Resources and Student workbooks today!

302 Advanced Placement Economics Microeconomics: Teacher Resource Manual © Council for Economic Education, New York, N.Y.
3 Miccroeeconnommicss
2. In Figure 3-11.1, draw the monopolist’s D, AR, MR, and ATC curves using the data from Table 3-11.1.Plot the MR and MC values at the higher of the two output levels rather than at the midpoint betweenthe two levels. Use dotted lines for the MR and MC curves in your graph. Label each curve.
Figure 3-11.1 Revenue and Cost Curves of a Monopolist
QUANTITY
MC
ATCD = AR
MR
RE
VE
NU
E, C
OS
T
–$150
$0
$150
$450
10 2 3 4 5 6
$750
$1,050
$1,350
–$300
$300
$600
$900
$1,200
3. To maximize its total profi t, this monopolist should produce 4 units.The fi rst three units have MR > MC. The fourth unit has MR = MC. Subsequent units haveMR < MC and should not be produced.
4. What price should the monopolist charge for each of these units?The highest price the fi rm can charge for four units is $750. This price is found on the D curve.
5. What is the total profi t this fi rm will earn? $600 Shade in the total profi t area inFigure 3-11.1.The AΠ for four units is $150: AΠ = AR – ATC = $750 – $600.
TΠ = (Q)(AΠ) = (4)($150) = $600.
Part B: Other Monopoly Examples
6. Suppose a monopolist can sell an extra unit of its good at a price of $50 and the MR of that unit is$44. If the MC of producing the extra unit is $46, the fi rm’s total profi t would (increase / decrease)by $2 if the fi rm sells that unit. Should the fi rm produce this additional unit of output?Explain your answer.The fi rm should not produce the extra unit because its MR is less than its MC. This unit has amarginal profi t of –$2 which means the fi rm’s total profi t would decrease by $2 if it sold thatunit. The fi rm compares MR to MC, not P to MC, to decide if an extra unit should be produced.
SOLUTIONS
ACTIVITY 3-11 (CONTINUED)
CEE-APE_MACROSE-12-0101-MITM-SAS-U03.indd 302CEE-APE_MACROSE-12-0101-MITM-SAS-U03.indd 302 10/08/12 5:17 PM10/08/12 5:17 PM
Purchase your 4th Edition AP Microeconomics and Macroeconomics Teacher Resources and Student workbooks today!

Advanced Placement Economics Microeconomics: Teacher Resource Manual © Council for Economic Education, New York, N.Y. 303
3 Microeconomics
7. Figure 3-11.2 shows the MR and MC curves of a monopolist. Economists claim that the firm willmaximize its total profit by producing 800 units where MR = MC. Show your understanding ofthis rule by circling the correct answer in each cell of Table 3-11.2.
Figure 3-11.2
0
$
800QUANTITY
MC
MR1,200
Table 3-11.2 The Logic behind the “MR = MC” Rule
Units of Q For each extra unit of output in this range:
1–799 MR is ( > / = / <) MC. MP is ( > / = / <) $0. TP will ( rise / fall / not change).
800 MR is (> / = / <) MC. MP is (> / = / <) $0. TP will (rise / fall / not change ).
801–1200 MR is (> / = / < ) MC. MP is (> / = / < ) $0. TP will (rise / fall / not change).
8. The firm illustrated in Figure 3-11.2 will maximize its total revenue if it produces 1,200 units.So why does it not want to produce those units between 800 and 1,200?Each of the units between 800 and 1200 has MR < MC which means the firm’s total profit will bedecreased if these units are produced.
9. The monopolist’s profit-maximizing output level will be in the (elastic / unitary elastic / inelastic)range of its demand curve. Explain.The output level where MR = MC must be in the elastic range because MC is always a positivevalue, which means MR must also be a positive value. MR is only positive in the elastic range ofthe demand curve.
SOLUTIONS
ACTIVITY 3-11 (CONTINUED)
CEE-APE_MACROSE-12-0101-MITM-Book.indb 303 26/07/12 5:26 PM
Purchase your 4th Edition AP Microeconomics and Macroeconomics Teacher Resources and Student workbooks today!

304 Advanced Placement Economics Microeconomics: Teacher Resource Manual © Council for Economic Education, New York, N.Y.
3 Microeconomics
Here’s a more interesting answer to Question 9. Assume the firm is producing an output level in the inelastic range. If the firm increases its price, three things will happen:
(1) Total revenue will increase because an increase in price when demand is inelastic increases total revenue.
(2) Total cost will decrease because the firm will need fewer resources since it will be selling fewer units of output because of the higher price.
(3) Total profit will increase because total revenue increases and total cost decreases when price is increased in the inelastic range of the demand curve. [See (1) and (2).]
Thus, if the firm is operating in the inelastic range of its demand curve, it should keep increasing its price (and its total profit) until it backs into the elastic range where it eventually hits the output level where MR = MC.
SOLUTIONS
ACTIVITY 3-11 (CONTINUED)
CEE-APE_MACROSE-12-0101-MITM-Book.indb 304 26/07/12 5:26 PM
Purchase your 4th Edition AP Microeconomics and Macroeconomics Teacher Resources and Student workbooks today!

Advanced Placement Economics Microeconomics: Teacher Resource Manual © Council for Economic Education, New York, N.Y. 305
3 Microeconomics
Equilibrium in a Monopolistic Market
Part A: Equilibrium in a Perfectly Competitive Market
Consider Figure 3-12.1, which shows a perfectly competitive market. The market supply curve S is the horizontal summation of the marginal cost (MC) curves of all the firms in the market. Use Figure 3-12.1 to answer the questions that follow the graph.
Figure 3-12.1 Equilibrium in a Perfectly Competitive Market
QUANTITY
S = MC
D
B
A
F
H
PR
ICE
$4
$8
$12
10 2 3 4 5 6 7
$16
$20
$24
$2
$6
$10
$14
$18
$22
1. What is the equilibrium quantity in the market?4 units
2. What is the equilibrium price?$16
3. What area of the graph represents consumer surplus in the market? Calculate the dollar value ofconsumer surplus.CS is represented by area ABH. CS = (0.5)(4)($24 – $16) = $16.
SOLUTIONS
ACTIVITY 3-12
CEE-APE_MACROSE-12-0101-MITM-Book.indb 305 26/07/12 5:26 PM
Purchase your 4th Edition AP Microeconomics and Macroeconomics Teacher Resources and Student workbooks today!

306 Advanced Placement Economics Microeconomics: Teacher Resource Manual © Council for Economic Education, New York, N.Y.
3 Microeconomics
4. What area of the graph represents producer surplus in the market? Calculate the dollar value ofproducer surplus.PS is represented by area BHF. PS = (0.5)(4)($16 – $0) = $32.
5. What area of the graph represents total surplus (also called social welfare or total welfare)?Calculate the dollar value of total surplus.TS is represented by area ABF. TS = CS + PS = $48.
Part B: Equilibrium in a Monopolistic Market
Now consider the same demand and cost curves, but assume the market is a monopoly. Because the monopoly faces the downward sloping market demand curve, it must reduce its price to sell more output, which means price will be greater than marginal revenue (MR). We add the firm’s MR curve below its demand curve in Figure 3-12.2, as well as the monopolist’s MC curve. Use Figure 3-12.2 to answer the questions that follow the graph.
Figure 3-12.2 Equilibrium in a Monopolistic Market
MRQUANTITY
MC
D
RE
VE
NU
E, C
OS
T
$4
$8
$12
10 2 3 4 5 6 7
$16
$20
$24
$2
$6
$10
$14
$18
$22W
F
B
Y
X
A
6. What output level will the monopolist produce? Why?It will produce 3 units where MR = MC.
SOLUTIONS
ACTIVITY 3-12 (CONTINUED)
CEE-APE_MACROSE-12-0101-MITM-Book.indb 306 26/07/12 5:26 PM
Purchase your 4th Edition AP Microeconomics and Macroeconomics Teacher Resources and Student workbooks today!

Advanced Placement Economics Microeconomics: Teacher Resource Manual © Council for Economic Education, New York, N.Y. 307
3 Microeconomics
7. What price will the monopolist charge for this output? Why?The monopolist will charge a price of $18 because, based on the demand curve, that is thehighest price consumers will pay for 3 units.
8. What area of the graph represents consumer surplus in the market? Calculate the dollar value ofconsumer surplus.CS is represented by area AWX. CS = (0.5)(3)($24 – $18) = $9.
9. What area of the graph represents producer surplus? Calculate the dollar value ofproducer surplus.PS is represented by area FXWY. To calculate the value of PS, break the FXWY area into atriangle and a rectangle.
PS = (0.5)(3)($12 – $0) + (3)($18 – $12) = $18 + $18 = $36.
10. What area of the graph represents total surplus? Calculate the dollar value of total surplus.TS is represented by area AWYF. TS = CS = PS = $45.
Part C: Comparing Equilibrium in the Two Markets
11. How do the price and output of a monopolist differ from those in the perfectlycompetitive market?The monopolist has a higher price and a lower output than a perfectly competitive market.
12. What is the dollar value of the portion of consumer surplus in the competitive market that istransferred to the firm’s producer surplus in the monopoly situation?Note that CS drops from $16 in perfect competition to $9 in monopoly. What happens to the $7reduction in CS when the market becomes a monopoly?
(1) Some of it is captured by the monopoly as PS = (3)($18 – $16) = $6.
(2) The other part is lost because output was reduced by one unit because of the monopoly. Thisis called a deadweight loss (DWL) to society. In this example, the DWL in terms of CS is equal to $1: (0.5)(4 –3)($18 – $16) = $1.
13. How does a monopoly affect consumer surplus? Is this good or bad from the perspectiveof consumers?Consumer surplus is reduced when a perfectly competitive market becomes a monopoly. This isbad news for consumers.
14. What area of Figure 3-12.2 represents the deadweight loss resulting from the market being amonopoly? Calculate the dollar value of the deadweight loss.Deadweight loss results from the market output being reduced by 1 unit (from 4 units to 3 units)when the market changes from perfect competition to monopoly. The DWL is represented by thearea BWY.
DWL = (0.50)(1)($18 – $16) + (0.5)(1)($16 – $12) = $1 + $2 = $3.
The value of DWL also can be found as the reduction in TS when a perfectly competitive market becomes a monopoly: DTS = $48 – $45 = $3.
SOLUTIONS
ACTIVITY 3-12 (CONTINUED)
CEE-APE_MACROSE-12-0101-MITM-Book.indb 307 26/07/12 5:26 PM
Purchase your 4th Edition AP Microeconomics and Macroeconomics Teacher Resources and Student workbooks today!

CEE-APE_MACROSE-12-0101-MITM-Book.indb 308 26/07/12 5:26 PM
Advanced Placement Economics Microeconomics: Teacher Resource Manual © Council for Economic Education, New York, N.Y. 309
3 Microeconomics
Price Discrimination
When producers have market power and sell a good or service that cannot be resold, the possibility of price discrimination arises. Price discrimination exists when a producer charges different prices to different customers for the same item, for reasons other than differences in cost. The seller needs to be able to divide the total market for the good into separate submarkets, each with a different demand for the good. There also must be no possibility of resale of the product between the submarkets; otherwise the different submarkets will collapse into a single market.
Part A: Regular Monopoly with No Price Discrimination
Pat’s Patriotic Tattoos is the only tattoo parlor in town. Pat provides only one tattoo—the American flag. There are 10 consumers in town who are willing to buy one tattoo, and they vary in their willingness to pay. One consumer is willing to pay $20 for a tattoo, another is willing to pay $18, and so forth, down to the tenth consumer who is willing to pay only $2. Table 3-13.1 shows the demand schedule for Pat’s flag tattoo.
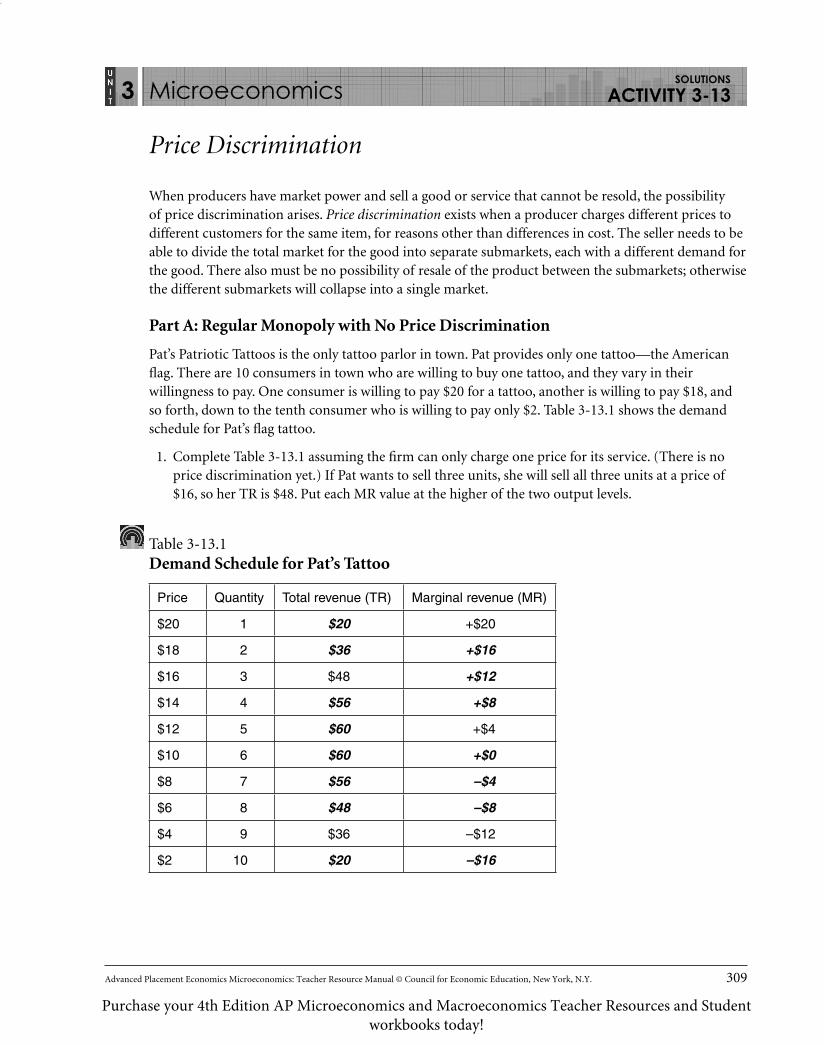
1. Complete Table 3-13.1 assuming the firm can only charge one price for its service. (There is noprice discrimination yet.) If Pat wants to sell three units, she will sell all three units at a price of$16, so her TR is $48. Put each MR value at the higher of the two output levels.
Table 3-13.1 Demand Schedule for Pat’s Tattoo
Price Quantity Total revenue (TR) Marginal revenue (MR)
$20 1 $20 +$20
$18 2 $36 +$16
$16 3 $48 +$12
$14 4 $56 +$8
$12 5 $60 +$4
$10 6 $60 +$0
$8 7 $56 –$4
$6 8 $48 –$8
$4 9 $36 –$12
$2 10 $20 –$16
SOLUTIONS
ACTIVITY 3-13
CEE-APE_MACROSE-12-0101-MITM-Book.indb 309 26/07/12 5:26 PM
Purchase your 4th Edition AP Microeconomics and Macroeconomics Teacher Resources and Student workbooks today!

310 Advanced Placement Economics Microeconomics: Teacher Resource Manual © Council for Economic Education, New York, N.Y.
3 Microeconomics
2. What is the total consumer surplus if Pat sells three units at a price of $16?CS is the difference between the highest price a consumer is willing to pay and the price he or sheactually does pay. CS= ($20 – $16) + ($18 – $16) + ($16 – $16) = $4 + $2 + $0 = $6.
3. What is the total consumer surplus if she sells five units at a price of $12?CS = ($20 – $12) + ($18 – $12) + ($16 – $12) + ($14 – $12) + ($12 – $12)
= $8 + $6 + $4 + $2 + $0 = $20.
4. In Figure 3-13.1, draw the demand curve for Pat’s tattoos.
Figure 3-13.1 Demand for Pat’s Tattoos
QUANTITY
D
MR
PR
ICE
–$14
–$10
–$6
10 2 3 4 5 6 7 8 9 10
–$2
$2
$6
$8
$10
$12
$14
$16
$18
$20
–$16
–$12
–$8
–$4
$0
$4
MC = ATC
SOLUTIONS
ACTIVITY 3-13 (CONTINUED)
CEE-APE_MACROSE-12-0101-MITM-Book.indb 310 26/07/12 5:26 PM
Purchase your 4th Edition AP Microeconomics and Macroeconomics Teacher Resources and Student workbooks today!
Advanced Placement Economics Microeconomics: Teacher Resource Manual © Council for Economic Education, New York, N.Y. 311
3 Microeconomics
Part B: Perfect Price Discrimination (Also Called First-Degree Price Discrimination)
Perfect price discrimination is a monopolist’s dream because it means that the firm can charge each individual consumer the highest price that he or she is willing to pay for the firm’s product. As we will see in this activity, perfect price discrimination eliminates all consumer surplus and increases the monopolist’s total profit above what it would if the firm sold all output at one price. For the questions in this section, assume that Pat’s average total cost and marginal cost are constant and equal to $8 (ATC = MC = $8).
5. In Figure 3-13.1, draw the firm’s ATC=MC curves as a horizontal line at $8.
6. If this were a perfectly competitive market, the MC curve would represent the supply ofthe product. If Pat produces the perfectly competitive quantity and charges the perfectlycompetitive price:
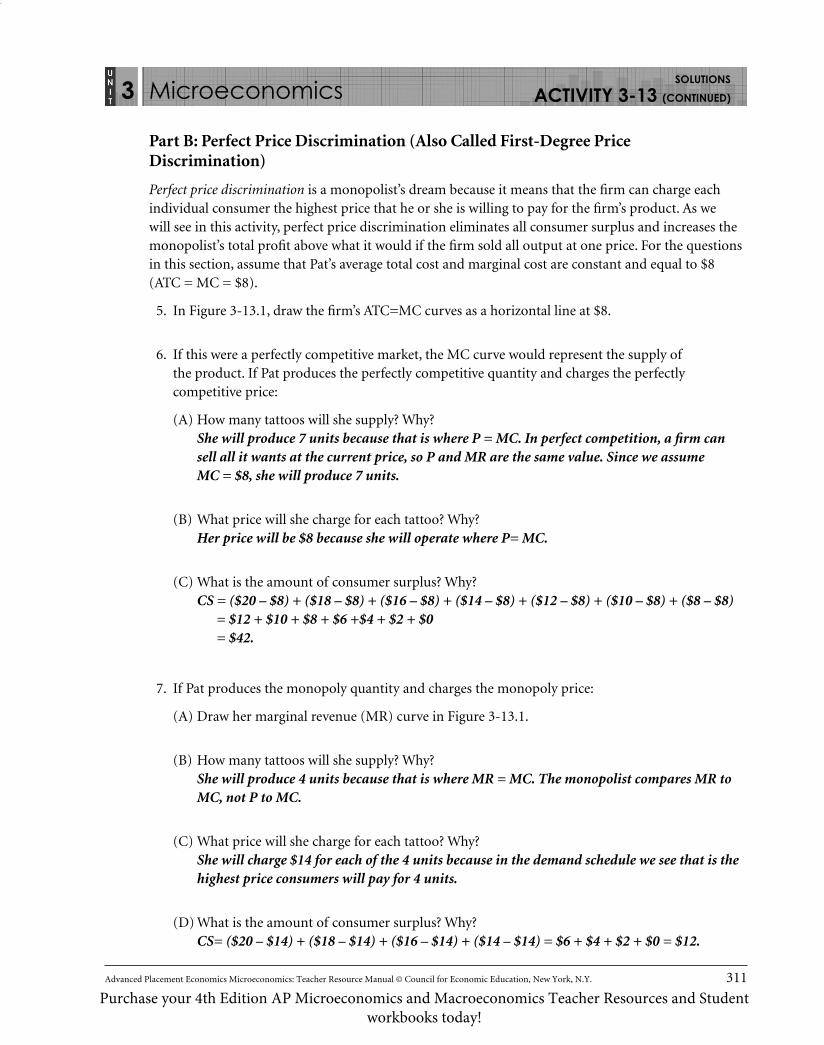
(A) How many tattoos will she supply? Why?She will produce 7 units because that is where P = MC. In perfect competition, a firm can sell all it wants at the current price, so P and MR are the same value. Since we assume MC = $8, she will produce 7 units.
(B) What price will she charge for each tattoo? Why?Her price will be $8 because she will operate where P= MC.
(C) What is the amount of consumer surplus? Why?CS = ($20 – $8) + ($18 – $8) + ($16 – $8) + ($14 – $8) + ($12 – $8) + ($10 – $8) + ($8 – $8)
= $12 + $10 + $8 + $6 +$4 + $2 + $0 = $42.
7. If Pat produces the monopoly quantity and charges the monopoly price:
(A) Draw her marginal revenue (MR) curve in Figure 3-13.1.
(B) How many tattoos will she supply? Why?She will produce 4 units because that is where MR = MC. The monopolist compares MR to MC, not P to MC.
(C) What price will she charge for each tattoo? Why?She will charge $14 for each of the 4 units because in the demand schedule we see that is the highest price consumers will pay for 4 units.
(D) What is the amount of consumer surplus? Why?CS= ($20 – $14) + ($18 – $14) + ($16 – $14) + ($14 – $14) = $6 + $4 + $2 + $0 = $12.
SOLUTIONS
ACTIVITY 3-13 (CONTINUED)
CEE-APE_MACROSE-12-0101-MITM-Book.indb 311 26/07/12 5:26 PM
Purchase your 4th Edition AP Microeconomics and Macroeconomics Teacher Resources and Student workbooks today!
312 Advanced Placement Economics Microeconomics: Teacher Resource Manual © Council for Economic Education, New York, N.Y.
3 Microeconomics
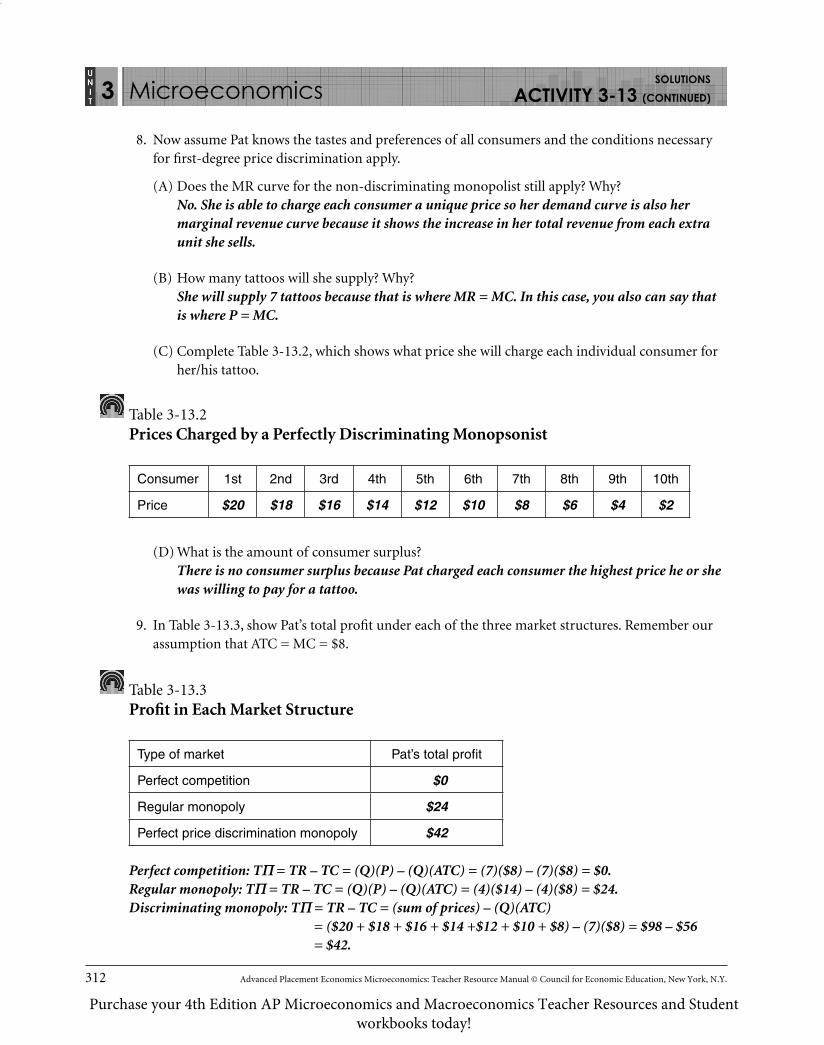
8. Now assume Pat knows the tastes and preferences of all consumers and the conditions necessaryfor first-degree price discrimination apply.
(A) Does the MR curve for the non-discriminating monopolist still apply? Why?No. She is able to charge each consumer a unique price so her demand curve is also her marginal revenue curve because it shows the increase in her total revenue from each extra unit she sells.
(B) How many tattoos will she supply? Why?She will supply 7 tattoos because that is where MR = MC. In this case, you also can say that is where P = MC.
(C) Complete Table 3-13.2, which shows what price she will charge each individual consumer for her/his tattoo.
Table 3-13.2 Prices Charged by a Perfectly Discriminating Monopsonist
Consumer 1st 2nd 3rd 4th 5th 6th 7th 8th 9th 10th
Price $20 $18 $16 $14 $12 $10 $8 $6 $4 $2
(D) What is the amount of consumer surplus?There is no consumer surplus because Pat charged each consumer the highest price he or she was willing to pay for a tattoo.
9. In Table 3-13.3, show Pat’s total profit under each of the three market structures. Remember ourassumption that ATC = MC = $8.
Table 3-13.3 Profit in Each Market Structure
Type of market Pat’s total profit
Perfect competition $0
Regular monopoly $24
Perfect price discrimination monopoly $42
Perfect competition: TP = TR – TC = (Q)(P) – (Q)(ATC) = (7)($8) – (7)($8) = $0.Regular monopoly: TP = TR – TC = (Q)(P) – (Q)(ATC) = (4)($14) – (4)($8) = $24.Discriminating monopoly: TP = TR – TC = (sum of prices) – (Q)(ATC)
= ($20 + $18 + $16 + $14 +$12 + $10 + $8) – (7)($8) = $98 – $56 = $42.
SOLUTIONS
ACTIVITY 3-13 (CONTINUED)
CEE-APE_MACROSE-12-0101-MITM-Book.indb 312 26/07/12 5:26 PM
Purchase your 4th Edition AP Microeconomics and Macroeconomics Teacher Resources and Student workbooks today!

Advanced Placement Economics Microeconomics: Teacher Resource Manual © Council for Economic Education, New York, N.Y. 313
3 Microeconomics
10. How does the total profit of the perfectly discriminating monopolist compare to the consumersurplus that existed in the perfectly competitive market? [See Question 6 (C).] Why?They are equal because the perfectly discriminating monopolist was able to capture all theconsumer surplus from each individual consumer.
11. Is the total profit for a regular monopolist different from the total profit of a monopolist that isable to practice perfect price discrimination? Why?Yes. The total profit of a nondiscriminating monopolist is smaller than that of the monopolistwho can practice perfect price discrimination. The latter captures all the consumer surplusbecause it does not have to sell its output at one price.
12. Is the output the same for perfect competition and perfect price discrimination? Why?Yes. In these two examples, price is equal to marginal revenue. The perfectly competitive firmcan sell all the output it wants at the market price, so it has P = MR. Even though the perfectlydiscriminating monopolist must reduce its price to sell more output, it also has P = MR becauseit can charge a unique price to each consumer. Because each firm faces the same MC, the outputin each market structure will be the same where P = MC.
13. Is there a deadweight loss resulting from the non-discriminating monopolist? What about fromthe monopolist with first-degree price discrimination?There is a deadweight loss from the nondiscriminating monopolist because the output is lessthan the socially optimal output which would occur in the perfectly competitive model. There isno deadweight loss from the discriminating monopolist, however, because the output is the sameas in the perfectly competitive model.
14. If an orange sells in Nebraska for $1.00 and the same quality orange sells in Florida for only $0.50,is this clear evidence of price discrimination? Why?No. The price difference could reflect the cost of transporting the orange from Florida (where itwas produced) to Nebraska.
15. What is an example of price discrimination that works in favor of students?Students often receive a lower price for movie tickets than do “regular” people. Because it is thesame service at the same cost of production, this is an example of price discrimination.
SOLUTIONS
ACTIVITY 3-13 (CONTINUED)
CEE-APE_MACROSE-12-0101-MITM-Book.indb 313 26/07/12 5:26 PM
Purchase your 4th Edition AP Microeconomics and Macroeconomics Teacher Resources and Student workbooks today!

CEE-APE_MACROSE-12-0101-MITM-Book.indb 314 26/07/12 5:26 PM

Advanced Placement Economics Microeconomics: Teacher Resource Manual © Council for Economic Education, New York, N.Y. 315
3 Microeconomics
Regulating a Monopoly
There are some firms that have decreasing marginal costs over a large range of output. As long as marginal cost (MC) is below average total cost (ATC), the firm also will experience decreasing ATC. Such firms are called natural monopolies and are often regulated by a governmental agency that allows the firm to be the only provider of the service. This is an attempt to take advantage of the low average total cost of the firm. This activity lets you explore several regulation plans and their effects on the firm and the market.
Suppose you are the manager of a local natural monopoly. Figure 3-14.1 illustrates the revenue and cost functions of your monopoly.
Figure 3-14.1 Revenue and Cost Functions
QUANTITY (1,000s)MR
D
RE
VE
NU
E, C
OS
T
$4
$8
$12
10 2 3 4 5 6 7 8
$16
$20
$24
$26
$28
$30
$32
$34
$2
$6
$10
$14
$18
$22
MC
ATC
SOLUTIONS
ACTIVITY 3-14
CEE-APE_MACROSE-12-0101-MITM-Book.indb 315 26/07/12 5:26 PM
Purchase your 4th Edition AP Microeconomics and Macroeconomics Teacher Resources and Student workbooks today!
316 Advanced Placement Economics Microeconomics: Teacher Resource Manual © Council for Economic Education, New York, N.Y.
3 Microeconomics
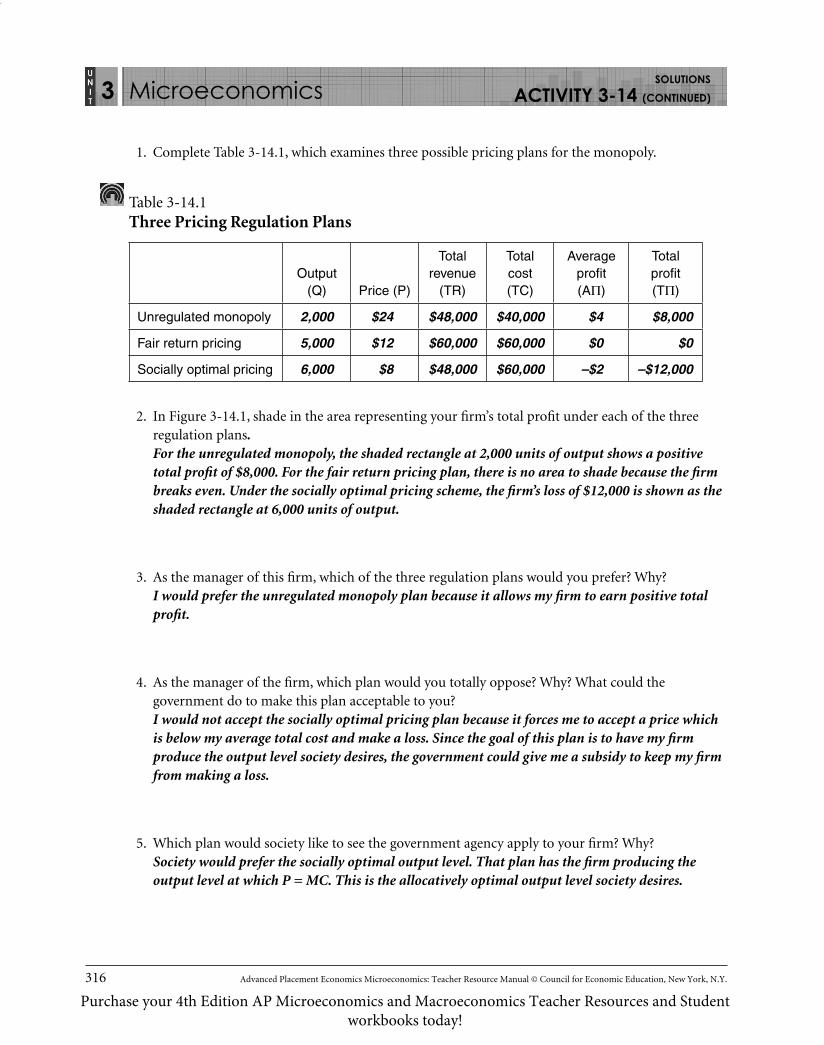
1. Complete Table 3-14.1, which examines three possible pricing plans for the monopoly.
Table 3-14.1 Three Pricing Regulation Plans
Output (Q) Price (P)
Total revenue
(TR)
Total cost (TC)
Average profit (AP)
Total profit (TP)
Unregulated monopoly 2,000 $24 $48,000 $40,000 $4 $8,000
Fair return pricing 5,000 $12 $60,000 $60,000 $0 $0
Socially optimal pricing 6,000 $8 $48,000 $60,000 –$2 –$12,000
2. In Figure 3-14.1, shade in the area representing your firm’s total profit under each of the threeregulation plans.For the unregulated monopoly, the shaded rectangle at 2,000 units of output shows a positivetotal profit of $8,000. For the fair return pricing plan, there is no area to shade because the firmbreaks even. Under the socially optimal pricing scheme, the firm’s loss of $12,000 is shown as theshaded rectangle at 6,000 units of output.
3. As the manager of this firm, which of the three regulation plans would you prefer? Why?I would prefer the unregulated monopoly plan because it allows my firm to earn positive totalprofit.
4. As the manager of the firm, which plan would you totally oppose? Why? What could thegovernment do to make this plan acceptable to you?I would not accept the socially optimal pricing plan because it forces me to accept a price whichis below my average total cost and make a loss. Since the goal of this plan is to have my firmproduce the output level society desires, the government could give me a subsidy to keep my firmfrom making a loss.
5. Which plan would society like to see the government agency apply to your firm? Why?Society would prefer the socially optimal output level. That plan has the firm producing theoutput level at which P = MC. This is the allocatively optimal output level society desires.
SOLUTIONS
ACTIVITY 3-14 (CONTINUED)
CEE-APE_MACROSE-12-0101-MITM-Book.indb 316 26/07/12 5:26 PM
Purchase your 4th Edition AP Microeconomics and Macroeconomics Teacher Resources and Student workbooks today!

Advanced Placement Economics Microeconomics: Teacher Resource Manual © Council for Economic Education, New York, N.Y. 317
3 Microeconomics
6. Under the fair return pricing plan, does your firm earn an economic profit? Does it earn a normalprofit?No, it does not earn an economic profit; it breaks even. Yes, it does earn a normal profit becauseits implicit costs are included in the economic costs.
7. Each of the three plans has its own rule for deciding how many units of output your firm willprovide. State those rules.
(1) Unregulated monopoly: produce the quantity at which MR = MC.
(2) Fair return pricing: produce the quantity at which P = ATC.
(3) Socially optimal pricing: produce the quantity where P = MC.
SOLUTIONS
ACTIVITY 3-14 (CONTINUED)
CEE-APE_MACROSE-12-0101-MITM-Book.indb 317 26/07/12 5:26 PM
Purchase your 4th Edition AP Microeconomics and Macroeconomics Teacher Resources and Student workbooks today!

CEE-APE_MACROSE-12-0101-MITM-Book.indb 318 26/07/12 5:26 PM

Advanced Placement Economics Microeconomics: Teacher Resource Manual © Council for Economic Education, New York, N.Y. 319
3 Microeconomics
Comparing Perfect Competition and Monopoly
The productivity and cost curves of a firm are the same regardless of the degree of competition the firm faces in the product market. The shapes of the productivity and cost curves depend on the productivity of resources and the prices the firm pays to acquire those resources. It is on the revenue side of the firm that we find the impact of the type of product market in which the firm sells its good or service.
Part A: A Comparison of Firms
Answer the following questions based on Figure 3-15.1, which shows the revenue and cost functions of a monopoly and a perfectly competitive firm. Assume the monopoly will charge only one price for output (i.e., it does not price discriminate).
Figure 3-15.1 Revenue and Cost Functions for a Monopoly and a Perfectly Competitive Firm
0
FG
HK
RE
VE
NU
E, C
OS
T
N
A B EMR
J
D
D = MRW
U
YX
MC MCATC
A Monopoly
QUANTITY
0
F
GH
K
RE
VE
NU
E, C
OS
T
A B E Z
XW
U
ATC
A Perfectly Competitive Firm
QUANTITY
Note: The values of coordinates are not the same in both graphs. For example, the value of 0K is greater in the monopoly graph than is the value of 0K in the graph of the competitive firm.
1. The monopoly will maximize its total profit by producing _____ units of output.
(A) 0A (B) 0B (C) 0E (D) 0J
2. The perfectly competitive firm will maximize its total profit by producing _____ units of output.
(A) 0A (B) 0B (C) 0E (D) 0Z
3. The profit-maximizing price for the monopoly is
(A) 0F. (B) 0G. (C) 0H. (D) 0K.
SOLUTIONS
ACTIVITY 3-15
CEE-APE_MACROSE-12-0101-MITM-Book.indb 319 26/07/12 5:26 PM
Purchase your 4th Edition AP Microeconomics and Macroeconomics Teacher Resources and Student workbooks today!

320 Advanced Placement Economics Microeconomics: Teacher Resource Manual © Council for Economic Education, New York, N.Y.
3 Microeconomics
4. The profit-maximizing price for the perfectly competitive firm is
(A) 0F. (B) 0G. (C) 0H. (D) 0K.
5. The maximum total profit of the monopoly is shown by the coordinates
(A) AX. (B) UX. (C) GWXK. (D) 0AXK.
6. The maximum total profit of the perfectly competitive firm is shown by the coordinates
(A) EU. (B) UX. (C) 0EUK. (D) HXUK.
7. The maximum average profit of the perfectly competitive firm is at output
(A) 0A. (B) 0B. (C) 0E. (D) 0Z.
8. The marginal profit of the monopoly is $0 at output
(A) 0A. (B) 0B. (C) 0E. (D) 0J.
9. The marginal profit of the perfectly competitive firm is $0 at output
(A) 0A. (B) 0B. (C) 0E. (D) 0Z.
10. The marginal profit of the perfectly competitive firm is maximized at output
(A) 0A. (B) 0B. (C) 0E. (D) 0Z.
11. At output 0A, the total cost of the monopoly is shown by the coordinates
(A) AU. (B) AW. (C) 0AUF. (D) 0AWG.
12. The monopolist will maximize its total revenue at output
(A) 0A. (B) 0B. (C) 0E. (D) 0J.
13. What price will the perfectly competitive firm charge when it is in long-run equilibrium?
(A) 0F (B) 0G (C) 0H (D) 0K
14. What area represents consumer surplus when the monopoly maximizes its total profit?
(A) KXN (B) 0AXN (C) GWXN (D) HYN
15. The profit-maximizing output of the monopoly is _______ the output society would like the firmto produce.
(A) greater than (B) equal to (C) less than
16. The profit-maximizing output of the perfectly competitive firm is _______ the output societywould like the firm to produce.
(A) greater than (B) equal to (C) less than
17. Is the perfectly competitive firm in a position of long-run equilibrium?
(A) Yes (B) No (C) We need more information.
SOLUTIONS
ACTIVITY 3-15 (CONTINUED)
CEE-APE_MACROSE-12-0101-MITM-Book.indb 320 26/07/12 5:26 PM
Purchase your 4th Edition AP Microeconomics and Macroeconomics Teacher Resources and Student workbooks today!

Advanced Placement Economics Microeconomics: Teacher Resource Manual © Council for Economic Education, New York, N.Y. 321
3 Microeconomics
18. Which firm will operate at the minimum point of its ATC curve in long-run equilibrium?
(A) Only the perfectly competitive firm
(B) Only the monopolistic firm
(C) Both firms
(D) Neither firm
Part B: A Comparison of Markets
Figure 3-15.2 shows a perfectly competitive market with demand curve D and supply curve S. The equilibrium output is Q
2, and the equilibrium price is 0F. If the market were to become a monopoly, the
firm would restrict output to some smaller output such as Q1. Answer the questions below Figure 3-15.2.
Figure 3-15.2 Comparing Perfect Competition and Monopoly
Q10
X
J
YS
DA
BF
H
PR
ICE
QUANTITY
W
Q2
19. Complete Table 3-15.1 with the coordinates of the variables under each type of market.
Table 3-15.1 Comparing Perfect Competition and Monopoly
Market type Consumer surplus Producer surplus Total surplus*
Perfect competition FYW AFY AWY
Monopoly HWJ AHJX AWJX
*Total surplus is also called total welfare and social welfare.
20. Explain what the triangle JXY represents.This shows the deadweight loss to society from the perfectly competitive market becoming amonopoly. Society loses the total surplus from those units between Q
1 and Q
2 because those units
will not be produced if the market is a monopoly.
SOLUTIONS
ACTIVITY 3-15 (CONTINUED)
CEE-APE_MACROSE-12-0101-MITM-Book.indb 321 26/07/12 5:26 PM
Purchase your 4th Edition AP Microeconomics and Macroeconomics Teacher Resources and Student workbooks today!