the right route
DESCRIPTION
In our report we have developed five case studies to show how the Government's system affects the transport schemes that go ahead in different locations, by favouring car use above cycling, walking and public transport. We put the original data from these schemes through our proposed revised version of NATA to show how the results could have been different if the appraisal process was changed. Our case studies illustrate the effect that these decisions could have had on people’s lives.TRANSCRIPT

The right route Improving transport decision making

1The right route
ContentsThe right route Improving transport decision-making
By Rachel Cary, Rebekah Phillips and James Harwood
Published by Green Alliance, November 2009 Designed by Howdy
ISBN 978-1-905869-29-9
This report summarises some of the main points of a larger piece of research we commissioned from Keith Buchan, Metropolitan Transport Research Unit (MTRU). Investing in Transport: Making the Change is available from the Green Alliance website.
This report was prepared with advice and support from the Campaign for Better Transport (www.bettertransport.org.uk)
We would also like to thank the individuals that agreed to be interviewed for the case studies.
Executive summary 2
Introduction 4
Improving transport decision-making 6
Improving the model 8
Case studies: what this means in real life 11
Merseytram: the development of a new tram scheme for Merseyside 12
Improving the Grand Union Canal passing through Park Royal 15
How to solve congestion in the Cambridge area? 16
Summary 22
Findings and recommendations 23Green AllianceGreen Alliance is an independent charity. Our mission is to promote sustainable development by ensuring that environmental solutions are a priority in British politics. We work with representatives from the three main political parties, government, business and the NGO sector to encourage new ideas, facilitate dialogue and develop constructive solutions to environmental challenges.
AcknowledgementsThis work is part of Green Alliance’s climate and energy theme and has been kindly sponsored by the following organisations

The right route2 3The right route
Executive summary
It must be noted that even this simple table has been difficult to produce because the NATA guidance on how the greenhouse gas objective should be treated is ambiguous and is, in places, misleading. Thus, there are sometimes no figures for present day emissions, which are essential if the scheme is to be assessed against the targets for reduction now built into the 2008 Climate Change Act and accepted by DfT.
What the table shows is that the overall BCR of a number of the schemes changes significantly under the revised appraisal model. If the model were to be reformed further in line with our suggestion to better account for time and carbon savings, the numbers would change even further.
Green Alliance recommends that Government take the following actions to improve transport appraisal:
• reassess all of the approved/proposed transport schemes where contracts have not been finalised to test their value for money, using the revised cost-benefit analysis model. Any schemes that do not meet the revised criteria should be removed from the transport programme;
• reform the decision-making process so that it is more accountable, transparent and joined-up. More consideration should be given to ensuring that guidance is followed and good quality appraisals are developed in every case;
• consider the alternatives in each appraisal to ensure that the best value for money scheme is selected;
• create an independent body to evaluate the solutions to transport problems. This should work within an overall strategic framework, and should only allow schemes that contribute to the government’s objectives to proceed;
• reform the transport appraisal model further to take better account of the impact of any proposed scheme on national carbon targets and sensibly assess time savings.
This would achieve better value for money for the tax payer and transport schemes that are able to deliver the government’s objectives. In particular it would enable the Department for Transport to deliver on its carbon reduction targets.
The UK transport system is being put under increasing pressure, as people demand ever-growing mobility. Both passenger and freight road vehicle kilometres continue to rise. Car traffic increased between 2006 and 2007 by 1.5 billion vehicle kilometres and the number of households with two cars or more now exceeds those without one1. The environmental impact of transport poses a real problem and concern over local air pollution, noise and rising carbon emissions cannot be ignored. In addition there are growing calls for greater accessibility and a need to reclaim our increasingly car dominated streets.
The recession and growing budget deficit has put an enormous strain on public finances and it is vital that good value for money transport schemes are selected. The introduction of departmental carbon budgets means that the Department for Transport (DfT) will now have responsibility for the majority of carbon emissions from the transport sector2. Given the long lifetimes of most transport infrastructure, we need to ensure that the schemes built now don’t lock us into high carbon lifestyles that could jeopardise success against our future carbon targets.
Transport decision-making in the UK today however does not reflect these challenges and is not fit for purpose. In many cases it is in direct conflict with the government’s own objectives, which include reducing transport related carbon emissions and promoting travel modes beneficial to health3.
To decide which transport schemes to fund, DfT uses an appraisal framework that includes a form of cost-benefit analysis. This was revised and broadened in 1998, but still favoured road schemes. Green Alliance and Campaign for Better Transport published a report in 20084, which supported a revision of the appraisal model. We are pleased that some of our recommendations were taken on board. However, there are still fundamental flaws in the cost-benefit analysis model.
In this report we showcase five types of transport schemes that have passed through the existing decision-making process. These illustrate the problems with the current transport appraisal system in the UK.
Our analysis shows that the recent revision to the government’s transport appraisal model makes public transport schemes look far more cost effective, and road expansion schemes less so.
But we also found that:
• the appraisal model is still not reflecting national objectives, as it does not take proper account of carbon reduction targets and exaggerates the value of small time savings;
• the decision-making process is far from transparent and lacks co-ordination across regions;
• there is an absence of reliable data and a lack of co-ordination in the decision-making process;
• insufficient attention is given to alternative schemes that could offer better value for money;
• individual schemes are implemented in isolation without proper consideration being given to demand management and multi-modal approaches that may be significantly more cost effective.
The Government’s transport appraisal system, the New Approach to Transport Appraisal (NATA), relies heavily on the results of a cost-benefit analysis that produces a single figure, a Benefit Cost Ratio (BCR), for each scheme assessed. The higher the number, the more beneficial the scheme is deemed to be. The table on the following page summarises the BCR for each of the case studies in this report. It gives the BCR under the original NATA, the revised NATA and under a NATA that is revised further in line with our recommendations to better account for carbon emissions.
Table 1: Summary of comparative results under different NATA assumptions
Benefit Cost Ratio (BCR) under original appraisal model
BCR under revised appraisal model
BCR under appraisal model with further reforms
Tram Merseytram 1.97 2.07 2.85*
Cycle Grand Union Canal Cycle Path
38.4 75.0 75.0
Road Improving the A14 between Ellington and Fen Ditton
10.83 6.69 1.3 – 3.25**
Bus Guided busway Cambridge to St Ives
4.8 6.4 7.9**
Rail Freight Expansion of rail freight (Felixstowe – Nuneaton)
5.25 10.4 10.4***
* Based on moving to a 60 year appraisal. The Merseytram case study provides several examples of how small changes in the treatment of tax revenues has a strong impact on the benefits (see the main report, Investing in Transport: Making the Change)
** Based on limited data
*** The carbon benefit of the rail freight scheme was already factored into the original analysis hence there is no change
The right route4 5The right route
Introduction
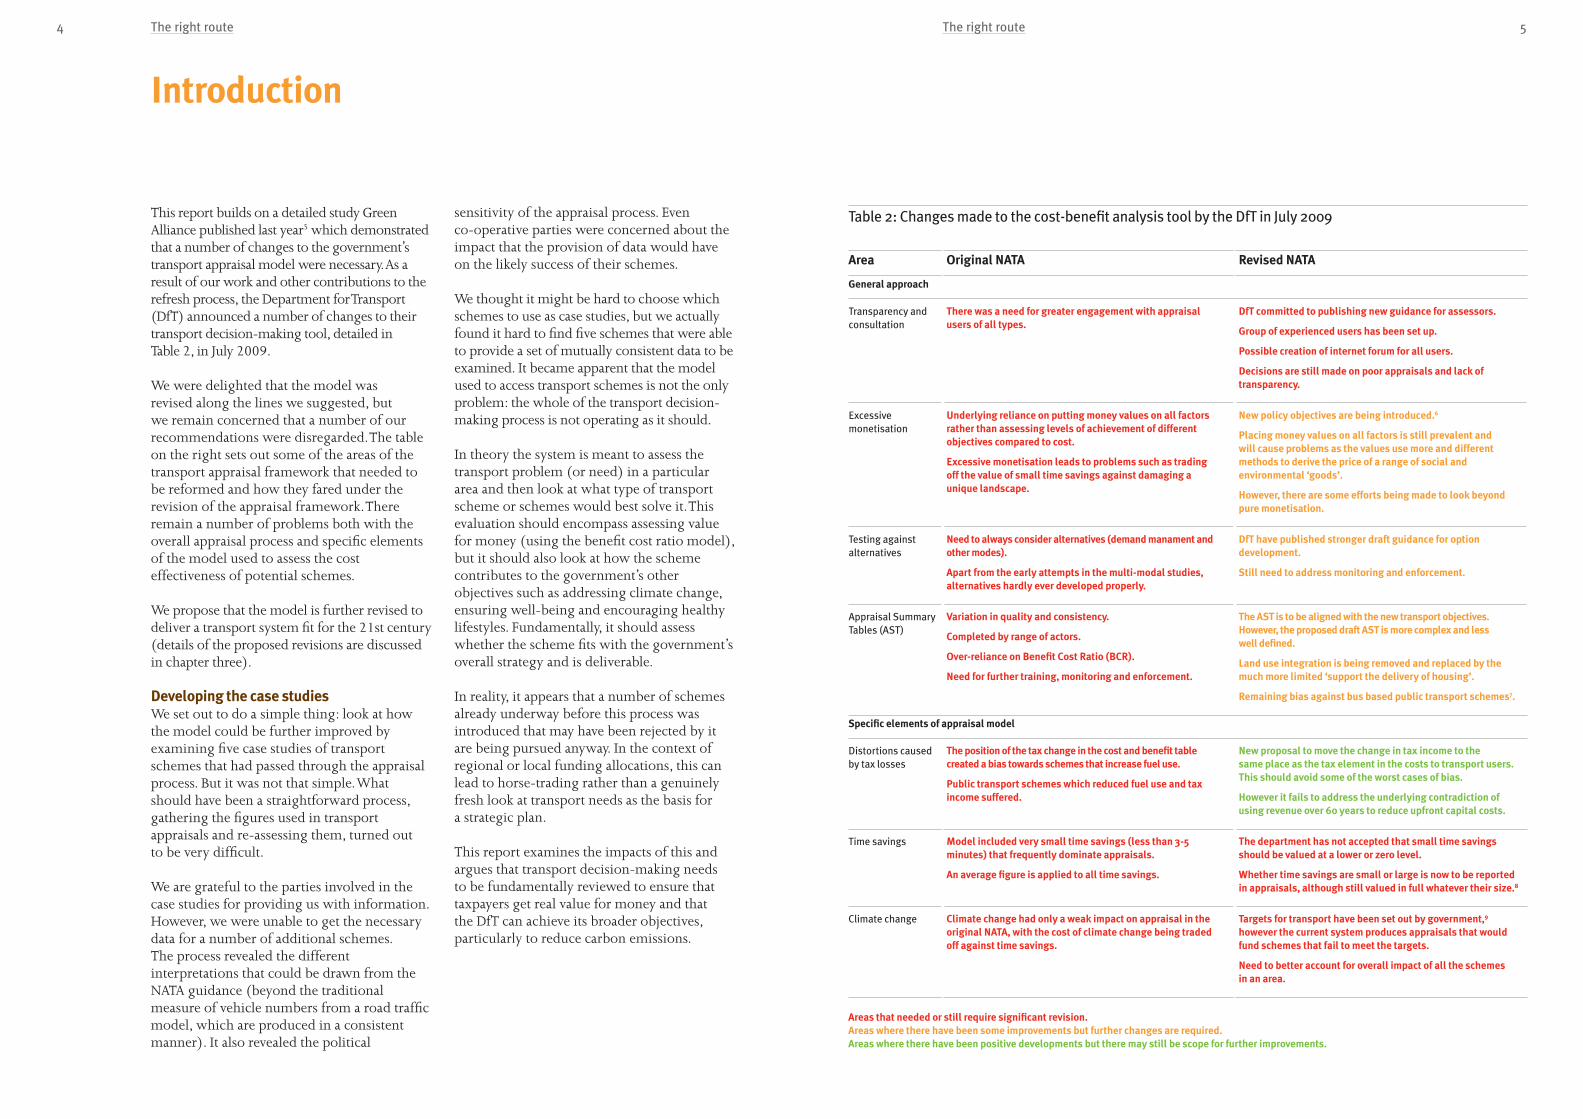
This report builds on a detailed study Green Alliance published last year5 which demonstrated that a number of changes to the government’s transport appraisal model were necessary. As a result of our work and other contributions to the refresh process, the Department for Transport (DfT) announced a number of changes to their transport decision-making tool, detailed in Table 2, in July 2009.
We were delighted that the model was revised along the lines we suggested, but we remain concerned that a number of our recommendations were disregarded. The table on the right sets out some of the areas of the transport appraisal framework that needed to be reformed and how they fared under the revision of the appraisal framework. There remain a number of problems both with the overall appraisal process and specific elements of the model used to assess the cost effectiveness of potential schemes.
We propose that the model is further revised to deliver a transport system fit for the 21st century (details of the proposed revisions are discussed in chapter three).
Developing the case studiesWe set out to do a simple thing: look at how the model could be further improved by examining five case studies of transport schemes that had passed through the appraisal process. But it was not that simple. What should have been a straightforward process, gathering the figures used in transport appraisals and re-assessing them, turned out to be very difficult.
We are grateful to the parties involved in the case studies for providing us with information. However, we were unable to get the necessary data for a number of additional schemes. The process revealed the different interpretations that could be drawn from the NATA guidance (beyond the traditional measure of vehicle numbers from a road traffic model, which are produced in a consistent manner). It also revealed the political
sensitivity of the appraisal process. Even co-operative parties were concerned about the impact that the provision of data would have on the likely success of their schemes.
We thought it might be hard to choose which schemes to use as case studies, but we actually found it hard to find five schemes that were able to provide a set of mutually consistent data to be examined. It became apparent that the model used to access transport schemes is not the only problem: the whole of the transport decision-making process is not operating as it should.
In theory the system is meant to assess the transport problem (or need) in a particular area and then look at what type of transport scheme or schemes would best solve it. This evaluation should encompass assessing value for money (using the benefit cost ratio model), but it should also look at how the scheme contributes to the government’s other objectives such as addressing climate change, ensuring well-being and encouraging healthy lifestyles. Fundamentally, it should assess whether the scheme fits with the government’s overall strategy and is deliverable.
In reality, it appears that a number of schemes already underway before this process was introduced that may have been rejected by it are being pursued anyway. In the context of regional or local funding allocations, this can lead to horse-trading rather than a genuinely fresh look at transport needs as the basis for a strategic plan.
This report examines the impacts of this and argues that transport decision-making needs to be fundamentally reviewed to ensure that taxpayers get real value for money and that the DfT can achieve its broader objectives, particularly to reduce carbon emissions.
Table 2: Changes made to the cost-benefit analysis tool by the DfT in July 2009
Area Original NATA Revised NATA
General approach
Transparency and consultation
There was a need for greater engagement with appraisal users of all types.
DfT committed to publishing new guidance for assessors.
Group of experienced users has been set up.
Possible creation of internet forum for all users.
Decisions are still made on poor appraisals and lack of transparency.
Excessive monetisation
Underlying reliance on putting money values on all factors rather than assessing levels of achievement of different objectives compared to cost.
Excessive monetisation leads to problems such as trading off the value of small time savings against damaging a unique landscape.
New policy objectives are being introduced.6
Placing money values on all factors is still prevalent and will cause problems as the values use more and different methods to derive the price of a range of social and environmental ‘goods’.
However, there are some efforts being made to look beyond pure monetisation.
Testing against alternatives
Need to always consider alternatives (demand manament and other modes).
Apart from the early attempts in the multi-modal studies, alternatives hardly ever developed properly.
DfT have published stronger draft guidance for option development.
Still need to address monitoring and enforcement.
Appraisal Summary Tables (AST)
Variation in quality and consistency.
Completed by range of actors.
Over-reliance on Benefit Cost Ratio (BCR).
Need for further training, monitoring and enforcement.
The AST is to be aligned with the new transport objectives. However, the proposed draft AST is more complex and less well defined.
Land use integration is being removed and replaced by the much more limited ‘support the delivery of housing’.
Remaining bias against bus based public transport schemes7.
Specific elements of appraisal model
Distortions caused by tax losses
The position of the tax change in the cost and benefit table created a bias towards schemes that increase fuel use.
Public transport schemes which reduced fuel use and tax income suffered.
New proposal to move the change in tax income to the same place as the tax element in the costs to transport users. This should avoid some of the worst cases of bias.
However it fails to address the underlying contradiction of using revenue over 60 years to reduce upfront capital costs.
Time savings Model included very small time savings (less than 3-5 minutes) that frequently dominate appraisals.
An average figure is applied to all time savings.
The department has not accepted that small time savings should be valued at a lower or zero level.
Whether time savings are small or large is now to be reported in appraisals, although still valued in full whatever their size.8
Climate change Climate change had only a weak impact on appraisal in the original NATA, with the cost of climate change being traded off against time savings.
Targets for transport have been set out by government,9 however the current system produces appraisals that would fund schemes that fail to meet the targets.
Need to better account for overall impact of all the schemes in an area.
Areas that needed or still require significant revision. Areas where there have been some improvements but further changes are required. Areas where there have been positive developments but there may still be scope for further improvements.

The right route6 7The right route
Improving transport decision-making
The system is rife with appraisals in which one or more elements are of poor quality.There is a low level of auditing of the overall quality of appraisals, apart from traffic modelling. This means that the quality of the assessment varies wildly from scheme to scheme. This is not being addressed, and appraisals are too often accepted rather than being sent back for revision and improvement. In particular, strategic policy fit and deliverability, which are also meant to be assessed, are often overlooked in favour of reliance on the output from the cost-benefit model.
In addition, the full benefits of some public transport schemes are not being assessed (particularly passenger rail outside urban areas). This is because detailed multi-modal transport models are often not available for suburban and rural rail corridors and so the required data is not available. In many cases the schemes already have an economic business case, therefore further further benefits are not needed to justify the scheme. Many private sector bus schemes are progressed on account of their commercial benefits alone. Simple estimates of the benefits resulting from the congestion relief and reduced carbon emissions associated with these schemes should be calculated so that the full benefits can be taken into account. This would make the analysis more consistent with other schemes and help decision-makers in allocating limited resources in the coming years.
The system lacks an independent referee. The Department for Transport is the body that assesses transport schemes and is the ultimate decision-maker. However in a given year the department may need to assess as many as 100 individual schemes and hundreds more in local and regional packages. This is very resource intensive if it is to be done properly. This means that a number of schemes manage to get through the decision-making process without any real assessment or evaluation until they get to Public Inquiry. This is far too late, and wasteful in terms of time and cost. The money spent setting up such a referee would be more than offset by money saved on letting poor value for money schemes go ahead.
The sensitivities that people felt when providing data for this project, or indeed the failure of guidance to ensure that they gathered the data required, highlighted the lack of transparency and politicised nature of transport decision-making.
It is clear that what should be an objective process of analysing a particular transport problem or need, and then looking at which transport scheme(s) could best address it, is far from objective.
There are four main problems with how the process currently works:
There is no proper assessment process looking at transport at a national level.This should ask what the national transport problems are and how they are best solved, given other policy objectives. A broad directional strategy for decision-makers on a regional basis would help guide them towards the kinds of proposals that are likely to help achieve these aims. Most regional spatial strategies have failed to properly address transport systems at a regional scale. Under the Planning Act 2008, Government now has to provide guidance on its policy for infrastructure in a series of National Policy Statements. However these will only cover large-scale transport infrastructure (ports, national networks10 and aviation) and it is yet to be seen whether they will provide an adequate framework to address transport needs at a regional level.
Not enough time is being given to generate the various different potential transport options in an area. What happens currently is that a particular, often long standing, scheme is promoted and the bare minimum assessments are done on alternatives, so that when the decision-maker looks at and compares them, the favoured scheme comes out as the best option. This means that potentially the best value for money scheme is either not even worked up, or may be worked up poorly so it doesn’t get the go-ahead. Where a local or regional package approach is used, it is too often a collection of arbitrary local schemes agreed as a result of inter-authority bargaining rather than an integrated package that will achieve government objectives.
A number of the multi-modal studies conducted at the beginning of this decade were based around existing road schemes rather than a proper consideration of alternative options. More recently a number of the regional funding allocation processes have been heavily influenced by long-lived road scheme proposals.
Our case studies demonstrate the lack of consistency in the consideration of alternatives at the scheme level. The development of the Merseytram scheme involved the proper assessment of a number of bus-based alternatives. In contrast, the original multi-modal package developed to address congestion in the Cambridge-Huntingdon corridor in 2001 has not been fully implemented nor has there been a consideration of alternatives at the individual scheme level.

The right route8 9The right route
Improving the model
There are two broad ways that this might be dealt with.
Pass or fail test If the scheme, along with other schemes in an area, cannot demonstrate that it achieves the lower emission targets (by reducing current emissions by at least 14% a year from 200814), it should be sent back to promoters as not being in line with core government policy.
Factoring in impact on government targets If the individual impact is to be assessed, this would be done by looking at the excess emissions over (or under) the target with the scheme in place, and costing all of these in the appraisal. This is explained more fully in the MTRU technical report that accompanies this report.
We suggested that the first method is used initially to select the best scheme from a range of options (and to trigger the development of new options where a scheme or package of individual schemes fail). Once a scheme or package is selected we suggest that the second approach is used to calculate the carbon benefits or costs in relation to the reduction targets.
If the second approach is used, it is also important that the cost of the additional carbon produced is added to the capital cost of a scheme and not traded off against time savings (as is the current approach). If a scheme resulted in carbon emissions above the reduction target then reductions elsewhere would have to be bought by investing in additional projects that reduce carbon emissions.
Time savingsThe way the appraisal model deals with time savings is very important as in many cases the economic value given to the time saved by passengers dominates the overall BCR.
There are a number of specific issues relating to the way time savings are viewed:
• Dominance of car user time savings. Time savings to motorised road users tend to dominate most transport appraisals due to the large number of passengers involved. In relation to road schemes this is no surprise, but it is also the case that public transport and even rail freight schemes have their appraisals powerfully influenced by car and lorry passenger time savings. This is often what would cause them to pass or fail the DfT criteria. This is certainly the case for the tram and rail freight case studies we looked at.
• Theoretical value of time. The dominance of car time savings in appraisals might not be a problem if the savings represented real money. However, the savings do not appear in any real world balance sheets, or household budgets, and are never tracked or audited. In fact, private user time savings are based on surveys of what people say they would theoretically be willing to pay to save time. Business time savings are based on estimates of the labour costs of travel undertaken for work purposes.
• The analysis still includes small time savings. Small time savings may not be of particular value to individuals; instead reliability may be more important. Aggregating small time savings across lots of people suggests a greater benefit than is the reality. Whilst the revised NATA is more transparent as it sets out the impact of small time savings, they are included in the overall figure produced upon which the judges of potential schemes frequently rely.
At the heart of transport decision-making is a cost-benefit analysis model. The model puts a value on all the costs and benefits of a particular scheme, from the direct cost of materials and labour involved to a value on the carbon emissions and noise pollution the scheme creates. It sums up these costs and benefits and produces a simple assessment summary table of them all, and produces a single figure, the Benefit Cost Ratio (BCR). The higher the figure, the better value for money a scheme is deemed.
A qualitative assessment is also undertaken which assesses the scheme against a number of environmental and social criteria.
Under the Government’s transport appraisal system, the New Approach to Appraisal (NATA), decision-makers are meant to use a range of tools when deciding which transport schemes to support:
• a summary table which sets out the results of the qualitative and quantitative analysis;
• the overall BCR figure produced by the cost-benefit appraisal model; and
• a broader assessment of strategic policy fit and deliverability.
However the figure produced by the cost-benefit model is heavily relied on; it is the key engine in transport decision-making.
The model was fundamentally flawed until the DfT revised it in 2009. You can see how it was changed in the more detailed MTRU report, Investing in transport: making the change, which is published alongside this report. We highlighted the problems the DfT needed to address in our report on this subject published last year11.
However, the department didn’t adopt all of our recommendations and there are still a number of worrying problems that remain with the model itself. It was the remaining anomalies with this model that we initially set out to highlight in this report.
We welcome moves to increase the value assigned to health benefits arising from walking and cycling schemes. However the health disbenefit of other schemes, which lock in unhealthy travel, should be given further consideration. The model still fails to adequately deal with two vital areas: carbon emissions and time savings. We discuss these two areas below.
Carbon emissionsThis is one of the key issues with the cost-benefit analysis model as it stands. Currently in NATA the carbon impact of an individual scheme is assessed against a business as usual scenario, which assumes that emissions slowly increase12. This is misleadingly called the ‘Do Minimum’ scenario in NATA. The scheme is then assessed to be ‘good’ if it results in less carbon emissions than the business as usual scenario. However, the business as usual scenario is ‘bad’ as it assumes emissions rise, and the targets essential to climate change mitigation are not met. Thus schemes that result in increased emissions, but emissions that are not higher than the baseline, appear to be ‘good’. If this approach were followed for all appraisals nationally, the Climate Change Act targets would not be met.
The contribution of an individual scheme to overall national carbon targets is ignored in the analysis13 and is, instead, meant to be addressed at a regional or national level by someone with an oversight of all schemes. However this structure is not in place.

The right route10 11The right route
• It assigns an economic value to time savings in the very distant future. As the value of time savings is based on surveys of people’s willingness to pay now, there are serious problems with the rationale of using this to value time saved in 30 or 60 years time. As time savings are discounted by three per cent but grow in line with GDP, they fall less quickly than certain other benefits so they continue to dominate in the long-term. We cannot possibly know what our future transport and communication systems will be in the distance future, given the vast changes that have taken place in the last 30, let alone 60 years. This uncertainty is not however relected in current appraisals.
• The approach results in perverse impacts. It is also questionable whether the short-term time saving resulting from a scheme leads to long-term benefits. In effect what has happened is that time savings on a route have simply allowed people to take longer routes. It has also contributed to a more dispersed patterns of land use with facilities (including shops and healthcare) getting bigger and fewer. One unfortunate side effect has been to reduce the self-sufficiency of local communities and the ability to access local facilities without driving.
Green Alliance suggests that this approach results in the wrong schemes being selected and is not beneficial for public transport and road users alike. Road schemes that are predicted to result in lots of small time savings are selected rather than ones that improve reliability and potentially reduce fuel consumption.
DfT should reassess how time savings are accounted for. With immediate effect, the appraisal process should include a sensitivity test, which calculates the overall BCR without small time savings. The treatment of benefits in the distant future needs to be reassessed (eg by considering the benefits over the next 20, 40 and 60 years rather than just over the next 60 years).
In each of the case studies presented in the next chapter we look at what the impact would be of reforming the appraisal model along the lines suggested above.
What does reforming transport decision-making look like in real life?
The case studies that we focused on highlight the problems with the cost-benefit analysis model that the Department for Transport has used for assessing transport schemes up until now. In certain cases they also illustrate the problems with the whole decision-making process.
What the case studies strongly show is the huge impact of reassessing transport schemes with the DfT’s new version of the cost-benefit analysis model, fundamentally changing which schemes are seen as value for money. The road case study goes down in value for money and the rail, bus and cycling schemes increase significantly. It also shows how further reform of the NATA model would have an even greater impact.
These case studies support our argument for the reassessment of any schemes waiting to be built with the DfT’s new version and for further reform of the cost-benefit analysis model.
They also show that transport is ultimately about people and the way they are able to live. The vagaries of a transport cost-benefit analysis model can affect which transport choices people make. If, for example, a new road scheme, rather than a bus or tram system is supported by the model and therefore goes ahead in an area, it means that those without a car will continue to find it hard to get around, and those with cars will have no choice but to continue to use them.
Below we discuss the following case studies:
• a tram scheme in Merseyside that has yet to progress;
• a cycling case study on the Grand Union canal that has been implemented; and
• three schemes which run through the Cambridge Huntingdon corridor: road expansion, busway scheme and rail freight expansion. The bus and rail freight schemes are in construction, and the road expansion scheme is going to a public enquiry.
In each case we assessed the scheme using:
• The original transport appraisal model (NATA 1);
• The revised transport appraisal model currently used by government (NATA Refresh); and
• Further reform to the transport appraisal model to account for the impact on national transport carbon targets (NATA Reform).
We have also considered strategic fit and the impact of the scheme on carbon emissions.

The right route12 13The right route
Case StudyMerseytram: the development of a new tram scheme for Merseyside
The line would also have had a direct link to the Royal Liverpool University Hospital, which has 4,600 staff and 100,000 patients per year, and would have served 20 GP clinics. Currently, the hospital doesn’t have car parking facilities, making it difficult for some patients and families to reach it, especially those with physical disabilities. The tram system would have been fully accessible, with easy access platforms and low floors.
There is no doubt that the line would have had a significant impact on people’s lives, including many that are not formally incorporated into the analysis model. Yet it was never built. Why?
Ultimately money was the reason. Unusually, in 2005, the Department for Transport (DfT) asked the local authority to underwrite any future unforeseen costs of the project, despite the use of fixed price contracts, which the local authority felt unable to do. This was an unusual request: for example it was not used for the Public Finance Initiative (PFI) road scheme in the nearby borough of Halton. With the local authority unable to sign up to this unlimited liability the DfT chose not to release the agreed central government funding.
As shown in the MTRU technical report there were a number of anomalies with the assessment process that meant that the value for money of the proposed scheme was seriously underestimated. One major oversight relates to car users, first, the analysis assumes that users would only be attracted from other public transport schemes and not out of their cars and, second, it underestimates the rising problem of congestion. The case study illustrates the appraisal model’s failure to give credit for schemes that improve the quality of service for existing public transport users and the bias towards small time savings rather than improved reliability. If the BCR had come in much higher, as suggested in the MTRU report, even using the old model, perhaps the government would have been less strict regarding the release of money. Using our proposed model (and even the DfT’s revised version) the figure comes in higher still.
Tabel 3: Comparative results under different NATA assumptions
NATA 1 NATA Refresh NATA Reform
Benefit Cost Ratio (BCR)
1.97 2.07 2.85*
Policy fit Positive Positive Unknown
*Based on moving to 60 years appraisal. The Merseytram provides several examples of how small changes in the treatment of tax revenues has a strong impact on the BCR (see the main report)
Spanning the Mersey Estuary, Merseyside lies in the Northwest of England, nestled between Lancashire, Greater Manchester and Cheshire.
In 2008 Liverpool was named as the most deprived place in England.15 There are high levels of deprivation in surrounding towns, one of these, Kirkby, was referred to by the chief executive of the borough council as a “ghetto that people are forced into, and have to leave in order to look for jobs, shops or entertainment”16.
Merseyside has been subject to many regeneration efforts over the past few decades. In December 2002, the government announced that it would provide £170 million towards the £225 million needed to build a tram system connecting Liverpool with towns in outer Merseyside. This was to be one of the ten new tram systems promised in the government’s ten year transport plan17.
Three different lines were planned: Line 1 would extend northeast to Kirkby, Line 2 eastwards to Preston, and Line 3 south to John Lennon airport.
The residents of Merseyside showed great support for the tram system; opinion polls showed that 90 per cent were in favour of it18.
Analysis using the model showed that the tram’s benefits exceeded its costs (modestly, but it exceeded its costs nonetheless), and following a public enquiry in 2004, the government announced its approval of Merseyside Line 1 and it looked like the scheme would proceed19.
The route of Line 1 would have been from Liverpool city centre via the Royal Liverpool University Hospital to the borough of Knowsley, terminating at Kirkby. More than 100,000 residents live within 800 metres of the proposed line, and 60 per cent of households don’t have access to a car, and thus rely heavily on public transport.
It would have passed by 38 primary schools and ten secondary schools, enrolling more than 17,000 students between them. It would also have served the 20 adult training centres and Knowsley Community College in Kirkby which has 3,500 students.
The line would have also had a significant impact on employment levels. Prior to the 1960s, Kirkby’s industry sector was flourishing however in the following decades unemployment in the area has been considerably higher than the national average. Line 1 would have created 300 new permanent jobs, as well as the 1,000 temporary jobs for its construction. It also would have opened up thousands of new jobs at other regeneration sites, such as the Liverpool Echo arena, Grosvenor’s Liverpool One Retail Development and Stonebridge Business Park. At the moment, it would take residents of Kirkby of Croxteth 40-60 minutes to reach the centre of Liverpool, and for many people this it too long for them to consider taking a job there. The tram system would have reduced this journey time to just 31 minutes, and would have cost the same as a bus ticket, opening up new opportunities.
Cherryfield Drive, Kirby, before Cherryfield Drive, Kirby, after
Line One Line Two Line Three
Page Moss
Liverpool City Centre Edge Lane
Option
Croxteth
Kirkby
Wavertree Technology Park Option
Prescot
Whiston Hospital
Menlove Avenue OptionMather Avenue Option
Railway Route Option
John Lennon Airport
Speke

14 The right route 15The right route
Case StudyImproving the Grand Union Canal passing through Park Royal
Park Royal is Europe’s largest industrial estate and the principal industrial area in West London, covering almost 700 hectares. It accommodates a range of businesses from manufacturing to distribution/logistics and TV/film: it is home to world class companies, household names and hundreds of small and medium sized firms. In total there are some 2,000 businesses employing around 40,000 people. The Park Royal area has been identified by the Mayor of London as an Opportunity Area, with a target to accommodate 11,000 new jobs in the area over the next 20 years.
As well as a large amount of industrial premises, it is also home to some of the most deprived wards in the UK, in terms of both social and employment deprivation.
Much of Park Royal is close to the strategic road network, with the A40 Western Avenue to the south and the A406 North Circular to the west. It is served by ten different bus routes and six underground stations. However the underground stations are on the periphery of the estate and the convoluted network of streets and cul-de-sacs make movement within the area difficult.
The public transport provision is considered to be poor; with bus routes slow and unreliable, while walking and cycling routes are often indirect and badly signed. The nature of the public realm means that walking tends to be unattractive, unpleasant and even unsafe. These factors contribute towards a high dependence on the private car for travel to and around Park Royal. The large amount of congestion, rat running through the estate, and delays are widely believed to be a major deterrent to further commercial investment in the area.
In 2002, the poor state of the towpath, and the common feeling that it was not safe, had led to declined use of the cycling route along the Grand Union Canal. There was a sense among several associated groups, from Sustrans to Brent Council, that access to the Park Royal Estate, and congestion, could be improved by encouraging cycling to the area.
A scheme was proposed to improve six kilometres of the towpath through resurfacing, widening, installing cycle parking, improving ramp access and putting in lighting where feasible. The route, flanked on either side by industrial units, and high-density housing, aimed to provide a safe route for the weekender and a useful, traffic-free route to work for cyclists.
The canal path improvements were undertaken in 2003-04 by British Waterways and the London Borough of Brent. The capital cost was £139,130 (2002 prices). Monitoring undertaken by Sustrans after the scheme’s completion found a marked increase in use of the canal, especially by adult females cycling to work, and concluded that “the objectives of the scheme have been fully met.”20 Commenting in 2007 on a more recent scheme undertaken on the same section of the canal, Jackie Sadek, chief executive of Park Royal Partnership, reported a further 50 per cent increase in use of the canal by employees walking and cycling along the canal since the work began.21
As can be seen from the table below, the impact on the BCR of improving NATA (under the refresh version) has been huge. This is mostly a result of moving the position of the tax revenues, particularly as a result of congestion relief for commuters and thus fuel savings. This means that the fuel tax loss is significant, and changing this to a disbenefit rather than increasing the capital cost of the scheme in turn has a major impact.
The inclusion of a financial figure for the health benefits associated with cycling in the refreshed NATA, also increases the BCR, which has been included in the NATA refresh model.
Table 4: Comparative results under different NATA assumptions
NATA 1 NATA Refresh NATA Reform
Benefit Cost Ratio (BCR)
38.4 75.0 75.0
Policy fit Postive Postive Positive
Interview with Bill Bailey (81 years old)
I have lived in Kirkby for 50 years. I have poor eyesight, and I find that I have to make regular visits to the hospital. I’ve never owned a car, and so I’ve always relied on trains and buses. Over the years, I’ve noticed that lots of the bus routes have been broken up, which has made it increasingly difficult for me to reach the hospitals.
Now to go to the Royal Hospital; I take the bus to get to the centre of town, which drops me off on Moss Street. From there I have to make a long walk up quite a steep hill and across two major roads. It’s quite a tiring journey.
I’m sure there are a lot of disabled people who would have benefited from a wheelchair friendly tram service that stopped near their residential area, and dropped them off next to the Royal University Hospital. It is tiring and expensive having to get on a series of busses, and often they are difficult to get on.
Jack Jones: Pensioner and long time Kirkby Resident
One organisation I’m involved with is called Older People’s Voice. Every year we have a meeting to decide which issues are most important to the elderly residents of our area. Without fail, transport is identified as one of them.
Like many residents in Kirkby, I don’t have a car and so I rely on buses and trains almost every day. The bus into the centre of Liverpool can take up to an hour and a half. I’m often late for meetings because the buses are delayed or cancelled. A lot of services are taken off the roads after 5.30pm. Sometimes I just give up and make the walk to the train station. I’m quite lucky; a lot of elderly residents aren’t able to get to the train station because it’s too far. Instead, they are forced to wait in the cold.
The tram system would have been much better because it would have been reliable, clean and fast. It also would have been a lot easier for older people to use, because it would have stopped on residential streets, and the cars would have been accessible even to those with walking difficulties.
The right route16 17The right route
Case StudyHow to solve congestion in the Cambridge area?
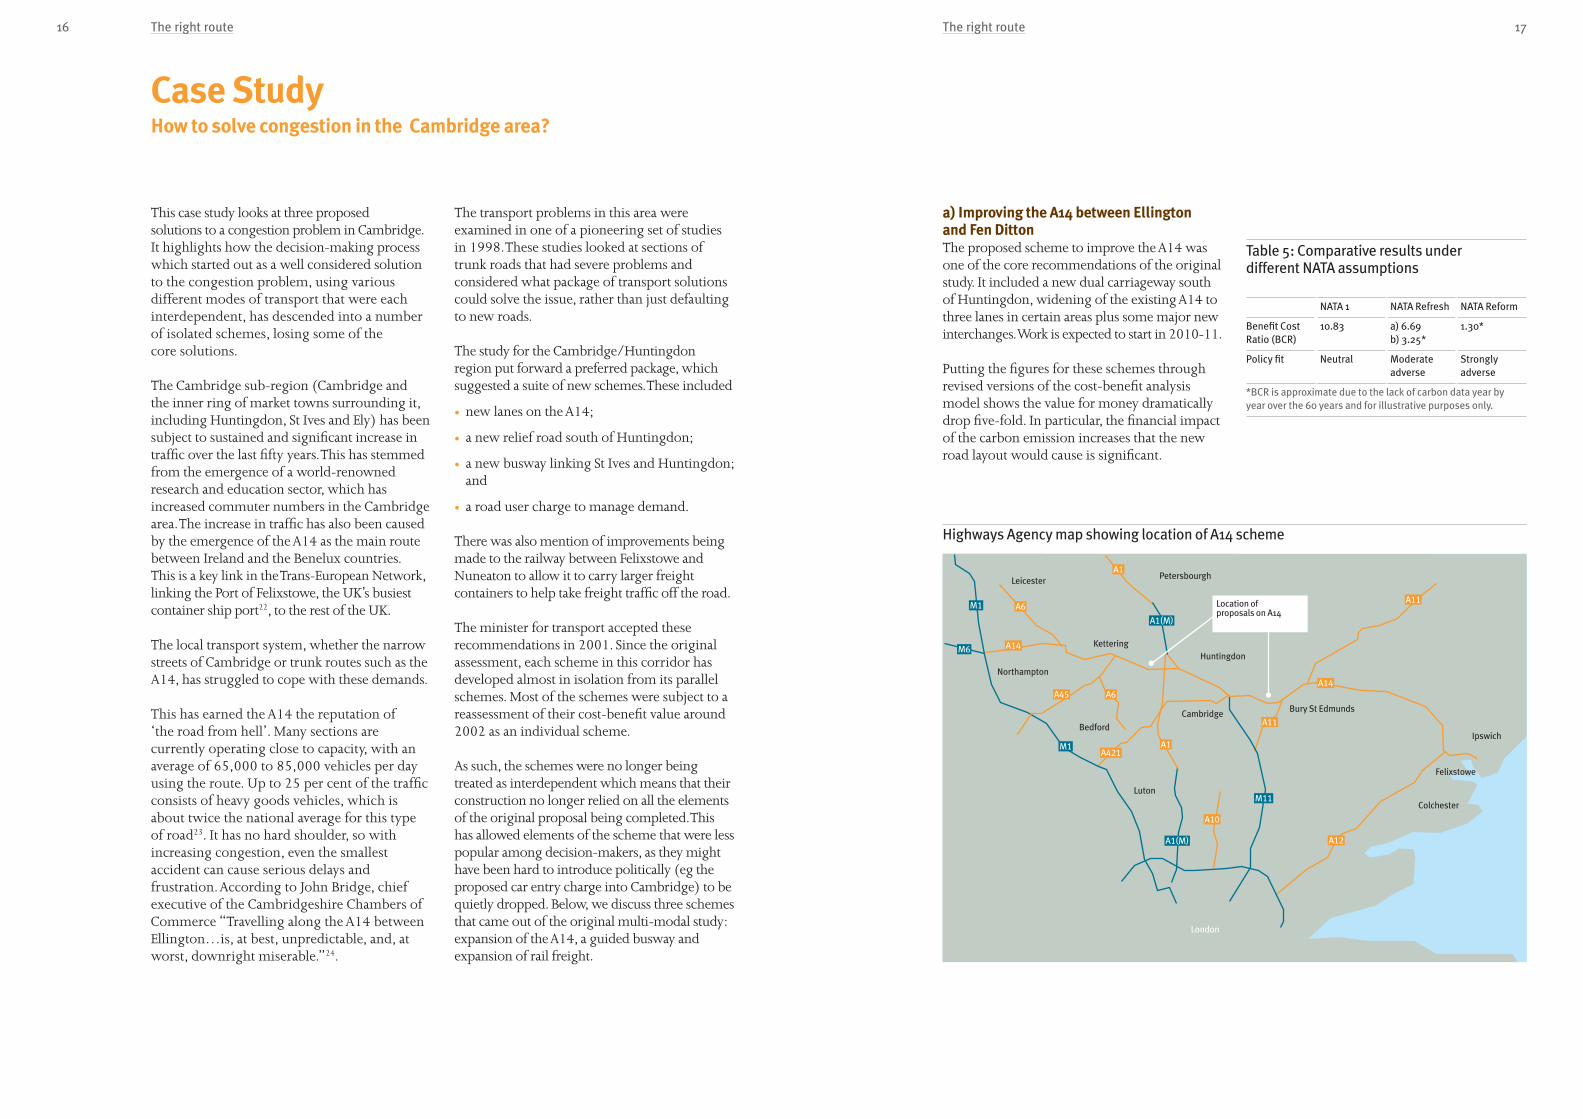
a) Improving the A14 between Ellington and Fen DittonThe proposed scheme to improve the A14 was one of the core recommendations of the original study. It included a new dual carriageway south of Huntingdon, widening of the existing A14 to three lanes in certain areas plus some major new interchanges. Work is expected to start in 2010-11.
Putting the figures for these schemes through revised versions of the cost-benefit analysis model shows the value for money dramatically drop five-fold. In particular, the financial impact of the carbon emission increases that the new road layout would cause is significant.
Table 5: Comparative results under different NATA assumptions
NATA 1 NATA Refresh NATA Reform
Benefit Cost Ratio (BCR)
10.83 a) 6.69 b) 3.25*
1.30*
Policy fit Neutral Moderate adverse
Strongly adverse
*BCR is approximate due to the lack of carbon data year by year over the 60 years and for illustrative purposes only.
This case study looks at three proposed solutions to a congestion problem in Cambridge. It highlights how the decision-making process which started out as a well considered solution to the congestion problem, using various different modes of transport that were each interdependent, has descended into a number of isolated schemes, losing some of the core solutions.
The Cambridge sub-region (Cambridge and the inner ring of market towns surrounding it, including Huntingdon, St Ives and Ely) has been subject to sustained and significant increase in traffic over the last fifty years. This has stemmed from the emergence of a world-renowned research and education sector, which has increased commuter numbers in the Cambridge area. The increase in traffic has also been caused by the emergence of the A14 as the main route between Ireland and the Benelux countries. This is a key link in the Trans-European Network, linking the Port of Felixstowe, the UK’s busiest container ship port22, to the rest of the UK.
The local transport system, whether the narrow streets of Cambridge or trunk routes such as the A14, has struggled to cope with these demands.
This has earned the A14 the reputation of ‘the road from hell’. Many sections are currently operating close to capacity, with an average of 65,000 to 85,000 vehicles per day using the route. Up to 25 per cent of the traffic consists of heavy goods vehicles, which is about twice the national average for this type of road23. It has no hard shoulder, so with increasing congestion, even the smallest accident can cause serious delays and frustration. According to John Bridge, chief executive of the Cambridgeshire Chambers of Commerce “Travelling along the A14 between Ellington…is, at best, unpredictable, and, at worst, downright miserable.”24.
The transport problems in this area were examined in one of a pioneering set of studies in 1998. These studies looked at sections of trunk roads that had severe problems and considered what package of transport solutions could solve the issue, rather than just defaulting to new roads.
The study for the Cambridge/Huntingdon region put forward a preferred package, which suggested a suite of new schemes. These included
• new lanes on the A14;
• a new relief road south of Huntingdon;
• a new busway linking St Ives and Huntingdon; and
• a road user charge to manage demand.
There was also mention of improvements being made to the railway between Felixstowe and Nuneaton to allow it to carry larger freight containers to help take freight traffic off the road.
The minister for transport accepted these recommendations in 2001. Since the original assessment, each scheme in this corridor has developed almost in isolation from its parallel schemes. Most of the schemes were subject to a reassessment of their cost-benefit value around 2002 as an individual scheme.
As such, the schemes were no longer being treated as interdependent which means that their construction no longer relied on all the elements of the original proposal being completed. This has allowed elements of the scheme that were less popular among decision-makers, as they might have been hard to introduce politically (eg the proposed car entry charge into Cambridge) to be quietly dropped. Below, we discuss three schemes that came out of the original multi-modal study: expansion of the A14, a guided busway and expansion of rail freight.
Highways Agency map showing location of A14 scheme
Leicester
Kettering
Northampton
Petersbourgh
Huntingdon
Bury St Edmunds
Ipswich
Cambridge
London
Bedford
Felixstowe
Colchester
Luton
A1
A1
A6
A10
A11
A12
A11
A14
A14
A6
A421
A1(M)
M11
M1
M6
M1
A1(M)
A45
Location of proposals on A14

18 The right route 19The right route
b) a new guided busway linking Cambridge to St IvesThe study also suggested that a busway scheme should be developed to reduce demand for car travel in the area. The proposed busway scheme will link the city of Cambridge with St Ives, Huntingdon and Northstowe (a proposed new town) to the northwest and with the M11 motorway to the south. For parts of the route it will be guided running on a dedicated track, mostly along the route of a closed railway. This guiding means that buses can travel closer together, they are easier to board, and more reliable as there is no other traffic. There will be a new path built next to the entire length of the guided busway track for walkers, cyclists and horse-riders. The bus will connect a number of town centres with Addenbrooke’s hospital and Fan Drayton Nature Reserve.
The scheme will start running in November 2009 and will be fully operational by the middle of 2010.
Table 6: Comparative results under different NATA assumptions
NATA 1 NATA Refresh NATA Reform
Benefit Cost Ratio (BCR)
4.8 6.4 7.9*
Policy fit Positive Positive Slight adverse
Note: None of the BCRs include carbon costs and annual summary data is not available to make an estimate. The first two BCRs would rise as a result of valuing carbon. In the reformed process, the BCR would fall, since the reduction in carbon does not meet the target. This is also the reason for the slight adverse policy fit result. The final result, as with many public transport schemes, depends on the major expenditure items in the region and the associated demand management policies.
* Loss of parking revenue was also added to the capital costs and in this case it is treated as a loss of benefit, as is done for fuel tax loss
David Price: Local resident and father of two small children
The cost to the taxpayer for the proposed A14 road scheme is expected to be in the order of £1.2 billion. If approved it will mean that drivers will have to spend more on fuel as the proposed road is longer than the existing one. At times I wonder if those that propose such schemes are truly competent for the role. In addition, it would mean that local residents will have to suffer from noise pollution, a chronic decrease in air quality and expect an increased risk of their homes being flooded. I live within a few hundred metres of what could become a ten lane highway.
I have a three year old daughter and a 3 month old son. I am deeply concerned about the impact the proposed scheme could have on our lives. I’m an environmental chemist by trade and this means I have a reasonable knowledge of the cocktail of compounds which would become part of our daily diet due to this crazy plan. Perhaps I’m old enough to subject my lungs to an increased dose of substances such as nitrogen dioxide, ozone, carbon monoxide and polynuclear aromatic hydrocarbons such as benzo(a)pyrene, but I am not at all happy to put up with the adverse effect it would have on my daughter and son. I propose that the existing A14 is maintained, more money is invested in local public transport and that a rush hour sole driver restriction scheme is put in place.

20 The right route 21The right route
c) expansion of the freight rail capacity between Felixstowe and NuneatonThe multi-modal study also suggested that rail freight should be used more in the A14 area. The port of Felixstowe is the UK’s busiest deep sea container ship port25, and handles 35 per cent of the large containers that end up on the UK’s doorstep. Every year Felixstowe has to deal with an increasing number of containers to satisfy our demands. Goods are transported by road, along the A14, and by rail: from Felixstowe’s two busy rail terminals. Each piece of cargo transported by rail is one piece of cargo not on the road. Transporting freight by rail saves tens of thousands of lorry journeys each year, alleviating pressure on the A14.
However, for rail to continue to compete effectively with road, a number of improvements have been identified that must be made to the rail infrastructure. This would involve the raising of some bridges, increasing train capability to carry standard European sized shipping containers and linking up the section of track to the West Coast Mainline. These improvements were already underway when the original Cambridge area study was done.
Table 7: Comparative results under different NATA assumptions
NATA 1 NATA Refresh NATA Reform
Benefit Cost Ratio (BCR)
5.25 10.4 10.4
Policy fit Positive Positive Positive
The revision of the original model dramatically increases the value for money for this scheme. It doubles under the new version of NATA from 5.25 to 10.4, making this scheme amazing value for money. This is mainly due to the adjustment of tax gains and losses, but also because removing Heavy Goods Vehicles (which are responsible for most of the damage to road surfaces) causes a huge reduction in road maintenance costs.
Overall this indicates that rail freight schemes are likely to see their BCRs rise very significantly as a result of tax change in the refreshed NATA. It suggests that the government should look again at many rail schemes that it has previously assessed, as they might now be much better value for money than previously realised.
Sheila Arnold: Retired Cambridge resident
When my nephew was very young, I took him on the last ever passenger train service passing through Histon, which ran past my old house. For a long time after, the tracks were only used for freight, but now they have been turned into the new route for the guided busway.
I don’t have a car, and so rely purely on public transport to visit my daughter who lives in Huntingdon. When I go by bus, the journey takes about an hour because the bus has to use the A14 which is a terrible road. If there’s a crash, then the whole city stands still. The guided busway will be fantastic; it will stop 2 minutes from my house, and will cut my journey down to 25 minutes as it won’t have to use the A14 at all.
I was lucky enough to try out a section of the busway earlier this year. The ride was extremely comfortable, and the buses themselves are fantastic. Great seats, air-conditioned and they even have the internet.
I’m really glad that the bus stops will have easy access; my daughter is disabled, so it means that she’ll be able to travel easily in her wheelchair.
Having been one of the last passengers before the rail line closed, I am definitely going to make sure I’m one of the first passengers to use the new busway riding in its place.
Selena Chapman: Arbury Park resident
I’ve just moved to Arbury Park, and if I want to go out in the evenings then I usually drive to the park ‘n’ ride. There is a regular bus service, but I rarely use it as there are no bus timetables or stops assigned as yet, and the bus costs more than the Park & Ride. Late at night, the only way for my friends and I to get home is to get a taxi. This usually costs a minimum of £10. The busway will run later than normal buses, and should be cheaper if we can buy weekly tickets. This would be a safer way to get into town and home again late at night.
I also think it’s good they are building a track alongside the busway, which can be used by cyclists and pedestrians. At the moment I don’t feel comfortable riding my bike along the main roads, the only alternative would be cutting through fields, which are quite isolated and not safe either. Instead I tend to drive everywhere, as I feel safer. The track will be a better place to cycle and walk, as there will be no cars, it will be well lit, and there will be plenty of other people using it. I will be much more likely to walk or cycle into town when its finished.

The right route22 23The right route
Case StudiesSummary
Findings and recommendations
The current process of transport decision-making, and the cost-benefit analysis model used has a number of impacts on the transport schemes selected.
Improving value for moneyThe best value for money schemes are not being picked for two reasons:
Lack of consideration of alternatives As the appraisal process does not ensure that the full range of alternative schemes are assessed, the best value for money scheme in a particular area might not even get put forward. So, in essence, taxpayer’s money is being wasted on transport choices that are not cost effective.
Flawed appraisal tool The revised cost-benefit tool is an improvement on the original, notably because it is less biased against schemes that reduce fuel consumption. However it still fails to properly account for carbon emissions and time savings.
As a result poor value for money schemes are being approved, wasting increasingly limited public money.
Meeting government objectivesThe government’s broader objectives, as detailed in Towards a sustainable transport system26, are not being supported by the transport infrastructure that is in place in the UK today. Infrastructure determines the transport choices available to people. If the infrastructure is not there, people cannot choose the option that would best support the policy.
Given these implications, a wholesale re-evaluation of how transport decision-making is carried out is needed, from the broader process to the details of the cost-benefit analysis model.
Green Alliance recommends that Government take the following actions are taken to improve transport appraisal:
• reassess all of the approved/proposed transport schemes where contracts have not been finalised to test their value for money, using the revised analysis model. Any schemes that do not meet the revised criteria should be removed from the transport programme;
• reform the decision-making process so that it is more accountable, transparent and joined-up. More consideration should be given to ensuring that guidance is followed and good quality appraisals are developed in every case;
• consider the alternatives in each appraisal to ensure that the best value for money scheme is selected;
• create an independent body to evaluate the solutions to transport problems. This should work within an overall strategic framework, and should only allow schemes that contribute to the government’s objectives;
• reform the transport appraisal model further to take better account of the impact of any proposed scheme on national carbon targets and sensibly assess time savings.
The table below summarises the Benefit Cost Ratio (BCR) for each case study under the original NATA, the revised NATA and under a NATA that is revised further in line with our recommendations.
It can be seen that the revisions to NATA has increased the BCR of the public transport and cycle schemes but lowered the BCR for the A14. If carbon emissions were properly accounted for, we estimate that the numbers would change even further.
Looking at the three Cambridgeshire schemes together (A14, guided busway and rail freight) we can see that the improvements to the A14 offer the least value for money of the three.
This begs the question as to whether there are other options that could help reduce the congestion further that would offer a better solution than the A14 and suggests that the whole multi-modal study should be revisited.
Table 8: Summary of comparative results under different NATA assumptions
Benefit Cost Ratio (BCR) under original appraisal model
BCR under revised appraisal model
BCR under appraisal model with further reforms
Merseytram 1.97 2.07 2.85*
Grand Union Canal Cycle Path 38.4 75.0 75.0
Improving the A14 between Ellington and Fen Ditton
10.83 6.69 1.3 – 3.25**
Guided busway Cambridge to St Ives
4.8 6.4 7.9**
Expansion of rail freight (Felixstowe – Nuneaton)
5.25 10.4 10.4***
*Based on moving to 60 years appraisal. The Merseytram provides several examples of how small changes in the treatment of tax revenues has a strong impact on the benefits (see the main report)
** Based on limited data
*** The carbon benefit of the rail freight scheme was already factored into the original analysis hence there is no change

The right route24
End notes
1. Department for Transport, Transport Trends – 2008 Edition. Online: http://www.dft.gov.uk/adobepdf/162469/ 221412/190425/220778/trends2008.pdf
2. Department for Energy and Climate Change (DECC), 2009, The UK Low Carbon Transition Plan, Annex B – Departmental carbon budgets.
3. Department for Transport, DfT aims and objectives, Online: http://www.dft.gov.uk/about/aimandobjectives
4. Green Alliance and Campaign for Better Transport, 2008, Decision-making for sustainable transport, Online: http://www.green-alliance.org.uk/grea_p.aspx?id=2670
5. Ibid.
6. As defined in Delivering a Sustainable Transport System (DaSTS): competitiveness, climate change, health, quality of life and equality.
7. This can arise because the proportion of business travellers and their time values are both lower for bus users. Bus travellers are assigned a lower value for their time than rail and car travellers. An hour saved by a business traveller is considered to be higher than someone travelling for leisure as it factors in his or her avoided earnings during that hour.
8. As well as reporting the size of time savings, some indication of ’who benefits where‘ is also planned.
9. DfT, July 2009, Low carbon transport: a greener future.
10. This will cover strategic highways and railways (including strategic rail freight interchanges)
11. Decision-making for sustainable transport, Green Alliance April 2008
12. Baseline carbon emissions are based on congestion models that assume a growth in vehicle use in line with GDP. Increases in vehicle efficiency reduce emissions slightly however the overall trend is for carbon emissions to grow.
13. An exception to this is some of the rail freight schemes where carbon is already factored in, in an adequate way.
14. This is figure that the DfT has committed itself to (as set out in the Low Carbon Transition Paper).
15. http://news.bbc.co.uk/1/hi/england/merseyside/7376584.stm
16. http://www.liverpooltimes.net/2008/07/06/knowsley-chief-executive-labels-kirkby-a-ghetto/
17. http://www.dft.gov.uk/about/strategy/whitepapers/previous/transporttenyearplan2000
18. http://www.mersey-tram.com/news.php?page=7 12th May
19. http://www.mersey-tram.com/news.php?page=2 21st Dec
20. Ibid.
21. http://www.britishwaterways.co.uk/newsroom/all-press-releases/display/id/1566
22. World Port Rankings 2005”. American Association of Port Authorities. May 2007. http://aapa.files.cms-plus.com/Statistics/WORLD%20PORT%20RANKINGS%202005.xls. Retrieved on 2008-02-06
23. http://www.highways.gov.uk/roads/projects/4221.aspx
24. http://www.heartcambridge.co.uk/Article.asp?id=1370472
25. World Port Rankings 2005”. American Association of Port Authorities. May 2007. http://aapa.files.cms-plus.com/Statistics/WORLD%20PORT%20RANKINGS%202005.xls. Retrieved on 2008-02-06
26. http://www.dft.gov.uk/about/strategy/transportstrategy/tasts/
The referee should work within an overall strategic direction set by the Department for Transport based on their broader policy objectives. Suites of schemes must be shown to help achieve these objectives.
Through developing real life case studies we learned a number of lessons:
• The Benefit Cost Ratio (BCR) produced by the appraisal process is extremely sensitive to small changes in the assumptions used. This is of real concern as decisions are heavily weighted on this single figure.
• Whilst we thank the parties involved in the case studies for the provision of information for this study, the data gathering process was lengthy and only a handful of parties were able to provide us with data.
It is vital that the current approach to transport appraisal is overhauled so that it become more transparent and consistent.
Both the transport appraisal model and the overall approach must be changed for it to deliver cost-effective, smart transport solutions that improve the quality of our lives and protect our fragile environment.

© 2009 Green Alliance
All rights reserved. No part of this publication may be reproduced, stored in a retrieval system, or transmitted, in any form or by any means, without the prior permission in writing of Green Alliance. Within the UK, exceptions are allowed in respect of any fair dealing for the purposes of private research or study, or criticism or review, as permitted under the Copyright, Design and Patents Act, 1988, or in the case of reprographic reproduction in accordance with the terms of the licenses issued by the Copyright Licensing Agency.
Green Alliance 36 Buckingham Palace Road London SW1W 0RET 020 7233 7433 F 020 7233 9033 [email protected] Registered charity number 1045395 and company limited by guarantee (England and Wales) registered number 3037633