the rising sun full
TRANSCRIPT
8/3/2019 The Rising Sun Full
http://slidepdf.com/reader/full/the-rising-sun-full 1/96
ENERGY AND NATURAL RESOURCES
The Rising SunA Point of View on the Solar
Energy Sector in India
May 2011
kpmg.com/in

8/3/2019 The Rising Sun Full
http://slidepdf.com/reader/full/the-rising-sun-full 2/96
© 2011 KPMG, an Indian Partnership and a member firm of the KPMG network of independent member firms affiliated with KPMG International Cooperative (“KPMG International”), a Swiss entity. All rights reserved.
8/3/2019 The Rising Sun Full
http://slidepdf.com/reader/full/the-rising-sun-full 3/96
Foreword
As one looks to the future, India faces significant challenges of energy security,
responding to the call for action against climate change and importantly addressing
the issue of inclusive growth within the country. Our coal import requirement is
expected to exceed 30 percent of our coal demand by 2017; India will need to show
some action towards its voluntary target of 20-25 percent reduction in carbon
emission intensity of GDP by 2020; and look at ways to electrify over 40 percent of
rural households with reliable electricity.
The Government of India launched the Jawaharlal Nehru National Solar Mission
(JNNSM) in late 2009 as one of the eight national missions under the Prime
Minister’s National Action Plan on Climate Change (NAPCC). Various states, notably
Gujarat and Rajasthan, have come forward with state level policies as well. These,
indeed, are far sighted steps and can contribute in a significant way to the three
challenges mentioned above. In this report, KPMG has analyzed how solar power
can contribute to addressing these challenges and why it is important for policy
makers to keep the momentum going into the future. Persistence in policy and
resilience in action is needed if the true potential of this sector is to be achieved.
The fruits of this persistence will be obtained in the later part of this decade and
that is the time we would look back and be thankful for the actions we are taking
today. Solar power has the potential to meet almost 7 percent of our power needs
by 2022, mitigate 2.6 percent of our carbon emissions in that year and save over 71
MTPA of imported coal in that year (equal to USD 5.5 bn of imports). Clearly, the
imperative for action today is strong and therefore is the case for persistence and
consistency on part of the Government. For the industry, this represents a
significant investment opportunity. Investment opportunities across the value chain
from manufacturing to EPC to project development exist with an estimated total
project investment of USD 110 bn over the next decade. Opportunities in both grid
and off-grid segments will be strong and industry should focus on these areas. I
would also urge a strong emphasis on innovation and R&D by Indian industry to
make applications that suit Indian needs while using the technological
achievements in rest of the world as a platform to leap-frog to next level.
We hope this study will show to different stakeholders the true potential of this
great source of energy and instigate the action and commitment that this sector
deserves.
Executive Director and Head
Energy and Natural Resources
Arvind Mahajan
© 2011 KPMG, an Indian Partnership and a member firm of the KPMG network of independent member firms affiliated with KPMG International Cooperative (“KPMG International”), a Swiss entity. All rights reserved.

8/3/2019 The Rising Sun Full
http://slidepdf.com/reader/full/the-rising-sun-full 4/96
Table of Contents
© 2011 KPMG, an Indian Partnership and a member firm of the KPMG network of independent member firms affiliated with
KPMG International Cooperative (“KPMG International”), a Swiss entity. All rights reserved.
8/3/2019 The Rising Sun Full
http://slidepdf.com/reader/full/the-rising-sun-full 5/96
Key terminology
Executive summary
Introduction
Solar power cost drivers
Grid parity projections
Solar grid-connected power market in India
Potential of off-grid solar applications
Economic benefits from solar market
Steps to be taken to enable the market transition
Investment opportunities for the Indian Industry
Appendix - Taxation
Importance of Solar Power – Energy security and emission mitigation
Solar Power Market Trends – Europe dominates the global market
Government Support to Solar Sector – Right framework has been put in-place
Solar Power Costs – Relatively higher when compared to other fuels
Solar PV
Concentrating Solar Power (CSP)
Power costs from conventional sources
Grid Parity Projections for small-scale - Domestic and agriculture segments
Grid Parity Projections for large scale - Utility power
Summary of Grid Parity Projections
Demand for Solar Power – Grid-connected consumer segments
Grid-connected Market Opportunity – Medium term
Grid-connected Solar Potential – Long term
Summary of Grid-connected Solar Market Potential
Solar-powered agriculture pumpsets
Solar water heating
Solar Energy for powering telecom towers
Solar lighting
Energy Security – Import substitution
Carbon mitigation
Job creation potential
Market stability
Credible funding planEnforce solar purchase obligations
Investments in R&D – PPP models
Focus on off-grid market applications
Provide incentives for solar manufacturing industry
Imperatives for the near term
Investment opportunity for the future
Tax and fiscal incentives
Tax planning
01 05
02 0903 21
04 29
05 37
06 47
07 57
08 73
09 77
10 83
11 89
Tableof Contents
© 2011 KPMG, an Indian Partnership and a member firm of the KPMG network of independent member firms affiliated with KPMG International Cooperative (“KPMG International”), a Swiss entity. All rights reserved.
8/3/2019 The Rising Sun Full
http://slidepdf.com/reader/full/the-rising-sun-full 6/96
Key terminology
THE RISING SUN05
© 2011 KPMG, an Indian Partnership and a member firm of the KPMG network of independent member firms affiliated with
KPMG International Cooperative (“KPMG International”), a Swiss entity. All rights reserved.
8/3/2019 The Rising Sun Full
http://slidepdf.com/reader/full/the-rising-sun-full 7/96
01Key terminology
06THE RISING SUN
© 2011 KPMG, an Indian Partnership and a member firm of the KPMG network of independent member firms affiliated with KPMG International Cooperative (“KPMG International”), a Swiss entity. All rights reserved.
8/3/2019 The Rising Sun Full
http://slidepdf.com/reader/full/the-rising-sun-full 8/96
© 2011 KPMG, an Indian Partnership and a member firm of the KPMG network of independent member firms affiliated with KPMG International Cooperative (“KPMG International”), a Swiss entity. All rights reserved.
01
Key terminology
Solar Photovoltaic Technology (PV)
Levelised Tariff
Concentrating Solar Power
Technology (CSP)
LCP
Grid Parity
CSP - Parabolic Trough Technology
Feed-in-Tariff
which can either be part of aSolar PV plants generate electricalconventional steam cycle or bepower by converting solar radiation intointegrated into a combined steam anddirect current electricity usinggas turbine cycle.semiconductors that exhibit the
photovoltaic effect. Photovoltaic power
generation employs solar panelscomprising a number of cells containing The tariffs for each year during a term
a photovoltaic material. of a PPA (Power Purchase Agreement)
are discounted by applying the discount
factors (based on the Discount Rate)
and such aggregate discounted value
for the term of the PPA is divided byFocuses the sun's energy to boil waterthe sum of such discount factors towhich is then used to produce power.calculate the Levelised Tariff.CSP plants produce electricity by
converting the infrared part of solar
radiation into high temperature heat
using various mirror/reflector and Landed cost of power is the total cost
receiver configurations. The heat is then of delivering power at the consumer
channeled through a conventional premises and includes the cost of
generator. The plants consist of two power purchase, the power losses at
parts: one that collects solar energytransmission and distribution (T&D)and converts it to heat, commonly levels and the cost of servicing and
known as ‘solar field’ and the other that maintaining the T&D assets till the
converts heat energy to electricity, particular consumer premises.
known as ‘power block’.
Threshold at which solar power system
supplies electricity to the end user atA parabolic trough structure is
the same price as grid-suppliedconstructed as a long parabolic mirror
electricity. Grid parity will be different(usually coated silver or polished
for different States and different endaluminum) with a receiver tube running
user applications.along its length at the focal point.
Sunlight is reflected by the mirror and
concentrated on the receiver tube. The
trough is usually aligned on a north- A feed-in tariff (FiT, feed-in law,
south axis, and rotated to track the sun advanced renewable tariff or renewable
as it moves across the sky each day. A energy payments) is a policy
thermal transfer fluid, such as synthetic mechanism designed to encourage the
thermal oil, is circulated in these tubes. adoption of renewable energy sources.
The fluid is heated to approximately Under a feed-in tariff, eligible renewable
400°C by the sun’s concentrated rays electricity generators (which can
and then pumped through a series of include homeowners and businesses)
heat exchangers to produce are paid a premium price for any
superheated steam. The steam is renewable electricity they produce.
converted to electrical energy in a
conventional steam turbine generator,
THE RISING SUN07
8/3/2019 The Rising Sun Full
http://slidepdf.com/reader/full/the-rising-sun-full 9/96
© 2011 KPMG, an Indian Partnership and a member firm of the KPMG network of independent member firms affiliated with KPMG International Cooperative (“KPMG International”), a Swiss entity. All rights reserved.
National Renewable Energy Laboratory
(NREL)
‘Off-grid’ solar applications
Solar Water Heating (SWH)
ESCO
The U.S. National Renewable Energy
Laboratory is a part of the U.S.
Department of Energy (DOE) and is a
leading laboratory for renewable energy
and energy efficiency research and
development within the US.
Are generally meant to refer to a set of
applications that provide solar power to
end-users through routes other than the
electricity grid. These routes, for
example, could be to deliver water
heated through solar power to a
consumer through water pipes at his
residence or street lights illuminated
through a battery bank charged using
solar power.
Is generally meant to imply the use of
solar energy to heat water. Solar heating
systems are generally composed of solar
thermal collectors, a water storage tank
or another point of usage,
interconnecting pipes and a fluid system
to move the heat from the collector to
the tank.
Implies an Energy Service Company that
would install, own and operate a system
with a fees-for-service model where
people buy a service from the company.
Typically, these companies are
characterized by the following features:
?Guaranteed energy savings and/or
provision of the same level of energy
service at lower cost
?Remuneration directly tied to the
energy savings achieved
?ESCO finances or assists in
arranging financing for the
installation of project
08THE RISING SUN
8/3/2019 The Rising Sun Full
http://slidepdf.com/reader/full/the-rising-sun-full 10/96
Executive summary
© 2011 KPMG, an Indian Partnership and a member firm of the KPMG network of independent member firms affiliated with
KPMG International Cooperative (“KPMG International”), a Swiss entity. All rights reserved.
THE RISING SUN09

8/3/2019 The Rising Sun Full
http://slidepdf.com/reader/full/the-rising-sun-full 11/96
Executive summary 02
© 2011 KPMG, an Indian Partnership and a member firm of the KPMG network of independent member firms affiliated with KPMG International Cooperative (“KPMG International”), a Swiss entity. All rights reserved.
10THE RISING SUN

8/3/2019 The Rising Sun Full
http://slidepdf.com/reader/full/the-rising-sun-full 12/96
© 2011 KPMG, an Indian Partnership and a member firm of the KPMG network of independent member firms affiliated with KPMG International Cooperative (“KPMG International”), a Swiss entity. All rights reserved.
1. United Nations Greenhouse Gas emissions
02
Executive summary
The Indian economy faces significant June, 2008 envisages meeting 15
challenges in terms of meeting its percent of our power requirements
energy needs in the coming decade. from renewable energy sources by
The increasing energy requirements 2020. One of the eight missions under
coupled with a slower than expected the NAPCC is the Jawaharlal Nehru
increase in domestic fuel production National Solar Mission (JNNSM) which
has meant that the extent of imports in was launched in late 2009. The mission
energy mix is growing rapidly. Oil targets 22,000 MW of solar power by
imports already constitute nearly 75 2022. The first phase of the program
percent of our total oil consumption. has been initiated and projects
Coal imports which were negligible a amounting to 704 MW have already
few years back are likely to rise to been allocated. The policy goals and the
around 30 percent of the total coal steps taken to achieve it have been in
requirement by 2017. Globally, there is the right direction. We must
intense competition for access to compliment the Government of India
energy resources. This is a serious for taking this far sighted and strategic
cause for concern as the Indian initiative with full earnest. In addition,
economy gets exposed to the global some states, notably Gujarat, have
fuel supply market which is volatile and taken visionary steps to support the
rising. Moreover, being amongst the program at the State level.
top five greenhouse gas (GHG) emitters Furthermore, the Renewable Energy1
globally , India has a responsibility to Certificate (REC) mechanism which is
achieve the growth trajectory in an already operational can play a catalytic
environmentally sensitive and role in the development of the solar
responsible manner. India has set a power market in India. We believe the
voluntary target to cut the emissions seeds have been sown for a rapidly
intensity of GDP by 20-25 percent by scalable and a very large solar energy
2020 compared to the 2005 level. sector in the near future. As we will
explain later, we believe that the
potential of this sector and its impactIn this backdrop, the thrust on
on our strategic considerations ofrenewable sources of energy is a step
energy security and GHG mitigation canin the right direction. The Prime
be far greater than is generallyMinister’s National Action Plan on
believed.Climate Change (NAPCC) released in
THE RISING SUN11
8/3/2019 The Rising Sun Full
http://slidepdf.com/reader/full/the-rising-sun-full 13/96
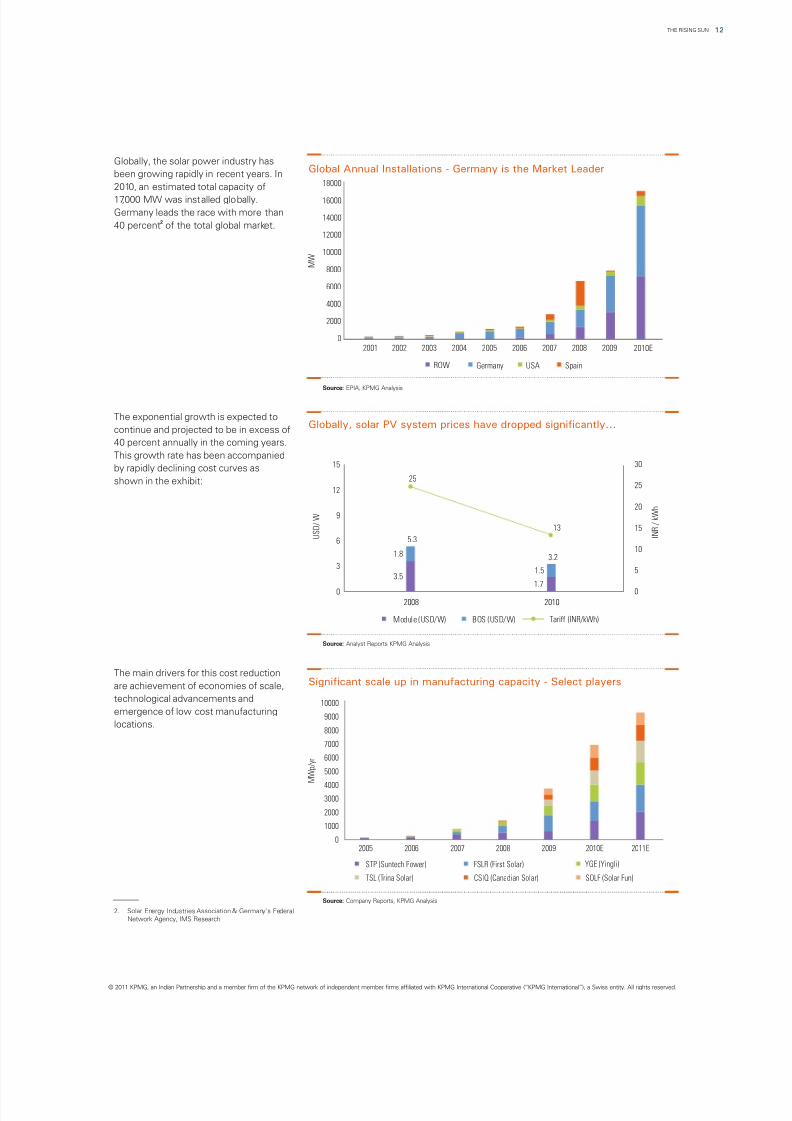
Globally, the solar power industry has
been growing rapidly in recent years. In
2010, an estimated total capacity of
17,000 MW was installed globally.
Germany leads the race with more than2
40 percent of the total global market.
The exponential growth is expected to
continue and projected to be in excess of
40 percent annually in the coming years.
This growth rate has been accompanied
by rapidly declining cost curves as
shown in the exhibit:
The main drivers for this cost reduction
are achievement of economies of scale,
technological advancements and
emergence of low cost manufacturing
locations.
STP (Suntech Power) FSLR (First Solar) YGE (Yingli)
TSL (Trina Solar) CSIQ (Canadian Solar) SOLF (Solar Fun)
2. Solar Energy Industries Association & Germany's Federal
Network Agency, IMS Research
Global Annual Installations - Germany is the Market Leader
Source: EPIA, KPMG Analysis
Globally, solar PV system prices have dropped significantly...
Source: Analyst Reports KPMG Analysis
Source: Company Reports, KPMG Analysis
Significant scale up in manufacturing capacity - Select players
0
2000
4000
6000
8000
10000
M W
12000
14000
16000
18000
2001 2002 2003 2004 2005 2006 2007 2008 2009 2010E
ROW Germany USA Spain
3.51.7
1.8
1.5
25
13
0
5
10
15
20
25
30
0
3
6
9
12
15
2008 2010
U S D / W
I N R / k W h
5.3
3.2
Module (USD/W) BOS (USD/W) Tariff (INR/kWh)
0
1000
2000
30004000
5000
6000
7000
8000
9000
10000
2005 2006 2007 2008 2009 2010E 2011E
M W p / y r
© 2011 KPMG, an Indian Partnership and a member firm of the KPMG network of independent member firms affiliated with KPMG International Cooperative (“KPMG International”), a Swiss entity. All rights reserved.
12THE RISING SUN
8/3/2019 The Rising Sun Full
http://slidepdf.com/reader/full/the-rising-sun-full 14/96
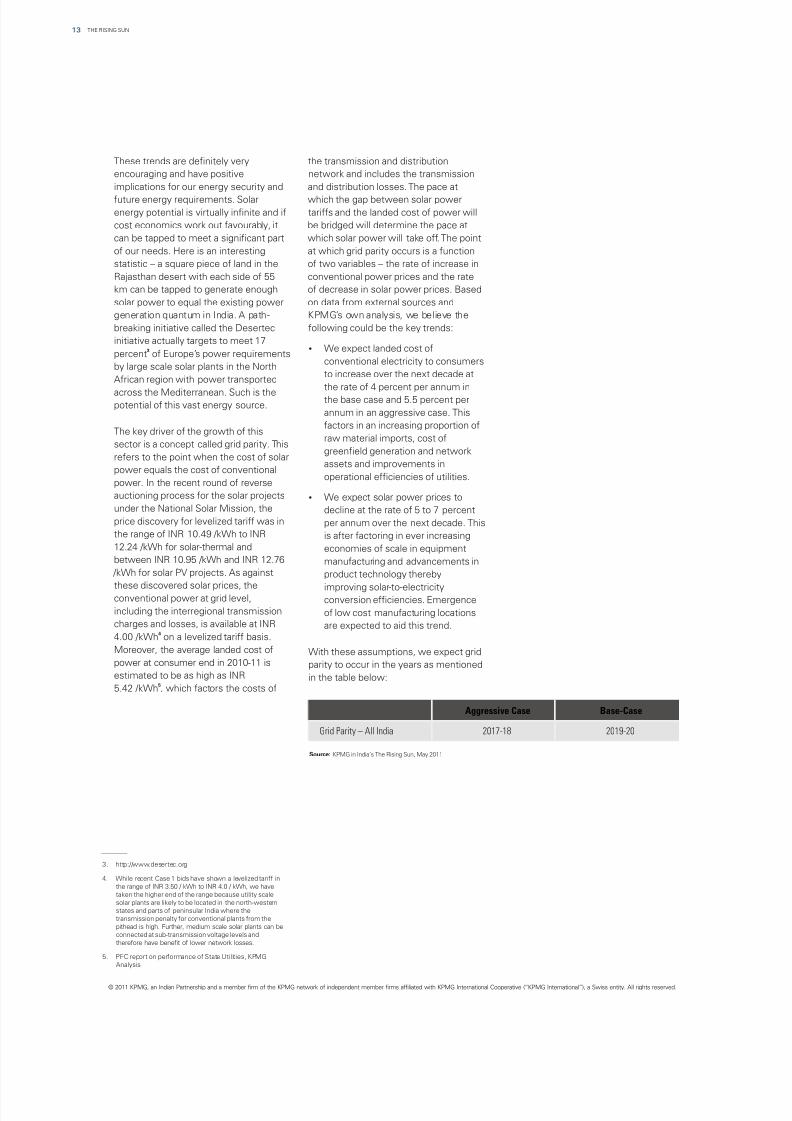
These trends are definitely very the transmission and distribution
encouraging and have positive network and includes the transmission
implications for our energy security and and distribution losses. The pace at
future energy requirements. Solar which the gap between solar power
energy potential is virtually infinite and if tariffs and the landed cost of power will
cost economics work out favourably, it be bridged will determine the pace at
can be tapped to meet a significant part which solar power will take off. The point
of our needs. Here is an interesting at which grid parity occurs is a function
statistic – a square piece of land in the of two variables – the rate of increase in
Rajasthan desert with each side of 55 conventional power prices and the rate
km can be tapped to generate enough of decrease in solar power prices. Based
solar power to equal the existing power on data from external sources and
generation quantum in India. A path- KPMG’s own analysis, we believe the
breaking initiative called the Desertec following could be the key trends:
initiative actually targets to meet 17?We expect landed cost of3
percent of Europe’s power requirementsconventional electricity to consumers
by large scale solar plants in the Northto increase over the next decade at
African region with power transportedthe rate of 4 percent per annum in
across the Mediterranean. Such is the the base case and 5.5 percent perpotential of this vast energy source.
annum in an aggressive case. This
factors in an increasing proportion ofThe key driver of the growth of this
raw material imports, cost ofsector is a concept called grid parity. This
greenfield generation and networkrefers to the point when the cost of solar
assets and improvements inpower equals the cost of conventional
operational efficiencies of utilities.power. In the recent round of reverse
auctioning process for the solar projects ?We expect solar power prices tounder the National Solar Mission, the decline at the rate of 5 to 7 percent
price discovery for levelized tariff was in per annum over the next decade. Thisthe range of INR 10.49 /kWh to INR is after factoring in ever increasing
12.24 /kWh for solar-thermal and economies of scale in equipmentbetween INR 10.95 /kWh and INR 12.76 manufacturing and advancements in
/kWh for solar PV projects. As against product technology thereby
these discovered solar prices, the improving solar-to-electricityconventional power at grid level, conversion efficiencies. Emergence
including the interregional transmission of low cost manufacturing locationscharges and losses, is available at INR are expected to aid this trend.
44.00 /kWh on a levelized tariff basis.
Moreover, the average landed cost of With these assumptions, we expect gridpower at consumer end in 2010-11 is parity to occur in the years as mentionedestimated to be as high as INR in the table below:
55.42 /kWh , which factors the costs of
Aggressive Case Base-Case
Grid Parity – All India 2017-18 2019-20
Source: KPMG in India’s The Rising Sun, May 2011
3. http://www.desertec.org
4. While recent Case 1 bids have shown a levelized tariff in
the range of INR 3.50 / kWh to INR 4.0 / kWh, we have
taken the higher end of the range because utility scale
solar plants are likely to be located in the north-western
states and parts of peninsular India where the
transmission penalty for conventional plants from the
pithead is high. Further, medium scale solar plants can be
connected at sub-transmission voltage levels and
therefore have benefit of lower network losses.
5. PFC report on performance of State Utilities, KPMG
Analysis
© 2011 KPMG, an Indian Partnership and a member firm of the KPMG network of independent member firms affiliated with KPMG International Cooperative (“KPMG International”), a Swiss entity. All rights reserved.
THE RISING SUN13
8/3/2019 The Rising Sun Full
http://slidepdf.com/reader/full/the-rising-sun-full 15/96
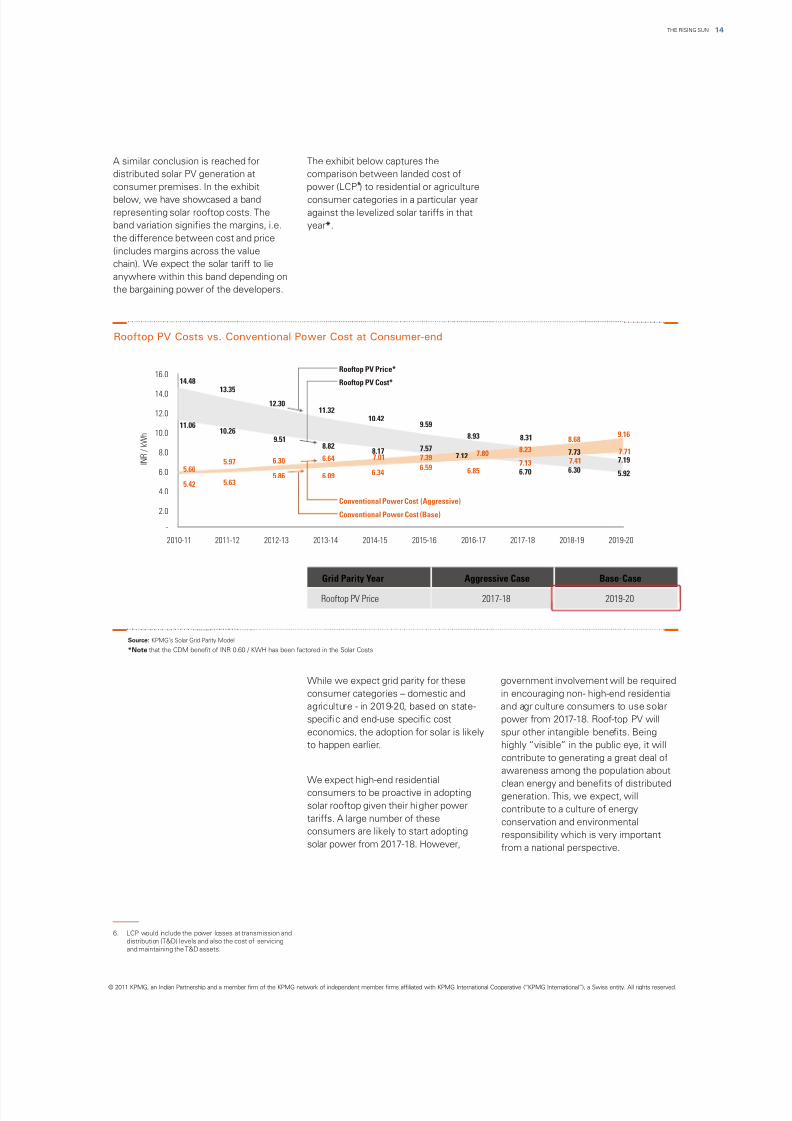
A similar conclusion is reached for The exhibit below captures the
distributed solar PV generation at comparison between landed cost of6
consumer premises. In the exhibit power (LCP ) to residential or agriculture
below, we have showcased a band consumer categories in a particular year
representing solar rooftop costs. The against the levelized solar tariffs in that
band variation signifies the margins, i.e. year*.
the difference between cost and price
(includes margins across the value
chain). We expect the solar tariff to lie
anywhere within this band depending on
the bargaining power of the developers.
While we expect grid parity for these government involvement will be required
consumer categories – domestic and in encouraging non- high-end residential
agriculture - in 2019-20, based on state- and agriculture consumers to use solar
specific and end-use specific cost power from 2017-18. Roof-top PV will
economics, the adoption for solar is likely spur other intangible benefits. Being
to happen earlier. highly “visible” in the public eye, it will
contribute to generating a great deal of
awareness among the population aboutWe expect high-end residential
clean energy and benefits of distributedconsumers to be proactive in adopting generation. This, we expect, willsolar rooftop given their higher power contribute to a culture of energytariffs. A large number of these conservation and environmentalconsumers are likely to start adopting responsibility which is very importantsolar power from 2017-18. However, from a national perspective.
Conventional Power Cost (Base)
Rooftop PV Cost*
Rooftop PV Price*
Conventional Power Cost (Aggressive)
-
2.0
4.0
6.0
8.0
10.0
12.0
14.0
16.0
I N R / k W h
2010-11 2011-12 2012-13 2013-14 2014-15 2015-16 2016-17 2017-18 2018-19 2019-20
5.66
7.808.23
5.42
7.13
8.31
6.85
8.93
14.48
11.06
7.01
6.34
10.42
8.176.64
6.09
11.32
8.82
6.30
5.86
12.30
9.51
5.97
5.63
13.35
10.26
7.39
6.59
9.59
7.577.12
6.70
8.68
7.417.73
6.30
9.16
7.717.19
5.92
Source: KPMG’s Solar Grid Parity Model
*Note that the CDM benefit of INR 0.60 / KWH has been factored in the Solar Costs
Rooftop PV Costs vs. Conventional Power Cost at Consumer-end
Grid Parity Year Aggressive Case Base-Case
Rooftop PV Price 2017-18 2019-20
6. LCP would include the power losses at transmission and
distribution (T&D) levels and also the cost of servicing
and maintaining the T&D assets.
© 2011 KPMG, an Indian Partnership and a member firm of the KPMG network of independent member firms affiliated with KPMG International Cooperative (“KPMG International”), a Swiss entity. All rights reserved.
14THE RISING SUN
8/3/2019 The Rising Sun Full
http://slidepdf.com/reader/full/the-rising-sun-full 16/96
The large scale utility power can be procured either from Solar PV or from CSP
depending on the cost economics. In the exhibits below, we have captured various*
scenarios in which grid parity could occur for both CSP and PV technologies .
However, solar CSP, due to the storage factor, can be instrumental in meeting the
evening peak requirements and therefore be potentially more attractive from a utility
scale perspective.
We expect the grid parity to happen in 2019-20 when the levelized tariffs from solar
power are comparable with the levelized tariffs of grid power in this year.
© 2011 KPMG, an Indian Partnership and a member firm of the KPMG network of independent member firms affiliated with KPMG International Cooperative (“KPMG International”), a Swiss entity. All rights reserved.
THE RISING SUN15
Grid Parity Year Aggressive Case Base-Case
Utility PV Price 2017-18 2019-20
Source: KPMG’s Solar Grid Parity Model
Levelized Cost Comparison of Utility-scale PV and Conventional Power at Grid
-
2.0
4.0
6.0
8.0
10.0
12.0
14.0
I N R / k W h
2010-11 2011-12 2012-13 2013-14 2014-15 2015-16 2016-17 2017-18 2018-19 2019-20
Conventional Grid Tariff (Base)
PV Cost*
PV Price*
Conventional Grid Tariff (Aggressive)
5.67
6.166.69
7.267.88
8.52
11.60
9.31
7.02 6.536.06
5.62
5.21 4.834.00
4.96 5.235.52 5.82 6.14
6.48
4.00
10.74
8.68
4.22
4.16
9.95
8.09
4.45
4.33
9.21
7.53
4.70
4.504.68 4.87 5.06 5.26 5.47
5.69
Grid Parity Year Aggressive Case Base-Case
CSP with Storage 2017-18 2019-20
Source: KPMG’s Solar Grid Parity Model
Levelized Cost Comparision of Solar CSP and Conventional Power at Grid
-
2.0
4.0
6.0
8.0
10.0
12.0
I N R / k W h
2010-11 2011-12 2012-13 2013-14 2014-15 2015-16 2016-17 2017-18 2018-19 2019-20
CSP Cost (without storage)*
CSP Cost (with storage)*
Conventional Grid Tariff (Base)
Conventional Grid Tariff (Aggressive)
10.88
9.36
4.00
8.75
7.51
4.96
4.68
9.24
7.94
4.704.50
9.76
8.39
4.454.33
10.31
8.86
4.224.164.00
6.64
5.68
6.485.69
7.02
6.016.14
5.47
7.42
6.365.82
5.26
7.84
6.72
5.52
5.06
8.28
7.11
5.23
4.87
*Note that the CDM benefit of INR 0.60 / KWH has been factored in the Solar Costs
*Note that the CDM benefit of INR 0.60 / KWH has been factored in the Solar Costs
8/3/2019 The Rising Sun Full
http://slidepdf.com/reader/full/the-rising-sun-full 17/96
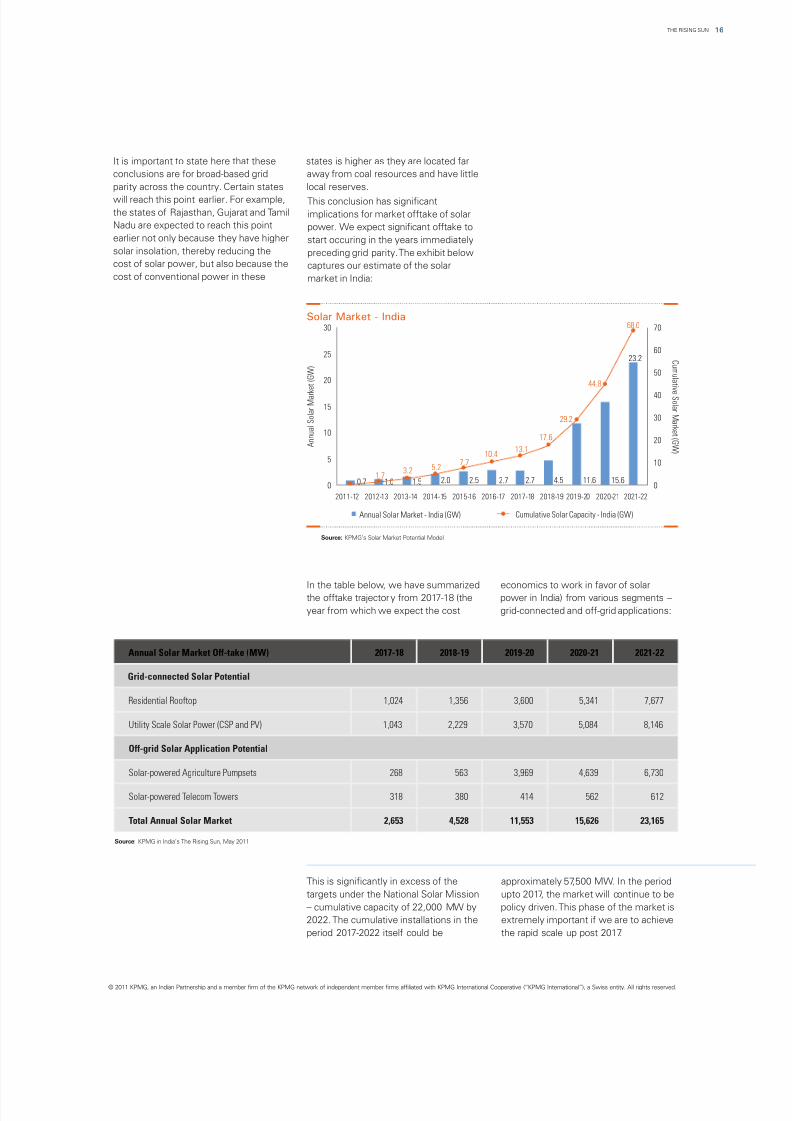
In the table below, we have summarized economics to work in favor of solarthe offtake trajectory from 2017-18 (the power in India) from various segments –
year from which we expect the cost grid-connected and off-grid applications:
This is significantly in excess of the approximately 57,500 MW. In the period
targets under the National Solar Mission upto 2017, the market will continue to be
– cumulative capacity of 22,000 MW by policy driven. This phase of the market is
2022. The cumulative installations in the extremely important if we are to achieve
period 2017-2022 itself could be the rapid scale up post 2017.
Source: KPMG in India’s The Rising Sun, May 2011
Annual Solar Market Off-take (MW) 2017-18 2018-19 2019-20 2020-21 2021-22
Grid-connected Solar Potential
Residential Rooftop 1,024 1,356 3,600 5,341 7,677
Utility Scale Solar Power (CSP and PV) 1,043 2,229 3,570 5,084 8,146
Off-grid Solar Application Potential
Solar-powered Agriculture Pumpsets 268 563 3,969 4,639 6,730
Solar-powered Telecom Towers 318 380 414 562 612
Total Annual Solar Market 2,653 4,528 11,553 15,626 23,165
It is important to state here that these states is higher as they are located far
conclusions are for broad-based grid away from coal resources and have little
parity across the country. Certain states local reserves.
will reach this point earlier. For example, This conclusion has significantthe states of Rajasthan, Gujarat and Tamil implications for market offtake of solarNadu are expected to reach this point power. We expect significant offtake toearlier not only because they have higher start occuring in the years immediatelysolar insolation, thereby reducing the preceding grid parity. The exhibit belowcost of solar power, but also because the captures our estimate of the solarcost of conventional power in these market in India:
© 2011 KPMG, an Indian Partnership and a member firm of the KPMG network of independent member firms affiliated with KPMG International Cooperative (“KPMG International”), a Swiss entity. All rights reserved.
16THE RISING SUN
Solar Market - India
Source: KPMG’s Solar Market Potential Model
2021-222019-20 2020-212011-12 2012-13 2013-14 2014-15 2015-16 2016-17 2017-18 2018-19
C u m u l a t i v e S o l a r M a r k e t ( G W )
A n n u a l S o l a r M a r k
e t ( G W )
Annual Solar Market - India (GW) Cumulative Solar Capacity - India (GW)
0.7 1.0 1.5 2.0 2.5
68.0
0
10
20
30
40
50
60
70
0
5
10
15
20
25
30
2.7 2.7 4.5 11.61.7
3.2 5.27.7
10.413.1
17.6
44.8
23.2
29.2
15.6
8/3/2019 The Rising Sun Full
http://slidepdf.com/reader/full/the-rising-sun-full 18/96
7. IDBI report on Telecom Infrastructure
In the off-grid space, solar power is Solar PV installations are well suited to ability to provide day time power, can
already cost competitive with replace diesel consumption for the meet the agricultural power demand
alternatives in certain applications. For following reasons – solar power price is from the farmers without the need to be
example, telecom towers are an already competitive with the effective connected to the grid. Moreover, unlike
attractive market for solar PV price of diesel based power for a large industrial and residential loads, the water
installations. A large number of telecom proportion of telecom towers and land pumping loads can tolerate a certain
towers are located in areas with limited availability for solar panel installations is level of intermittency in power output,
or no grid connectivity and have to generally not a constraint in rural / semi- which is a characteristic of solar PV
depend on diesel gensets for meeting urban areas. power.
their power requirement. Depending on
the tower configuration and connected While solar power would not be able to The other segment of the energy market
load, the price of diesel power can vary completely replace diesel consumption, which can use solar energy is the solar
from around INR 15/ kWh to as high as we believe that it has the potential to water heating (SWH) segment. Solar
INR 30/ kWh for low load towers in replace about 30 percent of diesel water heating applications could be used
remote areas. Today, India has about 3.6 consumption. This implies a diesel saving in residential, commercial as well as7
lakh telecom towers that are likely to of 5.4 Billion liters between now and industrial sectors.
grow to 7 lakh towers by 2020 – a large 2022. This would also mean about 3,500
proportion of the new towers would be MW of solar panel installations that Internationally, SWH is a well developed
coming up in rural / semi-urban areas would create an industry (comprising of technology and promises significant fuelreflecting the much higher pace of new solar panels, inverters, battery banks and savings and emissions reduction. China,
consumer addition in rural / semi-urban associated components) of USD 12.5 European Union, Turkey, Japan and Israel
areas compared with urban areas going Billion in the same period. are the leaders and cover about 90
forward. This would result in diesel percent of the global installed SWH
consumption increasing from about 2 Another off-grid application where solar capacity. While India is well endowed
Billion liters / annum (comprising about power is well suited is the agricultural with solar insolation, the cumulative
3.5 percent of India’s annual diesel pumping segment. Presently, the power installed capacity in India in 2009-10 was
consumption) today to about 3.5 Billion supply to agriculture segment is only 3.53 million square meter. As a
liters / annum by 2020. staggered and partially supplied during comparison, China with relatively lower
inconvenient night times when grid insolation has 125 million square meters
power is available. Solar power, with its of SWH collector capacity.
© 2011 KPMG, an Indian Partnership and a member firm of the KPMG network of independent member firms affiliated with KPMG International Cooperative (“KPMG International”), a Swiss entity. All rights reserved.
THE RISING SUN17
Growth of SWH in India Category wise break-up of SWH installation in India
Source: MNRE Estimates Source: Greentech Report on Solar Water Heaters in India
Industry 6%
Others 5%
Residential 80%
Hospitals 3%
Hotels 6%
0
500
1000
1500
2000
2500
3000
3500
4000
09-10
0
100
200
300
400
500
600
700
Upto
2002-03
02-03 03-04 04-05 05-06 06-07 07-08 08-09
‘ 0 0 0 S q m
CumulativeAnnual Collector Area Addition
8/3/2019 The Rising Sun Full
http://slidepdf.com/reader/full/the-rising-sun-full 19/96
© 2011 KPMG, an Indian Partnership and a member firm of the KPMG network of independent member firms affiliated with KPMG International Cooperative (“KPMG International”), a Swiss entity. All rights reserved.
8. Usage of solar power for telecom towers and capturing
solar heat through collector area installation are already
economically viable options. Hence, from an economic
viability perspective, these applications do not have to
wait till 2017-18 for a self-sufficient market to get created.
9. BP Statistical Review - Conversion factor from MTOE to
MBOE is 7.33. Assumed oil pri ce is USD 100 per barrel
10. This calculation factors the PLF of conventional plants
and solar plants.
Residential SWH comprises ~80 percent would be required. This would result in a
of the total installed capacity. One of the saving of 4.8 Mn tons of oil per annum9biggest drivers of SWH offtake for that is equivalent to USD 3.5 billion .For
residential applications is the favourable solar power to find a place in industry,
cost economics which works out to a we believe that emergence of solution
payback period of 2.71 years. However, providers who provide performance
the barriers to this are the following: assurances is necessary. These solution
providers would customize the product?High upfront cost of the SWH
to meet each industry’s specific needsystems. This can be potentially
and provide assurances around hot wateraddressed through a consumer
/ steam requirements – duration offinancing solution.
availability, temperature and pressure
conditions, etc. We believe that solar?Presently, the cost to consumer of
equipment vendors would need to investalternates such as electric geysers doin technology as well as adapt to a morenot fully reflect the true cost of theseservices driven model (similar to analternatives since electricity pricesEnergy Services Company model) to befor the residential segment areable to penetrate the industrial segment.mostly subsidised.
However, we are confident that if andHot water / steam are also vital inputs for when such models evolve, the solution
a variety of industries including dairy, providers will find significant demand
pulp and paper, textiles and leather from the industrial segment.
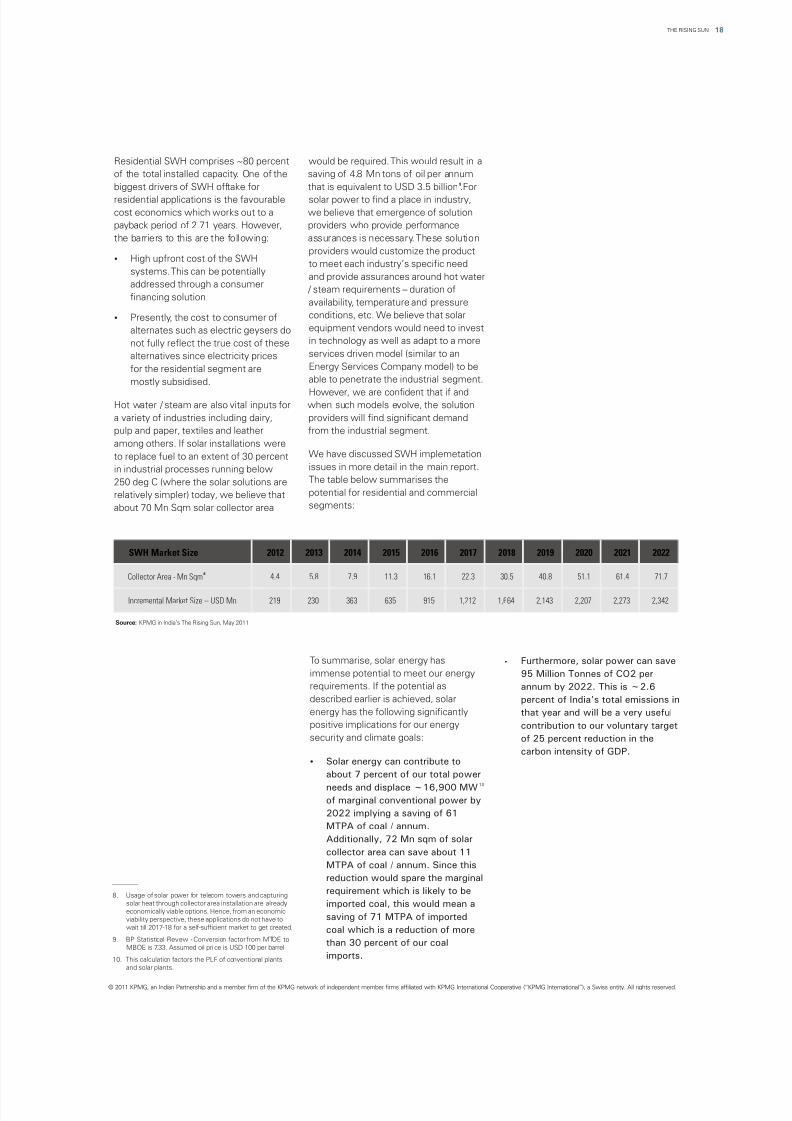
among others. If solar installations wereWe have discussed SWH implemetationto replace fuel to an extent of 30 percentissues in more detail in the main report.in industrial processes running belowThe table below summarises the250 deg C (where the solar solutions arepotential for residential and commercialrelatively simpler) today, we believe thatsegments:about 70 Mn Sqm solar collector area
To summarise, solar energy has ?Furthermore, solar power can save
immense potential to meet our energy 95 Million Tonnes of CO2 per
requirements. If the potential as annum by 2022. This is ~2.6
described earlier is achieved, solar percent of India’s total emissions in
energy has the following significantly that year and will be a very useful
positive implications for our energy contribution to our voluntary target
security and climate goals: of 25 percent reduction in the
carbon intensity of GDP.?Solar energy can contribute to
about 7 percent of our total power
10needs and displace ~16,900 MWof marginal conventional power by
2022 implying a saving of 61
MTPA of coal / annum.
Additionally, 72 Mn sqm of solar
collector area can save about 11
MTPA of coal / annum. Since this
reduction would spare the marginal
requirement which is likely to be
imported coal, this would mean a
saving of 71 MTPA of imported
coal which is a reduction of more
than 30 percent of our coal
imports.
SWH Market Size 2012 2013 2014 2015 2016 2017 2018 2019 2020 2021 2022
8Collector Area - Mn Sqm 4.4 5.8 7.9 11.3 16.1 22.3 30.5 40.8 51.1 61.4 71.7
Incremental Market Size – USD Mn 219 230 363 635 915 1,212 1,664 2,143 2,207 2,273 2,342
Source: KPMG in India’s The Rising Sun, May 2011
18THE RISING SUN
8/3/2019 The Rising Sun Full
http://slidepdf.com/reader/full/the-rising-sun-full 20/96
However, for all this to be achieved, the for financing: 1) Classify renewable and could commence earlier than
Government has an important role to energy and cleantech areas as a expected if the Government adopts
play in the coming five years. These separate sector for measuring an innovative execution model that
include the following: sectoral exposure limits for banks; provides scale to manufacturers to
currently they are considered part of bring down costs and a viable
power sector for measuring service delivery chain to provide aThe first phase under the JNNSM is exposure limits leading to sectoral reliabe solution to the farmers. Tothe right beginning. The Government limits emerging as a constraint 2) start with, diesel replacement canhas to keep the market going so that Grant priority sector lending status to commence immediately due tothe supply chain and ecosystem solar sector and 3) Allow banks to favourable cost economics. Pilots incontinue to evolve for the rapid scale issue tax free solar bonds which will this direction should commenceup. A graduated scale-up is desirable enable access to a long tenure stable immediately.rather than a fits-and-starts approach. interest rate source of finance.The scale-up should be calibrated Further, for the first phase of thebased on trade-off analysis between National Solar Mission projects, itcurrent affordability and long term Various State Governments andwould be prudent to provide abenefits. Municipal Corporations havecalibrated back-stop arrangement
implemented policy measures such(atleast for a certain time frame) in
as mandating SWH installations bythe event of payment default byamendment of building bye-laws,states utilities. We understand that
The Indian power utilities are highly rebate in property tax, rebate insuch a mechanism is being workedcash strapped and reeling under the electricity bills etc. Additionally,out and that will indeed be a veryburden of rising fuel costs and MNRE has programmes for providingsupportive measure. It is importantgreenfield investments. They need to interest rate / capital subsidies forthat the first phase of NSM receivesbe given the full support to absorb SWH installation. In our view, whilethe necessary financing to bethe cost of this program. A more these programs have met withsuccessful. This has seriousdirect support from the Centre to the success in a few regions, theimplications for the long term.state power utilities is the need of potential is far from realised.the hour. In the absence of this, the Reasons for this could be lack ofprogram has a serious risk of awareness of policy measuresderailing. We understand that steps While vendors may be able to among users, lack of interest amongare being taken to utilise the fund indigenize certain low value banks to actively fund SWHcreated by the cess on coal (National components of both grid and off-grid installations and certain concerns inClean Energy Fund) to assist states applications by themselves, high the mechanism of capital subsidyin building the evacuation value technology intensive disbursement. We believe that theinfrastructure. While this is welcome, components may require R&D schemes / policy measures need towe suggest a more broad based support from Government agencies / be strengthened through an effectiveutilisation of this fund that will institutions for indigenization. Some dialogue between stakeholders (endsupport states in meeting their RPO examples of such components are users, Government , Municipal(Renewable Purchase Obligation) absorber tubes for parabolic trough Corporations and Financialtargets for solar power. plants and collector dishes for high Institutions). Also, mandatory
temperature / pressure industrial implementation policies need to be
processes. Institutes such as the followed up with effective monitoring
Indian Institutes of Technology could to ensure compliance.
collaborate with the industry under aIn the first phase of the program, the Government driven R&D fundinglending community is likely to have From an industry standpoint, the solarframework to engineer products inconcerns related to technology risk sector presents an immense opportunity.the country. There are successfuland power off-take and payment The total investment requirement in onlyexamples from the US where the
security. The Central Government has the “projects” or “applications” spaceNational Renewable Energyindeed evolved innovative steps (not including manufacturing ) is anLaboratory (NREL) collaborates withunder the National Solar Mission estimated USD 110 billion in the periodthe private sector for collaborativesuch as the bundling program 2012-22. This could provide tremendousresearch.wherein the solar power is pooled potential for solar-specific product
with conventional power and the markets (inverters, parabolic mirrors etc.)
bundle is sold to state utilities at an to develop in India during the
average rate. This softens the impact corresponding period, which could be
of the higher price of solar power around USD 30 billion.The total connected load ofand gives comfort to lenders that agriculture pumpsets is expected to
For mainstream solar companies, wepayment default is less likely to be in excess of 100 GW by 2020. Webelieve that the following are the keyoccur. However, we believe the believe that this could be a very largeimperatives in the near term:following steps can be taken to market for solar-powered pumpsets
further strengthen the environment
?
?
?
?
?
?
Keep the market stimulus going
Push Solar Water Heating (SWH) in
residential catergory
Get the funding in place andchannelise it to the utilities
Support domestic R&D through
public-private collaboration
Government should play an active
role in giving the requisite support
to the lending community
Look at innovative possibilities for
large scale solar powering of
agriculture pumpsets
© 2011 KPMG, an Indian Partnership and a member firm of the KPMG network of independent member firms affiliated with KPMG International Cooperative (“KPMG International”), a Swiss entity. All rights reserved.
THE RISING SUN19
8/3/2019 The Rising Sun Full
http://slidepdf.com/reader/full/the-rising-sun-full 21/96
© 2011 KPMG, an Indian Partnership and a member firm of the KPMG network of independent member firms affiliated with KPMG International Cooperative (“KPMG International”), a Swiss entity. All rights reserved.
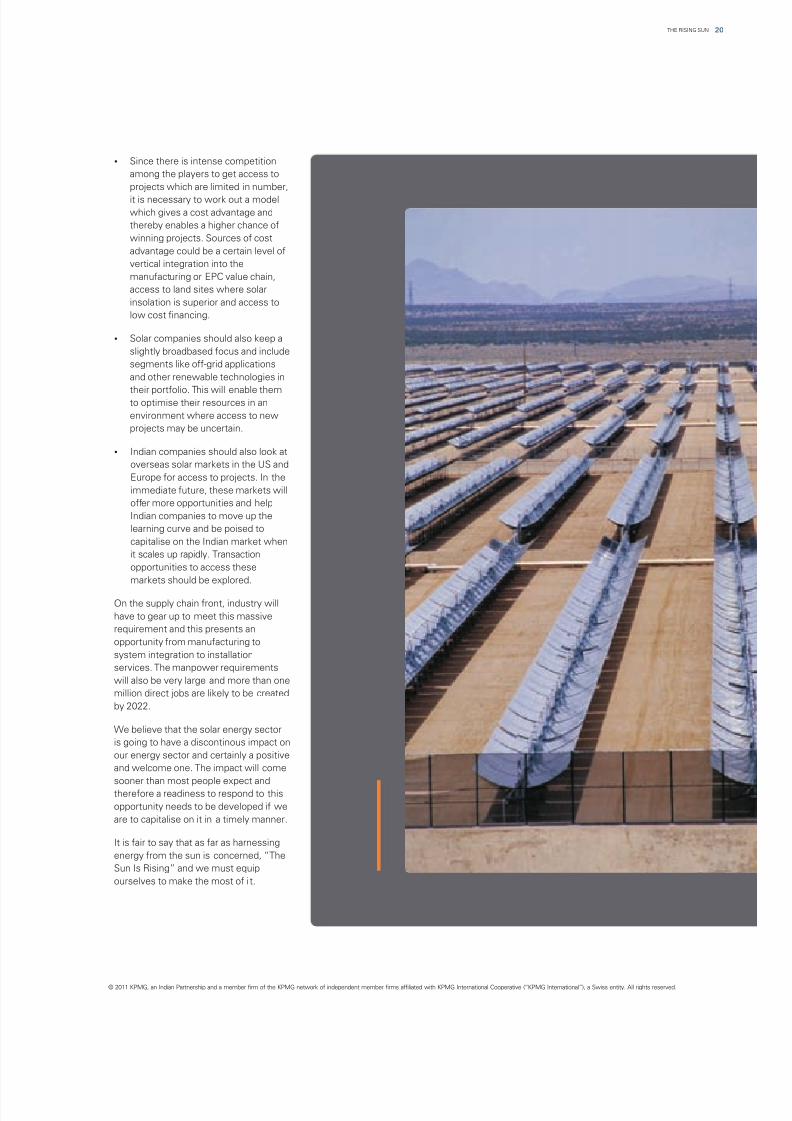
?Since there is intense competition
among the players to get access to
projects which are limited in number,
it is necessary to work out a model
which gives a cost advantage and
thereby enables a higher chance of
winning projects. Sources of cost
advantage could be a certain level of
vertical integration into the
manufacturing or EPC value chain,
access to land sites where solar
insolation is superior and access to
low cost financing.
?Solar companies should also keep a
slightly broadbased focus and include
segments like off-grid applications
and other renewable technologies in
their portfolio. This will enable themto optimise their resources in an
environment where access to new
projects may be uncertain.
?Indian companies should also look at
overseas solar markets in the US and
Europe for access to projects. In the
immediate future, these markets will
offer more opportunities and help
Indian companies to move up the
learning curve and be poised to
capitalise on the Indian market when
it scales up rapidly. Transaction
opportunities to access these
markets should be explored.
On the supply chain front, industry will
have to gear up to meet this massive
requirement and this presents an
opportunity from manufacturing to
system integration to installation
services. The manpower requirements
will also be very large and more than one
million direct jobs are likely to be created
by 2022.
We believe that the solar energy sector
is going to have a discontinous impact on
our energy sector and certainly a positive
and welcome one. The impact will come
sooner than most people expect andtherefore a readiness to respond to this
opportunity needs to be developed if we
are to capitalise on it in a timely manner.
It is fair to say that as far as harnessing
energy from the sun is concerned, “The
Sun Is Rising” and we must equip
ourselves to make the most of i t.
20THE RISING SUN
8/3/2019 The Rising Sun Full
http://slidepdf.com/reader/full/the-rising-sun-full 22/96
THE RISING SUN42
Introduction
THE RISING SUN21
© 2011 KPMG, an Indian Partnership and a member firm of the KPMG network of independent member firms affiliated with
KPMG International Cooperative (“KPMG International”), a Swiss entity. All rights reserved.

8/3/2019 The Rising Sun Full
http://slidepdf.com/reader/full/the-rising-sun-full 23/96
03Introduction
22THE RISING SUN
© 2011 KPMG, an Indian Partnership and a member firm of the KPMG network of independent member firms affiliated with KPMG International Cooperative (“KPMG International”), a Swiss entity. All rights reserved.
8/3/2019 The Rising Sun Full
http://slidepdf.com/reader/full/the-rising-sun-full 24/96
1. United Nations Greenhouse Gas emissions data
03
Introduction
Key Questions:?Why is solar power important for India?
?Globally, how has the solar power market evolved?
?What role has the Indian Government played in supporting the solar programs?
3.1Importance of solar
power – energy security
and emission mitigationIndia is a rapidly growing economy “NIMBY” (Not in My Backyard)
which needs energy to meet its growth syndrome. These developments further
objectives in a sustainable manner. The strengthen the case for Renewable
increasing energy requirements have Energy and particularly that for Solar
meant that the extent of imports in the Energy.
energy mix is growing rapidly. OilIndia is a tropical country with abundantimports already constitute nearly 75sunshine. From time immemorial,percent of our total oil consumption.Indians have idolized the Sun as theCoal imports which were negligible aVisible God that provides vital energyfew years back are likely to rise to
for sustenance of life. It is time wearound 30 percent of the total coalutilize this immense potential of solarrequirement by 2017. Globally, there ispower which addresses the twinintense competition for access toobjectives of Energy Security andenergy resources. This is a seriousCarbon Mitigation for India. Moreover,cause for concern as the Indianbeing modular in nature, solar powereconomy gets exposed to the globalcan meet demand for wide rangingfuel supply market which is volatile andmarket applications where the size ofrising. Moreover, being amongst theinstallations can vary from as low astop five greenhouse gas (GHG) emitters
1 KWp to MWp scale projects. Further,globally , India has a responsibility tosolar power can meet requirements inachieve the growth trajectory in anareas where conventional power wasenvironmentally sensitive andunable to reach economically due toresponsible manner.infrastructure bottlenecks.
Given this backdrop, alternate fuels like
The global solar radiation map asnuclear fuel and renewable energyshown in the exhibit overleaf clearlytechnologies have been gaining inshows that India has a radiationprominence lately. However, there areadvantage compared to severalseveral sensitivities related to costs andEuropean nations which have theenvironment when it comes to nuclearmaximum solar installations today.technology. In fact, the recent Japanese
experiences at the Fukushima nuclear
reactor following a devastating
earthquake and tsunami has reignited
the debate around safety of nuclear
energy and triggered the usual
© 2011 KPMG, an Indian Partnership and a member firm of the KPMG network of independent member firms affiliated with KPMG International Cooperative (“KPMG International”), a Swiss entity. All rights reserved.
THE RISING SUN23
India is a rapidly growing
economy which needs energy
to meet its growth objectives
in a sustainable manner.
“”
8/3/2019 The Rising Sun Full
http://slidepdf.com/reader/full/the-rising-sun-full 25/96
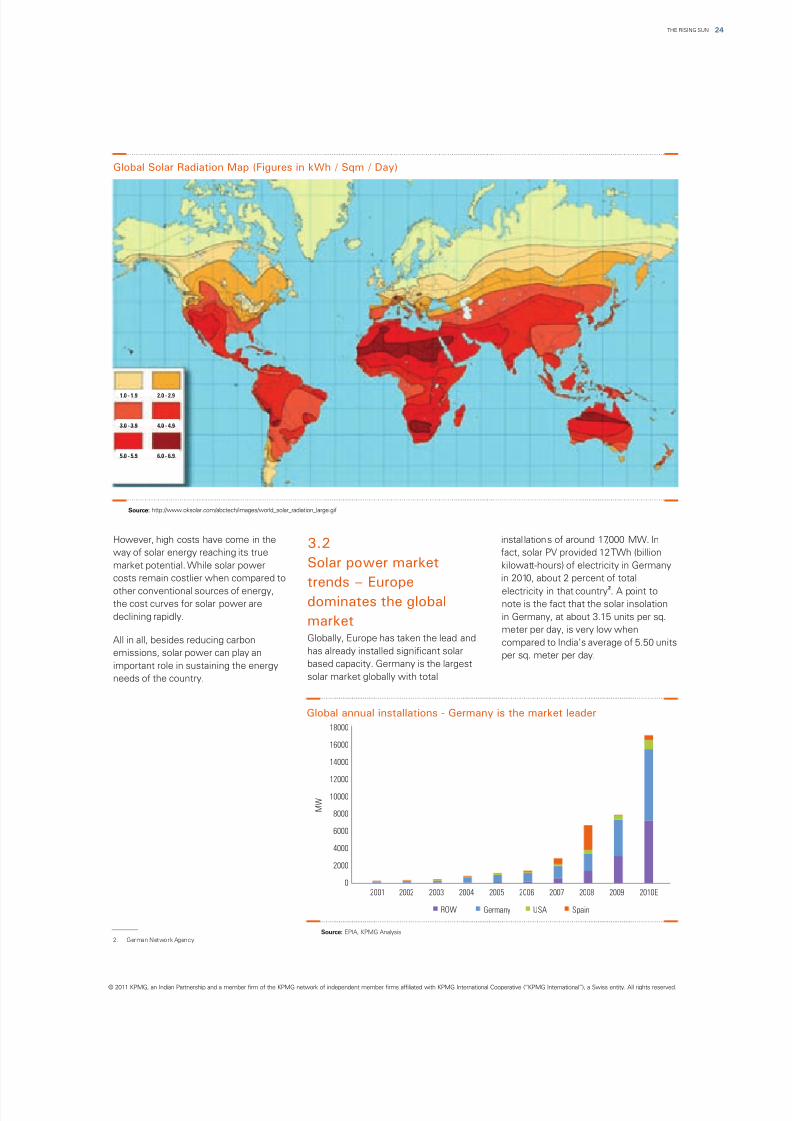
Global annual installations - Germany is the market leader
Global Solar Radiation Map (Figures in kWh / Sqm / Day)
Source: EPIA, KPMG Analysis
2. German Network Agency
Source: http://www.oksolar.com/abctech/images/world_solar_radiation_large.gif
However, high costs have come in the installations of around 17,000 MW. In
way of solar energy reaching its true fact, solar PV provided 12 TWh (billion
market potential. While solar power kilowatt-hours) of electricity in Germany
costs remain costlier when compared to in 2010, about 2 percent of total
2other conventional sources of energy, electricity in that country . A point tothe cost curves for solar power are note is the fact that the solar insolation
declining rapidly. in Germany, at about 3.15 units per sq.
meter per day, is very low whenGlobally, Europe has taken the lead andAll in all, besides reducing carbon compared to India’s average of 5.50 unitshas already installed significant solaremissions, solar power can play an per sq. meter per day.based capacity. Germany is the largestimportant role in sustaining the energysolar market globally with totalneeds of the country.
3.2
Solar power market
trends – Europedominates the global
market
0
2000
4000
6000
8000
10000
M W
12000
14000
16000
18000
2001 2002 2003 2004 2005 2006 2007 2008 2009 2010E
ROW Germany USA Spain
24THE RISING SUN
© 2011 KPMG, an Indian Partnership and a member firm of the KPMG network of independent member firms affiliated with KPMG International Cooperative (“KPMG International”), a Swiss entity. All rights reserved.
Midpoint ofzone value
1.0 - 1.9
3.0 - 3.9
5.0 - 5.9
2.0 - 2.9
4.0 - 4.9
6.0 - 6.9
8/3/2019 The Rising Sun Full
http://slidepdf.com/reader/full/the-rising-sun-full 26/96
THE RISING SUN25
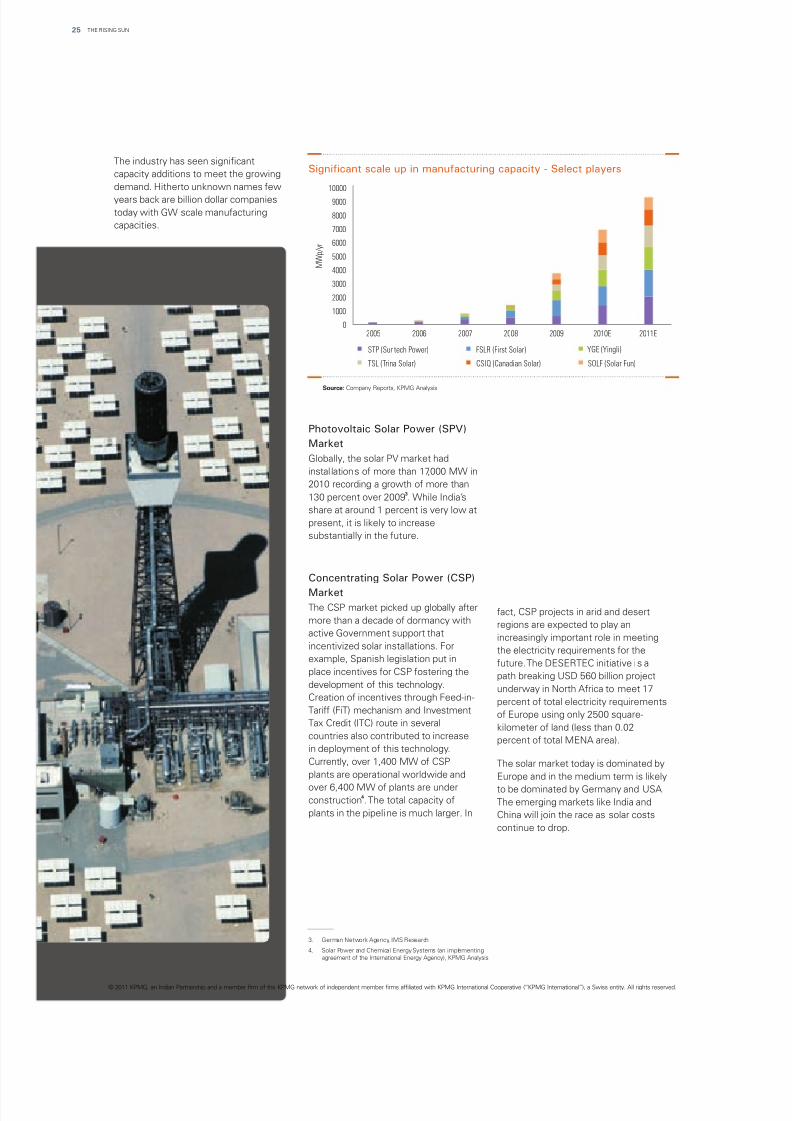
The industry has seen significant
capacity additions to meet the growing
demand. Hitherto unknown names few
years back are billion dollar companies
today with GW scale manufacturing
capacities.
3. German Network Agency, IMS Research
4. Solar Power and Chemical Energy Systems (an implementing
agreement of the International Energy Agency), KPMG Analysis
Significant scale up in manufacturing capacity - Select players
Source: Company Reports, KPMG Analysis
Photovoltaic Solar Power (SPV)
Market
Globally, the solar PV market had
installations of more than 17,000 MW in
2010 recording a growth of more than3
130 percent over 2009 . While India’s
share at around 1 percent is very low at
present, it is likely to increase
substantially in the future.
Concentrating Solar Power (CSP)
Market
The CSP market picked up globally after fact, CSP projects in arid and desertmore than a decade of dormancy with regions are expected to play anactive Government support that increasingly important role in meetingincentivized solar installations. For the electricity requirements for theexample, Spanish legislation put in future. The DESERTEC initiative is aplace incentives for CSP fostering the path breaking USD 560 billion projectdevelopment of this technology. underway in North Africa to meet 17Creation of incentives through Feed-in- percent of total electricity requirementsTariff (FiT) mechanism and Investment of Europe using only 2500 square-Tax Credit (ITC) route in several kilometer of land (less than 0.02countries also contributed to increase percent of total MENA area).in deployment of this technology.
Currently, over 1,400 MW of CSP The solar market today is dominated byplants are operational worldwide and Europe and in the medium term is likely
over 6,400 MW of plants are under to be dominated by Germany and USA.4
construction . The total capacity of The emerging markets like India andplants in the pipeline is much larger. In China will join the race as solar costs
continue to drop.
STP (Suntech Power) FSLR (First Solar) YGE (Yingli)
TSL (Trina Solar) CSIQ (Canadian Solar) SOLF (Solar Fun)
0
1000
2000
3000
4000
5000
6000
7000
8000
9000
10000
2005 2006 2007 2008 2009 2010E 2011E
M W p / y r
© 2011 KPMG, an Indian Partnership and a member firm of the KPMG network of independent member firms affiliated with KPMG International Cooperative (“KPMG International”), a Swiss entity. All rights reserved.
8/3/2019 The Rising Sun Full
http://slidepdf.com/reader/full/the-rising-sun-full 27/96
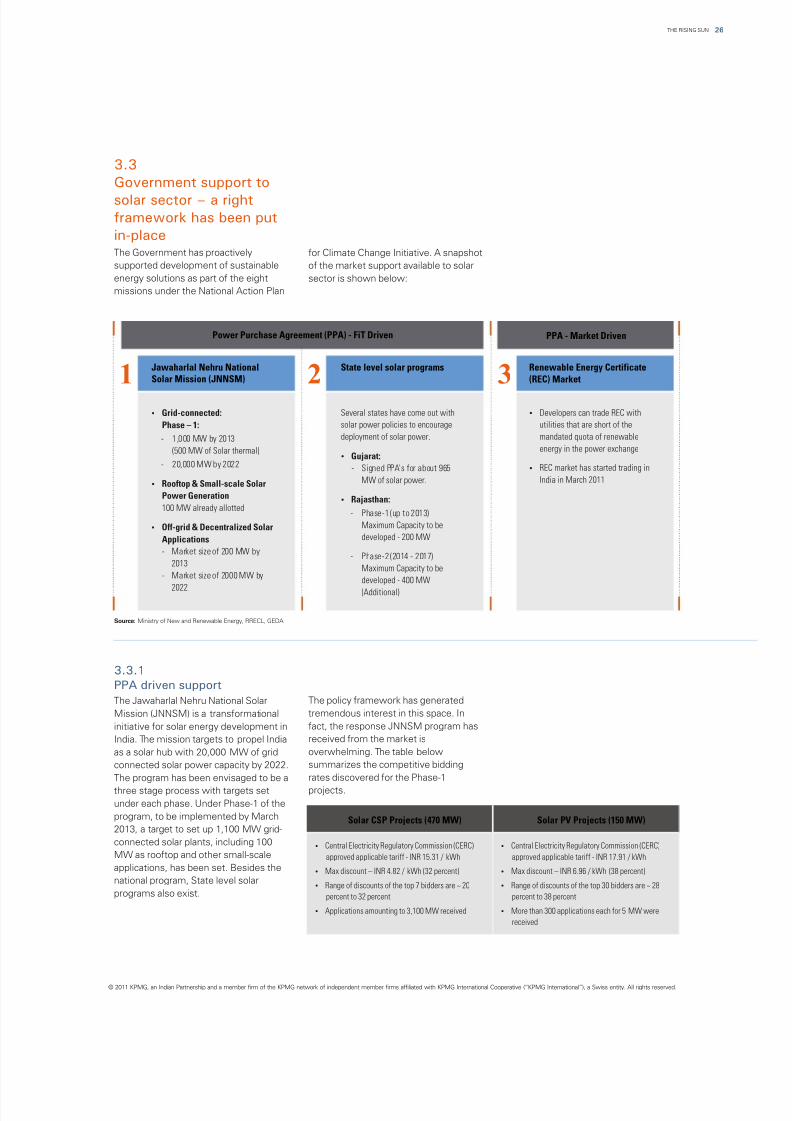
3.3.1
PPA driven support
The policy framework has generatedThe Jawaharlal Nehru National Solar
tremendous interest in this space. InMission (JNNSM) is a transformational
fact, the response JNNSM program hasinitiative for solar energy development in
received from the market isIndia. The mission targets to propel India
overwhelming. The table belowas a solar hub with 20,000 MW of grid
summarizes the competitive biddingconnected solar power capacity by 2022.
rates discovered for the Phase-1The program has been envisaged to be a
projects.three stage process with targets set
under each phase. Under Phase-1 of the
program, to be implemented by March
2013, a target to set up 1,100 MW grid-
connected solar plants, including 100
MW as rooftop and other small-scale
applications, has been set. Besides the
national program, State level solar
programs also exist.
3.3
Government support to
solar sector – a rightframework has been put
in-placeThe Government has proactively for Climate Change Initiative. A snapshot
supported development of sustainable of the market support available to solar
energy solutions as part of the eight sector is shown below:
missions under the National Action Plan
Power Purchase Agreement (PPA) - FiT Driven PPA - Market Driven
3 Renewable Energy Certificate
(REC) Market21 State level solar programsJawaharlal Nehru NationalSolar Mission (JNNSM)
?Grid-connected:
Phase – 1:
- 1,000 MW by 2013
(500 MW of Solar thermal)
- 20,000 MW by 2022
?Rooftop & Small-scale Solar
Power Generation
100 MW already allotted
?Off-grid & Decentralized Solar
Applications
- Market size of 200 MW by
2013
- Market size of 2000 MW by
2022
Several states have come out with
solar power policies to encourage
deployment of solar power.
?Gujarat:
- Signed PPA's for about 965
MW of solar power.
?Rajasthan:
- Phase-1 (up to 2013)
Maximum Capacity to be
developed - 200 MW
- Phase-2 (2014 - 2017)
Maximum Capacity to be
developed - 400 MW
(Additional)
?Developers can trade REC with
utilities that are short of the
mandated quota of renewable
energy in the power exchange
?REC market has started trading in
India in March 2011
Solar CSP Projects (470 MW) Solar PV Projects (150 MW)
?Central Electricity Regulatory Commission (CERC)
approved applicable tariff - INR 15.31 / kWh
?Max discount – INR 4.82 / kWh (32 percent)
?Range of discounts of the top 7 bidders are ~ 20
percent to 32 percent
?Applications amounting to 3,100 MW received
?Central Electricity Regulatory Commission (CERC)
approved applicable tariff - INR 17.91 / kWh
?Max discount – INR 6.96 / kWh (38 percent)
?Range of discounts of the top 30 bidders are ~ 28
percent to 38 percent
?More than 300 applications each for 5 MW were
received
26THE RISING SUN
Source: Ministry of New and Renewable Energy, RRECL, GEDA
© 2011 KPMG, an Indian Partnership and a member firm of the KPMG network of independent member firms affiliated with KPMG International Cooperative (“KPMG International”), a Swiss entity. All rights reserved.
8/3/2019 The Rising Sun Full
http://slidepdf.com/reader/full/the-rising-sun-full 28/96
THE RISING SUN27
5. One REC is equivalent to 1 MWH of electricity generated fromrenewable energy source and injected into the grid.
These discounts reflect the rapidly
declining cost curves for solar modules.
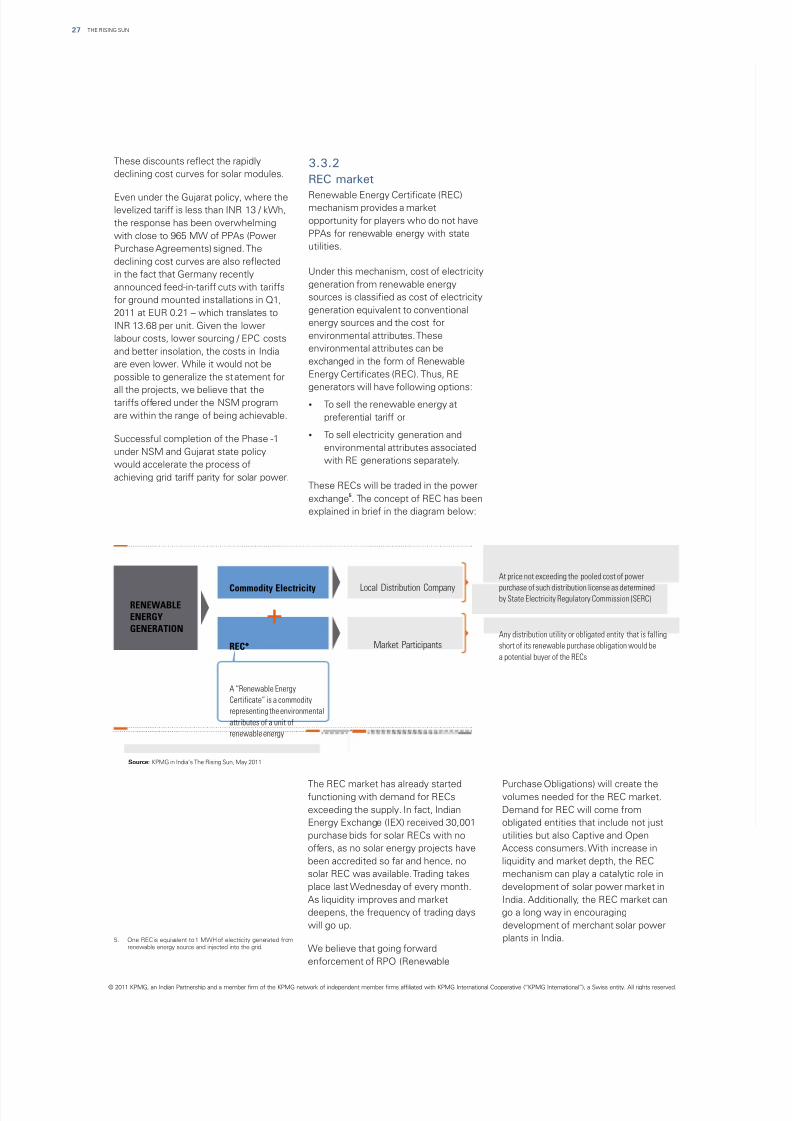
Renewable Energy Certificate (REC)Even under the Gujarat policy, where themechanism provides a marketlevelized tariff is less than INR 13 / kWh,opportunity for players who do not havethe response has been overwhelmingPPAs for renewable energy with statewith close to 965 MW of PPAs (Powerutilities.Purchase Agreements) signed. The
declining cost curves are also reflectedUnder this mechanism, cost of electricityin the fact that Germany recentlygeneration from renewable energyannounced feed-in-tariff cuts with tariffssources is classified as cost of electricityfor ground mounted installations in Q1,generation equivalent to conventional2011 at EUR 0.21 – which translates toenergy sources and the cost forINR 13.68 per unit. Given the lowerenvironmental attributes. Theselabour costs, lower sourcing / EPC costsenvironmental attributes can beand better insolation, the costs in Indiaexchanged in the form of Renewableare even lower. While it would not beEnergy Certificates (REC). Thus, REpossible to generalize the statement forgenerators will have following options:
all the projects, we believe that thetariffs offered under the NSM program ?To sell the renewable energy atare within the range of being achievable. preferential tariff or
?To sell electricity generation andSuccessful completion of the Phase -1environmental attributes associatedunder NSM and Gujarat state policywith RE generations separately.would accelerate the process of
achieving grid tariff parity for solar power.These RECs will be traded in the power
5
exchange . The concept of REC has been
explained in brief in the diagram below:
3.3.2
REC market
Local Distribution Company
At price not exceeding the pooled cost of power
purchase of such distribution license as determinedby State Electricity Regulatory Commission (SERC)
Any distribution utility or obligated entity that is falling
short of its renewable purchase obligation would be
a potential buyer of the RECs
Market Participants
RENEWABLEENERGY
GENERATION
Commodity Electricity
REC*
+
A “Renewable Energy
Certificate” is a commodity
representing the environmental
attributes of a unit of
renewable energy
The REC market has already started Purchase Obligations) will create thefunctioning with demand for RECs volumes needed for the REC market.
exceeding the supply. In fact, Indian Demand for REC will come from
Energy Exchange (IEX) received 30,001 obligated entities that include not just
purchase bids for solar RECs with no utilities but also Captive and Open
offers, as no solar energy projects have Access consumers. With increase in
been accredited so far and hence, no liquidity and market depth, the REC
solar REC was available. Trading takes mechanism can play a catalytic role in
place last Wednesday of every month. development of solar power market in
As liquidity improves and market India. Additionally, the REC market can
deepens, the frequency of trading days go a long way in encouraging
will go up. development of merchant solar power
plants in India.We believe that going forward
enforcement of RPO (Renewable
© 2011 KPMG, an Indian Partnership and a member firm of the KPMG network of independent member firms affiliated with KPMG International Cooperative (“KPMG International”), a Swiss entity. All rights reserved.
Source: KPMG in India’s The Rising Sun, May 2011

8/3/2019 The Rising Sun Full
http://slidepdf.com/reader/full/the-rising-sun-full 29/96
28THE RISING SUN
© 2011 KPMG, an Indian Partnership and a member firm of the KPMG network of independent member firms affiliated with KPMG International Cooperative (“KPMG International”), a Swiss entity. All rights reserved.
8/3/2019 The Rising Sun Full
http://slidepdf.com/reader/full/the-rising-sun-full 30/96
THE RISING SUN42
Solar power cost drivers
29
© 2011 KPMG, an Indian Partnership and a member firm of the KPMG network of independent member firms affiliated with
KPMG International Cooperative (“KPMG International”), a Swiss entity. All rights reserved.
THE RISING SUN
8/3/2019 The Rising Sun Full
http://slidepdf.com/reader/full/the-rising-sun-full 31/96
04Solar power cost drivers
30THE RISING SUN
© 2011 KPMG, an Indian Partnership and a member firm of the KPMG network of independent member firms affiliated with KPMG International Cooperative (“KPMG International”), a Swiss entity. All rights reserved.

8/3/2019 The Rising Sun Full
http://slidepdf.com/reader/full/the-rising-sun-full 32/96
04
Key Questions:?What are the costs of solar power today?
?How are the key cost drivers evolving for solar PV and CSP?
4.1Solar power costs –
relatively higher when
compared to other fuelsSolar power is expensive when
compared to conventional sources of
power and hence, the solar market
development is currently dependent on
Government support.
During the last few years, there has explore cost reduction possibilities for
been significant cost reduction in solar solar power.
power and the cost curves of solarWhile there are multiple solarpower are declining. On the other hand,technology options, particularly twocosts of power from conventionaltechnologies viz. solar crystalline andsources are increasing due to highersolar parabolic trough are consideredfixed costs and rising fuel prices.mature and likely to reach grid parityMoreover, there is considerablefaster.research that is underway to further
Solar power costdrivers
Indicative levelized cost comparison of power from different fuels
Source: Industry Estimates, KPMG Analysis
33.5
4 43
1211
5
0
2
4
6
8
10
12
14
Domestic
Coal
Imported
Coal
Natural
Gas
Nuclear
Power
Hydro Solar
PV
Solar Thermal
(Storage)
Wind
Power
I N R / k W h
© 2011 KPMG, an Indian Partnership and a member firm of the KPMG network of independent member firms affiliated with KPMG International Cooperative (“KPMG International”), a Swiss entity. All rights reserved.
THE RISING SUN31
8/3/2019 The Rising Sun Full
http://slidepdf.com/reader/full/the-rising-sun-full 33/96
4.2
Solar PV
4.2.1
Crystalline Silicon technology –
costs are declining rapidly
The solar crystalline PV technology
dominates the market for solar PV
installations globally. Dynamic cost
reductions have accelerated deployment
of Solar C-Si (crystalline silicon)
technology in the recent past. The
module prices have dropped from around
USD 3-4 per W about two years back to
under USD 1.5-1.8 per W today.
Consequently, the proportion of module
prices in the total system price has come
down significantly. The corresponding
price of electricity which was upwards of
INR 25 has dropped to around INR 13
per unit.
Some of the drivers that have
contributed towards this price reduction
are mentioned below:
Besides the aforementioned factors, the
solar module prices have also been
affected by the global market supply
scenario. The entry of China into the
solar manufacturing space has
contributed significantly to lower costs.
Economies of scale and global recession
in 2008 coupled with oversupply of
modules resulted in the squeeze on
margins across the board, triggering a
sharp fall in prices.
Going forward, while poly-silicon prices
continue to be an important determinant
factor, other key elements like
processing costs and silicon usage will
gain prominence. Fully integrated
Chinese manufacturers have attained
cost leadership position today in C-Si and
are likely to continue producing modules
with global cost leadership.
1018 12031843
2798
6048
7544
11961771
2474
3733
7700
9300
0
1000
2000
3000
4000
5000
6000
7000
8000
9000
10000
2004 2005 2006 2007 2008 2009
M W
Installations Cell Supply
Market Scenario - Oversupply
Source: EPIA, Industry Estimates, JP Morgan Report, KPMG Analysis
Source: DOE, NREL, KPMG Analysis
Polysilicon Costs ~400 USD/ Kg ~ 50-60 USD/ Kg
Silicon Usage > 8 gm/ W ~ 6-6.5 gm/ W
Processing Costs > 1.2-1.3 USD/ W ~ 0.7-0.8 USD/ W
32THE RISING SUN
© 2011 KPMG, an Indian Partnership and a member firm of the KPMG network of independent member firms affiliated with KPMG International Cooperative (“KPMG International”), a Swiss entity. All rights reserved.
Globally, solar PV system prices have dropped significantly...
Source: Analyst Reports KPMG Analysis
3.51.7
1.8
1.5
25
13
0
5
10
15
20
25
30
0
3
6
9
12
15
2008 2010
U S D / W
I N R / k W h
5.3
3.2
Module (USD/W) BOS (USD/W) Tariff (INR/kWh)
8/3/2019 The Rising Sun Full
http://slidepdf.com/reader/full/the-rising-sun-full 34/96
THE RISING SUN33
1. Industry Estimates
It may be mentioned here that within the
overall system costs, the proportion of
the non-module system costs is
increasing. In fact, the cost reduction
possibilities in the non-module segment
of the system costs could well
determine the timing of grid parity.
The cost reduction trends for non-
module system costs are listed here:
?Majority of
Inverters areimported currently
?Players are looking
at assembly of
inverters in India
which could
contribute
towards cost
reduction
?Market and
technology alreadyestablised
?Driven by prices of
commodities like
copper and CRGP
coil
?Driven by localized
site conditions andlow labour costs
?Availability of
manpower fordesign engineering
?Local sourcing of
materials
?Driven by low cost
innovativefinancing options
- Exim route
- Tax f ree solar
bonds
Balance of system(~45-50 % of totalsolar system cost)
Inverters Transformers,
switch gears andcables
Civil andGeneral Works
Installation andCommissioning
IDC andFinancing charges
Key
Considerations
Potential forcost reduction
LOW LOW HIGH HIGH HIGH
Source: IEA-PVPS, Industry Estimates, NREL, KPMG Analysis
Given this backdrop, we have looked at
overall system costs from a utility scale
perspective as well as from aThin film modules are constructed by
residential rooftop perspective. Whiledepositing extremely thin layers of
module costs may not be significantlyphotosensitive materials onto a
different, the non-module and balancesubstrate such as glass, stainless steel
of system costs could be cheaper at aor flexible plastic. Correspondingly, thin-
utility level when compared to thefilm has less raw material consumption.
small-scale residential rooftop segment.However, the typical efficiencies
Further, the constraint of higher land1
between 7 and 10 percent are muchavailability which would be there forlower when compared to crystalline PV.
utility scale project does not exist forMoreover, global market for thin-filmsmall-scale roof top projects wherehas been driven significantly by First
unutilized space can be effectivelySolar.
used.
Overall, we estimate that PV system
prices could decline at the rate of 7
percent per year over the next decade.
4.2.2
Thin-film PV
© 2011 KPMG, an Indian Partnership and a member firm of the KPMG network of independent member firms affiliated with KPMG International Cooperative (“KPMG International”), a Swiss entity. All rights reserved.
Solar PV system prices
could decline at 5-7
percentage per annum during
the next decade
“”
8/3/2019 The Rising Sun Full
http://slidepdf.com/reader/full/the-rising-sun-full 35/96
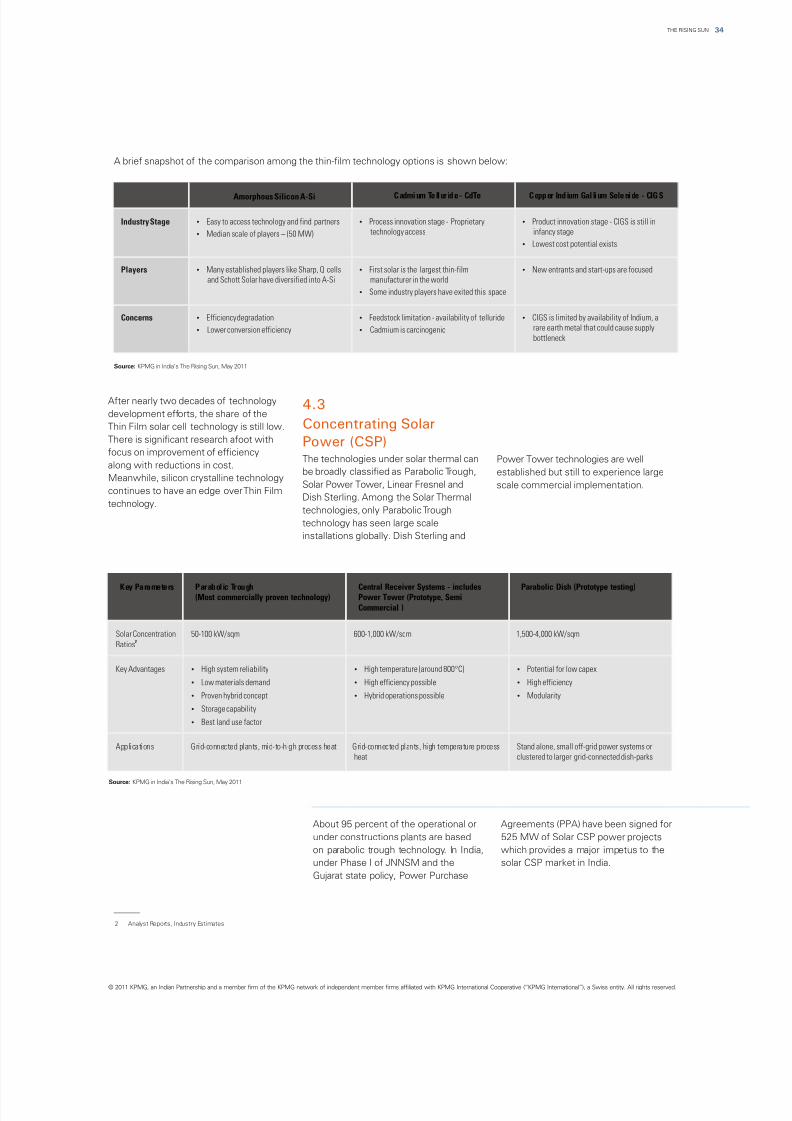
After nearly two decades of technology
development efforts, the share of the
Thin Film solar cell technology is still low.
There is significant research afoot with
focus on improvement of efficiencyThe technologies under solar thermal can Power Tower technologies are well
along with reductions in cost.be broadly classified as Parabolic Trough, established but still to experience large
Meanwhile, silicon crystalline technologySolar Power Tower, Linear Fresnel and scale commercial implementation.
continues to have an edge over Thin FilmDish Sterling. Among the Solar Thermal
technology.technologies, only Parabolic Trough
technology has seen large scale
installations globally. Dish Sterling and
4.3
Concentrating Solar
Power (CSP)
About 95 percent of the operational or Agreements (PPA) have been signed for
under constructions plants are based 525 MW of Solar CSP power projects
on parabolic trough technology. In India, which provides a major impetus to the
under Phase I of JNNSM and the solar CSP market in India.
Gujarat state policy, Power Purchase
A brief snapshot of the comparison among the thin-film technology options is shown below:
Amorphous Silicon A-Si Cadmium Telluride - CdTe Copper Indium Gal lium Selenide - CIGS
Industry Stage ?Easy to access technology and find partners
?Median scale of players – (50 MW)
?Process innovation stage - Proprietary
technology access
?Product innovation stage - CIGS is still in
infancy stage
?Lowest cost potential exists
Players ?Many established players like Sharp, Q cells
and Schott Solar have diversified into A-Si
?First solar is the largest thin-film
manufacturer in the world
?Some industry players have exited this space
?New entrants and start-ups are focused
Concerns ?Efficiency degradation
?Lower conversion efficiency
?Feedstock limitation - availability of telluride
?Cadmium is carcinogenic
?CIGS is limited by availability of Indium, a
rare earth metal that could cause supply
bottleneck
Key Parameters Parabolic Trough(Most commercially proven technology)
Central Receiver Systems - includesPower Tower (Prototype, Semi
Commercial )
Parabolic Dish (Prototype testing)
Solar Concentration2
Ratios
50-100 kW/sqm 600-1,000 kW/sqm 1,500-4,000 kW/sqm
Key Advantages ?High system reliability
?Low materials demand
?Proven hybrid concept
?Storage capability
?Best land use factor
?High temperature (around 800°C)
?High efficiency possible
?Hybrid operations possible
?Potential for low capex
?High efficiency
?Modularity
Applications Grid-connected plants, mid-to-high process heat Grid-connected plants, high temperature process
heat
Stand alone, small off-grid power systems or
clustered to larger grid-connected dish-parks
34THE RISING SUN
2. Analyst Reports, Industry Estimates
Source: KPMG in India’s The Rising Sun, May 2011
Source: KPMG in India’s The Rising Sun, May 2011
© 2011 KPMG, an Indian Partnership and a member firm of the KPMG network of independent member firms affiliated with KPMG International Cooperative (“KPMG International”), a Swiss entity. All rights reserved.
8/3/2019 The Rising Sun Full
http://slidepdf.com/reader/full/the-rising-sun-full 36/96
THE RISING SUN35
4.3.1
Drivers for cost reduction in Parabolic Trough technology
The key component market for parabolic trough technology has oligopolycharacteristics dominated by a small number of players. The market in Europe has
been dominated by technology players who are integrated across the value chain
right up to project development. In fact, access to technology besides project
design and execution becomes important to ensure cost competitiveness. Further,
from an Indian market context, the cost reduction could be driven primarily by the
following factors:
1 Localization – Extent of indigenization
2 Economies of Scale – Direct impact on cost per MW
3 Manufacturing innovations and value engineering – Increasing efficiency and
reducing cost
4 Usage of storage system – Higher utilization of the plant
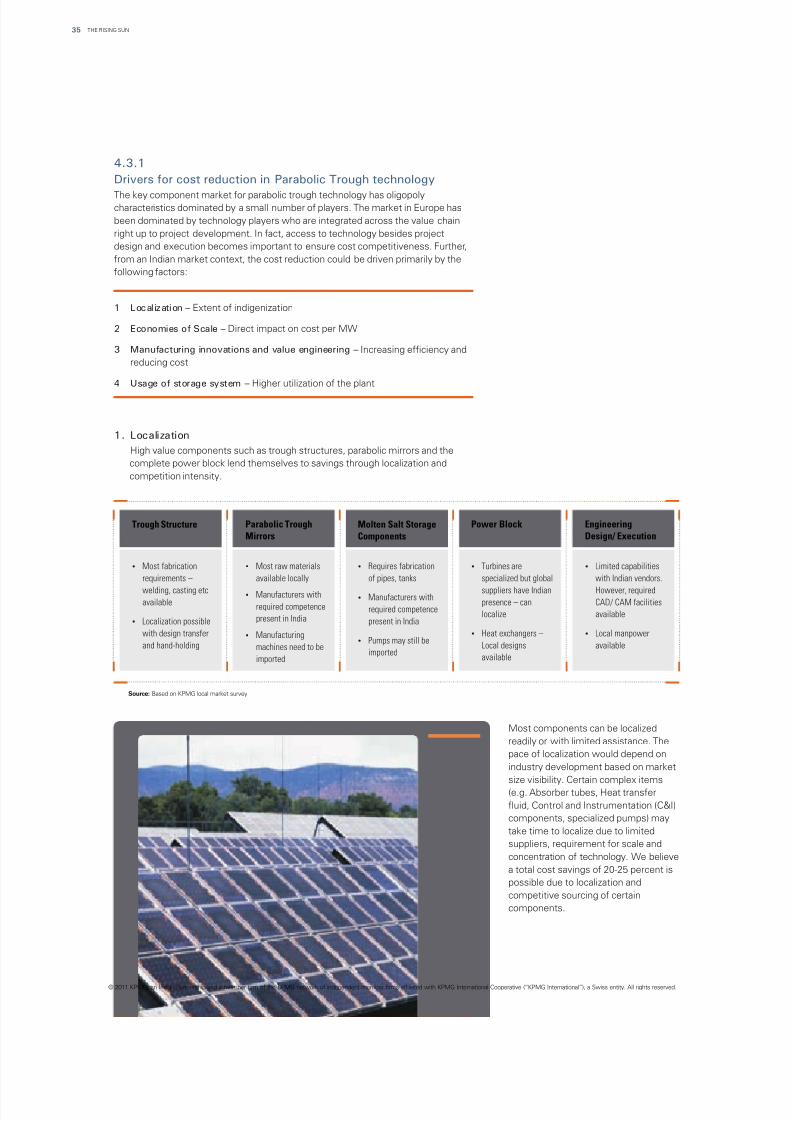
1. Localization
High value components such as trough structures, parabolic mirrors and the
complete power block lend themselves to savings through localization and
competition intensity.
Source: Based on KPMG local market survey
?Most fabrication
requirements –
welding, casting etcavailable
?Localization possible
with design transfer
and hand-holding
?Most raw materials
available locally
?Manufacturers with
required competence
present in India
?Manufacturing
machines need to be
imported
?Requires fabrication
of pipes, tanks
?Manufacturers with
required competence
present in India
?Pumps may still be
imported
?Turbines are
specialized but global
suppliers have Indianpresence – can
localize
?Heat exchangers –
Local designs
available
?Limited capabilities
with Indian vendors.
However, requiredCAD/ CAM facilities
available
?Local manpower
available
Trough Structure Parabolic Trough
MirrorsMolten Salt Storage
Components
Power Block Engineering
Design/ Execution
Most components can be localized
readily or with limited assistance. The
pace of localization would depend on
industry development based on market
size visibility. Certain complex items
(e.g. Absorber tubes, Heat transfer
fluid, Control and Instrumentation (C&I)
components, specialized pumps) may
take time to localize due to limited
suppliers, requirement for scale and
concentration of technology. We believe
a total cost savings of 20-25 percent is
possible due to localization and
competitive sourcing of certain
components.
© 2011 KPMG, an Indian Partnership and a member firm of the KPMG network of independent member firms affiliated with KPMG International Cooperative (“KPMG International”), a Swiss entity. All rights reserved.
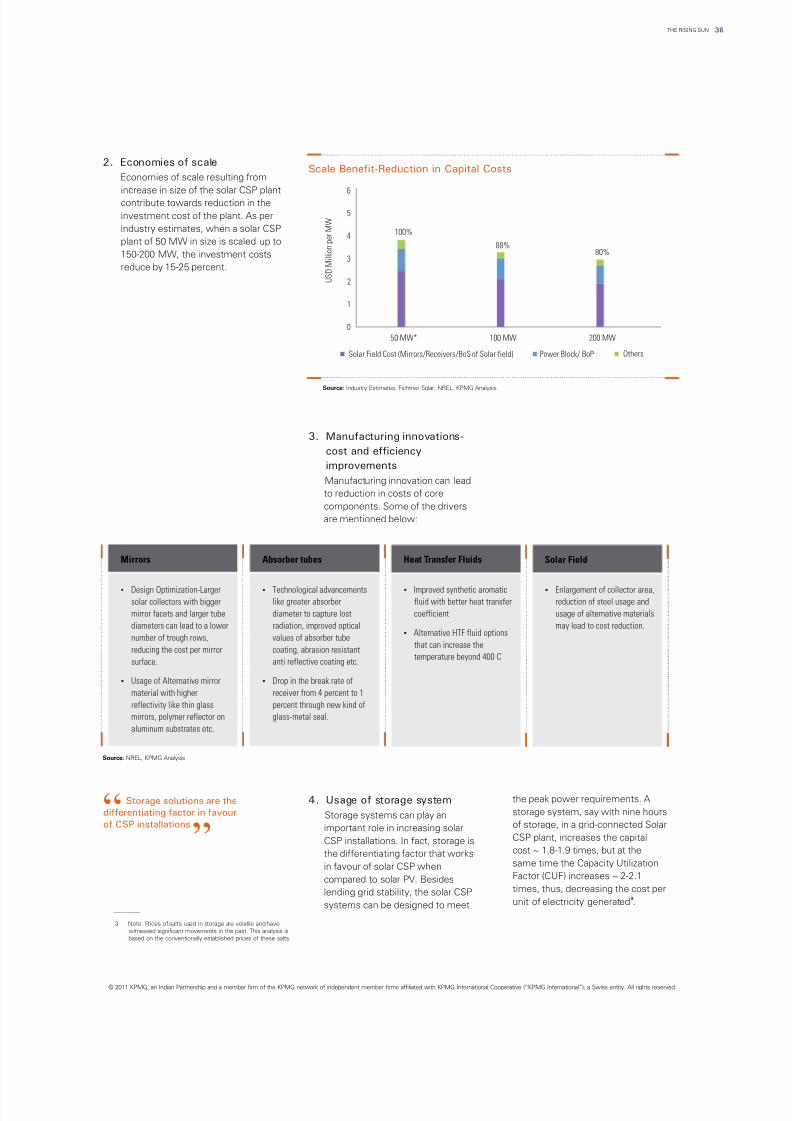
8/3/2019 The Rising Sun Full
http://slidepdf.com/reader/full/the-rising-sun-full 37/96
2. Economies of scale
Economies of scale resulting from
increase in size of the solar CSP plant
contribute towards reduction in the
investment cost of the plant. As per
industry estimates, when a solar CSP
plant of 50 MW in size is scaled up to
150-200 MW, the investment costs
reduce by 15-25 percent.
3. Manufacturing innovations-
cost and efficiency
improvements
Manufacturing innovation can lead
to reduction in costs of core
components. Some of the drivers
are mentioned below:
the peak power requirements. A4. Usage of storage systemstorage system, say with nine hoursStorage systems can play anof storage, in a grid-connected Solarimportant role in increasing solarCSP plant, increases the capitalCSP installations. In fact, storage iscost ~ 1.8-1.9 times, but at thethe differentiating factor that workssame time the Capacity Utilizationin favour of solar CSP whenFactor (CUF) increases ~ 2-2.1compared to solar PV. Besidestimes, thus, decreasing the cost perlending grid stability, the solar CSP
3
unit of electricity generated .systems can be designed to meet
Solar Field Cost (Mirrors/Receivers/BoS of Solar field) Power Block/ BoP Others
U S D M i l l i o n p e r M W
100%
88%80%
0
2
1
4
3
6
5
50 MW* 100 MW 200 MW
Scale Benefit-Reduction in Capital Costs
Source: Industry Estimates, Fichtner Solar, NREL, KPMG Analysis
Source: NREL, KPMG Analysis
?Design Optimization-Largersolar collectors with bigger
mirror facets and larger tube
diameters can lead to a lower
number of trough rows,
reducing the cost per mirror
surface.
?Usage of Alternative mirror
material with higher
reflectivity like thin glass
mirrors, polymer reflector on
aluminum substrates etc.
?Technological advancementslike greater absorber
diameter to capture lost
radiation, improved optical
values of absorber tube
coating, abrasion resistant
anti reflective coating etc.
?Drop in the break rate of
receiver from 4 percent to 1
percent through new kind of
glass-metal seal.
?Improved synthetic aromaticfluid with better heat transfer
coefficient
?Alternative HTF fluid options
that can increase the
temperature beyond 400 C
?Enlargement of collector area,reduction of steel usage and
usage of alternative materials
may lead to cost reduction.
Mirrors Absorber tubes Heat Transfer Fluids Solar Field
36THE RISING SUN
© 2011 KPMG, an Indian Partnership and a member firm of the KPMG network of independent member firms affiliated with KPMG International Cooperative (“KPMG International”), a Swiss entity. All rights reserved.
3. Note: Prices of salts used in storage are volatile and have
witnessed significant movements in the past. This analysis is
based on the conventionally established prices of these salts.
Storage solutions are the
differentiating factor in favour
of CSP installations“
”
8/3/2019 The Rising Sun Full
http://slidepdf.com/reader/full/the-rising-sun-full 38/96
THE RISING SUN42
Grid parity projections
37
© 2011 KPMG, an Indian Partnership and a member firm of the KPMG network of independent member firms affiliated with
KPMG International Cooperative (“KPMG International”), a Swiss entity. All rights reserved.
THE RISING SUN
8/3/2019 The Rising Sun Full
http://slidepdf.com/reader/full/the-rising-sun-full 39/96
05Grid parity projections
38THE RISING SUN
© 2011 KPMG, an Indian Partnership and a member firm of the KPMG network of independent member firms affiliated with KPMG International Cooperative (“KPMG International”), a Swiss entity. All rights reserved.
8/3/2019 The Rising Sun Full
http://slidepdf.com/reader/full/the-rising-sun-full 40/96
1. The landed cost of solar would be INR 0.60 / kWh lesser than
the solar price.
05
Key Questions:?When is the grid parity likely to happen for solar power?
?Which segments of the market are likely to reach grid parity?
The market for Solar will grow various States in the country and
exponentially as costs of generating analyzed the likely cost trends to
solar power inches closer to estimate which states are likely to
conventional power sources. Grid parity reach grid parity earlier.
is said to occur when the landed costFurthermore, the solar power tariffs atof solar power reaches the same levelthe consumer segment would be loweras the cost of conventional power. This
1
once the benefits from CDM are takenphenomenon is state specific as wellinto account. In the long run, it isas end-use application specific. This ispossible that there could be abecause the cost of conventional powermechanism that is different from theis different for different applications. Weprevailing CDM mechanism. However,believe grid parity will happen in stagesthe carbon emission market isfor India. Within States, there isexpected to remain given thesignificant variation between the costsincreasing environment awareness. Inof power at utility input level and at theour calculations, we have factored inresidential level. The cost of power is
the benefit from CDM and havelower in energy resource rich Statesprojected the solar power tariffs at thewhile import dependent States havegrid level and at the users end. Forhigher cost of power. Additionally, costcomputation purposes, this benefit hasof solar power is dependent on level ofbeen quantified to be equivalent to INRsolar radiation in a state. Accordingly,0.60 per unit.we have looked at costs of power for
Grid parityprojections
© 2011 KPMG, an Indian Partnership and a member firm of the KPMG network of independent member firms affiliated with KPMG International Cooperative (“KPMG International”), a Swiss entity. All rights reserved.
THE RISING SUN39
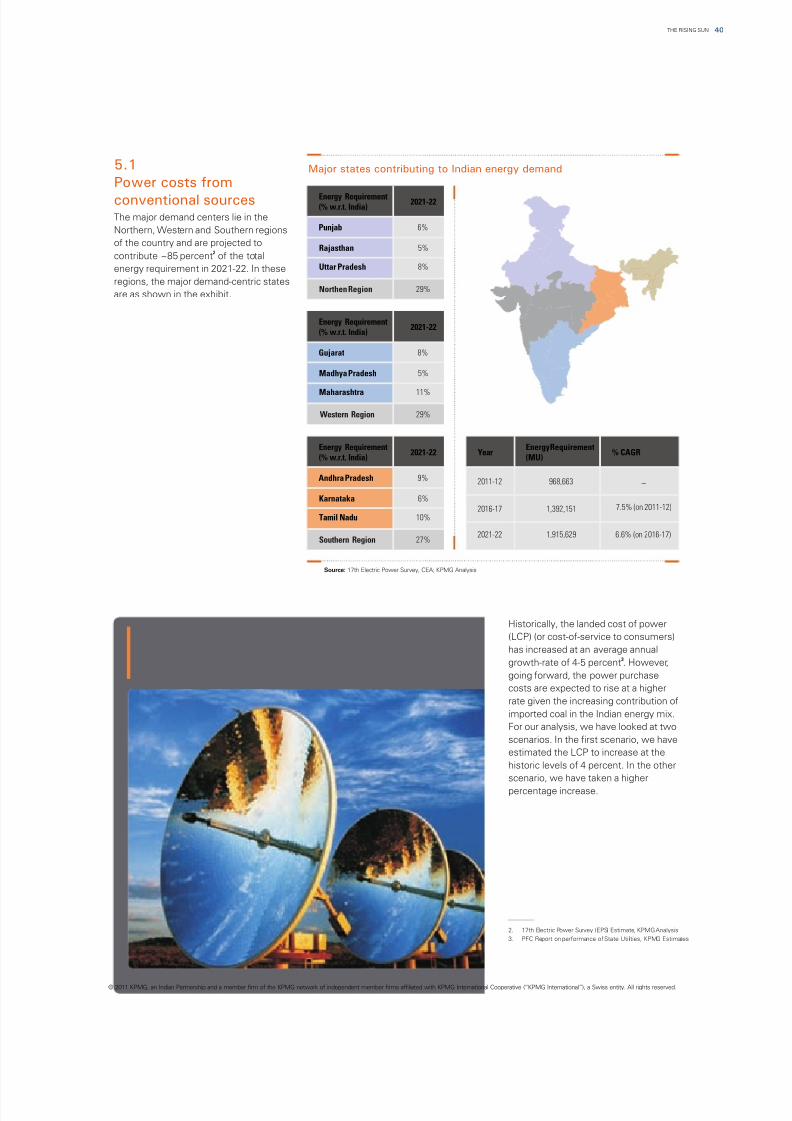
8/3/2019 The Rising Sun Full
http://slidepdf.com/reader/full/the-rising-sun-full 41/96
2. 17th Electric Power Survey (EPS) Estimate, KPMG Analysis
3. PFC Report on performance of State Utilities, KPMG Estimates
5.1
Power costs from
conventional sourcesThe major demand centers lie in the
Northern, Western and Southern regions
of the country and are projected to2
contribute ~85 percent of the total
energy requirement in 2021-22. In these
regions, the major demand-centric states
are as shown in the exhibit.
Major states contributing to Indian energy demand
Energy Requirement(% w.r.t. India)
2021-22
Gujarat 8%
Madhya Pradesh 5%
Maharashtra 11%
Western Region 29%
Energy Requirement(% w.r.t. India)
2021-22
Andhra Pradesh 9%
Karnataka 6%
Tamil Nadu 10%
Southern Region 27%
Energy Requirement(% w.r.t. India)
2021-22
Punjab 6%
Rajasthan 5%
Uttar Pradesh 8%
Northen Region 29%
YearEnergy Requirement(MU)
% CAGR
2011-12 968,663 _
2016-17 1,392,151 7.5% (on 2011-12)
2021-22 1,915,629 6.6% (on 2016-17)
Source: 17th Electric Power Survey, CEA; KPMG Analysis
Historically, the landed cost of power
(LCP) (or cost-of-service to consumers)
has increased at an average annual3
growth-rate of 4-5 percent . However,
going forward, the power purchase
costs are expected to rise at a higher
rate given the increasing contribution of
imported coal in the Indian energy mix.
For our analysis, we have looked at two
scenarios. In the first scenario, we have
estimated the LCP to increase at the
historic levels of 4 percent. In the other
scenario, we have taken a higher
percentage increase.
40THE RISING SUN
© 2011 KPMG, an Indian Partnership and a member firm of the KPMG network of independent member firms affiliated with KPMG International Cooperative (“KPMG International”), a Swiss entity. All rights reserved.
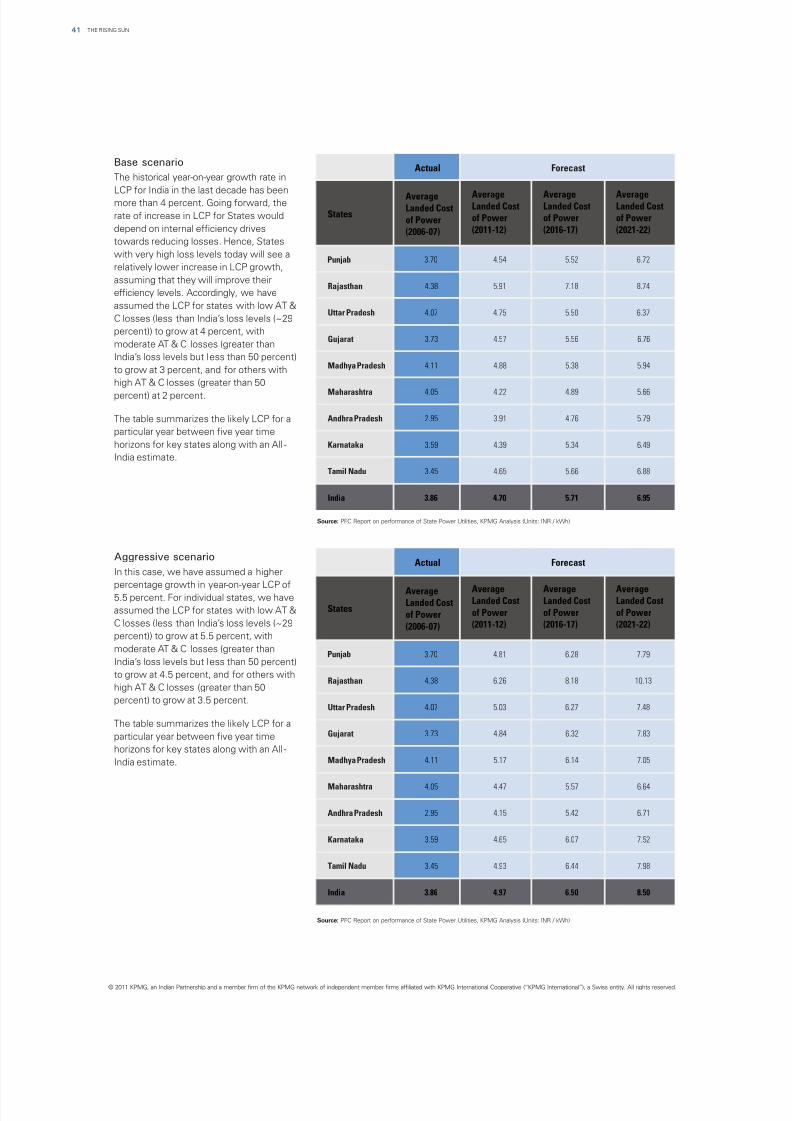
8/3/2019 The Rising Sun Full
http://slidepdf.com/reader/full/the-rising-sun-full 42/96
THE RISING SUN41
Base scenario
The historical year-on-year growth rate in
LCP for India in the last decade has been
more than 4 percent. Going forward, the
rate of increase in LCP for States would
depend on internal efficiency drives
towards reducing losses. Hence, States
with very high loss levels today will see a
relatively lower increase in LCP growth,
assuming that they will improve their
efficiency levels. Accordingly, we have
assumed the LCP for states with low AT &
C losses (less than India’s loss levels (~29
percent)) to grow at 4 percent, with
moderate AT & C losses (greater than
India’s loss levels but less than 50 percent)
to grow at 3 percent, and for others with
high AT & C losses (greater than 50
percent) at 2 percent.
The table summarizes the likely LCP for a
particular year between five year time
horizons for key states along with an All -
India estimate.
Aggressive scenario
In this case, we have assumed a higher
percentage growth in year-on-year LCP of5.5 percent. For individual states, we have
assumed the LCP for states with low AT &
C losses (less than India’s loss levels (~29
percent)) to grow at 5.5 percent, with
moderate AT & C losses (greater than
India’s loss levels but less than 50 percent)
to grow at 4.5 percent, and for others with
high AT & C losses (greater than 50
percent) to grow at 3.5 percent.
The table summarizes the likely LCP for a
particular year between five year time
horizons for key states along with an All -
India estimate.
Actual Forecast
States
AverageLanded Cost
of Power(2006-07)
AverageLanded Costof Power
(2011-12)
AverageLanded Costof Power
(2016-17)
AverageLanded Costof Power
(2021-22)
Punjab 3.70 4.54 5.52 6.72
Rajasthan 4.38 5.91 7.18 8.74
Uttar Pradesh 4.07 4.75 5.50 6.37
Gujarat 3.73 4.57 5.56 6.76
Madhya Pradesh 4.11 4.88 5.38 5.94
Maharashtra 4.05 4.22 4.89 5.66
Andhra Pradesh 2.95 3.91 4.76 5.79
Karnataka 3.59 4.39 5.34 6.49
Tamil Nadu 3.45 4.65 5.66 6.88
India 3.86 4.70 5.71 6.95
Actual Forecast
States
AverageLanded Cost
of Power
(2006-07)
AverageLanded Cost
of Power(2011-12)
AverageLanded Cost
of Power(2016-17)
AverageLanded Cost
of Power(2021-22)
Punjab 3.70 4.81 6.28 7.79
Rajasthan 4.38 6.26 8.18 10.13
Uttar Pradesh 4.07 5.03 6.27 7.48
Gujarat 3.73 4.84 6.32 7.83
Madhya Pradesh 4.11 5.17 6.14 7.05
Maharashtra 4.05 4.47 5.57 6.64
Andhra Pradesh 2.95 4.15 5.42 6.71
Karnataka 3.59 4.65 6.07 7.52
Tamil Nadu 3.45 4.93 6.44 7.98
India 3.86 4.97 6.50 8.50
Source: PFC Report on performance of State Power Utilities, KPMG Analysis (Units: INR / kWh)
Source: PFC Report on performance of State Power Utilities, KPMG Analysis (Units: INR / kWh)
© 2011 KPMG, an Indian Partnership and a member firm of the KPMG network of independent member firms affiliated with KPMG International Cooperative (“KPMG International”), a Swiss entity. All rights reserved.
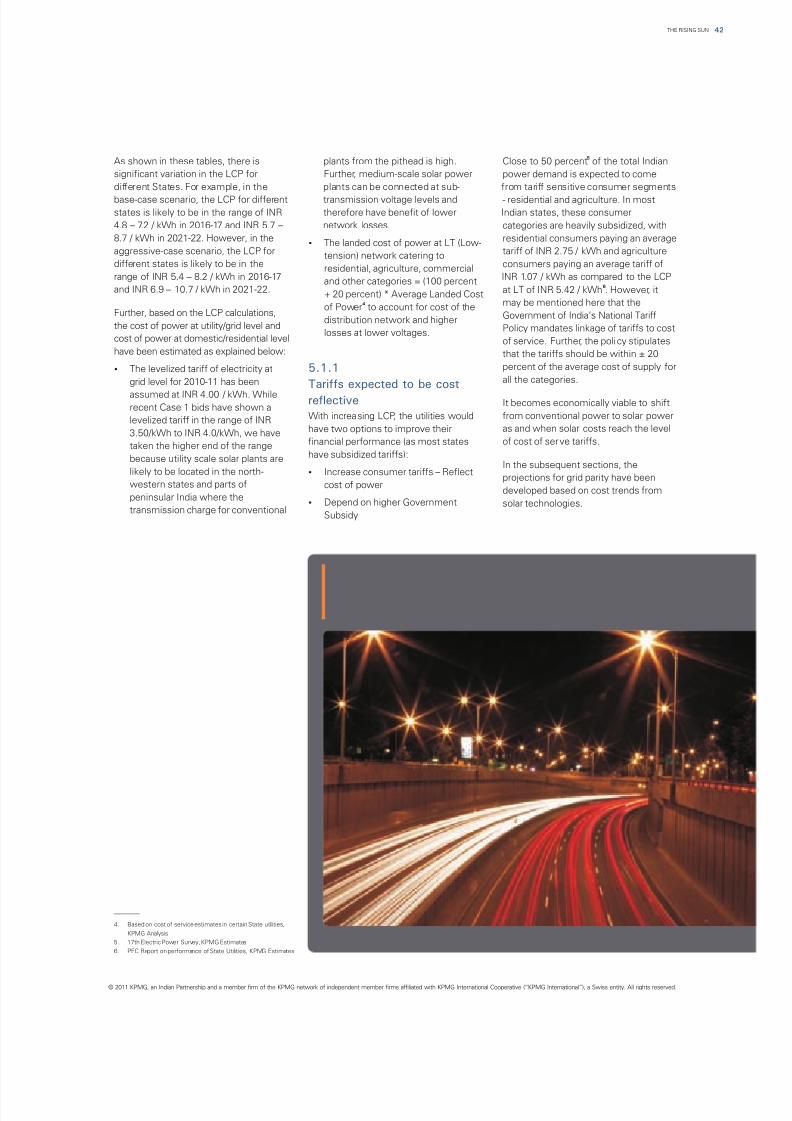
8/3/2019 The Rising Sun Full
http://slidepdf.com/reader/full/the-rising-sun-full 43/96
5
As shown in these tables, there is plants from the pithead is high. Close to 50 percent of the total Indian
significant variation in the LCP for Further, medium-scale solar power power demand is expected to come
different States. For example, in the plants can be connected at sub- from tariff sensitive consumer segments
base-case scenario, the LCP for different transmission voltage levels and - residential and agriculture. In most
states is likely to be in the range of INR therefore have benefit of lower Indian states, these consumer
4.8 – 7.2 / kWh in 2016-17 and INR 5.7 – network losses. categories are heavily subsidized, with
8.7 / kWh in 2021-22. However, in the residential consumers paying an average?The landed cost of power at LT (Low-
aggressive-case scenario, the LCP for tariff of INR 2.75 / kWh and agriculturetension) network catering to
different states is likely to be in the consumers paying an average tariff ofresidential, agriculture, commercial
range of INR 5.4 – 8.2 / kWh in 2016-17 INR 1.07 / kWh as compared to the LCPand other categories = (100 percent
6
and INR 6.9 – 10.7 / kWh in 2021-22. at LT of INR 5.42 / kWh . However, it+ 20 percent) * Average Landed Cost4 may be mentioned here that the
of Power to account for cost of theFurther, based on the LCP calculations, Government of India’s National Tariff
distribution network and higherthe cost of power at utility/grid level and Policy mandates linkage of tariffs to cost
losses at lower voltages.cost of power at domestic/residential level of service. Further, the policy stipulateshave been estimated as explained below: that the tariffs should be within ± 20
percent of the average cost of supply for?The levelized tariff of electricity atall the categories.grid level for 2010-11 has been
assumed at INR 4.00 / kWh. WhileIt becomes economically viable to shift
recent Case 1 bids have shown aWith increasing LCP, the utilities would from conventional power to solar powerlevelized tariff in the range of INRhave two options to improve their as and when solar costs reach the level
3.50/kWh to INR 4.0/kWh, we havefinancial performance (as most states of cost of serve tariffs.taken the higher end of the rangehave subsidized tariffs):because utility scale solar plants are
In the subsequent sections, thelikely to be located in the north- ?Increase consumer tariffs – Reflect
projections for grid parity have beenwestern states and parts of cost of power
developed based on cost trends frompeninsular India where the
?Depend on higher Government solar technologies.transmission charge for conventional
Subsidy
5.1.1
Tariffs expected to be cost
reflective
4. Based on cost of service estimates in certain State utilities,
KPMG Analysis
5. 17th Electric Power Survey, KPMG Estimates
6. PFC Report on performance of State Utilities, KPMG Estimates
42THE RISING SUN
© 2011 KPMG, an Indian Partnership and a member firm of the KPMG network of independent member firms affiliated with KPMG International Cooperative (“KPMG International”), a Swiss entity. All rights reserved.
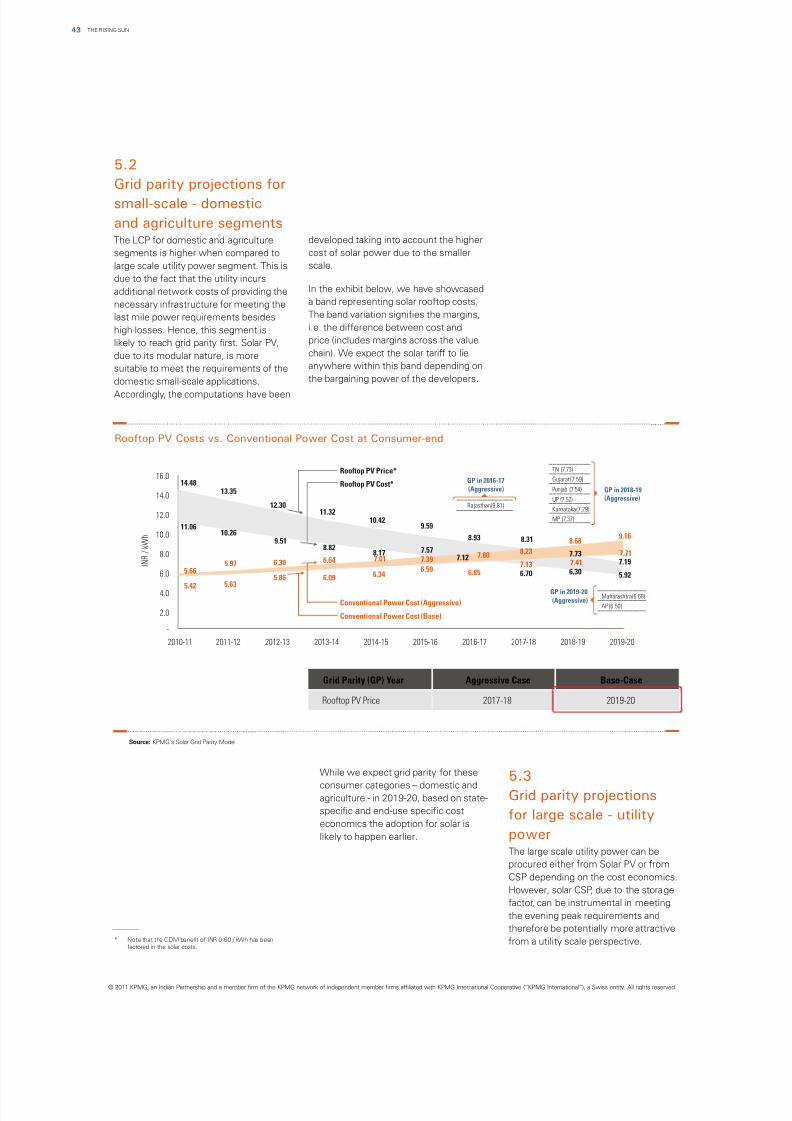
8/3/2019 The Rising Sun Full
http://slidepdf.com/reader/full/the-rising-sun-full 44/96
THE RISING SUN43
5.2
Grid parity projections for
small-scale - domestic
and agriculture segmentsThe LCP for domestic and agriculture developed taking into account the higher
segments is higher when compared to cost of solar power due to the smaller
large scale utility power segment. This is scale.
due to the fact that the utility incursIn the exhibit below, we have showcasedadditional network costs of providing thea band representing solar rooftop costs.necessary infrastructure for meeting theThe band variation signifies the margins,last mile power requirements besidesi.e. the difference between cost andhigh losses. Hence, this segment isprice (includes margins across the valuelikely to reach grid parity first. Solar PV,chain). We expect the solar tariff to liedue to its modular nature, is moreanywhere within this band depending onsuitable to meet the requirements of thethe bargaining power of the developers.domestic small-scale applications.
Accordingly, the computations have been
While we expect grid parity for these
consumer categories – domestic andagriculture - in 2019-20, based on state-
specific and end-use specific cost
economics the adoption for solar is
likely to happen earlier.
The large scale utility power can be
procured either from Solar PV or from
CSP depending on the cost economics.
However, solar CSP, due to the storage
factor, can be instrumental in meeting
the evening peak requirements and
therefore be potentially more attractive
from a utility scale perspective.
5.3
Grid parity projections
for large scale - utility
power
© 2011 KPMG, an Indian Partnership and a member firm of the KPMG network of independent member firms affiliated with KPMG International Cooperative (“KPMG International”), a Swiss entity. All rights reserved.
GP in 2016-17
(Aggressive) GP in 2018-19(Aggressive)
Karnataka (7.29)
MP (7.37)
Punjab (7.54)
TN (7.73)
Gujarat (7.59)
UP (7.52)Rajasthan (9.81)
GP in 2019-20(Aggressive)
Maharashtra (6.68)
AP (6.50)
Conventional Power Cost (Base)
Rooftop PV Cost*
Rooftop PV Price*
Conventional Power Cost (Aggressive)
-
2.0
4.0
6.0
8.0
10.0
12.0
14.0
16.0
I N R / k W h
2010-11 2011-12 2012-13 2013-14 2014-15 2015-16 2016-17 2017-18 2018-19 2019-20
5.66
7.808.23
5.42
7.13
8.31
6.85
8.93
14.48
11.06
7.01
6.34
10.42
8.176.64
6.09
11.32
8.82
6.30
5.86
12.30
9.51
5.97
5.63
13.35
10.26
7.39
6.59
9.59
7.577.12
6.70
8.68
7.417.73
6.30
9.16
7.717.19
5.92
Source: KPMG’s Solar Grid Parity Model
Rooftop PV Costs vs. Conventional Power Cost at Consumer-end
Grid Parity (GP) Year Aggressive Case Base-Case
Rooftop PV Price 2017-18 2019-20
* Note that the CDM benefit of INR 0.60 / kWh has beenfactored in the solar costs.
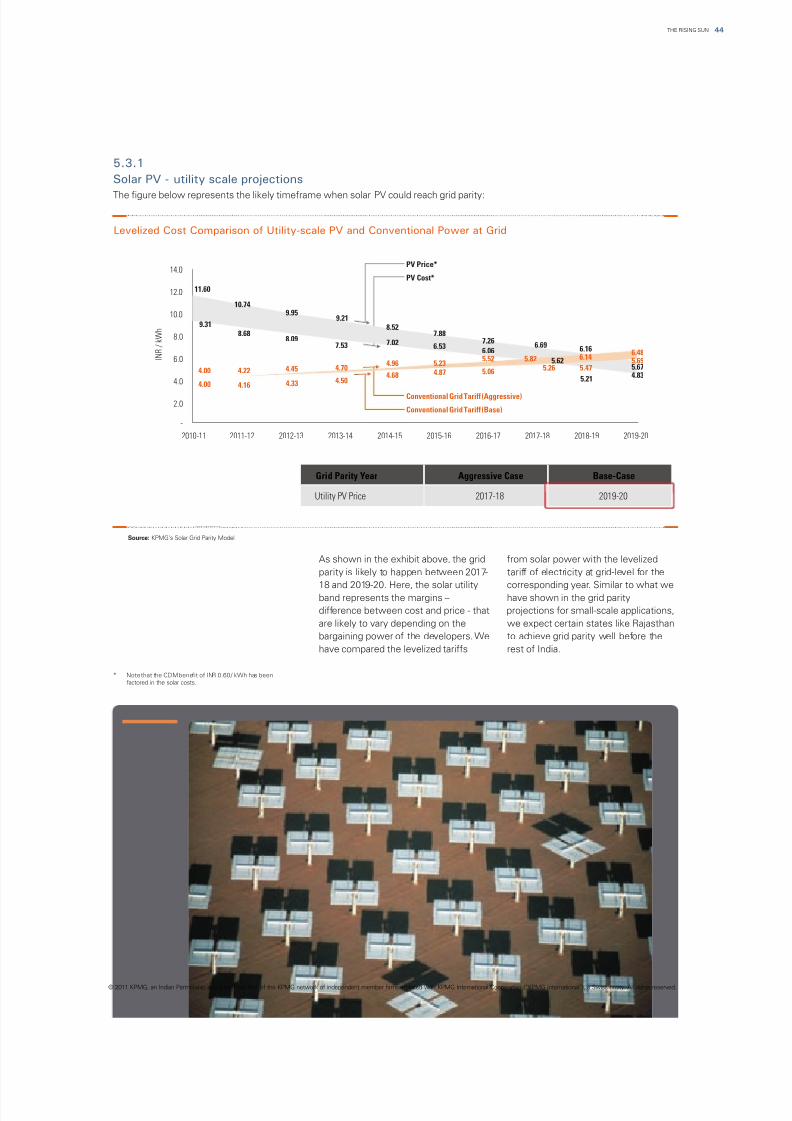
8/3/2019 The Rising Sun Full
http://slidepdf.com/reader/full/the-rising-sun-full 45/96
Grid Parity Year Aggressive Case Base-Case
Utility PV Price 2017-18 2019-20
Source: KPMG’s Solar Grid Parity Model
Levelized Cost Comparison of Utility-scale PV and Conventional Power at Grid
As shown in the exhibit above, the grid from solar power with the levelized
parity is likely to happen between 2017- tariff of electricity at grid-level for the
18 and 2019-20. Here, the solar utility corresponding year. Similar to what weband represents the margins – have shown in the grid parity
difference between cost and price - that projections for small-scale applications,
are likely to vary depending on the we expect certain states like Rajasthan
bargaining power of the developers. We to achieve grid parity well before the
have compared the levelized tariffs rest of India.
5.3.1
Solar PV - utility scale projections
The figure below represents the likely timeframe when solar PV could reach grid parity:
44THE RISING SUN
© 2011 KPMG, an Indian Partnership and a member firm of the KPMG network of independent member firms affiliated with KPMG International Cooperative (“KPMG International”), a Swiss entity. All rights reserved.
-
2.0
4.0
6.0
8.0
10.0
12.0
14.0
I N R / k W h
2010-11 2011-12 2012-13 2013-14 2014-15 2015-16 2016-17 2017-18 2018-19 2019-20
Conventional Grid Tariff (Base)
PV Cost*
PV Price*
Conventional Grid Tariff (Aggressive)
5.67
6.166.69
7.267.88
8.52
11.60
9.31
7.02 6.536.06
5.62
5.21 4.834.00
4.96 5.235.52 5.82 6.14
6.48
4.00
10.74
8.68
4.22
4.16
9.95
8.09
4.45
4.33
9.21
7.53
4.70
4.504.68 4.87 5.06 5.26 5.47
5.69
* Note that the CDM benefit of INR 0.60 / kWh has been
factored in the solar costs.
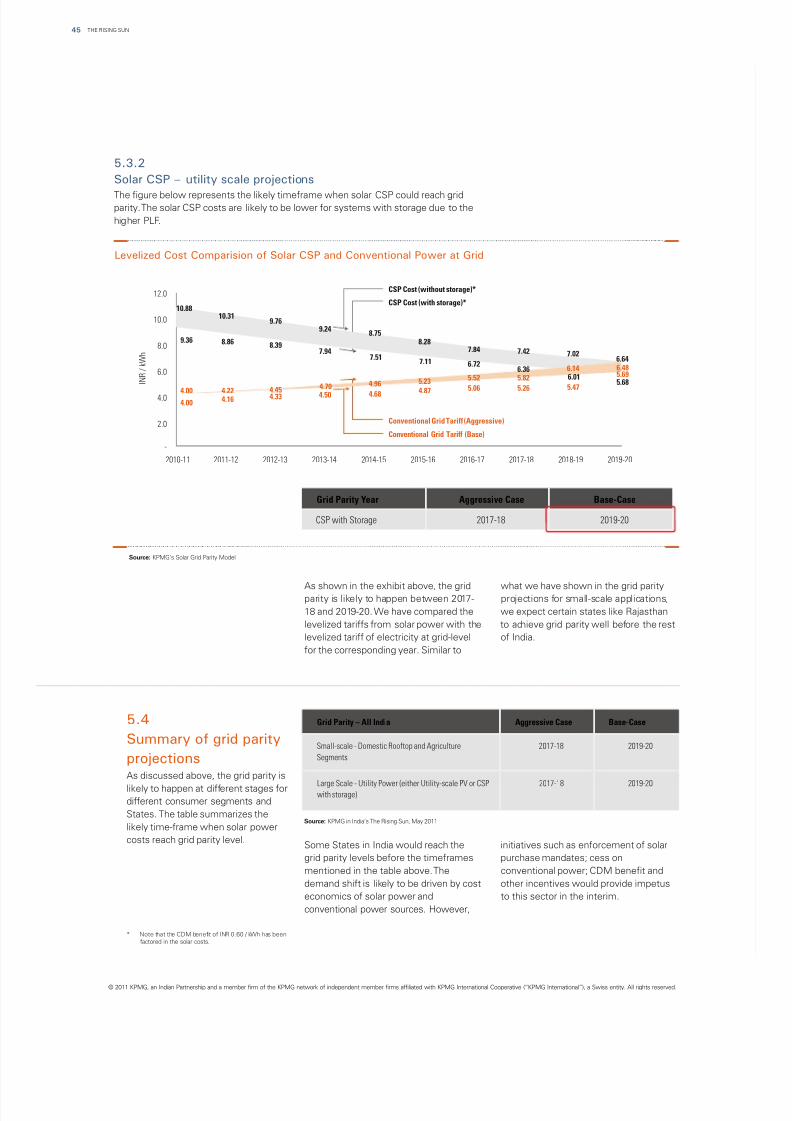
8/3/2019 The Rising Sun Full
http://slidepdf.com/reader/full/the-rising-sun-full 46/96
THE RISING SUN45
Source: KPMG in India’s The Rising Sun, May 2011
5.3.2
Solar CSP – utility scale projections
The figure below represents the likely timeframe when solar CSP could reach gridparity. The solar CSP costs are likely to be lower for systems with storage due to the
higher PLF.
As shown in the exhibit above, the grid what we have shown in the grid parityparity is likely to happen between 2017- projections for small-scale applications,
18 and 2019-20. We have compared the we expect certain states like Rajasthan
levelized tariffs from solar power with the to achieve grid parity well before the rest
levelized tariff of electricity at grid-level of India.
for the corresponding year. Similar to
Some States in India would reach the initiatives such as enforcement of solar
grid parity levels before the timeframes purchase mandates; cess on
mentioned in the table above. The conventional power; CDM benefit and
demand shift is likely to be driven by cost other incentives would provide impetus
economics of solar power and to this sector in the interim.
conventional power sources. However,
5.4
Summary of grid parity
projectionsAs discussed above, the grid parity is
likely to happen at different stages for
different consumer segments and
States. The table summarizes the
likely time-frame when solar power
costs reach grid parity level.
Grid Parity – All India Aggressive Case Base-Case
Small-scale - Domestic Rooftop and Agriculture
Segments
2017-18 2019-20
Large Scale - Utility Power (either Utility-scale PV or CSPwith storage)
2017-18 2019-20
© 2011 KPMG, an Indian Partnership and a member firm of the KPMG network of independent member firms affiliated with KPMG International Cooperative (“KPMG International”), a Swiss entity. All rights reserved.
Grid Parity Year Aggressive Case Base-Case
CSP with Storage 2017-18 2019-20
Source: KPMG’s Solar Grid Parity Model
Levelized Cost Comparision of Solar CSP and Conventional Power at Grid
-
2.0
4.0
6.0
8.0
10.0
12.0
I N R / k W h
2010-11 2011-12 2012-13 2013-14 2014-15 2015-16 2016-17 2017-18 2018-19 2019-20
CSP Cost (without storage)*
CSP Cost (with storage)*
Conventional Grid Tariff (Base)
Conventional Grid Tariff (Aggressive)
10.88
9.36
4.00
8.75
7.51
4.96
4.68
9.24
7.94
4.70
4.50
9.76
8.39
4.454.33
10.31
8.86
4.224.164.00
6.64
5.68
6.485.69
7.02
6.016.14
5.47
7.42
6.365.82
5.26
7.84
6.72
5.52
5.06
8.28
7.11
5.23
4.87
* Note that the CDM benefit of INR 0.60 / kWh has been
factored in the solar costs.
8/3/2019 The Rising Sun Full
http://slidepdf.com/reader/full/the-rising-sun-full 47/96
46THE RISING SUN
© 2011 KPMG, an Indian Partnership and a member firm of the KPMG network of independent member firms affiliated with KPMG International Cooperative (“KPMG International”), a Swiss entity. All rights reserved.
8/3/2019 The Rising Sun Full
http://slidepdf.com/reader/full/the-rising-sun-full 48/96
Solar grid-connected
power market in India
© 2011 KPMG, an Indian Partnership and a member firm of the KPMG network of independent member firms affiliated with
KPMG International Cooperative (“KPMG International”), a Swiss entity. All rights reserved.
THE RISING SUN47
8/3/2019 The Rising Sun Full
http://slidepdf.com/reader/full/the-rising-sun-full 49/96
06Solar grid-connected
power market in India
© 2011 KPMG, an Indian Partnership and a member firm of the KPMG network of independent member firms affiliated with KPMG International Cooperative (“KPMG International”), a Swiss entity. All rights reserved.
48THE RISING SUN
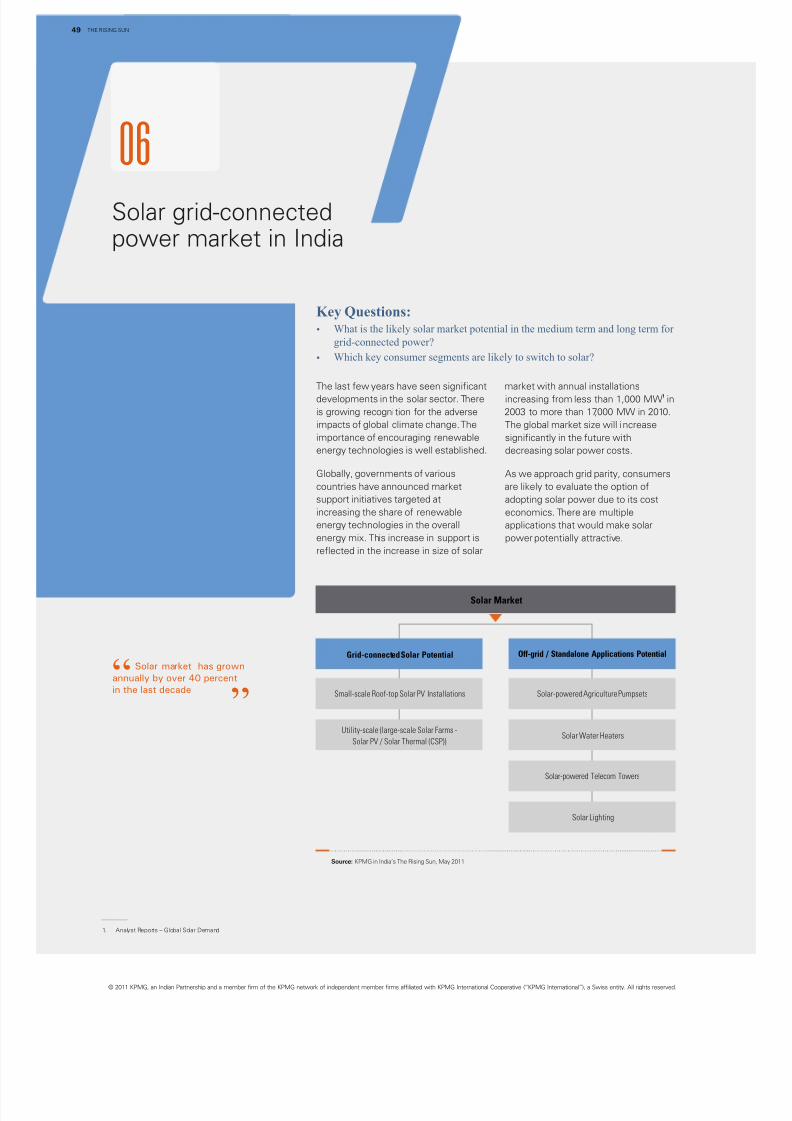
8/3/2019 The Rising Sun Full
http://slidepdf.com/reader/full/the-rising-sun-full 50/96
Key Questions:?What is the likely solar market potential in the medium term and long term for
grid-connected power?
?Which key consumer segments are likely to switch to solar?
The last few years have seen significant market with annual installations1
developments in the solar sector. There increasing from less than 1,000 MW in
is growing recognition for the adverse 2003 to more than 17,000 MW in 2010.
impacts of global climate change. The The global market size will increase
importance of encouraging renewable significantly in the future with
energy technologies is well established. decreasing solar power costs.
Globally, governments of various As we approach grid parity, consumers
countries have announced market are likely to evaluate the option of
support initiatives targeted at adopting solar power due to its cost
increasing the share of renewable economics. There are multiple
energy technologies in the overall applications that would make solar
energy mix. This increase in support is power potentially attractive.
reflected in the increase in size of solar
1. Analyst Reports – Global Solar Demand
06
Solar grid-connectedpower market in India
Solar Market
Grid-connected Solar Potential Off-grid / Standalone Applications Potential
Solar-powered Agriculture PumpsetsSmall-scale Roof-top Solar PV Installations
Utility-scale (large-scale Solar Farms -
Solar PV / Solar Thermal (CSP))Solar Water Heaters
Solar-powered Telecom Towers
Solar Lighting
© 2011 KPMG, an Indian Partnership and a member firm of the KPMG network of independent member firms affiliated with KPMG International Cooperative (“KPMG International”), a Swiss entity. All rights reserved.
THE RISING SUN49
Source: KPMG in India’s The Rising Sun, May 2011
Solar market has grown
annually by over 40 percent
in the last decade“
”
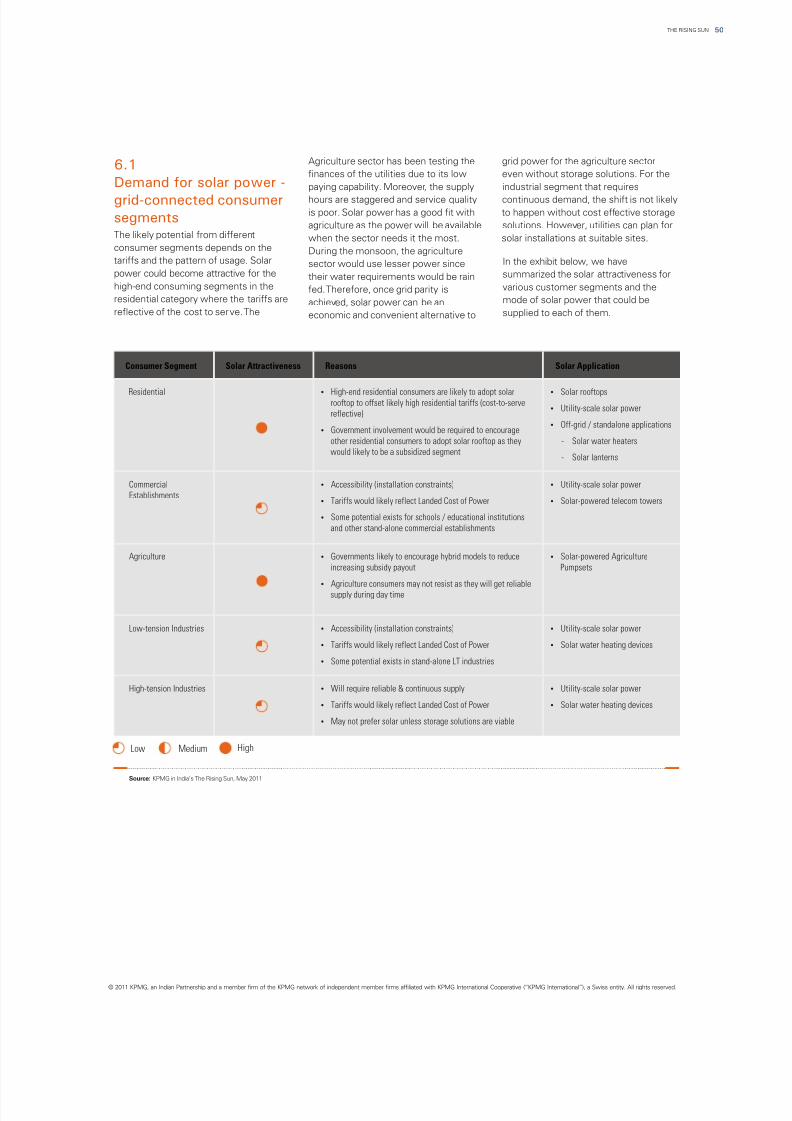
8/3/2019 The Rising Sun Full
http://slidepdf.com/reader/full/the-rising-sun-full 51/96
© 2011 KPMG, an Indian Partnership and a member firm of the KPMG network of independent member firms affiliated with KPMG International Cooperative (“KPMG International”), a Swiss entity. All rights reserved.
6.1
Demand for solar power -
grid-connected consumersegments
Agriculture sector has been testing the grid power for the agriculture sector
finances of the utilities due to its low even without storage solutions. For the
paying capability. Moreover, the supply industrial segment that requires
hours are staggered and service quality continuous demand, the shift is not likely
is poor. Solar power has a good fit with to happen without cost effective storage
agriculture as the power will be available solutions. However, utilities can plan forThe likely potential from different when the sector needs it the most. solar installations at suitable sites.consumer segments depends on the During the monsoon, the agriculturetariffs and the pattern of usage. Solar In the exhibit below, we havesector would use lesser power sincepower could become attractive for the summarized the solar attractiveness fortheir water requirements would be rainhigh-end consuming segments in the various customer segments and thefed. Therefore, once grid parity isresidential category where the tariffs are mode of solar power that could beachieved, solar power can be anreflective of the cost to serve. The supplied to each of them.economic and convenient alternative to
Consumer Segment Solar Attractiveness Reasons Solar Application
Residential ?High-end residential consumers are likely to adopt solarrooftop to offset likely high residential tariffs (cost-to-serve
reflective)
?Government involvement would be required to encourage
other residential consumers to adopt solar rooftop as they
would likely to be a subsidized segment
?Solar rooftops
?Utility-scale solar power
?Off-grid / standalone applications
- Solar water heaters
- Solar lanterns
Commercial
Establishments
?Accessibility (installation constraints)
?Tariffs would likely reflect Landed Cost of Power
?Some potential exists for schools / educational institutions
and other stand-alone commercial establishments
?Utility-scale solar power
?Solar-powered telecom towers
Agriculture ?Governments likely to encourage hybrid models to reduce
increasing subsidy payout
?Agriculture consumers may not resist as they will get reliable
supply during day time
?Solar-powered Agriculture
Pumpsets
Low-tension Industries ?Accessibility (installation constraints)
?Tariffs would likely reflect Landed Cost of Power
?Some potential exists in stand-alone LT industries
?Utility-scale solar power
?Solar water heating devices
High-tension Industries ?Will require reliable & continuous supply
?Tariffs would likely reflect Landed Cost of Power
?May not prefer solar unless storage solutions are viable
?Utility-scale solar power
?Solar water heating devices
Low Medium High
50THE RISING SUN
Source: KPMG in India’s The Rising Sun, May 2011
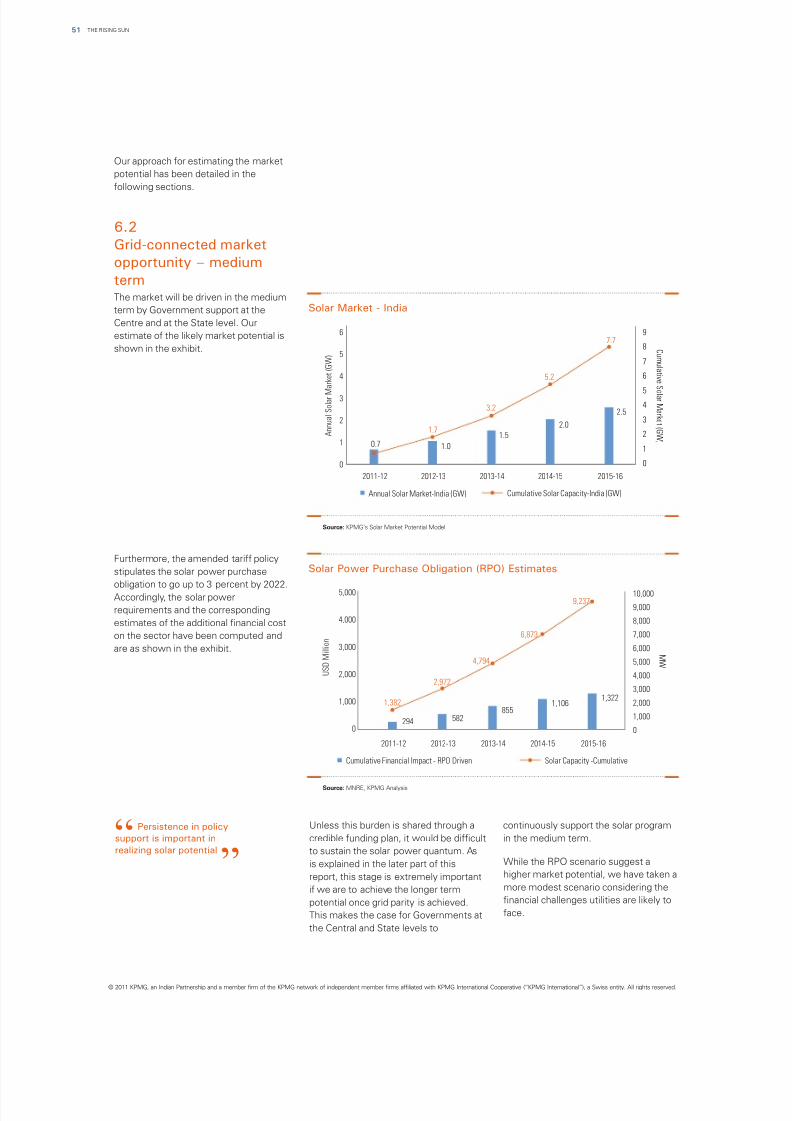
8/3/2019 The Rising Sun Full
http://slidepdf.com/reader/full/the-rising-sun-full 52/96
Our approach for estimating the market
potential has been detailed in the
following sections.
The market will be driven in the medium
term by Government support at the
Centre and at the State level. Our
estimate of the likely market potential is
shown in the exhibit.
Furthermore, the amended tariff policy
stipulates the solar power purchase
obligation to go up to 3 percent by 2022.Accordingly, the solar power
requirements and the corresponding
estimates of the additional financial cost
on the sector have been computed and
are as shown in the exhibit.
6.2
Grid-connected market
opportunity – medium
term
Unless this burden is shared through a continuously support the solar program
credible funding plan, it would be difficult in the medium term.
to sustain the solar power quantum. AsWhile the RPO scenario suggest ais explained in the later part of thishigher market potential, we have taken areport, this stage is extremely importantmore modest scenario considering theif we are to achieve the longer termfinancial challenges utilities are likely topotential once grid parity is achieved.face.This makes the case for Governments at
the Central and State levels to
© 2011 KPMG, an Indian Partnership and a member firm of the KPMG network of independent member firms affiliated with KPMG International Cooperative (“KPMG International”), a Swiss entity. All rights reserved.
2.5
7.7
2015-16
0
1
2
3
45
6
7
8
9
0.7 1.0
1.5
2.01.7
3.2
5.2
6
5
4
3
2
1
0
2011-12
C u m u l a t i v e S o l a r M a r k e t ( G W )
A n n u a
l S o
l a r M
a r k e t
( G W )
2012-13 2013-14 2014-15
Annual Solar Market-India (GW) Cumulative Solar Capacity-India (GW)
Solar Market - India
Source: KPMG’s Solar Market Potential Model
THE RISING SUN51
Solar Power Purchase Obligation (RPO) Estimates
Source: MNRE, KPMG Analysis
2015-162011-12
MW
U S D M i l l i o n
2012-13 2013-14 2014-15
582855
1,1061,322
2,972
4,794
6,873
9,237
1,000
00
2,000
3,000
4,000
5,000
6,000
7,000
8,000
9,000
10,000
Cumulative Financial Impact - RPO Driven Solar Capacity -Cumulative
294
1,3821,000
2,000
4,000
5,000
3,000
Persistence in policy
support is important in
realizing solar potential“
”
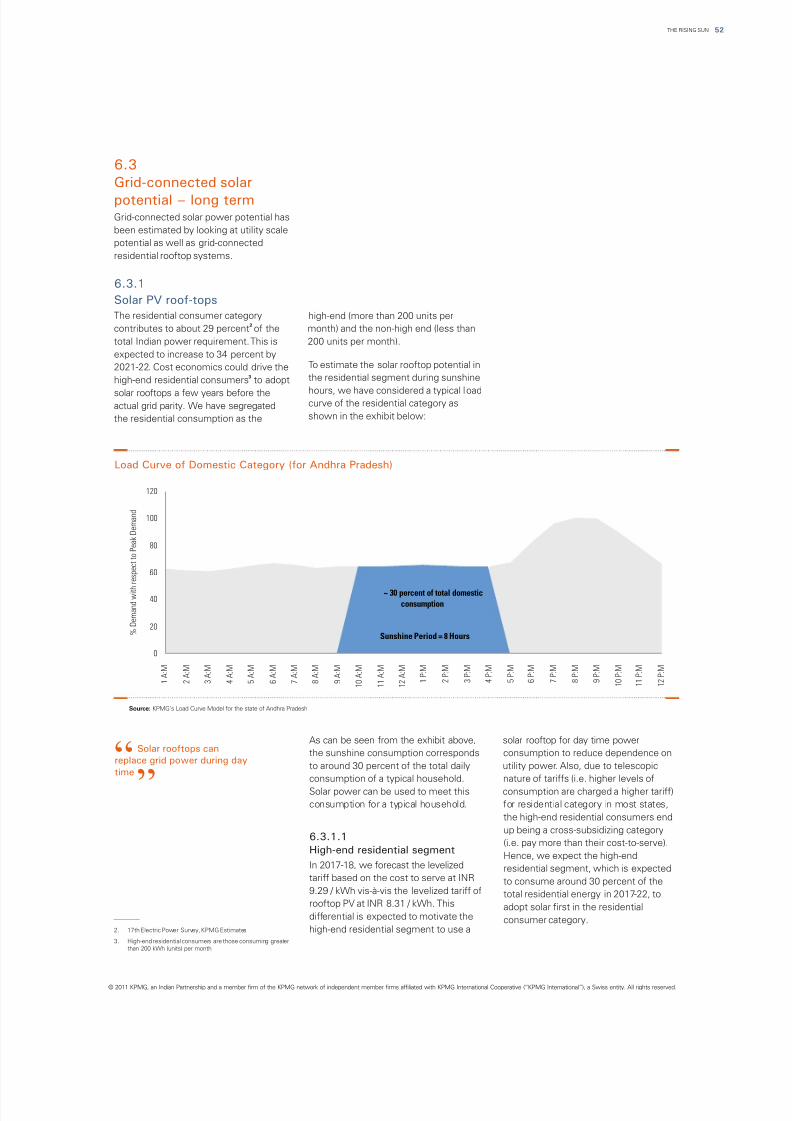
8/3/2019 The Rising Sun Full
http://slidepdf.com/reader/full/the-rising-sun-full 53/96
© 2011 KPMG, an Indian Partnership and a member firm of the KPMG network of independent member firms affiliated with KPMG International Cooperative (“KPMG International”), a Swiss entity. All rights reserved.
0
20
40
60
80
100
120
1 A : M
2 A : M
3 A : M
4 A : M
5 A : M
6 A : M
7 A : M
8 A : M
9 A : M
1 0 A : M
1 1 A : M
1 2 A : M
1 P : M
2 P : M
3 P : M
4 P : M
5 P : M
6 P : M
7 P : M
8 P : M
9 P : M
1 0 P : M
1 1 P : M
1 2 P : M
% D e m a n
d w i t h
r e s p e c t t o
P e a
k D e m a n
d
Sunshine Period = 8 Hours
~ 30 percent of total domestic
consumption
Load Curve of Domestic Category (for Andhra Pradesh)
6.3
Grid-connected solar
potential – long termGrid-connected solar power potential has
been estimated by looking at utility scale
potential as well as grid-connected
residential rooftop systems.
The residential consumer category high-end (more than 200 units per2
contributes to about 29 percent of the month) and the non-high end (less than
total Indian power requirement. This is 200 units per month).
expected to increase to 34 percent byTo estimate the solar rooftop potential in2021-22. Cost economics could drive the
3 the residential segment during sunshinehigh-end residential consumers to adopt
hours, we have considered a typical loadsolar rooftops a few years before thecurve of the residential category asactual grid parity. We have segregatedshown in the exhibit below:the residential consumption as the
6.3.1
Solar PV roof-tops
As can be seen from the exhibit above, solar rooftop for day time power
the sunshine consumption corresponds consumption to reduce dependence on
to around 30 percent of the total daily utility power. Also, due to telescopic
consumption of a typical household. nature of tariffs (i.e. higher levels of
Solar power can be used to meet this consumption are charged a higher tariff)
consumption for a typical household. for residential category in most states,
the high-end residential consumers end
up being a cross-subsidizing category6.3.1.1
(i.e. pay more than their cost-to-serve).High-end residential segment
Hence, we expect the high-endIn 2017-18, we forecast the levelized residential segment, which is expectedtariff based on the cost to serve at INR to consume around 30 percent of the9.29 / kWh vis-à-vis the levelized tariff of total residential energy in 2017-22, torooftop PV at INR 8.31 / kWh. This adopt solar first in the residentialdifferential is expected to motivate the consumer category.high-end residential segment to use a
Source: KPMG’s Load Curve Model for the state of Andhra Pradesh
2. 17th Electric Power Survey, KPMG Estimates
3. High-end residential consumers are those consuming greater
than 200 kWh (units) per month
52THE RISING SUN
Solar rooftops can
replace grid power during day
time“
”
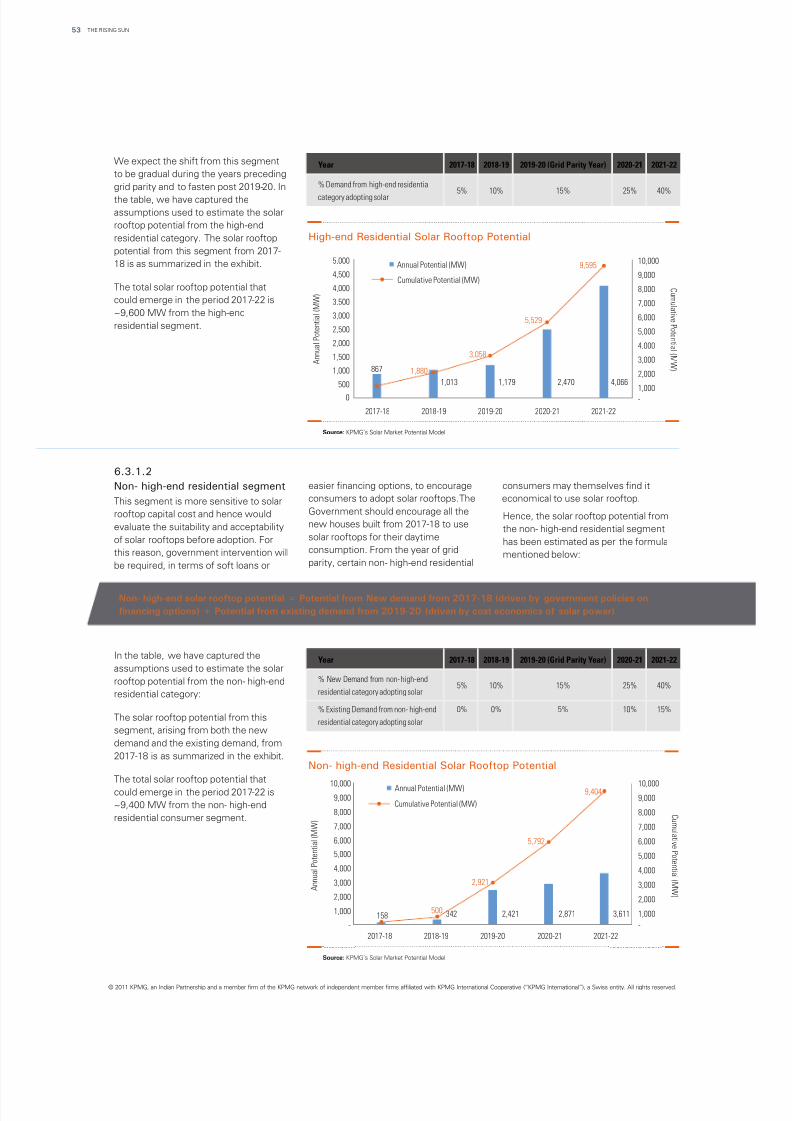
8/3/2019 The Rising Sun Full
http://slidepdf.com/reader/full/the-rising-sun-full 54/96
We expect the shift from this segment
to be gradual during the years preceding
grid parity and to fasten post 2019-20. In
the table, we have captured the
assumptions used to estimate the solar
rooftop potential from the high-end
residential category. The solar rooftop
potential from this segment from 2017-
18 is as summarized in the exhibit.
The total solar rooftop potential that
could emerge in the period 2017-22 is
~9,600 MW from the high-end
residential segment.
In the table, we have captured the
assumptions used to estimate the solar
rooftop potential from the non- high-end
residential category:
The solar rooftop potential from this
segment, arising from both the new
demand and the existing demand, from
2017-18 is as summarized in the exhibit.
The total solar rooftop potential that
could emerge in the period 2017-22 is
~9,400 MW from the non- high-end
residential consumer segment.
Non- high-end solar rooftop potential = Potential from New demand from 2017-18 (driven by government policies on
financing options) + Potential from existing demand from 2019-20 (driven by cost economics of solar power)
© 2011 KPMG, an Indian Partnership and a member firm of the KPMG network of independent member firms affiliated with KPMG International Cooperative (“KPMG International”), a Swiss entity. All rights reserved.
6.3.1.2
easier financing options, to encourage consumers may themselves find itNon- high-end residential segmentconsumers to adopt solar rooftops. The economical to use solar rooftop.This segment is more sensitive to solarGovernment should encourage all therooftop capital cost and hence would Hence, the solar rooftop potential fromnew houses built from 2017-18 to useevaluate the suitability and acceptability the non- high-end residential segmentsolar rooftops for their daytimeof solar rooftops before adoption. For has been estimated as per the formulaconsumption. From the year of gridthis reason, government intervention will mentioned below:parity, certain non- high-end residentialbe required, in terms of soft loans or
THE RISING SUN53
High-end Residential Solar Rooftop Potential
Source: KPMG’s Solar Market Potential Model
4,0662,4701,1791,013
867 1,880
3,058
5,529
9,595
0
500
1,000
1,500
2,000
2,500
3,000
3,500
4,000
4,500
5,000
2017-18 2018-19 2019-20 2020-21 2021-22
A n n u a
l P o t e n t i a
l ( M W )
C u m u l a t i v e P o t e n t i a l ( MW )
Annual Potential (MW)
Cumulative Potential (MW)
-
1,000
2,000
3,000
4,000
5,000
6,000
7,000
8,000
9,000
10,000
2017-18 2018-19 2019-20 2020-21 2021-22
Annual Potential (MW)
Cumulative Potential (MW)
342 3,6112,8712,421158500
2,921
5,792
9,404
A n n u a
l P o t e n t i a
l ( M W )
C u m u l a t i v e P o t e n t i a l ( MW )
Non- high-end Residential Solar Rooftop Potential
Source: KPMG’s Solar Market Potential Model
-
1,000
2,000
3,000
4,000
5,000
6,000
7,000
8,000
9,00010,000
-
1,000
2,000
3,000
4,000
5,000
6,000
7,000
8,000
9,00010,000
Year 2017-18 2018-19 2019-20 (Grid Parity Year) 2020-21 2021-22
% Demand from high-end residential
category adopting solar5% 10% 15% 25% 40%
Year 2017-18 2018-19 2019-20 (Grid Parity Year) 2020-21 2021-22
% New Demand from
residential category adopting solar
non- high-end5% 10% 15% 25% 40%
% Existing Demand from non- high-end
residential category adopting solar
0% 0% 5% 10% 15%
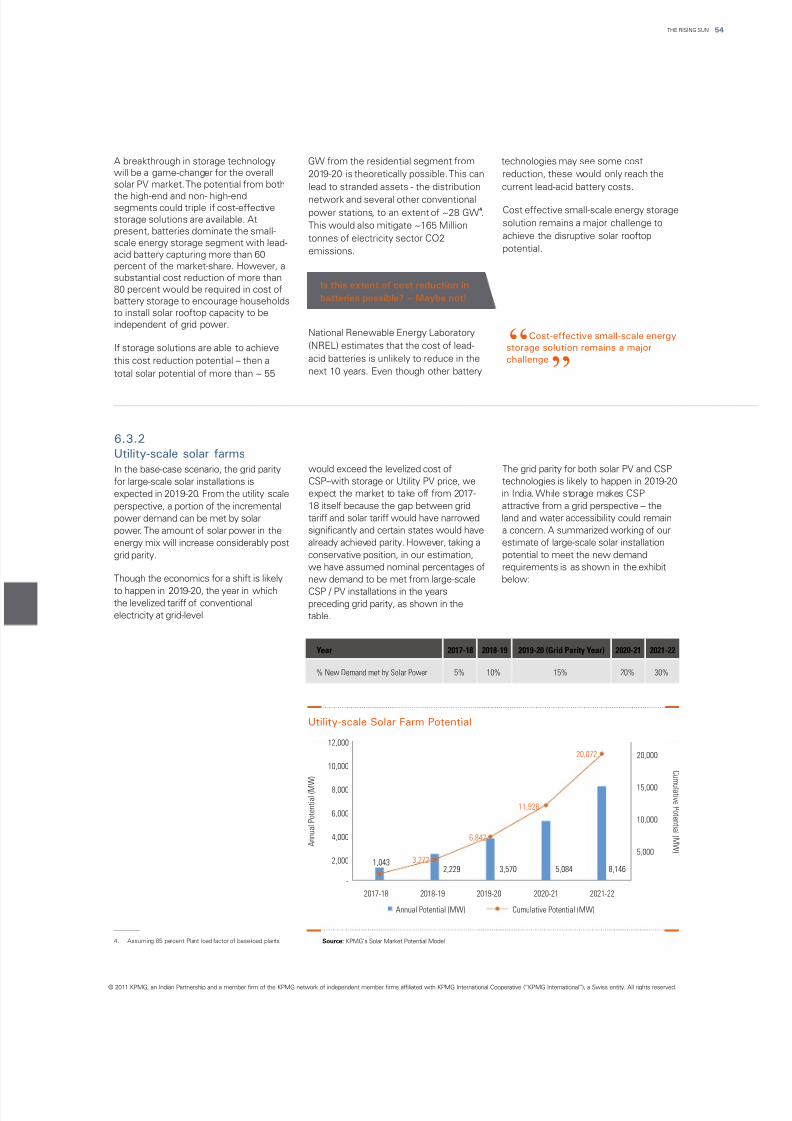
8/3/2019 The Rising Sun Full
http://slidepdf.com/reader/full/the-rising-sun-full 55/96
© 2011 KPMG, an Indian Partnership and a member firm of the KPMG network of independent member firms affiliated with KPMG International Cooperative (“KPMG International”), a Swiss entity. All rights reserved.
A breakthrough in storage technology GW from the residential segment from technologies may see some cost
will be a game-changer for the overall 2019-20 is theoretically possible. This can reduction, these would only reach thesolar PV market. The potential from both lead to stranded assets - the distribution current lead-acid battery costs.
the high-end and non- high-end network and several other conventionalsegments could triple if cost-effective 4 Cost effective small-scale energy storagepower stations, to an extent of ~28 GW .storage solutions are available. At solution remains a major challenge toThis would also mitigate ~165 Millionpresent, batteries dominate the small-
achieve the disruptive solar rooftoptonnes of electricity sector CO2scale energy storage segment with lead-
potential.emissions.acid battery capturing more than 60
percent of the market-share. However, a
substantial cost reduction of more than
80 percent would be required in cost of
battery storage to encourage households
to install solar rooftop capacity to be
independent of grid power.National Renewable Energy Laboratory
(NREL) estimates that the cost of lead-If storage solutions are able to achieveacid batteries is unlikely to reduce in thethis cost reduction potential – then anext 10 years. Even though other batterytotal solar potential of more than ~ 55
6.3.2
Utility-scale solar farms
would exceed the levelized cost of The grid parity for both solar PV and CSPIn the base-case scenario, the grid parity
CSP–with storage or Utility PV price, we technologies is likely to happen in 2019-20for large-scale solar installations is
expect the market to take off from 2017- in India. While storage makes CSPexpected in 2019-20. From the utility scale
18 itself because the gap between grid attractive from a grid perspective – theperspective, a portion of the incremental
tariff and solar tariff would have narrowed land and water accessibility could remainpower demand can be met by solar
significantly and certain states would have a concern. A summarized working of ourpower. The amount of solar power in the
already achieved parity. However, taking a estimate of large-scale solar installationenergy mix will increase considerably post
conservative position, in our estimation, potential to meet the new demandgrid parity.
we have assumed nominal percentages of requirements is as shown in the exhibit
Though the economics for a shift is likely new demand to be met from large-scale below:
to happen in 2019-20, the year in which CSP / PV installations in the yearsthe levelized tariff of conventional preceding grid parity, as shown in the
electricity at grid-level table.
Is this extent of cost reduction in
batteries possible? – Maybe not!
4. Assuming 85 percent Plant load factor of base-load plants
54THE RISING SUN
2017-18 2018-19 2019-20 2020-21 2021-22
A n n u a
l P o t e n t i a
l ( M W )
C u m u l a t i v e P o t e n t i a l ( MW )
Annual Potential (MW) Cumulative Potential (MW)
8,1465,0843,5702,2291,043 3,272
6,842
11,926
20,072
Utility-scale Solar Farm Potential
Source: KPMG’s Solar Market Potential Model
-
5,000
10,000
15,000
20,000
-
2,000
4,000
6,000
8,000
10,000
12,000
Year 2017-18 2018-19 2019-20 (Grid Parity Year) 2020-21 2021-22
% New Demand met by Solar Power 5% 10% 15% 20% 30%
Cost-effective small-scale energy
storage solution remains a major
challenge“
”
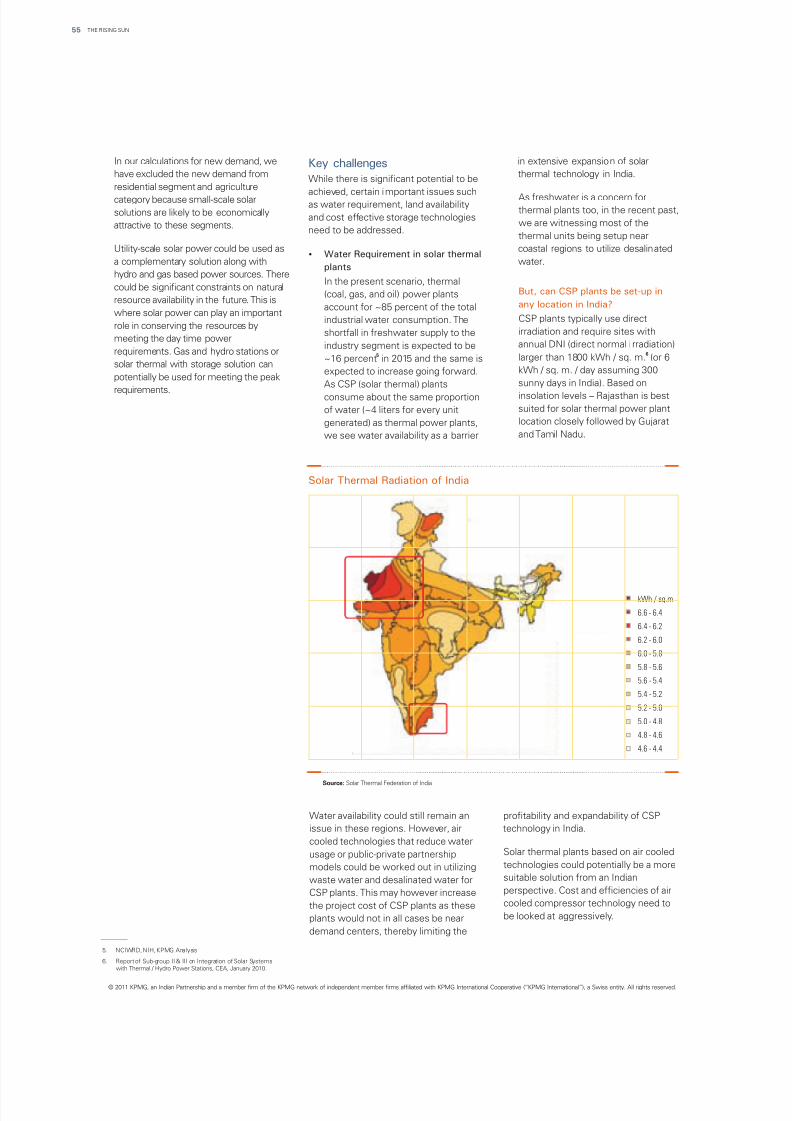
8/3/2019 The Rising Sun Full
http://slidepdf.com/reader/full/the-rising-sun-full 56/96
In our calculations for new demand, we in extensive expansion of solar
have excluded the new demand from thermal technology in India.While there is significant potential to be
residential segment and agriculture
achieved, certain important issues such As freshwater is a concern forcategory because small-scale solar as water requirement, land availabilitythermal plants too, in the recent past,solutions are likely to be economically
and cost effective storage technologieswe are witnessing most of theattractive to these segments.
need to be addressed.thermal units being setup near
Utility-scale solar power could be used as coastal regions to utilize desalinated?Water Requirement in solar thermal
a complementary solution along with water.plants
hydro and gas based power sources. ThereIn the present scenario, thermal
could be significant constraints on natural(coal, gas, and oil) power plants
resource availability in the future. This isaccount for ~85 percent of the total
where solar power can play an importantCSP plants typically use directindustrial water consumption. The
role in conserving the resources byirradiation and require sites withshortfall in freshwater supply to the
meeting the day time powerannual DNI (direct normal i rradiation)industry segment is expected to be
requirements. Gas and hydro stations or 65 larger than 1800 kWh / sq. m. (or 6~16 percent in 2015 and the same issolar thermal with storage solution can
kWh / sq. m. / day assuming 300expected to increase going forward.potentially be used for meeting the peak
sunny days in India). Based onAs CSP (solar thermal) plants
requirements. insolation levels – Rajasthan is bestconsume about the same proportion
suited for solar thermal power plantof water (~4 liters for every unit
location closely followed by Gujaratgenerated) as thermal power plants,
and Tamil Nadu.we see water availability as a barrier
Key challenges
But, can CSP plants be set-up in
any location in India?
Solar Thermal Radiation of India
Source:Solar Thermal Federation of India
kWh / sq.m
6.6 - 6.4
6.4 - 6.2
6.2 - 6.0
6.0 - 5.8
5.8 - 5.6
5.6 - 5.4
5.4 - 5.2
5.2 - 5.0
5.0 - 4.8
4.8 - 4.6
4.6 - 4.4
Water availability could still remain an profitability and expandability of CSP
issue in these regions. However, air technology in India.
cooled technologies that reduce waterSolar thermal plants based on air cooledusage or public-private partnershiptechnologies could potentially be a moremodels could be worked out in utilizingsuitable solution from an Indianwaste water and desalinated water forperspective. Cost and efficiencies of airCSP plants. This may however increasecooled compressor technology need tothe project cost of CSP plants as thesebe looked at aggressively.plants would not in all cases be near
demand centers, thereby limiting the
5. NCIWRD, NIH, KPMG Analysis
6. Report of Sub-group II & III on Integration of Solar Systemswith Thermal / Hydro Power Stations, CEA, January 2010.
© 2011 KPMG, an Indian Partnership and a member firm of the KPMG network of independent member firms affiliated with KPMG International Cooperative (“KPMG International”), a Swiss entity. All rights reserved.
THE RISING SUN55
8/3/2019 The Rising Sun Full
http://slidepdf.com/reader/full/the-rising-sun-full 57/96
Source: KPMG in India’s The Rising Sun, May 2011
Source: KPMG in India’s The Rising Sun, May 2011
© 2011 KPMG, an Indian Partnership and a member firm of the KPMG network of independent member firms affiliated with KPMG International Cooperative (“KPMG International”), a Swiss entity. All rights reserved.
?Land requirement areas for developing solar plants. on R & D would be required to
Desert regions in Rajasthan are an reduce the capital costs and certainCSP requires large tracts of evenideal location from the solar pilot demonstrations of each of theseland, typically around four to five
insolation perspective. Similar to the technologies could help the utilitiesacres per MW with a land gradientpit head concept for conventional understand the pros and cons ofless than 1-3 degrees. Though solarpower sources – the desert belt each of the technology type. ThermalPV can be installed in scatteredcould become the centre for “pit- storage in CSP plants are currentlypatches of land unlike CSP, it wouldhead” solar power generation in the economically viable and thus can berequire about 5 acres / MW. Simplycountry! used to meet the baseload andput, to generate the same quantum
peakload power requirements.of power as conventional power?Storage solutionssources during the year – solar power
7 Currently, we have certain large-scaleinstallations would require 20 timesenergy storage technologies such asthe land required for coal plants.Adiabatic Compressed Air Energy
Storage, Hydrogen Storage, Pumped
Hydro and large-scale stationary
batteries. While large-scale energyRajasthan has more than 51 Millionstorage options exist, we believeacres of desert land that could be
challenges such as capital costs,used to produce solar power. Gujaratscalability, and disposal of wastes inhas allocated more than 50,000 acresa large-scale exist. Increased focusof wasteland in four major potential
Is land a constraint for grid-scale
solar technologies?
6.4
Summary of grid-connected solar market potentialThe potential that has been estimated in this section is from an All- India perspective.
Different States will have different potentials which would depend on the grid parity
year and the Government support.
?Domestic Rooftop = Conversion of high and non- high-end residential demand +
New Incremental Demand from non- high-end residential segment
?Large-Scale Utility Power = Incremental Demand from non-residential and non-
agriculture categories
Solar Potential (MW) 2017-18 2018-19 2019-20 (Grid Parity Year) 2020-21 2021-22
Annual Solar Rooftop Potential ~1,100 ~1,300 ~3,700 ~5,300 ~7,800
Cumulative Solar Rooftop Potential ~1,100 ~2,400 ~6,000 ~11,300 ~19,000
Solar Potential (MW) 2017-18 2018-19 2019-20 (Grid Parity Year) 2020-21 2021-22
Annual Solar Capacity Required to meet
certain percentage of Incremental
consumption (MW)
~1,000 ~2,200 ~3,600 ~5,100 ~8,100
Cumulative Utility-scale Solar Farm
Potential (MW) ~1,000 ~3,300 ~6,800 ~11,900 ~20,100
7. Coal plants typically require about 0.30-1.50 acres / MW;
Coal PLF is ~80-85 percent unlike Solar technologies PLF
of about 19-22 percent.
56THE RISING SUN
8/3/2019 The Rising Sun Full
http://slidepdf.com/reader/full/the-rising-sun-full 58/96
Potential of off-grid
solar applications
© 2011 KPMG, an Indian Partnership and a member firm of the KPMG network of independent member firms affiliated with
KPMG International Cooperative (“KPMG International”), a Swiss entity. All rights reserved.
THE RISING SUN57
8/3/2019 The Rising Sun Full
http://slidepdf.com/reader/full/the-rising-sun-full 59/96
07Potential of off-grid
solar applications
© 2011 KPMG, an Indian Partnership and a member firm of the KPMG network of independent member firms affiliated with KPMG International Cooperative (“KPMG International”), a Swiss entity. All rights reserved.
58THE RISING SUN
8/3/2019 The Rising Sun Full
http://slidepdf.com/reader/full/the-rising-sun-full 60/96
‘Off-grid’ solar applications are generally meant to refer to a set of applications that
provide solar power to end-users through routes other than the electricity grid.
These routes, for example, could be to deliver water heated through solar energy to
a consumer through water pipes at his residence or street lights illuminated
through a battery bank charged using solar power.
While there are large tracts of land that can be used for grid interactive generation
in radiation rich states with sparsely populated belts e.g. Thar desert in Rajasthan,
there are small Sun exposed pockets available in populated areas e.g. rooftops,
unused land in commercial and industrial complexes, space over streetlights etc
that lend themselves well to off-grid applications.
The Jawaharlal Nehru National Solar Mission (JNNSM) recognizes the potential of
off-grid applications and mentions that:
JNNSM program recognizes the off-grid potential
Key mission targets relating to off-grid applications are:
?“To promote programmes for off grid applications, reaching 1000 MW by 2017
and 2000 MW by 2022
?To achieve 15 million sq. meters of solar thermal collector area by 2017 and 20
million by 2022.
?To deploy 20 mill ion solar lighting systems for rural areas by 2022”
Off-grid applications find use in three broad categories: Heating, Cooling and
Lighting. Put together, these three categories hold immense potential in a tropical
country like India with bright, sunny days for most part of the year. However,
despite the promise they hold, off-grid applications have not been able to establish
themselves significantly in the country for various reasons.
Given the increasing attention of Indian and other Federal Governments on solar
power, we believe that the time is opportune to put in place the right environment
for off-grid applications to prosper. As we will show in the subsequent sections, off-
grid segment holds significant potential – be it investment requirement, fuel
savings, greenhouse emissions reduction or beneficial impact on society – for
anyone to ignore.
The promise of off-grid applications
07
Potential of off-gridsolar applications
…there are a number of off-grid solar applications particularly for meeting rural energyneeds, which are already cost-effective and provides for their rapid expansion.“
The immediate aim of the Mission is to focus on setting up an enabling environment for
solar technology penetration in the country both at a centralized and decentralized level. Thefirst phase (up to 2013) will focus on capturing the low hanging options in solar thermal; on
promoting off-grid systems to serve populations without access to commercial energy andmodest capacity addition in grid-based systems.
© 2011 KPMG, an Indian Partnership and a member firm of the KPMG network of independent member firms affiliated with KPMG International Cooperative (“KPMG International”), a Swiss entity. All rights reserved.
THE RISING SUN59
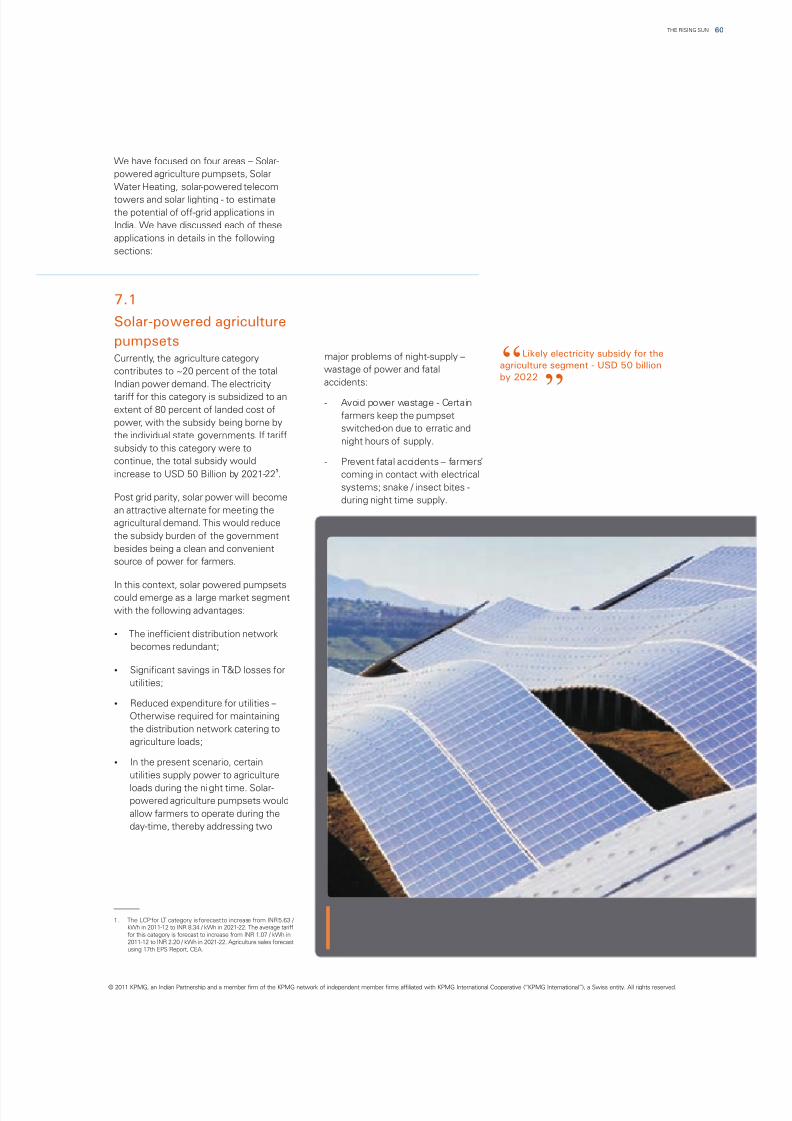
8/3/2019 The Rising Sun Full
http://slidepdf.com/reader/full/the-rising-sun-full 61/96
© 2011 KPMG, an Indian Partnership and a member firm of the KPMG network of independent member firms affiliated with KPMG International Cooperative (“KPMG International”), a Swiss entity. All rights reserved.
1. The LCP for LT category is forecast to increase from INR 5.63 / kWh in 2011-12 to INR 8.34 / kWh in 2021-22. The average tariff
for this category is forecast to increase from INR 1.07 / kWh in
2011-12 to INR 2.20 / kWh in 2021-22. Agriculture sales forecast
using 17th EPS Report, CEA.
We have focused on four areas – Solar-
powered agriculture pumpsets, Solar
Water Heating, solar-powered telecom
towers and solar lighting - to estimate
the potential of off-grid applications in
India. We have discussed each of these
applications in details in the following
sections:
major problems of night-supply –Currently, the agriculture categorywastage of power and fatalcontributes to ~20 percent of the totalaccidents:Indian power demand. The electricity
tariff for this category is subsidized to an- Avoid power wastage - Certain
extent of 80 percent of landed cost offarmers keep the pumpset
power, with the subsidy being borne byswitched-on due to erratic and
the individual state governments. If tariffnight hours of supply.
subsidy to this category were to
continue, the total subsidy would - Prevent fatal accidents – farmers’1
increase to USD 50 Billion by 2021-22 . coming in contact with electrical
systems; snake / insect bites -Post grid parity, solar power will become during night time supply.an attractive alternate for meeting the
agricultural demand. This would reduce
the subsidy burden of the government
besides being a clean and convenient
source of power for farmers.
In this context, solar powered pumpsetscould emerge as a large market segment
with the following advantages:
?The inefficient distribution network
becomes redundant;
?Significant savings in T&D losses for
utilities;
?Reduced expenditure for utilities –
Otherwise required for maintaining
the distribution network catering to
agriculture loads;
?In the present scenario, certain
utilities supply power to agriculture
loads during the night time. Solar-powered agriculture pumpsets would
allow farmers to operate during the
day-time, thereby addressing two
7.1
Solar-powered agriculture
pumpsets
60THE RISING SUN
Likely electricity subsidy for the
agriculture segment - USD 50 billion
by 2022“
”
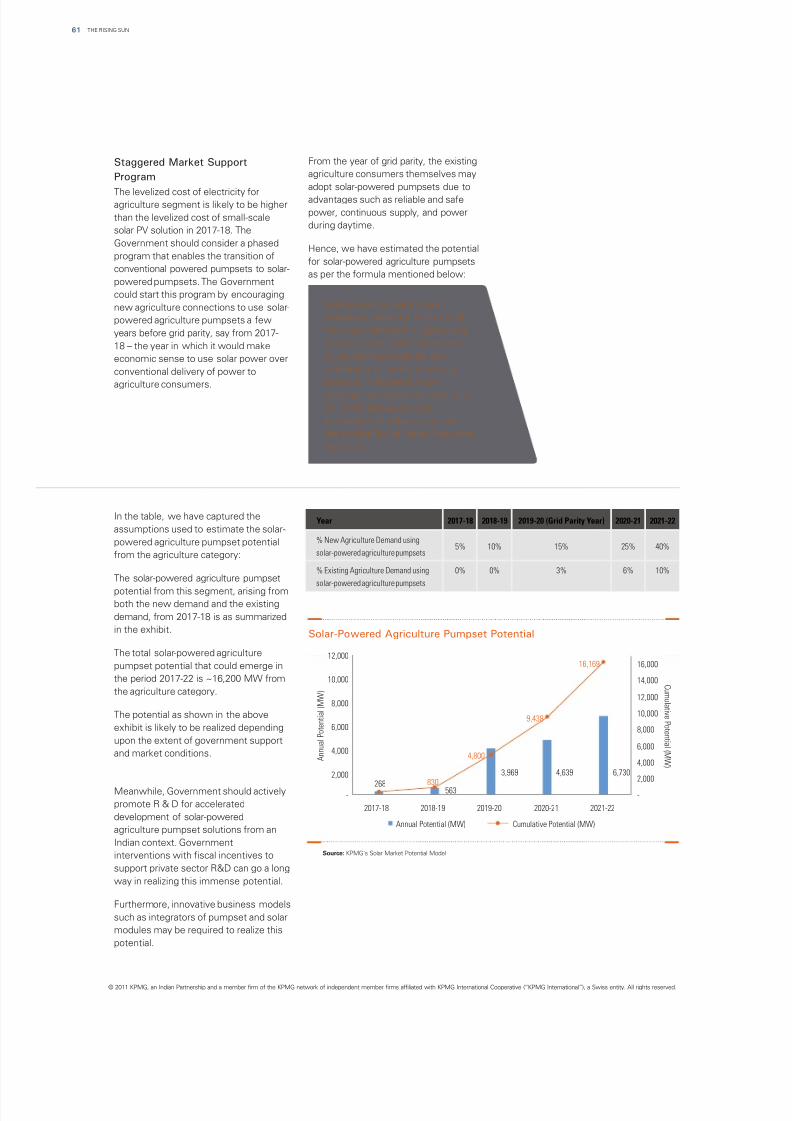
8/3/2019 The Rising Sun Full
http://slidepdf.com/reader/full/the-rising-sun-full 62/96
In the table, we have captured the
assumptions used to estimate the solar-
powered agriculture pumpset potential
from the agriculture category:
The solar-powered agriculture pumpset
potential from this segment, arising fromboth the new demand and the existing
demand, from 2017-18 is as summarized
in the exhibit.
The total solar-powered agriculture
pumpset potential that could emerge in
the period 2017-22 is ~16,200 MW from
the agriculture category.
The potential as shown in the above
exhibit is likely to be realized depending
upon the extent of government support
and market conditions.
Meanwhile, Government should actively
promote R & D for accelerated
development of solar-powered
agriculture pumpset solutions from an
Indian context. Government
interventions with fiscal incentives to
support private sector R&D can go a long
way in realizing this immense potential.
Furthermore, innovative business models
such as integrators of pumpset and solar
modules may be required to realize this
potential.
From the year of grid parity, the existingStaggered Market Supportagriculture consumers themselves mayProgramadopt solar-powered pumpsets due to
The levelized cost of electricity for advantages such as reliable and safeagriculture segment is likely to be higherpower, continuous supply, and power
than the levelized cost of small-scaleduring daytime.
solar PV solution in 2017-18. The
Government should consider a phasedHence, we have estimated the potential
program that enables the transition offor solar-powered agriculture pumpsets
conventional powered pumpsets to solar-as per the formula mentioned below:
powered pumpsets. The Government
could start this program by encouraging
new agriculture connections to use solar-
powered agriculture pumpsets a few
years before grid parity, say from 2017-
18 – the year in which it would make
economic sense to use solar power over
conventional delivery of power to
agriculture consumers.
Solar-powered Agriculture
Pumpsets potential = Potential
from new demand in Agriculture
category from 2017-18 (driven
by government policies and
availability of viable financing
options) + Potential from
existing agriculture demand from
2019-20 (driven by cost
economics of solar power and
the availability of viable financing
options)
© 2011 KPMG, an Indian Partnership and a member firm of the KPMG network of independent member firms affiliated with KPMG International Cooperative (“KPMG International”), a Swiss entity. All rights reserved.
THE RISING SUN61
-
2,000
4,000
6,000
8,000
10,000
12,000
14,000
16,000
-
2,000
4,000
6,000
8,000
10,000
12,000
2017-18 2018-19 2019-20 2020-21 2021-22
A n n u a
l P o t e n t i a
l ( M W )
C u m u l a t i v e P o t e n t i a l ( MW )
Annual Potential (MW) Cumulative Potential (MW)
6,7304,6393,969
563268 830
4,800
9,438
16,169
Solar-Powered Agriculture Pumpset Potential
Source: KPMG's Solar Market Potential Model
Year 2017-18 2018-19 2019-20 (Grid Parity Year) 2020-21 2021-22
% New Agriculture Demand using
solar-powered agriculture pumpsets5% 10% 15% 25% 40%
% Existing Agriculture Demand using
solar-powered agriculture pumpsets
0% 0% 3% 6% 10%
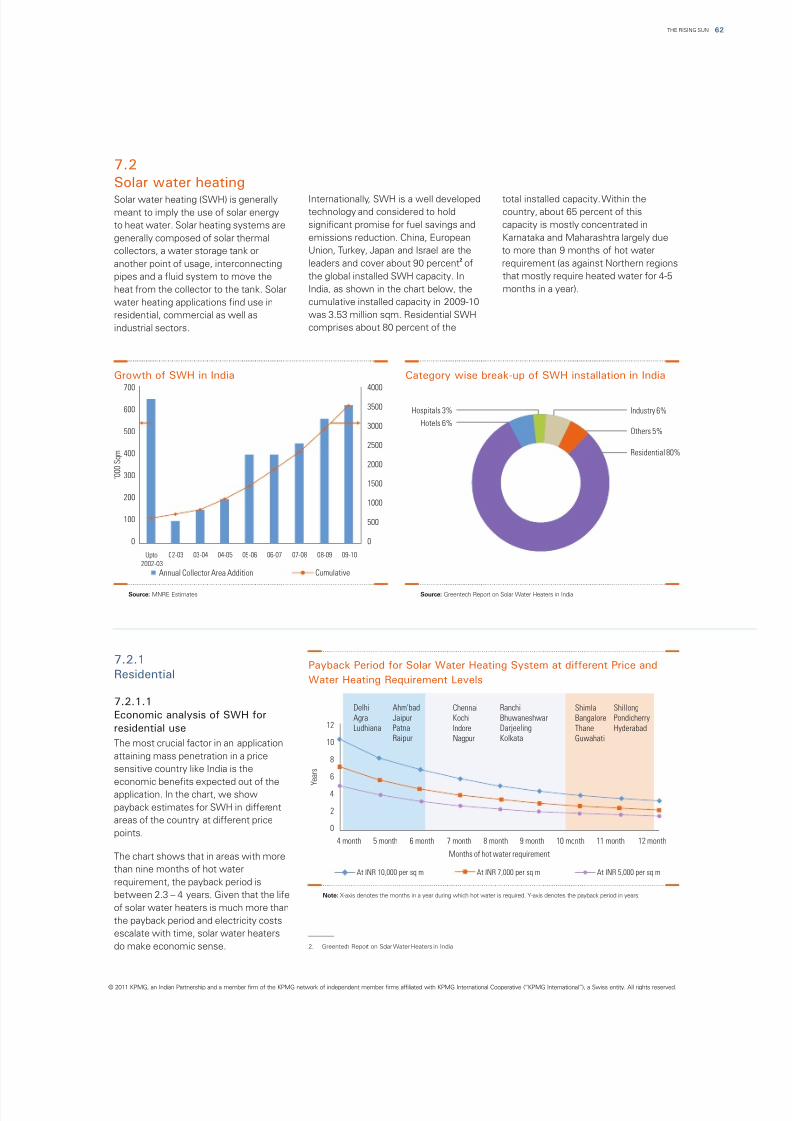
8/3/2019 The Rising Sun Full
http://slidepdf.com/reader/full/the-rising-sun-full 63/96
© 2011 KPMG, an Indian Partnership and a member firm of the KPMG network of independent member firms affiliated with KPMG International Cooperative (“KPMG International”), a Swiss entity. All rights reserved.
7.2
Solar water heating
Internationally, SWH is a well developed total installed capacity. Within theSolar water heating (SWH) is generally
technology and considered to hold country, about 65 percent of thismeant to imply the use of solar energy
significant promise for fuel savings and capacity is mostly concentrated into heat water. Solar heating systems are
emissions reduction. China, European Karnataka and Maharashtra largely duegenerally composed of solar thermal
Union, Turkey, Japan and Israel are the to more than 9 months of hot watercollectors, a water storage tank or2
leaders and cover about 90 percent of requirement (as against Northern regionsanother point of usage, interconnecting
the global installed SWH capacity. In that mostly require heated water for 4-5pipes and a fluid system to move the
India, as shown in the chart below, the months in a year).heat from the collector to the tank. Solar
cumulative installed capacity in 2009-10water heating applications find use in
was 3.53 million sqm. Residential SWHresidential, commercial as well as
comprises about 80 percent of theindustrial sectors.
Growth of SWH in India Category wise break-up of SWH installation in India
Source: MNRE Estimates Source: Greentech Report on Solar Water Heaters in India
Industry 6%
Others 5%
Residential 80%
Hospitals 3%
Hotels 6%
7.2.1
Residential
7.2.1.1
Economic analysis of SWH for
residential use
The most crucial factor in an application
attaining mass penetration in a price
sensitive country like India is the
economic benefits expected out of theapplication. In the chart, we show
payback estimates for SWH in different
areas of the country at different price
points.
The chart shows that in areas with more
than nine months of hot water
requirement, the payback period is
between 2.3 – 4 years. Given that the life
of solar water heaters is much more than
the payback period and electricity costs
escalate with time, solar water heaters
do make economic sense.
Payback Period for Solar Water Heating System at different Price and
Water Heating Requirement Levels
Note: X-axis denotes the months in a year during which hot water is required. Y-axis denotes the payback period in years.
12 month
0
2
4
6
8
10
12
4 month 5 month 6 month
Delhi
Agra
Ludhiana
Ahm'bad
Jaipur
Patna
Raipur
Chennai
Kochi
Indore
Nagpur
Ranchi
Bhuwaneshwar
Darjeeling
Kolkata
Shimla
Bangalore
Thane
Guwahati
Shillong
Pondicherry
Hyderabad
7 month 8 month 9 month 10 month 11 month
Y e a r s
Months of hot water requirement
At INR 5,000 per sq mAt INR 7,000 per sq mAt INR 10,000 per sq m
62THE RISING SUN
2. Greentech Report on Solar Water Heaters in India
0
500
1000
1500
2000
2500
3000
3500
4000
09-10
0
100
200
300
400
500
600
700
Upto
2002-03
02-03 03-04 04-05 05-06 06-07 07-08 08-09
‘ 0 0 0 S q m
CumulativeAnnual Collector Area Addition
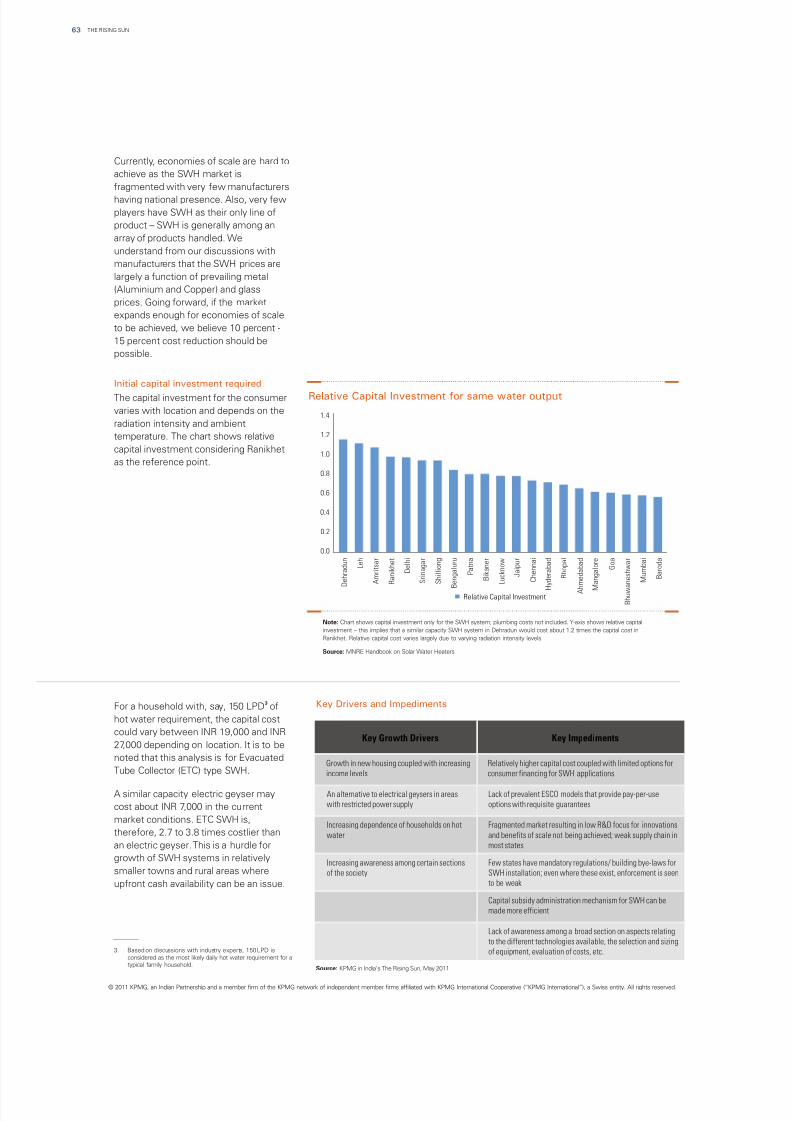
8/3/2019 The Rising Sun Full
http://slidepdf.com/reader/full/the-rising-sun-full 64/96
Currently, economies of scale are hard to
achieve as the SWH market is
fragmented with very few manufacturers
having national presence. Also, very few
players have SWH as their only line of
product – SWH is generally among an
array of products handled. We
understand from our discussions with
manufacturers that the SWH prices are
largely a function of prevailing metal
(Aluminium and Copper) and glass
prices. Going forward, if the market
expands enough for economies of scale
to be achieved, we believe 10 percent -
15 percent cost reduction should be
possible.
The capital investment for the consumer
varies with location and depends on the
radiation intensity and ambient
temperature. The chart shows relative
capital investment considering Ranikhet
as the reference point.
Initial capital investment required
3
For a household with, say, 150 LPD of
hot water requirement, the capital cost
could vary between INR 19,000 and INR
27,000 depending on location. It is to be
noted that this analysis is for Evacuated
Tube Collector (ETC) type SWH.
A similar capacity electric geyser may
cost about INR 7,000 in the current
market conditions. ETC SWH is,
therefore, 2.7 to 3.8 times costlier than
an electric geyser. This is a hurdle for
growth of SWH systems in relatively
smaller towns and rural areas where
upfront cash availability can be an issue.
0.0
0.2
0.4
0.6
0.8
1.0
1.2
1.4
D e h r a d u n
L e h
A m r i t s a r
R a n i k h e t
D e l h i
S r i n a g a r
S h i l l i o n g
B e n g a l u r u
P a t n a
B i k a n e r
L u c k n o w
J a i p u r
C h e n n a i
H
y d e r a b a d
B h o p a l
A h m e d a b a d
M
a n g a l o r e
G o a
B h u w a n e s h w a r
M u m b a i
B a r o d a
Relative Capital Investment
Relative Capital Investment for same water output
Note: Chart shows capital investment only for the SWH system; plumbing costs not included. Y-axis shows relative capital
investment – this implies that a similar capacity SWH system in Dehradun would cost about 1.2 times the capital cost in
Ranikhet. Relative capital cost varies largely due to varying radiation intensity levels.
Source: MNRE Handbook on Solar Water Heaters
Source: KPMG in India’s The Rising Sun, May 2011
Key Growth Drivers Key Impediments
Growth in new housing coupled with increasing
income levels
Relatively higher capital cost coupled with limited options for
consumer financing for SWH applications
An alternative to electrical geysers in areas
with restricted power supply
Lack of prevalent ESCO models that provide pay-per-use
options with requisite guarantees
Increasing dependence of households on hot
water
Fragmented market resulting in low R&D focus for innovations
and benefits of scale not being achieved; weak supply chain in
most states
Increasing awareness among certain sections
of the society
Few states have mandatory regulations/ building bye-laws for
SWH installation; even where these exist, enforcement is seen
to be weak
Capital subsidy administration mechanism for SWH can be
made more efficient
Lack of awareness among a broad section on aspects relating
to the different technologies available, the selection and sizing
of equipment, evaluation of costs, etc.
Key Drivers and Impediments
© 2011 KPMG, an Indian Partnership and a member firm of the KPMG network of independent member firms affiliated with KPMG International Cooperative (“KPMG International”), a Swiss entity. All rights reserved.
THE RISING SUN63
3. Based on discussions with industry experts, 150 LPD is
considered as the most likely daily hot water requirement for atypical family household.
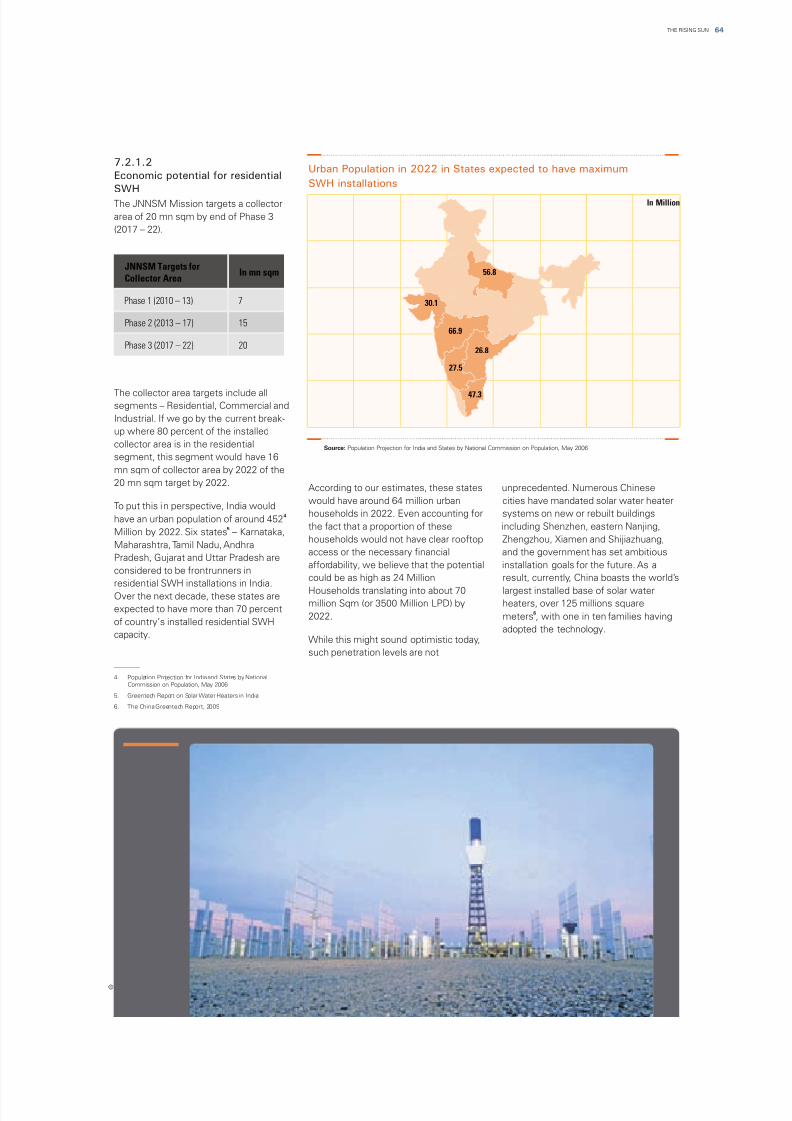
8/3/2019 The Rising Sun Full
http://slidepdf.com/reader/full/the-rising-sun-full 65/96
7.2.1.2
Economic potential for residential
SWH
The JNNSM Mission targets a collector
area of 20 mn sqm by end of Phase 3
(2017 – 22).
The collector area targets include allsegments – Residential, Commercial and
Industrial. If we go by the current break-
up where 80 percent of the installed
collector area is in the residential
segment, this segment would have 16
mn sqm of collector area by 2022 of the
20 mn sqm target by 2022.According to our estimates, these states unprecedented. Numerous Chinese
would have around 64 million urban cities have mandated solar water heaterTo put this in perspective, India would
households in 2022. Even accounting for systems on new or rebuilt buildings4
have an urban population of around 452the fact that a proportion of these including Shenzhen, eastern Nanjing,5
Million by 2022. Six states – Karnataka,households would not have clear rooftop Zhengzhou, Xiamen and Shijiazhuang,
Maharashtra, Tamil Nadu, Andhraaccess or the necessary financial and the government has set ambitious
Pradesh, Gujarat and Uttar Pradesh areaffordability, we believe that the potential installation goals for the future. As a
considered to be frontrunners incould be as high as 24 Million result, currently, China boasts the world’s
residential SWH installations in India.Households translating into about 70 largest installed base of solar waterOver the next decade, these states aremillion Sqm (or 3500 Million LPD) by heaters, over 125 millions square
expected to have more than 70 percent6
2022. meters , with one in ten families havingof country’s installed residential SWH
adopted the technology.capacity.
While this might sound optimistic today,
such penetration levels are not
© 2011 KPMG, an Indian Partnership and a member firm of the KPMG network of independent member firms affiliated with KPMG International Cooperative (“KPMG International”), a Swiss entity. All rights reserved.
Urban Population in 2022 in States expected to have maximum
SWH installations
JNNSM Targets for
Collector AreaIn mn sqm
Phase 1 (2010 – 13) 7
Phase 2 (2013 – 17) 15
Phase 3 (2017 – 22) 20
27.5
26.8
56.8
30.1
66.9
47.3
In Million
4. Population Projection for India and States by National
Commission on Population, May 2006
5. Greentech Report on Solar Water Heaters in India
6. The China Greentech Report, 2009
64THE RISING SUN
Source: Population Projection for India and States by National Commission on Population, May 2006
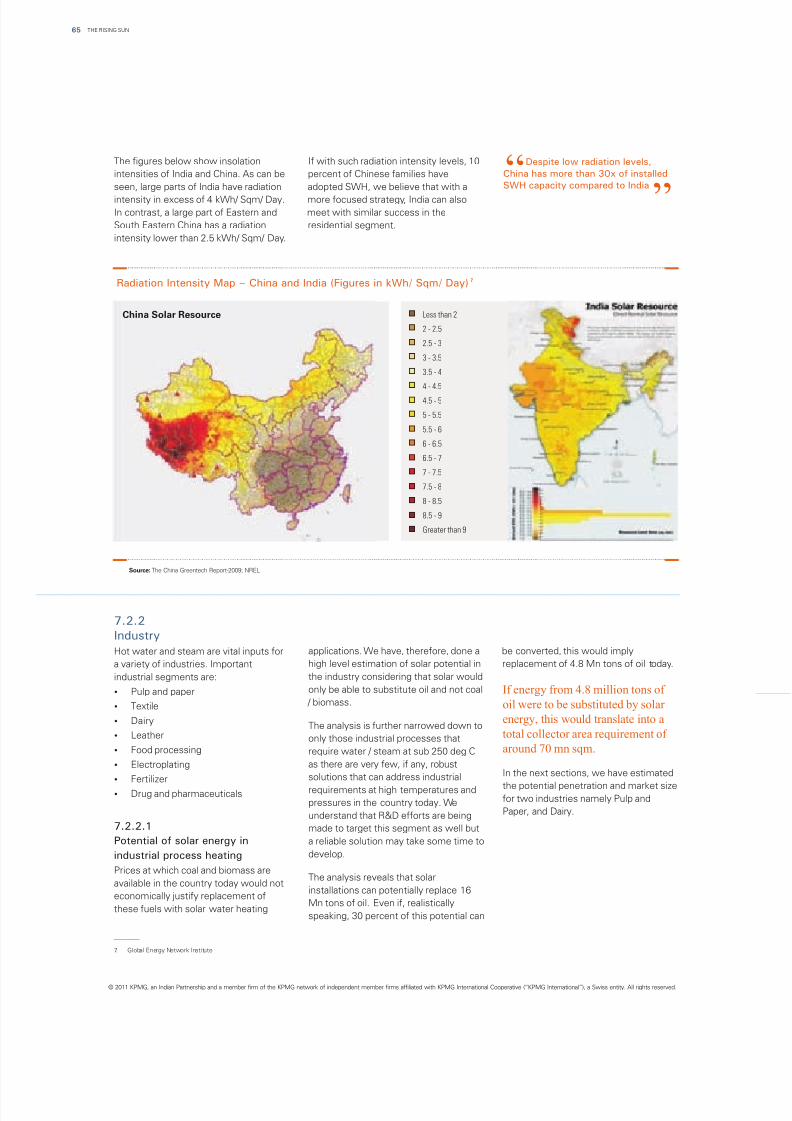
8/3/2019 The Rising Sun Full
http://slidepdf.com/reader/full/the-rising-sun-full 66/96
The figures below show insolation If with such radiation intensity levels, 10
intensities of India and China. As can be percent of Chinese families have
seen, large parts of India have radiation adopted SWH, we believe that with a
intensity in excess of 4 kWh/ Sqm/ Day. more focused strategy, India can also
In contrast, a large part of Eastern and meet with similar success in the
South Eastern China has a radiation residential segment.
intensity lower than 2.5 kWh/ Sqm/ Day.
Source: The China Greentech Report-2009; NREL
Radiation Intensity Map – China and India (Figures in kWh/ Sqm/ Day)7
7.2.2
Industry
applications. We have, therefore, done a be converted, this would implyHot water and steam are vital inputs for
high level estimation of solar potential in replacement of 4.8 Mn tons of oil today.a variety of industries. Important
the industry considering that solar wouldindustrial segments are:
only be able to substitute oil and not coal?Pulp and paper / biomass.
?Textile
?DairyThe analysis is further narrowed down to
?Leather only those industrial processes that
?Food processing require water / steam at sub 250 deg C
as there are very few, if any, robust?ElectroplatingIn the next sections, we have estimatedsolutions that can address industrial?Fertilizerthe potential penetration and market sizerequirements at high temperatures and
?Drug and pharmaceuticalsfor two industries namely Pulp andpressures in the country today. WePaper, and Dairy.understand that R&D efforts are being
7.2.2.1 made to target this segment as well but
Potential of solar energy in a reliable solution may take some time to
develop.industrial process heating
Prices at which coal and biomass areThe analysis reveals that solar
available in the country today would notinstallations can potentially replace 16
economically justify replacement ofMn tons of oil. Even if, realistically
these fuels with solar water heatingspeaking, 30 percent of this potential can
If energy from 4.8 million tons of
oil were to be substituted by solar
energy, this would translate into a
total collector area requirement of
around 70 mn sqm.
7. Global Energy Network Institute
© 2011 KPMG, an Indian Partnership and a member firm of the KPMG network of independent member firms affiliated with KPMG International Cooperative (“KPMG International”), a Swiss entity. All rights reserved.
THE RISING SUN65
Less than 2
2 - 2.5
2.5 - 3
3 - 3.5
3.5 - 4
4 - 4.5
4.5 - 5
5 - 5.5
5.5 - 6
6 - 6.5
6.5 - 7
7 - 7.5
7.5 - 8
8 - 8.5
8.5 - 9
Greater than 9
China Solar Resource
Despite low radiation levels,
China has more than 30x of installed
SWH capacity compared to India“
”
8/3/2019 The Rising Sun Full
http://slidepdf.com/reader/full/the-rising-sun-full 67/96
© 2011 KPMG, an Indian Partnership and a member firm of the KPMG network of independent member firms affiliated with KPMG International Cooperative (“KPMG International”), a Swiss entity. All rights reserved.
7.2.2.3
Dairy Industry (Milk Pasteurization
Process)
products like Ghee, Butter, and CheeseDairy industry is again a good exampleetc.of an industry that uses significant
quantum of hot water for multiple
applications such as utensil cleaning,Our analysis shows the following paybackpasteurization, manufacturing of milkperiods vis-à-vis conventional fuels after
considering capital costs.
Payback Analysis
However, for industries such as Pulp and requirement is for customized undergoes a change along with
Paper, and Dair y to start using solar products for each buyer. requirement of additional
power in a feasible manner, certain key components such as heat
barriers listed below would need to be exchangers. The capital cost of such– Unlike, say, residentialovercome. systems today is quite high.
SWH where users may be able toWe believe that for solar power to becope up with non-performance on a
Key barriers for solar power used feasibly in the industry, solutionsporadic basis (e.g. not getting
providers would need to emerge. Theseenough hot water due to cloudyuse for industrial requirementssolution providers could be in the form ofstretches), industry is critically
– EachESCOs that not only customize thedependent on hot water / steam and
industry has a specific requirementproduct to each user’s requirements buteven a short duration of non-
for water / steam at a givenalso provide the requisite performanceavailability can bring the processes to
temperature and pressure. Evenguarantees on the output.a stop.
within an industry, manufacturing
units might have differingAdded advantages from such solution
requirements based on their size,providers could be to convert capital cost– This is the case
number of shifts etc. A “cookie-into ongoing costs for users through pay-especially for steam requirement at
cutter” product would not beper-use models and cost reductionhigh temperature/pressure, where
successful in such a scenario. Thethrough necessary R&D efforts.the basic design of solar collectors
?
?
?
Criticality of hot water / steam to
industry
Customization requirements
High capital costs for certain
applications
7.2.2.2
Pulp and paper
met by sunlight directly, solar storagePaper industry has significant
systems such as thermal salt storagerequirement of steam primarily for drying
can be used for heating requirementsapplications. Most of the current heating
during the night.requirements are done through burning
of fossil fuels like heavy furnace oil
(HFO), coal etc. We believe that most of
Our analysis shows the following paybackthese heating requirements can be met
periods vis-à-vis conventional fuels afterby using solar power. While steam
considering capital costs.requirements during the daytime can be
Payback Analysis
Payback period for Solar system vis-à-vis conventional fuels
Coal More than 10 years
Natural Gas 4.5 years
Diesel 3.0 years
Payback period for Solar system vis-à-vis conventional fuels
Coal More than 10 years
Natural Gas 6.5 years
Furnace oil 4.5 years
66THE RISING SUN
Source: KPMG in India’s The Rising Sun, May 2011
Source: KPMG in India’s The Rising Sun, May 2011
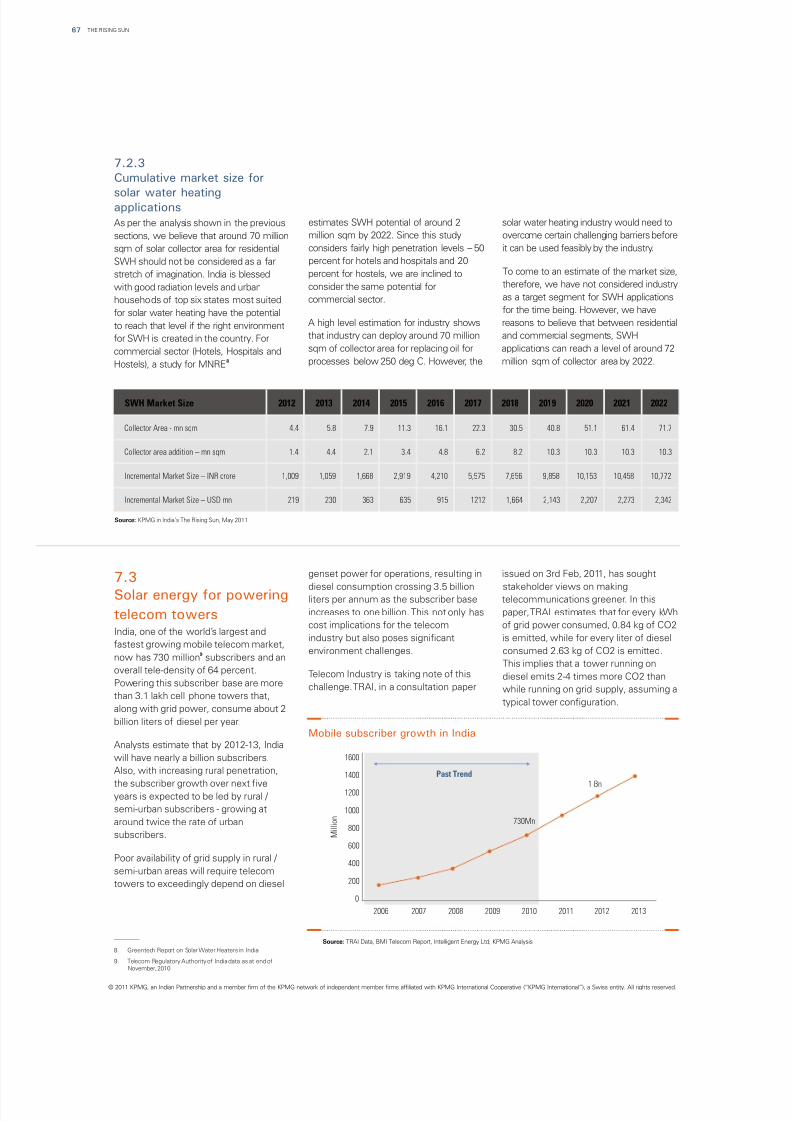
8/3/2019 The Rising Sun Full
http://slidepdf.com/reader/full/the-rising-sun-full 68/96
7.2.3
Cumulative market size for
solar water heatingapplications
estimates SWH potential of around 2 solar water heating industry would need toAs per the analysis shown in the previous
million sqm by 2022. Since this study overcome certain challenging barriers beforesections, we believe that around 70 million
considers fairly high penetration levels – 50 it can be used feasibly by the industry.sqm of solar collector area for residential
percent for hotels and hospitals and 20SWH should not be considered as a farTo come to an estimate of the market size,percent for hostels, we are inclined tostretch of imagination. India is blessedtherefore, we have not considered industryconsider the same potential forwith good radiation levels and urbanas a target segment for SWH applicationscommercial sector.households of top six states most suitedfor the time being. However, we havefor solar water heating have the potential
A high level estimation for industry shows reasons to believe that between residentialto reach that level if the right environmentthat industry can deploy around 70 million and commercial segments, SWHfor SWH is created in the country. Forsqm of collector area for replacing oil for applications can reach a level of around 72commercial sector (Hotels, Hospitals and
8 processes below 250 deg C. However, the million sqm of collector area by 2022.Hostels), a study for MNRE
SWH Market Size 2012 2013 2014 2015 2016 2017 2018 2019 2020 2021 2022
Collector Area - mn sqm 4.4 5.8 7.9 11.3 16.1 22.3 30.5 40.8 51.1 61.4 71.7
Collector area addition – mn sqm 1.4 4.4 2.1 3.4 4.8 6.2 8.2 10.3 10.3 10.3 10.3
Incremental Market Size – INR crore 1,009 1,059 1,668 2,919 4,210 5,575 7,656 9,858 10,153 10,458 10,772
Incremental Market Size – USD mn 219 230 363 635 915 1212 1,664 2,143 2,207 2,273 2,342
7.3
Solar energy for powering
telecom towers
genset power for operations, resulting in issued on 3rd Feb, 2011, has sought
diesel consumption crossing 3.5 billion stakeholder views on makingliters per annum as the subscriber base telecommunications greener. In this
increases to one billion. This not only has paper, TRAI estimates that for every kWh
cost implications for the telecom of grid power consumed, 0.84 kg of CO2India, one of the world’s largest and
industry but also poses significant is emitted, while for every liter of dieselfastest growing mobile telecom market,
environment challenges. consumed 2.63 kg of CO2 is emitted.9
now has 730 million subscribers and anThis implies that a tower running on
overall tele-density of 64 percent. Telecom Industry is taking note of this diesel emits 2-4 times more CO2 thanPowering this subscriber base are more challenge. TRAI, in a consultation paper while running on grid supply, assuming athan 3.1 lakh cell phone towers that,
typical tower configuration.along with grid power, consume about 2
billion liters of diesel per year.
Analysts estimate that by 2012-13, India
will have nearly a billion subscribers.
Also, with increasing rural penetration,
the subscriber growth over next fiveyears is expected to be led by rural /
semi-urban subscribers - growing at
around twice the rate of urban
subscribers.
Poor availability of grid supply in rural /
semi-urban areas will require telecom
towers to exceedingly depend on diesel
Mobile subscriber growth in India
Source: TRAI Data, BMI Telecom Report, Intelligent Energy Ltd, KPMG Analysis
0
200
400
600
800
1000
1200
1400
1600
2006
730Mn
1 Bn
2007
Past Trend
2008 2009 2010 2011 2012 2013
M i l l i o n
8. Greentech Report on Solar Water Heaters in India
9. Telecom Regulatory Authority of India data as at end ofNovember, 2010
© 2011 KPMG, an Indian Partnership and a member firm of the KPMG network of independent member firms affiliated with KPMG International Cooperative (“KPMG International”), a Swiss entity. All rights reserved.
THE RISING SUN67
Source: KPMG in India’s The Rising Sun, May 2011
8/3/2019 The Rising Sun Full
http://slidepdf.com/reader/full/the-rising-sun-full 69/96
© 2011 KPMG, an Indian Partnership and a member firm of the KPMG network of independent member firms affiliated with KPMG International Cooperative (“KPMG International”), a Swiss entity. All rights reserved.
Tower
76%
Corporate Office 12%
Others 2%
Core
Network
24%
Network
86%
Energy consumption of telecom firms
Source: TRAI Consultation Paper On Green Telecommunications, 3rd February, 2011
Increasing competition will require the While these tariffs are for MW scale grid
telecom operators to find the most cost connected stations, they point to a
optimized operation structure and power distinct trend towards cost reduction
cost in towers is a significant cost centre possibility due to the emergence of
in the business. indigenous suppliers. We expect that
technological advancement and growingAlso, growing desire to control indigenization will continue to drive downemissions and falling prices of PV power costs in the time to come.are expected to be key drivers going
forward. The CERC, in a Regulation Other factors driving adoption of solar
issued in 2009, had determined levelized power in this industry are depicted
tariff of solar PV power at INR 17.91/ below.
kWh. Subsequently, JNNSM bidding
received competitive tariffs in the range10
of INR 10.95 – INR 12.76/ kWh .
?Govt impetus such as capital susidy, soft
loans under JNNSM to spur growth/reduce
prices
?Pricing pressure on fuel to favour solar
power going forward
?Solar Power mitigates/eliminates the need
for continuous diesel refill ops
?
Makes installation of towers convenient inremote areas beyond grid and road reach
Favourable Economics Logistical Convenience
?Indian telecom firms are taking steps to
become greener-Green Shelter, Bio-diesel
etc.
?This is a step in the same direction
?Gradual emergence of Solution Providers
that customize technology and provide
warranties/services
Desire to Go Green Solution Provider Emergence
Tower critical to telecom cost
structure
Tower site is the single biggest energy
consumer in the entire set up of a
telecom firm as is evident from the
adjacent chart.
It is estimated that switching from
diesel to solar power would save Indian
telecom firms INR 6,440 Crores in
operations cost.
Additionally, every unit of diesel power
replaced with solar power should
generate CDM benefits of around INR11
0.75 / kWh at the current CER prices.
10. Bid results released by NVVN
11. TRAI Consultation Paper on Green Telecommunication, 3rd Feb,2011, KPMG Analysis
68THE RISING SUN
Source: KPMG in India’s The Rising Sun, May 2011
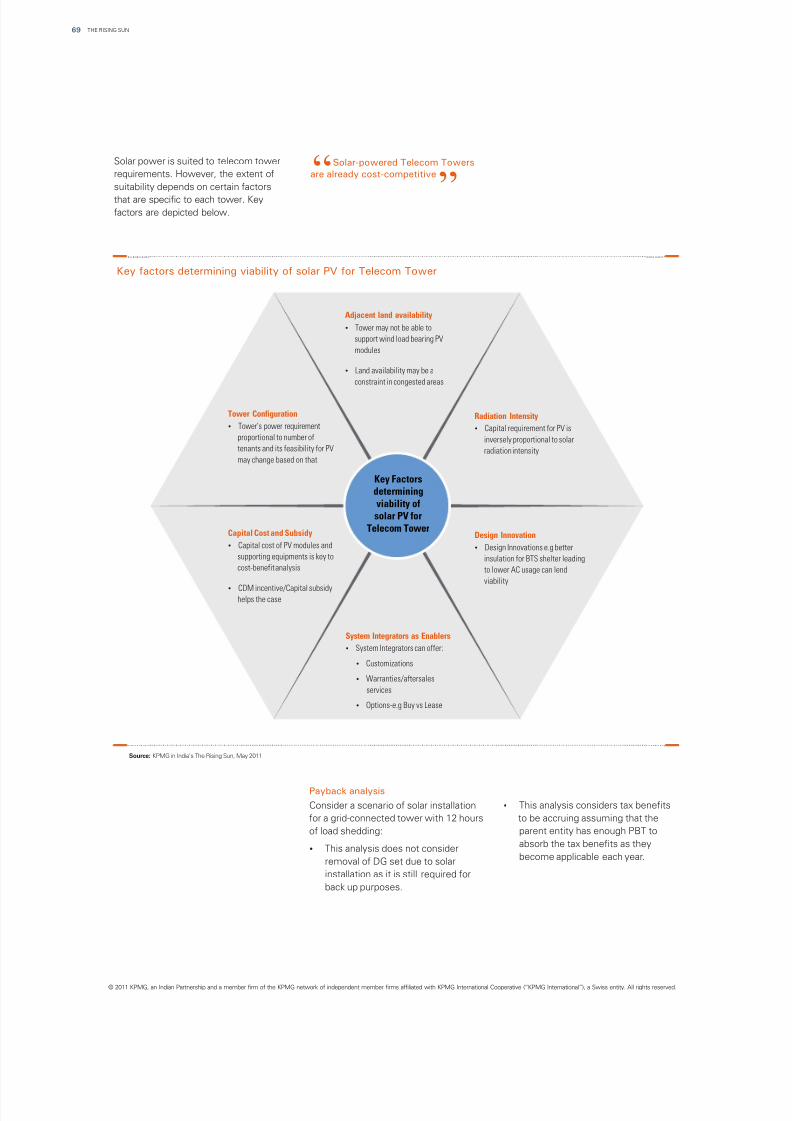
8/3/2019 The Rising Sun Full
http://slidepdf.com/reader/full/the-rising-sun-full 70/96
Solar power is suited to telecom tower
requirements. However, the extent of
suitability depends on certain factors
that are specific to each tower. Key
factors are depicted below.
Payback analysis
Consider a scenario of solar installation ?This analysis considers tax benefits
for a grid-connected tower with 12 hours to be accruing assuming that the
of load shedding: parent entity has enough PBT to
absorb the tax benefits as they?This analysis does not consider
become applicable each year.removal of DG set due to solar
installation as it is still required for
back up purposes.
Source: KPMG in India’s The Rising Sun, May 2011
Key factors determining viability of solar PV for Telecom Tower
Key Factorsdeterminingviability ofsolar PV for
Telecom Tower
Adjacent land availability
?Tower may not be able to
support wind load bearing PV
modules
?Land availability may be a
constraint in congested areas
Tower Configuration
?Tower’s power requirement
proportional to number of
tenants and its feasibility for PV
may change based on that
Radiation Intensity
?Capital requirement for PV is
inversely proportional to solar
radiation intensity
Design Innovation
?Design Innovations e.g better
insulation for BTS shelter leading
to lower AC usage can lend
viability
Capital Cost and Subsidy
?Capital cost of PV modules and
supporting equipments is key to
cost-benefit analysis
?
CDM incentive/Capital subsidyhelps the case
System Integrators as Enablers
?System Integrators can offer:
?Customizations
?Warranties/aftersales
services
?Options-e.g Buy vs Lease
© 2011 KPMG, an Indian Partnership and a member firm of the KPMG network of independent member firms affiliated with KPMG International Cooperative (“KPMG International”), a Swiss entity. All rights reserved.
THE RISING SUN69
Solar-powered Telecom Towers
are already cost-competitive“”
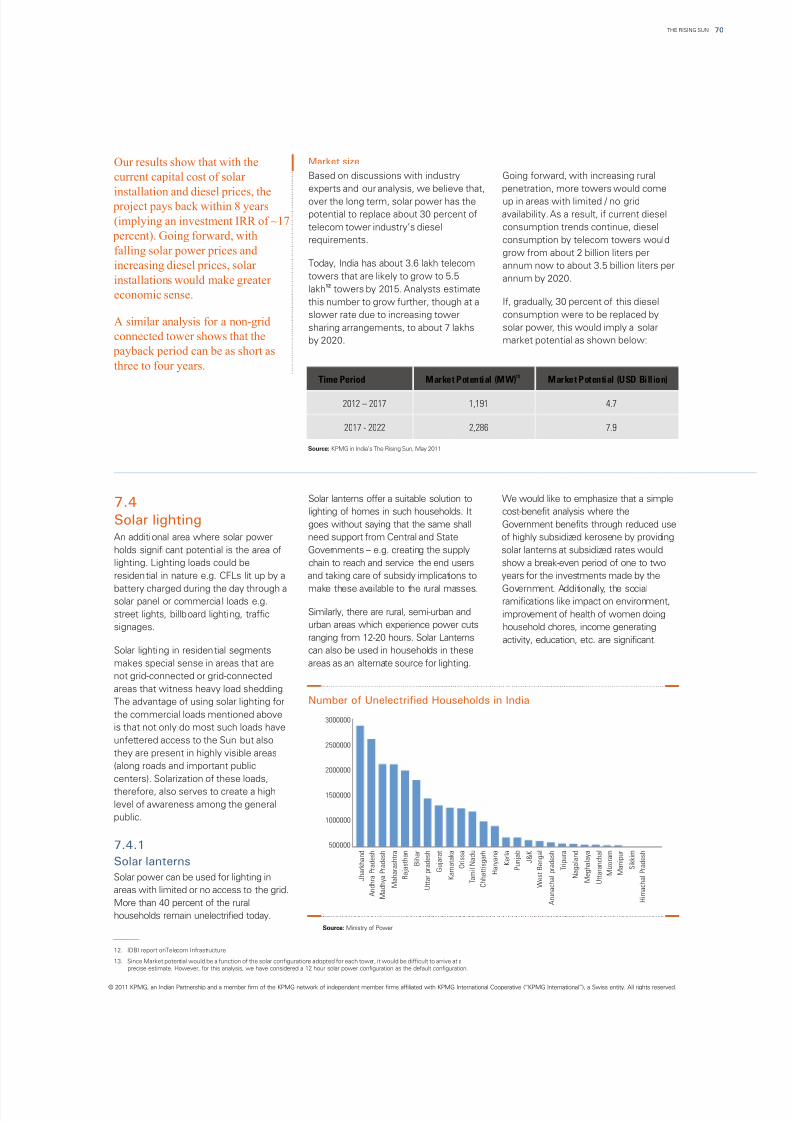
8/3/2019 The Rising Sun Full
http://slidepdf.com/reader/full/the-rising-sun-full 71/96
Market sizeOur results show that with the
current capital cost of solar
installation and diesel prices, the project pays back within 8 years
(implying an investment IRR of ~17
percent). Going forward, with
falling solar power prices and
increasing diesel prices, solar
installations would make greater
economic sense.
A similar analysis for a non-grid
connected tower shows that the
payback period can be as short as
three to four years.
Based on discussions with industry Going forward, with increasing rural
experts and our analysis, we believe that, penetration, more towers would come
over the long term, solar power has the up in areas with limited / no grid
potential to replace about 30 percent of availability. As a result, if current diesel
telecom tower industry’s diesel consumption trends continue, diesel
requirements. consumption by telecom towers would
grow from about 2 billion liters perToday, India has about 3.6 lakh telecom annum now to about 3.5 billion liters pertowers that are likely to grow to 5.5 annum by 2020.
12
lakh towers by 2015. Analysts estimate
this number to grow further, though at a If, gradually, 30 percent of this diesel
slower rate due to increasing tower consumption were to be replaced by
sharing arrangements, to about 7 lakhs solar power, this would imply a solar
by 2020. market potential as shown below:
7.4
Solar lighting
Solar lanterns offer a suitable solution to We would like to emphasize that a simple
lighting of homes in such households. It cost-benefit analysis where the
goes without saying that the same shall Government benefits through reduced use
An additional area where solar power need support from Central and State of highly subsidized kerosene by providing
holds significant potential is the area of Governments – e.g. creating the supply solar lanterns at subsidized rates would
lighting. Lighting loads could be chain to reach and service the end users show a break-even period of one to two
residential in nature e.g. CFLs lit up by a and taking care of subsidy implications to years for the investments made by the
battery charged during the day through a make these available to the rural masses. Government. Additionally, the socialsolar panel or commercial loads e.g. ramifications like impact on environment,
Similarly, there are rural, semi-urban andstreet lights, billboard lighting, traffic improvement of health of women doingurban areas which experience power cutssignages. household chores, income generatingranging from 12-20 hours. Solar Lanterns activity, education, etc. are significant.
Solar lighting in residential segments can also be used in households in these
makes special sense in areas that are areas as an alternate source for lighting.
not grid-connected or grid-connected
areas that witness heavy load shedding.
The advantage of using solar lighting for
the commercial loads mentioned above
is that not only do most such loads have
unfettered access to the Sun but also
they are present in highly visible areas
(along roads and important public
centers). Solarization of these loads,
therefore, also serves to create a high
level of awareness among the general
public.
Solar power can be used for lighting in
areas with limited or no access to the grid.
More than 40 percent of the rural
households remain unelectrified today.
7.4.1
Solar lanterns
© 2011 KPMG, an Indian Partnership and a member firm of the KPMG network of independent member firms affiliated with KPMG International Cooperative (“KPMG International”), a Swiss entity. All rights reserved.
Time Period13
Market Potential (MW) Market Potential (USD Billion)
2012 – 2017 1,191 4.7
2017 - 2022 2,286 7.9
Number of Unelectrified Households in India
Source: Ministry of Power
Source: KPMG in India’s The Rising Sun, May 2011
500000
1000000
1500000
2000000
2500000
3000000
J h a r k h a n d
A n d h r a P r a d e s h
M a d h y a P r a d e s h
M a h a r a s h t r a
R a j a s t h a n
B i h a r
U t t a r p r a d e s h
G u j a r a t
K a r n a t a k a
O r i s s a
T a m i l N a d u
C h h a t t i s g a r h
H a r y a n a
K e r l a
P u n j a b
J & K
W e s t B e n g a l
A r u n a c h a l p r a d e s h
T r i p u r a
N a g a l a n d
M e g h a l a y a
U t t a r a n c h a l
M i z o r a m
M a n i p u r
S i k k i m
H i m a c h a l P r a d e s h
12. IDBI report on Telecom Infrastructure
13. Since Market potential would be a function of the solar configurations adopted for each tower, it would be difficult to arrive at aprecise estimate. However, for this analysis, we have considered a 12 hour solar power configuration as the default configuration.
70THE RISING SUN
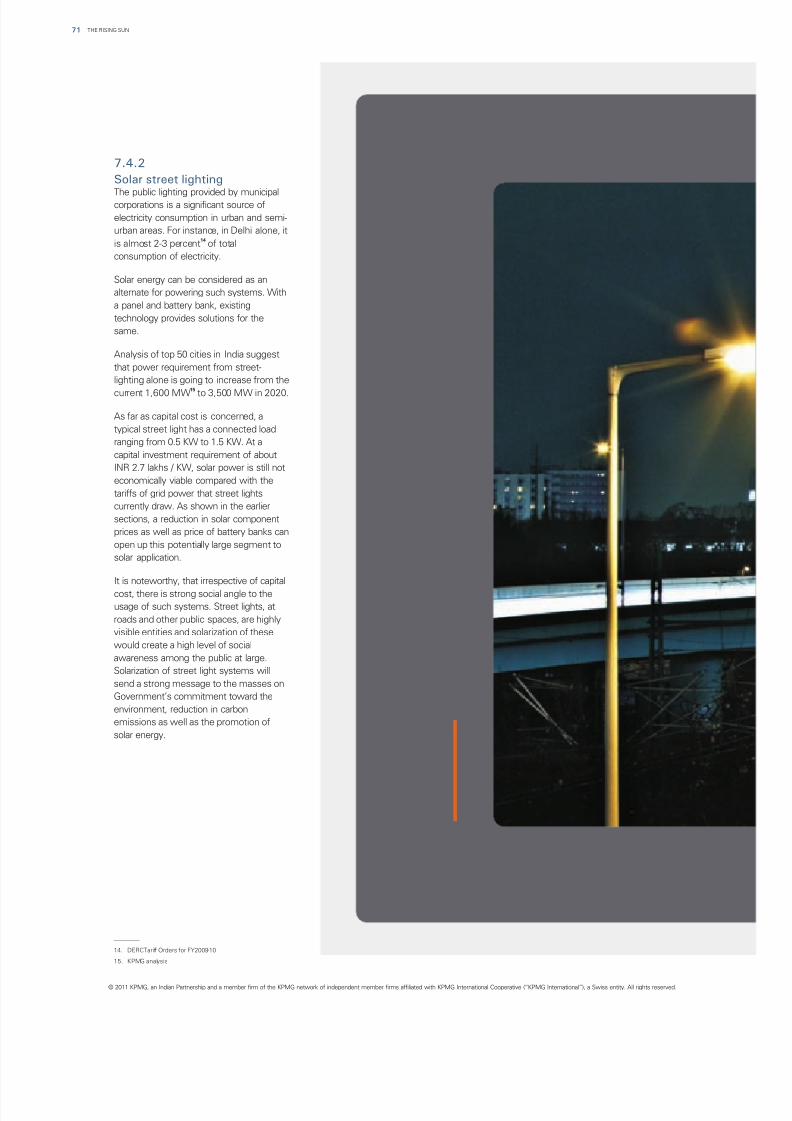
8/3/2019 The Rising Sun Full
http://slidepdf.com/reader/full/the-rising-sun-full 72/96
7.4.2
Solar street lighting
The public lighting provided by municipalcorporations is a significant source of
electricity consumption in urban and semi-
urban areas. For instance, in Delhi alone, it14
is almost 2-3 percent of total
consumption of electricity.
Solar energy can be considered as an
alternate for powering such systems. With
a panel and battery bank, existing
technology provides solutions for the
same.
Analysis of top 50 cities in India suggest
that power requirement from street-
lighting alone is going to increase from the15
current 1,600 MW to 3,500 MW in 2020.
As far as capital cost is concerned, a
typical street light has a connected load
ranging from 0.5 KW to 1.5 KW. At a
capital investment requirement of about
INR 2.7 lakhs / KW, solar power is still not
economically viable compared with the
tariffs of grid power that street lights
currently draw. As shown in the earlier
sections, a reduction in solar component
prices as well as price of battery banks can
open up this potentially large segment to
solar application.
It is noteworthy, that irrespective of capital
cost, there is strong social angle to the
usage of such systems. Street lights, at
roads and other public spaces, are highly
visible entities and solarization of these
would create a high level of social
awareness among the public at large.
Solarization of street light systems will
send a strong message to the masses on
Government’s commitment toward the
environment, reduction in carbon
emissions as well as the promotion of
solar energy.
© 2011 KPMG, an Indian Partnership and a member firm of the KPMG network of independent member firms affiliated with KPMG International Cooperative (“KPMG International”), a Swiss entity. All rights reserved.
THE RISING SUN71
14. DERC Tariff Orders for FY2009-10
15. KPMG analysis
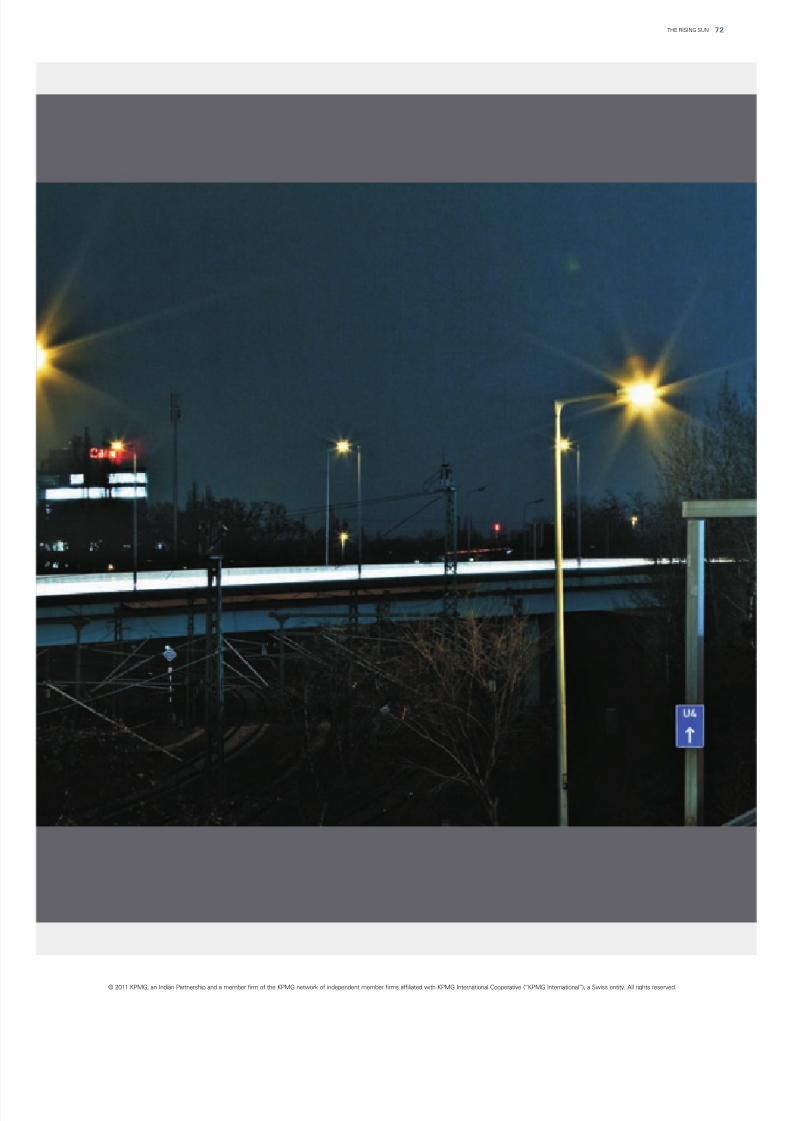
8/3/2019 The Rising Sun Full
http://slidepdf.com/reader/full/the-rising-sun-full 73/96
© 2011 KPMG, an Indian Partnership and a member firm of the KPMG network of independent member firms affiliated with KPMG International Cooperative (“KPMG International”), a Swiss entity. All rights reserved.
72THE RISING SUN
8/3/2019 The Rising Sun Full
http://slidepdf.com/reader/full/the-rising-sun-full 74/96
Economic benefits
from solar market
THE RISING SUN73
© 2011 KPMG, an Indian Partnership and a member firm of the KPMG network of independent member firms affiliated with
KPMG International Cooperative (“KPMG International”), a Swiss entity. All rights reserved.
8/3/2019 The Rising Sun Full
http://slidepdf.com/reader/full/the-rising-sun-full 75/96
08Economic benefitsfrom solar market
74THE RISING SUN
© 2011 KPMG, an Indian Partnership and a member firm of the KPMG network of independent member firms affiliated with KPMG International Cooperative (“KPMG International”), a Swiss entity. All rights reserved.
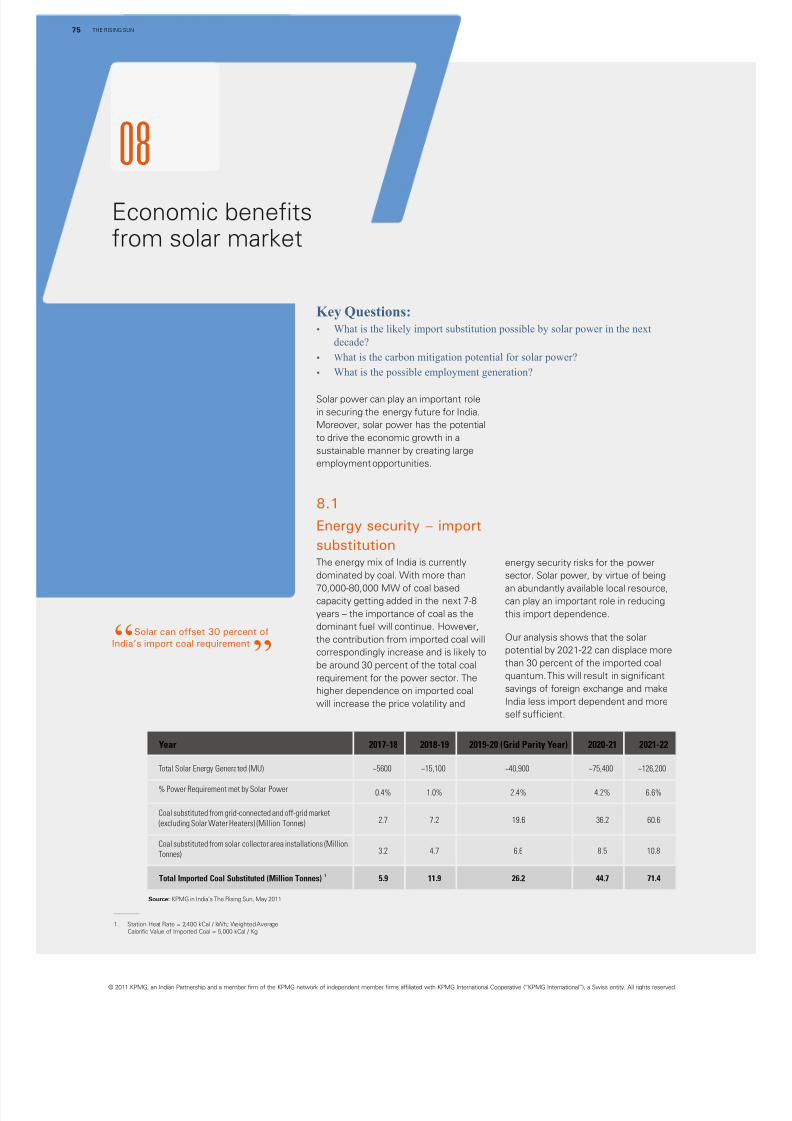
8/3/2019 The Rising Sun Full
http://slidepdf.com/reader/full/the-rising-sun-full 76/96
08
Economic benefitsfrom solar market
© 2011 KPMG, an Indian Partnership and a member firm of the KPMG network of independent member firms affiliated with KPMG International Cooperative (“KPMG International”), a Swiss entity. All rights reserved.
THE RISING SUN75
Key Questions:?What is the likely import substitution possible by solar power in the next
decade?
?What is the carbon mitigation potential for solar power?
?What is the possible employment generation?
Solar power can play an important role
in securing the energy future for India.
Moreover, solar power has the potential
to drive the economic growth in a
sustainable manner by creating large
employment opportunities.
The energy mix of India is currently energy security risks for the power
dominated by coal. With more than sector. Solar power, by virtue of being
70,000-80,000 MW of coal based an abundantly available local resource,capacity getting added in the next 7-8 can play an important role in reducing
years – the importance of coal as the this import dependence.
dominant fuel will continue. However,Our analysis shows that the solarthe contribution from imported coal willpotential by 2021-22 can displace morecorrespondingly increase and is likely tothan 30 percent of the imported coalbe around 30 percent of the total coalquantum. This will result in significantrequirement for the power sector. Thesavings of foreign exchange and makehigher dependence on imported coalIndia less import dependent and morewill increase the price volatility andself sufficient.
8.1
Energy security – import
substitution
Year 2017-18 2018-19 2019-20 (Grid Parity Year) 2020-21 2021-22
Total Solar Energy Generated (MU) ~5600 ~15,100 ~40,900 ~75,400 ~126,200
% Power Requirement met by Solar Power 0.4% 1.0% 2.4% 4.2% 6.6%
Coal substituted from grid-connected and off-grid market
(excluding Solar Water Heaters) (Million Tonnes) 2.7 7.2 19.6 36.2 60.6
Coal substituted from solar collector area installations (Million
Tonnes) 3.2 4.7 6.6 8.5 10.8
1Total Imported Coal Substituted (Million Tonnes) 5.9 11.9 26.2 44.7 71.4
1. Station Heat Rate = 2,400 kCal / kWh; Weighted Average
Calorific Value of Imported Coal = 5,000 kCal / Kg
Source: KPMG in India’s The Rising Sun, May 2011
Solar can offset 30 percent of
India’s import coal requirement“ ”
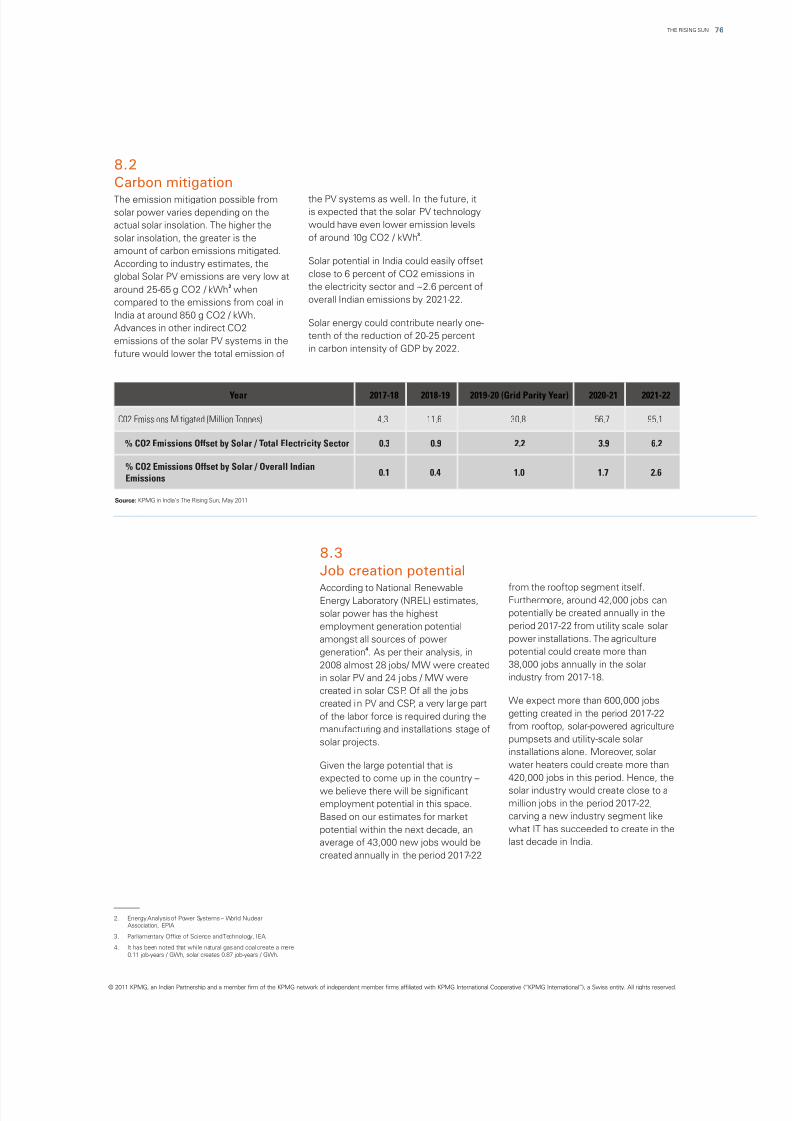
8/3/2019 The Rising Sun Full
http://slidepdf.com/reader/full/the-rising-sun-full 77/96
8.2
Carbon mitigation
the PV systems as well. In the future, itThe emission mitigation possible from
is expected that the solar PV technologysolar power varies depending on the
would have even lower emission levelsactual solar insolation. The higher the3
of around 10g CO2 / kWh .solar insolation, the greater is the
amount of carbon emissions mitigated.Solar potential in India could easily offsetAccording to industry estimates, theclose to 6 percent of CO2 emissions inglobal Solar PV emissions are very low at
2 the electricity sector and ~2.6 percent ofaround 25-65 g CO2 / kWh whenoverall Indian emissions by 2021-22.compared to the emissions from coal in
India at around 850 g CO2 / kWh.Solar energy could contribute nearly one-
Advances in other indirect CO2tenth of the reduction of 20-25 percent
emissions of the solar PV systems in thein carbon intensity of GDP by 2022.
future would lower the total emission of
© 2011 KPMG, an Indian Partnership and a member firm of the KPMG network of independent member firms affiliated with KPMG International Cooperative (“KPMG International”), a Swiss entity. All rights reserved.
76THE RISING SUN
8.3
Job creation potential
from the rooftop segment itself.According to National RenewableFurthermore, around 42,000 jobs canEnergy Laboratory (NREL) estimates,
potentially be created annually in thesolar power has the highest
period 2017-22 from utility scale solaremployment generation potential
power installations. The agricultureamongst all sources of power4 potential could create more thangeneration . As per their analysis, in
38,000 jobs annually in the solar2008 almost 28 jobs/ MW were created
industry from 2017-18.in solar PV and 24 jobs / MW were
created in solar CSP. Of all the jobsWe expect more than 600,000 jobscreated in PV and CSP, a very large partgetting created in the period 2017-22of the labor force is required during thefrom rooftop, solar-powered agriculturemanufacturing and installations stage ofpumpsets and utility-scale solarsolar projects.installations alone. Moreover, solar
water heaters could create more thanGiven the large potential that is
420,000 jobs in this period. Hence, theexpected to come up in the country –
solar industry would create close to awe believe there will be significant
million jobs in the period 2017-22,employment potential in this space.
carving a new industry segment likeBased on our estimates for market
what IT has succeeded to create in thepotential within the next decade, an
last decade in India.average of 43,000 new jobs would be
created annually in the period 2017-22
Year 2017-18 2018-19 2019-20 (Grid Parity Year) 2020-21 2021-22
C02 Emissions Mitigated (Million Tonnes) 4.3 11.6 30.8 56.7 95.1
% CO2 Emissions Offset by Solar / Total Electricity Sector 0.3 0.9 2.2 3.9 6.2
% CO2 Emissions Offset by Solar / Overall IndianEmissions
0.1 0.4 1.0 1.7 2.6
2. Energy Analysis of Power Systems – World NuclearAssociation, EPIA
3. Parliamentary Office of Science and Technology, IEA.
4. It has been noted that while natural gas and coal create a mere
0.11 job-years / GWh, solar creates 0.87 job-years / GWh.
Source: KPMG in India’s The Rising Sun, May 2011

8/3/2019 The Rising Sun Full
http://slidepdf.com/reader/full/the-rising-sun-full 78/96
Steps to be taken to enable
the market transition
THE RISING SUN77
© 2011 KPMG, an Indian Partnership and a member firm of the KPMG network of independent member firms affiliated with
KPMG International Cooperative (“KPMG International”), a Swiss entity. All rights reserved.

8/3/2019 The Rising Sun Full
http://slidepdf.com/reader/full/the-rising-sun-full 79/96
09Steps to betaken to enable
the market transition
78THE RISING SUN
© 2011 KPMG, an Indian Partnership and a member firm of the KPMG network of independent member firms affiliated with KPMG International Cooperative (“KPMG International”), a Swiss entity. All rights reserved.
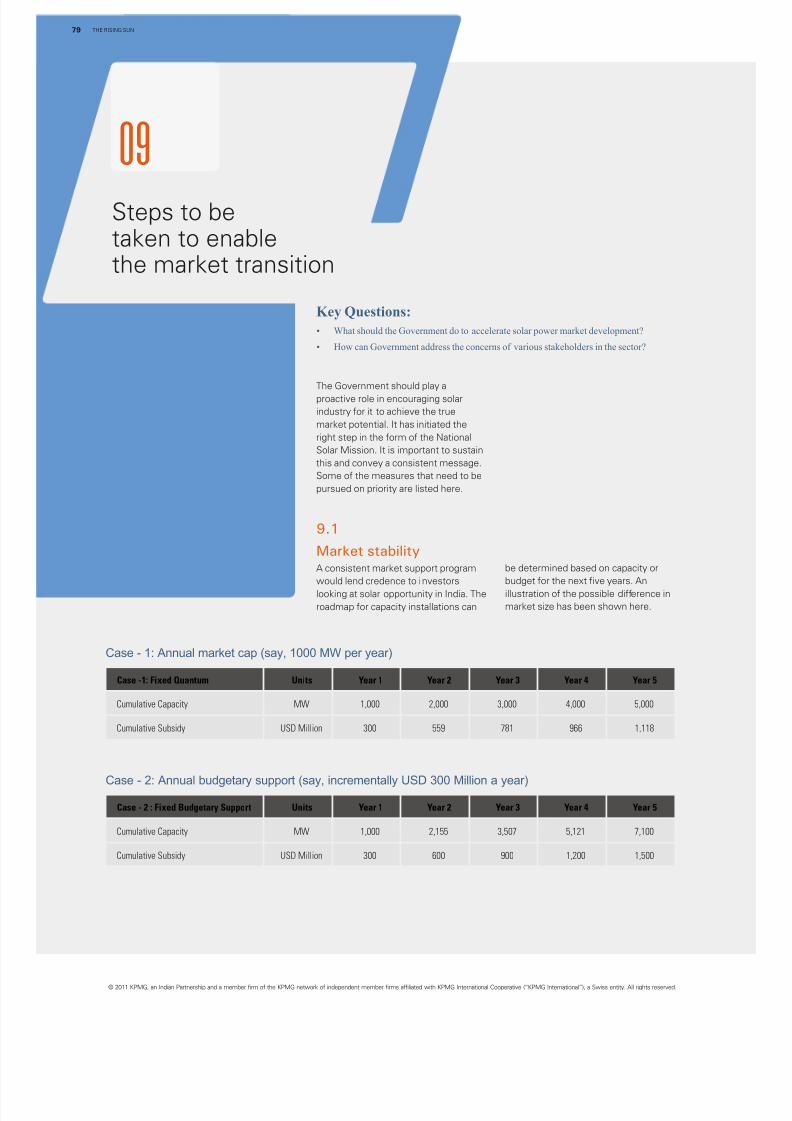
8/3/2019 The Rising Sun Full
http://slidepdf.com/reader/full/the-rising-sun-full 80/96
09
Steps to betaken to enablethe market transition
© 2011 KPMG, an Indian Partnership and a member firm of the KPMG network of independent member firms affiliated with KPMG International Cooperative (“KPMG International”), a Swiss entity. All rights reserved.
Key Questions:
?What should the Government do to accelerate solar power market development?
?How can Government address the concerns of various stakeholders in the sector?
The Government should play a
proactive role in encouraging solar
industry for it to achieve the true
market potential. It has initiated the
right step in the form of the National
Solar Mission. It is important to sustain
this and convey a consistent message.
Some of the measures that need to be
pursued on priority are listed here.
A consistent market support program be determined based on capacity or
would lend credence to investors budget for the next five years. An
looking at solar opportunity in India. The illustration of the possible difference in
roadmap for capacity installations can market size has been shown here.
9.1
Market stability
Case -1: Fixed Quantum Units Year 1 Year 2 Year 3 Year 4 Year 5
Cumulative Capacity MW 1,000 2,000 3,000 4,000 5,000
Cumulative Subsidy USD Million 300 559 781 966 1,118
Case - 1: Annual market cap (say, 1000 MW per year)
Case - 2: Annual budgetary support (say, incrementally USD 300 Million a year)
Case - 2 : Fixed Budgetary Support Units Year 1 Year 2 Year 3 Year 4 Year 5
Cumulative Capacity MW 1,000 2,155 3,507 5,121 7,100
Cumulative Subsidy USD Million 300 600 900 1,200 1,500
THE RISING SUN79
8/3/2019 The Rising Sun Full
http://slidepdf.com/reader/full/the-rising-sun-full 81/96
© 2011 KPMG, an Indian Partnership and a member firm of the KPMG network of independent member firms affiliated with KPMG International Cooperative (“KPMG International”), a Swiss entity. All rights reserved.
As can be noted from these illustrations welcome. Banks on their part should solar projects. One key challenge here is
– the quantum of capacity that can be spend enough resources to understand the transparency / information availability
supported by a fixed budget increases this sector well, since the strategic about the projects and developers in the
over the years, since the cost curves for implications for the country are large and solar sector. To mitigate this, a risk rating
solar power are decreasing. The this sector provides an enormous mechanism needs to be developed that
Government should devise the roadmap funding opportunity in the coming provides rating to the solar projects and
based on its ability to support subsidy. It decade. developers and will play an important
may be mentioned here that higher role in reducing the risk perception of theSecond, is the ability of State utili ties tocapacity additions will lead to a faster sector.afford the bundled power. Given thelearning curve effect.financial constraints of the State utilities,
Here, the German model, which provides affordability can be a challenge. We
a market feed-in-tariff for a given period, understand that there is some comfortThere is a need to devise a crediblemakes for a good case study. The being provided by the Centralfunding plan to support market creation.German Feed-in-Tariff (FIT) Law Government to provide a back-stop in theThis is important to provide assurance toguarantees consumers tariff for 20 years event the states default. However, wemarket participants to realize moneyafter they are connected to the grid. This would urge one step further to be takenfrom this industry. At present, thetariff is lowered at a constant rate (the in this regard through utilization of the
burden of solar subsidy has beenrate is predetermined and does not National Clean Energy Fund to support delegated, to a large extent, onto thechange over the term of the existing 20 states directly for solar power purchasepower utilities, as they are the ultimateyear contract). Depending on the as is explained later.buyers of this power. State powerresponse of consumers, the tariff rate for
Third, is the issue relating to sector utilities are already under severe financialthe next time period is dynamicallyspecific exposure limits on lending. strain. This puts the entire solar programchanged. If the market gets anBanks have internal sectoral cap / at jeopardy as the bankers are unsureoverwhelming response, then the FITexposure limits for each sector. A about the ability of the power utilities torate for the next year for new contractsseparate solar/renewable energy sector foot the bill.changes such that it is inverselyspecific exposure/cap can go a long wayproportional to that response. However,
While the creation of the National Cleanin increasing the pool of financialif the response is lower than desired,Energy Fund through a levy of cess onresources for solar sector. Further, giventhen the FIT rate is raised in order tocoal at the rate of INR 50 per ton is athe importance of energy security andattract more consumers. This dynamicstep in the right direction, it is importantcarbon mitigation potential, lending toFIT rate stabilizes the rise in demand. Tillthat the State utilities are providedsolar/renewable sectors should bedate, the response has always beenfinancial support from this fund. Specificclassified as ‘priority sector’.higher than expected and hence, thebudgetary allocation/grants from thetariff is being lowered. This constant
Fourth, is the issue of asset liability Central Government to the State utilitiesdecline in tariff ensures innovation andmismatch. Banks typically depend on for meeting solar power purchaserapid growth in the solar sector.deposits with tenures of around 2-3 obligations would come in handy for the
years, while the financing requirements cash strapped utilities.
for solar sector would be of longerThe State utilities should focus ontenures of up to 15 years. Here, debtdeveloping a financing mechanism thatmobilization through say - long tenure taxreduces the burden on the Statefree solar bonds - can go a long way inexchequer. Creation of a State Cleanproviding access to low cost debt forEnergy Fund with focus on solar sectordevelopers. This can address thecould lend credibility to projectinherent asset liability mismatch of the
Availability of credit to the developers for developers. The budget of the fund couldbanking system and lend stability to thefinancing solar projects is critical for the be met through options such as cess oninterest rates charges on developers.success of solar program in India. The electricity consumption within the State,This issue is similar to what is being
lending community should be adequately raising funds through solar bonds etc.faced in other infrastructure sectors.equipped to understand the sector and The state of Gujarat has already initiated
play an active role in supporting it. From Fifth, is relaxation of ECB norms. The this measure.
a lending perspective, there are some Government has permitted eligible
concerns relating to the solar sector. borrowers in the telecommunication
sector to avail themselves of ECB routeFirst is technology. The technology is for payment of spectrum fees. Further,relatively new and there are not enough the relaxed norms permit the bidders toexamples that prove the performance of For wider acceptance of solar powerraise rupee funds from domesticsolar plants from an Indian context. among consumers, especially small-markets and these rupee funds can beHere, education of the banks is the need scale applications segment like solarrefinanced through ECB’s at a later date.of the hour. The Government has initiated water heaters, the high one timeA similar relaxation can be provided forsteps in this direction and this move is investment is a potential deterrent.
9.2
Credible funding plan
9.2.2
Support to states
9.2.1
Support lending community
9.2.3
Support consumer financing
models
80THE RISING SUN
8/3/2019 The Rising Sun Full
http://slidepdf.com/reader/full/the-rising-sun-full 82/96
Innovative financing models that provide the solar energy centre in Gurgaon. This
funding access to small-scale end user is a step in the right direction.
segments can potentially enlarge the
Investments in renewable R&D aremarket size. Government can encourageimportant to accelerate the costfinancial institutions for onward lendingreduction trajectory. R&D efforts withat affordable rates to kick–start thefocus on cost reduction, gridsmall-scale applications market.interconnection and energy storage are
critical to enable large-scale deploymentSolar power can potentially transform the
of solar power solutions. Furthermore,agriculture segment by meeting its
specific research that meets the localpower requirements optimally. It will be
demand conditions is the need of thea win-win situation for all stakeholders -
hour.provides power access to the farmers
when it is required the most; results inThere are some key issues that shouldTo support market creation efforts, it is savings in power purchase costs andbe addressed to facilitate India’s rise as aimportant to enforce solar purchase network maintenance costs for powerglobal R&D hub for solar powerobligations and take appropriate action utilities; and controls over spiralingtechnologies.where the obligations are not met. The power subsidy for the Government.
solar mission already lists down the First, improve coordination of R&D workThe need of the hour is a workabletrajectory linked to power consumption, in renewable energy technologies. This ismodel that brings in innovation andgradually increasing from 0.25 percent to important to help maximize efficiencymeets the local requirements. The3 percent by 2022. This enforcement has and minimize duplication of R&D efforts.workable model needs to have theto happen at the state level by state Today, there are many academic andfollowing elements –regulators. research institutes doing research but
there is lack of coordination about who is ?A technically viable solution underThis will ensure that the base market doing what. A coordinated R&D field conditionswhich is required to build the necessary approach which involves all key
?Assurance of large scale off take toeconomies of scale will come up. This stakeholders is the need of the hour.manufacturers to bring down costwill also facilitate setting-up of a solar
eco-system in the country. Besides the Second, take steps to further increase ?Farmer awareness and educationaforementioned benefits, the REC private sector participation in R&D. There about the benefitsmarket will get the required boost is a need for higher involvement of
?A delivery model that can install andresulting in new capacities being market private sector in R&D for solar power
service the equipment at large scale
driven. technologies. For example, solar power – an ESCO model can be a potentialis ideally suited to meet many off-grid
solution.Further, solar power can be mandated for market applications. Public Privatesuch end-use applications where solar Government should start with a pilot onPartnerships (PPP) with market orientedpower is economical when compared to PPP basis and this should then beR&D efforts can go a long way inthe alternative fuel options. For example, considered for large scale up.accelerating India’s progress as an R&Ddiesel generation sets are deployed for hub. Besides communicating industrymeeting the power requirement of R&D priorities for research focus, PPP 9.5.2telecom towers. In such instances, a results in faster technology transfer back Solar water heatingmandate to use solar power in a to industry.
Some of the measures that can becalibrated manner can help in marketundertaken to promote deployment ofcreation besides emission savings. Third, an R&D life cycle managementsolar water heating systems are
approach that monitors the transition ofmentioned below:
projects from the research stage to
commercial deployment is required. ?Consumer financing / prevalence of
ESCO models to take the higherFinally, a solar R&D mission which upfront capital cost burden off thearticulates the framework for consumers. This step can make SWHcollaborative research consisting of all applications more popular in areasstakeholders is the need of the hour. An with lower dependence on hot waterThe Government has already takenexample of a goal could be to “achieve a (say less than 8 months) as well.several proactive measures to promotecost of storage system of INR 0.50-1.00 /
R&D in renewable energy technologies. ?Mandatory building byelaws bykWh for a particular size and type of
The Ministry of New and Renewable Central / State Governments andstorage in Indian condit ions”. There is a
Energy has given a mandate to IIT ensuring compliance – of specialneed for higher involvement of private
Jodhpur to set-up a Centre of Excellence relevance to multistory buildingssector in R&D efforts.
to complement the existing facilities at
9.5
Focus on off-grid market
applications
9.3
Enforce solar purchase
obligations
9.4
Investments in R&D –
PPP models
9.5.1
Agriculture segment
THE RISING SUN81
© 2011 KPMG, an Indian Partnership and a member firm of the KPMG network of independent member firms affiliated with KPMG International Cooperative (“KPMG International”), a Swiss entity. All rights reserved.

8/3/2019 The Rising Sun Full
http://slidepdf.com/reader/full/the-rising-sun-full 83/96
where individual houses do not have
clear rooftop access. Rational
method of distribution of limited
water output acts as a barrier today.
?Better subsidy administration – an
improvement in our view could be to
deliver subsidies directly to Globally, solar manufacturing industry is
consumers rather than to dominated by China and is highly
manufacturers. This can incentivize competitive. Chinese companies are
market growth without necessarily global cost leaders due to the highly
distorting the market. favorable policies that exist there.
Chinese companies have access to large?Increased awareness of SWH and
credit facilities at low interest rates fromsubsidies available – While subsidies
domestic state-owned banks to expandsuch as rebate on electricity bill are
manufacturing capacities besides accesswell known, people are not aware of
to low cost labour. In the US, given theother subsidies like reduction of
potential for the industry to generatehouse tax etc that exist in some
jobs, the US Government has recently
parts of the country. announced a tax credit policy to?Focus on developing model cities on encourage solar manufacturing industry.
a pilot basis – While Bangalore has
emerged as a role model for other Governments at the State and Central
parts of the country to follow, it is level should actively support
also considered as a city where all development of solar manufacturing
the elements (water requirement industry in India. Some options for
duration during the year, Government consideration include: Facilitate access
incentives, SWH manufacturing to long term low cost loans; Duty
supply chain) fall in place. More cities exemptions for imports of raw material /
need to be taken up across the intermediary equipments; Provide tax
country on a pilot basis by Central / concessions similar in nature to what
State Governments and incentivized was provided for the IT industry.
to install SWH. This will not only
In addition, the State Governments couldspread broader awareness at a
identify potential sites for developingcountry level but also strengthen solar parks with all the basicSWH supply chain in areas where it
infrastructure in-place. Steps need to beis currently missing or is fragmented.
initiated that reduce time delays in
getting project approvals.
9.6
Provide incentives for
solar manufacturing
industry
82THE RISING SUN
© 2011 KPMG, an Indian Partnership and a member firm of the KPMG network of independent member firms affiliated with KPMG International Cooperative (“KPMG International”), a Swiss entity. All rights reserved.

8/3/2019 The Rising Sun Full
http://slidepdf.com/reader/full/the-rising-sun-full 84/96
Investment opportunities
for the Indian Industry
© 2011 KPMG, an Indian Partnership and a member firm of the KPMG network of independent member firms affiliated with
KPMG International Cooperative (“KPMG International”), a Swiss entity. All rights reserved.
THE RISING SUN83

8/3/2019 The Rising Sun Full
http://slidepdf.com/reader/full/the-rising-sun-full 85/96
10Investment opportunitiesfor the Indian Industry
© 2011 KPMG, an Indian Partnership and a member firm of the KPMG network of independent member firms affiliated with KPMG International Cooperative (“KPMG International”), a Swiss entity. All rights reserved.
84THE RISING SUN
8/3/2019 The Rising Sun Full
http://slidepdf.com/reader/full/the-rising-sun-full 86/96
10
Investmentopportunities for theIndian Industry
Key Questions:
?What should be the key imperatives in the near term?
?What is the potential investment opportunity – services & material supply for private
sector in the next 5-10 years?
10.1Imperatives for the near
termFor mainstream solar companies, we applications and other renewable
believe that the following are the key technologies in their portfolio. This
imperatives in the near term: will enable them to optimize their
resources in an environment where?Since there is intense competition access to new projects may be
among the players to get access to uncertain.projects which are limited in
number, it is necessary to work out ?Indian companies should also look
a model which gives a cost at overseas solar markets in the US
advantage and thereby enables a and Europe for access to projects.
higher chance of winning projects. In the immediate future, these
Sources of cost advantage could be markets will offer more
a certain level of vertical integration opportunities and help Indian
into the manufacturing or EPC value companies to move up the learning
chain, access to land sites where curve and be poised to capitalize on
solar insolation is superior and the Indian market when it scales up
access to low cost financing. rapidly.
?Solar companies should also keep a
slightly broad-based focus and
include segments like off-grid
© 2011 KPMG, an Indian Partnership and a member firm of the KPMG network of independent member firms affiliated with KPMG International Cooperative (“KPMG International”), a Swiss entity. All rights reserved.
THE RISING SUN85

8/3/2019 The Rising Sun Full
http://slidepdf.com/reader/full/the-rising-sun-full 87/96
© 2011 KPMG, an Indian Partnership and a member firm of the KPMG network of independent member firms affiliated with KPMG International Cooperative (“KPMG International”), a Swiss entity. All rights reserved.
10.2
Investment opportunity
for the futureare a multitude of applications that haveThe Indian industry has proved itssignificant market potential and cancompetence globally throughtransform the energy scenario of thecompetitiveness in sectors such as ITcountry. The investment required in theand automobile. India needs solar powersector over the next decade isand this sector requires innovation tosummarized here:make it happen on a large scale. There
86THE RISING SUN
Solar Investments (In USD Billion) 2012-17 2017-22
Small-scale Solar Market (Rooftops, Agriculture Pumpsets, Telecom) 5 64
Utility-scale Solar Farms (CSP and PV) 15 28
Cumulative Investments Required in five-year periods 20 92
Solar Specific Vendor Market (In USD Billion) 2012-17 2017-22
Solar PV Segment
Inverter Market 1.8 12.3
Sub-total PV Vendor Market Potential 1.8 12.3
Solar CSP Segment
Parabolic Troughs 0.6 1.8
Mirrors 0.4 1.2
Sub-total CSP Vendor Market Potential 1.0 3.0
Total Solar Specific Vendor Market Potential 2.8 15.3
Non-Solar Specific Vendor Market (In USD Billion) 2012-17 2017-22
Solar PV Segment
EPC Services Market 1.5 7.5
Sub-total PV Vendor Market Potential 1.5 7.5
Solar CSP Segment
EPC Services Market 0.5 1.6
Civil Works 0.2 0.6
Sub-total CSP Vendor Market Potential 0.7 2.2
Total Non-Solar Specific Vendor Market Potential 2.2 9.7
This would develop the vendor market which is as detailed in the table below:
In addition, the potential in the non solar-specific vendor market which includes items
common with other industries is as shown below:
Source: KPMG’s Solar Market Size Model
Source: KPMG’s Solar Market Size Model
Source: KPMG’s Solar Market Size Model
8/3/2019 The Rising Sun Full
http://slidepdf.com/reader/full/the-rising-sun-full 88/96
Further, some of the potential creating user applications with solar
investment and innovation opportunities power. This includes areas like powering
are cited below: telecom towers, solar heating
applications in Industry, solar-poweredOne, cost effective storage solutions can agriculture pumpsets, etc. Companiestransform solar from being a marginal which can evolve suitable businesssource to a frontline source of energy. models to address this market canThis will have an exponential impact on achieve significant scale as the market isthe market potential and opportunity. At very large.present, there are multiple technology
options with high costs. Given the fact Finally, significant human resource
that costs of solar power are on a steady capacity building is required in the solar
decline, it is an opportune time for sector. The solar sector is still at a
investments in storage technologies that nascent stage. Given the market
can provide stability to solar power potential, the capabilities of the industry
supply. need to be built. There will be demand
for skilled manpower to construct andTwo, the extent of localization of solar operate solar power plants. A millionsystem installations could determine the
direct jobs are likely to be created bypace of cost reduction trajectory. Going 2021-22. Collaboration with trainingforward, the non-module system costs institutes and research organizations(inverters, switchgear, and other could go a long way in bridging the skillelectrical equipment) will form a higher gap.share of total solar system costs than
module costs. For example, at present In conclusion, the solar sector has the
inverters are not manufactured in India. potential to transform the Indian
With the growing market potential, there economy in a way the IT sector
will be higher demand for quality transformed the Indian economy during
inverters. Technology tie-ups and local the 90s. Industry should grab this golden
manufacturing could potentially reduce opportunity, thus benefiting themselves
costs of inverters. and the overall economy.
Three, is the opportunity to set up solar
manufacturing capacity to meet the
Indian and global solar market demand.Solar manufacturing industry is a global
industry with aggressive cost reduction
trajectories. Here, the ability to be the
lowest cost manufacturer becomes the
critical success factor. While the
manufacturing segment is scale
sensitive and global cost leaders have
emerged in other parts of the world
notably China, we believe India can offer
a large market in the next five years. Yet,
Indian manufacturers will have to depend
on a mix of domestic and export markets
to make the business case for entry into
this space in the medium term.
Companies wanting to enter this areashould contemplate on the right
business model in terms of scale, level
of integration and partnerships for global
market access and technology to make
this proposition viable.
Fourth, we believe that significant
opportunities exist in the downstream
space comprising system integration and
© 2011 KPMG, an Indian Partnership and a member firm of the KPMG network of independent member firms affiliated with KPMG International Cooperative (“KPMG International”), a Swiss entity. All rights reserved.
THE RISING SUN87
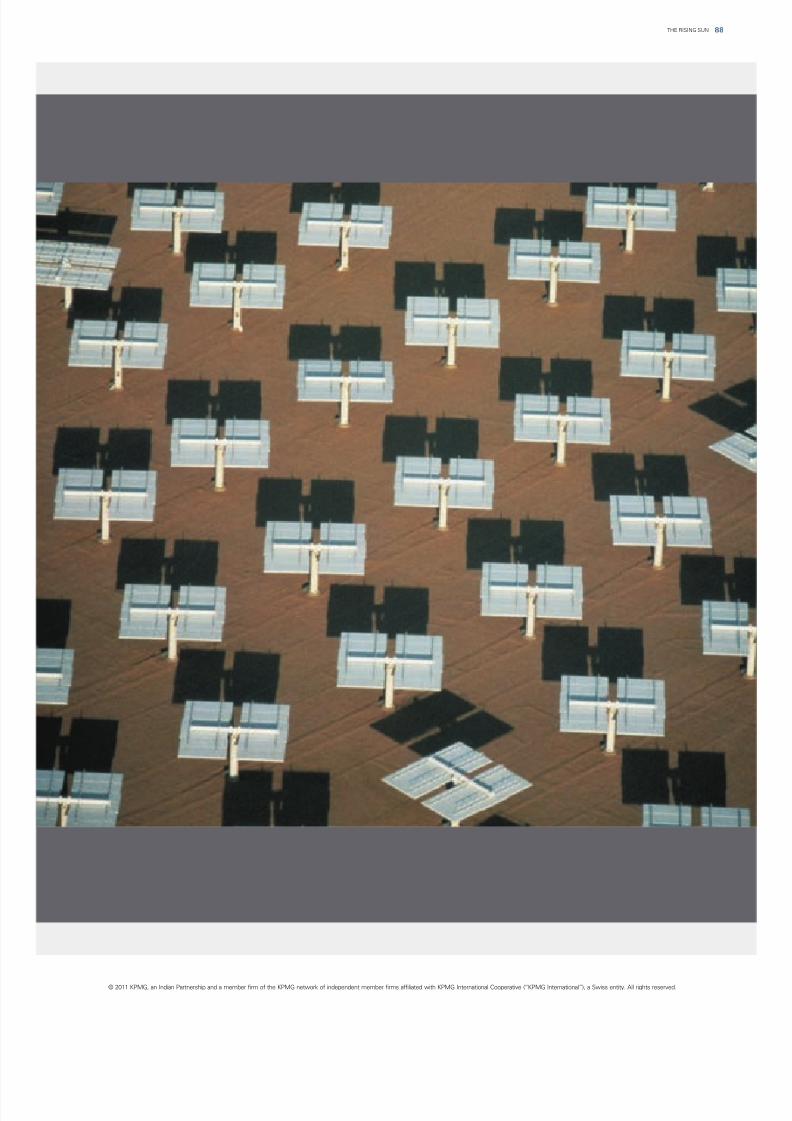
8/3/2019 The Rising Sun Full
http://slidepdf.com/reader/full/the-rising-sun-full 89/96
© 2011 KPMG, an Indian Partnership and a member firm of the KPMG network of independent member firms affiliated with KPMG International Cooperative (“KPMG International”), a Swiss entity. All rights reserved.
88THE RISING SUN

8/3/2019 The Rising Sun Full
http://slidepdf.com/reader/full/the-rising-sun-full 90/96
Appendix - Taxation
© 2011 KPMG, an Indian Partnership and a member firm of the KPMG network of independent member firms affiliated with
KPMG International Cooperative (“KPMG International”), a Swiss entity. All rights reserved.
THE RISING SUN89
8/3/2019 The Rising Sun Full
http://slidepdf.com/reader/full/the-rising-sun-full 91/96
11Appendix - Taxation
© 2011 KPMG, an Indian Partnership and a member firm of the KPMG network of independent member firms affiliated with KPMG International Cooperative (“KPMG International”), a Swiss entity. All rights reserved.
90THE RISING SUN
8/3/2019 The Rising Sun Full
http://slidepdf.com/reader/full/the-rising-sun-full 92/96
11
The sun is shining bright for players in the solar sector so
far as the incentives are concerned.
11.1
Tax and fiscal incentivesThere are many tax incentives available Government has given variousto the solar sector in India. incentives on setting up the solarUndertakings engaged in generation or power project which includesgeneration and distribution of power exemption from customs and excisehave been offered a 10-year tax holiday duties on specific goods required forfor solar plants if it begins to generate setting up the solar power projects.power before 31.03.2012. However, these exemptions are subject
to fulfillment of prescribed conditionsPost 31.03.2012, new Direct Tax Code is
and compliances to be undertaken bylikely to be effective which provides for
the EPC contractor or IPP.expenditure based incentive to
business of generation, transmission or Furthermore, some of the statedistribution of power. As regards this governments have provided theincentive, all revenue and capital incentives in the form of levy of VAT at
expenditure will be allowed as tax reduced rate (i.e. 5 percent) whereasdeduction upfront instead of claiming the other states levies VAT @ 12.5amortisation / depreciation on the percent.capital expenditure.
Given the vast variety of tax and fiscalIndirect tax cost forms a substantial incentives available, one needs topart of the overall EPC Project cost, quantify the tax cost and explore thewhich ranges from 10 percent to 20 structuring options, before investingpercent of the total solar project cost. into the solar sector.Considering the special focus on
renewable energy, the Central
© 2011 KPMG, an Indian Partnership and a member firm of the KPMG network of independent member firms affiliated with KPMG International Cooperative (“KPMG International”), a Swiss entity. All rights reserved.
THE RISING SUN91
Appendix - Taxation
8/3/2019 The Rising Sun Full
http://slidepdf.com/reader/full/the-rising-sun-full 93/96
© 2011 KPMG, an Indian Partnership and a member firm of the KPMG network of independent member firms affiliated with KPMG International Cooperative (“KPMG International”), a Swiss entity. All rights reserved.
11.2
Tax planningAt the outset, for a player based The selection of schemes for payment of
overseas, entry strategy would carry a indirect tax liability on construction of
lot of importance. In order to achieve tax solar power plant offers various tax
efficiency with regard to taxability of planning avenues for solar power project.
gains on sale of shares, many companies Furthermore, the above scheme has
opt to route the investments through an various attributes which sometime
intermediate entity in a tax friendly becomes cumbersome to comply (i.e.
jurisdiction. restriction on procurement of goods
outside the state etc).Typically, solar companies in India
procure the equipment and services The manner of procurement of goods
from overseas i.e. offshore supply and and supply chain structuring plays vital
services. In such a scenario, contract role in the solar power project costs,
structuring from a tax perspective help since the tax rates are different for
Solar companies upfront achieve major procurement of goods from outside
tax efficiency. Further, in case of multiple India, from other state and from theparties coming together and bidding as a same state.
consortium, contract structuring
Generally, EPC contractor alsoassumes deep importance to avoid the
undertakes operation and maintenancerisk of the consortium being taxed as an
of solar power plant. The taxability ofAssociation of persons.
O&M contract has been subject matter
In India, based on the nature of of disputes in various decisions.
operation, different forms of entity could
The exemption provided under thebe established in India. Operating
customs and excise act are subject tothrough a Limited Liability Company i.e.
various conditions and compliances.by forming a Joint Venture/ Wholly
Hence, it is utmost important to ensureowned subsidiary could be one of the
compliance of the respective conditionspossible options in a situation where the
as otherwise the benefits envisaged mayforeign company is looking at a long term
not be available.presence in India. However, one needsto rule out other forms before
The proposed introduction of ‘Goods andconcluding.Services Tax’ will also play a major role in
the costing of solar power project as theFurther, solar sector being a capital
government intends to limit the variousintensive sector, investing companies
exemptions available to solar powerwould need to strategise the options
project.available for funding the project vis-à-vis
the repatriation of profits/ return onGiven the vast variety of tax and fiscalinvestments.incentives available, one needs to
quantify the tax cost and explore theHence, various tax planning avenues
structuring options, before planning thecould be explored by the solar sector
capex, at the tender\bid stage and also atcompanies while planning their
the time of awarding contracts, so thatinvestments in India in solar sector.
tax costs are optimized.
The taxation of EPC contract offersvarious challenges and opportunities.
The EPC Contract can be structured as a
single contract or divisible contracts. The
selection of the any of the above option
causes a huge impact on the indirect tax
costs and working capital of the project.
92THE RISING SUN
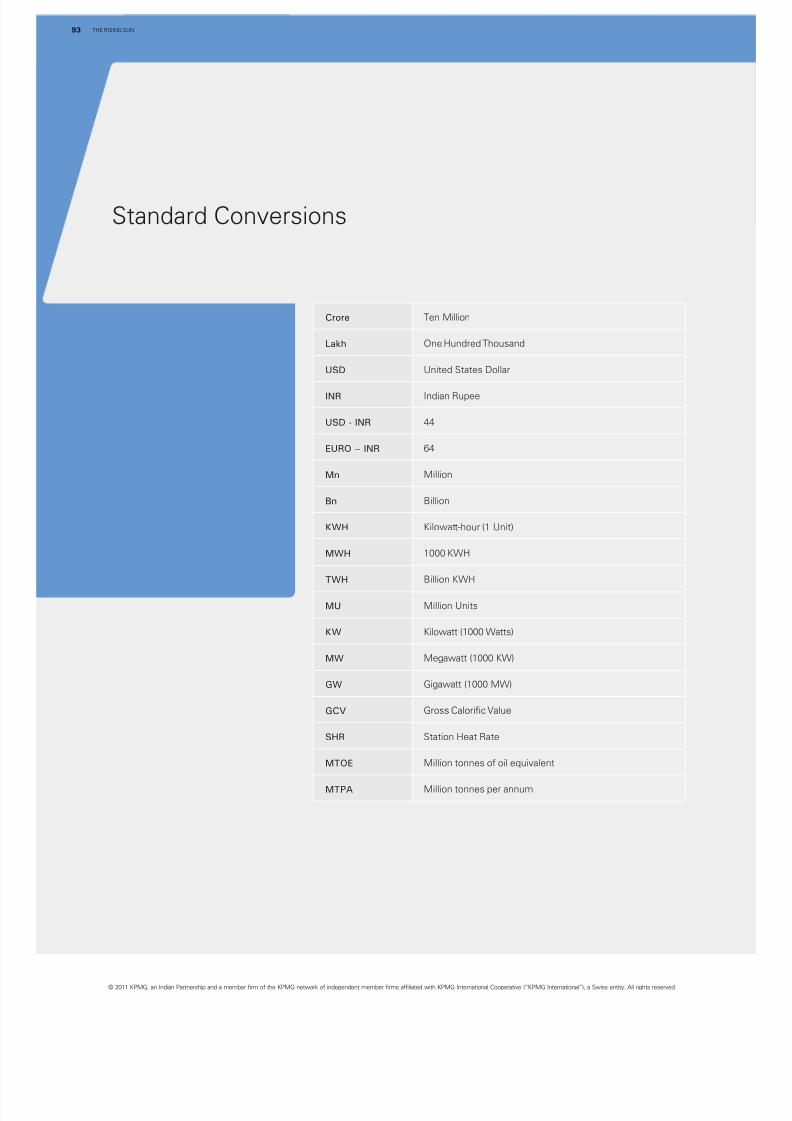
8/3/2019 The Rising Sun Full
http://slidepdf.com/reader/full/the-rising-sun-full 94/96
Standard Conversions
© 2011 KPMG, an Indian Partnership and a member firm of the KPMG network of independent member firms affiliated with KPMG International Cooperative (“KPMG International”), a Swiss entity. All rights reserved.
THE RISING SUN93
Crore Ten Million
Lakh One Hundred Thousand
USD United States Dollar
INR Indian Rupee
USD - INR 44
EURO – INR 64
Mn Million
Bn Billion
KWH Kilowatt-hour (1 Unit)
MWH 1000 KWH
TWH Billion KWH
MU Million Units
KW Kilowatt (1000 Watts)
MW Megawatt (1000 KW)
GW Gigawatt (1000 MW)
GCV Gross Calorific Value
SHR Station Heat Rate
MTOE Million tonnes of oil equivalent
MTPA Million tonnes per annum
8/3/2019 The Rising Sun Full
http://slidepdf.com/reader/full/the-rising-sun-full 95/96
During the preparation of this report, we greatly
benefited from our interactions with the following
gentlemen:
?Mr K. Subramanya, CEO, Tata BP Solar
?
Mr. V. Saibaba, CEO, Lanco Solar
?Mr. Dhruv Batra, Director, Cargo Power & Infrastructure
?Mr. Siddarth Bhandari, Director, Electrotherm India Ltd
?Mr. Atam Kumar, Jain Irrigation Systems Ltd
?Mr. Dinesh Kumar, Excel Towers
?Mr. D.N Swain, Orient Paper Mills
?Mr. Rajesh Kumar Reddy, ITC Limited
?Mr. A.K. Srivastava, MP Dair y Co-operative
We would also like to acknowledge the core team
from KPMG in India who made this report
possible:
?Anand Jain
?Harsha Rawal
?Koshal Agarwal
?Peeyush Mohit
?Uday Kiran Alamuru
?S Shivashankar
?Praveen Golash
?Payal Goel
?Sheshank Kumar
?Keerthi Potnuru
Acknowledgements
© 2011 KPMG, an Indian Partnership and a member firm of the KPMG network of independent member firms affiliated with KPMG International Cooperative (“KPMG International”), a Swiss entity. All rights reserved.
94THE RISING SUN
8/3/2019 The Rising Sun Full
http://slidepdf.com/reader/full/the-rising-sun-full 96/96
Key Energy and Natural Resources (ENR) contacts
Executive Director and Head
Energy and Natural Resources
T: +91 22 3090 1740
Arvind Mahajan Anand Jain
Associate Director
Energy and Natural Resources
T: +91 22 3090 2479
Santosh Kamath
Executive Director
Lead - Renewables
Energy and Natural Resources
T: +91 22 3090 2527
Other key contacts
Executive Director and Head
Advisory
T: +91 124 307 4303
Executive Director and Head
Markets
T: +91 22 3090 2320
Richard Rekhy
Vikram Utamsingh
Deepankar Sanwalka
Hemal Zobalia
Executive Director and Head
Risk and Compliance
T: +91 124 307 4302
Executive Director
Tax and Regulatory
T: +91 22 3090 2706
Sunny Banerjea
Sachin Menon
Executive Director and Head
Performance and Technology
T: +91 22 3090 1700
Executive Director
Tax and Regulatory
T: +91 22 3090 2682