the rivers trust autumn conference: day 2 - session 1
TRANSCRIPT

Chaired by Prof Laurence Smith

Managing Director, South West Water

The case for resilient catchments
Improving resilience through
collaboration
Dr Stephen BirdManaging Director, South West Water
4
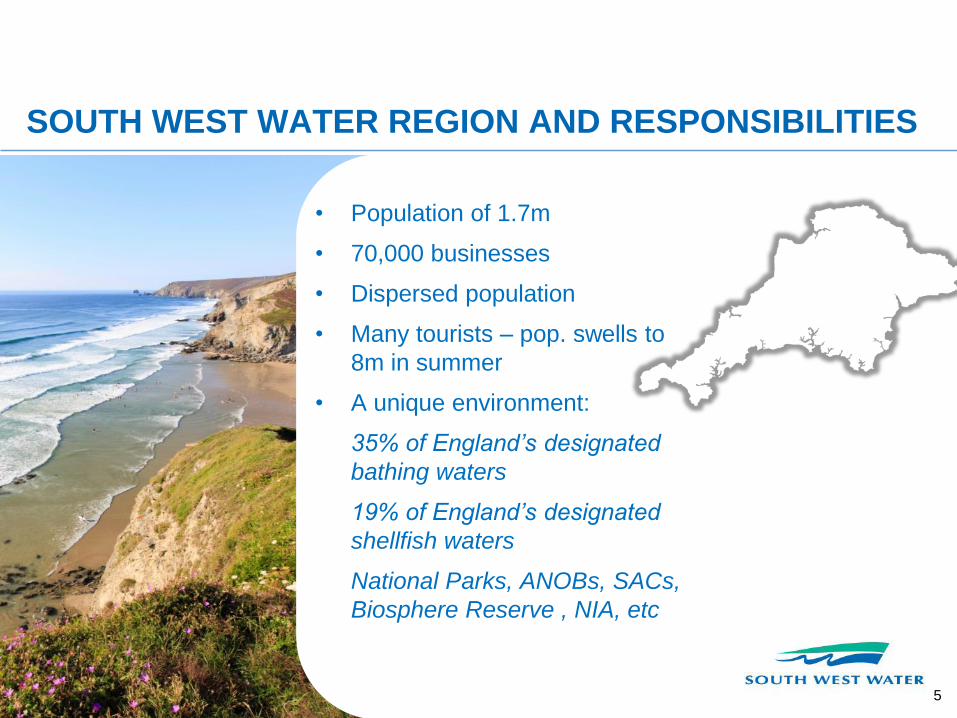
SOUTH WEST WATER REGION AND RESPONSIBILITIES
• Population of 1.7m
• 70,000 businesses
• Dispersed population
• Many tourists – pop. swells to
8m in summer
• A unique environment:
35% of England’s designated
bathing waters
19% of England’s designated
shellfish waters
National Parks, ANOBs, SACs,
Biosphere Reserve , NIA, etc
5
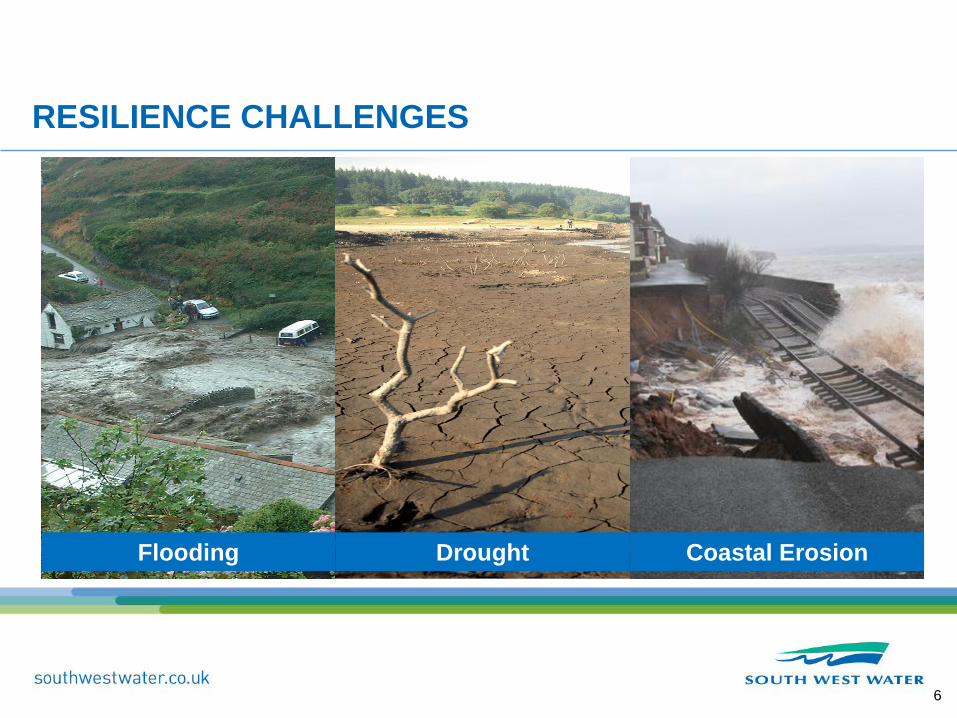
RESILIENCE CHALLENGES
Flooding Drought Coastal Erosion
6

The resilience challenge for SWW

RESILIENCERECENT DEVELOPMENTS IN THE WATER INDUSTRY
(1) Cabinet Office: ‘Keeping the Country Running’ – Natural Hazards and Infrastructure(2) Ofwat: ‘Towards Resilience – How we will Embed Resilience in our Work’(3) Resilience Task and Finish Group Report
(4) Ofwat: ‘Reliable services for customers – consultation on Ofwat’s role on resilience
WHY IS IT A HOT TOPIC?WHY IS IT A HOT TOPIC?
• Climate change and population growth• Scarcity and affordability concerns• Financial and economic pressures
WHAT DOES RESILIENCE MEAN?
“Resilience is the ability to cope with, and to recover from, disruption and anticipate trends and variability in order to maintain services for people and protect the natural environment”
HOW CAN THE SECTOR EMBED RESILIENCE?• Long-term planning• Innovation• Investing based on whole-life costs and benefits
8

THE NATIONAL RESILIENCE POLICY DEBATE
• Recognition of the need to change
• New duties and focus
• Lots of parliamentary reviews post winter 2015 flooding
• New ways of working - developing catchment solutions
• Ministerial hands on approach- eg Somerset Levels
• Much debate over design standards and practices
• Should we wait for central policy ?
9
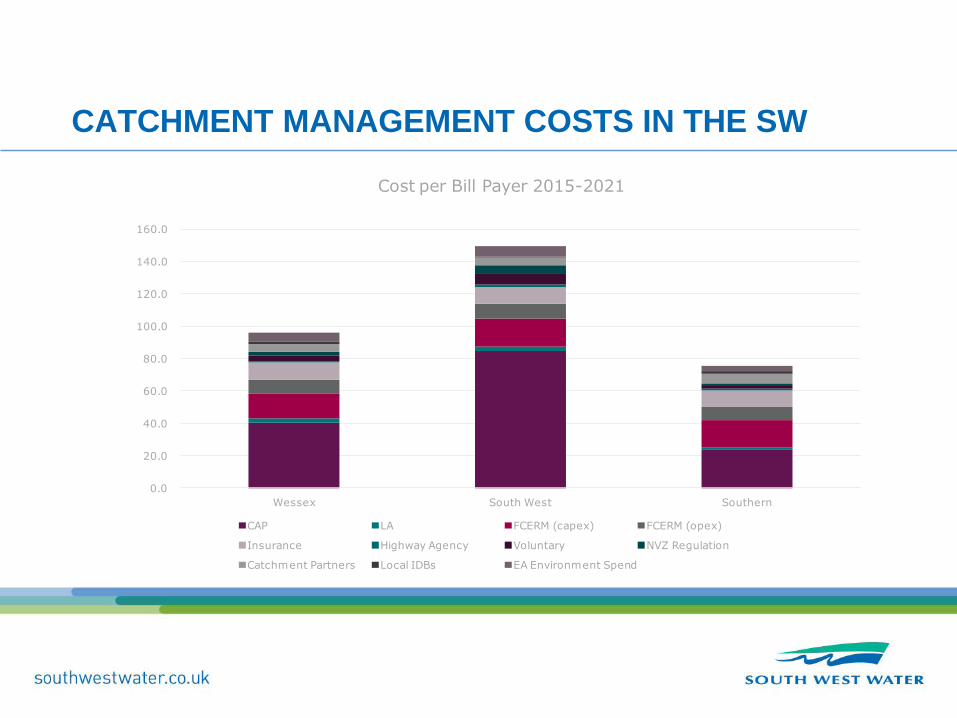
CATCHMENT MANAGEMENT COSTS IN THE SW
0.0
20.0
40.0
60.0
80.0
100.0
120.0
140.0
160.0
Wessex South West Southern
Cost per Bill Payer 2015-2021
CAP LA FCERM (capex) FCERM (opex)
Insurance Highway Agency Voluntary NVZ Regulation
Catchment Partners Local IDBs EA Environment Spend

RESILIENCEWHAT SOUTH WEST WATER IS ALREADY DOING
WHY IS IT A HOT TOPIC?• ORGANISATIONAL SECURITY
Operational innovation
Skills development and apprentice programmes
• SERVICE & ENVIRONMENTAL PERFORMANCE
Upstream and Downstream Thinking
WaterShare performance monitoring framework
• FINANCIAL VIABILITY
Efficient equity and debt finance base
Growth opportunities
Payment for Eco-system Services (PES)
Flood defence funding and support
1
1

CATCHMENT RESILIENCESOUTH WEST WATER CATCHMENT RESILIENCE PLANNING
DOWNSTREAM THINKING
Multi-agency, multi-benefit approach to
sustainable improvements in urban flooding and
drainage
SuDs, highway drainage, landscaping and active
network monitoring & management
Pilot approaches, trialling innovative behaviours
and techniques
UPSTREAM THINKING
• Multi-partner, multi-benefit approach to improving raw water quality and natural water storage
• 11 catchments in the South West targeted for moorland and agricultural improvements
12

Upstream Thinking
Flagship environmental project
£9m (2010-15) £10m (2015-20)
Partnership delivery
2 workstreams:
- moorland restoration
- agricultural improvements
Focus on water
quality
Improving natural water
quality and water storage in
the landscape
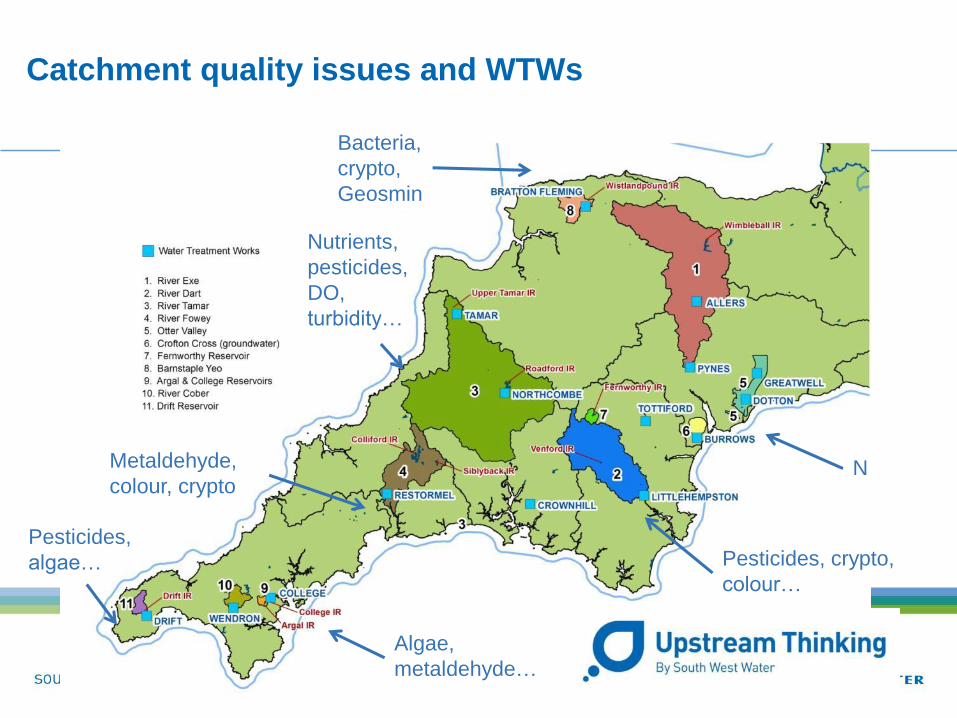
Catchment quality issues and WTWs
Pesticides, crypto,
colour…
N
Algae,
metaldehyde…
Pesticides,
algae…
Bacteria,
crypto,
Geosmin
Nutrients,
pesticides,
DO,
turbidity…
Metaldehyde,
colour, crypto

Catchment interventions:Cornwall Wildlife Trust (CWT)
Devon Wildlife Trust (DWT)
Westcountry Rivers Trust (WRT)
Exmoor Mires Partnership (EMP)
Exmoor National Park (ENPA)
Scientific monitoring:
University of Exeter
Project partners
South West Water
Catchments
River Exe
River Dart
River Tamar
River Fowey
Cofton Cross and Otter
Fernworthy
Barnstaple Yeo
Argal & College
River Cober
Drift
Who and where?

SWW BENEFITS FROM PARTNERSHIP DELIVERY OF
CATCHMENT MANAGEMENT
• Match funding from sources SWW cannot access
• Extra delivery by the partners in areas that SWW is less able to fund
such as biodiversity
• Use of a 3rd party for delivery brings greater success - the honest
broker approach
• Builds partnership support from stakeholders
• Customer support and reputational benefits

FUTURE SOLUTIONS FOR THE SOUTH WEST
• We must reach a common understanding on infrastructure resilience needs &
solutions
• Need to balance scarce resources to respond to challenges and continue to
work in partnership to leverage investment through matched funding
opportunities
• Need to translate central policy, when it comes, to local actions plans
1
9
DEVELOPING A COMMON UNDERSTANDING
• Undertake joint research and data analysis
• Create a common understanding of the hazards and risks
• Working with universities, flood forecasting centre and Met Office to quantify
risks and impacts
• Work with lead flood authorities, local land drainage boards, Environment
Agency, farmers, developers and other utilities – encourage sharing of
strategies and action plans
20
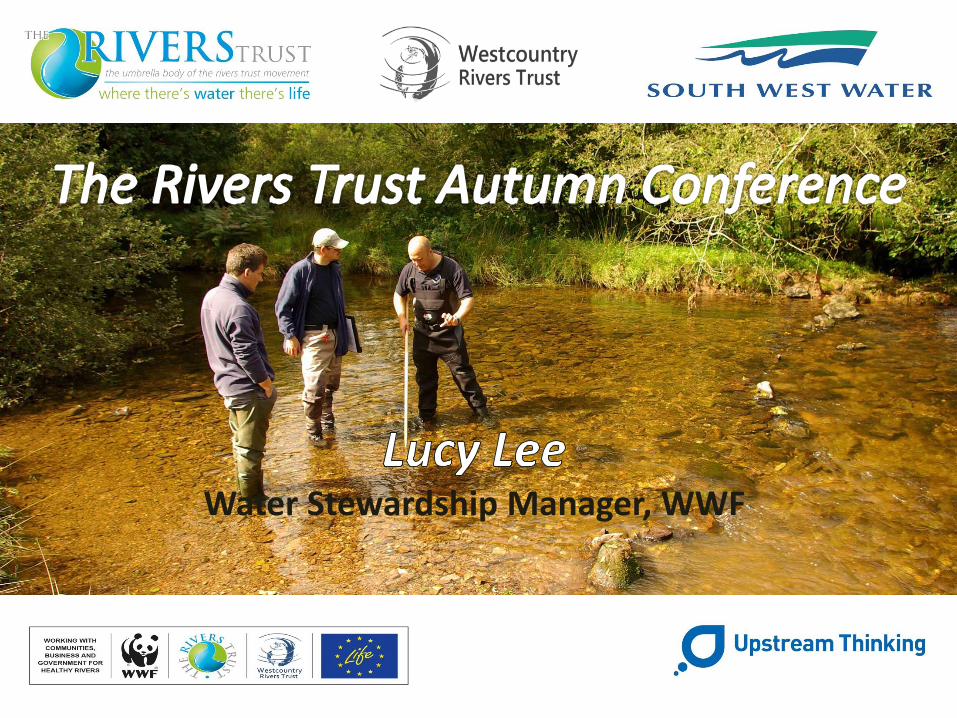
Water Stewardship Manager, WWF
www.waterlife.org.ukwww.waterlife.org.uk WWF registered charity no.1081247, a company limited by guarantee no. 4016725
WATERLIFE is funded by EC LIFE+. Project number: LIFE13 ENV/UK/000497
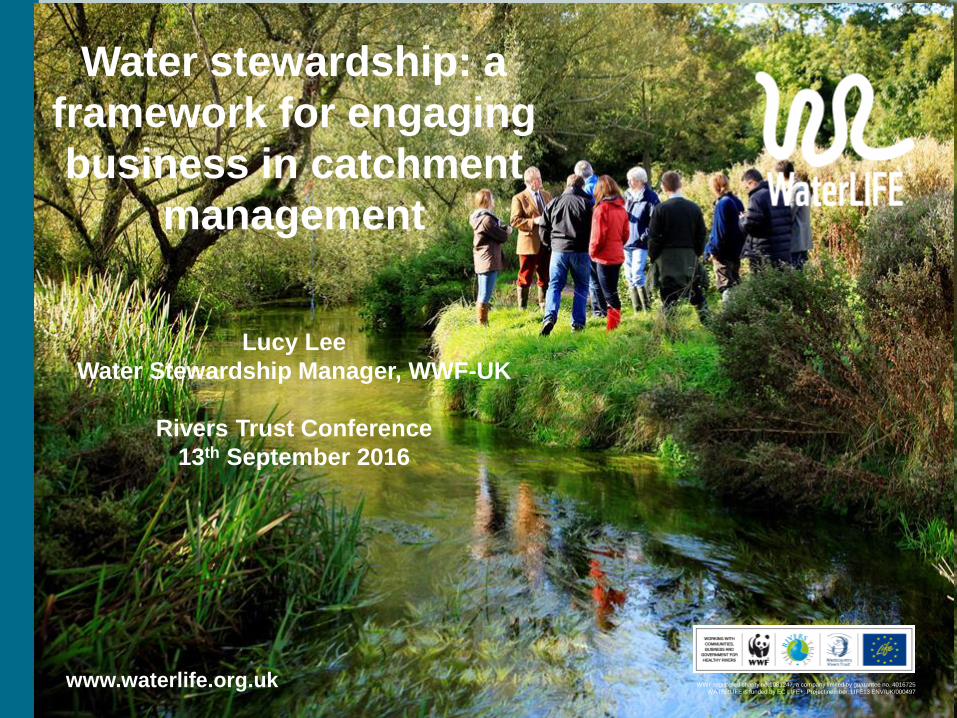
Water stewardship: a
framework for engaging
business in catchment
management
Lucy Lee
Water Stewardship Manager, WWF-UK
Rivers Trust Conference
13th September 2016

www.waterlife.org.uk
Focus of the presentation
1. Why water matters to UK business
2. How water stewardship provides a framework for engaging business in catchment management
3. WWF’s action to date to engage business in catchment management in the UK and plans for supporting increased engagement

www.waterlife.org.uk
Message 1 - It makes
business sense for the
corporate businesses to play
a long-term role in WFD
delivery.1. It makes business sense for the corporate
businesses to play a long-term role in WFD delivery.
1.Why water matters to UK business

www.waterlife.org.uk
Water matters to business
• The WEF’s Global Risk Report 2015 ranked “water crises” as the top risk to global growth.
• Freshwater species have declined by 76% since 1970.
• ½ European rivers and 17% of English rivers meet Good Ecological Status.
• The drivers of the economic water risks are the same as those for the decline in freshwater species: physical water scarcity poor management of the rivers, lakes and
aquifers which supply our water.

www.waterlife.org.uk
Physical • Flooding• Water scarcity• Water quality
Regulatory • 20-30% compliance gap• Changes through Water Act and legislation• Regulatory uncertainty associated with Brexit
Reputational • Associated with impacts on communities and
ecosystems
Opportunity framing can be useful to engage
The River Mimram, Hertfordshire during drought
Diffuse pollution caused by food and drinks supply chain
UK business water risks & opps
www.waterlife.org.uk
2. How water stewardship provides a framework for engaging business in catchment management

www.waterlife.org.uk
Water Awareness
Collective Action
Influence Governance
Internal Action
WWF’s Water Stewardship
Framework
Knowledge of Impact
Internal water managementBusinesses understand their impact and take action to better manage water in their own operations and supply chains
Water stewardshipBusinesses engage beyond their own operations and supply chains

www.waterlife.org.uk
WS as a framework for engaging
business in CM • Water risks are a result of cumulative water use in
catchments
• Internal water management is therefore not sufficient to manage water risks or maximise opportunities
• Businesses need to work collectively with stakeholders in catchments where they have a hotspot of water risk to develop integrated solutions
• The catchment management approach provides a perfect framework to enable this and engage business in supporting delivery of the WFD

www.waterlife.org.uk
1. We are working in East Anglia, England to demonstrate and test this approach.
3. WWF’s action to date to engage business in catchment management and plans for supporting increased engagement

www.waterlife.org.uk
Collective action with
business – River NarAim Deliver environmental improvements through collaborative delivery
• Funded by Coca Cola
• Addressing reputational risks associated with diffuse pollution in the sugar supply chain
• Brought together a range of partners including Norfolk RT, the NFU, NE
Actions
• Creation of Local WFD Catchment Plan
• Engaged farmers to improve over 2000 acres of land
• Re-meandering channels

www.waterlife.org.uk
Collective action – WaterLIFE
• Though our WaterLIFE project we are engaging additional businesses in catchment management
• Focus on engaging farmers to reduce agricultural pollution
• Two catchments Cam-Ely-Ouse and Broadlands
• AIM: scale up the approach and learning from our work in the River Nar and drive broader change in East Anglia

www.waterlife.org.uk
Supporting increased business
engagement in CM
We are working with the RT to create a CaBA related work package around water stewardship.
• Higher resolution data for England via the Water Risk Filter
• Guidance on water stewardship for the food and drink sector in England
Its early day so watch this space for more
information.

www.waterlife.org.uk
Influencing governance• Joint action to ensure the right policies and rules are in
place to enable the water environment to improve.
• Without changes in governance it will be impossible for businesses to mitigate their business risk.
• Through our partnership with Coca Cola, we have supported a number of actions:
Government & business WFD roundtable.
Sugar beet workshops
Secretary of State visits
Business to business engagement
Joint activities at party conference
Joint report launches with government – The Chalk Stream report

www.waterlife.org.uk
In conclusion
1. Water matters to UK businesses
2. Water stewardship provides a framework for engaging business in catchment management
3. WWF is taking action to engage business in catchment management and is developing a toolkit with the RT to support increased engagement

www.waterlife.org.uk
Questions?
Thank you

Technical Specialist – Environment Agency

The condition of soils in our catchments and the impact on the water environment
Richard Smith
Technical Specialist – Environment Agency
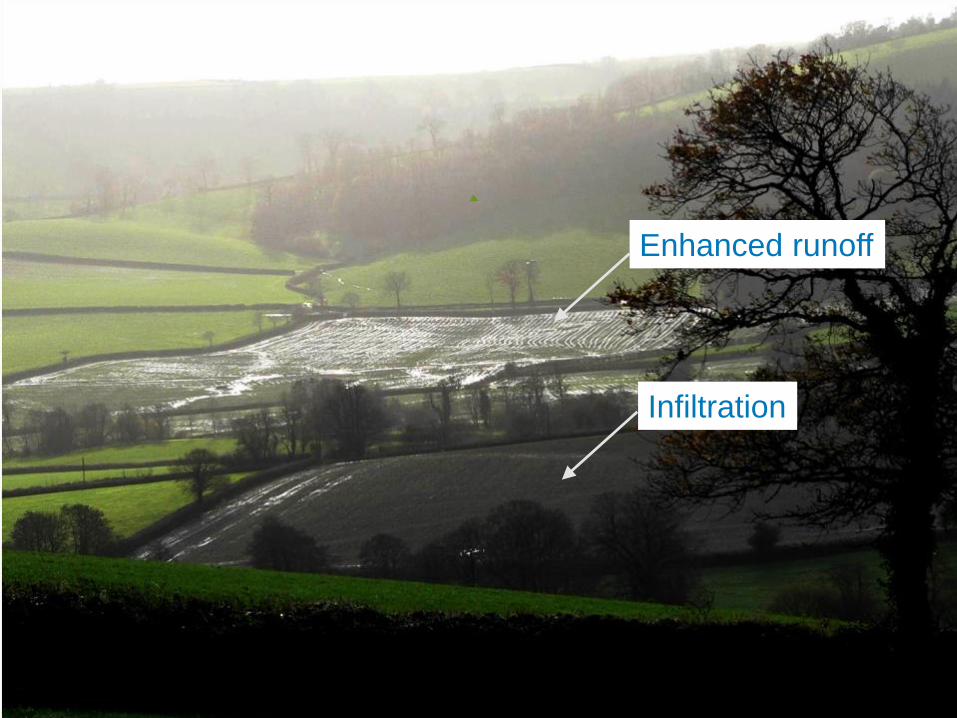
Enhanced runoff
Infiltration

The condition of soils in the South West

Soil degradation in relation to runoff
Severe
Moderate
High
Low

Soil condition assessment

% clay
Areas surveyed in the South West (2002 to 2011)
Hampshire
Avon
Frome
Axe & Otter
Tone and Parrett
Bristol Avon
Creedy
& Culm
Torridge & Tamar
Marazion
Bodmin

Soil structure degradation in the South West
during winter months
0
10
20
30
40
50
60
70
1 (87) 2 (123) 3 (112) 4 (46) 5 (2087) 6 (62) 7 (623) 8 (49)
Soil type
Pe
rce
nta
ge
oc
cu
rre
nc
e
Severe
High
Moderate
Low
Shallow
calcareous
Deeper
calcareous
Pelosols Brown
podzolic
Brown
earths
Brown sands Stagno-
gley
Ground-
water gley
Soil type

Soil structure degradation in the South West
during winter months
0
10
20
30
40
50
60
70
80
Potatoes
(70)
Maize
(198)
Winter
cereals
(670)
Stubble
(166)
Ley grass
(638)
Total
cultivated
(2032)
Permanent
grass
(1154)
All sites
(3243)
Land use
Pe
rce
nta
ge
oc
cu
rre
nc
e
Severe
High
Moderate
Low
Potatoes
(70)
Maize
(198)
Winter
cereals
(670)
Stubble
(166)
Ley grass
(638)
Total
cultivated
(2032)
Permanent
grass
(1154)
All sites
(3243)

60% runoff from grassland with moderate soil structure
2% runoff from grassland with good soil structure
Measuring runoff at Boscastle


Summary
Soil surveys in the South West have found a widespread
problem with soil condition affecting runoff
The runoff problem is exacerbated by bad weather and
commercial pressures faced by farmers
The South West is a high risk area and the environmental
impact is serious

Reader in Physical Geography, University of Leicester
Pesticides in water – challenges and
opportunities
Mick Whelan

Maximum concentrations
observed at Grimsbury
Cpropyzamide
0
0.1
0.2
0.3
0.4
0.5
0.6
0.7
1 2 3 4 5 6 7 8 9 10 11 12
months
co
nc (
Avera
ge)
Cpropyzamide
Ccarbetamide
0
0.1
0.2
0.3
0.4
0.5
0.6
0.7
1 2 3 4 5 6 7 8 9 10 11 12
months
co
nc (
Avera
ge)
Ccarbetamide
Average monthly
propyzamide
concentrations at
Grimsbury
Average monthly
carbetamide
concentrations at
Grimsbury
CONTEXT: Concentrations of some pesticides
periodically challenge DWD compliance

Cherwell: Field-scale monitoring
Hypothesis: Field drains are a major
conduit for herbicide transfer to the
Cherwell

Drain flow monitoring

www.le.ac.uk
Herbicide concentrations in drain flowVery rapid,
significant transfer
to field drain in the
first event post
application
Concentration
recession mirrors
hydrograph
recession
Propyzamide
losses 1.1% of
applied
Carbetamide
losses 8.6% of
applied

Metaldehyde
Widely used for slug control
Aqueous solubility: 222 mg L-1 at 20°C
Low KOC: 85 L kg-1
Soil DT50: 4.5 – 73 days
No photolysis or hydrolysis
Difficult to remove in treatment
→ “Undertakings”
From UKWIR report 2014

www.le.ac.uk
What to do?
• Buffer Zones?
• Hard surface management?
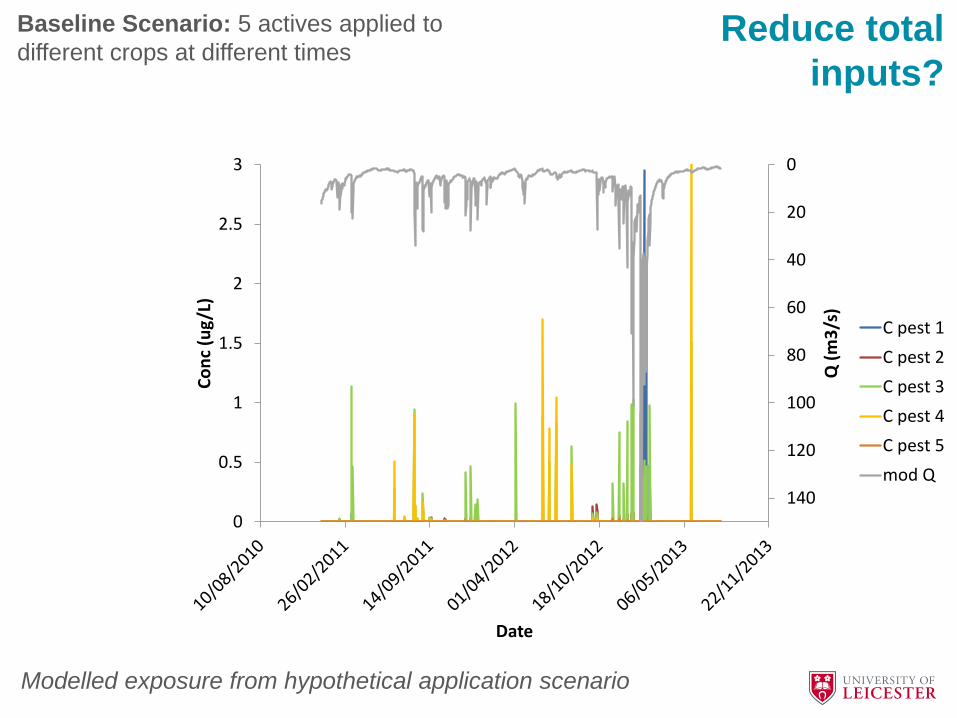
• Reduce total inputs?
• In drain or ditch treatment?
• Better soil management?
• Operational controls on abstraction?

Reduce total
inputs?
Storage
(Soil 1)
Rain ETa
Drainage
Storage
(Soil 2)
Drainage
OLFRain ETa
OLF
Qmod
Rainfall
Drainflow Surface
WaterGroundwater
Recharge
Solid phase
Liquid phase
Air phase
Saturated
θsat
Field
Capacity
θ5
θ200θ150050%
of θ1500
Interactive water Mobile water
Pre-event depth
of pesticide
penetration
Pesticide
Pesticides subject to:
• Linear sorption
• First-order
degradation
θ0
j
Mixed land use
0
20
40
60
80
100
120
1400
0.5
1
1.5
2
2.5
3
Q (
m3
/s)
Co
nc
(ug/
L)
Date
C pest 1
C pest 2
C pest 3
C pest 4
C pest 5
mod Q
Modelled exposure from hypothetical application scenario
Reduce total
inputs?
Baseline Scenario: 5 actives applied to
different crops at different times

0
20
40
60
80
100
120
1400
0.5
1
1.5
2
2.5
3
Q (
m3
/s)
Co
nc
(ug/
L)
Date
C pest 1
C pest 2
C pest 3
C pest 4
C pest 5
mod Q
Scenario A: Reducing the fraction of
managed grassland treated with pesticide
4 from 25% to 12.5%
Reduce total
inputs?
Modelled exposure from hypothetical application scenario

Scenario B: Not growing cereals on poorly drained
soil (Cereals moved to other soils, grass and some
OSR to heavy soil).
0
20
40
60
80
100
120
1400
0.5
1
1.5
2
2.5
3
Q (
m3
/s)
Co
nc
(ug/
L)
Date
C pest 1
C pest 2
C pest 3
C pest 4
C pest 5
mod Q
Change locations
for key crops?
Modelled exposure from hypothetical application scenario

On-line treatment
Hope farm in Knapwell
(Cambridgeshire)
m asl
3.9 km2 catchment

0
50
100
150
200
250
0.0
1.0
2.0
3.0
4.0
5.0
6.0
7.0
8.0
9.0
10.0
Q (
L/s)
Me
tald
eh
yde
co
nc.
(u
g/L)
Metaldehyde (ug/L) Inlet
Metaldehyde (ug/L) Outlet
Q V-notch (l/s) IN
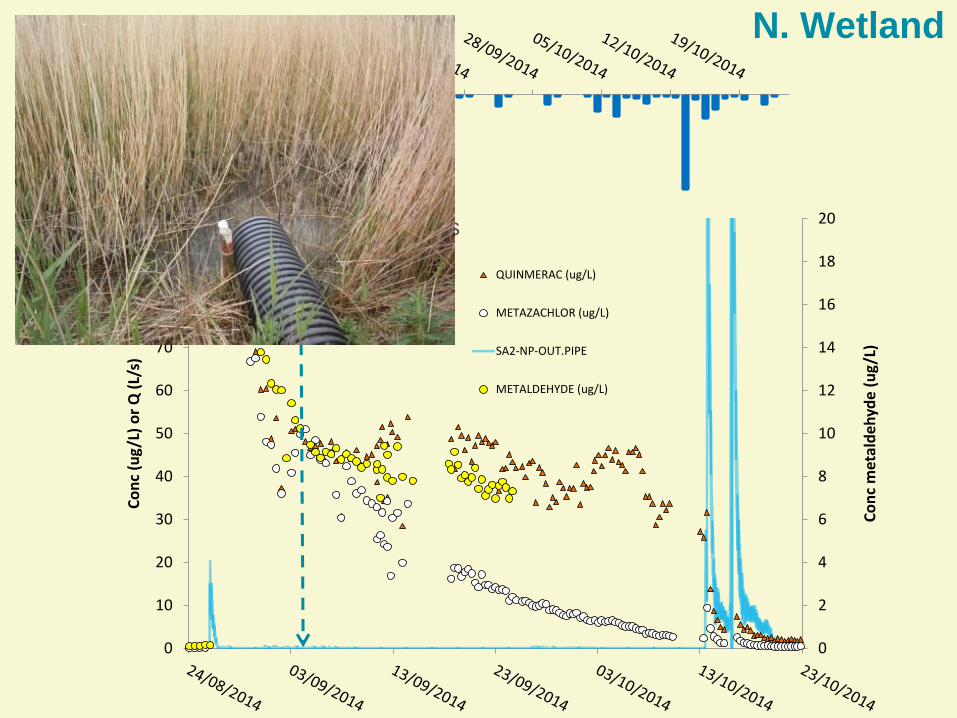
Metaldehyde S. Wetland
y = 0.9048x + 0.0692R² = 0.9043
0.0
2.0
4.0
6.0
8.0
10.0
0.0 2.0 4.0 6.0 8.0 10.0
Co
nc.
Ou
tle
t S
W 2
(u
g/L)
Conc. Inlet SW1 (ug/L)
Paired t-test for means – no
significant difference
between concentrations in
the inlet and outlet
0
10
20
30
40Rai
nfa
ll (m
m/d
)
0
2
4
6
8
10
12
14
16
18
20
0
10
20
30
40
50
60
70
80
90
100
Co
nc
met
ald
eh
yde
(u
g/L
)
Co
nc
(ug
/L)
or
Q (
L/s)
QUINMERAC (ug/L)
METAZACHLOR (ug/L)
SA2-NP-OUT.PIPE
METALDEHYDE (ug/L)
Outflow Stops
N. Wetland

Dynamic model predictions
DT50 sed = 122 d
DT50 wat = 12.2 d
A = 210 m2
z = 0.5 m
0
10
20
30
40
50
60
70
80
0
1000
2000
3000
4000
5000
6000
7000
8000
9000
10000
0 100 200 300 400 500 600 700 800
Dis
char
ge (
L/s)
Co
nc
(ng
/L )
Time (hours)
C pred
C meas
C input
Q meas

0
10
20
30
40
50
60
70
80
0
1000
2000
3000
4000
5000
6000
7000
8000
9000
10000
0 100 200 300 400 500 600 700 800
Dis
char
ge (
L/s)
Co
nc
(ng
/L )
Time (hours)
C meas
C input
Cpred
Q meas
DT50 sed = 122 d
DT50 wat = 12.2 dA = 2100 m2
z = 1 m
Increase
area x10
Decrease in
peak conc
by 36%
Reduction in
total flux
<1%
Dynamic model predictions
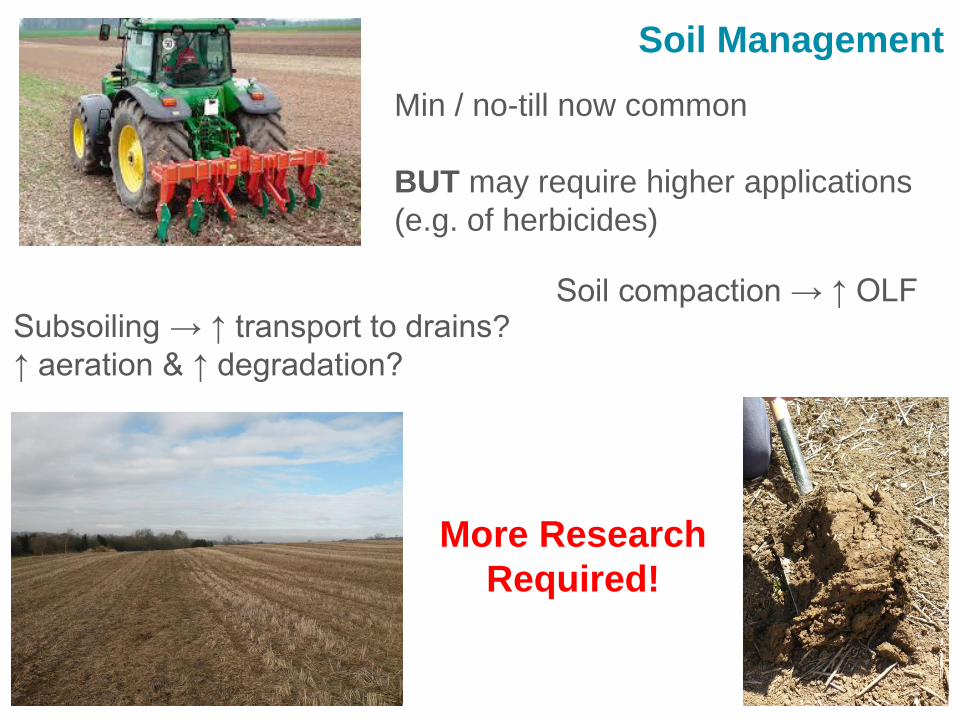
Soil Management
Min / no-till now common
BUT may require higher applications
(e.g. of herbicides)
Subsoiling → ↑ transport to drains?
↑ aeration & ↑ degradation?
Soil compaction → ↑ OLF
More Research
Required!
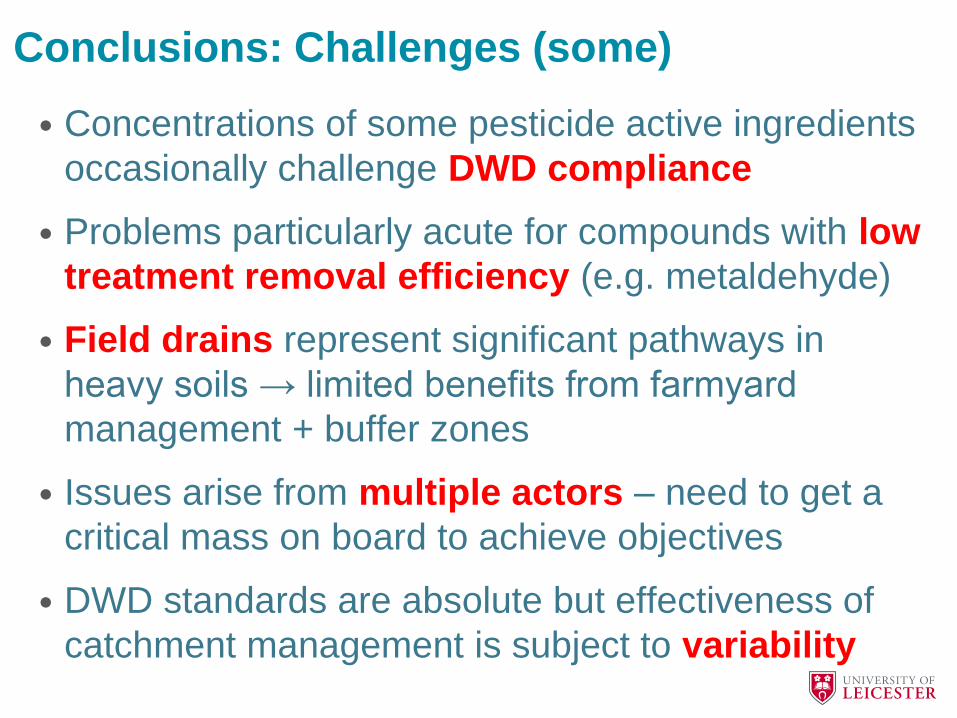
Conclusions: Challenges (some)
• Concentrations of some pesticide active ingredients
occasionally challenge DWD compliance
• Problems particularly acute for compounds with low
treatment removal efficiency (e.g. metaldehyde)
• Field drains represent significant pathways in
heavy soils → limited benefits from farmyard
management + buffer zones
• Issues arise from multiple actors – need to get a
critical mass on board to achieve objectives
• DWD standards are absolute but effectiveness of
catchment management is subject to variability

Conclusions: Opportunities (some)
• Potential benefits for crop rotation changes
involving reduced total usage and changes in
application timings
• On line treatment wetlands (probably) of limited
value for catchment protection (need high wetland :
catchment area)
• Better understanding of catchment dynamics
could help to target interventions (e.g. on
vulnerable soils) and inform operational controls
(e.g. on abstraction)
• Soil management may offer (currently unknown)
benefits – more research needed!

Engineer, Arup

74
Current understanding of NFM and where we go from here
Alexander Nicholson
@AlexNicho1

75
Natural flood management (NFM) is the alteration, restoration or use of landscape
features to reduce flood risk (POST, 2011).
What is Natural Flood Management?
POST. (2011). Natural Flood Management POSTNOTE 396. London, UK: Parliamentary Offices of Science and Technology. Retrieved from http://www.parliament.uk/briefing-papers/POST-PN-396
SLOW STORE FILTER

76
Benefits of NFM• Reduction of peak flow at downstream receptors
• Reduced erosion (on land and in waterbodies)
• Reduced sediment delivery (capturing at source)
• Improved water quality (reduced costs to water companies)
• Habitat creation (terrestrial and aquatic)
• Drought reduction (and agricultural enhancement)?

Pickering

Holnicote
© National Trust
© Penny Anderson Associates
© National Trust

79
Stroud

Belford

81
PhD findings
𝑑𝑉
𝑑𝑡= 𝑄𝑖𝑛 − 𝑄𝑜𝑢𝑡
𝑄𝑑𝑠 = 𝑄𝑢𝑠 −𝑑𝑉
𝑑𝑡
Analytical method: Monitored evidence:
FillingFull
Emptying
10% reduction in flow from one pond!Though – this was not the design event.

82
Modelling method: Modelled results:
PhD findings
𝐼 = ቐ0 𝑖𝑓 𝑧𝑠1 ≤ 𝑧𝑠𝑤
𝑓𝑟𝐶𝑑2
3𝑏 2𝑔 𝑧𝑠1 − 𝑧𝑠𝑤
1.5 𝑖𝑓 𝑧𝑠1 > 𝑧𝑠𝑤
𝑓𝑟 =
1.0 𝑖𝑓 𝑧𝑠2 ≤ 𝑧𝑠𝑤
1 −𝑧𝑠2 − 𝑧𝑠𝑤𝑧𝑠1 − 𝑧𝑠𝑤
1.5 0.385
𝑖𝑓 𝑧𝑠2 > 𝑧𝑠𝑤

83
• Water storage capacity ≈ 280 m3
• 70 ha contributing area
Multi-benefits (sediment and water quality)

84
0
2
15
min
ra
in (
mm
)
0.0
5.0
10.0
Flu
me
stag
e (c
m)
0
0.2
0.4
TP c
on
c. (
mg
l-1)
TP in TP out
0
100
200
300
SS c
on
c. (
mg
l-1)
SS in SS out
0
2
4
6
8
NO
3co
nc.
(m
g l-1
)
NO3 in NO3 out
Retention (% concentration)
• SS: 25 – 67 (49% net retention)
• TP: 16 – 44 (33% net retention)
• NO3: 5 – 85 (18% net retention)
~ £2000 of work
85
Other initiatives
• Cumbria Floods Partnership (and action plan)
• Working with Natural Processes (and opportunity mapping)
• Defra model competition
• NERC Research Call (up to £6M)

86
Mapping

87
Mapping

88
Mapping – NFM+

89
Sub-catchment division
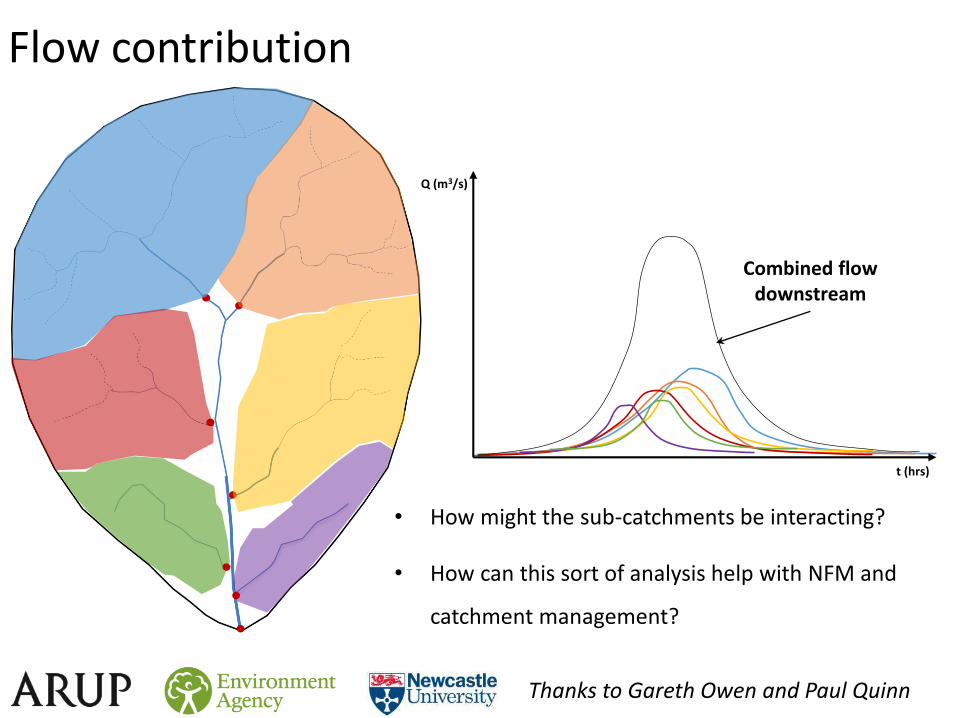
• How might the sub-catchments be interacting?
• How can this sort of analysis help with NFM and
catchment management?
Flow contribution
Q (m3/s)
t (hrs)
Combined flow downstream
Thanks to Gareth Owen and Paul Quinn
91
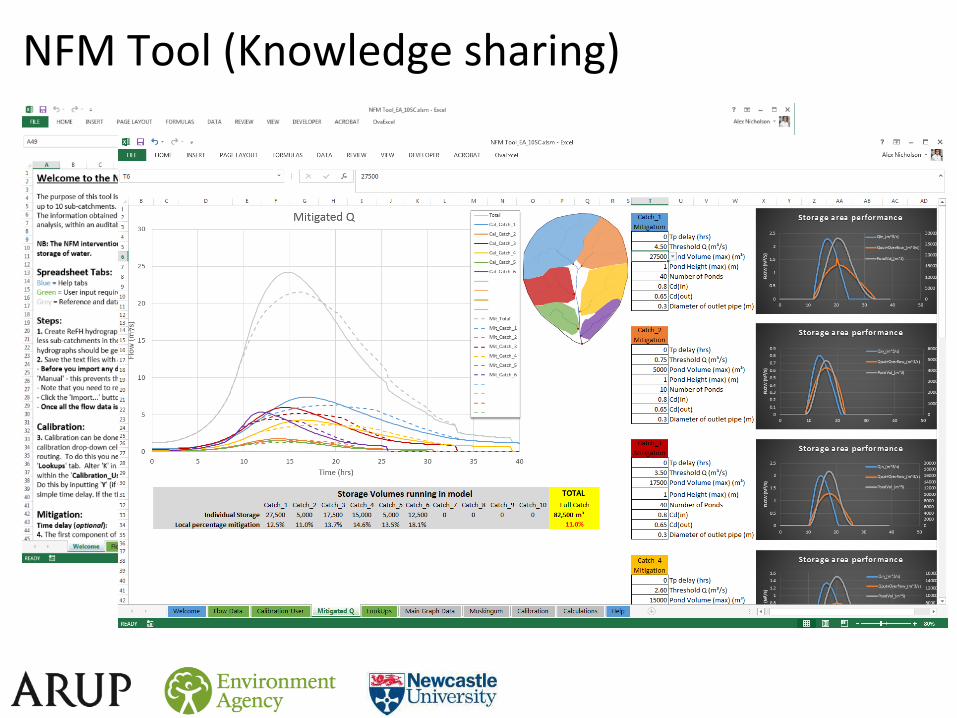
NFM Tool (Knowledge sharing)

92
Estimating storage requirements and costs
1km
1km
How much storage is needed?(Based on the Belford Study and other research)
Need approx. 2,000m3 / km2
If storage areas only fill up to 25cm, the area of land take will be 8,000m2, which equates to 1% of the land*
Conservative costs:
£10 / m3
This means to deliver an NFM scheme for:
10km2 Catchment = £200,000
100km2 Catchment = £2,000,000
* Paul Quinn’s 5% future. Let’s also remember that these features only take up this area when full of water

93
Benefits and funding
FDGiA
OM1 – Damages avoided
OM2 – Moving risk bands (Low, Medium, High)
OM4a – Water dependent habitat
Partnership funding
Natural EnglandForestry Commission
How many properties are you potentially benefiting?Multiple locations and further downstream

94
Maintenance
AIMS
Asset description
Maintenance plan
Access
What features can be maintained?
What is the whole life cost of the scheme?
Should the EA be tasked with maintenance?
Role of Flood Action Group
Belford:
Of the 48 features, 40 are eligible for adding to AIMS (the other 8 are LWD dams)
£2,000 / year


12th & 13th September 2016Rougemont Hotel, Exeter