the role and impact of services sector on …...the role and impact of services sector on economic...
TRANSCRIPT

Copyright is owned by the Author of the thesis. Permission is given for a copy to be downloaded by an individual for the purpose of research and private study only. The thesis may not be reproduced elsewhere without the permission of the Author.

THE ROLE AND IMPACT OF SERVICES
SECTOR ON ECONOMIC GROWTH: AN
ECONOMETRIC INVESTIGATION
OF TOURISM AND AIR SERVICES
IN FIJI
(1968-2006)
A thesis presented in partial fulfillment of the requirements for the degree of
Masters of Management
in
Economics
at Massey University, Palmerston North, New Zealand.
Mosese Tavaga Qasenivalu
2008

i
ABSTRACT
Empirical studies have established that tourism is a major determinant of economic growth
and that international air services have a beneficial effect on the growth and development
of an economy. It has also been argued that trade and public enterprise reforms in the
service sectors, undertaken to a greater extent in high income countries, have had a positive
impact on the sectors performances.
This study analyses several hypotheses relating to Fiji’s tourism and air transport service
industries. First the study examines the contribution of tourism exports to economic growth
in the case of Fiji. Second, the study analyses whether the tourism reform adopted by Fiji
in 1999 under the World Trade Organization’s General Agreement on Trade in Services
(GATS) has impacted on total tourism export performance. Third, the aviation-service
growth nexus is investigated. Lastly, the effect of the aviation public enterprise reform
activities on the export performance of air services is evaluated.
Using time series annual data from 1968 to 2006, the Auto Regressive Distributed Lag.
methodology has been utilized to estimate the contribution of each service sector to Fiji’s
total service output. The results show that the tourism is a major determinant of growth in
Fiji and that the aviation service-growth hypothesis is also valid for Fiji. The empirical
results show that both the trade reforms in tourism and the pro-competitive measures
undertaken in the airline industry, amongst other determinants, have not significantly
created an impact on the respective export performance of tourism and air services. These
findings provide key policy implications in the light of capitalizing on services exports as a
major source of growth, particularly in developing island countries such as Fiji and the
need to facilitate the strengthening of the market to boost the export performance of
tourism and air services.

ii
ACKNOWLEDGEMENTS Several people have provided diverse support to this study and I wish to convey my
acknowledgements accordingly.
First, the professional guidance of my supervisor, Associate Professor Rukmani Gounder
of the Department of Economics and Finance is greatly appreciated and respected. Her
direction and expert supervision throughout the study period, and also particularly in the
challenging times encountered during the research process have been a great cause of
breakthrough. I am sincerely thankful for the invaluable advice and support. Vinaka
Vakalevu.
Second, I would like to acknowledge the endless support of my family who have always
stood beside and encouraged me during the course of my study. Their love and prayers
have been always tremendously felt.
Third, I wish to extend my genuine appreciation to the Fiji Government staff at the
National Planning Office, Fiji Islands Bureau of Statistics, Transport Planning Unit and the
Ministry of Commerce for the data assistance and referrals.
I would also like to express my gratitude to the Department staff particularly Dr. Krishna
Iyer, Professor Srikanta Chatterjee and Mr. Stuart Birks for the comments during the
seminar presentation. The encouragement and support of my fellow student colleagues are
greatly appreciated. Finally, I wish to acknowledge the New Zealand Government for the
postgraduate scholarship to undertake this study.
This thesis is dedicated to Tanya, Eleanor and Fiona Qasenivalu.

iii
TABLE OF CONTENTS
ABSTRACT i
ACKNOWLEDGEMENTS ii
TABLE OF CONTENTS iii
LIST OF TABLES vi
LIST OF FIGURES vii
LIST OF ABBREVIATIONS viii
Chapter One INTRODUCTION 1
1.1 Background of the Study 1 1.2 Aims and Objectives 3 1.3 Data and Methodology 5 1.4 Chapter Outline 6
Chapter Two LITERATURE REVIEW 7
2.1 Introduction 7 2.2 Services Trade-Growth Nexus 8 2.2.1 Goods and Services: Theoretical Issues 11 2.2.2 Trade in Services 13 2.2.3 Trade in Services and Reforms 15 2.3 Tourism and International Air Services 20 2.3.1 Tourism Exports and Economic Growth 21 2.3.2 Tourism Trade Reform 24 2.3.3 International Air Services and Economic Growth 25 2.3.4 Reforms in Aviation Trade 26 2.4 Empirical Studies on Tourism, Air Services Growth and Reforms 30 2.5 Significance and Implications of Fiji’s Services Trade Reforms 36 2.6 Summary and Conclusion 39
Chapter Three FIJI’S TOURISM AND AIRLINE INDUSTRY: AN
OVERVIEW 41
3.1 Introduction 41 3.2 Fiji’s Macroeconomy: An Overview 42 3.2.1 Economic Growth Factors 43 3.2.2 Fiji’s International Trade in Goods and Services 51 3.2.3 The Services Sector in Fiji 53 3.3 Economic Policy and Reforms in Fiji 55 3.3.1 Trade Liberalization in Fiji’s Tourism Industry 58 3.3.2 Reforms in Fiji’s Airline Industry 60 3.4 The Fiji Tourism Industry 61

iv
3.4.1 Supply of Tourism Services 64 3.4.2 Tourism Source Markets 67 3.4.3 Tourism-Growth Nexus 69 3.5 The Airline Industry in Fiji 72 3.5.1 Production of Air Services Exports 73 3.5.2 Demand for Fiji’s Air Services Exports 76 3.5.3 Air Services-Growth Nexus 77 3.6 Summary and Conclusion 79
Chapter Four EMPIRICAL MODELS AND METHODOLOGICAL
FRAMEWORK 81
4.1 Introduction 81 4.2 Specification of the Models 82 4.2.1 Tourism-Growth Model 83 4.2.2 Determinants of Tourism and Reform Models 84 4.2.3 Air Services-Growth Model 87 4.2.4 Determinants of Air Services and Reforms Models 88 4.3 Data 90 4.4 Econometric Technique 97 4.4.1 Testing the Unit Root Hypothesis 98 4.4.2 Estimating the Long run Relationship Among Variables 99 4.5 Summary and Conclusion 100
Chapter Five TOURISM GROWTH AND REFORMS: EMPIRICAL
RESULTS 102
5.1 Introduction 102 5.2 Tourism-Growth, Tourism Determinants and Reforms 103 5.2.1 Tourism-Growth, Determinants and Reform Models 103 5.2.2 Data and Methodology 105 5.2.3 Results for Unit Root 106 5.3 Results for Tourism-Growth Nexus and Reforms 107 5.3.1 Tourism-Growth Nexus Results 107 5.3.2 Tourism Reform and Determinants 110 5.3.2.1 Tourism Receipts and Reform Results 110 5.3.2.2 Tourism Arrivals and Reform Results 115 5.4 Conclusion 119 Chapter Six AIR SERVICES GROWTH AND REFORMS:
EMPIRICAL RESULTS 120
6.1 Introduction 120 6.2 International Air Services-Growth, Determinants and Reforms 121 6.2.1 International Air Services-Growth, Determinants and Reform Models 121 6.2.2 Data and Methodology 123 6.2.3 Results for Unit Root 124 6.3 Results for Air Services-Growth Nexus and Reforms 125 6.3.1 Air Services-Growth Nexus 125 6.3.2 Aviation Reform and Determinants 127 6.4 Conclusion 132

v
Chapter Seven CONCLUSION 134
7.1 Introduction 134 7.2 Summary of Chapters 136 7.3 Policy Recommendations 138 7.4 Areas for Future Research 141 BIBLIOGRAPHY 143

vi
LIST OF TABLES Table 2.1 Classification of Trade in Services 14 Table 2.2 Services Trade Policy Instruments 16 Table 2.3 The Five Freedoms of the Air 28 Table 3.1 Fiji’s Trade in Services and the Current Account 52 Table 3.2 Fiji’s Schedule of Specific Commitments to the GATS 59 Table 3.3 Implemented projects in the Tourism Industry 1986-1999 63 Table 3.4 Previous Calculations of Tourism and Sugar Income Multipliers 71 Table 3.5 Details of Bilateral Agreement with Fiji Air Services Agreements 75 Table 4.1 List of Time Series Variables Used in Equations and Sources 91 Table 4.2 Gross Domestic Product by Activities 92 Table 5.1 ADF Test Results for Tourism Model Variables 106 Table 5.2 Bounds F-Test Results for Tourism and Growth Nexus in Fiji 107 Table 5.3 Results for Tourism-Growth Nexus in Fiji 109 Table 5.4 Bounds F-Test Results for Tourism Receipts and Reform in Fiji 111 Table 5.5 Results for Tourism Receipts and Reform in Fiji 112 Table 5.6 Bounds F-Test Results for Tourism Arrival and Reform 116 Table 5.7 Results for Tourism Arrivals and Reform in Fiji 117 Table 6.1 ADF Test Results for Air Services Model Variables 124 Table 6.2 Bounds F-Test Results for Air Services and Growth Nexus in Fiji 125 Table 6.3 Results for Air Services and Growth Nexus in Fiji 126 Table 6.4 Bounds F-Test Results for Aviation Reform in Fiji 128 Table 6.5 Results for Aviation Reforms in Fiji 129

vii
LIST OF FIGURES Figure 2.1 The Benefit of Freer International Services 29 Figure 3.1 Fiji’s Annual Growth in Real GDP: 1968-2005(2000 Prices) 44 Figure 3.2 Real GDP Per Capita (2000 prices): 1968-2005 45 Figure 3.3 Annual Average Inflation Rate: 1970-2005 46 Figure 3.4 Total Paid Employment 1968-2006 48 Figure 3.5 Investments and Saving to GDP Ratio 49 Figure 3.6 Real Effective Exchange Rate 1968-2005 50 Figure 3.7 Services Export and Imports by Major Components-2005 53 Figure 3.8 GDP Goods and Real GDP Services 1970-2005 (1989 Prices) 54 Figure 3.9 Breakdown of Services Contribution to GDP-2004 55 Figure 3.10 Complementary Reforms for the Export Oriented Open-market
Growth Strategy 57
Figure 3.11 Annual Tourism Arrival 1968-2006 65 Figure 3.12 Total Level of Consumption of Tourist Products 1995 67 Figure 3.13 Visitor Arrivals by Country of Residence, 1968-2006 68 Figure 3.14 Real Tourism Export Receipts 1968-2006 69 Figure 3.15 Sugar versus Tourism Exports in Fiji (% of GDP) 1970-2005 70 Figure 3.16 Total Paid Employment in the Services Sector 1968-2006 71 Figure 3.17 Total Expenditure to Revenue Ratio of Air Pacific Limited
1968-2006 74 Figure 3.18 Total International Air Passenger Traffic 1968-2006 76 Figure 3.19 Real Airline Revenues of Air Pacific Limited 1968-2006 78 Figure 3.20 Fiji’s Manpower in Air Pacific Limited 1968-2006 79

viii
LIST OF ABBREVIATIONS
ACP Asia Caribbean and the Pacific
ADB Asian Development Bank
AFL Airports Fiji Limited
ARDL Auto Regressive Distributed Lag
ASA Air Service Agreement
CAAF Civil Aviation Authority of Fiji
CAAFI Civil Aviation Authority of the Fiji Islands
FIBOS Fiji Islands Bureau of Statistics
GATS General Agreement on Trade in Services
GATT General Agreement on Trade and Tariffs
GDP Gross Domestic Product
IATA International Air Transport Association
ICAO International Civil Aviation Organization
IMF International Monetary Fund
OECD Organization for Economic Cooperation and Development
RBF Reserve Bank of Fiji
TSA Tourism Satellite Account
UNCTAD United Nations Conference on Trade and Development
UNWTO United Nations World Trade Organization
WTO World Trade Organization

1
Chapter One
INTRODUCTION
1.1 Background of the Study
This study investigates the service export-growth nexus for Fiji focusing on the
international sale of tourism and air services and examines the impact of the reforms in the
tourism and aviation industries on the respective sectors’ export performance. The export
of services among countries is a growing international transaction activity. In the last two
decades, world service trade grew from US$767 billion in 1980 to US$6316 billion in 2007
(World Trade Organization (WTO), 2008). Amongst the major categories of services
traded in the international market, the tourism and air transport industries stand out as the
most vibrant services exchanged, particularly in developing countries where both tourism
and air services is becoming a significant and increasing phenomenon.
Recently, it has been established in several empirical studies that tourism is a major
economic growth determinant and that international air services have a beneficial effect on
the growth and development of an economy (see, inter alia, Oh, 2003; Eugenio-Martin,
Morales and Scapa, 2004; Durbarry, 2004; Button and Taylor, 2000; Button, 2006). It has
also been argued that the reforms in the service export sectors, undertaken to a greater
extent in high income countries, have had a positive impact on sector performance (see,
inter alia, Brohman, 1996; Organization for Economic Cooperation and Development
(OECD), 1996; Forsyth (1998); Forsyth, et.al., (2004); Doove, et al., 2001). Given such
generalizations, the case in developing countries such as Fiji is not clearly known
particularly for the export of air services and the impact of reforms in the tourism and
aviation sectors. This suggest the general lack of empirical discussion on these issues
which has contributed to the lack of emphasis and clear articulation of services from an
export and reform impact perspective in the sectoral and national policy framework in Fiji.
The trade in services has recently been endorsed as tradable commodities by the WTO in
1995 under the General Agreement on Trade in Services (GATS), following extensive
deliberation during the WTO Uruguay round of trade talks held from 1986 to 1993 (Shelp,
1987). The late recognition of services was mainly due to the nature and characteristics of
services compared to goods, and the way in which the classical school of thought have not

2
developed a clear definition of services (Shelp, 1987). The dominance of neoclassical
economics in the latter period clarified the role of services as exports after it was pointed
out that, services, though it can not be stored, has a value which can be determined by the
market forces of demand and supply (Weintraub, 2002).
This led to the applicability of trade in services to the existing trade-growth theories which
have long been understood in the context of trade in merchandise goods, such as the theory
of comparative advantage, trade factor endowment theory, the North-South and South-
South trade models, growth-trade directional effect models, balanced growth theory, the
widely used neoclassical growth model and its recent variant known as the endogenous
growth theory. The relevance of trade in services to the aforementioned theories has
activated a number of empirical studies examining the services trade-growth nexus, of
which the results have been mixed at both the macro and disaggregated service levels in
different country contexts.
The importance of economic reforms has been noted to enhance the participation of
developing countries into the global economy and to promote economic growth and
poverty reduction (International Monetary Fund, 1997). These reforms are basically aimed
at promoting the economic system of the free market through major structural changes.
Among the key pillars for structural change, outward orientation and the opening up of
domestic markets to foreign participation is a major foundation (Mohan et. al., 2000). The
reform agenda widely took charge in most economic sectors including the service export
industries of tourism and air services. In particular, the service trade liberalization under
the WTO’s GATS was the main driving force for opening up trade in tourism services on a
voluntary basis by member countries (United Nations Conference on Trade and
Development (UNCTAD), 1998). In the aviation sector, the public enterprise reform
activities of airport privatization, commercialization of aviation regulatory functions and
the government divestiture in the national airlines were the main pro-competitive measures
to facilitate the liberalization of the air services markets.
Fiji, a developing country has experienced an increase in tourist inflows and international
passenger traffic over the last three decades. In the course of the same period, the growth
of Fiji’s economy has been relatively slow in real terms due to a number of factors such as
the military coups, vulnerability to natural disasters, low investment, migration of skilled

3
labour and other socio-economic crises (Gounder, 1999, 2002; Chand 2000; Narayan and
Smyth 2005). The poor economic growth performance was also attributed to the public
sector-led growth strategy and the protectionist approach that Fiji’s first government
adopted since independence (Reddy et. al., 2004).
This led to the acceptance of the WTO and World Bank reform programs which saw the
country’s shift in economic policies from an import substitution strategy to an outward
looking, export oriented strategy in 1986. This became the overarching policy stance of
successive Fijian governments after 1986 (Akram-Lodhi, 2000). In 1999 the government
committed Fiji’s tourism sector to the WTO’s GATS and volunteered to remove the
market access limitations for foreigners to invest in tourist hotel accommodation and
restaurants (Ministry of Commerce, Business Development and Investment, 1999). Around
the same time, the government divested a large part of its shares in the national airline Air
Pacific Limited to introduce new foreign management and embarked on the restructure of
the Civil Aviation Authority of Fiji (CAAF) into two new entities to improve efficiency in
the overall production of air transport services (Hicks, 1998; Mc Master, 2001).
1.2 Aims and Objectives
Given the background of the study, the two key aims are to empirically analyze the
service-growth nexus with a special focus on tourism and air services exports; and to
determine the impact of the relevant reform programs on the respective sectors export
performance. The specific hypotheses tested are embedded in two basic questions. These
are:
(1) What is the contribution of the export of tourism and air services to economic
growth and development in Fiji?
(2) Has the WTO GATS reform in tourism and the World Bank’s public enterprise
reform activities implemented in the aviation sector impacted on the respective
sector’s export performance?
The empirical investigation of these fundamental questions for Fiji is crucial for several
reasons. First, some studies on the tourism export-growth nexus for Fiji have been
undertaken recently, for example, Doessel and Gounder (1996) and Narayan (2004),
however the analysis of the second largest service export, i.e. air services, and its relation

4
to growth has not been examined for Fiji.1 In addition, the impact of the reform programs
on the export of tourism and air services has also not been empirically evaluated.
Investigating these relationships is vital in order to derive policies which would achieve
both the goals of the disaggregated service sectors and macroeconomic objectives. It is also
important for the formulation of policies that allows the combined achievement of tourism
and air transport sector objectives that would maximize the growth and development of the
two interdependent sectors. Second, understanding the impact of the reforms provide
lessons that would assist the policymakers for the way forward in relation to ongoing and
future reform programs in the service sector. Thirdly, the study contributes to the
knowledge and given that it has been the first to empirically address the air service sector
and the impact of reforms in both sectors, it provides avenues for future research and
analysis particularly for other service sectors which are opening up in the world market.
To achieve the two major aims of this study, a number of objectives have been set. The
first objective is to analyze the key theoretical and empirical literature underlying the study
of the service sector, economic growth and related reforms undertaken in the service export
of tourism and air services in Fiji. The second objective is to undertake a review of the
macroeconomy in Fiji from the time of independence to 2006, before delving into the
tourism and airline sectors with regard to its economic performance, major developments
and the specific service reforms undertaken.
In examining the above two aims, the third objective involves empirically estimating the
models related to the contribution of the tourism industry as a major growth determinant.
In the next step, the study aims to establish whether the tourism reform amongst other
determinants have impacted on the export demand performance of tourism services in Fiji.
The final objective assesses the relationship between air services exports and growth in
total services output. It further seeks to estimate the effect of pro-competitive aviation
reforms amongst other factors on the export performance of air services by the domestic
airlines.
1 The Fiji Islands Bureau of Statistics (2006) notes that in 2005, the two largest service exports of Fiji were transport (mainly air transport) and tourism and travel services. See also Figure 3.7, Chapter 3.

5
1.3 Data and Methodology
The study estimates a total of eight equations to analyze the two key aims of this research.
A total of five models relate to the tourism-growth nexus and reform models while three
models focus on the air services-growth relationship and the aviation determinants models.
The datasets for each of the parameters in the models were compiled from a number of
sources for the period 1968 to 2006. This include the Fiji Islands Bureau of Statistics
(various) for the data on total and disaggregated GDP and labour force, tourism receipts
and arrivals, international passenger traffic and primary data for hotel price indices; the
World Bank (2007) for the total labour force, merchandise exports, exchange rate, income
per capita of Fiji’s air tourism and air service markets, foreign direct investment and life
expectancy at birth; the Reserve Bank of Fiji (various) for the investment and real effective
exchange rate data; the Government of Fiji (various) for the state’s tourism promotion
expenditure; and the Air Pacific Limited (various) for the national airline’s total
expenditure and revenue data and the primary data required to calculate the air fare indices.
The absence of some data for some years has been a constraint, particularly for the air
services exports data and the reform variables related to the disaggregated total air
transport output and total expenditure data for the reformed entities. Similar available
measures for these variables were used as undertaken in other studies. Nominal values for
total and disaggregated GDP data were converted to constant 2000 prices using the GDP
deflator provided by the World Bank (2007) and the variables transformed to ratios were
undertaken for the relevant parameters.
The methodology used to estimate the models is the Autoregressive Distributed Lag
(ARDL) approach to cointegration. The Microfit Version 4.1 software by Pesaran and
Pesaran (1997) has been used to estimate these models. The ARDL approach involves the
determination of long run relationships amongst the variables in each model using the
Bounds F-test before it estimates the ARDL, long run and short run error correction
coefficients in the second stage. This approach has been selected because of its ability to
determine short and long run relationships. It has also being selected given that it has never
been used in previous tourism-growth nexus studies as that undertaken by Doessel and
Gounder (1996) and Narayan (2004) nor on any other service-growth and reform models
for Fiji. Given the longer time series data used, the robust results derived from the study
would enable the design of sound policies that reflect the disaggregated services exports

6
and growth relationships, the impact of the reforms and other determinants of tourism, air
services and economic growth. The details of the ARDL methodological framework, data
and model specification are discussed in Chapter 4.
1.4 Chapter Outline
The framework for this study is organized into seven chapters. The first chapter provides
the background and motivation of the study. In Chapter 2, the literature review is
undertaken from an aggregate perspective of services sector studies and the theories
associated with trade, growth and service sector performance in developed and developing
countries. A review of specific tourism and aviation service sectors are discussed to show
the significance of this study for Fiji in relation to that of the service sector literature. In
Chapter 3, the study provides an overview of the macroeconomic performance of Fiji’s
economy since independence in 1970. A detailed discussion of the tourism and aviation
industries are examined in terms of its demand and supply in the global market, policies
and the reforms undertaken in these sectors.
Chapter 4 discusses the empirical models and methodological framework used to estimate
the two prime objectives of this study for the tourism and aviation sectors. In Chapter 5,
the empirical results are presented for the five tourism models. This includes, first the
determination of whether tourism is major determinant for growth in Fiji. Second, the
hypothesis test related to whether the WTO tourism reforms impacts on tourism exports is
analyzed. This is undertaken through four models in which two, sets tourism receipts as the
dependent variable and the other two equations using tourist arrivals to both assess the
reform impact.
Chapter 6 undertakes an empirical analysis for air services sector and presents the results
relating to the three models on the air service-growth nexus and the aviation reforms and
determinants equations. In this chapter, two key issues are examined. First, the hypothesis
related to whether air services exports has contributed to the growth in total services output
is analyzed. Second, the impact of the public enterprise reforms in the aviation sector on
air services exports is investigated using several reform indicators with other determinants
of air services in Fiji. Chapter 7 presents the conclusions focusing on the key empirical
findings and its associated policy implications. It also suggests research areas for further
investigation.
7
Chapter Two
LITERATURE REVIEW
2.1 Introduction
This chapter analyses the theoretical and empirical literature underlying the study of
service export-growth nexus, and the worldwide pro-competitive and service liberalization
reform programs of the World Bank and the World Trade Organization (WTO),
undertaken in the service sectors of tourism and aviation services. From a macro
perspective of service trade and economic growth, the literature cascades to the
disaggregated exports of tourism and air transport services and the reforms undertaken
therein. These issues have increasingly received attention in order to explain its impact on
overall economic growth and total export performance of tourism and aviation services in
both developed and developing countries. Given the limited literature in service trade
compared to goods merchandise trade, the main objective of this chapter is to examine the
trade in service literature whereby it has been noted that support for the role of trade in
services is crucial for economic growth and development. In particular, small island
nations have recently developed their trade in services through reforms as exports of this
sector form a key determinant of growth particularly for tourism and air services.
The sale of international tourism and air services is a growing phenomenon in the global
market. In defining the two industries from an export point of view, Forsyth (2006a)
described tourism services as the creation of both goods and service products for the
pleasure of visitors from another country in exchange for foreign currencies, and the air
transport services as the conveyance of passengers and cargo of another country in return
for national airline revenues. The increasing vibrant production of both tourism and air
service for export, relative to other services has made the two sectors the most prominent
elements of total services trade. This has been mainly attributed to a host of demand
determinant factors for these services, of which the aforementioned reforms have played a
key role.
Aviation and tourism are closely interlinked. The air transport plays an important role in
exporting tourism services given that aviation is the most widely used means of travel for
most tourists, (Forsyth, 2006a). Most small island developing nations are richly endowed

8
with resources that give them the advantage in exporting tourism services such as a unique
natural environment that can never be experienced in most developed countries. To support
this source of comparative advantage, the aviation sector is crucial for small island nations,
because of its complementary connection to the tourism service industry. In addition,
producing aviation services for exports is an injection to the economy that supplements the
already low merchandise exports in developing countries, thus improving the balance of
payments and stimulating economic growth.
The organization of this chapter is as follows: section 2.2 outlines the concept of trade,
services and economic growth and subsequently frames the discussion in the context of the
reforms undertaken in the service sectors. Section 2.3 concentrates on tourism and aviation
sectors as service export industries and explains the various reforms to facilitate trade in
these sectors. Empirical evidence of former research is presented in section 2.4. In section
2.5, the significance and implications of the literature for Fiji are discussed. The final
section provides a summary of the literature reviewed in this chapter.
2.2 Services Trade-Growth Nexus
During the last five decades, a number of mechanisms have evolved to explain the growth
of economies including Ramsey’s foundational modern growth theory of 1928 the Harrod
and Domar savings and investment growth model of the late 30s and early 40s, the
neoclassical growth theory of Solow (1956), and the more recent endogenous growth
theory expanding on the magnitude and suitability of the neoclassical growth model. The
most commonly used framework for analyzing economic growth has been the extended
version of the neoclassical growth structure by Solow (1956) whereby on the basis of an
aggregate production function, growth is set as a function of the capital and labour inputs
extended to include other factors inputs.
Within the extended neoclassical model, a key factor input that has been widely taken into
consideration is exports (for example, see Balassa, 1978; Ram, 1987; Esfahani, 1991; Ram
2003; Narayan and Smyth 2005). Rooted in the classical Keynesian economic theory of
income growth, exports has commonly been referred to as the exchange of goods such as
agricultural products, food manufactures, garments, cars and other goods merchandise. It
has rarely been related to services, which are obviously also exchanged in the global
market such as air services and tourism.

9
One of the reasons for the lack of recognition of services exports over a long period is the
manner in which classical economists have initially viewed services to be unproductive
and the fact that it cannot be stored after being produced (Shelp, 1987). However, in the
advent of neoclassical economics, services became recognized as something of value in the
same manner as goods. This culminated in the recognition of services as an item of
exchange by the WTO in 1995. Since then, international trade became formally
acknowledged to include both the exchange of goods and services.
Prior to the formal recognition of services as an item of international exchange, several
trade-growth theories had existed in the literature for goods trade, of which some have
been tested for its applicability to services trade. The first relates to the theory of
comparative advantage whereby, Ricardo (1817, cited in Krugman and Obstfeld, 2003)
developed the idea that both parties can benefit from trade if each party specializes in the
good in which it relatively produces cheaply, thus creating static gains from trade which
contributes to overall growth and welfare of the nations. Studies which have shown the
applicability of the theory of comparative advantage to services trade include Hindley and
Smith (1984) and Deardorff (1985).
Secondly, the factor endowment theory by Ohlin (1933, cited in Krugman and Obstfeld,
2003) stipulates that the main reason why countries trade is due to the differences in factor
endowments or the supply of land, labour and capital in the various countries. This trade
pattern encourages specialisation which in turn leads to welfare gains and economic
growth analogous to that of the Ricardian model. Studies by Bhagwati (1984) and Melvin
(1989) have shown that the factor endowment theory is compatible with services trade.
The third trade-growth theory challenged the classical models through authors such as
Myint 1958, 1969; Balough 1973; Smith and Toye 1979; Myrdal 1970; Riedel 1983; and
Toye 1987. This led to the North-South (i.e. developed and developing countries) trade
proposition that associate trade with uneven development. The North-South trade
represents the trade relations between rich (North) and poor (South) countries and argues
that there is unequal exchange between the North and the South due to historical forces,
differences in factor endowments and income elasticities of demand of the North’s capital
goods and the South’s consumption goods. Some of the studies that have been undertaken
to test this theory are Krugman (1981), Chichilnisky (1986), Ocampo (1986) and Dutt
(1988). The relevance of the North-South trade proposition can logically be compared to

10
trade in tourism services in the case where the profits of foreign-owned hotels are
repatriated from a developing country to a developed country where the foreign owner
normally originates from. This led to a new trade-growth proposition to boost economic
growth among developing countries through the South-South trade relations among third
world countries (For example see Greenaway and Milner, 1990; and Mayda and Steinberg,
2006).
In the aftermath of the Second World War, discussions on the lack of money currency and
the increasing gap between the developed and developing countries led to various
explanations on the trade-growth nexus. The first, unlike the aforementioned models,
focused on the directional effect from economic growth to international trade by authors
like Hicks (1953), Johnson (1958), Bhagwati (1958) and Sodersten (1964). They
concentrated on the effect of economic growth brought about by factor accumulation and
technical progress on the terms of trade and national income. The common view put
forward is that economic growth measured by an expansion of the production possibility
frontier, shifts outward in the direction of some goods than in the direction of others. This
increases the relative supply of those goods in which the growth is biased (i.e., either
toward goods usually exported or towards those that a country usually imports), which in
turn affects the volume of trade via changes in the terms of trade. This effect on the terms
of trade is said to impinge on initial growth at home and on the rest of the world (Krugman
and Obstfeld, 2003).
The second set of theoretical response by Rosenstein-Rodan (1943), Lewis (1955) and
Nurske (1953) explains trade with the ‘big push’ or the theory of ‘balanced growth’. They
suggest that developing countries characterized by low income and manufacturing process
can make a big push into industrialization and enhance growth through coordinated
investments in areas that have the potential to reap the benefits of external economies
(Murphy et al., 1989). Specifically, Nath (1962) indicates that the export industry is an area
where investments are to be made to enhance the growth of the economy.
More recently, the literature on the trade growth nexus has been associated with the
endogenous or new growth theory. Romer (1990) and Ben-David and Lowey (1998)
discuss in the context of international trade that the central idea in the new growth theory is
the enhancement of a nation’s human capital or the accumulation of knowledge to enhance
economic growth. This can be realised via the development of new forms of technology

11
and efficient and effective means of production. They specifically point out that the
endogenous free trade policy that increase trade transactions would boost human capital
since engagement in more exports and imports leads to the acquisition of new knowledge
and ideas that improves efficiency in production and economic growth.
Given the general presumed relevance of the aforementioned trade growth theories to
services trade, a number of cross-country studies and reports related to the service export-
growth nexus have been undertaken recently at the aggregate level such as, Langhammer
(2002) for developing countries; Gabriel (2004) for developing and transition countries;;
and Ito and Krueger (2002) for countries in the Asia Pacific region. Investigations and
reports have also highlighted the importance of services as a key driver of economic
growth in both high income and developing countries such as Hoekman and Mattoo (2008)
and Organization for Economic Cooperation and Development (2005). While the results
have been mixed, country specific studies would indicate whether the service export led
growth hypothesis is valid for a particular country. More importantly, the analysis of
services exports at the disaggregated level with economic growth is more advantageous in
terms of deriving policy implications that would allow the common achievement of goals
related to the particular service export sector and the macroeconomy. For this purpose, the
study focuses on the export of services related to tourism and aviation in Fiji. A conceptual
clarification on goods versus services is presented in the next sub-section before the
literature on trade in services, growth and reforms in both the tourism and international air
transport industries is discussed.
2.2.1 Goods and Services – Theoretical Issues
The distinction between a good and a service was first noted by Adam Smith based on the
criteria of productiveness of labour (Shelp, 1987). According to Smith, labour is defined to
be productive if it contributes to the creation of material goods. Since services produced in
the nation (for e.g. a menial servant in the 18th century) do not meet this criterion, the
labour used to create the service was regarded as unproductive. In addition, John Stuart
Mills in the 18th century explained that the ability to be accumulated is essential to the idea
of wealth and concluded that since services cannot be stored after being produced they do
not qualify to be counted as wealth (Shelp, 1987, p. 64-65). These perceptions did not
provide a strong foundation for analyzing trade in services, and as a result there has been
the ignorance by economic thinkers over the over the preceding years (ibid).

12
By the 19th century, further developments in trade and growth theories captured the
concept of labour productivity. This led to the adoption of the neoclassical perspective on
value which became widely understood as the relationship between costs of production and
the subjective elements of ‘demand’ and ‘supply’ Weintraub (2002). On the basis of this
concept, production was defined as any activity that produces something in exchange for
income, and therefore regarded services as a producible commodity with an attached
monetary value similar to the goods output produced.
However, services remain distinct from goods output. Hill (1977) defined a good as a
physical object which can be appropriated and transferred between economic units, and a
service as the change in the condition of a person, or of a good belonging to some
economic unit, brought about as a result of the activity of some other economic unit, with
the prior agreement of the former person or economic unit. Similarly, Deardorff (2001a)
points out that a good is products that can be produced bought and sold and have a physical
identity, while a service is a product not embodied in a physical good and that typically
effects some change in another product, person or institution.
Wolak, Kalafatis and Harris (1998) examine the four main characteristics of a service and
state that they are: (i) intangible; (ii) inseparable; (iii) heterogeneous; and (iv) perishable.
The intangibility of services implies no physical identity because services are basically
activities, benefits or satisfactions which are offered for sale or are provided in connection
with the sale of goods. Unlike goods, services are inseparable meaning that its delivery
requires both the consumer and producer of the service to be located near each other, either
physically or via telecommunications network (Regan 1963; Wong, et al., 2001). In
contrast to goods, services are heterogeneous in the sense that its delivery varies
particularly with those that have a higher labour content where there could be non-
uniformity of the performance by different people involved (Rathmell, 1966). Services are
also perishable because they cannot be stored after production or carried forward to a
future time period. The fact that they are intangible and inseparable makes services
perishable and clearly differentiates it from goods
The recent studies have added to the common features of trade in services. Wong, et al.,
(2001), outline two other special characteristics of services in contrast to goods. First, they
stipulate that services are knowledge and experience-intensive because knowledge and

13
experience is accumulated in learning by doing manner. This means that after the service
provider has completed learning the task of delivering the service, additional services can
be created at low marginal costs, for e.g. a barber providing a hair cut. Secondly, they state
that most services are used as intermediate inputs in the production of other goods such as
management, consulting, accounting and financial services. Deardorff (2001a) in
examining intermediate inputs identified service inputs related to trade (e.g. transport,
insurance and finance) and labeled them as trade services to mean those services that
facilitate export and import of goods and services. He points out that liberalizing these
trade services or intermediate inputs per se, have a crucial role in stimulating trade in both
goods and services. A comprehensive study by Mattoo and Payton (2007) provide an
important overview of services trade and development experiences in the case of Zambia.
In the next sub-section the attention is paid to international trade in services.
2.2.2 Trade in Services
The provision of a service to buyers within or from another country by a firm operating in
or from another country is usually viewed as the international exchange in services.
According to Castle and Findlay (1987), trade in services are often referred to as invisibles
because compared to merchandise trade, they cannot be seen as they cross national
boundaries. Since the service provider and consumer need to be together in most cases for
the delivery of the service, Hoekman and Stern, 1988, p.40; and Snape, 1988, p.81)
highlight the ways in which this contact is made. This includes: (i) the receiver moving to
the producer of services, e.g. tourism; (ii) producer of services moving to the receiver, e.g.
via foreign direct investment in services in the consumer country or sell services from a
base in the producer’s home country; and (iii) providing the service via another service
intermediary, e.g. provision of database services through the telecom network.
These mechanisms of contact delivery make trade in services invisible because what
moves across the national boundary is either the capacity to provide a service, the good or
person which is to be subject to the service or the income flow generated by foreign
investment in the service. These items do not enter the customs shed in the same concrete
manner as shoes or cars (Castle and Findlay, 1987). Deardorff (2001a) notes that because
trade in services is invisible, they are not treated as ‘trade’ leading to its non-inclusion in
the initial negotiations of the 1947 General Agreement on Trade and Tariffs (GATT).
However, in the mid 1980s, services gained recognition as a form of trade and were
14
included for the first time in the WTO’s Uruguay round of trade negotiations held during
the period 1986 to 1993. Based on the service delivery mechanisms described by Hoekman
and Stern, 1988; and originally by Sampson and Snape, 1985, the WTO in 1995, approved
a four-tier classification of trade in services during the Uruguay round as shown in Table
2.1.
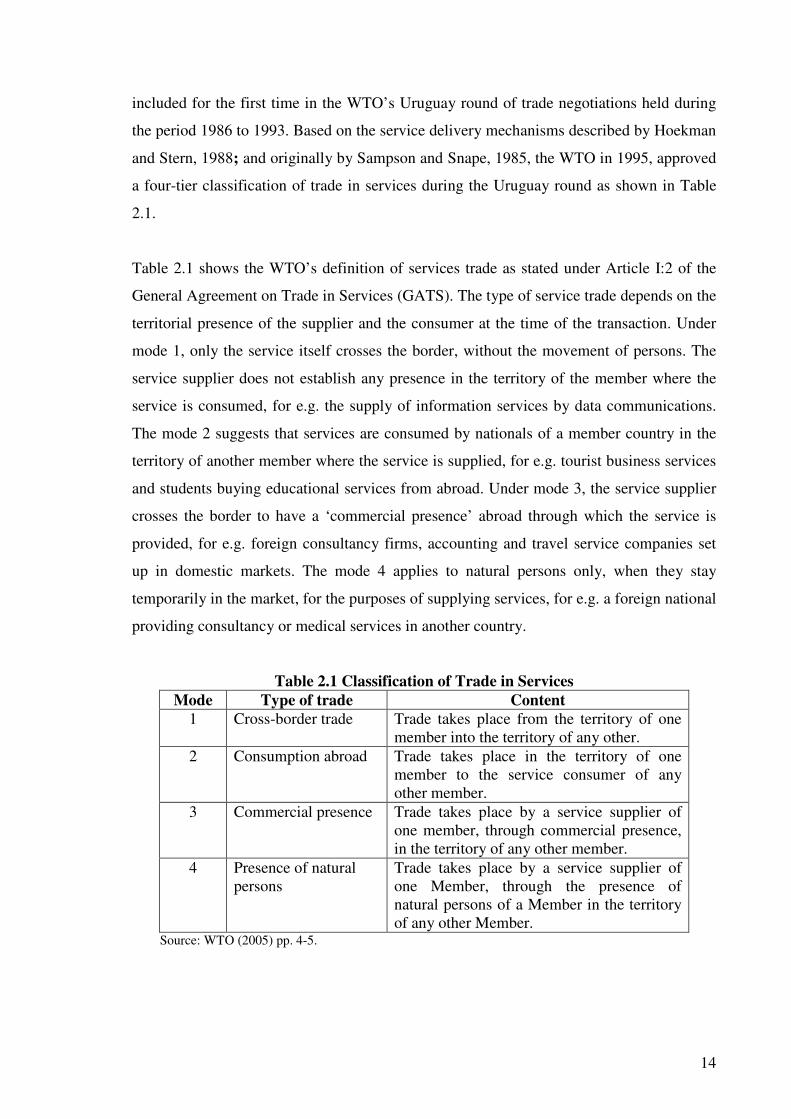
Table 2.1 shows the WTO’s definition of services trade as stated under Article I:2 of the
General Agreement on Trade in Services (GATS). The type of service trade depends on the
territorial presence of the supplier and the consumer at the time of the transaction. Under
mode 1, only the service itself crosses the border, without the movement of persons. The
service supplier does not establish any presence in the territory of the member where the
service is consumed, for e.g. the supply of information services by data communications.
The mode 2 suggests that services are consumed by nationals of a member country in the
territory of another member where the service is supplied, for e.g. tourist business services
and students buying educational services from abroad. Under mode 3, the service supplier
crosses the border to have a ‘commercial presence’ abroad through which the service is
provided, for e.g. foreign consultancy firms, accounting and travel service companies set
up in domestic markets. The mode 4 applies to natural persons only, when they stay
temporarily in the market, for the purposes of supplying services, for e.g. a foreign national
providing consultancy or medical services in another country.
Table 2.1 Classification of Trade in Services
Mode Type of trade Content
1 Cross-border trade Trade takes place from the territory of one member into the territory of any other.
2 Consumption abroad Trade takes place in the territory of one member to the service consumer of any other member.
3 Commercial presence Trade takes place by a service supplier of one member, through commercial presence, in the territory of any other member.
4 Presence of natural persons
Trade takes place by a service supplier of one Member, through the presence of natural persons of a Member in the territory of any other Member.
Source: WTO (2005) pp. 4-5.

15
The various modes 1, 2, 3 and 4 note such recognitions that provide valid evidence of trade
in services actually taking place. It also suggests that the concepts underlying trade in
goods are also applicable to services. In support of this, Castle and Findlay (1987 p.9)
point out that, “similar to goods output, countries have comparative advantage in some
activities traded as services but not in others”. They explain that despite the broadness of
the question of comparative advantage in services as a whole, the gains from international
exchange in goods is just as relevant for any services exchange. Thus the comparative
advantage analysis in examining trade patterns in services is applicable provided that
relevant factor intensities and determinants of competitiveness are identified. By the early
eighties, empirical evidence began that indicate that theory of comparative advantage
applies to trade in services (Sapir and Winter, 1994). This provides the intellectual basis on
which to precede efforts to liberalize trade in services. In the next sub-section, the focus
shifts to trade in services and the reforms focusing on the pro-competitive and trade
liberalization measures.
2.2.3 Trade in Services and Reforms
Services are increasingly becoming important in economic terms for both the developing
and developed countries. During the last 3 decades service trade has multiplied rapidly due
to the advent of information-related technology (Shelp, 1987). Services play a critical role
in determining both the quality and speed of the process of economic development. This
suggests that a competitive economy cannot operate without an efficient and
technologically advanced service sector. However, most developing countries implement
policies that restrict the access of foreign services and service suppliers to domestic
markets. This protectionist approach has promoted the role of the state and has created
inefficiencies and lack of competition in the domestic market (Mohan et al., 2000).
There are several key reasons why most developing countries do not liberalize their trade
in services. Shelp (1987) point out that the balance of payments problems and national
security concerns used by the policymakers to support free trade principles have also been
used to justify protecting service industries. Castle and Findlay (1987), reason that
government regulation of service sector transactions is justifiable on the grounds of public
interest and consensus among consumers and producers. On the other hand, Itoh and
Shimoi (2003) note that trade barriers are erected because of the government fear that its
removal would allow service providers to exercise monopoly power. They add that

16
governments are concerned about threats to national security if they accept foreign capital
in the fundamental services areas.
Given these rationales, the barriers to trade in services have manifested in many forms and
in different country context. Hoekman and Braga (1997) provide some examples of
barriers to trade in services in the second and third columns of Table 2.2. The service trade
barriers have been identified based on the similar impediments that exist in the trade of
goods listed in column 1.
Table 2.2 Service Trade Policy Instruments Goods trade
barrier
Service trade barrier
equivalent
Example of service trade barrier
Quotas Quotas, local content and prohibitions (Quantity restrictions – QRs)
• Bilateral air service agreements that specify airline routes, capacity and the amount of capacity that 3rd country airlines are permitted to offer on that route.
• UNCTAD Liner code that specify cargo sharing arrangements for shipping lines
Tariffs/subsidies Price-based instruments for cross-border type service trade and explicit or implicit subsidies for service industries
• Visa fees for service providers and consumers
• Entry/Exit taxes for service providers and consumers
• Discriminatory airline landing fees
• Port taxes
• ITU procedures on international accounting rate system that charges a collection fee for making an international telephone call.
• Government subsidy to construction, communications and transport service sectors
Technical standards
Standards, licensing and procurement
• Certification and licensing to provide professional and business services such as financial, legal, accountancy and medical services.
• Environmental standards that influence transport and tourism service industries e.g. emission/energy efficiency standard for transport and tourism affected by environment land use restrictions.
Discriminatory access to distribution networks
• A dominant telecommunication carrier imposing restrictions to the use of existing distribution and communications infrastructures.
Source: Hoekman and Braga (1997).

17
In the case of the first instrument in Table 2.2 on the quota imposed on goods, similar
quantity restrictions also exist with services, for e.g. the amount of air service flights to be
provided by designated airlines as stipulated under the bilateral air service agreements
between two countries. Secondly, service trade barriers also exist in the form of tariffs and
subsidies through price based instruments for cross-border type service trade and subsidies
given by governments to service industries. Examples of these include the discriminatory
airline landing fees and port taxes to the airline and shipping firms and high government
subsidy and shareholding in the construction, communications and transport service
industries. In particular, the extensive role of owning national airlines and public airports
by the government has been a common trend in most developing countries barring the
participation of foreign players in these services (Graham, 2001).
A third form of service trade restriction include standards and licensing procedures, such as
environment standards and foreign investment regulations that hinder the delivery of
transport and tourism services or the strict licensing requirements that could hold back the
provision of professional and business services. Lastly, a unique barrier in the service
sector trade is the discriminatory access to distribution networks that disallow the free flow
of trade in services such as a monopoly telecommunication provider blocking the use of
current distribution networks to other providers from abroad.
As a result of these service trade impediments, reforms in domestic service industries
called pro-competitive reforms, and those associated with the opening of market access to
foreign providers called trade liberalization were introduced (Hodge, 2001). The pro-
competitive and trade liberalization measures were part of the first generation of reform
programs of the World Bank which included structural changes in the domestic sectors of
trade, finance, public sector, and the labour market. The World Bank reform model is
firmly based on the neoclassical view of economics particularly the efficiency of free
markets and private producers and the benefits of international trade and competition
Woodward (1993, cited in Mohan et. al., 2000). It is generally aimed at promoting the
economic system of the free market. In linking the World Bank’s programs to the reform
categories by Hodge (2001), the trade reform is basically trade liberalization while all other
reforms and its sub-variants can be regarded as pro-competitive measures geared towards
the promotion of domestic competition before the exposure to foreign competition through

18
trade liberalization. The service trade reform is also facilitated by the free trade agenda of
the WTO under the General Agreements on Trade in Services (GATS).
Recent studies by Sazanami (1988), Ndiyae (2001), Tohammy (2001) and Ikiara, Muriira
and Nyangena (2001) show that services such as telecommunications, information
services, tourism and transportation are being deregulated rapidly and have taken up pro-
competitive and liberalization policy reforms. This has been largely undertaken based on
the net benefits that accrue from removing the barriers to trade in services. According to
perfectly competitive static models, a restriction on trade in goods reduces the level of real
gross domestic product and is equivalent to a loss in welfare. Mattoo, Rathindran and
Subramanian (2006), in examining this issue state that the restriction creates a wedge
between domestic and foreign prices, leading to a loss in consumer surplus that is greater
than the gain in producer surplus arising from higher domestic production and in
government revenue.2 They add that the same distortion also exist in the case of
restrictions in services trade and when these trade barriers are removed, the associated
distortions are also eliminated, leading to an increase in quantity traded and the overall
national welfare.
Further to this theoretical benefit, Hodge (2001) elaborates the benefits and adjustment
costs associated with domestic reforms in service industries (i.e. pro-competitive
regulatory reform) and those related to the opening of market access to foreign providers
(i.e. trade liberalization). Both categories are interrelated and could be mobilized to
promote greater involvement in domestic markets. As such, pro-competitive measures are
an important component of trade liberalization (ibid).
The major benefits of pro-competitive regulatory reform to the domestic economy can be
realized even without trade liberalization. These benefits include: lower price cost margins;
greater efficiency; and higher innovation rates (Hodge, 2001). This links to the view of
(Stern, 2001) who pointed out lower prices and improved product quality filter down to
producers and consumers and add up to significant benefits that outweigh negative
adjustment costs in the reforming sector.
2 See Krugman and Obstfeld (2003, Chapter 8, pp. 186-217) and Mattoo et al., (2006, pp. 87) for a detail
discussion on the effects of trade policy instruments on producers, consumers, government revenue and overall national welfare.

19
Following the first phase of pro-competitive regulatory reform, services are in a situation
to be opened up for market access to foreign providers through the second stage of service
trade liberalization. This policy prescription result in a number of positive effects to the
economy. According to Hodge (2001) the benefits of trade liberalization include increased
competition in the domestic sector as market access is granted to new and additional
foreign suppliers; enhanced transfer of technology and acceleration of learning and
innovation for domestic firms; market expansion for service providers leading to potential
scale economies, larger variety of goods, and increased specialization; efficient allocation
of domestic and world resources due to greater specialization; enhanced downstream
benefits to consumers through lower prices and high quality service products; and potential
trade gains from higher exports as countries discover services in which they have
comparative advantage.
However, allowing free access to foreign services suppliers also has potential negative
effects. Hodge (2001), point out that the disadvantages of free trade in services includes the
loss in output, employment and the loss in future growth opportunities. The loss in output
and jobs occurs if the economy is producing services for which it has no comparative
advantage compared to the more efficient foreign entrants. This could lead to the decline in
the respective service sectors that has been liberalized. On the other hand, if the countries
shift resources to the services in which they have a comparative advantage, there is
potential for loss of future growth opportunities, because specialization along comparative
advantage can bar a country from service sectors where there is scope for rapid learning
and productivity improvements.
The overall net benefits of pro-competitive reform and trade liberalization of services trade
have been largely promoted with the continued growing momentum of world service trade.
The first multilateral trade agreement to cover trade in services was created during the
WTO Uruguay round of trade negotiations held from 1986 to 1993 (WTO, 2005). This
accord, which came into effect in January 1995, was called the General Agreement on
Trade in Services (GATS). The main objective of this treaty as stated in its preamble is to
contribute to trade expansion “under conditions of transparency and progressive
liberalization and as a means of promoting the economic growth of all trading partners and
the development of developing countries” (WTO, 2005). Deardorff (2001a) explains that

20
the GATS allow countries to grant national treatment to foreign services providers and for
them to select and negotiate the service sectors to be covered under GATS. The service
sectors are subject to individual country decisions and negotiated in the trade rounds
through GATS commitments. The categories of services covered under the GATS include
air transport, financial services, maritime transport, telecommunications and all those
services that involve movement of natural persons. In the next section, a review of the
growth and reform literature related to the two focal service sectors of this study i.e. the
tourism and international air transport services, are discussed.
2.3 Tourism and International Air Transport Services
Tourism has been a crucial determinant of economic growth where the touring receipts
contribute substantially to the nations GDP. These impacts have been particularly
significant for developing countries in general and island economies in particular. Studies
for countries in the Caribbean, South Pacific, Indian Ocean, Asia and Latin American
regions show significant contributions of the tourist sector (Eugenio-Martin, Morales and
Scapa, 2004; Durbarry, 2004; and Sica 2005). Air transport services have been developed
to support the tourism sector which forms part of the nation’s service sector development
goals. The tourist sector as in international trade provides the island nations with foreign
exchange that they would not earn through exchange of merchandise goods exports given
their low capacity to produce goods.
Recognizing the existence of trade in services in the late eighties and early nineties has
given more support and credibility to international air transport and tourism services,
which has been analyzed in the international trade perspectives. Findlay and Forsyth (1988,
p.100), explain that trade in tourism services occurs when a person visits a foreign country
and purchases goods and services mainly related to relaxation and leisure. They describe
that when an airline service transaction is taken with a foreign resident, it is exporting air
transport services to its customer’s home country. As such, exchange in tourism services is
regarded as a mode 2 type (consumption abroad) of service trade while exchange in
international air services matches a mode 1 (cross-border) type of service trade delivery
(WTO, 2005).
Findlay and Forsyth (1988), note that trade can occur wherever the airline is flying, as long
as the route consists of a pair of countries, which are home to neither the airline nor its

21
client. In contrast, the provision of tourism services must take place in the exporting
country. Woods, Perry and Steagall (1991) point out that tourism is basically an export
industry that delivers services and experiences produced using domestic resources to
foreign consumers in return for foreign currencies. Instead of importing goods and services
from staying at home, tourists travel to the exporting country and enjoy the experiences
and activities on site.
The exchange of civil aviation and tourism services also portray indefinite intra-industry
trade (Findlay and Forsyth, 1988). Intra-industry trade is the two way exchanges within
industries due to economies of scale rather than specialization and comparative advantage.
For example, Australia exports air services to Japan when Japanese travel by Qantas and
vice versa when Australians travel by Japan Airlines. Intra-industry trade in tourism is
obvious given that most countries are habitually both an exporter and importer of tourism
services (Findlay and Forsyth, 1988).
Another crucial feature of tourism is its joint consumption with land, air and sea transport
services. In a most recent account, Forsyth (2006b) elaborates on the strong linkage
between tourism and air transport services. He states that the connection between tourism
and aviation is apparent when tourists use aviation as the foremost means of travelling to
their destinations. As a result, the characteristics of air transport system in terms of price,
quality and frequency, for example, logically become determinants of tourism demands.
On the other hand, policies directed to air transport will tend to have an influence on tourist
activity. Given these implications on growth the next two sections provide some literature
on the tourism-growth and aviation-growth relationships including the major relevant
reforms that have been undertaken in the service sectors respectively.
2.3.1 Tourism Exports and Economic Growth
The study of tourism and its link to economic growth goes back to Ogilvie’s 1933
evaluation of tourism from an economic standpoint. During that time, the English language
was in the search of a general word to describe a man who performs the simple act of
leaving his home or country, with the intention of returning to it again after a limited space
of time (Ogilvie, 1933, cited in Morley, 1990). The word ‘tourist’ and ‘tourism’ then
gained recognition that Ogilvie derived as what appeared to be the earliest formal meaning
of ‘tourists’ in the English language. Ogilvie’s definition is ‘all persons who satisfy two

22
conditions; that they are away from home for any period of less than a year and, second,
that while they are away they spend money in the place they visit without earning it there
(cited in Morley, 1990, p.5). While the first condition in the definition distinguishes
between a tourist and a migrant in terms of a time limit, the second condition forms the
connection to economic growth in the sense that tourism is termed as an invisible export,
which, from the Keynesian national income identity point of view is a major component of
aggregate demand or GDP.
According to Sica (2005) and Oh (2005) the exportation of tourism services in the
international market are some of the most vibrant economic activities taking place in the
world economy. A total of 807 million people traveled to foreign countries in 2005 and
spent more than US$683 billion (United Nations World Tourism Organization (UNWTO),
2006). Of this, total global tourism activity of around 60 percent took place in developed
countries while 40 percent occurred in the developing countries (UNWTO, 2006).
There are various types of tourism products offered for sale in the international market.
The major categories include air transport, accommodation services, food and beverage
services, sport and recreation, retail sales souvenirs and handicrafts and others. As a result
of this large combination of goods and services tourism is seen to overlap with other
sectors and, as such, is treated as a non-clearly identifiable industry. Doessel and Gounder
(1996), state that a conventionally defined tourism industry does not exist as tourism
involves heterogeneous collection of goods and services. In another study, Sica (2005)
notes that the contribution of tourism activity to an economy is not easily recognized
because tourism involves many different products (such as transportation, mails,
entertainment etc) and that some products (for e.g. a restaurant meal) can be sold to both
tourists and local residents. Despite this conceptual complication many countries have been
able to disaggregate total tourism earnings, arrivals and other tourism variables for
economic policy and analysis. In a recent development by the UNWTO, the
implementation of tourism satellite accounts (TSA) by most countries has improved the
capture of the real contribution of tourism to gross domestic product.3
3 The TSA is a model and software developed in line with guidelines published by the UNWTO and approved by the United Nations Statistical Commission to measure the economic contribution of tourism to gross domestic product (GDP) and to provide analysis of the tourism industry (World Tourism Organization, 2001).

23
During the past few decades, tourism flows have had several effects on local economies. In
terms of the positive effects, Woods, Perry and Steagall (1997), point out that the dollars or
other currencies received by tourism exporters are new monies that provide an additional
stimulus to the domestic economy. Secondly, tourism helps to reduce deficits in the current
account of the balance of payments. Third, it generates government revenues through the
various taxes and fees charged on tourism related projects and services. Through the
multiplier process, tourism also increases sales volume, employment and income (Woods,
Perry and Steagall 1997; Sica 2005). Lastly, while tourism not only represents a main
source of foreign exchange, Vaugeois (2000, cited in Sica, 2005) state that tourism also
broaden the horizons of the economy providing an alternative driving force to the
agriculture and manufacturing industries which are usually the leading sectors in most
developing countries. In this sense, tourism offers a viable option for growth and
development.
Against these positive impacts, tourism has hidden costs, which adversely affect the
domestic economy. Sica (2005) highlights that one of the problems in the industry is the
general lack of job security due to seasonality of employment which is dependent on the
changing demand for tourism activities. For example tourism demand is low during winter
season in the tourism exporting countries and vice versa. He points out that tourism also
adversely affects the domestic economy via import leakage, which occurs when tourists
demand standards of equipment, food, and other products that the local economy cannot
supply. Therefore, much of the income from tourism expenditure leaves the country again
to pay for these imports. Local economies may also be unfavorably affected by export
leakages particularly where the multinational corporations and large foreign businesses
have substantial share in the import leakage. Export leakage thus occurs when these
investors from abroad who finance the resorts and hotels take their profits back to their
country of origin. Nevertheless, because of the multiplier effects of tourism on the
economy, the overall benefits are usually said to outweigh the costs. From this
macroeconomic point of view, tourism thus contributes to economic growth and
employment (Eugenio-Martin, Morales and Scarpa, 2004). The next section discusses the
major reform that has been undertaken in relation to trade in tourism services.

24
2.3.2 Tourism Trade Reform
Given the importance of tourism as a key contributor to economic growth, most countries
are negotiating towards getting rid of the barriers that hinder the sale of tourism services in
the international market through service trade reforms (UNCTAD, 1998). The WTO
Director General in a speech states that many countries in the Asia, Caribbean and the
Pacific (ACP) are focusing their liberalization efforts on tourism, particularly in the
Maldives, Seychelles, Antigua and Barbuda and the Bahamas where travel and tourism
absorb 50 percent of gross domestic product (WTO, 2006). He emphasizes that
undertaking tourism reform by removing regulations that constrain service providers
creates the opportunity to attract greater numbers of tourists.
There are several forms of barriers that hinder the trade in tourism services. Based on the
summary of commitments made by countries regarding tourism services under the GATS,
UNCTAD (1998) outline the barriers to tourism trade under three categories. The first
category relate to hotels and restaurant services, for which the impediments include the
lack of technical feasibility in cross border trade, hard currency regulations, licensing and
non-automatic approval for commercial presence. The second category on travel agency
and tour operator services relate its barriers to the necessity of commercial presence for
cross border trade and limits to the number of foreign travel agencies allowed. In the third
category on tourist guides services, the trade barriers include the non-automatic approval
of commercial presence and nationality for the movement of natural persons.
According to WTO (2006), the most common barrier to trade in tourism services has been
the restrictions placed on the establishment and presence of foreign commercial entities to
provide tourism services. This barrier is of the first category described above and involves
market access limitations to foreign investors in the supply of hotel rooms and
accommodation. From a total of 157 members in the WTO, 83 percent or 130 member
countries have made commitments to open up their tourist sector particularly in the
provision of hotel and accommodation, more than for any other service sector
(Organization for Economic Cooperation and Development, 2008). Some developing
countries which have taken this path include Mozambique, India and Fiji where the
specific common barriers to tourism trade in these countries have been the complex and

25
expensive process for accessing land, national hotel room shortage and the lengthy
investment approval processes (OECD, 2008; and Ministry of Commerce, Business
Development and Investment, 1999). The specific commitments undertaken included
improving land availability to attract foreign direct investment in tourism and improving
FDI investment approval procedures. Such commitments to improve market access and
encourage foreign direct investment have generally contributed to the growth in export
performance of tourism services in both developed and developing countries (UNCTAD,
2007).
2.3.3 International Air Services and Economic Growth
The sale of international air transport services is a growing global phenomenon as air
travels between nations have become an important mode of transport. According to
Euromonitor International (2008), the total number of passengers carried by the world’s
airlines per kilometer had grown at an average of 8 percent per year from 1978 to 2007.
This has contributed to the growth in total airport activity and all other services allied to
the provision of air transport services.
The entire air transport industry comprises all activities that are directly dependent on
transporting people and goods by air. This include (i) the aviation sector that covers
airports, airlines, general aviation, air navigation service providers and those activities
directly serving passengers or providing airfreight services; and (ii) the civil aerospace
sector that manufactures and maintains aircraft systems, frames and engines. Like the
tourism sector, the air transport industry has several impacts on the economy. A recent
study by Oxford Economic Forecasting (OEF), (2005, p.6-21) undertaken for the
international air transport action group (ATAG), state that there are two major categories
of economic benefits from air transport. These include (i) employment and wealth benefits;
and (ii) catalytic or spin-off benefits
Economic benefits in the form of employment occur directly within the air transport
industry such as jobs provided by airlines, airport operations, aircraft maintenance, air
traffic control and regulation, and activities directly serving air passengers such as check
in, baggage handling, on site retail and catering facilities. It also happens indirectly through
the jobs and activities of the suppliers to the air transport industry such as aviation fuel
26
suppliers, building companies that construct additional air transport facilities and the
business services sector providing call centers, information and communication
technology, accountancy etc.
The air transport benefits in terms of wealth creation, includes the multiplier effects when
spending by those in the sector consequently support job incomes in other industries
throughout the economy. The air transport also generates wider catalytic (spin-off) effects
on the performance of the global economy by improving the efficiency of other industries
across the whole spectrum of economic activity. These include trade facilitation, tourism
penetration, increased productivity, supply chain efficiency, investment facilitation,
opportunities for further innovation and positive consumer welfare effects. With such
enormous benefits, air transport services contribute to increase in employment and
economic growth (Button and Taylor, 2000; Oxford Economic Forecasting, (2005); and
Button 2006). The next section describes the major pro-competitive reform measures in the
aviation sector to support further reforms through liberalization of air services.
2.3.4 Reforms in Aviation Trade
An extensive literature exists on the policy reforms related to the aviation industry, as
discussed below. The complexity of the aviation industry in terms of the various service
elements required and their inter-link to produce international air services for exports has
also been reflected in the types of reforms undertaken. These reforms include the pro-
competitive measures of airline and airport privatization and the liberalization of air
services through open sky agreements.
In the case of the pro-competitive reforms, the earlier periods before the mid-eighties had
seen the dominance of various governments in the ownership and management of the
national airlines and public airport infrastructure. The role of governments in airport and
air service functions diminished when England privatized the national airline British
Airways and the British Airports Authority in 1986 and 1987, respectively (Graham,
2001). Since then, there has been considerable privatization activity in the aviation sectors
of developing, developed and more intensely in the Asian transition economies, where
greater involvement by the private sector occurred in the management and operations of
national carriers and airport infrastructure (Forsyth, 1997b).

27
There are several reasons for the reduced role of the state in the aviation sector. Forsyth
(1997b) explains three key factors that were responsible for the first airport and airline
reforms undertaken by the British government. This includes the revenue argument where
the government views the sale of state owned enterprises as attractive for government
budgets. Second, the move to privatize was based on the government desire to alter the
balance between labour union and other interests in the economy. Thirdly and most
importantly was the efficiency argument where government had the belief that the private
sector will operate an airline or airport more efficiently. Overall, there was also the desire
for small government where privatization was seen as a way of lessening government
participation in sectors which could be best left to the private sector (Graham, 2001).
In the case of Fiji, the restructure of the government’s Civil Aviation Authority of Fiji into
Airports Fiji Limited for the airport management function and the Civil Aviation Authority
of the Fiji Islands (CAAFI) for the aviation regulation and safety oversight role was mainly
based on improving efficiency and providing better aviation services (Ministry of
Commerce, Industry, Cooperatives and Public Enterprises, 1998). Similarly, the reduction
of the Fiji government shares in the national airline Air Pacific Limited was undertaken
with the view to introduce foreign management and technical expertise to improve
efficiency in the operation of the national airline (Hicks, 1998; McMaster 2001).
While the neoclassical paradigm promotes the reforms in terms of efficiency of free
markets and private producers, there is a large amount of debate on whether privatization
in aviation and in other sectors has led to efficiency improvements (Forsyth, 1997b). This
debate explains the mixed outcomes from the implementation of privatization undertaken
in most countries. However, a large amount of evidence exists in support of the reform-
efficiency hypothesis postulated by the neoclassical school of thought particularly in the
case of airline privatization (For example see Findlay and Forsyth, 1984; Oum 1995; and
Oum and Yu 1995). This suggests the importance of pro-competitive reforms for economic
efficiency and improvement in air services export performance.
The second major reform activity undertaken in the aviation sector relates to the trade
liberalization of air services. The existing literature notes that international air transport is
one of the most regulated industries (Lehner, 1995; Forsyth, 1997a; Doove, Gabbitas,
Nguyen-Hong and Owen, 2001: Intervistasga2, 2005; and Button, 2006). The regulation of

28
air services operates through a system of bilateral Air Service Agreements (ASAs) among
countries which, due to its bilateral nature, limits the amount of air services produced and
traded in the international market, as opposed to a multilateral open sky policy that
provides an extreme case similar to that of a free trade area. Hutcheson (1996, p. 11-13)
highlights Article 6 of the 1944 Chicago Convention as the original basis for which
bilateral ASAs are agreed upon for the exchange of air service between states. Article 6
states that:
‘No scheduled international air service may be operated over or into the territory of a contracting State except without the permission or other authorization of that State and in accordance with the terms of such permission or authorization.
In the lead up to this final resolution, the five freedom rights given to airlines to operate air
services have been under extensive deliberation and debate among countries. These rights
known as the freedoms of the air outlined in the Table 2.3 below was difficult to evenly
distribute at a multilateral level. Therefore, the Chicago conference through Article 6
produced the standard form of Bilateral Agreements for provisional air routes.
Table 2.3 The Five Freedoms of the Air
Freedom
Type
Description
First Freedom A civil aircraft has the right to fly over the territory of another country without landing, provided the overflown country is notified in advance and approval is given (the right of innocent passage).
Second Freedom
A civil aircraft of one country has the right to land in another country for technical reasons, such as refueling or maintenance, without offering any commercial service to or from that point (a technical stop).
Third Freedom
An airline has the right to carry traffic from its country of registry to another country.
Fourth Freedom
An airline has the right to carry traffic from another country to its own country of registry.
Fifth Freedom An airline has the right to carry traffic between two countries outside its own country of registry as long as the flight originates or terminates in its own country of registry (beyond rights)
Source: Hutcheson (1996).
According to Hutcheson (1996), bilateral ASAs are similar to trade agreements between
two governments, where each party seeks to secure the best possible benefit for its
designated carrier(s). Bilateral ASAs are therefore contracts between two countries which

29
allow their airlines to operate according to agreed conditions such as frequency, capacity
and pricing of air services on defined routes. In this way, the framework limits the
production of air services produced and traded between countries. Competition is ruled out
between carriers in terms of prices and rates because the tariffs are approved by the
worldwide international Air Transport Association (IATA) before governments
subsequently ratify them (Hutcheson, 1996).
In recent years, several developed countries have largely freed up air service arrangements,
for e.g. the Transatlantic aviation market between the cities in the United States (US) and
the countries in the European Union (EU), the Trans-Tasman aviation between cities in
Australia and New Zealand, and the Intra EU liberalization of air services for countries
within the EU. In other developing regions, proposals to free up trade in air services have
been incorporated into various trade agreements such as the Asia Pacific Economic
Cooperation (APEC) and the Association of East Asian Nations (ASEAN), while others
have continued a phased liberalized approach through signing additional bilateral ASAs.
Button (2006) provides a theoretical explanation of the overall economic gains from freer
trade in air transport services. Figure 2.1 indicates that free trade in any activity including
air transport give consumers more choice and ensures that the most efficient producers
deliver goods and services.
Figure 2.1 The Benefits of Freer International Services
Source: Button, (2006).
A B
Domestic producer cost
International cost
Deadweight cost of tariff
Demand
C+T
C
Output 0
Qe Qt
Price

30
Suppose C represents the world market price of air transport services under a perfectly
competitive regime. With the additional costs imposed by the limitations of the restrictive
bilateral ASAs framework, regulation over foreign ownership and the lack of cabotage
rights (Eighth freedom), the total cost of buying the air service rises to C+T for domestic
consumers.4 At this price, fewer air services are consumed as air services produced decline
from Qe to Qt. This results in an overall loss to society equal to the triangular area B in
Figure 2.1. The rectangle A represents a loss in benefits to consumers transferred to the
airlines as they pay higher air fares under the restrictive regime. The low level of efficiency
of the protected airlines may also reflect in the higher cost of air transport. The removal of
the trade barriers through an open sky policy would result in increased competition as more
efficient producers of air transport enter the market previously serviced solely by the
designated airline. As a result, air service liberalization creates new and better services that
would increase the flow of air services traffic, thus producing economic growth and rise in
employment (Intervistas-ga2, 2005).
2.4 Empirical Studies on Tourism, Air Services Growth and Reforms
The review of existing empirical studies is divided into four categories. The first set relate
to the nexus between tourism and economic growth. Next, empirical studies on the impact
of tourism reform on the exports of tourism are outlined featuring the FDI-tourism exports
nexus. The third set of empirical studies focus on the aviation-growth relationship. Finally,
some previous analysis related to aviation reforms are noted highlighting the impact of
airline privatization and liberalization of air services.
Many empirical evidences on the relationship between tourism and economic growth have
emerged in the recent period. For instance Oh, (2005) looks into the causal relationship
between tourism growth and economic expansion in Korea using Engle and Granger two-
stage approach and a bivariate Vector Autoregressive (VAR) model. In using time series
data from 1975 to 2001, he finds that there is no long–run equilibrium relationship between
tourism growth and economic expansion. However, he obtains evidence that economic
growth causes tourism growth in Korea by testing the sensitivity of causality tests under
different lag selections along with the optimal lag.
4 Other freedoms of the air have emerged over time such in addition to the five freedoms outlined in Table 3. This includes 6th, 7th and 8th freedoms and is combinations of third and fourth freedom rights. The 6th-8th freedom rights have not been formally incorporated into any widely recognized agreement.

31
Eugenio-Martin, Morales and Scapa’s (2004) study for the Latin American countries over
the period 1985 to 1998 using the panel data approach and the Arellano bond estimator for
dynamic panels estimate the tourism-growth nexus. They find that tourism is sufficient for
economic growth of these developing countries. In studying the determinants of tourism,
they find that low income countries need certain levels of infrastructures, education and
development to attract tourists while middle-income countries need high levels of social
development like health services and high GDP per capita levels to attract tourists.
In another study Durbarry (2004) use cointegration and causality tests on tourism and
economic growth in the case of Mauritius and finds that tourism has promoted growth. He
substantiates with further evidence that tourism has had a significant positive impact on the
economic development of Mauritius. Demiroz and Ongan (2005) investigate the impact of
international tourism receipts on the long-run economic growth for Turkey. Using
cointegration and Granger causality tests on quarterly data from quarter 1 of 1980 to
quarter 2 of 2004, they find that Turkey’s tourism receipts causes economic growth and
vice versa in both the short and the long-run. Sica (2005), investigates the tourism-growth
hypothesis in the case of eleven South-East Asian and Pacific countries for the period 1990
to 2000. Using a dynamic panel data model that applies pooled ordinary least squares and
the Arellano-Bond GMM approach, he obtained results that confirm the contribution of
tourists on the economic growth in these countries.
A number of empirical studies have also been undertaken on the tourism-growth nexus for
Fiji. The first study by Doessel and Gounder (1996), analyses the extent to which tourist
expenditures can explain Fiji’s economic growth. Using the neoclassical model
specification whereby tourism is viewed as an invisible export for the period 1980 to 1993,
they find that tourism is an important factor that significantly explains the growth in Fiji.
Narayan (2004a) analyzes the economic impact of tourism on Fiji’s economy using a
Computable General Equilibrium (CGE) model. He notes that a ten percent increase in
tourist expenditure in Fiji increases GDP by 0.5 percent, consumption by 0.72 percent, real
national welfare by 0.67 percent and an improvement in the balance of payments. More
recently, Kumar and Prasad (2007) evaluate the contribution of the export of services
dominated by tourism towards Fiji’s total output. In employing the time series technique

32
they find that service exports have a positive impact on the output level in Fiji in both the
short and long run.
In addition to the above tourism growth studies, other related investigations have been
undertaken on tourism demand in Fiji. These studies form the basis of the tourism reform
models estimated in this study. In the first analysis, Narayan (2004b) examines the demand
for tourism in Fiji using the Autoregressive Distributed Lag (ARDL) approach to
cointegration and error correction models. Using time series data from 1970 to 2000, the
long run results show that the income in the major tourist source markets of Australia, New
Zealand and the United States have a positive effect on the decisions of tourists to travel to
Fiji. He also finds that hotel and substitute prices negatively impact on tourist arrivals.
In the second study, Gounder and Katafono (2004) also model Fiji’s tourism demand using
cointegration and error correction techniques. They find that both the long run and short
run results indicate that income of Fiji’s major trading partners and relative prices are
positively related with tourism demand. They also show that political coups reduce the
demand for tourism while cyclones statistically did not have a long term impact on tourism
arrival.
The second set of empirical studies focus on the impact of the tourism reform on the export
performance of tourism services. In particular, the studies relate to the relationship between
foreign direct investment and tourism exports, where the level of foreign direct investment
(FDI) has been used to explain the reform impact on tourist receipts or tourism arrivals.
While not many studies exist on the above hypothesis per se, only two relevant studies
were found to use FDI in a different context other than the reform.
First, the paper by Tang et al., (2007) investigates the causal link between foreign direct
investment and tourism in China. In employing the Granger causality test under a VAR
framework, they find that there is uni-directional causality from foreign direct investment
to tourism. They conclude that this causality has contributed to the rapid growth of tourism
in China during the last ten years.
In another recent detailed study, the United Nations Conference on Trade and
Development (2007) analyzed the impact of foreign direct investment in tourism on

33
various dependent variables including tourism arrivals, tourism receipts and number of
hotel rooms. Using various methodologies such as country case studies, and impact
analysis conducted through surveys in developing countries, they find that at the aggregate
level, a weak positive relationship exists between tourism demand measured by tourist
arrivals and supply capacity measured by number of hotels owned by transnational
companies (TNCs). They also find that there is a positive association between the number
of TNCs and the level of tourism revenues per country.
The third set of empirical analysis focus on international air transport services and
economic growth. Among the few studies in this area, Button and Taylor (2000), examine
the economic benefits largely in terms of employment generation that communities in
America obtain from having direct access to international air services. Using ordinary least
squares and multiple regression techniques on cross-sectional data of 41 US airports in
1996, they show that the availability of international air services to the EU market retain or
internally generate more new economy employment than those without air services.5
Kurth and Co. (1990, cited in Button and Taylor 2000) measure the effects of air services
on local economies surrounding 10 American airports, particularly those related to the
airline service per se and its multiplier implications from the air services to Tokyo and
London. It is found that the air service operation carrying 100,000 passengers resulted in
direct annual expenditure by the airline (excluding fuel) of $2.9m (1990 prices) and
expenditure by incoming tourists of $30.7m. Similarly, the United Kingdom Civil Aviation
Authority (1994, cited in Button & Taylor 2000), examines the economic implications of
new services between Birmingham and New York and between Manchester and Atlanta.
Using multiplier analysis, it is found that after accounting for traffic creation and diversion
effects, the New York route generates passenger benefits of 1 million and 1.2 million
pounds per year for the Atlanta service.
In another investigation, Button and Lall (1999) test the relationship between economic
development (measured by new economy employment) and airline hubs represented by
5 The regression model takes economic development (proxied by new economy employment in 1996) as a
function of (1) Population of the surrounding metropolitan area in 1996; (2) Number of European on-plane passengers in 1994; (3) Number of European airports served in 1994; (4) military expenditure in 1996; (5) time zone; and (6) Total enplanements in 1994.

34
hub airports that link the international gateways in the US. Using correlation analysis for
cities with hub and non-hub airports, they find a positive correlation between hubs and
development and confirm that the direction of causality runs from air service availability to
employment. Green (2002) also studies the connection between airport activity and
economic development. Using first stage regression technique he finds that that there is a
positive relationship between airport activity and economic development for the US major
airports. He also finds that passenger boarding is a powerful predictor of population and
employment growth.
While the above studies look at developed countries within the European Union and the
United States, limited research exist on developing countries. In the case of Fiji, no
empirical analysis exists on the aviation-growth nexus. Previous investigations on Fiji have
largely focused on air transport sector policy and investment planning, infrastructure and
domestic inter-island air services. For instance, the Asian Development Bank funded study
by Beca International Consultants Limited, Wilbur Smith Associates, KRTA Ltd and
Deloitte Ross Tohmatsu (1994) examines the Fiji transport industry with the view to
update the policy for all modes of transport including air services and to derive a transport
investment plan. Using transport demand analysis and economic evaluation tools, they find
that for Fiji’s international airline service industry, the national carrier’s corporate
objectives are clear and reasonable given its difficult competitive market and small aircraft
fleet. However, they recommend that (i) the government review its position on traffic
rights to overseas airlines on a non-reciprocal basis given its readily attitude to accede to
overseas requests; (ii) that no cabotage rights be granted to overseas airlines, including
other Pacific states in the interest of the national carrier and to avoid further dilution of
traffic on the Nadi-Nausori sector; and (iii) the national carrier be given more flexibility to
change its air fares and pricing in response to market conditions.
The final set of empirical studies relates to the aviation reforms. In the particular case of
pro-competitive reforms (i.e. airline and airport privatization) no study has empirically
analyzed the effect of airline privatization on the export of air services. However, existing
studies focus on the relationship between privatization and airline performance in terms of
private efficiency such as Findlay and Forsyth (1984), Oum (1995), Barla and Perelman
(1989) and Oum and Yu (1995). The results of these studies generally point out that airline
privatization leads to productivity growth. These findings are relevant to this study and

35
clarify the channel of impact that could flow from privatization to the overall export
performance of air services.
In the reform activity of air transport liberalization and its impact on aviation export
performance, most recent work has been largely empirical and has shown that the removal
of trade barriers in air transport services contributes to economic growth. Button (2006)
examines the potential economic impacts of deregulating international air transportation
markets focusing on the North Atlantic market and the European component of that
market. Using a mixture of descriptive and empirical techniques, he concludes that the
experience of deregulation of air transport produce significant economic benefits. He adds
that the emergence of more flexible international air transport regimes for extra European
movements has overall benefited those involved in terms of higher passenger traffic and
employment creation.
Micco and Serebrisky (2004) assess the effect of change in the competition regime
(implementation of a series of open skies agreements) on air transport prices. Using cross
section and panel data for all countries in the world over the period 1990-2001 they find
that an improvement in infrastructure from the 25th to 75th percentiles reduces air transport
costs 15 percent while an improvement in the quality of regulation reduces air transport
costs by 14 percent. They also find that open skies agreements reduce air transport costs by
8 percent.
In another worldwide study, Intervistas-ga2 Consulting Inc (2005) examines the economic
consequences of liberalizing air transport for 190 countries in the world. Using a case
study approach of large airline markets and regression analysis using OLS algorithm on a
double log specification model for 190 countries and 2000 bilateral agreements, they find
that liberalization of air services between countries generates significant opportunities for
consumers, shippers and the numerous direct and indirect entities and individuals affected
by such liberalization. They also find evidence that restrictive bilateral services agreements
between countries suppress air travel, tourism and business and consequently, economic
growth and job creation.
More recently, Endo (2007), assess the impact of the bilateral aviation framework on the
import of air transport services in the United States and Japan. While the United States,

36
promote open skies framework, Japan adopted a phased–in liberalization under the
traditional bilateral air services framework. He finds that the number of US and Japanese
citizens flying on foreign carriers has increased. Moreso, the penetration of foreign
imported air services into Japan is significant. Using a regression analysis following the
gravity model approach of time series data from 1992 to 1999, he finds that open skies
liberalization may have contributed to the increased US imports of air services. However,
he concludes that Japan’s relative market openness makes it hard to measure the effects of
liberalization under a bilateral framework.
2.5 Significance and Implications of Fiji’s Services Trade Reforms
This literature has outlined various theoretical concepts and empirical studies that relate to
services and economic growth with a focus on tourism and air services. It also highlights
the pro-competitive and trade liberalization reforms that have been undertaken in the
service sectors and how it impact on the export performance on tourism and air services
exports through the neoclassical paradigm. The main significance of this literature and how
it implicates on Fiji is largely reflected by: (i) the increasing flow of inbound tourists and
total international passenger traffic serviced by the domestic airlines; and (ii) the broad
policy change that Fiji implemented through the acceptance of the World Bank and WTO
reform programs particularly that relating to the trade and public enterprise reforms which
affected the tourism and aviation sectors respectively. Fiji has pursued along this path to
improve its trade in services. Since independence in 1970, the nation focused on the public
sector-led growth and inward looking import substitution before switching to an outward
looking export oriented growth strategy in 1986. The World Bank (1987) points out that
trade liberalization and other pro-competitive reforms are key policy prescriptions of the
outward looking strategy to increase economic growth in developing countries.
While most of the liberalization policies implemented applied to trade in goods, the
introduction of the WTO’s GATS in 1995 extended the multilateral trading system to
include services. This led to a gradual liberalization of trade in services where WTO
member countries volunteered to submit commitments on the service sectors they intend to
open up. Fiji as a member of the WTO is a signatory to the GATS and automatically
accedes to the conditions of liberalization pertaining to services under the GATS

37
framework of rules and disciplines.6 As such, the change in strategy towards free trade in
services at a multilateral level makes the literature relevant to the experience of Fiji’s
international trade in services.
During the last thirty six years, the service sector has contributed to Fiji’s economy,
particularly in terms of employment and output. From 1970 to 2005, the service sector
accounted for an average of 68 percent of gross domestic product (Fiji Islands Bureau of
Statistics, various). In comparison, agriculture and manufacturing accounted for
approximately 21 percent and 13 percent of GDP. In terms of employment, an average of
75 percent of total paid occupations worked in the service sector compared to 4 percent in
agriculture and 20 percent in manufacturing (Fiji Islands Bureau of Statistics, various). In
the international trade arena, the Balance of Payments summary indicates that Fiji is
dependent on the service sector for foreign exchange to offset the trade deficit in the
current account. Foreign exchange from services has increased over the years to maintain a
positive balance for net services earnings.
The largest component of services output in Fiji is the tourism industry measured by the
total GDP activity of wholesale, retail, hotels and restaurants. The Ministry of Commerce,
Business Development and Investment (1999), states that Fiji’s service sector is
predominantly represented by the tourism industry. Another related service provider to the
tourism industry is the airline industry. Both these services are sold in the international
market in return for foreign exchange earnings that contributes to the reduction of the trade
deficit in the current account.
Services trade liberalization in Fiji through the GATS has generally not progressed
significantly. The tourism services sector is largely open with minor barriers to trade. This
has been recently addressed since Fiji’s ratification of the GATS. According to the
Ministry of Commerce Business Development and Investment (1999), only the tourism
service sector has been officially committed for liberalisation under the GATS. This
includes opening up trade in (i) hotels, motels, other tourist accommodation; and (ii)
restaurants. The WTO’s schedule of specific commitments for Fiji outlines the trade
barriers in the above tourism services. In part (i) on hotels and accommodation the major
6 See WTO (2005) for an overview of the GATS agreement.

38
limitations relates to market access in the form of government red tape procedures for
foreigners that wish to invest in the above areas. In the second part on restaurants, the
limitation concerns the government approval procedures on the presence of natural persons
in regards to the types of foreign employees such as chefs and related personnel to be
allowed in the country (Ministry of Commerce, Business Development and Investment
(1999). There is also the imposed barrier through the strict requirement for foreign
managers and skilled employers to provide on-the job training. While efforts to remove
these barriers are in progress, other service sectors have been proposed for inclusion in the
commitment schedule for the Doha round of trade talk negotiations. This includes
international maritime transport services, business services and financial services (Ministry
of Commerce, Business Development and Investment, 2002).
In the case of the aviation services sector, developments to fully liberalize air services
under open skies has not eventuated, in the light of bilateral air service agreements (ASAs)
as a vehicle for determining traffic rights on new agreements with interested States
(Ministry of Transport and Civil Aviation, 2003, p. 2-5). However, Fiji has undertaken pro-
competitive measures in the form of the restructure of the Civil Aviation Authority of the
Fiji (CAAF). This has led to the creation of two new government commercial entities i.e.
Airports Fiji Limited (AFL) and the Civil Aviation Authority of the Fiji Islands (CAAFI)
with a view to improve efficiency in the respective functions of airport management and
aviation regulation and safety oversight. The other reform activity in Fiji’s sector involves
the reduced shareholding of the government in the national airline Pacific. This has
resulted in the introduction of foreign management and technical expertise from Qantas as
they increase their shares in the national airline to 46 percent in 1998 (Hicks, 1998). It is
envisaged that this would facilitate amongst other developments the liberalization of air
services in Fiji at the appropriate time.
At present Fiji’s trade in international air services is still highly regulated with the current
system of bilateral air service agreements. According to the Fiji Ministry of Transport and
Civil Aviation (MTCA) (2003) Fiji has signed a total of 25 air service agreements with
bilateral partners of which only 12 have been utilized. However, the government has
continued to pursue the restricted bilateral air service agreements until the appropriate
framework and infrastructures are in place to support the opening up of air services (ibid).
It is envisaged that the theoretical gains from free trade (that the literature has highlighted)

39
could be reaped if Fiji continues to allow gradual liberalisation to take place in the tourism
and aviation services industries. Given Fiji’s large service sector it is important to examine
the role of this sector and its contribution to growth, and its policy implication.
2.6 Summary and Conclusion
This chapter discusses the service trade sector and various empirical studies that have
evaluated the relationships between services exports, reforms and economic growth. In
particular, it focuses on the effects of tourism and international air services on economic
growth and how the public enterprise and trade reforms in these sectors impact on the
growth and the overall development of the economy.
The following implications can be drawn, first, despite some oppositions to free trade
theory, economies which are open perform better in aggregate than the closed nations in
the long run and that open polices are good for its overall development. Second, services
are productive and qualify as something that can be produced in exchange for income
similar to goods. The recognition of services during the world trade negotiations of the
Uruguay Round from 1986 to 1993 led to the promotion of service as a product that is
exchanged internationally through four main modes of delivery including cross border,
consumption abroad, commercial presence and presence of natural presence. Like goods,
services also have restrictions that hinder its trade in the international market. The tourism
and aviation services are examples of sectors wrought with certain limitations that lower its
trade volume and also its potential to impact on economic growth. The removal of these
restrictions to allow competition can reap potential welfare gains and economic growth.
A number of related theoretical and empirical studies have been undertaken over the last
century covering the trade-growth nexus, trade in services and liberalization, tourism-
growth nexus and the air transport-growth relationship. Although the results are generally
mixed in some areas, a majority of the empirical literature lend support to the contention
that tourism and air services contribute to economic growth and that the removal of trade
restrictions in these sectors have a positive impact on the quantity traded and ultimately
economic growth and development. Various models have been utilized in the studies
ranging from demand analysis, multiplier analysis, computable general equilibrium
models, econometric modeling and simple descriptive and statistical tools. To date most
research on the relationships between service exports, reforms and economic growth have

40
used various kinds of econometric models such as Vector Autoregression and Auto
Regressive Distributed Lag approach to cointegration, Granger causality and ordinary least
squares on panel data, cross section and time series data. In recognition of the effect of
services on economic growth, examination of these hypotheses of how Fiji’s tourism and
air transport affect economic growth over the period 1970 to 2005 and how the trade and
public enterprise reform impacts on the volume of tourism and aviation services traded are
vital. The next chapter provides an overview of Fiji’s economy and based on the literature
noted here examines the empirical models of trade in services in Chapters 4, 5 and 6.

41
Chapter Three
FIJI’S TOURISM AND AIRLINE INDUSTRY: AN
OVERVIEW
3.1 Introduction
In most Pacific Island countries tourism and air transport services depend on each other for
their respective growth and survival (Tourism Council of the South Pacific, 1989). This
mutual relationship is crucial in the island countries as these two service sectors provide
viable export alternatives for economic growth and development. In Fiji, tourism is the
largest source of foreign income achieved largely by the supportive production and sale of
air services to foreign passengers through its national carrier Air Pacific. This study looks
at the two industries as invisible exports and assesses how it impacts on service output and
overall economic growth. It also evaluates the effect of trade and public enterprise reforms
on the respective sector’s growth in output and export performance. The purpose of this
chapter is to provide a basic overview of the Fiji economy and its services sector. It also
reviews the performance of the tourism and aviation sectors and the trade reform
undertaken therein.
Since independence from the British rule on 10th October 1970, Fiji’s economy has
undergone two major policy changes that have led to various changes in the service sectors
and its performance. The first change in the policy took place when Fiji adopted an inward
looking import substitution policy in 1970. The second major policy change occurred
sixteen years later when the outward looking export-oriented policy focus was adopted in
1986. The latter policy change came about in two generations of worldwide reforms
initiated by the International Monetary Fund (IMF) and the World Bank. Among the
sectors affected by this change is tourism which required liberalization under the World
Bank’s trade reform facilitated by the World Trade Organization’s (WTO) General
Agreement on Trade in Services (GATS). The air transport industry also undertook pro-
competitive regulatory reforms in the domestic aviation sector with a view to support the
second stage of allowing future international competition and free trade in air services.
To set the scene, an overview of the Fiji economy is first outlined before drawing on the
services sector and the two focal service industries of this study. The chapter therefore is

42
outlined as follows: section 3.2 provides the socio-economic and political background of
Fiji from independence with a focus on trade and the services sector. An overview of the
reforms in Fiji particularly in the tourism and aviation sectors is presented in section 3.3.
Section 3.4 discusses the performance of the tourism industry. In section 3.4, Fiji’s
aviation industry is reviewed followed by summary and conclusion in section 3.5.
3.2 Fiji’s Macroeconomy: An Overview
Fiji is a small developing island economy located centrally among neighbouring island
countries in the South Pacific Ocean. It has a total land area of 18,272 square kilometres
distributed over 332 islands which are scattered within the total exclusive economic zone
of 1,146, 000 square kilometres. There are two main islands, Viti Levu, covering 10,249
square kilometers and Vanua Levu with a total area of, 5,559 square kilometers. Based on
the 2007 population census, Fiji has a multiracial population of around 827,900 of which
57 percent are indigenous Fijians, 38 percent are Indo-Fijians and the remaining 5 percent
made up of Europeans, Chinese, and other Pacific islanders (Fiji Islands Bureau of
Statistics, 2008).
About 70 percent of the population lives on the main island of Viti Levu, 17 percent on the
island of Vanua Levu, with the remainder spread across the smaller inhabited islands.
Despite its small size and relative isolation, the Fiji Islands are most affluent amongst the
South Pacific island nations. According to the World Bank’s 2007 development indicators
more than 90 per cent of adults can read and write and the life expectancy at birth has
improved from 60 years in 1970 to 70 years in 2005 (World Bank, 2007). Over the same
period, infant mortality has decreased indicating an improvement from around 49 per
thousand to 13 per thousand population (ibid).
After seventeen years of governance of the Alliance Party in 1987, the Fiji Labour Party/
National Federation Party Coalition won the election in April and formed the new
government. However, on 14th May 1987, the democratic rule was disrupted when Fiji’s
Military armed forces under the command of Lt-Col Sitiveni Rabuka who later became
Prime Minister of Fiji (i.e. from 1987 to April 1999) took over the leadership. The period
1987 to 1999 was marked with political instabilities and poor economic performances.
Following the 1999 election, another coup took place in May 2000, which like the previous
coup brought in a period of political turmoil and economic decline. A military appointed

43
government took office before the elections of August 2001. The democratically elected
government under the Soqosoqo Duavata ni Lewenivanua (SDL) Party was overthrown in
December 2006 by the Fiji military forces. The election though is proposed to be in March
2009, as noted by the present interim government, it is yet to be confirmed (Pacific Islands
Forum Secretariat, 2008).
Fiji’s mixed economy comprises of the traditional mode of production (i.e. subsistence
sector and the commercial market economy. Although the market system has had a
significant impact on Fiji, the forces of pre-capitalism still govern many aspects of
decision-making such as communal ownership of land and the effect of tradition and pre-
capitalist institutions (Chand, 2004). Apart from the dual economic structure, Fiji is also
characterized by features such as economic dependence, ethnic diversity and native land
system of tenureship. The economic dependence is reflected in its dealings with the rest of
the world as it largely exports primary commodities in exchange for manufacturing
products from abroad.
The economy is also supported by a large inflow of foreign aid since the time of
independence. Besides the ethnic Fijian population, other ethnic groups that make up the
multiracial groups include Indians, Rotumans, Chinese, Europeans and other Pacific
Islanders. The Indians were brought to Fiji in 1879 under the Indenture system of the
British colonial rulers to work in the sugarcane plantation fields. Since the military coups
in 1987, land, labour and capital as major sources of production have been affected by
political instability. These resources are discussed, in the next section, in detail.
3.2.1 Economic Growth Factors
The experience of growth in national output of the Fiji economy has been based on the
British system from 1874 to 1970. The system of capitalism became well established and
the economy grew rapidly into the era when Fiji gained independence (Knapman, 1987). In
the immediate pre- and post- independence era, the economy experienced rapid growth
mainly due to the rapid expansion of the public sector and increasing exports of sugar and
copra. Since this initial surge in growth, the economy has experienced marked swings in
gross domestic product (GDP) and per capita growth rates. From 1970 to 2005, Fiji’s real
GDP grew at an average of 3.2 percent per annum, while real GDP per capita grew slower
at 1.9 percent per annum (World Bank, 2007). Figure 3.1 shows that the real economic

44
growth over time has fluctuated. Between 1970 and 2005 the annual growth rate of real
GDP varied from a high of 12.22 per cent in 1979 to a low of –6.62 per cent in 1987
(World Bank, 2007). This volatility reflected the impact of natural disasters, changes in
international commodity prices and more recently of political coups of 1987, 2000 and
2006. The positive growth rates over the years were due to the expansionary fiscal policy
of 1986, the devaluations of 1989 and 1998, and the recovery in the sugar sector following
the 1997/1998 drought. On the other hand, the negative growth rates were attributed to the
severe cyclone in January 1985, the two coups in 1987, tropical cyclone Kina in
1992/1993, the Asian financial crisis and the El Nino weather effect in 1997 and more
recently the incident of the second coup in 2000.
Figure 3.1 Fiji’s Annual Growth in Real GDP: 1968-2005 (2000 Prices)
-10
-5
0
5
10
15
68 70 72 74 76 78 80 82 84 86 88 90 92 94 96 98 00 02 04
Year
GD
P G
row
th (
%)
Source: World Bank (2007).
In Figure 3.2 the GDP per capita for Fiji from 1968 to 2005 is shown. The graph shows
that during the first four years after independence, there has been an increase in the real per
capita income. From 1975 to 1985, the average growth rate in real GDP per capita was
relatively steady. Throughout this period, the Government pursued an inward-looking
economic development policy with a strong emphasis on import substitution, self-
sufficiency, and economic diversification. The period was also marked with the dominant
role of the state under a public sector-led growth strategy (Reddy, Prasad, Sharma,
Vosikata and Duncan, 2004). In 1987, two military coups disrupted a strong economic
recovery that had started in 1986. The coups caused a collapse in business confidence as
tourist arrivals plummeted, sugar production fell sharply, and there was a flight of both
capital and skilled workers out of the country (Gounder, 1998, 1999, 2002). It took two
substantial devaluations, totaling 33 per cent, and the imposition of strict foreign exchange

45
reins, to control the rapid erosion of foreign reserves caused by these events (Reserve Bank
of Fiji, 1987).
Figure 3.2 Real GDP Per Capita (2000 prices): 1968-2005
0
1000
2000
3000
68 70 72 74 76 78 80 82 84 86 88 90 92 94 96 98 00 02 04
Year
F$
Source: World Bank (2007).
Following the coups in 1987, the Government began to restructure the economy with
outward-looking trade policies (Government of the Republic of Fiji, 1993). The economy
responded rapidly and, despite the low investment performance, it grew by 7.4 per cent in
1989. From 1987 to 1998 the growth in real GDP per capita improved with an average
growth rate of 1.2 per cent per annum compared to the relatively steady growth experience
of the late 1970s and early 1980s (World Bank, 2007). In this period the garment industry
emerged as a major source of jobs. There was a greater variety of primary exports, such as
sugar, fish, gold and timber and major tourism facilities expanded in response to the steady
growth in visitor numbers. By 1998, the economy experienced a decline in the production
and export of sugar and copra. In 2000, Fiji faced its third political upheaval which had a
significant and negative impact on the growth in real GDP (Gounder, 2002). A series of
political and constitutional developments took place which saw the change in leadership
and policy priorities. While all parts of the economy were affected by the downturn, the
tourism, garments and construction sectors were the most directly affected by the political
instability (Reserve Bank of Fiji, 2000).
A wide economic recovery program was implemented in 2001 and resulted in a turn
around growth to 1.96 percent. Growth was essentially driven by the gradual return of
tourists and by a deliberate increase in government capital expenditure initially targeted to
bring about economic recovery. In addition, rising inflow of remittances from Fiji citizens
abroad has been noted as a key component of foreign exchange. In 2002, the expansionary

46
fiscal policy stance was maintained to make up for the decline in private sector investment
which had not recovered since the events of 2000 (Ministry of Finance and National
Planning, 2002). Although this led to an increase in government deficit, the economic
growth rate increased to 2.51 percent in 2002. In 2003, growth fell back to 1.46 percent, at
a time when government reduced its fiscal stimulus. The positive growth in 2004 and 2005
can be attributed to the government’s overall medium term strategy to rebuild confidence
for stability and growth outlined in the Strategic development 2003-2005 (Ministry of
Finance and National Planning, 2004).
Inflation
The general rise in prices of goods and services over the period was on average around 6.6
percent per annum with a high of 22 percent in 1973 and a low of 0.7 percent in 2002.
During the 36 year period the fluctuation of inflation rates has been due to various reasons
ranging from imported inflation, introduction of new taxes such as the Value Added Tax
(VAT) on consumable items, in 1992 the temporary rise in food prices following natural
disasters, oil price shocks, wage increases in the private and public sectors and
containment of prices through monetary policy (Ministry of Finance and National
Planning, 2002). Figure 3.3 shows the trend in inflation since 1970. It can be seen that
towards the last ten years from 1995 to 2005, the government has been able to contain the
level of annual inflation within the 5 percent mark.
Figure 3.3 Annual Average Inflation Rate: 1970-2005
0
5
10
15
20
25
70 72 74 76 78 80 82 84 86 88 90 92 94 96 98 00 02 04
Year
Infl
ati
on
Ra
te (
%)
Source: World Bank (2007).

47
Employment and the Labour Market
Fiji’s labour market is characterized by a predominantly young working population with
substantial flexibility despite some regulation by the wages boards and presence of trade
unions in various sectors of the economy (Kasper, Bennett, Blandy, 1988). During the
thirty six years from 1970 to 2005, Fiji’s total labour force has increased at an average of
2.7 percent per annum from 153,868 in 1970 to 386,285 in 2005 (World Bank, 2007). Of
this total annual labour force estimates, an average of 36 percent are in continuous paid
employment. The Fiji Islands Bureau of Statistics estimates that the total number of
people engaged in paid employment has grown by 2.6 percent per annum from 51,590 in
1970 to 118,900 in 2005. This indicates that Fiji’s skilled labour force has increased the
paid employment (established) category which contains the majority of Fiji’s trained
manpower.
Figure 3.4 shows the number of people in paid employment over time. The graph shows
that employment in the agriculture, mining and quarrying have relatively declined from
1970 to 2005 while employment in manufacturing and services as a whole has increased
indicating the change in the economy’s structure from a primary based (agriculture) to
secondary based manufacturing and service sectors. The services trend consists of
employment in public utilities, construction, wholesale and retail, restaurants and hotels,
transport and communications, financial and other community and social services.
According to the Ministry of Finance and National Planning (2004, p.108), a total of about
17,000 people enter the labor force for the first time every year, of which about 9,700
people find jobs in the formal sector with the remainder largely absorbed into the informal
sector and cash crop or mixed cash crop/subsistence agriculture. The new entrants to the
labour market mainly consisting of school leavers and some laid-off workers seeking re-
employment On the other hand, the number of employees leaving the labour force each
year due to retirement, death and emigration is around 8000 to 9,000 people. This leaves a
net annual increase in the formal labor force of between 700 and 1,700 workers per annum.
The relatively high rate of emigration has created a general shortage of skills which has
shown to intensify in the event of coups (Narayan and Smyth, 2005).

48
Figure 3.4 Total Paid Employment by Sector 1968-2006
0
20
40
60
80
100
120
140
68 70 72 74 76 78 80 82 84 86 88 90 92 94 96 98 00 02 04 06
Year
No
. o
f em
plo
yees (
000)
Community, Social and personal servicesFinance, Insurance and Real Estate and Business ServicesTransport, Storage and CommunicationWholesale & Retail Trade, Hotels and RestaurantsConstructionEletricity, Gas and WaterManufacturingMining & QuarryingAgriculture, Fisheries & Forestry
Source: Fiji Islands Bureau of Statistics (various).
Savings and Investment
Aggregate investment levels in Fiji comprise of capital expenditure by the central
government, public enterprises and the private sectors. From 1970 to 2005, real total gross
fixed capital formation (at 1989 prices) increased at an average of 4.6 percent per annum
from F$181m in 1970 to F$531m in 2005 (Reserve Bank of Fiji, 2007). Investment by the
central government as a percent of GDP has been around an average of 3.8 percent of
national output per annum. For public enterprises, its share of investment as a percent of
GDP is approximately 5.5 percent per annum over the 36 year period. The private sector
investment to GDP ratio has been the largest component taking about 11 percent of total
GDP over the same period. However, total investment as a share of GDP has generally
declined from around 20 percent in 1970 to around 18 percent in 2005 (Reserve Bank of
Fiji, 2007). All the components of investment showed a general decrease in its share of
GDP over time as a result of the coups with a marked decline experienced by the private
sector investment component (Gounder, 2005). The government of Fiji targets the level of
49
investment to be 25 percent of GDP which is also the target set for most developing
countries (Ministry of Finance and National Planning, 2002).
Over the years savings from domestic and foreign sources have provided a pool of
financing investments in Fiji. Apart from the forms of savings such as insurance and bank
deposits, a compulsory national savings scheme administered by the Fiji National
Provident Fund ensures a minimum level of domestic savings within Fiji. In Figure 3.5, the
total savings as a share of GDP shows a relatively low and declining trend. There are
several explanations for this trend. The World Bank (2000) explains that the declining
level of savings in Fiji and other Pacific island countries is due to the high consumption
levels, shallow financial systems and the tight money supply management by the central
bank. Given the close link between having a job opportunity and savings, the other
possible reason for the low savings is the high rate of unemployment, low wages and the
large number of people employed in the informal sector (Reddy, Naidu and Vosikata,
2005). The low level of savings is also attributed to the low level of economic growth over
time (Narayan and Narayan, 2006).
Figure 3.5 Investment and Savings to GDP Ratio
0
10
20
30
70 72 74 76 78 80 82 84 86 88 90 92 94 96 98 00 02 04
Year
% o
f G
DP
Government Investment to GDP RatioPublic Investment to GDP ratioPrivate Investment to GDP ratioGross Savings to GDP ratio
Source: Reserve Bank of Fiji (2007) and World Bank (2007).

50
Exchange Rate
Fiji has a fixed exchange rate regime where the value of the Fiji dollar is fixed against a
trade-weighted basket of currencies comprising the United States dollar, Japanese yen,
Australian dollar, New Zealand dollar and United Kingdom pound sterling. Figure 3.6
shows the trend in the real effective exchange rate for Fiji during the last thirty six years. It
can be seen that the real effective exchange rate has generally declined with marked
decreases in the years of the devaluation i.e. 1987 and 1998. This indicates that Fiji has
been able to generally maintain its level of price competitiveness in the international
market.
Figure 3.6 Real Effective Exchange Rate 1968-2005
0
60
120
180
240
68 70 72 74 76 78 80 82 84 86 88 90 92 94 96 98 00 02 04
Year
RE
ER
Ind
ex
Source: World Bank (2007). 2000=100
Following the first coup in 1987, the Reserve Bank of Fiji imposed strict foreign exchange
controls and devalued the currency by 33 percent in two steps in June and October 1987.
Between the end of 1988 and the beginning of 1998, however, the real exchange rate was
then allowed to appreciate gradually against the trade-weighted basket of currencies. By
January 1998 it had gained nearly 12 percent over its value at the end of 1988 (Reserve
Bank of Fiji, 1998). This appreciation eroded the international competitiveness of
exporters and domestic producers and helped sustain the continued pressure for tariff
protection from domestic producers. On 20 January 1998, the Fiji dollar was devalued by a
further 20 percent, mainly in response to concerns about the competitive position of Fiji’s
tourist and export industries (such as garments and sugar) in the face of the rapid
devaluation of Asian currencies in the aftermath of the 1997 Asian financial crisis (ibid).

51
By virtue of the 1998 devaluation, the economy at the beginning of 1999 stood in a newly
strengthened competitive position vis-à-vis its competitors. Since then, the benefits have
been slowly dissipated through increases in the cost of goods and services.
3.2.2 Fiji’s International Trade in Goods and Services
Fiji is engaged in the international trade of goods and services. Over the years, its trade
pattern has generally been supported by the nature of its comparative advantage. This
nature of Fiji’s comparative advantage is seen in terms of its people, natural resources,
climate and the network of trade and aid agreements. In terms of the labour resources, Fiji
is an English speaking country which provides an advantage for doing business. The level
of adult literacy, health standards, and the labour market have improved providing some
competitive edge in conducting international trade activities. The country is also well
endowed with fertile agricultural land, forestry resources, gold and marine resources and
has the natural endowments of sand, sea and sun, and friendly people which make it an
ideal tourist destination. Other features which have reinforced its nature of comparative
advantage has been the valuable traditional trading agreements and other informal linkages
with major markets in Europe, Japan, the United States, Australia and New Zealand as well
as with its immediate Pacific neighbors.
According to the World Bank’s 2007 development indicators, Fiji’s total real exports of
goods and services had increased by an average of 3 percent per annum from F$483m in
1970 to about F$1.5b in 2005 (1989 prices). In terms of imports, Fiji’s purchases from
abroad increased by an average of 5 percent per annum from F$402m in 1970 to F$1.8b in
2005. Fiji mainly exports primary-based products consisting of sugar, gold, garments, fish,
coconut oil, dalo and footwear. The major import items include mineral fuels,
manufactured goods, and machinery and transport equipment. Fiji conducts international
exchange with a number of countries including Australia, United States, United Kingdom,
New Zealand and Japan and other Asian and Pacific Island countries. Since the time of
independence, New Zealand and Australia have been Fiji’s major trading partners.
Fiji also trades internationally in services merchandise. Based on available statistics on
services trade under the Balance of payments summary (see Table 3.1) both the export and
import of services had increased dramatically from 1990 to 2006 (Fiji Islands Bureau of
Statistics, various). According to the Fiji Islands Bureau of Statistics (2007), Fiji trades

52
with other countries in sea and air transportation services, business and personal travel
services, postal and telecommunication services, construction, insurance, financial
services, computer and information services, government services, and other business
services. Fiji overall has been importing more from abroad than exporting to other
countries. However, the services trade component has been producing positive net effects
compared to goods trade and all other sub-balances in the current account as shown in
Table 3.1. This indicates that Fiji is dependent on the service sector for foreign exchange to
offset the trade deficit in the current account. In other words, while the import of goods has
been exceeding the export of goods (i.e. negative goods balance), there has been a large
compensating surplus by the services trade account.
Table 3.1 Fiji’s Trade in Services and the Current Account
Year Balance of Goods
(F$m)
Balance on
Services (F$m)
Exports of Services
(F$m)
Imports of Services
(F$m)
Balance on
income (F$m)
Balance on
Transfers (F$m)
Current Account Balance (F$m)
1990 -331.9 267.9 649.1 381.2 -70.3 68.5 -65.8
1991 -269.8 232.5 659.2 426.7 -58.5 105.8 10
1992 -294 258.8 715.1 456.3 -75.2 117.4 7
1993 -425.5 286.7 781.8 495.1 -83.6 106.5 -115.9
1994 -326.7 290.3 826.1 535.8 -126.1 70.2 -92.3
1995 -330 278.7 839.3 560.6 -101.2 126.3 -26.2
1996 -265.9 326.8 906.4 579.6 -86 112.7 87.6
1997 -378.5 427.6 1013.1 585.5 -104.1 105 50
1998 -381.6 351.9 1051.2 699.3 -162.8 181.1 -11.4
1999 -477.4 398.3 1209.3 811 -196.9 128.5 -147.5
2000 -483.4 192.2 901.1 708.9 36.5 111.8 -142.9
2001 -614.9 243.9 919.9 676.0 -39.7 153.4 -257.3
2002 -690.5 465.2 1098.7 633.5 8.8 171.6 -44.9
2003 -729.6 411.8 1163.9 752.1 -21.4 159.9 -179.3
2004 -1096.6 350.6 1192.0 841.4 -19.1 123.2 -641.9
2005 -1291.8 481.1 1369.0 887.9 -78.1 218.5 -670.3
2006 -1607.9 400.3 1339.5 939.2 -209.3 -78.8 -1238.1
Source: Fiji Island Bureau of Statistics (various).
In Figure 3.7, it can be seen that Fiji’s largest service exports in 2005 are transportation
(mainly air and water transport) and travel. These services represent the main tourism
products purchased by foreign visitors to Fiji (i.e. air transport and hotel accommodation).7
The largest service imported is transportation which has a total almost in par with the total
transport export value. This supports the existence of intra-industry trade in air services
where Fiji nationals travel other international airlines. Fiji has a net import situation in the 7 See also Figure 3.12

53
case of business services and other services including communications, insurance, financial
services, construction, computer and information, royalties, government and cultural and
recreational activities.
Figure 3.7 Services Exports and Imports by Major Components - 2005
0
100
200
300
400
500
600
700
800
Transportation Travel Other Business
services
Other
Types of Services Traded
F$m
Exports Imports
Source: Fiji Islands Bureau of Statistics (2007). Notes: Services under ‘Other’ includes communications, insurance, financial services,
construction, computer and information, royalties, government and cultural and recreational activities.
3.2.3 The Service Sector in Fiji
One of the most important components of the GDP contribution is the service sector.
Figure 3.8 exhibits the growth in GDP services over time. According to the Fiji Islands
Bureau of Statistics, the service sector accounted for an average of 68 percent of GDP (at
constant 1989 prices) over the period 1970 to 2005. During the same period total services
output grew on an average of 4.4 percent. In comparison, the goods (merchandise) sector
accounted for an average of 32 percent of GDP over the same period and grew at a slower
average rate of 2.5 percent per annum (Fiji Islands Bureau of Statistics, various).
The service sector is also important to Fiji because of its contribution in terms of
employment. From 1970 to 2005, the service sector employed an average of 75 percent of
total paid employment compared to 4 percent in agriculture, and 20 percent in
manufacturing (Fiji Islands Bureau of Statistics, various). In the international trade arena,
the Balance of Payments summary indicates that Fiji is dependent on the service sector for
foreign exchange to offset the trade deficit in the current account. Foreign exchange from
services has been relatively steady and net services earnings have been positive through
out the years.

54
Figure 3.8 GDP Goods and GDP Services 1970-2005 (Constant 1989 Prices)
0
400
800
1200
1600
2000
68 70 72 74 76 78 80 82 84 86 88 90 92 94 96 98 00 02 04
Year
F$
m
GDP Goods GDP Services
Source: Fiji Islands Bureau of Statistics (various). Notes: GDP Goods comprises total agriculture, forestry, fishing, mining, quarrying and
manufacturing outputs. GDP Services consist of total output from electricity, construction, tourism, transport, communications, finance, community and personal services.
The service sector in Fiji consist of electricity and water services, the construction
industry, wholesale and retail, hotels and restaurants, transport and communications,
finance, insurance and business services; and community, social and personal services.
Based on a service sector study conducted in 1999 by the Government, it was found that
Fiji’s service sector is predominantly represented by the tourism industry (Ministry of
Commerce, Business Development and Investment, 1999b). Figure 3.9 compares the
breakdown of services in 1974, 1984, 1994 and 2004. It can be seen that tourism
represented by wholesale and retail, hotels and restaurants took up the most of the services
sector at an average contribution of 28 percent of GDP (Fiji Islands Bureau of Statistics,
various).
Figure 3.9 also shows that another significant contributor to the service sector is transport
and communications. Within this category, air transportation service is the largest
component of total transport services compared to the contributions rendered by the road
and sea modes of transportation. In this regard tourism and international air transport are
crucial service industries as they are largely produced for both domestic and foreign

55
consumption. The next section discusses the reforms in Fiji and details the particular
reform carried out in the tourism and airline industry.
Figure 3.9 Breakdown of Services Contribution to GDP – 2004
0
5
10
15
20
25
30
35
A B C D E F
Service com ponent of GDP
% G
DP
Co
ntr
ibu
tio
n
1974 1984 1994 2004
Source: Fiji Islands Bureau of Statistics Key Statistics (2004). Legend: A = Electricity, B=Construction, C=Wholesale and Retail Trade, Hotels and Restaurants, D=Transport E=Finance, Insurance, Real Estate and Business Services, F=Community, Social and Personal Services.
3.3 Economic Policy and Reforms in Fiji
The literature review undertaken in Chapter 2 has highlighted the relevance of the World
Bank reform program to Fiji. The reform is generally understood as moving towards
developing a more market-oriented economic system (Fanelli and Popov, 2003). This view
will be discussed in the light of its application to the service sectors of tourism and air
transport. Prior to undertaking this, an overview of the reform in Fiji and the rationale for
its adoption is discussed.
Throughout the 1970s and early eighties, Fiji’s economic policy was focussed on a strategy
of import substitution, self-sufficiency and a heavy involvement of government in
business. This strategy was in place at the time when the International Monetary Fund
(IMF) and the World Bank introduced the first generation of reforms known as the
stabilization policies of the 1970s, which had the objective of stimulating the supply side
dynamics of the economy. Many developed countries first adopted this worldwide program

56
where the specific changes included liberalization of trade, deregulation of public, labour
and financial sectors and reducing the size of government.
Fiji did not adopt these policies until 1986 when it realised its poor growth performance
that led to implementing the reforms following the political coups of 1987. Prior to
embarking on such a policy, Fiji was faced with the high prices and cost of doing business;
it had a large public sector and high level of government spending; there were market
distortions caused by the system of taxation, non-competitive wages; native land issues and
bureaucratic control over land and land use; inefficient public enterprises; and high level of
regulation in the financial market (Government of the Republic of Fiji, 1993). These
problems and issues hindered the achievement of an export led growth policy and formed
the basis for necessitating the reforms in Fiji.
In 1989, the full switch to an integrated policy centred on the acceleration of economic
growth led by expanding exports was made at the 1989 National Economic Summit.
Taking its course from the World Bank’s stance, the key reform policies adopted by Fiji
included; trade deregulation; taxation reforms; labour market reforms; reduction in the size
of government and managing the role of government; public enterprises reform; and the
mobilisation of all sectors of the community in support of economic expansion
(Government of the Republic of Fiji, 1993). The objective of these policies were to bring
down domestic prices closely into line with world prices via trade deregulation; ensure
availability of resources for growth in the private sector through cutting down the size of
government; minimize market distortions via taxation reform; liberalize the financial
market; and maintain a competitive wage structure. These reforms were anticipated as a
package that required complementary implementation to achieve the overall objective of
export orientation and open market strategy.
Since the introduction of the reforms in 1986, consecutive Fijian governments have
maintained the World Bank stance of promoting the market system and the overarching
strategy of export-led growth (Akram-Lodhi, 2000). However, despite the growth of many
countries as a result of applying the reforms, it became generally obvious that the benefits
of the first generation of reform did not filter down to the grassroots for which the reform
was intended (International Monetary Fund, 1997). This led to the second generation of
reforms introduced with the objective to build sound social, political and economic
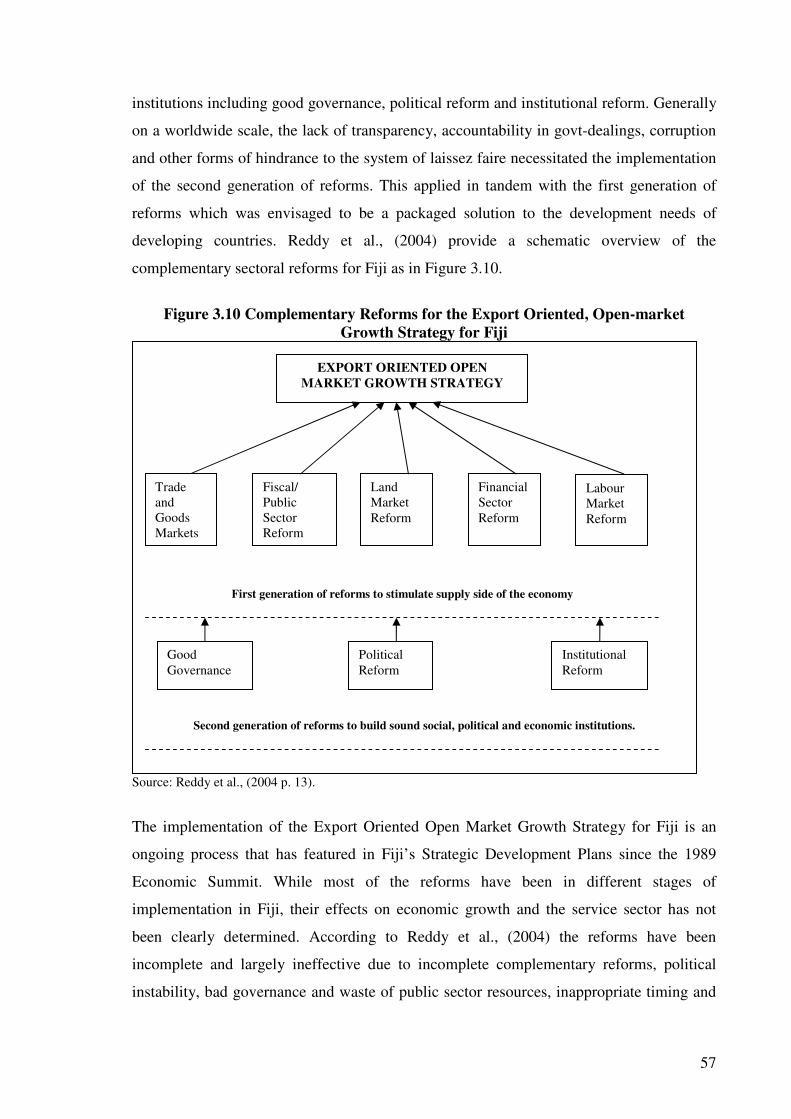
57
institutions including good governance, political reform and institutional reform. Generally
on a worldwide scale, the lack of transparency, accountability in govt-dealings, corruption
and other forms of hindrance to the system of laissez faire necessitated the implementation
of the second generation of reforms. This applied in tandem with the first generation of
reforms which was envisaged to be a packaged solution to the development needs of
developing countries. Reddy et al., (2004) provide a schematic overview of the
complementary sectoral reforms for Fiji as in Figure 3.10.
Figure 3.10 Complementary Reforms for the Export Oriented, Open-market
Growth Strategy for Fiji
Source: Reddy et al., (2004 p. 13).
The implementation of the Export Oriented Open Market Growth Strategy for Fiji is an
ongoing process that has featured in Fiji’s Strategic Development Plans since the 1989
Economic Summit. While most of the reforms have been in different stages of
implementation in Fiji, their effects on economic growth and the service sector has not
been clearly determined. According to Reddy et al., (2004) the reforms have been
incomplete and largely ineffective due to incomplete complementary reforms, political
instability, bad governance and waste of public sector resources, inappropriate timing and
EXPORT ORIENTED OPEN
MARKET GROWTH STRATEGY
Fiscal/ Public Sector Reform
Land Market Reform
Good Governance
Political Reform
Institutional Reform
Trade and Goods Markets
Financial Sector Reform
Labour Market Reform
Second generation of reforms to build sound social, political and economic institutions.
First generation of reforms to stimulate supply side of the economy

58
sequencing of reforms, political economy of stakeholders, institutional rigidities and
constraints to reform, and the lack of electoral competition and policy reform. This
research focuses on the reforms undertaken in the sector markets that influence the
international trade of tourism and air transport services in Fiji. Specifically it will try to
statistically measure the effect of the reforms undertaken on the respective sector’s overall
export performance. The reforms undertaken in these sectors are elaborated in sections
3.3.2 and 3.3.3.
3.3.1 Trade Liberalization in Fiji’s Tourism Industry
The shift in economic policy focus in the late 1980s exposed Fiji’s tourism sector on the
World Bank reform agenda of the 1970s. Specifically, of the various reforms outlined to
promote the market, tourism as a service export sector became subject to international
trade reform which aimed at eliminating exchange barriers and improving competitiveness
under the auspices of the WTO. The ultimate objective was to reduce labour cost per unit
of goods and services produced for sale in the global market.
After adopting the World Bank’s first generation of reforms in 1986, Fiji became a
member of the WTO ten years later in 1996. As a member, Fiji is obliged to work towards
eliminating barriers to trade of both goods and services. The elimination of trade barriers in
services is specifically governed by the WTO’s General Agreement on Trade in Services
(GATS). The GATS is the framework of rules and disciplines that governs the
liberalization of services trade in WTO member countries and applies in principle to all
services with the exception of those services supplied in the exercise of governmental
functions and those provided by non-government organization (NGOs), which are not
supplied for profit or in competition with other suppliers.
Since the trade talks round of 2000 where the GATS commitments of member countries
were first negotiated, Fiji committed the tourism and travel related services as the only
service sector to liberalize (Ministry of Commerce, Business Development, and
Investment, 1999). Table 3.2 outlines this pledge as registered under the WTO. This
commitment came about as the international trade in tourism and travel related services
have been restrictive to foreign investors in the tourist sector in terms of market access and
national treatment.

59
Table 3.2 Fiji’s Schedule of Specific Commitments to the GATS SECTOR –SPECIFIC COMMITMENTS
Sector or Sub-Sector Limitations on Market Access Limitations on National
Treatment
Fiji 9. Tourism and Travel
Related Services
A. Hotels, Motels, Other Tourist Accommodation (CPC 641)
1) None 1) None
2) None 2) None 3) Normal government approval and
registration required for all foreign investors
3) None
4) Normal government approval required for foreign nationals. Entry limited to key post management and time post skilled employees where these are unavailable locally. Time post appointments for skilled employees is three years initially and extension is subject to immigration department requirements.
4) Foreign managers/skilled employees required to provide locals with on-the-job training
Restaurants 1) None 1) None (CPC 642) 2) None 2) None 3) Normal government approval and
registration required for all foreign investors. Limited to specifically restaurants and hotel restaurants, where speciality restaurants unavailable.
3) None
4) Normal government approval required for foreign nationals. Entry limited to key post management and time post skilled employees where these are unavailable locally. Time post appointments for skilled employees is three years initially and extension is subject to immigration department requirements.
4) Skilled foreign employees required to provide training to locals
Source: WTO Services Database Output, WTO (2008). Notes: Modes of Supply - 1) Cross-border supply; 2) Consumption abroad; 3) Commercial presence;
4) Presence of national persons.
According to the Fiji schedule of specific commitments under the GATS, Fiji’s trade
barriers existed in the provision of hotels, motels, other tourist accommodation and
restaurants. There was the hindering of commercial presence of foreign investors in these
tourism activities through inefficient government approval and registration procedures. In
particular, restaurants have been restricted only to specialty restaurants and hotel

60
restaurants that are not available locally. There have also been barriers to the presence of
natural persons from another country to perform in the delivery of tourism services in Fiji,
such as government approval required for foreign nationals and the restriction of entry to
key post management time and post skilled employees (Ministry of Commerce, Business
Development and Investment, 1999a) . In addition to these, the foreign managers and
skilled employees have been obligated to provide locals with on the job training if they
wished to invest in the Fiji tourism industry (ibid). This poses additional costs to foreign
investors in the tourism sector.
The progress towards eliminating the limitations to trade in tourism services has involved
streamlining Fiji’s foreign investment act and the relevant provisions of the Fiji
Immigration Act. Indicators have shown that the number of foreign investors in the tourism
industry have shown some growth. As the limitations have been removed under the GATS
various openings could lead to overall positive benefits to the industries and the economy.
The reform in the airline industry that is also a vital policy relating to tourism services is
examined next.
3.3.2 Reform in Fiji’s Airline industry
Since the implementation of the first generation of reforms in 1989, the airline industry
was affected by the pro-competitive measures particularly those under the Public
Enterprise reform program. Two reform activities eventuated. First, the government
reduced its share ownership in Air Pacific from 78 percent to 51 percent in 1998 to
introduce new management and technical expertise from Qantas Airways. Second, the key
government player in aviation, CAAF became a candidate for restructure under the 1996
Public Enterprise Act. The main objective of reforming the CAAF was to improve
operational efficiency and enhance competition in the airline industry. Using the
privatization and corporatisation tools of public enterprise reform, the CAAF was
separated into a government commercial company ‘Airports Fiji Limited’ (AFL) to solely
manage the airports infrastructure and a commercial statutory authority called the Civil
Aviation Authority of the Fiji Islands (CAAFI) to oversee regulation aspects concerning air
services. It is anticipated that these reforms would contribute to the provision of air
services for exports.
61
Unlike the exchange in tourism services, trade in air services was not subject to service
trade liberalization under the GATS. One of the key reasons for this is that under the
GATS, air traffic rights are not part of the WTO trade liberalization agenda as they are
solely governed by the 1944 Chicago Convention’s system of bilateral air service
agreements. Opening up trade in air services does not follow the WTO system but under
the provisions stipulated under the Chicago convention (WTO, 2005). However, other air
transport services which are not related to air traffic rights are included in the WTO GATS
and consist of (i) aircraft repair and maintenance services; selling and marketing services;
computer reservation systems services, ground handling services; and airport operation
services (WTO, 2005). Since Fiji’s ratification of the GATS, none of these air services
sub-sectors have been submitted for inclusion in Fiji’s schedule of commitments to the
GATS.
3.4 The Fiji Tourism Industry – Supply-Side and Growth
Tourism plays a key function in the economic growth and development of Fiji. Over the
years, the industry has continued to be a major prospect for growth given the rising
demand for tourism services in the global market. Tourism in Fiji dates back almost a
hundred years ago. The construction of the Grand Pacific Hotel in 1914 marked the start of
the tourism industry in Fiji. This coincided with the trans-pacific shipping trade in the early
twentieth century, which eventually led to the foundational development of the industry in
1941 through the construction of Fiji’s first international airport in Nadi (Britton, 1983).
Between the late 1940s and early 1960s, improvements were made to the local
infrastructure critical to tourism such as the Queens highway and upgrading of
accommodation facilities and retail services. This led in the late 1960s and 1970s to a
substantial increase in tourism inflows referred to as the period of the tourism boom in Fiji.
From 1970 to 2005, tourism earnings and arrivals have been closely moving together in a
progressive fashion with a few slumps in some years. Apart from the long term
development foundations described earlier, a number of factors have explained the trend.
First, the government has played a supportive role through its policies and incentives
designed for the tourism industry. The government policies and incentives have been
reflective of the needs and demands of the tourism industry. The main policies of Fiji’s
tourism sector have been geared towards active marketing of Fiji tourism, securing

62
adequate airline capacity, increasing investment in tourism, strengthening internal links,
education and training of manpower and sustainable tourism development. The specific
policies emphasized through out the government’s development plans and policy
documents of various years can be summarised as follows (Ministry of National Planning,
1997, p. 90-91):
• Active marketing through the Fiji visitors bureau and the private sector boost visitor
arrivals and diversify source markets;
• Securing adequate airline capacity through attracting additional foreign airlines into
Fiji;
• Encouraging investment in tourism plant to realise the full development potential of the
industry;
• Strengthening linkages with the rest of the economy to ensure increasing retention of
the tourist dollar through greater local participation and greater use of inputs;
• Enhancing Fijian participation, particularly in rural areas, through encouragement of
small business commercial activities focussing on secondary tourism activities, with
direct links to established tourism plants;
• Promoting education and training to ensure availability of suitably trained manpower
and increased tourism awareness within the community; and
• Integrating planning of tourism development.
Secondly, in promoting these policies and strategies, Fiji as signatory to the WTO’s
General Agreement on Trade in Services (GATS) has also partially liberalised a number of
service sector activities, one of which is tourism and travel related services. The steep
growth experienced in the latter part of the study period can be attributed to the entry of
new air carriers to Fiji’s overseas destination routes and a rise in foreign travel agencies
operating domestically.
Third, investment in the tourism industry has played a large role in the overall rise in
tourism over the period. Government’s facilitative role in tourism related infrastructure
such as roads, airports and jetties have served as the development foundation for the
industry. However, tourism in Fiji is largely private sector driven and private sector
investment has been very crucial in addressing the supply of tourism services particularly

63
in terms of hotels and accommodation over the period. For example, according to data
received from the Fiji Islands Trade and Investment Bureau as shown in the Table 3.3,
total investment in tourism created more than 354 new projects valued at F$699 million
and led to employment opportunities for 6334 people over the period 1986 to 2006.
Table 3.3 Implemented projects in the Tourism Industry 1986-2006 Year Number of projects Investment (F$m) Employment 1986 1 0.25 11
1987 0 0 0
1988 6 4.22 80
1989 7 22.69 304
1990 15 22.07 184
1991 8 12.01 99
1992 9 4.33 81
1993 23 22.49 334
1994 10 7.79 134
1995 14 8.53 116
1996 12 12.24 147
1997 11 117.5 907
1998 14 68.83 525
1999 17 15.00 136
2000 9 45.84 189
2001 13 29.35 270
2002 7 3.06 41
2003 12 8.86 617
2004 22 20.47 280
2005 69 194.32 1365
2006 75 79.47 514
Total 354 699.10 6334
Average 16.86 33.29 302
Source: Fiji Islands Trade and Investment Bureau (2007).
Finally, during the study period, two major declines in visitors and earnings occurred in
1987 and 2000 (see Figures 3.11 and 3.14). The drop in these years was mainly due to the
political coups. This adversely affected visitor arrival as travel advisories in the major
tourism markets considered Fiji as an unsafe destination for tourists. Burns (1995) explains
that tourist flow after the coup in 1987 was impacted due to bad publicity in major source
markets and the rescheduling and cancellation of flights by international carriers. Visitor
arrivals declined by 26 percent from 257,824 in 1986 to 189,866 at the end of 1987
(Reserve Bank of Fiji, 2007). During the same period tourism earnings declined by 20
percent from F$185m to F$148.4m. In 2000, the impact on tourism was more severe as
visitor arrivals declined by 28 percent from 409,955 in 1999 to 294,870 at the end of 2000.
Earnings from tourism over the same period fell by 31 percent from F$559m to F$387m.
However, despite the internal and external shocks, the Fiji tourism industry has been quite
resilient in peaking up after the disturbances (Gounder and Katafono, 2004). This is in line

64
with the statistically proven understanding that the effects of any shocks on the tourism
industry are only temporary (Narayan, 2005).
3.4.1 Supply of Tourism Services
Since the development of the industry during the immediate pre-and post-independence era
in 1970, tourism in Fiji has developed into a buoyant and dynamic cluster of multi-sectoral
activities. The supply of Fiji’s tourism service products over the last 37 years has varied
within international standards and consist of a variety ranging from air transport,
accommodation services, water transport, retail sales services of souvenirs and handicrafts,
sports and recreation, motor vehicle hire services, travel agency services, retail sales of
travel handbags and suitcases, food and beverage serving services and retail sales of
alcohol. Like many other tourist competing countries, Fiji has been mainly supplying a
resort style, sand and sea product as they are relatively easy to develop and service
(Department of Tourism, 2007). This may be either upmarket such as beachfront luxurious
bures and five star European resorts or basic such as backpacker lodges with cold showers.
This standard tourism product has been diversified over the years to include diving,
snorkeling, sailing, water activities, beach activities and tour or day cruises of the
surrounding areas. In addition Fiji has developed some niche activity based tourism
products which are more targeted such as weddings, meetings incentives conventions and
expositions (MICE), dive, sports and cultural event tourism.
The production of this whole range of services for tourist consumption in Fiji is largely
produced by the private sector and supported by the features of overall comparative
advantage that Fiji possesses. Narayan (2000) describes this advantage in terms of the
strengths of the industry including (i). the unique nature of Fijian tourism product; (ii) the
expanding world tourism; (iii). broad market source (iv). high standard accommodation;
and (v). a reliable network of domestic air services. On the unique tourism product nature,
Fiji is richly endowed with the factors of production (mainly land and labour) needed for
providing tourism services. Land resources are not only largely available but are also
attractive in its natural state. The labour resource is hospitable and friendly in nature. With
the possession of such resources, Fiji is able to offer various kinds of tourist related
activities. The expanding world tourism has been an advantage to Fiji in terms of assured
market demand where Fiji could draw on to attract more tourists. It has also taken
advantage of the broad source market, high standard of accommodation in terms of

65
international comparisons and the well interconnected domestic airlines servicing the needs
of tourists in the tourist market.
Demand for Fiji’s tourism export products
The level of demand for Fiji’s tourism services is widely reflected in the number of
foreigners travelling to Fiji to consume and enjoy the whole range of services offered. In
Figure 3.11, it is seen that from 1970 to 2005, visitor arrivals have grown at an average of
5.45 percent per year from 110,042 visitors in 1970 to a record of 549,911 in 2005
(Reserve Bank of Fiji, 2007). When the years of the coups in 1987 and 2000 are not taken
into account, the average growth rate calculated is higher at around 5.55 percent per
annum.
Figure 3.11 Annual Tourism Arrivals 1968-2006
0
150
300
450
600
68 70 72 74 76 78 80 82 84 86 88 90 92 94 96 98 00 02 04 06
Year
Nu
mb
er
of
Vis
ito
rs (
00
0)
Source: Reserve Bank of Fiji (2007).
From another analytical view, if the average pre-1987 growth rate of 7.04 percent per
annum were to continue without any incident of coups, total tourism arrivals in 2005
would have been much higher at an estimated 737,314 number of visitors. The demand for
Fiji’s tourism services has depended on a number of factors such as the growth of income
in Fiji’s tourism source markets, the cost of travel to Fiji, tourism marketing and promotion
expenditure, safety and political instability and many other factors.
One of the significant factors that influence the demand for Fiji’s tourism services is the
growth of income in Fiji’s source markets, Australia, New Zealand and the United States
(Narayan 2002). This is based on the logic that a rise in national disposal income leads to
an increase in consumption spending abroad. Another factor that affects the demand for

66
Fiji’s tourism services is the availability of tourism infrastructure and investment which
requires the consideration of institutional factors and property rights in land and tourism
development (Prasad and Tisdell, 2006).
The demand for Fiji’s tourism services has also been affected by prices, for instance a
report by the World Bank (1995) state that Fiji has a higher cost of holiday package
compared to other tourist destinations for visitors originating in Sydney, Australia and
explains some of the slumps in tourist arrivals to Fiji from both Australia and New
Zealand. In particular, tourists to Fiji from Australia, New Zealand and the United States
are responsive to hotel prices, air fares and substitute costs in Fiji relative to the costs in
these source countries and in other tourist competitors (Narayan, 2004b).
The increase in Fiji’s tourism demand revealed by the rising tourist arrival numbers
indicates that the demand for each of the various tourism service products has also
increased over the period 1970 to 2005. While it has been quite difficult to determine the
actual amount of services demanded over the years, the recent development of the first
tourism satellite accounting in 2006 has provided a foundation for a more precise valuation
of the demand for tourism and its contribution to the Fiji economy. Figure 3.12 shows the
level of each tourist service product consumed out of the total supply produced in 1995.
The figure shows that out of the total supply of each tourism service product provided, air
transport is the largest service consumed by tourists and has a tourism product ratio (TPR)
of 98 percent, followed by accommodation services (96 percent), water transport (90
percent), retail sales of souvenirs and handicrafts (85 percent), sports and recreation (82
percent), car rental (81 percent), travel agency services (80 percent), handbags and
suitcases (76 percent), food and beverage (52 percent) and alcohol (30 percent)
(Department of Tourism, 2006). The balance of the ratios shown by the yellow portion of
each bars in Figure 3.12 indicates the amount consumed for non-tourism purposes.
The TPR’s in Figure 3.12 indicate how important a particular tourism product is in terms
of serving foreign and domestic tourists. The production of these services provides a major
source of incomes for the people of Fiji. In particular, the high consumption of souvenirs
and handicrafts (i.e. 85 percent) indicates the importance of tourism to the rural population
given that it is a major source of their income and livelihood (Department of Tourism,
2007). While the number of inbound tourists to Fiji continues to increase over the years,

67
the corresponding supply of the various tourism product services would have to be met
through appropriate levels of investment from the government, public enterprises and the
private sector (ibid).
Figure 3.12 Total Level of Consumption of Tourist Products 1995
0%
10%
20%
30%
40%
50%
60%
70%
80%
90%
100%
A B C D E F G H I J
Tourism Product
Consum
ption level (T
PR
)
Source: Department of Tourism (2006, p.20).
Key: A-air transport, B-accommodation services, C-water transport, D-retail sales of souvenirs and handicrafts, D-sports recreation and other activities, E-sports recreation and other activities, F- motor vehicle hire and rental, G-travel agency services, H-retail sales of handbags, suitcases, and traveling bags, I-Food and beverage serving services, J-retail sales of alcohol.
3.4.2 Tourism Source markets
Since the time of independence in 1970, Australia has been Fiji’s biggest source market for
tourist (Fiji Islands Bureau of Statistics, 2003). In 2006 tourists from Australia reached a
record high of 197,742 visitors representing 36 percent of total visitor arrivals. Other major
source markets for Fiji’s tourism industry include New Zealand providing 20 percent,
United States (12 percent), United Kingdom and Continental Europe (15 percent), Asia (9
percent), other Pacific islands (5 percent), and Canada (3 percent) (Reserve Bank of Fiji,
2008).
Figure 3.13 shows that while Australia, New Zealand and the United Sates provide the
majority of tourists to Fiji, other source markets have been growing at a relatively slower
rate. From the late 1980s to the mid-1990s, Japan, dominating all visitors from Asia,
emerged as an important source market for Fiji tourism and almost equalled the number of
visitors from New Zealand. Japan became Fiji’s third largest export market during this
period but this declined from 1997 to 2000 reflecting the negative impact of the Asian

68
financial crisis at that time (Reserve Bank of Fiji, 1998). Since then, Japan has been the
fifth largest tourist export market for Fiji. It is also noted that visitors from the United
Kingdom, have risen in the past decade and are currently the fourth largest source market.
The visitor arrival trend shown by Continental Europe, Canadian and Pacific Island tourists
have been relatively steady, over the years (Fiji Islands Bureau of Statistics, 2003).
Figure 3.13 Visitor Arrivals by Country of Residence, 1968-2006
0
50
100
150
200
250
68 70 72 74 76 78 80 82 84 86 88 90 92 94 96 98 00 02 04 06
Year
No
. o
f V
isit
ors
(0
00
)
Australia New Zealand United States Canada United Kingdom Continental EuropePacific Islands All Asia
Source: Reserve Bank of Fiji (various).
Visitors to Fiji have come for various reasons including business, official conference,
holiday, visiting friends and relatives, education and training and others. From 1970 to
2005, an average of 78 percent came to Fiji for holiday, about 7 percent visited friends and
relatives, 5 percent came for business purposes, 2 percent for official conferences and
around a mere 1 percent for education and training. Visitors who have come for other
reasons such as sports and other events were around 7 percent (Fiji Islands Bureau of
Statistics, 2007).

69
3.4.3 Tourism-Growth Nexus
The tourism industry largely contributes to the Fijian economy in terms of foreign
exchange earnings and employment. In terms of tourism export receipts, the real earnings
from tourism (at 2000 prices) have grown at an average of 3.6 percent per annum from
F$227m in 1968 to F$640m in 2006. In Figure 3.14 below, it can be seen that the trend in
tourism earnings mirrors that of tourist arrivals shown in Figure 3.11. Both show the
general overall increase and the sharp declines in the year of the coups thus indicating the
close association between tourism arrivals and receipts. According to the Fiji Islands
Bureau of Statistics (2005), tourists in Fiji spent approximately $170 a day and stayed for
about 9 days in 2003.
Tourism has established itself as Fiji’s largest foreign exchange earner. Based on Reserve
Bank data presented in Figure 3.15, a comparison between sugar and tourism earnings
show that the value of tourism exports as a ratio of GDP is on average more than twice that
of the sugar industry since 1997. Sugar has moved down to the second position in terms of
its export importance since 1989. In 1970, real sugar export (at 1989 prices) was valued at
F$166m, equivalent to about 3.2 percent of GDP, while tourism export was valued at
F$141m, equivalent to 2.7 percent of GDP. In 2005, real sugar exports rose to $125m and
its share of GDP increased to 7.3 percent. The share of tourism exports rose to 24.3 percent
of GDP establishing its mark as the number one foreign exchange earner for Fiji in 2005
(i.e. constant F$419m). Figure 3.15 below shows the GDP shares of sugar and tourism
earnings from 1970 to 2005. It can be seen that tourism surpassed sugar in terms of both
export value and share of GDP after 1988.
Figure 3.14 Real Tourism Export Receipts 1968-2006
0
200
400
600
800
68 70 72 74 76 78 80 82 84 86 88 90 92 94 96 98 00 02 04 06
Year
F$m
Source: Fiji Islands Bureau of Statistics (various). 2000=100.

70
Figure 3.15 Sugar versus Tourism Exports in Fiji 1970-2005
0
5
10
15
20
25
30
70 72 74 76 78 80 82 84 86 88 90 92 94 96 98 00 02 04
Year
(% o
f G
DP
)
Sugar Tourism
Source: Reserve Bank of Fiji (various).
The actual contribution of tourism to the economy in terms of foreign exchange earnings is
negatively affected by external outflows of tourism earnings. One type of such external
outflow is the import leakage where much of the income from tourist expenditures leave
the country again to pay for the import of equipment, food, and other products demanded
by tourists and which are not available domestically (Woods, Perry and Steagall, 1997).
Another type of outflow exist as export leakage where large multinational firms and large
foreign businesses have a substantial share in the import leakage, for e.g. when investors
from abroad who finance the resorts and hotels take their share of profits back to their
country of origin (Sica, 2005). In most developing countries, both types of leakages occur
and Fiji is no exception (Pleumarom, 1999). Issues, as such are captured in detail under the
multiplier analysis or input-output analysis which forms a major component of the widely
used tourism satellite account framework, discussed later below (Woods, Perry and
Steagall, 1997; Prasad and Tisdell, 2006).
A vital contribution of tourism to the economy is the number of jobs and income. During
the last 37 years, total paid employment in the tourism industry increased by an average of
17.3 percent per year, from 8,683 employees in 1970 to 23,900 established staff in 2005
(Fiji Islands Bureau of Statistics, various). Compared to other service sector employment it
can be seen that employment in the tourism industry represented by wholesale and retail
trades, hotels and restaurants is the second largest provider of paid established employment
(see Figure 3.16). It is also noted that while employment in other services have been

71
relatively steady, the tourism and employment in the community social and personal
services have shown a rising trend.
Figure 3.16 Total Paid Employment in the Service Sector 1968-2006
0
15
30
45
68 70 72 74 76 78 80 82 84 86 88 90 92 94 96 98 00 02 04 06
Year
No. of peo
ple
(000)
Electricity, Gas and WaterConstructionWholesale & Retail Trade, Hotels and RestaurantsTransport, Storage and CommunicationFinance, Insurance and Real Estate and Business ServicesCommunity, Social and personal services
Source: Fiji Islands Bureau of Statistics, (various).
One of the widely used tools to measure the impact of tourism on the economy is the
multiplier analysis of tourist spending. Multiplier impacts provide a measure of the effect
of expenditure in one sector on various economic aggregates. In the case of Fiji, a number
of income multipliers for tourism and the sugar industry have been estimated for some
years summarized in Table 3.4.
Table 3.4 Previous Calculations of Tourism and Sugar Income Multipliers Author Multiplier type calculated for
Fiji
Year Multiplier
coefficient
Lundberg, Krishnamoorthy and Stavenga (1995)
Tourism income multiplier 1995 0.72
Government of Fiji Tourism income multiplier 1992 0.94
Government of Fiji Sugar industry income multiplier 1992 1.47
Fiji Central Planning Office
Tourism income multiplier 1995 1.07
Source: Prasad and Tisdell (2006, p.188)

72
The last column of Table 3.4 shows the multiplier coefficients that measure the change
required in all industries to meet additional demand by one dollar for a particular industry.
For example, the tourism income multiplier of 0.72 measures the increase in income from
employment throughout the economy that results from an additional dollar of income
earned from employment in the tourism industry.
In a more recent and thorough estimation exercise, the Fiji Department of Tourism
calculates the tourism income multiplier to be 1.89 for 1995 under its first tourism satellite
account (TSA) based on the methodology laid by the World Tourism Organization. The
Fiji TSA 1995 numerically measures the size and strength of tourism in the Fiji economy.
The main results show that out of the total tourist expenditure in 1995 of F$979m, 64
percent or F$628m was spent by international visitors (Department of Tourism, 2006). The
tourism products consumed the most include air transport (98 percent of total supply);
accommodation services (96 percent of total supply); water transport (90 percent of total
supply); and souvenirs and handicrafts (85 percent of total supply) as shown in Figure
3.12. The total import leakage has been 19 percent of total tourism earnings while the
government Value Added Tax (VAT) revenue from tourism totaled F$83m in 1995.
Overall, the total employment created by tourism in 1995 is 31,110 while the total
economic impact which includes direct, indirect and induced impacts to tourism in 1995
has an overall value of F$2,299m (Department of Tourism, 2006).
3.5 The Airline Industry in Fiji
Air transportation is a key service mode for people and cargo movement that has greatly
assisted in the growth and development of Fiji during the last 37 years. The beginning of
the airline industry in Fiji can be traced back to the early 1920s during the time of World
War 1, and as the government, Australia and New Zealand got involved in developing the
industry (McGreal, 1998). This early industry formation took place in tandem with the
foundational development of the tourism sector and marked the start of the mutual
dependence between the airline and tourism sectors. Since then, air transportation has been
an essential element of the tourism global value chains contributing largely to economic
development by linking Fiji to the international tourism markets.
The industry facilitates international trade by conveying export and import goods between
Fiji and its trading partners and plays a key role in extending the benefits of economic

73
development to the hard to reach areas within the fragmented geography of the islands.
Since 2003, the airline industry has also assisted in the distribution of the gains of
sustainable tourism development throughout Fiji, especially to places and communities
which have little other option to participate in economic development (Department of
Tourism, 2007). Like the tourism industry, air transport services also serve as an invisible
export when foreign passengers purchase air tickets from Fiji airlines, thus, providing a
source of foreign exchange earnings to the country.
Fiji’s airline industry consists of a number of key stakeholders. The Department of Civil
Aviation (DCA) in the Fiji Ministry of Transport and Civil Aviation looks after air
transport, including oversight of regulation, licensing of air services and negotiation of
international air service agreements with other countries. The Air Transport Licensing
Board (ATLB) issues air transport operating licenses and regulates airfares and freight
tariffs. On the aspect of air transport safety, the Civil Aviation Authority of the Fiji Islands
(CAAFI), a non commercial statutory authority is responsible and deals with safety issues
such as aircraft registration, certification of aircraft and operators, licensing of air crew and
airports and meeting Fiji’s obligations concerning air safety under the International Civil
Aviation Organization (ICAO). The Airports Fiji Limited (AFL) operates the Nadi and
Nausori airports as a government commercial company and maintains 26 secondary
airports for the government. The air Terminal Services Ltd (ATS) is a 51 percent
Government-owned company providing monopoly terminal handling and catering services
to the AFL at the Nadi international airport. The other important key player in the airline
industry is the airline service providers which are explained in the next section.
3.5.1 Production of Air Services Exports
Fiji’s supply of air services for foreign international passengers is mainly provided by the
country’s national carrier, Air Pacific Limited, in which the government owns 51 percent
of the shares, Qantas 46 percent and the balance owned by other domestic shareholders.
The total supply also consists of scheduled domestic services provided by Air Fiji and
Sunflower Airlines under regulated competition. The Government of Tuvalu is the
majority owner of Air Fiji Limited with the Government of Fiji as a minority owner. There
are a number of private charter operators restricted by “regulated competition” to protect
the two main domestic carriers. The private charters and resort owned aircraft and
helicopters provide services to resorts in the offshore and outer islands.
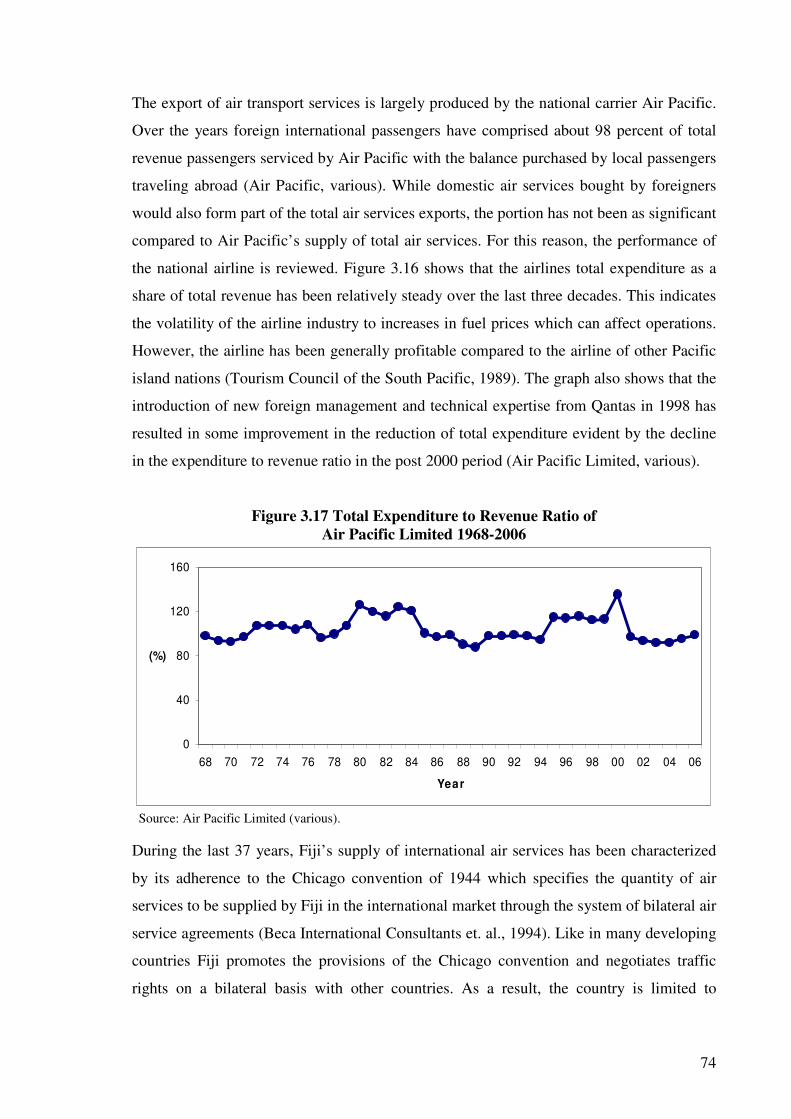
74
The export of air transport services is largely produced by the national carrier Air Pacific.
Over the years foreign international passengers have comprised about 98 percent of total
revenue passengers serviced by Air Pacific with the balance purchased by local passengers
traveling abroad (Air Pacific, various). While domestic air services bought by foreigners
would also form part of the total air services exports, the portion has not been as significant
compared to Air Pacific’s supply of total air services. For this reason, the performance of
the national airline is reviewed. Figure 3.16 shows that the airlines total expenditure as a
share of total revenue has been relatively steady over the last three decades. This indicates
the volatility of the airline industry to increases in fuel prices which can affect operations.
However, the airline has been generally profitable compared to the airline of other Pacific
island nations (Tourism Council of the South Pacific, 1989). The graph also shows that the
introduction of new foreign management and technical expertise from Qantas in 1998 has
resulted in some improvement in the reduction of total expenditure evident by the decline
in the expenditure to revenue ratio in the post 2000 period (Air Pacific Limited, various).
Figure 3.17 Total Expenditure to Revenue Ratio of
Air Pacific Limited 1968-2006
0
40
80
120
160
68 70 72 74 76 78 80 82 84 86 88 90 92 94 96 98 00 02 04 06
Year
(%)
Source: Air Pacific Limited (various).
During the last 37 years, Fiji’s supply of international air services has been characterized
by its adherence to the Chicago convention of 1944 which specifies the quantity of air
services to be supplied by Fiji in the international market through the system of bilateral air
service agreements (Beca International Consultants et. al., 1994). Like in many developing
countries Fiji promotes the provisions of the Chicago convention and negotiates traffic
rights on a bilateral basis with other countries. As a result, the country is limited to

75
supplying international air services based on the conditions of the routes specified in the
agreement. From 1970 to 2005, Fiji has signed 26 air service agreements with other
countries, of which only 12 have been utilized (Ministry of Transport and Civil Aviation,
2003). This indicates that Fiji has a guaranteed air service capacity to supply in the global
market of up to 26 air service agreements that it has successfully negotiated. The details of
the air services agreements signed by Fiji with other countries are outlined in Table 3.5.
Table 3.5 Details of Bilateral Agreements with Fiji Air Services Agreements
Agreements Between FIJI and
Partner Signed PEIF DEIF ICAO # UN# Status
1 Australia 3/24/1982 3/24/1982 3067 23087
2 Canada 4/30/1974 4/30/1974 2476 13468
3 Chile 7/9/1973 7/9/1973 3/26/1974 3052 Nreg
4 France 6/3/1981 9/29/1981 3047 Nreg
5 India 1/28/1974 1/28/1974 3053 Nreg
6 Japan 3/10/1980 6/18/1980 3001 Nreg
7 Malaysia 4/26/1979 11/26/1990 3675 Nreg
8 Marshall Islands 12/19/1990 12/19/1990 3676 Nreg
9 New Zealand 10/12/1973 10/12/1973 2686 15789 NLIF
4/26/1979 4/26/1979 2881 18940 NLIF
9/4/1991 4/21/1992 3731 Nreg NLIF
11/19/1994 11/19/1994 3927 Nreg
10 Papua New Guinea 3/25/1996 3/25/1996 3994 Nreg
11 Rep. of Korea 10/28/1994 10/28/1994 Nreg Nreg
12 Solomon 5/23/1991 5/23/1991 3678 Nreg
13 Tonga 11/17/1977 11/17/1977 3027 Nreg
14 Tuvalu 12/15/1989 3511 Nreg
15 United Kingdom 1/10/1974 1/10/1974 3054 13437
16 USA 10/1/1979 10/1/1969 10/1/1979 12/16/1907 20992
17 Vanuatu 3/24/1993 3/24/1993 8/10/1993 6/23/1910 Nreg
18 Western Samoa 2/7/1991 2/7/1991 3677 Nreg
19 Kiribati 12/11/1996 12/11/2002 12/11/2002
20 Thailand 11/5/1996
21 Singapore 4/4/1998 22 Hong Kong 30/6/97 .
23 China 9/17/1996 9/17/1996 9/17/1996 9/17/1996
24 Cook Islands 2/26/1999 2/26/1999 2/26/1999 2/26/1999 25 Niue 11/1993 3/30/2005
26 Nauru
Source: Ministry of Transport and Civil Aviation (2003). Note: A - (Through UK). Now lapsed since HK is no longer a special administration of UK
B - Initiated but not signed. November 1993 PEIF - Proposed Entry into Force DEIF - Date Entry into Force NLIF - No Longer In Force

76
3.5.2 Demand for Fiji’s Air Services Exports
The demand for Fiji’s air services exports has increased over the last 3 decades, indicated
by the number of international passenger traffic carried by Fiji’s domestic airlines.
According to the Fiji Islands Bureau of Statistics (1998), the total international passenger
traffic refers to the total passenger traffic carried by local airlines between Fiji and airports
overseas and also traffic carried between airports overseas excluding non-scheduled
flights. In Figure 3.17, the total international passengers serviced by Fiji have increased by
an average of 10.3 percent per year from 26062 passengers in 1970 to 597217 passenger in
2005. Like tourism arrivals, the number of passengers in the years of the coups showed
marked downturns as they declined by 9.4 percent in 1987 and 21.9 percent in 2000 (Fiji
Islands Bureau of Statistics, various).
Figure 3.18 Total International Air Passenger Traffic 1968-2006
0
160
320
480
640
68 70 72 74 76 78 80 82 84 86 88 90 92 94 96 98 00 02 04 06
Year
No
. o
f in
tern
ati
on
al
passen
gers
(000)
Source: Fiji Islands Bureau of Statistics (various).
From 1970 to 2005, the demand for Fiji’s air service exports has been largely influenced
by a number of factors including the world economic cycles, international events and the
domestic economic cycles. However, the coups have adversely impacted as natural
disasters. Another key factor that affects the demand for Fiji’s air services exports is the
level of domestic airport infrastructure in place. The airport infrastructure and facilities are
crucial elements to support and facilitate the efficient delivery of Fiji’s air services exports.
Of the 26 airports established in the islands only two meet the global standards to service
international flights. These include the international airports in Nadi on western Viti Levu
and in Nausori on the eastern side.

77
Over the years, the government has invested in upgrading the runways and refurbishing the
airport terminals in Nadi and Nausori to keep up with the general increase in international
passenger traffic to and from the islands. However, for the other smaller domestic airports
located in the islands, the lack of budgetary allocation has hindered its maintenance to
ensure continuous scheduled services to these destinations. In 2004, the government in
collaboration with the Asian Development Bank designed an airport improvement and
upgrading project for all Fiji’s airports, particularly in the rural maritime areas under the
Bank’s technical assistance programme (Asian Development, 2006). This major
investment is envisaged to meet the increasing demand for Fiji’s air services by both the
local and international passengers.
The demand for Fiji’s tourism products also has a bearing on the demand for Fiji’s air
services exports. During the last 37 years, tourism arrivals have increased in a similar
progressive fashion as international passenger indicating that the majority of the tourists
travel to Fiji by air. According to Tourism Council of the South Pacific (1989), tourism
development and air transport in the South Pacific are closely interlinked and the tourism
demand for air transport is necessary to contribute to the viability of frequent services and
good connections. This applies in the case of Fiji as the international demand for its air
services is largely dominated by the demand from foreign tourists.
During the last 3 decades, Fiji’s major export markets for air transport services include
Australia, New Zealand, North America, Japan and other Pacific Islands. Australia and
North America have been the major source markets representing an average of 32 percent
and 31 percent of Fiji’s total airline receipts from Air Pacific respectively (Air Pacific,
various). The average share of other source markets over the years includes Japan 18
percent, New Zealand 16 percent and other Pacific Islands 5 percent.
3.5.3 Air Services-Growth Nexus
The airline industry is one of Fiji’s important sources of economic growth, investment and
foreign exchange earnings. The sector’s average share is around 2 percent of GDP at 1995
prices (Fiji Islands Bureau of Statistics, 2007), and although not substantial the industry
has essentially contributed to the growth of other sectors in the economy. From 1970 to
2005, real gross airline revenue by Fiji’s national carrier, grew at an average rate of 16
percent per annum from F$3.9m in 1970 to F$449m in 2005 (Air Pacific, various). These

78
receipts flow into the economy as air passenger revenue and cargo freight revenue (see
Figure 3.19).
Of the total earnings received each year, approximately 85 percent on average are derived
from passengers and capacity seat sales, 6 percent others while the balance of 9 percent
comes from cargo freight (Air Pacific, various). While Fiji’s foreign receipts from air
services have increased, its multiplier effect from these receipts has been low given the
leakages arising from profit repatriation by Qantas who owns 46 percent of Air Pacific.
The air service export industry also contributes to the economy through the provision of
employment. The average number of staff employed has generally increased in a
fluctuating trend over the years (Smith, 2002).
In Figure 3.20 total manpower in the airline had shown general decline in the years of the
coups indicating the volatility of employment in the industry brought about by temporary
lay-offs during the period of instability. The impact of the air transport industry in Fiji on
economic growth has never been analyzed in the empirical literature. However, while the
income multiplier is expected to be low, the employment multiplier in the air service
industry is most likely to be high given the high utilization of local manpower that would
result from the newly created jobs in aviation.
Figure 3.19 Real Airline Revenues of Air Pacific Limited 1968-2006
0
100
200
300
400
500
68 70 72 74 76 78 80 82 84 86 88 90 92 94 96 98 00 02 04 06
Year
F$m
Source: Air Pacific Annual Reports (various). 1989=100

79
Figure 3.20 Fiji’s Manpower in Air Pacific Limited 1968-2006
0
200
400
600
800
68 70 72 74 76 78 80 82 84 86 88 90 92 94 96 98 00 02 04 06
Year
No
. o
f e
mp
loy
ee
s
Source: Air Pacific Limited (various).
3.6 Summary and Conclusion
This chapter provides an overview of Fiji’s tourism and air transport service export
industries. The Fiji tourism and air transport industries are analyzed as invisible exports
whereby these exports are injections into the economy and lead to economic growth. On
the basis of this perspective, the international demand and supply aspects of both these
services are indicate the vital role in terms of its contribution to the economy. Reforms, i.e.
trade liberalization of Fiji’s tourism services under the GATS and government divestiture
in the national airline and the restructure of the Civil Aviation Authority of Fiji under the
Public Enterprise Reform program, were crucial components to boost its contribution.
The exports of tourism and air services have shown an increasing trend in terms of volume
and earnings over time. Similarly, the supply of Fiji’s tourism products in the global
market has grown to meet the increasing international demand. These, however, have been
affected by political instabilities which also delay the reforms besides its complementary
reforms in other service sectors. Fiji’s production of air services for export is guaranteed
and generally fixed to the 26 bilateral air service agreements that the country has
successfully negotiated since the early 1970s with the trading countries. However, Fiji has
not fully utilized its guaranteed supply of air services in the international market.
Supplying additional services require higher levels of investment by the industry and
improved efficiency in the airline operations, but this has been lacking.

80
The demand for Fiji’s air service exports has increased amid rising average costs of
providing the air service. This reflects the necessity of the air mode of transport, the level
of protecting the national carrier and the need for Fiji’s national carrier to enhance its
efficiency and competitiveness. The largest demand for Fiji’s air services come from
foreign tourists of the nearby source markets of Australia and New Zealand. The mutual
link between tourism and air transport services explains Fiji’s policy objectives in the
respective service sectors. Specifically, the export of tourism and air transport services and
the reforms will be vital for its impact on total production of tourism and international air
services for export. The next chapter presents the models that analyze the relationship
between Fiji’s tourism services, air transport services, growth in services output, total
economic growth and the effect of reforms on the export of tourism and air transport
services.

81
Chapter Four
EMPIRICAL MODELS AND METHODOLOGICAL
FRAMEWORK
4.1 Introduction
This chapter presents the empirical models and the methodologies applied to investigate
the services export and growth nexus. In particular, the focus is on the export of tourism
and air transport services and the models present the various determinants and its growth
impact. The models also examine the impact of the reforms undertaken in these sectors
amongst other determinants that may influence tourism exports of the service sector and
the export of air services in Fiji. An overview of Fiji’s tourism industry and air service
markets outlined in chapter three indicate the substantial contribution of this sector and the
trade and public enterprise reforms that have been undertaken to enhance the growth of the
service industries. The data and analytical framework discussed in this chapter will be used
to address the key research questions in the subsequent chapters.
As noted in the literature review, a majority of recent empirical evidence suggest that
tourism is a major determinant of growth and that international air services provides
economic benefits for both developed and developing countries. This has been the case for
tourism in developing countries such as Mauritius and Latin American countries (See
Durbarry, 2004; and Eugenio-Martin, Morales and Scapa, 2004). In the study of the air
service-growth nexus, the hypothesis has been largely valid for developed countries in the
case of United States and the European Union (see Button and Taylor, 2000).
The theoretical literature also suggests that trade and pro-competitive reforms in tourism
and air services lead to an increase in services trade. There is not much empirical evidence
for this hypothesis in the case of developing countries given that most have recently
embarked on the reform compared to high income countries like United States, Japan and
UK, whose aviation markets are fully developed to undertake the analysis (see Endo, 2007;
and Button, 2006). Therefore, the estimation of these relationships for Fiji would
determine the validity of these findings for the nation and the wider group of developing
countries. Examination of these issues have policy implications for Fiji particularly with
respect to understanding the relevance of the reforms undertaken in the tourism sector and

82
to identify ways to further develop the two service industries (tourism industries and the
airline industry. The models and the variables to be used are specified based on the
theoretical aspects as outlined in chapter two. This study applies the recent developed time
series econometric techniques to estimate the relationships of tourism and growth, reforms
and the disaggregated service sector exports.
The chapter is outlined as follows: Section 4.2 discusses the specifications of the models to
estimate various tourism service-growth and services-reform relationships. Section 4.3
highlights the issues pertaining to the data used in this study. A discussion of the steps
followed to estimate the specified models are provided in Section 4.4. The recent time
series approaches are noted to avoid spurious results. These issues are discussed in detail
below. The conclusion is presented in Section 4.5.
4.2 Specification of the Models
This study examines four base models in relation to the research questions. The service
exports-growth nexus models, which seek to address the first research question, are
established on the premise of the neoclassical framework, particularly of the type
pioneered by Solow (1956) and Denison (1985) which incorporates other factors such as
goods and services exports, political instabilities and natural disasters, in addition to the
usual labour and capital inputs that determines economic growth. The reform-service
exports models that define the second key research question are based on the classical
theory of the determinants of demand for goods and services. The major determinants of
the demand for goods and services are prices, incomes and other specific factors such as
the services reform activities which can alter the tastes of consumers of particular goods
and services.
The four groups of models to be estimated include (i) the tourism and economic growth
model; (ii) the tourism determinants and reform models; (iii) air services and economic
growth model; and (iv) air service determinants and reform models. A total of eight
equations will be estimated of which five are related to tourism and three models related to
air services. The specification of each model is described in detail below.

83
4.2.1 Tourism-Growth Model
During the last three decades, Fiji, has experienced an increase in tourism flows. Equation
4.1 tests whether tourism services export contributes to Fiji’s economic growth. According
to previous tourism-led growth studies, the models used have been based on the two-
variable specification between Gross Domestic Product (GDP) and tourism earnings, e.g.
Durbarry (2004) for the causality test of Mauritian tourism and economic development,
and Oh (2003) for analyzing the granger causality between Korean tourism and economic
growth. The studies that focus on Fiji have specified the tourism growth equations by
modeling the entire economy using the Computable General Equilibrium (CGE)
methodology (Narayan, 2004b) and the neoclassical specification (Doessal and Gounder,
1996). This study uses the neoclassical growth framework similar to that used by Doessal
and Gounder (1996) and utilizes aggregate data to explain the service sector growth over
time.
The model for the impact of tourism on growth takes the following specific form:
GYt =γ0+γ1GLFt+γ2LIYt+γ3GXt+γ4GTRt+γ5DVt+ γ6 DVCYt + µ1 (4.1)
Where GY is the growth in gross domestic product;
GLF is the growth in total labour force;
LIY is the log of total investment to GDP ratio;
GX is the growth in total merchandise exports;
GTR is the growth in tourism receipts;
DV is the dummy variable that measures the impact of the coups; and
DVCY is the dummy variable for the effect of cyclones.
As applied in many empirical growth studies, the dependent variable (GY) is the measure
of economic growth. This is set as a function of the growth in labour (L) and capital (K)
inputs measured by the growth in labour force (GLF) and the ratio of investment to GDP
(IY) respectively. Export parameters as injections into the economy are also treated as
inputs in the model and are represented at the disaggregated level including growth in total
goods (merchandise) exports (GX) and growth in tourism services receipts (GTR). The
dummy variables for the coup (DV) that measures the impact of political instability and the

84
effect of tropical cyclones (DVCY) on growth are also included. It is expected that the γ’s
are > 0, except for the coefficients for the coup (DV) and tropical cyclones (DVCY).
4.2.2 Determinants of Tourism and Reform Models
Following the determination of the relationship between tourism exports and economic
growth, the next step involves estimation of the models to explain the impact of tourism
reforms on export of tourism services. In the first two models, tourism receipts is used as
the dependent variable and the determinants of tourism exports are analyzed featuring an
indicator for the tourism reform that Fiji committed to undertake under the World Trade
Organization’s (WTO) General Agreement on Trade in Services (GATS) schedule. In the
third and fourth equations, the effect of reform and other determinants are estimated using
the volume of tourists to Fiji as the dependent variable.
The specifications of these four models are:
LTRt = γ0 + γ1LHPIt + γ2LOERt + γ3LAPCY + γ4FDIY + γ5GHRYSt + γ6LTPE + γ7DV+ µ1 (4.2a)
LTRt = γ0 + γ1LHPIt + γ2LREERt + γ3LAPCY + γ4FDIY + γ5LTPEt + γ6DVTR+ µ2 (4.2b)
LTAt = β0 + β1LHPIt + β2LAFIt + β3LAPCYt + β4FDIY + β5LHRAt + β6GYt + µ3 (4.2c)
LTAt = β0 + β1LHPIt + β2LAFIt + β3LREERt + β4LTPE + β5LHRAt + µ4 (4.2d)
where LTR is the log of tourism export receipts;
LTA is the log of total annual number of tourist arrivals;
LHPI is the log of the hotel price index;
LOER is the log of the official exchange rate given by the Fijian currency unit
per US dollar;
LREER is the log of the real effective exchange rate;
LAPCY is the log of the average per capita income of Fiji’s major tourism
source markets;
FDIY is the foreign direct investment to GDP ratio;
GHRYS is the growth in wholesale and retail trade, hotels and
restaurants to total services output ratio;
LTPE is the log of the total tourism promotion expenditure by government;

85
LAFI is the log of the national airline’s air fare index;
GY is the annual growth in GDP;
LHRA is the log of the total hotel rooms available;
DV is the dummy variable that measures the impact of the coups; and
DVTR is the dummy variable for implementation of tourism reform in 1999.
The log-log functional form is adopted to facilitate the interpretation of the estimated
coefficients as elasticities. As such, all the coefficients of the log variables are taken to be
elasticities except for the dummy variables. This means that the estimated coefficient of the
log explanatory variables reflect the percentage change in the dependent variable as a
result of a 1 percent change in the corresponding regressor. However, the variables
expressed in ratios (i.e. non-log form) are interpreted as semi-elasticities where its
estimated coefficient is multiplied by 100 to give the percentage change in the dependent
variable (Woolridge, 2006, p. 49).
In equation (4.2a), the demand for tourism exports is measured by tourism receipts (LTR)
set as a function of the standard factors of the cost of tourism services and income level of
tourists. Other factors that may influence the taste and demands of tourists are also
included. Walsh (1996, p.7) points out that there are three main measures for price of
tourism utilized in many tourism demand studies, i.e. the cost of travel to the destination,
the exchange rate between the tourist’s country of origin and that of the destination country
and the cost of goods and services incurred after travel. This study uses all three measures
of which two are used in this equation i.e. the hotel price index (LHPI) and the official
exchange rate (LOER). The use of the official exchange rate in this equation is to find out
if the devaluations of the Fiji dollar had created an impact on tourism earnings.
To account for tourist’s level of income in the model, the average of the income per capita
of Fiji’s major tourism source markets comprising of Australia, New Zealand, United
States, Canada, Japan and Great Britain (LAPCY) is used. The other determinants
hypothesized to have an impact on the demand for tourism services include the intensity of
tourism production measured by the growth in wholesale and retail trade, hotels and
restaurants as a share of total services GDP (GHRYS) and total government tourism
promotion expenditure (LTPE). Fiji implemented the reform of the tourist sector. Tourism
reform is measured by the foreign direct investment (FDI) in Fiji. As FDI in tourism is not

86
available, total FDI flows is taken as a proxy given that most of the FDI flows are in the
tourism sector, i.e. hotels, tourism services etc. The incidences of coups (DV) are taken
into consideration.
Equation (4.2b), substitutes the official exchange rate (LOER), with the real effective
exchange rate (LREER) to determine the competitiveness of exports in the global market
and measures the effect of tourism reform implementation in 1999 using the subjective
measure of dummy variable DVTR. The demand for tourism exports is assessed using
Fiji’s tourist arrival numbers (LTA) as the dependent variable in equations (4.2c) and
(4.2d). In equation (4.2c), the number of tourist arrivals is set as a function of the price of
hotel food and accommodation, cost of travel in the national airline (LAFI), the income
level of tourists from the major destinations (LAPCY) and other determinants including the
tourism trade reform (FDIY), total supply of hotel rooms (LHRA) and the growth in
domestic income (GY). After determining the impact of LAPCY, FDIY and GY on tourist
arrivals, these variables are dropped in equation (4.2d) to analyze other particular features
of the Fiji tourist destination such as price competitiveness (LREER) and the impact of
government expenditure on tourist promotion overseas (LTPE). This equation is estimated
with a view to assess more determinants of tourism whilst maintaining the degrees of
freedom for the model’s explanatory power.
The variables of interest are the level of foreign direct investment (FDIY) in the tourism
industry and the dummy variable for implementation of the reform in 1999 (DVTR). As
discussed in chapter 3, Fiji committed to open up trade in tourism and travel related
services in 1999 after joining the WTO in 1996 (Ministry of Commerce, Business
Development and Investment, 1999, 2002). This pledge was put forward by the
government of Fiji to the World Trade Organization (WTO) as a result of the restrictions
put on foreign investors in terms of market access and national treatment in the provision
of hotels, accommodation and restaurants (ibid). On the basis of the liberalization theory
discussed in Chapter 2, opening market access barriers would lead to more foreign
investment in the tourism sector i.e. hotels and accommodation. It is expected that Fiji’s
commitment to the WTO in 1999 to remove barriers to FDI in tourism would positively
impact on the demand for tourism services. Similarly, if the reform has positively affected
tourism receipts, the dummy variable for the reform implementation (DVTR) would give a
positive sign. However, given that total FDI value and not disaggregated FDI data for

87
tourism is used, the estimated coefficient for FDIY should be interpreted with caution. The
theoretical predictions of the variables in equations (4.2a), (4.2b), (4.2c) and (4.2d) are that
the γ’s, and β’s are > 0, except for the coefficients of LHPI, LREER, LAFI and DV. While
the estimate for LOER is normally negative, the expectation in this model is positive as the
variable is expressed in local currency per US dollar.
4.2.3 Air Services-Growth Model
After estimating the significance of the WTO’s GATS reform and other determinants on
tourism exports, the focus shifts to a vital component of tourism services, the airline
industry. As shown in Chapter 3, Figure 3.3, Fiji’s exports in the service sector is
dominated by air transport and travel services. The highest tourism product consumed out
of the total supply of tourism services produced in 1995 is air transport services (see for
example Chapter 3, Figure 3.11). Given the large consumption level of the air services, the
next step test whether the export of air transport services significantly contribute to total
services output.
The equation for the growth in service sector and air services nexus follows a neoclassical
specification as follows:
GYSt = γ0 + γ1GLFSt + γ2PIYSt + γ3GTPTt + γ4OPEN + γ5DVt + µ5 (4.3)
Where GYS is the growth in gross domestic product (GDP) in the services sector;
GLFS is the growth in the services sector labour force;
PIYS is private sector investment to GDP services ratio;
GTPT is the growth in total international passengers carried by domestic airlines;
OPEN is the total trade given by exports plus imports to GDP ratio; and
DV is the dummy variable for the impact of the coups
According to Button and Taylor (2000), international air services have short and long term
development implications in terms of the changes to infrastructure, airport operations,
employment, incomes, state revenues and business growth. Using employment to indicate
for growth and development, they specifically identified that the trend in new economy
employment is reflective of the development impact of air services, particularly when it
has the potential to indicate for the changes in the introduction of new or additional air

88
services compared to aggregate income (GDP). The industry in which this new economy
employment is dynamically created as a result of air transport is concentrated in the service
sectors. This is in line with some studies which found that service sector companies
regarded air services as the most important factor for business operations (ibid). While
Button and Taylor (2000) use employment data, this study utilizes income as the dependent
variable to proxy for economic growth. However, to ensure that the measure is
comprehensive to reflect changes in air services, disaggregated GDP data of the service
sector or GDP services (GYS) is used.
The growth in total services output (GYS) is set as a function of the disaggregated labour
(L) and capital (K) inputs in the service sector represented by the growth in service sector
labour force (GLFS) and private sector investment to GDP services ratio (PSIYS). The use
of total private sector investment (PSIYS) rather than total investment is used given that air
services for international passengers are mainly provided by domestic private companies
namely the Air Pacific Limited, Air Fiji Limited and some hotel airline operators. The
growth in air services exports measured by the total international passenger traffic carried
by domestic airlines (GTPT) is also added including the dummy variable (DV) for the
coups.
While the total export value of air services reported in the international trade in services
would account to be the best proxy for the sale of international air services to foreign
customers, its compilation by the Fiji Islands Bureau of Statistics is available only from
2003 to date. The airline revenues data for the Air Pacific Limited is available from 1968
but given that it is only one of the local airlines providing air services to foreigners, it lacks
to fully reflect Fiji’s aggregate export value of air services. Therefore, growth in total
international passenger traffic carried by Fiji’s domestic carriers (GTPT) is used as it also
captures the international passengers using domestic carriers, mainly, that of the Air
Pacific Limited and Air Fiji Limited. It is expected that all the regressors would have a
positive coefficient except for the adverse impact of the coups (DV).
4.2.4 Determinants of Air Services and Reforms Models
Once the relationship between international air services (GTPT) and total services output
growth (GYS) is determined, the effect of the aviation reforms amongst other determinants
such as prices (LAFI) and incomes (LAPCY) on Fiji’s international air services exports are

89
then estimated. As outlined in chapter 3, two reform activities in the civil aviation sector
took place under the public enterprise reform program in 1998. This include the restructure
of the Civil Aviation Authority of Fiji (CAAF) into two new entities each concentrating on
their respective core functions of regulation and airport management, respectively, with a
view to improve efficiency (Ministry of Commerce, Industry, Cooperatives and Public
Enterprises, 1998). The other reform activity in the aviation sector is the reduced
shareholding by the government in the national airline Air Pacific, with the aim to
introduce new management and technical expertise and as a means of introducing fresh
capital through the widening of share ownership (Hicks, 1998; McMaster, 2001).
To reflect the impact of the implementation of these reforms in the model, a dummy
variable (DVAR) is used by identifying the time in which both the above reform activities
took place. A value of 0 is thus assigned to the years before the implementation of the
reform in 1998 and the value of 1 in the post-1998 period. This measure for reform has
been used in many reform related studies such as that of Papageorgiou, et al., (1991),
Greenaway et al., (1998) and Narayan and Smyth (2005). However, Greenaway et al.,
(1998) point out that although policy accounts are an obvious starting point they must be
complemented with more specific robust measures. As such two reform variables are
added to indicate for each of the two aviation reforms undertaken in Fiji. The first related
reform is the restructure of CAAF whereby the growth in total transport output (GTT) is
used as a proxy. While the income and expenditure of the CAAF would be the ideal reform
measure, this data has not been fully available for the time period of this analysis. The
other complementary variable for the aviation reform activity is related to the reduced
government shareholding in the Air Pacific Limited reflected in the model by the national
airline’s total operating expenditure as a share of total revenue.
The models to investigate the effect of reforms on international air services follow an
extended classical specification of the demand for goods and services consisting of two
equations as follows:
LTPTt=β0 + β1LAFIt + β2LAPCYt + β3AERt + β4GTTt + β5PIYt + β6DVt + µ6 (4.4a)
LTPTt=β0 + β1LAFIt + β2LAPCYt + β3AERt + β4GTTt + β5LIYt + β6DVARt+ µ7 (4.4b)
where LTPT is the log of total international passenger traffic by domestic carriers;

90
LAFI is the log of the national airline’s air fare index;
LAPCY is the log of the average income per head of the six major markets of
Fiji’s air services;
AER is the national airline’s total expenditure to revenue ratio;
GTT is the growth in total transport output;
PIY is private sector investment to GDP ratio;
LIY is the log of the total investment to GDP ratio;
DV is the dummy variable representing the effect of the coups; and
DVAR is the dummy variable reflecting the year in which Fiji implemented
the two aviation reform activities in 1998.
In equation (4.4a), the level of Fiji’s international air services (LTPT) is set as a function of
the price of international air services (LAAF) and the income level of Fiji’s major
consumers of international air services mainly, Australia, New Zealand, United States,
Japan, Canada and Great Britain (LAPCY). Other factors that influence the level of
international air services are added such as the level of private investment (PIY) and the
two key reform variables. The reform activity of reducing government shareholding in the
national airline is measured by the total operating expenditure to revenue share of the
national airline (AER), and the growth in total transport output (GTT) measures the reform
activity of the restructure of CAAF into the regulatory and airport management entities.
Equation (4.4b) introduces the dummy variable (DVAR) representing the implementation
of the two reforms in 1998 in place of the coup dummy (DV) and enters total investment
(LIY) in place of private investment (PIY). This is to determine whether the
implementation of the reform in 1998 and the total investment has impacted on total
passenger traffic. If the reforms has had a positive effect on total passenger traffic, AER
and GTT would both have a positive sign and DVAR will have a positive sign. The
remaining variables are also expected to be positive except for the cost of air services
(LAFI) and the coup (DV). A description of all the variables specified in the eight models
above and how they are computed is explained next.
4.3 Data
The study utilizes annual data for Fiji for the period 1968 to 2006 to estimate the models
specified in this chapter. The list of variables and data sources is summarized in Table 4.1.

91
The data are in constant prices and the variables converted to ratios have been undertaken
for the relevant variables. The key data sources include World Bank (2007) World
Development Indicators (WDI) and the Fiji Islands Bureau of Statistics. The primary data
have been also collected by visiting Fiji Islands Bureau of Statistics and the Air Pacific
Limited for various components of tourism variables. Attention has been given to the
conversions and calculations for each specific variable in the relevant form. Data
definitions and details are discussed next.
Table 4.1 List of Time Series Variables Used in the Equations and Sources
Code Variable Source
GY Annual growth in total GDP
GTR Annual growth in tourism export receipts
LTR Log of tourism export receipts
LTA Log of tourism arrivals
LHPI Log of the hotel price index
GHRYS Annual growth in wholesale and retail trade, hotels and restaurants to services GDP ratio
LHRA Log of the total number of hotel rooms available
GYS Annual growth in GDP services
GLFS Annual growth in service sector labour force
GTPT Annual growth in total international passenger traffic
LTPT Log of total international passenger traffic
GTT Annual growth in total transport output
Fiji Islands Bureau of Statistics (various).
GLF Annual growth in total labour force
GX Annual growth in goods merchandise exports
LOER Log of the official exchange rate
LAPCY Log of the average per capita income of Fiji’s major tourism markets
FDIY Foreign direct investment to GDP ratio
OPEN Total exports plus total imports to GDP ratio
World Bank (2007).
LIY Log of investment to GDP ratio
LREER Log of the real effective exchange rate
PSIYS Private sector investment to GDP services ratio
Reserve Bank of Fiji (various).
LTPE Log of total government expenditure on tourism promotion Government of Fiji (various).
LAFI Log of the international air fare index of the national airline
AER Total expenditure to revenue ratio of the national airline
Air Pacific Limited (various).
DV Dummy variable for the incidence of political coups in 1987, 2000 and 2006 Gounder (1998, 1999, 2002)
DVCY Dummy variable for the incidences of tropical cyclones during the period 1968 to 2006 Kostachuk et al., (2001)
DVTR Dummy variable for the implementation of tourism reform in 1999 MCBDI (1999) (
DVAR Dummy variable for the implementation of aviation reforms in 1998 McMaster(2001)

92
One of the most widely used measure for economic growth and development is GDP. Data
on GDP was obtained in current prices at disaggregated level from the Fiji Islands Bureau
of Statistics (various). This enabled the computation of GY, GHRYS, GYS and GTT used
in equations 4.1, 4.2a, 4.2c, 4.3, 4.4a and 4.4b. First, the data in current prices are
transformed to constant GDP figures using the 1989 GDP deflator provided by the World
Bank (2007) and then calculated the annual growth rates. The disaggregated GDP
components as reported in Fiji’s national accounts are summarized in Table 4.2.
Table 4.2: Gross Domestic Product By Activities
1. Agriculture, Forestry and Fishing
2. Mining and Quarrying
3. Manufacturing
-----------------------------------------------------------------------------------------
4. Electricity and Water +
5. Construction 6. Wholesale and Retail Trade, Hotels and Restaurants - HR
7. Transport and Communications
a. Air transport -
b. Sea transport
c. Water transport
d. Services allied to transport
e. Communications
8. Finance, Insurance, Real Estate and Business Services =
9. Community, Social and Personal Services
-----------------------------------------------------------------------------------------
10. Others not elsewhere classified
11. Less Computed Bank Charges 12. Equals TOTAL GROSS DOMESTIC PRODUCT -Y
Source: Fiji Islands Bureau of Statistics (2006).
The annual growth in GDP (GY) is calculated by taking the growth rate of total GDP
activities (Y) represented by item 12 as shown in Table 4.2. Similarly, GYS is computed
by taking the growth in that service portion of total GDP that reflects only the output from
services (YS). This consist of the sum of the outputs under items (4) to (9) in Table 4.2 and
includes electricity and water services; construction services; wholesale and retail trade,
hotels and restaurants; transport and communications services; finance, insurance, real
estate and business services; and community, social and personal services.
The intensity of tourism output production (GHRYS) is calculated by first setting the
tourism output variable given by the total wholesale and retail trade, hotels and restaurants
i.e. item (6) in Table 4.2 as a ratio of total services output (YS). The annual growth rate of
GDP GOODS
GDP SERVICES - YS
GDP TOTAL
TT

93
this ratio is then taken. GTT is calculated by taking the growth rate of total transport (TT)
comprising of the sum of items (7a) to (7d) in Table 4.2 above. This variable has been used
to proxy for the reform activity involving the restructure of the Civil Aviation Authority of
Fiji, given that the disaggregated data in the earlier years for air transport (i.e. item 7a) and
services allied to transport (i.e. item 7d) is not available.
The information on total labour force (GLF) was retrieved from the World Bank (2007)
WDI and represents the number of people that satisfy the International Labour
Organization’s definition of the economically active population supplying labor for the
production of goods and services during a specified period (World Bank, 2007).
Disaggregated labour force for the total services sector (GLFS) was obtained from the Fiji
Islands Bureau of Statistics and represents the total numbers in paid establishments under
the service sectors of electricity and water services; construction services; wholesale and
retail trade, hotels and restaurants; transport and communications services; finance,
insurance, real estate and business services; and community, social and personal services.
Investment is a key component in the growth process and in the service sector growth
equations. In the context of the service sector models, the ideal measure to use is the total
investment in the tourism and air service industries, respectively. However, the Fiji Islands
Bureau of Statistics (2007) only reports investment by government, public enterprises and
the private sector. As such, the investment data used in equations (4.1) and (4.4b) is the log
of total investment (gross fixed capital formation) expressed as a share of total gross
domestic product (LIY). In equations (4.3) and (4.4a), private sector investment
(PIY/PIYS) is used as the air services are mainly provided by the private companies. These
measures for investment have been taken due to lack of disaggregated total investment data
in the tourism and air services industries.
To account for the trade reform in the tourism service sector, annual data of foreign direct
investment (FDI) as a share of GDP (FDIY) are used sourced from the World Bank (2007).
As a member of the WTO’s General Agreement of Trade in Services (GATS), Fiji
committed to removing the trade barriers in the supply of tourist hotels and
accommodation for the global tourism market. Specifically, the GATS commitment
schedule for Fiji submitted to the WTO highlights that Fiji poses market access limitations
to foreign investors in tourism hotel accommodation and restaurants through its inefficient

94
investment approval process laid down in the Fiji foreign investment Act. It is expected
that removal of such barriers leads to high inflow of FDI in tourism to Fiji. This reform
process in tourism is consistent with the overall export oriented growth strategy that would
need to be carried out complementarily with the reforms in other sectors/markets such as
the public sector, land and labour markets, financial sector, good governance, political and
institutional reform, to realize the full benefits of trade reform in goods and services
(Reddy et al., 2004). The level of FDI in tourism data would directly measure the success
of this service trade reform initiative. However, due to the unavailability of disaggregated
FDI data for tourism, total FDI is used as a proxy.
The key parameters of this study focus on services exports, particularly on the
disaggregated exports of tourism services and air services. The GTR variable is the growth
in tourism services export receipts measured by total annual tourist expenditure in Fiji
obtained from the Fiji islands Bureau of Statistics. GTPT is the calculated growth in total
international passenger traffic carried by domestic airlines namely Air Pacific Limited and
Air Fiji Limited. This variable is used to proxy for the air services sold to foreigners as the
Fiji Islands Bureau of Statistics does not have the full time series data for air services
exports. Total merchandise export (GX) is also included and covers the total value of Fiji’s
exports of goods merchandise obtained from the World Bank (2007). Similarly the
variable, OPEN is obtained from the World Bank (2007) computed by the sum of
merchandise exports and imports divided by the value of GDP converted to international
dollars using purchasing power parity (World Bank, 2007).
Data on tourist arrivals (LTA) and the total number of hotel rooms available (LHRA) is
obtained from various issues of the Fiji Islands Bureau of Statistics Current Economic
Statistics and Key Statistics. Tourist arrival is defined as the total number of visitors
visiting Fiji in a given year and are particularly those visitors satisfying the definition of a
tourist under the United Nations World Tourism Organization. The number of hotel rooms
is the total the total supply by both domestic and foreign owned hotels at the end of each
year.
The price of hotel food and accommodation is a major standard parameter used in most
tourism determinant studies. Using tourist expenditure and hotel room sales data from
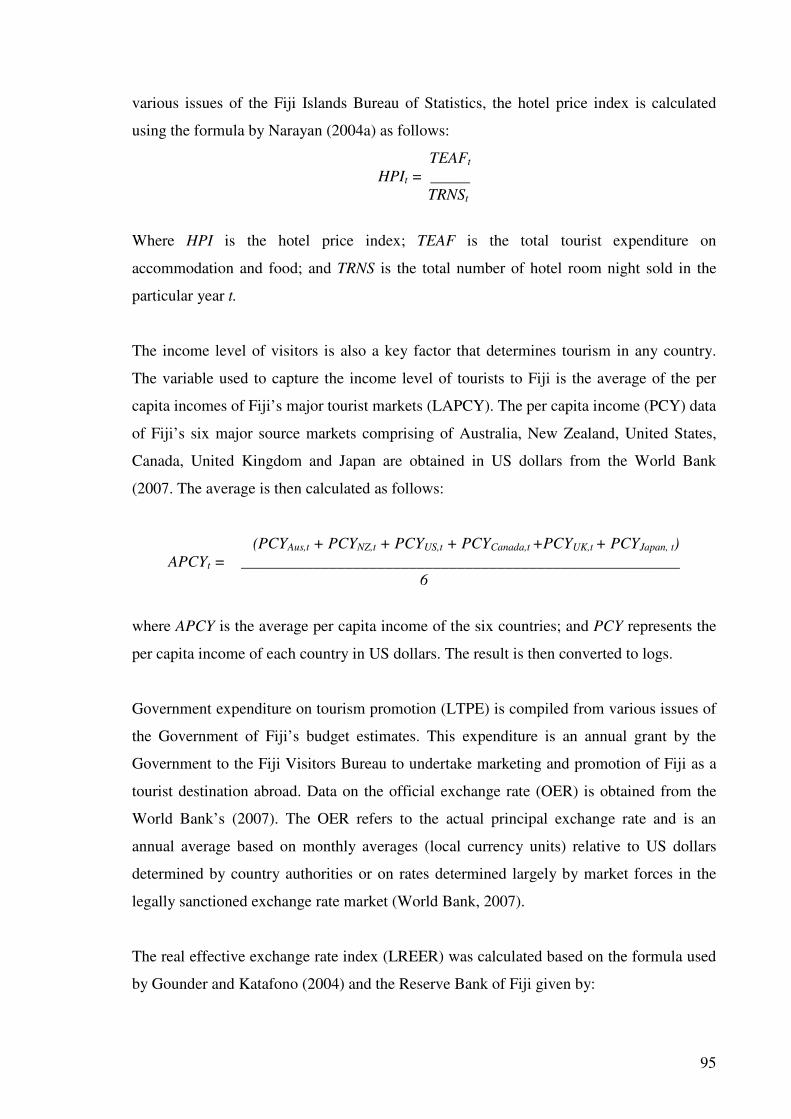
95
various issues of the Fiji Islands Bureau of Statistics, the hotel price index is calculated
using the formula by Narayan (2004a) as follows:
TEAFt
HPIt = _____
TRNSt
Where HPI is the hotel price index; TEAF is the total tourist expenditure on
accommodation and food; and TRNS is the total number of hotel room night sold in the
particular year t.
The income level of visitors is also a key factor that determines tourism in any country.
The variable used to capture the income level of tourists to Fiji is the average of the per
capita incomes of Fiji’s major tourist markets (LAPCY). The per capita income (PCY) data
of Fiji’s six major source markets comprising of Australia, New Zealand, United States,
Canada, United Kingdom and Japan are obtained in US dollars from the World Bank
(2007. The average is then calculated as follows:
(PCYAus,t + PCYNZ,t + PCYUS,t + PCYCanada,t +PCYUK,t + PCYJapan, t)
APCYt = _______________________________________________________
6
where APCY is the average per capita income of the six countries; and PCY represents the
per capita income of each country in US dollars. The result is then converted to logs.
Government expenditure on tourism promotion (LTPE) is compiled from various issues of
the Government of Fiji’s budget estimates. This expenditure is an annual grant by the
Government to the Fiji Visitors Bureau to undertake marketing and promotion of Fiji as a
tourist destination abroad. Data on the official exchange rate (OER) is obtained from the
World Bank’s (2007). The OER refers to the actual principal exchange rate and is an
annual average based on monthly averages (local currency units) relative to US dollars
determined by country authorities or on rates determined largely by market forces in the
legally sanctioned exchange rate market (World Bank, 2007).
The real effective exchange rate index (LREER) was calculated based on the formula used
by Gounder and Katafono (2004) and the Reserve Bank of Fiji given by:

96
5 NERj,t * RPIj,t
REERt = Σ __________ * TWj,t
j=1 100
where t is the year; j =1,2,3,4,5 (Australia, New Zealand, Japan, United States and the
United Kingdom respectively) are Fiji’s five major trading partners; NERj is the nominal
exchange rate index (per Fiji dollar) with each trading partner j; RPIj is the consumer price
index of Fiji relative to the consumer price index of each major trading partner j (Base
year=2000); and TWj is the trade weight for each of Fiji’s major trading partner j given by
the total trade between Fiji and the respective country j as a share of total trade between
Fiji and all the five trading partners. The real effective exchange rate is then converted to
logs for elasticity interpretation. All the data on consumer prices, exchange rates, exports
and imports required to calculate the real effective exchange rate indices were obtained
from the World Bank (2007).
To account for the public enterprise reform activity of reduced government shareholding in
the national airline Air Pacific Limited, the airlines total expenditure as a share of total
revenue (AER) sourced from the financial information presented in the national airline’s
annual reports is used. In Fiji, the sale of government shares in Air Pacific to Qantas in
1998 was undertaken with the intention to improve quality and provide better services.
Specifically, the change in ownership structure was to introduce new foreign management
and technical expertise with a view to achieve improved efficiency in the provision of air
services by the national airline (Hicks, 1998; McMaster, 2001). An indicator that reflects
this change is the level of expenditures given that efficiency reflects higher output at lower
costs. The levels of expenditure data has also been utilized as indicators for reforms in the
public sector (Reddy et. al., 2004). For this reason, the financial indicators of Air Pacific
are used to gauge for the general level of efficiency in air service operations.
The cost of air services by Fiji’s national airline is an important aspect that affects the
export of Fiji’s air services. Due to the general difficulty in computing the cost of air fares
from the differential pricing system in airlines, the air fare index of Air Pacific is thus used
as the proxy for air travel costs. The calculation of the air fare index is based on Dwyer and
Forsyth’s (2006) computation of real revenue per passenger kilometer which
97
simultaneously refers to as the average cost paid by each airline passenger. The air fare
index of Fiji’s national airline is therefore calculated as follows:
AFIt = TPRt
TPCt
Where, AFI is the air fare index; TPR is the total annual passenger revenue by the national
airline i.e. Air Pacific Limited; and TPC is the total annual number of passengers carried at
each annual time period t. The AFI index is then converted to log form to obtain the air
fare price elasticity of demand for tourism from its coefficient.
Other data parameters used in this analysis include the dummy variables for the coups
(DV), tropical cyclones (DVCY), tourism reform implementation in 1999 (DVTR), and the
aviation reform episode of 1998 (DVAR). According to Woolridge (2006), quality factors
such as one-of events and policy accounts which have an impact on the dependent variable
can also be captured in the model by defining a binary variable, i.e. zero or one for each
variable.
4.4 Econometric Technique
This study employs the autoregressive distributed lag (ARDL) approach to cointegration
using Microfit econometric package by Pesaran and Pesaran (1997), to estimate the models
specified above. The ARDL technique has been selected to determine the long run and
short run relationships between service exports (i.e. tourism and air services) and economic
growth and between the reforms in the tourism and air services industries viz a viz their
respective total export outputs. Gujarati (1988) notes that a distributed lag model includes
present and historical values of the explanatory variables (the Xs) and an autoregressve
model is one that includes one or more lagged values of the predicted variable (Y) among
its regressors.8
In deriving the ARDL estimates, Pesaran and Shin (1995) included lagged values of both
the dependent and explanatory variables on the right hand side as the regressors to
illustrate the long run and short run relationship with the dependent variable. The
8 Thus, Yt = α + β0Xt + β1Xt-1 + β2Xt-2 + µt represents a distributed lag model with current and lagged values of the Xs (i.e. Xt, Xt-1, Xt-2) and Yt = α + βXt + λYt-1 + µt represents an autoregressive model with only the lagged values of Y (i.e. Yt-1) included as a regressor in addition to the current values of the Xs.

98
procedures to carry out the ARDL approach to cointegration technique includes (i) the
determination of the long run relationships among the variables used in the models; and (ii)
the estimation of the coefficients of the long and short run relationships. A description of
each of the above steps is outlined in the following sections.
4.4.1 Testing the Unit Root Hypothesis
Prior to the application of the ARDL method, the first step is to test for the stationarity of
each variable used in models for unit roots. Using time series data under the basic ordinary
least squares (OLS) regression model, a key assumption made is that the means and
variances of the parameters are constant over time. Where the variables do not have
constant means and variances they are non-stationary or have the problem of unit root. The
use of non-stationary variables in the time series analysis leads to misleading inferences
(Libanio, 2005). The unit root test is applied to check for its order of integration. As such,
unit root testing has been a crucial requirement to the existence of cointegration links
(John, Nelson and Reetu, 2005).
This study uses the traditional Augmented Dickey Fuller (ADF) test to check for the unit
root in each variable and thereby determine its order of integration. The model to carry out
the ADF test is:
k-1
∆xt = α0 + λT + øxt-1 + Σ γi ∆xt-1 + et (4.5) i=1
Where ∆ represents the first difference, xt is the time series being tested for unit root, T is
the time trend parameter and k is the number of lags which are included in the model to
ensure that there is no autocorrelation in the error terms et. The number of the lags k in the
ADF model is chosen based on the Schwarz Bayesian Criterion (SBC). The coefficient of
interest in the above model is ø, which corresponds to the lagged differences of the
regressor xt-1. The null hypothesis tested here is that ø = 0 or the series (in level form) is
non-stationary against the alternative that ø<1 indicating the stationarity of the variable.
Mackinnons (1991) set of critical values is used to decide on whether to reject or accept the
null hypothesis. If the estimated value of ø is greater than the critical value, the null is
rejected and the variable is said to be stationary (no unit root). At this level form, the
variable is said to be integrated of order zero I(0). However, if the null is not rejected, the

99
series has unit roots and is integrated of order one, i.e. I(1). The stationarity of the variable
is obtained by differencing the variables, i.e. the first difference. If the null hypothesis is
rejected at the first difference form, the variable is stationary and is said to be integrated of
order one I(0).
4.4.2 Estimating the Long run Relationship Among Variables
To estimate the ARDL model is to test for the presence of long run relationships among the
variables in each of the equations specified. The first step used to determine the existence
of long run relation between the variables is the Bounds F-Test. In this process, the F-
statistic is calculated to test whether the lagged levels of the variables in the error
correction form of the underlying ARDL model is significant. Pesaran and Pesaran (1997)
and Narayan and Narayan (2004) illustrate a representative model of the bounds F test as
follows. Suppose Zt is a vector of two variables represented as Zt = (Yt, X’t)’ with a data
generating process following a k-order vector autoregression. Yt is the regressand and Xt is
a vector of independent variables. In analyzing long run relationships between variables,
the equation requires that ∆Yt be represented as a conditional error correction model
(ECM) expressed as follows:
p q
∆yt =β0 +λ1yt-1 + λ2xt-1 + Σ ηi ∆yt-i + Σ ø’j ∆xt-j + θrt + µt (4.6) i=1 j=0
Where β0 is a constant, λ1 and λ2 denote long run multipliers and rt is a vector of
explanatory variables which are uncorrelated with the error term µt.
To reflect the short run dynamics of the model the lagged values of ∆yt and current and
lagged values of ∆xt are included. The Bounds F test for no relationship between yt and xt
is then estimated by omitting the lagged level variables, yt-1 and xt-1 from equation 6. The
null hypothesis used to test the F statistic is that the long run multipliers are equal to zero
i.e. H0: λ1= 0, λ2 = 0’ meaning no long run relationship between yt and xt . The alternative
hypothesis of the existence of a long term relationship is where there is any inequality
among the long run multipliers i.e. H1: λ1 ≠ 0, λ2 ≠ 0’ or λ1 ≠ 0, λ2 = 0’ or λ1 ≠ 0, λ2 ≠ 0’
indicating the presence of a long run relationship (Pesaran and Pesaran, 1997).
100
The F-Test has a non-standard distribution which is largely determined by the order of
integration of the variables in the ARDL model, the number of independent variables and
whether the ARDL model has an intercept and/or trend (Pesaran and Pesaran, 1997). The
computed critical values are compared against the estimated F test value. The critical
values are in two sets, one treating all the variables in the ARDL model as I(1) and the
other assuming all the variables as I(0). For each F test conducted, the critical values
corresponding to I(0) and I(1) act as a band which determines the success/failure of the F-
test to reject/accept the null hypothesis of no cointegration (See Pesaran and Pesaran, 1997,
Table F, p.478. Specifically, if the computed F test statistic lies above the upper bound of
the critical values, the null hypothesis of no long run relationships among the variables is
rejected and indicates the existence of cointegration. On the other hand if the estimated F
statistic falls below the lower bound of the critical values, the null hypothesis cannot be
rejected and indicates that no long run relationships exist among the variables in the model.
If the estimated F-test values falls within the lower and upper bound that implies, that
implies that unit root tests have to be conducted. (Pesaran and Pesaran, 1997).
Once a long run relationship has been established, the final step of the ARDL analysis
involves estimating the coefficients of the long run relations and making inferences about
their values (Pesaran and Pesaran, 1997). This stage involves two further steps. The first
stage involves selecting the orders of the lags based on Schwarz Bayesian Information
Criteria (SBIC) or the Akaike Information Criteria (AIC). In the second step, the selected
optimal ARDL model restricted to the lag structure defined in the first stage of the final
ARDL process is then estimated including the short run and error correction model. These
methodologies will be applied to avoid spurious results.
4.5 Summary and Conclusion
This chapter discusses the analytical framework and methodology to be applied to estimate
various specifications of the models. The variables, data issues and the econometric steps
note the application of time series techniques to test the tourism-growth and service sector-
growth nexus in this study. The methodology employed is the Autoregressive Distributed
Lag approach to cointegration over the period 1968 to 2006. The available data source and
the period of estimation provide a systematic approach that address various hypotheses
noted in this chapter. The execution of the ARDL approach will enable the determination
of the long run and short run relationships between services exports (i.e. tourism and air

101
services) and economic growth. It also assists to determine the time effects of the reforms
undertaken in the tourism and air service sectors. The estimation of the equations and
empirical results for Fiji are presented in the next two chapters.

102
Chapter Five
TOURISM GROWTH AND REFORMS: EMPIRICAL
RESULTS
5.1 Introduction
This chapter presents the econometric analysis of the relationship between export of Fiji’s
tourism services and economic growth and the effect of the World Trade Organization
(WTO) services trade reforms on tourism exports. The overview of the tourism and airline
industries in Fiji and the performance over the last thirty six years (as outlined in Chapter
3) suggest a relatively vital sector and its contribution to growth. The tourism sector can be
associated with several key sectors of the economy, namely agriculture, air services,
employment and investment. The tourism sector and its economic growth nexus has been
also supported by various economic policies and reforms over time.
For most developing countries, trade in tourism services has recently become a major
phenomenon that has led many economic and development researchers to analyze its
importance as a key contributor to economic growth. While most recent studies have
confirmed the significance of tourism as a determinant of growth, it is important for the
developing nations to create an environment that is conducive to the growth of the industry
given their relatively poor performance in merchandise trade compared to developed
countries. During the last three and a half decades, Fiji has had a relatively slow growth
rate in real terms attributed to a mixture of factors such as the military coups, vulnerability
to natural disasters, low investment and a number of other socio-economic aspects
(Gounder, 1998, 1999, 2002; Chand, 2000; Narayan and Smyth 2005). Since independence
in 1970, the number of inbound tourists has increased dramatically creating a major source
of foreign exchange for the developing island nation. However, the development of the
industry has tried to cope with the demand for tourism services in Fiji particularly in
accommodation and room stock, attractions and experiences and human resource needs of
a growing industry (Department of Tourism, 2007, p.28). As a response, Fiji committed the
tourism sector to the requirements of the WTO’s services exchange liberalization program,
whereby international market access barriers in Fiji are to be removed to allow more
foreign investment in tourist hotels, accommodation and restaurants (Ministry of
Commerce, Business Development and Investment, 1999, 2002).

103
Previous investigations on the tourism growth nexus provide evidence that tourism has
been a major influence on economic growth, particularly for developing countries like
Mauritius and for the countries in the Caribbean and Latin America (See Durbarry 2004,
Eugenio-Martin, Morales and Scapa, 2004; Woods, Perry and Steagall, 1997). In the case
of Fiji, few studies exist on the tourism growth linkages such as Doessel and Gounder
(1996) and Narayan (2004b). Unlike the outcome of these existing studies, the results
derived here for the tourism growth nexus would clarify both the long run and short run
relationship. In regard to the effect of the WTO’s reforms on tourism services trade, it has
been pointed out that removing trade barriers in the provision of tourism services have a
beneficial effect on tourism services exports in the case of the Maldives, Seychelles,
Antigua, Barbuda and the Bahamas (WTO, 2006).
The empirical analysis of the tourism-growth-reforms linkages in the case of Fiji will
clarify whether or not the WTO services trade reform has impacted on the tourism
industry. By focusing on the effect of reforms, other determinants of tourism are assessed
in the case of Fiji. The organization of the chapter is as follows: prior to delving into the
results, section 5.2 discusses the models, data and methodology used in the analysis.
Empirical analysis for time series data are undertaken using the Autoregressive Distributed
Lag (ARDL) approach to cointegration for the period 1968 to 2006. First, it tests whether
the variables used in the models are stationary. In Section 5.3, the results for the ARDL
models are presented. Section 5.4 presents the conclusion.
5.2 Tourism-Growth, Tourism Determinants and Reforms
This section presents the empirical models of tourism exports and whether the WTO
tourism trade reforms amongst other determinants have impacted on the export demand
performance of the tourism industry in Fiji. Specifically, it presents the methodology,
results of unit root test and the estimated results for equations (5.1), (5.2a), (5.2b) and
(5.2c) as noted below.
5.2.1 Tourism-Growth, Determinants and Reform Models
In the first regression equation (5.1), the neoclassical growth framework is applied to
measure the tourism-growth nexus which takes the following form:
GYt =γ0+γ1GLFt+γ2LIYt+γ3GXt+γ4GTRt+γ5DVt+ γ6DVCYt + µ1 (5.1)

104
where GY is the annual growth in gross domestic product (GDP);
GLF is the growth in total labour force;
LIY is the log of total investment to GDP ratio;
GX is growth in total goods merchandise exports;
GTR is the growth in tourism receipts;
DV is the dummy variable for the impact of the coups; and
DVCY is the dummy variable for the incidences of tropical cyclones.
The model adopted here is similar to that used by Doessal and Gounder (1996) but is
different in two aspects. First this study uses aggregate data of the neoclassical
specification instead of per capita data variables and secondly it includes the dummies for
the coups and tropical cyclones.
In the next step, the impact of tourism trade reforms amongst other determinants of tourism
is estimated. This step is analyzed based on the economic theory of demand applied to
tourism service as a consumable commodity. First, the WTO tourism trade reform is
analyzed in terms of its impact on tourism receipts which indicate the expenditure
decisions of tourists. Next, the reform and other determinants are investigated to find out if
it impacts on tourist arrivals or the travel decisions of tourists. The various equations take
the following forms:
LTRt = γ0 + γ1LHPIt + γ2LOERt + γ3LAPCY + γ4FDIY + γ5GHRYSt + γ6LTPE + γ7DV + µ1 (5.2a)
LTRt = γ0 + γ1LHPIt + γ2LREERt + γ3LAPCY + γ4FDIY + γ5LTPEt + γ6DVTR+ µ2 (5.2b)
LTAt = β0 + β1LHPIt + β2LAFIt + β3LAPCYt + β4FDIY + β5LHRAt + β6GYt + µ3 (5.2c)
LTAt = β0 + β1LHPIt + β2LAFIt + β3LREERt + β4LTPE + β5LHRAt + µ4 5.2d)
where LTR is the log of tourism export receipts;
LTA is the log of total annual number of tourist arrivals;
LHPI is the log of the hotel price index;
LOER is the log of the official exchange rate given by the Fijian currency unit
per US dollar;

105
LREER is the log of the real effective exchange rate;
LAPCY is the log of the average per capita income of Fiji’s major tourism
source markets;
FDIY is the foreign direct investment to GDP ratio;
GHRYS is the growth in wholesale and retail trade, hotels and
restaurants to total services output ratio;
LTPE is the log of the total tourism promotion expenditure by government;
LAFI is the log of the national airline’s air fare index;
GY is the annual growth in GDP;
LHRA is the log of the total hotel rooms available;
DV is the dummy variable that measures the impact of the coups; and
DVTR is the dummy variable for implementation of tourism reform in 1999.
The two equations (5.2a) and (5.2b) focus on the tourism receipts and reform nexus. The
equations (5.2c) and (5.2d) investigate the relationship between tourism arrivals and other
determinants including the reform.
5.2.2 Data and Methodology
The major sources of data for the variables used in the models are outlined in Table 4.1
(see Chapter 4), i.e. the World Bank (2007), Fiji Islands Bureau of Statistics (various),
Reserve Bank of Fiji (various), Government of Fiji (various) and Air Pacific Limited
(various). The chapter also describes the data transformations applied to the relevant
variables to put them in a form for use in the regression. With a view to determining the
short and long run relationships between tourism and growth and the effect of reforms and
other determinants on tourism exports, the ARDL methodology has been used employing
Pesaran and Pesaran’s (1997) Microfit Version 4.1 econometric software. This
econometric technique first determines any long run relationships amongst the variables
before the coefficients of the short with error correction term (ECM) are estimated. A
prelude to the ARDL estimation is the analysis of the time series properties of the model
data using the Augmented Dickey Fuller (ADF) test. The result of this test is reported in
the next sub-section.

106
5.2.3 Results for Unit Root
Before applying the ARDL procedure, all the variables are tested for stationarity. The
Augmented Dickey Fuller (ADF) test for stationarity analyses whether the mean and
variance of the variables used are constant over time. It determines whether the variables in
each model are stationary in their levels or first difference forms. This enables us to assign
the order of integration for each variable i.e. I(0) or I(1) before identifying the possible
long run linkages. Table 5.1 shows the unit root test results for all the variables used in
models (5.1), (5.2a), (5.2b) and (5.2c). The table indicates the unit root test results for the
variables relating to the GDP growth rate (GY), labour force (GLF), goods exports (GX),
tourism receipts (GTR), tourism arrivals (LTA), official exchange rate (LOER), income
per capita of tourist source markets (LAPCY), foreign direct investment (FDIY), the
growth rate of hotels and restaurants output (GHRYS), and the total supply of hotel rooms
available (LHRA) that are stationary I(0).
Table 5.1 ADF Test Results of Tourism Variables Levels First differences Variable
Intercept and trend
Order of integration
Intercept and trend
Order of Integration
GY -4.06 I(0)
GLF -4.10 I(0)
LIY -2.01 I(1) -4.83 I(0)
GX -5.13 I(0)
GTR -6.06 I(0)
LTR -2.42 I(1) -6.17 I(0)
LTA -4.57 I(0)
LHPI -0.52 I(1) -5.26§ I(0)
LOER -4.57 I(0)
LREER -2.86 I(1) -5.44§ I(0)
LAPCY -3.81 I(0)
FDIY -3.93 I(0)
GHRYS -5.04 I(0)
LTPE -1.88 I(1) -5.03 I(0)
LAFI -0.56 I(1) -5.87§ I(0)
LHRA -4.36 I(0) Note: Critical value at 5% level is -3.53 for intercept and trend.
§ variable is in second difference form. Legend: GY is the annual growth in GDP, GLF is the growth in labour force, LIY is
the log of total investment to GDP ratio, GX is growth in goods merchandise exports, GTR is the growth in tourism receipts, LTR is the log of tourism export receipts, LTA is the log of total annual number of tourist arrivals, LHPI is the log of the hotel price index, LOER is the log of the official exchange rate, LREER is the log of the real effective exchange rate, LAPCY is the log of the average per capita income of Fiji’s major tourism source markets, FDIY is the foreign direct investment to GDP ratio, GWRTHRYS is the growth in wholesale and retail trade, hotels and restaurants to total services output ratio, LTPE is the log of the total tourism promotion expenditure by government, LAFI is the log of the national airline’s air fare index, GY is the annual growth in GDP and LHRA is the log of total hotel rooms available.

107
This is based on the Augmented Dickey-Fuller (ADF) test where the estimated ADF test
values exceed the critical value of -3.53 (in absolute terms) at the 5 percent level for a
model with an intercept and trend. The other variables are non-stationary, i.e. I(1), these
includes the log of investment to output ratio (LIY), the log of the real effective exchange
rate (LREER), the log of tourism receipts (LTR), the log of the hotel price index (LHPI),
the log of government promotion expenditure (LTPE), the log of the air fare index (LAFI)
and life expectancy at birth (SAF).
As the test statistic values of these variables do not exceed the critical value in absolute
terms, they indicate the presence of unit root or are non-stationary. Applying the ADF test
on the first difference of the non-stationary [i.e. I(1)] variables, the results show that the
null hypothesis of the presence of unit root can be rejected except for the variables, LHPI,
LREER and LAFI, which achieved stationarity I(0) in its second difference form.
5.3 Results for Tourism-Growth Nexus and Reforms
This section presents the results of the equations shown in sub-section 5.2.1. First, the
result of the tourism growth nexus model (equation (5.1)) is reported in sub-section 5.3.1.
The results for the impact of tourism trade reform on the demand for tourism services in
Fiji are discussed in sub-section 5.3.2.
5.3.1 Tourism-Growth Nexus Results
As a first step in the ARDL technique, the determination of any long run relationship
among the variables is estimated. The Bounds F test result in Table 5.2 shows the results of
this first stage with the estimated F-test value indicative of the presence of the long run
relationships among the variables. As the calculated F-statistic of 3.31 exceeds the upper
bound value of 2.943, the null hypothesis of no long run relationship is rejected
irrespective of whether the variables used are integrated of order one I(1) or zero I(0). This
indicates that a long run relationship exist amongst the variables in equation (5.1).
Table 5.2 Bounds F-Test Results for Tourism and Growth Nexus in Fiji
Critical value band (90%) Model K- degrees of freedom I(0) I(1)
Estimated F test value
Pass/Fail
Equation (5.1) 5 1.825 2.943 3.31 Pass Note: The critical values are from Pesaran and Pesaran (1997) Table F, p. 478.

108
In the second stage, the ARDL, long run and the short run ECM coefficients are estimated
by using the Akaike Information Criteria (AIC) to select the appropriate lags.9 Given the
time series period from 1968 to 2006, the lag length has been set to maximum order of 2,
as also selected by the AIC. The estimated results for tourism-growth nexus in Fiji is
reported in Table 5.3. The adjusted R2 value of 0.50 indicates that tourism growth model
explains about 50 percent of the variations in Fiji’s economic growth. The model’s
diagnostic tests for serial correlation, functional form, normality of the residuals, and
heteroskedasticity do not indicate any concern.
The estimated long run and short run relationships are noted. The coefficients for the
standard production function factors of labour force (GLF) and merchandise exports (GX)
have positively contributed to economic growth. However, the estimated negative and
statistically significant total investment coefficient suggest that investment has declined
over time. This has been due to the political instability since 1987 whereby the results
indicate that low levels of investment have an adverse effect on growth.
The estimated long run coefficients for labour force suggest that a 1 percent increase in the
labour force leads to a 4.12 percent increase in GDP. This result is similar to Gounder
(2002) but differs from that of Narayan and Smyth (2005). Narayan and Smyth obtained
mixed and insignificant results for the long run and short run labour force coefficients. The
estimated long run growth in merchandise exports (GX) coefficient is positive and
significant, it suggest that a one percent increase in merchandise goods exports increases
GDP by 29 percent. This result differs from the per capita results of Doessel and Gounder
(1996) where the merchandise exports coefficient was negative but insignificant for the
period 1980 to 1993.
The estimated export of tourism services (GTR) coefficient is positive and statistically
significant at the 1 percent level in the short run. The long run coefficient indicates that a 1
percent increase in tourism exports leads to a 12 percent increase in the growth of Fiji’s
economy. This finding is similar to the results derived by Doessel and Gounder (1996)
where a one percent change in tourism receipts leads to a 14 percent increase in economic
growth and Narayan’s (2004b) Computable General Equilibrium (CGE) results where a 10
9 This process is applied to all equations as specified in this chapter.

109
percent increase in tourist expenditure increases GDP by 0.5 percent in dollar value terms.
This result also supports the recent finding of Kumar and Prasad (2007) who analyzed the
case of the aggregate services exports-growth nexus for Fiji. He found that total service
exports, of which tourism exports is a major component, has had a positive impact total
output level in both the short run and long run.
Table 5.3 Results for Tourism-Growth Nexus in Fiji Dependent Variable: Growth in Gross Domestic Product
ARDL Estimates Long Run Estimates ECM Short Run
Estimates
Variable Coefficient Coefficient Variable Coefficient
4.12 4.12 4.12 GLF
(3.05)*** (3.05)*** ∆GLF
(3.05)*** -5.36 -5.36 -5.36 LIY
(-2.00)* (-2.00)* ∆LIY
(-2.00)* 0.15 0.29 0.15 GX
(2.10)** (2.45)** ∆GX
(2.10)** 0.03 -0.12 GXt-1
(0.41) ∆GXt-1
(-1.97)* 0.12 0.12 0.12 GTR
(2.75)*** (2.75)*** ∆GTR
(2.75)*** -2.12 -2.12 -2.12 DV
(-1.44) (-1.44) ∆DV
(-1.44) -2.51 -2.51 ∆DVCY -2.51 DVCY
(-2.03)** (-2.03)** (-2.03)* 8.34 8.34 Constant
(1.06) ∆Constant
(1.06) -1.30
ECMt-1 (-7.62)***
Adjusted R2 0.50 0.80 SER 3.35 SCχ2(1) 0.78 FFχ2(1) 0.05 Nχ2(2) 0.67 Hχ2(1) 0.00 Note: ***, ** and * are the levels of significance at the one, five and ten percent levels of the t-ratios given in brackets. The description of the test statistics are as follows: Adjusted R2 is the coefficient of determination, adjusted for degrees of freedom. SER is the standard error of the regression. SC stands for Serial Correlation. FF is Functional Form. N is Normality of residuals and H stands for Heteroskedasticity. The critical values of the chi-square distribution for the tests are as follows: χ2(1) = 6.63, χ2(2) = 9.21.
In terms of the impact of political instabilities (DV) and incidences of tropical cyclones
(DVCY) coefficients, both indicate negative effects from coups and cyclones that
adversely impact the economy. The estimated coup dummy coefficient shows a weak
negative significance level (16 percent level) that suggest that coups in Fiji have led to
substantial decline in growth in the long run. On the other hand the estimated long run

110
cyclone coefficient suggests that the adverse effects of tropical cyclones lead to a 2.5
percent decline in growth. This finding is similar to that of Chand (2000) and Gounder and
Katafono (2004). The ECM results for the movement of the variables in relation to the
previous period’s gap from long-run equilibrium show that the error correction term
(ECMt-1), coefficient is negative and statistically significant at the one percent level. This
suggests that during short term disturbances, the speed of returning to equilibrium is fast.
5.3.2 Tourism Reform and Determinants
After establishing that tourism is a major driving force of economic growth, the effect of
the tourism trade reform and other determinants on the demand for tourism is estimated.
The determinants of tourism are measured using equations (5.2a), (5.2b), (5.2c) and (5.2d).
In (5.2a) and (5.2b), the dependent variable is tourism receipts and in (5.2c) and (5.2d), the
dependent variable is tourism arrivals. Both equations include the reform indicators as
determinants to ascertain its impact on Fiji’s tourism exports performance. The result of
equation (5.2a) and (5.2b) is reported in sub-section 5.3.2.1. Section 5.3.2.2 explains the
results related to equation (5.2c) and (5.2d).
5.3.2.1 Tourism Receipts and Reform Results
The relationship between tourism receipts and the tourism trade reform amongst other
determinants in Fiji is analyzed using equations (5.2a) and (5.2b). In equation (5.2a), the
dependent variable tourism receipts (LTR) is regressed against the standard determinants
of demand for tourism including the hotel price index (LHPI) in Fiji, the official exchange
rate (LOER) and the income per capita of Fiji’s major tourist source markets (LAPCY).
Other determinants are added including the total amount spent by government on tourism
promotion abroad (LTPE), the dummy variable for the incidence of coups (DV) and the
reform indicators consisting of the level of foreign direct investment in tourism (FDIY)
and the intensity of the production of tourism services (GHRYS). In equation (5.2b),
tourism receipts is analyzed in terms of the hotel price index (HPI), the real effective
exchange rate (LREER), income per capita of tourist source markets (LAPCY), total
government expenditure on tourism promotion abroad and the reform indicators consisting
of the level of total foreign direct investment and a dummy variable for the implementation
of tourism reform in 1999 (DVTR).

111
The Bounds F-test is applied to both equations (5.2a) and (5.2b) excluding the dummy
variables. The result in Table 5.4 shows that the F-statistic values of 3.37 for equation
(5.2a) and 2.97 for equation (5.2b) falls outside their upper bound critical values of 3.199
and 2.862 respectively. This indicates that the null hypothesis of no long run relationship
amongst the variables in each model can be rejected. Therefore, a significant long run
relationship exists among the variables in both equations at the 95 percent level confidence
interval for (5.2a) and 90 percent level confidence interval for equation (5.2b).
Table 5.4 Bounds F-Test Results for Tourism Receipts and Reform in Fiji Critical value band Model K- degrees of
freedom I(0) I(1)
Estimated F test value
Pass/Fail
Equation (5.2a) 7 2.003 3.199 3.37 Pass
Equation (5.2b) 6 1.760 2.862 2.97 Pass Note: The critical values are from Pesaran and Pesaran (1997) Table F, p. 478.
The ARDL estimation of the short run, long run and error correction coefficients are
presented in Table 5.5. The model’s conventional tests indicate a good fit to the data.
Based on the estimated values of serial correlation, functional form, normality of the
residuals and heteroskedasticity, the models diagnostic tests are not subject to any problem.
In terms of the long run and short run relationships in equation (5.2a), the standard tourism
demand determinants of the hotel price index (LHPI) and income per capita of tourist
source markets (LAPCY) have positively contributed to tourism receipts. However, the
significant and negative coefficient for the official exchange rate indicates a departure from
demand theory and suggests that the two large devaluations of the Fiji dollar conducted as
a result of the 1987 coup and the 1997 Asian financial crisis have generally not supported
in favour of a tourist influx and spending to increase Fiji’s tourism receipts.
The hotel price index (LHPI) did not have the expected negative sign. The estimated
positive long run LHPI coefficient suggests that price levels of hotel, food and
accommodation for quality tourism services influence receipts. This positive relationship
could be attributed to the business practice of selling holiday packaged deals and suggests
that hotel food and accommodation in Fiji is of a quality standard that appeals to tourists
more than its actual prices. This finding for Fiji can be supported by the views of Buhalis
(2000) and Dwyer and Kim (2003) who argue that visitors maybe prepared not to trade
quality of tourism experiences for lower prices. Thus, regardless of the price levels, it is.

112
Table 5.5 Results for Tourism Receipts and Reform in Fiji Dependent Variable: Tourism Receipts
ARDL Estimates Long Run Estimates ECM Short Run Estimates
Variable Coefficients Coefficients Variables Coefficients (5.2a) (5.2b) (5.2a) (5.2b) (5.2a) (5.2b)
0.32 0.33 0.22 LTRt-1 (2.18)** (2.29)**
∆LTRt-1 (1.75)*
-0.22 LTRt-2 (-1.75)*
0.64 1.10 0.71 0.44 0.64 1.10 LHPI
(3.59)*** (2.71)*** (6.03)*** (1.70)* ∆LHPI
(3.59)*** (2.71)*** -0.80 LHPIt-1 (-2.23)** -0.80 -0.78 -0.80 LOER (-3.62)*** (-4.04)***
∆LOER (-3.62)***
0.86 0.76 LOERt-1 (2.38)**
∆LOERt-1 (3.06)***
-0.76 LOERt-2 (-3.06)***
0.96 1.31 0.96 LREER (2.87)*** (3.78)***
∆LREER (2.87)***
-0.69 -0.60 LREERt-1 (-1.33)
∆LREERt-1 (-1.83)*
0.60 LREERt-2 (1.83)*
1.36 -0.42 1.51 2.74 1.36 -0.42 LAPCY (2.20)** (-0.32) (2.21)** (1.79)*
∆LAPCY (2.20)** (-0.32)
2.25 LAPCYt-1 (1.71)* 0.02 0.01 0.02 0.04 0.02 0.01 FDIY (1.79)* (0.92) (1.57) (1.47)
∆FDIY (1.79)* (0.92)
0.02 FDIYt-1 (1.75)*
-0.002 -0.01 -0.002 GHRYS (-1.22) (-2.45)**
∆GHRYS (-1.22)
-0.0009 0.01 GHRYSt-1 (-0.44)
∆GHRYSt-1 (3.04)***
-0.01 GHRYSt-2 (-3.04)***
0.27 0.17 0.30 0.25 0.27 0.17 LTPE (3.24)*** (1.75)* (3.39)*** (1.62)
∆LTPE (3.24)*** (1.75)*
-0.19 -0.21 -0.19 DV (-2.34)** (-2.61)**
∆DV (-2.34)**
-0.08 -0.11 -0.08 DVTR (-0.83) (0.81) (-0.83) -2.83 -13.56 -2.83 -13.56 Constant (-0.56) (-1.62)
∆Constant (-0.56) (-1.62)
-0.90 -0.67
ECMt-1 (-5.81)*** (-4.64)***
Adjusted R2 0.99 0.99 0.67 0.59
SER 0.08 0.08 SCχ
2(1) 1.02 0.29
FFχ2(1) 0.16 0.73
Nχ2(2) 0.97 0.56
Hχ2(1) 1.18 0.77
Note: ***, ** and * are the levels of significance at the one, five and ten percent levels of the t-ratios written in brackets. The description of the test statistics are as follows: Adjusted R2 is the coefficient of determination, adjusted for degrees of freedom. SER is the standard error of regression. SC stands for Serial Correlation. FF is Functional Form. N is Normality of residuals and H stands for Heteroskedasticity. The critical values of the chi-square distribution for the tests are as follows: χ2(1) = 6.63, χ2(2) = 9.21.

113
ultimately the quality of tourism products that influence travel decisions. The results
suggest that travel and hotel packages promoted by hotels and travel agencies have a
positive impact on tourism revenue whereby the accommodation and food costs do not
deter travel decisions.
The income of tourists measured from the main destinations by the average of the income
per capita of Australia, New Zealand, USA, Canada, United Kingdom and Japan (LAPCY)
shows a strong and positive impact on Fiji’s tourism earnings. This result is consistent with
the demand theory and indicates that a rise in income in the tourists origin countries lead to
an increase in spending on tourism products. The positive and significant sign of the
lagged dependent variable (LTRt-1) suggests that tourism receipts in Fiji depend on the
previous year’s spending by the tourists.
In terms of the reform, the long run coefficient for the total foreign direct investment
(FDIY) variable shows a positive and weak relationship with tourism earnings. It is noted
that FDIY impacts on tourism receipts in the short run but does not attain the conventional
significance level in the long run. The lack of significance of the FDIY parameter at the
conventional level indicates that Fiji’s commitment to open up trade in tourism services
through allowing more foreigners to invest and provide hotel accommodation and
restaurants in Fiji has not boosted total tourist expenditure to a higher level. This could be
attributed to the incidence of coups. The slow growth in FDI flows has been mainly due to
cautionary decisions on foreign investment. The coefficient measuring the intensity of
tourism production (GHRYS) in equation (5.2a) is negative and significant at the 5 percent
level. This is due to the general decline in the intensity of tourism production in the post-
coup period resulting from the lower than potential occupancy rates. In addition, the
growth in hotels, restaurants and tourist related services has not been undertaken due to
higher risk on capital associated with political instability and decline in various economic
activities over time. These findings are supported by the views of Gounder (2002, 2005)
who notes that investment levels in various sectors are low which also affects the economic
activities resulting in poor economic growth. The finding that foreign direct investment is
weakly related to tourism receipts deviates from the general perception that tourism
reforms significantly impact on the export performance of the sector as pointed out by
Tang et al., (2007) and the OECD (2008).

114
As expected the government spending on tourism promotion abroad (LTPE) is positively
related to tourism receipts (LTR) and is statistically significant at the 1 percent level. This
suggests that promotion and marketing information on Fiji’s competitive tourism products
has a significant impact on tourist arrivals. Thus, attracting potential visitors to buy the
tourism product via promotion is positive and significant. Both short run and long run
coefficients have significant impacts on tourism receipts, i.e. in the short run increase in
tourism promotion expenditure increases tourism receipts by 0.27 percent. Likewise, in the
long run, a 1 percent increase in government spending on tourist promotion overseas
causes tourism exports to increase by 0.30 percent.
The occurrence of coups causing political instability measured by the dummy variable
(DV) is negative and significant in both the short and long run at the 5 percent level. This
finding indicates that coups are detrimental to the demand for tourism services. It caused
tourists to cancel their visit to Fiji or diverted their spending to alternative tourist
destinations. In terms of the short run dynamics given by the error correction result, the
lagged error correction term is negative and significant at the 1 percent level and indicates
that 90 percent of the change in demand for tourism exports is due to disequilibrium which
rapidly converges to long run equilibrium within a short period of time.
In equation (5.2b), another measure for the impact of tourism trade reform is utilized in
terms of a dummy variable for the implementation of the reform in 1999 (DVTR). The
coefficient for this dummy variable would confirm whether the implementation of Fiji’s
commitments on the tourism sector to the WTO’s General Agreements on Trade in
Services (GATS) has impacted on the export of tourism services. Equation (5.2b) also
measures the extent of Fiji’s competitive level in the global market, assessed by
substituting the official exchange rate (LOER) with the real effective exchange rate
(LREER).
The results shown in Table 5.5 indicate that all same variables in equation 5.2a i.e. LHPI,
LAPCY, FDIY and LTPE attained similar signs and significance levels. Substituting the
real effective exchange rate (LREER) in place of the official exchange rate (LOER) in
equation (5.2b), it indicates a positive and significant effect on tourism receipts. This
suggests that relative prices are positively related to the spending by tourist and means that

115
despite an increase in the real effective exchange rate (or a loss in the level of
competitiveness) the tourist expenditure increases.
The negative and weak effect of the reform implementation (DVTR), shows that the
reform has not created a significant impact on tourism earnings. A possible reason for this
adverse impact is that although the government has improved investment regulations and
approval processes of FDI, domestic issues such as the coups causing political instability
and land disputes between land owners and hotel developers have worked against the
measures to encourage more FDI in tourism. This is exacerbated by the poor execution of
other complementary reforms e.g. land, political and institutional reforms which have been
slow to encourage more FDI flows in tourism sector. This result is consistent with the
review of Reddy et al., (2004) who note that the incomplete progress of the complementary
reforms in the land, finance, labour market, public sector, goods markets, the political
arena and institutions have led to the failure of Fiji’s export-oriented growth strategy. The
findings suggest that tourism services have not benefited due to lack of reforms even
though Fiji’s commitment to WTO GATS reforms.
5.3.2.2 Tourism Arrivals and Reform Results
After estimating the effect of the WTO’s service trade reforms on tourism receipts,
equation (5.2c) analyses how the level of foreign direct investment (FDIY) explains the
volume of inbound tourists to Fiji (LTA). Other determinants of tourist arrivals are
included such as the price of hotel food and accommodation (LHPI), the cost of air fares
by the national airline (LAFI), income per capita of tourist source markets (LAPCY),
economic growth in Fiji (GY) and the total supply of hotel rooms (LHRA). In equation
(5.2d), specific determinants that attract tourist arrivals are analyzed including the hotel
price index, cost of air fares by the national airline, total supply of hotel rooms, the real
effective exchange rate (LREER) and the level of government expenditure on tourism
promotion abroad (LTPE).
The Bounds F-test is applied to equation (5.2c) to explain the existence of any long run
relationship between tourism arrival and reforms undertaken in Fiji. The result in Table 5.6
shows that the Bounds test F-statistic value of 4.73 is greater than the upper bound critical
value of 3.909. This indicates that the null hypothesis of no long run relationship amongst
the variables can be rejected. Therefore, a significant long run relationship amongst the

116
variables exists at the 99 percent level of confidence interval. In model (5.2d), the
estimated F-statistic value of 2.87 also exceeds the upper bound critical value of 2.862 and
indicates that significant long run relationships exist amongst the variables at the 90
percent confidence interval.
Table 5.6 Bounds F-Test Results for Tourism Arrivals and Reforms Critical value band Model K- degrees of
freedom I(0) I(1)
Estimated F test value
Pass/Fail
Equation (5.2c) 7 2.595 3.909 4.73 Pass
Equation (5.2d) 6 1.760 2.862 2.87 Pass Note: The critical values are from Pesaran and Pesaran (1997) Table F, p. 478.
The estimated coefficients for equations (5.2c) and (5.2d) are presented in Table 5.7. The
models have a very high explanatory power with an estimated coefficient of determination
of 0.98 for both equations. As shown by the model diagnostics, there are no problems of
serial correlation, functional form, normality of the residuals and heteroskedasticity.
In equation (5.2c), the long term coefficients for the determinants of tourism export
demand show that while the cost of hotel food and accommodation (LHPI) departs from
the theoretical expectation, the cost of travel by the national airline (LAFI) and the income
per capita of tourists from the major destinations (LAPCY) have the correct signs and are
statistically significant. The positive HPI coefficient is due to the increase in holiday
packaged deals offered, where the quality and not cost is a major concern accounted by the
tourists. This finding differs from the long run results of Narayan (2004a) who finds that
the hotel price index of Fiji relative to the hotel prices in the particular major tourist
markets of Australia, New Zealand and the United States are negatively associated with
visitor arrivals from these respective countries.
The negative relationship between air fares and tourist arrivals indicates that tourists are
generally sensitive to changes in fares by the national airline. The estimated coefficient for
LAFI indicates that an increase in the cost of air fares by the national airline causes a
decline in tourist arrivals coming through the Air Pacific Limited. This result is similar to
Narayan (2002) who found that an increase in cost of travel between Fiji and its main
tourist source in Australia, New Zealand and the United State leads to a fall in tourists
from these countries.

117
Table 5.7 Results for Tourism Arrivals and Reform in Fiji
Dependent Variable: Tourism Arrivals
ARDL Estimates Long Run Estimates ECM Short Run Estimates
Variable Coefficient Coefficient Variable Coefficient
(5.2c) (5.2d) (5.2c) (5.2d) (5.2c) (5.2d)
-0.08 -0.11 0.43 0.34 LTAt-1 (-0.53) (-0.95)
∆LTAt-1 (3.86)*** (3.54)***
-0.43 -0.34 LTAt-2 (-3.86)*** (-3.54)***
0.38 0.94 0.80 0.65 0.38 0.94 LHPI (1.71)* (5.97)*** (5.74)*** (6.88)***
∆LHPI (1.71)* (5.97)***
0.12 -0.70 LHPIt-1 (0.34)
∆LHPIt-1 (-3.21)***
0.70 LHPIt-2 (3.21)***
-1.22 -0.53 -0.45 -0.37 -1.22 -0.53 LAFI (-1.44) (-6.60)*** (-7.10)*** (-7.57)***
∆LAFI (-1.44) (-6.60)***
0.60 0.41 0.60 LREER (3.78)*** (3.81)***
∆LREER (3.78)***
0.29 0.58 0.29 LAPCY (-0.34) (2.24)**
∆LAPCY (-0.34)
2.37 1.22 LAPCYt-1 (2.04)**
∆LAPCYt-1 (1.44)
-1.22 LAPCYt-2 (-1.44)
0.005 0.02 0.005 FDIY (0.85) (2.60)**
∆FDIY (0.85)
0.02 FDIYt-1 (3.53)
0.01 0.004 0.01 GY (2.73)*** (2.47)**
∆GY (2.73)***
0.33 0.22 0.33 LTPE (7.21)*** (7.14)*** (7.21)*** 0.80 0.52 0.53 0.36 0.80 0.52 LHRA (4.65)*** (3.53)*** (6.69)*** (4.10)***
∆HRA (4.65)*** (3.53)***
1.74 4.68 1.74 4.68 Constant (0.55) (4.67)***
∆Constant (0.55) (4.67)***
-1.50 -1.45
ECMt-1 (-8.57)*** (11.42)***
Adjusted R2 0.98 0.98 0.82 0.81
SER 0.05 0.05 0.05 0.05 SCχ
2(1) 1.21 2.01
FFχ2(1) 0.21 1.52
Nχ2(2) 0.95 1.27
Hχ2(1) 4.89 0.01
Note: ***, ** and * are the levels of significance at the one, five and ten percent levels of the t-ratios written in brackets. The description of the test statistics are as follows: Adjusted R2 is the coefficient of determination, adjusted for degrees of freedom. SER is the standard error of regression. SC stands for Serial Correlation. FF is Functional Form. N is Normality of residuals and H stands for Heteroskedasticity. The critical values of the chi-square distribution for the tests are as follows: χ2(1) = 6.63, χ2(2) = 9.21.

118
The positive coefficient for the income per capita (LAPCY) indicates that a 1 percent
increase in the per capita income of the major source destinations leads to a 3.11 percent
increase in the volume of inbound tourists to Fiji. In elasticity terms, the LAPCY
coefficient exceeds unity and confirms that tourism in Fiji is a luxury commodity. This
result is consistent with Gounder and Katafono (2004), who found that the trade weighted
real income of Fiji’s major trading partners have a positive and significant effect on tourist
arrivals in both the short and long run. The finding is also similar to Narayan (2004a) who
found that the respective income levels of Australia, New Zealand and USA positively
relate to the visitor arrivals from these respective countries supporting the theory that rises
in income levels of tourists increase the consumption of tourism and travel services.
The long run estimate for the FDIY parameter is positive and significant. This differs from
the result of equation (5.2a) where a positive but a weak impact exists between FDIY and
tourism receipts. The significant impact of the FDIY variable on tourist arrivals can be
attributed to the increasing FDI in the aviation industry brought about by the major foreign
investment undertaken in 1998 by Qantas Airways in the national airline. This improved
the standard quality of air services and directly increased total passenger traffic dominated
by tourist visitor arrivals. This result is consistent with the finding in Chapter 6 where the
reform activity of introducing foreign capital from Qantas Airways (i.e. government
divestiture in the national airline) significantly created an impact in boosting total
international passenger traffic.
In terms of the existing features of the Fiji tourist destination, the coefficient for the growth
in domestic income (GY) positively links to tourism arrivals and indicates that economic
growth in terms of improved transport infrastructure, hotel facilities, public amenities, and
other socio-economic developments augurs well that attracts more tourist inflows. The
positive and significant hotel room coefficient (LHRA) indicates that more hotel rooms
leads to an increase in tourist arrivals. In terms of the overall short run changes in the
variables in relation to the previous period’s diversion from long run equilibrium, the error
correction term is negative and significant that indicates that 66 percent of the change in
tourism arrivals is attributed to long run disequilibrium which quickly recovers within a
short period of time.

119
5.4 Conclusion
The chapter presents the results for tourism growth and the impact of reforms in Fiji. First,
the results indicate that the effect of tourism export receipts on economic growth is positive
and significant supporting the validity of the tourism-led growth hypothesis for Fiji. In
comparison, while the export of merchandise goods is also positive, its contribution is not
significant. It is seen that tourism exports contributes more to economic growth than goods
merchandise exports. Tourism has been a dominant source of growth and development of
the economy. Manpower resources contribute positively compared to the generally low and
depressed investment sector. Political coups have negative effects on growth and suggest
that political instabilities are detrimental to economic growth, tourism, investment and
other economic activities.
In estimating the determinants of tourist export receipts and tourist arrivals, the income per
capita of major source markets and the level of air fares by the national airline are both
significant while the exchange rate variables and the cost of hotel food and accommodation
deviated from the demand theory. This suggests that the level of income matters more to
the tourists than the cost of hotel food and accommodation and exchange rate.
Government support through tourism promotion and marketing expenditure plays a key
role in boosting tourist arrivals to Fiji. While coups deter tourist receipts and arrivals, the
significant and positive coefficients pertaining to the level of economic prosperity, and the
availability of hotel rooms implies the importance of maintaining economic growth and the
need to balance demand for hotel facilities with the increasing number of inbound tourists.
In terms of the reforms, the total foreign direct investments have a positive impact on both
tourism receipts and arrivals. However, the intensity of tourism production showed a
strong adverse relationship with tourist receipts due to the declining intensity of tourism
production in the period after the first coup. Overall, the implementation of streamlining
the FDI processes and improving the investment regulations has been ineffective and not
significant because of the adverse effect of the coups and the incidences of land disputes
which affect foreign investors and developers.

120
Chapter Six
AIR SERVICES GROWTH AND REFORMS: EMPIRICAL
RESULTS
6.1 Introduction
This chapter discusses the empirical results of the nexus between international air services
exports and economic growth, and the effect of the public enterprise reforms in the civil
aviation sector on the export of air services in Fiji. During the last thirty six years, the
performance of the aviation industry in Fiji (as outlined in Chapter 4) has indicated the
importance of air services and its mutual link to other sectors of the economy, particularly
the tourism industry. While the empirical result of the tourism models outlined in chapter 5
indicates that the tourism reform has not significantly impacted on the demand for tourism,
the cost of air services by the national airline confirms its significant influence on the
travel decisions of the tourists to Fiji. Given the close interlink between tourism and air
services and its relation to economic growth, the aviation industry has been directed by
various policies to support the tourism sector. This, in particular, has been seen by the
public enterprise reforms to boost the level of efficiency in the supply of air services.
In most developing countries, the regulation of air services for growth, balance of
payments support and other reasons such as national security concerns, public interest and
the fear for the rise of monopoly producers in the provision of air services have justified
the actions of these nations to protect this sector (Shelp, 1987; Castle and Findlay, 1987,
Itoh and Shimoi, 2003). However, the critical role of services in determining both the
quality and speed of the process of economic development, through competition and
efficiency, has led many countries to deregulate services through the reform programs of
the World Bank and International Monetary Fund (IMF). This has been undertaken
through various pro-competitive measures, such as the public enterprise reform of the
aviation regulation and airport management functions and through reducing government
ownership in the national airlines. In the case of Fiji, two public enterprise reform activities
in the aviation sector have been undertaken since 1998 to improve the efficiency in the
provision of air services. This include (i) the restructure of the Civil Aviation Authority of
Fiji (CAAF) into two entities namely the Civil Aviation Authority of the Fiji Islands
(CAAFI) for the function of aviation regulation, and Airports Fiji Limited (AFL) for

121
airport management; and (ii) the sale of government shares of the national airline to Qantas
Airways Limited.
Previous studies on the aviation growth nexus such as Button and Taylor (2000) and
Button (2006) indicate that international air services have largely impacted on the growth
and development of international and local economies. The studies supporting this
relationship have been for the developed countries whose aviation markets are more
developed and liberal. Not many studies exist on developing countries and in the case of
Fiji, there has been no empirical examination of the air services exports and growth nexus.
The result estimated in this chapter is to indicate whether international air services have
significantly contributed to Fiji’s growth in services. In regards to the effect of aviation
reforms on air service exports, many studies have shown that the reforms and liberalization
of air services in the international market both significantly contribute to employment,
economic growth and higher total passenger traffic. In this analysis, the two reform
activities amongst other determinants of air services, are investigated to determine its
impact on the export of air passenger services in Fiji. The chapter is organized as follows:
Section 6.2 outlines the models, data and methodology used in the analysis and the
stationarity of the variables. The results for the Autoregressive Distributed Lag (ARDL)
equations are presented in Section 6.3 and Section 6.4 highlights the conclusion.
6.2 International Air Services-Growth, Determinants and Reforms
This section focuses on the empirical analysis of the contribution of international air
services exports to economic growth and whether the public enterprise reform activities
consisting of the CAAF reform and reduced government shareholding in the national
airline, amongst other determinants, have impacted on the demand for international air
services in Fiji. It presents the models and results for equations (6.1), (6.2a) and (6.2b)
shown below.
6.2.1 International Air Services-Growth Determinants Models
The first regression equation for the air services exports and growth nexus is based on the
neoclassical growth framework that takes the following form:
GYSt = γ0 + γ1GLFSt + γ2PIYSt + γ3GTPTt + γ4OPEN + γ5DVt + µ5 (6.1)

122
Where GYS is the growth in gross domestic product (GDP) in the services sector;
GLFS is the growth in the services sector labour force;
PIYS is private sector investment to GDP services ratio;
GTPT is the growth in total international passengers carried by domestic airlines;
OPEN is the total trade given by exports plus imports to GDP ratio; and
DV is the dummy variable for the impact of the coups.
Similar to Button and Taylor (2000), this study uses total international passenger traffic
(GTPT) as the key explanatory variable to proxy for the export of international air services.
This is added to the neoclassical growth model inputs of labour and investment with other
factors that may affect service growth, such as the magnitude of trade activities (OPEN)
and political instabilities (DV). Fiji’s six major tourist markets are Australia, New Zealand,
United States, Japan, Canada and the United Kingdom. Tourism export earnings and flow
of tourists from these markets have been substantial over time which has also been
supported by the government initiatives to increase tourist flows from these sources. Thus,
openness of Fiji’s economy is crucial to measure whether air travel decision, on balance,
has a net effect due to openness of the economy.
After determining the relationship between air services and economic growth, the next step
is to determine whether the two reform activities undertaken in the aviation sector have
influenced international air services exports. This research question is analyzed based on
the economic theory of demand applied to international air services as a consumable
commodity. The specifications of the models to investigate the effect of reforms on
international air services exports consist of two equations as follows:
LTPTt=β0 + β1LAFIt + β2LAPCYt + β3AERt + β4GTTt + β5PIYt + β6DVt + µ2 (6.2a)
LTPTt=β0 + β1LAFIt + β2LAPCYt + β3AERt + β4GTTt + β5LIYt + β6DVARt+ µ3 (6.2b)
where LTPT is the log of total international passenger traffic by domestic carriers;
LAFI is the log of the national airline’s air fare index;
LAPCY is the log of the average income per head of the six major markets of
Fiji’s air services;

123
AER is the national airline’s total expenditure to revenue ratio;
GTT is the growth in total transport output;
PIY is private sector investment to GDP ratio;
LIY is the log of the total investment to GDP ratio;
DV is the dummy variable representing the effect of the coups; and
DVAR is the dummy variable reflecting the year in which Fiji implemented
the two aviation reform activities in 1998.
In equation (6.2a), the demand for international air services in Fiji (LTPT) is set as a
function of the price of international air services (LAFI) and the income level of consumers
from Fiji’s major air service markets consisting of Australia, New Zealand, United States,
Japan, Canada and Great Britain (LAPCY). Other factors that influence the demand for
international air services exports are added including the level of private sector investment
(PIY) and the two key reform variables, i.e. the total operating expenditure to revenue
share of the national airline (AER) reflecting the introduction of new management from
Qantas to the national airline; and the growth in total transport services output that gauges
the effect of the restructure of CAAF into the regulatory and airport management roles.
In equation (6.2b) the dummy variable (DVAR) representing the implementation of the
two reforms in 1998 is introduced to confirm its impact on international air services export.
If the reforms have had a positive effect on total passenger traffic the decline in airline
expenditure to revenue share would have a negative sign as the new management and
technical expertise would be measured by its performance in improving the quality through
reducing total expenditure as a share of revenue. At the same time growth in total transport
output (GTT) would have a positive sign and the DVAR coefficient for the implementation
of the aviation reform in 1998 activities will have a positive sign.
6.2.2 Data and Methodology
The data for the parameters used are obtained from the World Bank (2007), Reserve Bank
of Fiji (2007), Air Pacific Limited (various) and the Fiji Islands Bureau of Statistics
(various). The data definitions are outlined in Table 4.1 (Chapter 4) and the data
transformations have been applied to the relevant variables for empirical estimations. The
ARDL technique has been used applying Microfit Version 4.1 econometric software
(Pesaran and Pesaran, 1997). The ARDL approach is selected because of its capability to

124
determine the short and long run impact of the air services exports and growth nexus and
between the air service determinants, reform and air passenger services exports. This
method determines if there is any long run relationship amongst the variables and the short
and long run relationships with the error correction model. An analysis of the time series
properties of the model data using the Augmented Dickey Fuller (ADF) test is conducted
to determine the stationarity of the variables. This result is reported in the next sub-section.
6.2.3 Results for Unit Root
The ADF test for the stationarity is applied to analyze whether the means and variances of
the variables used are constant over time. It determines whether the variables in each
model are stationary in their levels or first difference forms. This assigns the order of
integration for each variable i.e. I(0) or I(1). Table 6.1 shows the unit root test results for
all variables used in the models (6.1), (6.2a) and (6.2b).
Table 6.1 ADF Test Results Aviation Variables Levels First differences Variable
Intercept and trend
Order of integration
Intercept and trend
Order of Integration
GYS -2.50 I(1) -7.41 I(0)
GLFS -6.31 I(0)
PSIYS -2.43 I(1) -3.81 I(0)
GTPT -5.22 I(0)
OPEN -3.13 I(1) 4.41 I(0)
LTPT -2.87 I(1) -5.26 I(0)
LAAF -0.56 I(1) -5.87§ I(0)
LAPCY -3.81 I(0)
AER -1.18 I(1) -5.25 I(0)
GTT -3.85 I(0)
LIY -2.01 I(1) -4.83 I(0) Note: Critical value at 5% level is -3.53 for intercept and trend. § variable is in second difference form. Legend: GYS is the growth in GDP in the services sector, GLFS is the growth
in the services sector labour force, PSIYS is private sector investment to GDP services ratio, GTPT is the growth in total international passengers carried by domestic airlines, OPEN is the total trade given by exports plus imports to GDP ratio, LTPT is the log of total international passenger traffic by domestic carriers, LAFI is the log of the national airline’s air fare index, LAPCY is the log of the average income per head of the six major markets of Fiji’s air services, AER is the national airline’s total expenditure to revenue ratio, GTT is the growth in total transport services output and LIY is the log of the total investment to GDP ratio.

125
The results in Table 6.1 reveal that the labour force, international passenger traffic, income
per capita of Fiji’s major air services markets and total transport services output are
stationary in their level forms with their ADF estimates exceeding the critical values at the
5 percent level for a model with intercept and trend. The remaining variables are stationary
in their first difference forms except for the air fare index variable (LAFI) which became
stationary in its second difference form.
6.3 Results for Air Services-Growth Nexus and Reform
This section presents the results of the equations specified in sub-section 6.2.1. The air
services and growth relationship model is reported in sub-section 6.3.1. The result of the
impact of the aviation reforms in Fiji on the demand for air services in Fiji is presented in
sub-section 6.3.2.
6.3.1 Air Services-Growth Nexus
The first step in the ARDL method is the estimation of any long run relationships amongst
the variables. The Bounds F test result in Table 6.2 shows the result of this first stage with
the estimated F test value indicative of the presence of the long run relationship amongst
the variables. As the calculated F-statistic of 3.63 exceeds the upper bound value of 3.340,
the null hypothesis of no cointegration is rejected irrespective of whether the variables
used are integrated of order one I(1) or zero I(0). This indicates that a long run relationship
exist among the variables in equation (6.1) at the 90 percent confidence level.
Table 6.2 Bounds F-Test Results for Air Services and Growth Nexus in Fiji Critical value band (90%) Model K- degrees of
freedom I(0) I(1)
Estimated F test value
Pass/Fail
Equation (6.1) 5 2.157 3.340 3.63 Pass Note: The critical values are from Pesaran and Pesaran (1997) Table F, p. 478.
In the second stage, the estimation of the ARDL, long run and ECM coefficients is
undertaken by setting the maximum order of lags to 2 and using the Akaike Information
Criteria (AIC) to select the appropriate lags.10 The result is given in Table 6.3. The
estimated adjusted R2 value of 0.64 indicates that the full ARDL estimation for the air
services growth model explains 64 percent of the variations in Fiji’s growth in services.
The F statistic is significant at the 1 percent level, and the model’s diagnostic tests for
10 This process is applied to all equations as specified in this Chapter.
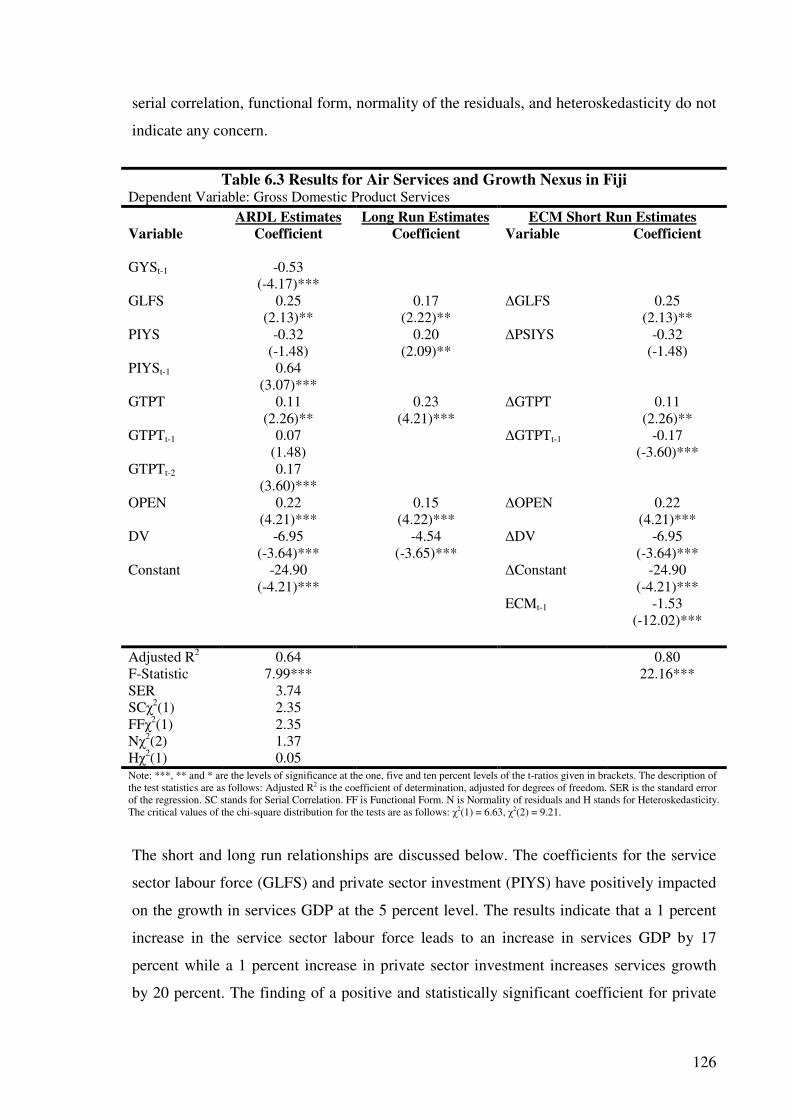
126
serial correlation, functional form, normality of the residuals, and heteroskedasticity do not
indicate any concern.
Table 6.3 Results for Air Services and Growth Nexus in Fiji Dependent Variable: Gross Domestic Product Services
ARDL Estimates Long Run Estimates ECM Short Run Estimates
Variable Coefficient Coefficient Variable Coefficient
-0.53 GYSt-1
(-4.17)***
0.25 0.17 0.25 GLFS
(2.13)** (2.22)** ∆GLFS
(2.13)** -0.32 0.20 -0.32 PIYS
(-1.48) (2.09)** ∆PSIYS
(-1.48) 0.64 PIYSt-1
(3.07)***
0.11 0.23 0.11 GTPT
(2.26)** (4.21)*** ∆GTPT
(2.26)** 0.07 -0.17 GTPTt-1
(1.48) ∆GTPTt-1
(-3.60)*** 0.17 GTPTt-2
(3.60)***
0.22 0.15 0.22 OPEN
(4.21)*** (4.22)*** ∆OPEN
(4.21)*** -6.95 -4.54 ∆DV -6.95 DV
(-3.64)*** (-3.65)*** (-3.64)*** -24.90 -24.90 Constant
(-4.21)*** ∆Constant
(-4.21)*** -1.53
ECMt-1 (-12.02)***
Adjusted R2 0.64 0.80 F-Statistic 7.99*** 22.16*** SER 3.74 SCχ2(1) 2.35 FFχ2(1) 2.35 Nχ2(2) 1.37 Hχ2(1) 0.05 Note: ***, ** and * are the levels of significance at the one, five and ten percent levels of the t-ratios given in brackets. The description of the test statistics are as follows: Adjusted R2 is the coefficient of determination, adjusted for degrees of freedom. SER is the standard error of the regression. SC stands for Serial Correlation. FF is Functional Form. N is Normality of residuals and H stands for Heteroskedasticity. The critical values of the chi-square distribution for the tests are as follows: χ2(1) = 6.63, χ2(2) = 9.21.
The short and long run relationships are discussed below. The coefficients for the service
sector labour force (GLFS) and private sector investment (PIYS) have positively impacted
on the growth in services GDP at the 5 percent level. The results indicate that a 1 percent
increase in the service sector labour force leads to an increase in services GDP by 17
percent while a 1 percent increase in private sector investment increases services growth
by 20 percent. The finding of a positive and statistically significant coefficient for private

127
sector investment is in line with neoclassical growth theory and indicates that the
investments undertaken by the airlines and the private sector have had a significant long
term contribution to the growth of services. While the short run impact of private sector
investment is negative, the sign on the lag of private sector investment (PIYt-1) is positive
and significant and indicates that the previous year’s investment by the private sector has a
positive effect on the growth in services GDP.
The estimated coefficient for the growth in total international passengers carried by
domestic airlines (GTPT) is positive and statistically significant at the 1 percent level. The
long run GTPT coefficient indicates that 1 percent increase in total passenger traffic causes
services growth to increase by 23 percent. This finding is similar to Button and Taylor
(2000) who found a strong relationship between the number of international passengers
from Europe and economic development in the supplying regions of the United States. It
can be said that total international air services has a strong positive significant payoffs for
economic development which increases growth in GDP services in the case of Fiji. The
positive contribution by the magnitude of international goods trade (OPEN) is significant
in the long run. Thus openness has a positive payoff in increasing growth in GDP services.
The short and long run estimates of coup dummy variable (DV) support the consistently
negative impact that political instabilities have on growth. The estimated coefficient for the
error correction term (ECMt-1) is statistically significant at the 1 percent level. The negative
sign substantiates the quick return to long run equilibrium between the variables.
6.3.2 Aviation Reform and Determinants
After establishing the importance of air services as a strong determinant of economic
growth in services, this sub-section presents the results of the impact of the two reform
activities undertaken in Fiji. The two reform activities include the sale of government
shares in the national airline to Qantas Airways and the restructure of the Civil Aviation
Authority of Fiji (CAAF) into Airports Fiji Limited for the airport management function
and the Civil Aviation Authority of the Fiji Islands (CAAFI). This is to examine if there is
any impact of reforms on total international air services exports specified in equations
(6.2a) and (6.2b).
Equation (6.2a) assesses the determinants of international air services by regressing the
dependent variable of international passenger traffic (LTPT) by domestic carriers against

128
the cost of international air services in Fiji (LAFI), the income per capita of Fiji’s major air
service markets (LAPCY), two aviation reform activities measured by the national airline’s
ratio of total expenditure to revenue (AER), and the growth in total transport services
output (GTT), total investment as a share of GDP (LIY) and the dummy variable
measuring the impact of coups. In equation (6.2b), a third measure using a dummy variable
for the reform is entered to determine whether the overall implementation of the aviation
reform in 1998 has impacted on total air services exports.
As a first step, the Bounds F-test is applied to equations (6.2a) and (6.2b). The result in
Table 6.4 shows that both equations have long run relationships amongst the variables in
each of the respective models. In equation (6.2a), the estimated F statistic of 9.26 lies
outside the upper bound critical value of 4.124 while in (6.2b), the F-statistic of 3.92 also
lies above the upper bound critical value of 3.626. This indicates that the null hypothesis of
no long run relationship among the variables can be rejected in both the models. As such, a
significant long run relationship exists amongst the variables in equation (6.2a) at the 99
percent confidence interval and at the 97.5 percent confidence level for equation (6.2b).
Table 6.4 Bounds F-Test Results for Aviation Reform in Fiji Critical value band Model K- degrees of
freedom I(0) I(1)
Estimated F test value
Pass/Fail
Equation (6.2a) 6 2.744 4.124 9.26 Pass
Equation (6.2b) 6 2.367 3.626 3.92 Pass Note: The critical values are from Pesaran and Pesaran (1997) Table F, p. 478.
The estimation of the ARDL, long run and short run error correction coefficients is
presented in Table 6.5. The result indicates that the models have a high explanatory power
with the estimated coefficient of determination of 0.99. The model’s conventional tests
indicate a good fit to the data. Based on the estimated values of serial correlation,
functional form, normality of residuals and heteroskedasticity, the models diagnostic tests
are not subject to any problem.
In equation (6.2a), the coefficients for the standard air service demand factors of the air
fare index of the national airline (LAFI) and the income per capita of Fiji’s major air
service markets (LAPCY) have a positive effect on the growth in total international
passenger traffic. While the coefficient for air fare index is weak with an unexpected sign,
the income of travelers to Fiji from major destinations has the expected sign consistently
with demand theory and is significant at the 1 percent level. The long run income

129
Table 6.5: Results for Aviation Reforms and Determinants in Fiji Dependent Variable: Total International Passenger Traffic
ARDL Estimates Long run Estimates Short Run ECM Estimates
Variable Coefficient Coefficient Variable Coefficient
(6.2a) (6.2b) (6.2a) (6.2b) (6.2a) (6.2b)
LTPTt-1 0.19 0.75 ∆LTPTt-1 -0.39 (0.75) (8.19)*** (-1.80)* LTPTt-2 0.39 (1.80)* LAFI 0.34 0.03 0.32 0.19 ∆LAFI 0.34 0.03 (1.15) (0.18) (1.50) (0.73) (1.15) (0.18) LAFIt-1 0.32 0.57 ∆LAFIt-1 0.52 0.56 (0.86) (2.00)* (2.46)** (2.96)*** LAFIt-2 -0.52 -0.56 (-2.46)** (-2.96)*** LAPCY -0.03 1.17 3.76 3.85 ∆LAPCY -0.03 1.17 (-0.02) (0.91) (3.80)*** (1.99)* (-0.02) (0.91) LAPCYt-1 4.03 2.19 ∆LAPCYt-1 2.44 2.39 (1.83)* (1.17) (2.41)** (1.87)* LAPCYt-2 -2.44 -2.39 (-2.41)** (-1.87)* AER -0.0001 -0.01 -0.02 -0.02 ∆AER -0.0001 -0.01 (0.06) (-3.20)*** (1.98)* (-1.85)* (0.06) (-3.20)*** AERt-1 -0.01 (-1.99)* GTT 0.003 0.002 0.01 0.01 ∆GTT 0.003 0.002 (1.27) (0.88) (1.11) (0.81) (1.27) (0.88) PIYS 0.02 0.01 ∆PIYS 0.02 (2.68)*** (0.80) (2.68)*** PIYSt-1 -0.01 ∆PIYSt-1 0.01 (-0.83) (1.28) PIYSt-2 -0.01 (-1.28) LIY 0.41 1.63 ∆LIY 0.41 (3.85)*** (2.89)*** (3.85)*** DV -0.38 -0.92 ∆DV -0.38 (-2.43)** (-3.63)*** (-2.43)** DVAR -0.08 -0.32 ∆DVAR -0.08 (-0.92) (-1.00) (-0.92) Constant -10.41 -7.53 ∆Constant -10.41 -7.53 (-1.97)* (-1.34) (-1.97)* (-1.34) ECMt-1 -0.42 -0.25 (-2.91)*** (-2.77)***
Adjusted R2 0.99 0.99 0.46 0.52 SER 0.09 0.09 0.09 0.09 SCχ2(1) 0.54 2.56 FFχ2(1) 0.74 1.89 Nχ2(2) 0.37 5.09 Hχ2(1) 0.03 1.23
Note: ***, ** and * are the levels of significance at the one, five and ten percent levels of the t-ratios written in brackets. The description of the test statistics are as follows: Adjusted R2 is the coefficient of determination, adjusted for degrees of freedom. SER is the standard error of regression. SC stands for Serial Correlation. FF is Functional Form. N is Normality of residuals and H stands for Heteroskedasticity. The critical values of the chi-square distribution for the tests are as follows: χ2(1) = 6.63, χ2(2) = 9.21.

130
coefficient indicates that a 1 percent increase in the income per capita in the major source
markets leads to a 3.76 increase in total international passenger traffic. This also suggests
that air travel service is a luxury commodity given that its elasticity of 3.76 is greater than
unity.
The weak and positive coefficient for the cost of air travel suggests that air fare does not
deter the demand for air service exports in Fiji. This could be attributed to the worldwide
regulation of air fares by the International Air Transport Association (IATA) and the
restricted system of bilateral air service agreements which limit the number of airlines
servicing particular routes. This causes airlines to exercise some price control within the
ambit of IATA leaving passengers with little choice to respond to prices. Given this market
structure, all passengers traveling as tourists and non tourists as a whole in the national
airline would generally not treat air fares as a major concern, although tourists in particular
are sensitive to airline prices as shown in Chapter 5. The lag of the air fares (LAFIt-2)
indicates that a 1 percent increase air fares leads to a fall in demand for Fiji’s air services
exports in period two, however the long run air fare coefficient is not sufficient. It thus
suggests that air fares have not had an adverse effect on passenger traffic to Fiji.
In terms of the effect of the two reforms undertaken in the aviation industry, the long run
coefficient for the national airline’s total expenditure as a share of revenue (AER) is
negative and significant and suggests that a decrease in the operational expenditure of Air
Pacific indicates an improvement in efficiency which increases international passenger
traffic and vice versa. This implies that the reform activity of the sale of government shares
in the national airline to Qantas, which introduced new management and technical
expertise to Air Pacific, has reduced costs and improved air service operations, leading to
an increase in passengers and higher profits in the national airline. This is supported by the
trend in the expenditure and revenue of the airline over the last three and a half decades,
which clearly indicates the improvement in profitability since the introduction of foreign
management in 1998, particularly in the period of political instability in the ensuing years.
The growth in total transport services output (GTT), which specifically measures the
second reform activity related to the reorganization of the CAAF, indicates a positive
effect on the growth in international passenger traffic. This indicates that the growth in
total transport services output, dominated by air transport and services allied to transport

131
which captures the services of the newly formed entities of CAAF and AFL, has positively
impacted on the total passenger traffic. However, the impact is not significant at the
conventional level. This could be due to the adverse effects of the coups on growth in all
other service sectors and the consequences of the poor implementation of the reform, in
addition to political instability that deterred passenger traffic.
The short run coefficient for private sector investment (PSIY) indicates a positive and
significant relationship to international passenger traffic. This is attributed to the high
private sector-led investment in tourism and related services which with attractive tourist
goods and infrastructures attract the majority of the total international passenger traffic to
Fiji. However, this relationship is not significant in the long run because total private sector
investment has generally declined after the first coup in 1987. The incidences of coups
(DV) continue to support the negative impact that political instabilities have on economic
activities including the aviation sector. In terms of the overall short run changes in the
variables in relation to the previous period’s departure from long run equilibrium, the error
correction term indicates that 25 percent of the change in international air services exports
is due to long run disequilibrium which rapidly reverts to equilibrium status.
In equation (6.2b), the total investment variable (LIY) is introduced together with a third
measure for the reform represented by a dummy variable signifying the time of reform
implementation in 1998 (DVAR). This is to determine whether the total investment and the
overall implementation of the reform in 1998 amongst other determinants have impacted
on total international passenger traffic by domestic carriers.
The results shown in the third and fifth columns of Table 6.5 indicate that air fares and
income per capita of source market variables as in equation (6.2a) have obtained the same
signs and levels of significance. The estimated coefficient for total investment is positive
and significant in both the short and long run, indicating that overall investment by
government, public enterprises and the private sector has played an important role in the
demand for Fiji’s international air services. The long run investment coefficient indicates
that a 1 percent increase in total investment as a share of GDP causes total international
passenger traffic to increase by 0.41 percent in the short run and by 1.63 percent in the
long run.

132
In terms of the overall effect of the reform undertaken in the aviation industry, the long run
coefficient for the reform implementation dummy (DVAR) indicates that the aviation
reforms has not had a positive effect on the flow of international passenger traffic. This is
mainly attributed to the changing policy stance of the government with regard to the public
enterprise reforms. This was evident when the labour government reversed the various
reform processes after winning the election in 1999 (See McMaster, 2001). Later, when the
interim government took over after the coup in 2000, the reform was again revamped and
pursued with vigor. Even though the reform has been completed with the forming of new
entities (i.e. Airports Fiji Limited and the Civil Aviation Authority of the Fiji Islands)
operating as the government commercial companies, the substantial wastage of public
resources arising from its implementation and reversals generally led to a negative impact
on the export of air services though it is not significant. The period since the reform in
1998 has been marked with political instability which also affects policy changes. It
suggests that stable government policies are necessary for reforms and such
implementation of the reforms require a stable political environment for positive impact on
air services.
6.4 Conclusion
The chapter presents the results for the contribution of air services to growth and the
impact of the pro-competitive measures in the aviation sector in Fiji. First, the analysis, the
effect of air services exports on the growth rate of services GDP is measured. The results
show that growth in services GDP is supported by international air services exports which
contributes to economic growth and development in Fiji and particularly to services sector.
The positive contributions of service sector labour force and private sector investment
suggest the importance of these variables in the domestic airline industry. While the
intensity of international trade in goods indicates a positive and significant link to the
growth rate of services, the incidences of political coups have an adverse effect that is
detrimental to the airline industry, its associated components of the services sector, and to
the whole economy.
Having established that international air services exports contribute significantly to growth,
the results of estimating the impact of aviation reforms show that reduced government
shareholding leads to efficiency and significantly contribute to the demand for
international air services exports in Fiji. The growth in total transport output measuring the

133
outcome of the restructure of the Civil Aviation Authority of Fiji did not create a strong
impact. Also, the dummy variable for the implementation of both reform activities in 1998,
shows that the reforms have not contributed to total international passenger traffic due to
the negative impact of coups and the change in government policies on reforms which
adversely affected its implementation during the course of four different political regimes
since 1998.
The price of international air services by the national carrier does not deter total passenger
traffic and suggests that the cost of air services does not matter to passengers, as seen
through the worldwide regulation of air fares stated in the International Air Transport
Association (IATA). The income per capita of the major tourist destinations has a strong
and positive relationship with international air services increasing passenger traffic. The
significant effect of total investment on the demand for international air services is vital
which suggest that the status of national infrastructure in Fiji, such as tourism plants,
public utilities, buildings and transport facilities and the capacity of the national airline
have created a positive impact on the demand for international air services in Fiji.
However, the lack of significance of private sector investment in the long run has been
attributed to the political events which drastically lowered the level of private investment
over time.
While noting the importance of international air services exports and its contribution to the
growth of services sector and economic growth of services, it is imperative that Fiji should
stabilize its political environment given its drastic adverse effects on the economy. Such
disturbances contribute to loss of private investment by the national airline. Policies
directed to the enhancement of investments in the aviation industry must be pursued in the
light of increasing competition from other airlines that compete on the same routes
serviced by the national airline. In particular, the private sector investment and reforms
must be encouraged to boost the export performance of international air services and other
tourism sector activities. The policy implications, in detail, are noted in Chapter 7.

134
Chapter Seven
CONCLUSION
7.1 Introduction
This study evaluates major components of Fiji’s services exports on economic growth and
the effect of the reforms amongst other determinants on the services export of tourism and
international air services. In many developing countries, the international sale of tourism
and aviation services have recently served as a viable alternative to merchandise exports, a
relief to the balance of payments problems and a major source of employment and growth
prospect for the citizens of these nations (Brohman, 1996; Castle and Findlay, 1987). In
noting these positive potentials, these countries have supported their tourism and aviation
service sectors through the pro-competitive reform policies of the World Bank and the
service trade liberalization agenda of the World Trade Organization (WTO) to enhance the
export performance of these services.
Various recent studies have been undertaken on the nexus between services exports and
economic growth, such as Button and Taylor (2000), Oh (2003), Eugenio-Martin, Morales
and Scapa (2004), Durbarry (2004) and Button (2006) on disaggregated tourism and air
services exports; and the aggregate service exports and growth by Gabriel (2004), Kumar
and Prasad (2007) and Hoekman and Mattoo (2008). While the studies have mixed results,
they generally support the contention that tourism, aviation and aggregate service exports
are major determinants of economic growth in developed and developing countries.
Several studies and reports have also pointed out the important role of the World Bank and
WTO reforms on service export performance, such as Tang, et al., (2007) and the
Organization for Economic Cooperation and Development, (2008) on FDI reforms in
tourism, and on public enterprise reforms in air services (See Forsyth, 1997b; Graham,
2001). Although the reform impact have been mixed, FDI enhancement in tourism have
generally supported the increase in tourism earnings and the impact of aviation reforms
through airline divestiture and airport privatization have generally had a beneficial effect
on air service exports through the channel of improved efficiency.
In this study, various propositions were analyzed regarding the export of tourism and air
services in Fiji. The specific hypotheses tested were entrenched in four fundamental

135
questions including (1) What is the contribution of tourism exports to economic growth in
Fiji? (2) Is the export of air services in Fiji a major determinant of the growth in total
services output? (3) Did the tourism reform of removing market access barriers to FDI
implemented by Fiji under the WTO GATS in 1999 impact on total tourism export
performance? (4) Has the public enterprise reform activities of government divestiture in
the national airline and the restructure of the Civil Aviation Authority of Fiji impacted on
the export of air services?
In undertaking the empirical analysis, the service sector growth and reform equations in
this study were estimated for the period 1968 to 2006. The models are estimated using the
Autoregressive Distributed Lag (ARDL) approach to cointegration, of which the models
relate to tourism services exports and the export of international air services. The service
growth models on tourism and air services are based on the neoclassical growth theory
extended to the particular service exports, airline industry variables and other factors such
as openness, political instability and natural disasters. The service reform models based on
the neoclassical theory of demand for goods and services, include the price and income
variables extended to the reform activities, events of political coups, investment and other
government support undertaken in the two service sectors, i.e. tourism and air services.
The estimated models provide robust results that satisfied various diagnostic tests of serial
correlation, functional form, normality of the residuals and heteroskedasticity. Following
this, policy implications from the study were identified, which suggest the need to support
the export of both services for economic growth through effective execution of pro-
competitive domestic reforms as an important pre-requisite to pursue further trade
liberalization activities. Proposals for maintaining long term stability and clear government
direction on reform policies for overall economic growth and service export performance
have been also taken into account.
The organization of the chapter is as follows. Section 7.2 briefly discusses the key findings
and contributions of each of the previous six chapters. Section 7.3 presents the policy
implications related to tourism and aviation services exports and growth. Section 7.4,
notes areas for further investigation related to services exports, reform and growth issues in
Fiji.

136
7.2 Summary of Chapters
The focus of this study is to examine whether tourism and air services are major
determinants of economic growth in Fiji and to determine the impact of reforms on the
export performance of tourism and international air passenger services. Chapter 1 explains
the key issues underlying the service-growth nexus and services reforms, with a view to
clarify the motivation and objectives for this research, its relevance to the Fiji context and a
brief account of the contents in each of the subsequent chapters.
Chapter 2 analyses the theoretical and empirical service export-growth literature
supplemented with the pro-competitive reform activities that promote the liberalization of
trade in services. The review notes that while the disaggregated service exports of tourism
and air services are major determinants of economic growth in many countries, the impact
of the reforms in these services have been largely successful in developed economies
aviation industries. The case for developing countries is yet to be known given that most
have either not implemented or have just recently adopted the pro-competitive reforms.
The third Chapter undertakes a macroeconomic review of the Fiji economy since
independence and details the performance of the tourism and air services in terms of its
production, demand and developments policy objectives. The review shows that service
sector is a dominant component of total gross domestic product (GDP) over the last three
decades. This suggests a larger role that service sector has and thus it contribution to GDP.
In particular, it is the export of tourism and air services that substantially make a large
contribution to total services output, employment and total GDP.
Chapter 4 discusses the models, data and the econometric techniques utilized in this study.
The ARDL methodology has been selected given its capability to determine the short run
and long run impacts of the variables, the effect of previous year estimates of both the
regressor and explanatory variables and the speed at which the variables in the model
reverts to long run equilibrium. All these are necessary to formulate efficient and sound
policies for the service sectors and for the economy as a whole.
The results for the tourism-growth and the tourism reform models are presented in Chapter
5. The ARDL Bounds F-test procedure suggests the existence of a long run relationship
amongst the variables in each of the four models. The result for the tourism-growth nexus

137
model indicates that the tourism-led growth hypothesis is valid for Fiji. The labour force
and merchandise goods exports positively contribute to economic growth. The adverse
impacts of the coups have led to the drastic decline in GDP and tourism receipts as well as
the decline in investment levels. The tourism-reform model indicates that the WTO’s
GATS reform has not boosted the export performance of tourism services in Fiji.
In Chapter 6, the results of the analysis for air service-growth nexus and the impact of the
pro-competitive reform measures on the export of air services are presented. The Bounds
F-test statistics indicate a long run cointegration amongst the variables in the long run. The
estimates indicate that export of air services in terms of total passenger traffic is a major
determinant of the growth in total services output. The aviation reform and air services
exports models also indicate that the reduced government shareholding and introduction of
foreign management in the national airline has led to improved efficiency and a higher
sales turnover. On the other hand, the impact of growth in total transport output on total
international passenger traffic is positive, however, show a weak significance level. The
dummy variable assessing the overall implementation of the pro-competitive reforms in
1998 has been negative given the lack of government direction on the reforms exacerbated
by the significant adverse effects of the coups.
Overall, both the tourism and air services exports are major determinants of economic
growth and growth in total services GDP, thus supporting the service export-led growth
hypothesis for Fiji. However, in the tourism sector, the reform activity of removing market
access barriers which limit foreign direct investment in hotels and accommodation have
only created a short term positive impact on tourism receipts. At the same time the
intensity of tourism production has not positively influenced tourism receipts and suggests
a low level of foreign direct investment in hotels and restaurants. The significant influence
of total FDI on tourist arrivals is directly due to the major foreign investment undertaken
by Qantas Airways Limited in the national airline, which improved air service quality that
led to an increase in visitor arrivals associated with total passenger traffic. The dummy
variable for the implementation of tourism reform in 1999 gives a general indication that
the reform has not created a positive effect on tourism exports.
The impact of the reforms in the aviation industry is mixed. While the introduction of
foreign management and expertise in the national airline has significantly boosted total

138
passenger traffic in the long run, the other reform activity of airport privatization has failed
to create a significant effect on total passenger traffic in the short run and long run. The
dummy variable for the implementation of both the above aviation reforms confirms that
the reform has not created a positive and significant impact on the export of air services.
The findings enable the formulation of various policies to support growth and improve the
determinants of tourism and service exports and the implementation of reforms in this
sector along with complementary reforms in other sectors to support the growth in service
exports. These are presented in detail in the next section.
7.3 Policy Recommendations
This study has established that export of tourism and air services have contributed to
growth in Fiji. It has also empirically confirmed that the reforms in the two service exports
aimed at ultimately liberalizing the trade in these services have not had positive pay-off so
far in terms of creating a beneficial impact on the level of tourism and air services exports.
The result on the tourism-growth model presented in chapter 5, show that tourism is a
major determinant of economic growth in Fiji. This finding confirms the earlier results of
Doessel and Gounder (1996) and Narayan (2004) and suggests that tourism has contributed
to the overall growth and development of Fiji. The result also shows that although
merchandise exports also contribute to growth, the export of tourism services has a higher
level contribution. This result is important given the expiry of the United States garments
quota and the cease of the guaranteed sale of sugar in the European Union market, which
both dominated the goods export sectors. The government must treat the tourism industry
with high priority as many developing countries are capitalizing on services exports as a
major source of economic growth. This is due to the lower performance of the
merchandised goods exports in which the developed nations have a relatively higher
competitive advantage. Therefore, existing reform policies in the tourism sector must be
implemented with dynamism and in conjunction with the policy objectives of other sectors,
such as domestic and foreign investment, labour force, and agriculture and air services.
The results of the tourism receipts-reform model have shown that Fiji’s commitment to
remove the market access barriers in the provision of hotel accommodation and restaurants
to foreign investors have not positively impacted in increasing tourism receipts. This
suggests that although the General Agreement on Trade in Services (GATS) commitment
on tourism has been fully implemented, other complementary reforms have not been

139
addressed by the Government to ensure the effectiveness of this change. For example,
while the Government has completed the WTO GATS commitment of streamlining the
investment approval process and amending the relevant clauses of the foreign investment
act, the incidences of coups result in adverse impacts on the tourism and service sectors.
The land dispute incidences where landowners demand high compensation from foreign
investors and developers, as also been pointed out by Prasad and Tisdell (2006), goes
against the initiatives to increase foreign direct investment in tourism. This particular
finding is important and implies that government must take a holistic policy approach to
ensure the effectiveness of service trade reforms.
A complementary set of reforms outlined by Reddy et. al., (2004) suggest a need to
undertake such reforms to achieve an export-oriented open market growth strategy. The
strategy highlights that apart from the trade reforms alone, other necessary changes include
the reforms in the goods market, fiscal and public sector, land market, financial sector,
labour market, good governance, political reform and institutional reform. The
Government needs to promote and commit to these targeted strategies as they encompass
all export promotion related issues. As coup cultures and land disputes adversely impact on
growth, the Government requires immediate attention to remove political adversities and
address the weakening of the markets.
The results on the cost of tourism services in Fiji in terms of the hotel prices and the
exchange rate are not of any major concerns to tourists. The income per capita of source
markets does matter. This suggests the prevalence of high quality packaged deals for which
tourists may not generally substitute for cheaper hotel and food prices. This is similar to
the findings of (Buhalis, 2000). Government assistance is therefore necessary in the
improvement of quality tourism services by collaborating with the hotel developers and
entrepreneurs, and other key stakeholders on issues, such as human resource development
and capacity building in the key areas of the tourism industry. This is crucial to provide
better services and meet the general tastes and preferences of the tourists. Government
support through tourism promotion via the Fiji Visitors Bureau augurs well with increases
in tourism receipts and its budget allocation should be continued particularly into the
competitive up-market and in other diversified tourism products such as eco-tourism.

140
In the tourist arrival model, the cost of air fares by the national carrier is a major
determinant of travel decisions by the tourist. This suggests the need for Air Pacific
Limited to maintain and improve its competitiveness. Economic prosperity and safety of
the country are also major concerns accounted by the tourists. Government policy is
needed in terms of supporting tourism infrastructure, fiscal incentives and improving the
general environment and health conditions in the country. Tourist safety is also crucial for
a safe environment where criminal activities have to be monitored and safety issues
addressed to attract Fiji as a tourist destination.
In Chapter 6, the aviation-growth model shows that air services exports is a major
contributor to the growth in total services output. This result is crucial given that total
services output is dominated by the output from wholesale and retail trade, hotels and
restaurants and that air passengers traveling with the Air Pacific is dominated by the
tourists. This provide evidence on the close interlink between the two service sectors and
suggest a policy approach that incorporates the combined achievement of these sectors’
policy objectives, for instance increasing airline capacity to meet tourism demand and
tourism developers providing hotel and other facilities as the air travel access to Fiji is
improved. The existing policies for both tourism and air services should be encouraged
given the growing importance of service exports for growth as seen in many developing
countries.
Another important result noted regarding the air services is the non-positive impact of the
pro-competitive measures implemented in Fiji’s aviation sector. While the introduction of
foreign management and technical expertise of the Qantas Airways Limited has raised the
total sale of domestically produced air services in the global market, the privatization of
the airports in Fiji and separation of the aviation regulatory functions did not have a strong
positive impact. In attributing this to the coups which coincided with the execution of the
reform activities, the result implies the need for the Government to continuously monitor
the reform implementation steps and impacts over time. The essential state of long term
political stability is necessary and a sufficient condition for successful policy strategies to
address consistency in reform implementations is vital. The recent political upheaval in
2006 leading to hampering various long term growth and investment structures would be
prudent to monitor the reforms undertaken against any possibility of reversing the reform
processes.

141
The result also suggests Government consideration towards the second stage of an open
sky policy when the time is appropriate for Fiji’s national airline to compete with other
potential airlines that would enter the open aviation market. This would require substantial
investment in the domestic airports and airline capacity, particularly when the Government
remains the major shareholder of the national airline. A concerted improvement on the
quality of the air services provided by the Air Pacific Limited is a necessity given that the
air fare is generally not a major concern for its passengers but rather the income level in
the source markets. The enhancement of air service quality will be a catalyst to consumer
satisfaction that would lead to more passengers traveling with the national airline, evident
by the coefficient of the lagged dependent variable, which indicates that international
passenger traffic is positively associated with past year’s passenger traffic.
7.4 Areas for Future Research
This study has offered potential areas for further empirical research. In the tourism sector,
the impact of foreign direct investment on tourism export performance has been analyzed.
Given that the removal of market access barriers for the foreigners in the supply of hotel
accommodation and restaurants have been completed, it would be useful to investigate the
determinants of foreign direct investment in tourism such as tourism land disputes, cost of
setting up business, disaggregated tourism investment by including sectors and other
relevant factors.
In the aviation sector, this is the first air service-growth model developed for Fiji. Future
research could involve analyzing the similar hypothesis including other disaggregated
variables. The aviation export determinants model was limited by the absence of data to
measure the reform activity involving the separation of the Civil Aviation Authority of Fiji
into the newly created entities. Reddy et al., (2004) suggest that the best indicators for
public enterprise reforms are the level of expenditure and revenues of the former and
restructured entities. Given that this data was not available the growth in air transport
output was used as a proxy. The model could be re-estimated using the full set of the
relevant expenditure and revenue time series data of the old Civil Aviation Authority of
Fiji (CAAF) and the newly formed Civil Aviation Authority of the Fiji Islands (CAAFI)
and Airports Fiji Limited (AFL), to clearly explain the impact of the public enterprise
reform of CAAF.

142
Similarly, the availability of the full air services exports data as the dependent variable (in
monetary terms) lends another possibility for further investigation in place of the volume
of air service exports, i.e. international passenger traffic, used in this study. The future
impact of air service liberalization (i.e. open sky policy) on the national airline Air Pacific
would be a vital and interesting area for empirical research in the light of the newly formed
Pacific Islands Aviation Services Agreement (PIASA) that promotes an open sky policy
among the airlines of Pacific island countries.
In both the tourism and air service sectors, the measurement of the dummy variable for the
implementation of the tourism and aviation reforms since 1998 maybe too short a period to
analyze its respective impacts. This provides the opportunity for continuous monitoring
and a reassessment of the reform impact hypothesis in ten to fifteen year period. Given the
importance of service export sector in Fiji, the research in the specific areas of the travel
and tourist industries will be vital for quality policies, reforms and its contribution to
economic growth in Fiji.

143
BIBLIOGRAPHY
Air Pacific Limited. (various). Annual Report. Suva: Air Pacific Limited. Akram-Lodhi, H. (Ed.). (2000). Confronting Fiji's Futures. Canberra: Asia Pacific Press
and Asia Pacific School of Economics and Management. Asian Development Bank. (2004). Civil Aviation and Airport Improvements Project
Dossier. Suva: Asian Development Bank South Pacific Sub-regional Office. Balassa, B. (1978). “Exports and economic growth: further evidence.” Journal of
Development Economics, 5(2), 181-189.
Balough, T. (1973). “Fact and fancy in international economic relations, part 1.” World
Development, 1(1-2), 76-92. Barla, P. and Perelman, S. (1989). “Technical efficiency in airlines under regulated and
deregulated environments.” Annals of Public and Cooperative Economics, 60(1), 103-124.
Barnes, I. (1946). “The economic role of air transportation.” Law and Contemporary
Problems, 11(3), 431-451. Beca International Consultants, Wilbur Smith Associates, KRTA Limited and Deloitte
Ross Tohmatsu. (1994). Fiji National Transport Sector Plan. Auckland: Beca Group.
Ben-David, D. and Loewy, M. B. (1998). “Free trade, growth and convergence”. Journal
of Economic Growth, 3(2), 143-170. Bhagwati, J. (1958). “Immiserizing growth: a geometrical note.” Review of Economic
Studies, 25(3), 201-205. Bhagwati, J. (1984). “Why are services cheaper in the poor countries?” Economic Journal,
94(374), 279-286. Britton, S. G. (1983). Tourism and Underdevelopment in Fiji. Canberra: Australian
National University. Brohman, J. (1996). “New directions in tourism for third world countries”. Annals of
Tourism Research, 23(1), 48-70. Buhalis, D. (2000). “Marketing the competitive destination in the future.” Tourism
Management, 21(1), 97-116. Burns, P. (1995). “Sustaining Tourism Under Political Adversity: The Case of Fiji.” In M.
V. Conlin and T. Baum (Eds.), Island Tourism: Management Principles and
Practice. Chicestor: John Wiley.

144
Button, K. J. (2006). The Effects of Air Transportation on Economic Development: The
Potential Impacts on the Europe Economy of Further Liberalization of the
Transatlantic Air Market. Paper presented at the National Conference on Transportation and Economic Development.
Button, K. J. and Lall, S. (1999). “The Economics of Being an Airline Hub City.” In B.S.
McMullen (Ed), Research in Transport Economics: Volume 5. Oregon: JAI Press. Button, K. J. and Taylor, S. Y. (2000). “International air transportation and economic
development.” Journal of Air Transport Management,6(4): 209-222. Castle, L. V. and Findlay, C. C. (1987). “Issues in services trade in the Pacific.” Pacific
Economic Paper No. 154, Canberra: Research School of Pacific Studies, Australian National University.
Chand, G. (2004). Overview of Current Economic Conditions in Fiji [Electronic Version].
Retrieved May 21 from http://www.gpn.org. Chand, S. (2000). “Coups, cyclones and recovery: the Fiji experience.” Pacific Economic
Bulletin, 15(2), 121-129. Chichilnisky, G. (1986). “A General Equilibrium Theory of North-South Trade.” In W.
Heller (Ed.), Essays in Honor of Kenneth J. Arrow. New York: Cambridge University Press.
Deardorff, A. V. (1985). “Comparative Advantage and International Trade and Investment
in Services.” In R. M. Stern (Ed.), Trade and Investment in Services: Canada/US
Perspectives. Toronto: Ontario Economic Council. Deardorff, A. V. (2001a). Deardorff's glossary of international economics. Retrieved from
http://www-personal.umich.edu/~alandear/glossary/. Deardorff, A. V. (2001b). “International provision of trade services, trade and
fragmentation.” Review of International Economics, 9(2), 233-248. Demiroz, D. M. and Ongan, S. (2005). “The contribution of tourism to the long-run
Turkish economic growth”. Ekonomicky Casopis ,53(9), 880-896. Denison, E. (1985). Trends in American Growth, 1929-1982. Washington DC: The
Brookings Institution. Department of Tourism. (2006). Tourism Satellite Account Fiji Islands: The Contribution
made by Tourism to the Fiji Economy. Suva: Department of Tourism. Department of Tourism. (2007). Fiji Tourism Development Plan 2007-2016. Suva:
Department of Tourism. Doessel, D. P. and Gounder, R. (1996). “Tourism and economic growth in Fiji.”
Department of Economics Discussion Paper. Brisbane: The University of Queensland.

145
Doove, S., Gabbitas, O., Nguyen-Hong, D. and Owen, J. (2001). Price Effects of
Regulation: Telecommunications, Air Passenger Transport and Electricity Supply. Canberra: Australia Productivity Commission.
Durbarry, R. (2004). “Tourism and economic growth: the case of Mauritius.” Tourism
Economics, 10(4), 389-401. Dutt, A. K. (1988). “Monopoly power and uneven development: Baran revisited.” Journal
of Development Studies, 24(2), 161-176. Dwyer, L., and Kim, C. (2003). “Destination competitiveness: determinants and
indicators.” Current Issues in Tourism, 6(5), 369-414. Endo, N. (2007). “International trade in air transport services: penetration of foreign
airlines into Japan under the bilateral aviation policies of the US and Japan.” Journal of Air Transport Management, 13(5), 285-292.
Esfahani, H.S. (1991). Exports, imports, and economic growth in semi-industrialized
countries. Journal of Development Economics, 35(1), 93-116. Eugenio-Martin, J. L., Morales, N. M., and Scarpa, R. (2004). “Tourism and economic
growth in Latin American countries: a panel data approach.” FEEM Research
Working Paper No.26. Fondazione Eni Enrico Mattei, Italy. Euromonitor International. (2008). Airline Passenger Traffic Data from International Civil
Aviation Authority National Statistics. Retrieved on 3 January 2008 from http://www.portal.euromonitor.com.ezproxy.massey.ac.nz/portal/server.pt/gateway/PT.
Fanelli, J.M. and Popov, V. (2003). On the Philosophical, Political and Methodological
Underpinnings of Reform. Paper presented at the Workshop on Understanding Reform, Global Development Network, Cairo, Egypt, January, 16-17.
Fiji Islands Bureau of Statistics. (1998). Fiji Aircraft Statistics 1994. Suva: Bureau of
Statistics. Fiji Islands Bureau of Statistics. (2003). Fiji Tourism and Migration Report 2003. Suva:
Bureau of Statistics. Fiji Islands Bureau of Statistics. (2005). Key Statistics: December 2005. Suva: Fiji Islands
Bureau of Statistics. Fiji Islands Bureau of Statistics. (2006). Key Statistics: March 2006. Suva: Fiji Islands
Bureau of Statistics. Fiji Islands Bureau of Statistics. (2007). Key Statistics: March 2007. Suva: Fiji Islands
Bureau of Statistics. Fiji Islands Bureau of Statistics. (2008). Key Statistics: March 2008. Suva: Fiji Islands
Bureau of Statistics.

146
Fiji Islands Bureau of Statistics. (various). Current Economic Statistics. Suva: Fiji Islands Bureau of Statistics.
Fiji Islands Bureau of Statistics. (various). Key Statistics. Suva: Fiji Islands Bureau of
Statistics. Fiji Islands Trade and Investment Bureau (FTIB). (2007). FTIB Database. Suva: Fiji
Islands Trade and Investment Bureau. Findlay, C. C. (1985). “A framework for services trade policy.” Pacific Economic Paper
No. 126. Canberra: Research School of Pacific Studies, Australian National University.
Findlay, C. C. and Forsyth, P. (1988). “Trade in Air Transport and Tourism Services.” In
L. V. Castle and C. C. Findlay (Eds.), Pacific Trade in Services. Sydney: Allen and Unwin.
Forsyth, P. (1997a). The Gains from the Liberalization of Air Transport. Canberra:
Australia Productivity Commission. Forsyth, P. (1997b). “Privatization in Asia Pacific Aviation.” In C. C. Findlay, L. S. Sien
and S. Karmjit (Eds.), Asia Pacific Air Transport: Challenges and Policy Reforms. Singapore: Institute of Southeast Asian Studies.
Forsyth, P. (1998). “The gains from the liberalization of air transport.” Journal of
Transport Economics and Policy, 32(1), 73-92. Forsyth, P. (2006a). “Martin Kunz memorial lecture: tourism benefits and aviation policy.”
Journal of Air Transport Management, 12(1), 3-13. Forsyth, P. (2006b). “Aviation and Tourism.” In L. Dwyer and P. Forsyth (Eds.),
International Handbook on the Economics of Tourism. Cheltenham, UK: Edward Elgar Publishing Limited.
Forsyth, P., Gillen, D. W., Knor, A., Mayer, O. G., Niemeier, H., and Starkie, D. (Eds.).
(2004). The Economic Regulation of Airports. Aldershot: Ashgate. Gabriel, A. (2004). Exports of Services and Economic Growth in Developing Countries.
New York: United Nations Conference on Trade and Development. Goff, B. L. (2005). “Estimating determinants of passenger air services to small markets.”
Urban Studies, 42(3), 557-565. Gounder, A., and Katafono, R. (2004). “Modelling tourism demand in Fiji.” RBF Working
Paper No.2004/01, Reserve Bank of Fiji. Gounder, R. (1998). “Ethnicity, military politics and development in Fiji.” Commonwealth
and Overseas Seminar Series, University of Cambridge 26 November 1998.

147
Gounder, R. (1999). “The political economy of development: some empirical evidence from Fiji.” Economic Analysis and Policy, 29(2), 133-150.
Gounder, R. (2002). “Political and economic freedom, fiscal policy and growth nexus:
some empirical results for Fiji.” Contemporary Economic Policy, 20(3), 234-245. Gounder, R. (2005). “Fiji's public-private sector investment, policy institutions and
economic growth: evidence from time series data.” Fijian Studies: A Journal of
Contemporary Fiji, 3(1), 87-110. Government of Fiji. (various). Budget Estimates. Suva: Government Printing Department. Government of the Republic of the Fiji Islands. (1993). Opportunities For Growth:
Policies and Strategies for Fiji in the Medium Term. Suva: Government Printing Department.
Graham, A. (2001). Managing Airports: An International Perspective. Oxford:
Butterworth Heinemann. Green, R. K. (2002). “A note on airports and economic development. Preliminary draft”
June 10, 2002, University of Wisconsin-Madison. Greenaway, D. and Milner, C. (1990). “South-South trade.” The World Bank Research
Observer, 5(1), 47-68.
Greenaway, D. N., Morgan, W. and Wright, P. (1998). “Trade reform, adjustment and growth: what does the evidence tell us?” The Economic Journal, 108(450), 1547-1561.
Gujarati, D. N. (1988). Basic Econometrics. Singapore: B & Jo Enterprise Pte Limited. Hicks, J. (1998, 6 May ). Qantas Buys Air Pac Shares. The Fiji Times, p. 1. Hicks, J. R. (1953). “An inaugural lecture.” Oxford Economic Papers, 5(2), 117-135. Hill, T. P. (1977). “On goods and services.” Review of Income and Wealth, 23(4), 315-338. Hindley, B. and Smith, A. (1984). “Comparative advantage and trade in services.” The
World Economy, 7(4), 369-390. Hodge, J. W. (2001). “Examining the potential benefits of services liberalization in a
developing economy: the case of South Africa.” In R. M. Stern (Ed.), Services in
the International Economy. Ann Arbor: The University of Michigan Press. Hoekman, B. and Braga, C. A. P. (1997). “Protection and trade in services: a survey.”
Open Economies Review, 8(3), 285-308. Hoekman, B. and Mattoo, A. (2008). “Services trade and growth.” Policy Research
Working Paper No. 4461, Development Research Group, World Bank.

148
Hoekman, B. and Stern, R. M. (1988). “The Service Sector in Economic Structure and in International Transactions.” In L. V. Castle (Ed.), Pacific Trade in Services. Sydney, Australia: Allen and Unwin.
Hutcheson, S. (1996). An Introduction to Air Transport: Political, Economic, Operational
and Technical Perspectives of Civil Aviation. Nambour, Australia: Queensland Complete Printing Services.
Ikiara, G. K., Muriira, M. I. and Nyangena, W. N. (2001). “Kenya's Trade in Services:
Should the Country Fully Liberalize?” In R. M. Stern (Ed.), Services in the
International Economy. Ann Arbor: The University of Michigan Press. International Monetary Fund. (1997). “Globalization and the Opportunities for Developing
Countries.” In World Economic Outlook: A Survey. Washington DC: International Monetary Fund Publication Services.
Intervistas-ga2. (2005). The Economic Impact of Air Service Liberalization. Washington,
DC: Intervistas-ga2. Ito, M. and Shimoi, N. (2003). “Services trade liberalization.” Pacific Economic Paper No.
340. Canberra: Research School of Pacific Studies, Australian National University. Ito, T. and Krueger, A. (2002). Trade in Services in the Asia Pacific Region. Chicago:
University of Chicago Press. John, G., Nelson, P. and Reetu, V. (2007). “Unit root tests and structural breaks: a survey
with applications.” Graduate School of Business Working Paper, University of Wollongong.
Johnson, H. G. (1958). “Economic Expansion and International Trade.” In H. G. Johnson
(Ed.), International Trade and Economic Growth. London: Bradford and Dickens. Kasper, W., Bennet, J. and Blandy, R. (1988). Fiji: Opportunity from Adversity? Saint
Leonards, New South Wales: The Centre for Independent Studies. Knapman, B. (1987). Fiji's Economic History, 1874-1939: Studies of Capitalist Colonial
Development. Canberra: National Centre for Development Studies, Research School of Pacific Studies, Australian National University.
Kostaschuk, R., Terry, J., and Raj, R. (2001). “Tropical cyclones and floods in Fiji.” Hydrological Science Journal, 43(3), 435-450.
Krugman, P. (1981). “Trade accumulation and uneven development.” Journal of
Development Economics, 8(2), 149-161. Krugman, P. R. and Obstfeld, M. (2003). International Economics: Theory and Policy.
Reading, Mass: Addison Wesley. Kumar, S. and Prasad, B. C. (2007). “Contributions of exports of services towards Fiji's
output.” USPSE Working Paper No. 2007/04, School of Economics, University of the South Pacific.

149
Langhammer, R. (2002). “Developing countries as exporters of services: what trade statistics suggest?” Journal of Economic Integration, 17(2), 297-310.
Lehner, R. (1995). “Protectionism, prestige and national security: the alliance against
multilateral trade in international air transport.” Duke Law Journal, 45(2), 436-478. Lewis, W. A. (1955). The Theory of Economic Growth. London: Allen and Unwin. Libanio, G. (2005). “Unit roots in macroeconomic time series: theory, implications and
evidence.” Nova Economia, 15(3), 145-176. Lundberg, D.E., Krishnamoorthy, M. and Stavenga, M.H. (1995). Tourism Economics.
New York: John Wiley. MacKinnon, J. (1991). “Critical Values for Cointegration” In R. F. Engle and C. W. J.
Granger (Eds.), Long Run Economic Relationships: Readings in Cointegration. Oxford: Oxford University Press.
Mattoo, A. and Payton, L. (Eds). (2007). Services Trade and Development. The Experience
of Zambia. Washington DC: Palgrave Macmillan and World Bank. Mattoo, A., Rathindran, R., and Subramanian, A. (2006). “Measuring services trade
liberalization and its impact on economic growth: an illustration.” The Journal of
Economic Integration, 21(1), 64-98. Mayda, A.M. and Steinberg, C. (2006). Do South-South Trade Agreements Increase
Trade? Commodity-Level Evidence from COMESA. Washington DC: International Monetary Fund.
McGreal, M. E. (2003). Fiji's Aviation Story. Auckland: Mcviti Publications. McMaster, J. (2001). “Public enterprise reform in Fiji: policy implementation and
reversals.” The Asian Journal of Public Administration, 23(2), 229-246. Melvin, J. R. (1989). “Trade in producer services: a Heckscher-Ohlin approach.” The
Journal of Political Economy, 97(5), 1180-1196. Micco, A. and Seresbrisky, T. (2004). “Competition regimes and air transport costs: the
effect of open skies agreements.” Journal of International Economics 70(1), 25-51. Ministry of Commerce, Industry, Cooperatives and Public Enterprises. (1998). Towards a
Better Fiji: The Public Enterprise Reform Program. Suva: Government Printing Department.
Ministry of Commerce Business Development and Investment. (1999). “Fiji Service Sector
Study Report.” DSC Paper No. 38/99, File Reference: DSC 3/28/7-2. Suva: Ministry of Commerce Business Development and Investment.

150
Ministry of Commerce Business Development and Investment. (1999). “Fiji Government Position on the World Trade Organization Millennium Negotiation Round Under the GATS.” Ministry of Commerce Business Development and Investment.
Ministry of Commerce Business Development and Investment. (2002). “Towards A
Negotiating Position on Trade in Services: Fiji's Commitments under the General Agreement on Trade in Services in the Doha Round of WTO Negotiations.” Ministry of Commerce Business Development and Investment.
Ministry of Finance and National Planning. (2002). Strategic Development Plan 2003-
2005: Rebuilding Confidence for Stability and Growth for a Peaceful, Prosperous
Fiji. Suva: Government Printing Department. Ministry of Finance and National Planning. (2004). Mid-Term Review of the Strategic
Development Plan 2003-3005. Suva: Government Printing Department. Ministry of National Planning. (1997). Development Strategy for Fiji: Policies and
Programmes for Sustainable Growth. Suva: Government Printing Department. Ministry of Transport and Civil Aviation. (2003). “Current International Aviation Policy
for Fiji.” PowerPoint slides of paper presented at the Fiji Development Sub-Committee Meeting of Cabinet on 12 September, 2003.
Mohan, G., Brown, E., Milward, B., and Zack-Williams, A. (2000). Structural adjustment.
London: Routledge. Morley, C. L. (1990). “What is tourism? definitions, concepts and characteristics.” The
Journal of Tourism Studies, 1(1), 3-8. Murphy, K. M., Shleifer, A. and Vishny, R. W. (1989). “Industrialization and the big
push.” The Journal of Political Economy, 97(5), 1003-1026. Myint, H. (1958). “The classical theory of international trade and the underdeveloped
countries” Economic Journal, 68(270), 317-337. Myint, H. (1969). “International Trade and the Developing Countries.” In P. A. Samuelson
(Ed.), International Economic Relations. London: Macmillan. Myint, H. (1977). “Adam's Smith's theory of international trade in the perspective of
economic development.” Economical, 44(175), 231-248. Myrdal, G. (1970). The Challenge of World Poverty. New York: Pantheon. Narayan, P. K. (2000). “Fiji's tourism industry: a SWOT analysis.” The Journal of Tourism
Studies, 11(2), 15-24. Narayan, P. K. (2002). “A tourism demand model for Fiji: 1970-2000.” Pacific Economic
Bulletin, 17(2), 103-116.
151
Narayan, P. K. (2004a). “Fiji's tourism demand: the ARDL approach to cointegration.” Tourism Economics, 10(2), 193-206.
Narayan, P. K. (2004b). “Economic impact of tourism on Fiji's economy: empirical
evidence from the computable general equilibrium model.” Tourism Economics,
10(4), 419-433. Narayan, P. K. (2005). “The structure of tourist expenditure in Fiji: evidence from unit root
structural break tests.” Applied Economics, 37(10), 1157-1161. Narayan, P. K. and Narayan, S. (2006). “Savings behaviour in Fiji: an empirical
assessment using the ARDL approach to cointegration.” International Journal of
Social Economics, 33(7), 468-480. Narayan, P. K. and Smyth, R. (2005). “Trade liberalization and economic growth in Fiji:
an empirical assessment using the ARDL approach.” Journal of the Asia Pacific
Economy, 10(1), 96-115. Narayan, S. and Narayan, P. K. (2004). “Determinants of demand for Fiji's exports: an
empirical investigation.” The Developing Economies, 42(1), 95-112. Nath, S. K. (1962). “The theory of balanced growth.” Oxford Economic Papers, 14(2),
138-153. Ndiaye, A. (2001). “GATS 2000: As Seen from Senegal.” In R. M. Stern (Ed.), Services in
the International Economy. Ann Arbor: The University of Michigan Press. Nurkse, R. (1953). Problems of Capital Formation in Underdeveloped Countries. New
York: Oxford University Press. Ocampo, J. A. (1986). “New developments in trade theory and LDCs.” Journal of
Development Economics, 22(1), 129-170. Ogilvie, F. W. (1933). The Tourist Movement. London: Staples Press. Oh, C. (2005). “The contribution of tourism development to economic growth in the
Korean economy.” Tourism Management, 26(1), 39-44. Ohlin, B. (1933). Inter-Regional and International Trade. Cambridge, Mass: Harvard
University Press. Organization for Economic Cooperation and Development. (2005). Growth in Services:
Fostering Employment, Productivity and Innovation. Paris: OECD Publishing. Organization for Economic Cooperation and Development. (2008). Opening up Trade in
Services: Key for tourism Growth [Electronic Version]. OECD Policy Brief, 8 from www.oecd.org/publications/Policybriefs.

152
Oum, T.H. (1995). “A comparative study of productivity and cost competitiveness of the world’s major airlines.” Discussion Paper No. 363, Institute of Social and Economic Research, Osaka University.
Oum, T.H. and Yu, C. (1995). “A productivity comparison of the world’s major airlines.”
Journal of Air Transport Management, 2(3), 181-195. Oxford Economics Forecasting (OEF). (2005). The Economic and Social Benefits of Air
Transport. Retrieved from http:www.oef.com/OE_FA_Display_Frm.asp?Pg=IntSectSpec&Txt=International%20Sectors#.
Pacific Islands Forum Secretariat (PIFS). (2008). “Forum Foreign Affairs Ministers
Meeting Outcomes Statement” Paper No. PIFS(08)FFAMM.4 of the PIFS Foreign Affairs Ministers meeting held at Auckland, New Zealand on 26 March 2008.
Papageorgio, D., Michaely, M. and Choksi, A. (1991). Liberalizing Foreign Trade.
Oxford: Basil Blackwell. Pesaran, M. H. and Pesaran, B. (1997). Microfit 4.0. Oxford: University Press. Pleumarom, A. (1999). Tourism Globalization and Sustainable Development. Paper
presented at the Third World Network Dossier for CSD 7 Malaysia. Prasad, B. C. (2004). “Fiji's sugar tourism and garment industries: a survey of
performance, problems and potentials.” Journal of Fijian Studies, 1(1), 3-27. Prasad, B. C. and Tisdell, C. (2006). “Institutions and Tourism Development.” In B. C.
Prasad and C. Tisdell (Eds.), Institutions, Economic Performance and Sustainable
Development: A Case Study of the Fiji Islands. New York: Nova. Ram, R. (1987). “Exports and economic growth in developing countries: evidence from
time-series and cross-section data.” Economic Development and Cultural Change,
36(1), 51-72. Ram, Y. (2003). “An empirical examination of the export-led growth hypothesis in Fiji.”
RBF Working Paper 2003/01, Reserve Bank of Fiji. Rathmell, J. M. (1966). “What is meant by services?” Journal of Marketing, 30(4), 32-36. Reddy, M., Naidu, V. and Vosikata, S. (2005). “Determinants of household savings
behaviour in an emerging economy: market vs. non-market factors. Paper retrieved from http://www.usp.ac.fj/fileadmin/files/Institutes/piasdg/dev_studies/papers/reddy_savings.pdf
Regan, W. J. (1963). “The service revolution.” Journal of Marketing, 27(3), 57-62. Reserve Bank of Fiji. (1987). Quarterly Review: July 1987. Suva: Reserve Bank of Fiji.

153
Reserve Bank of Fiji. (1998). Quarterly Review: September 1998. Suva: Reserve Bank of Fiji.
Reserve Bank of Fiji. (2007). Quarterly review: December 2007. Suva: Reserve Bank of
Fiji. Reserve Bank of Fiji. (various). Quarterly review. Suva: Reserve Bank of Fiji. Riedel, J. (1983). “Trade as the engine of growth in developing countries, revisited.” The
Economic Journal, 94(373), 56-73. Romer, P. M. (1990). “Endogenous technological change.” The Journal of Political
Economy, 98(5), 71-102. Rosenstein-Rodan, P. N. (1943). “Problems of industrialization of eastern and south
eastern Europe.” Economic Journal, 53(2), 202-211. Sampson, G. P. and Snape, R. H. (1985). “Identifying the issues in trade in services” World
Economy, 8(2) 171-182. Sapir, A. and Winter, A. (1994). “Services Trade.” In D. Greenaway (Ed.), Surveys in
International Trade. Oxford: Blackwell Publishers. Sazanami, Y. (1988). “Telecommunication and Information Services: Japan's recent
experience.” In L. V. Castle (Ed.), Pacific Trade in Services. Sydney: Allen and Unwin.
Shelp, R. K. (1987). “Trade in services.” Foreign Policy, 65(Winter 1986-1987), 64-84. Sica, E. (2005). “Tourism as a determinant of economic growth: the case of south-east
Asian countries.” Working Paper No. 3.169 Faculty of Economics, University of Foggia, Italy.
Smith, M.J. (2002). The Airline Encyclopedia 1909 – 2000: Volume 1.Lanham: Scarecrow
Press Inc. Smith, S. and Toye, J. (1979). “Special issue on trade and poor countries” Journal of
Development Studies, 15(3), 1-18. Smith, S. C. and Todaro, M. P. (2006). Economic Development. Harlow, England: Pearson
Addison Wiley. Snape, R. H. (1988). Prospects for liberalizing service trade. In L. V. Castle (Ed.), Pacific
trade in services. Sydney, Australia: Allen and Unwin. Soderston, B. (1964). A Study of Economic Growth and International Trade. Stockholm:
Almqvist and Wiskell. Solow, R. M. (1956). “A contribution to the theory of economic growth.” The Quarterly
Journal of Economics, 70(1), 65-94.

154
Stern, R. M. (2001). “Overview of the First World Services Congress. In R. M. Stern (Ed.), Services in the International Economy. Ann Arbor: The University of Michigan Press.
Tang, S., Selvanathan, E. A. and Selvanathan, S. (2007). “The relationship between foreign
direct investment and tourism: evidence from China.” Tourism Economics, 13(1), 25-39.
Tohammy, S. (2001). “Egypt's Service Liberalization, Service Barriers and Implementation
of the GATS Agreements.” In R. M. Stern (Ed.), Services in the International
Economy. Ann Arbor: The University of Michigan Press. Tourism Council of the South Pacific. (1989). Air Transport-Tourism Linkage Study: Final
Report. Denmark: Dangroup International Consulting Engineers and Planners. Toye, J. (1987). Dilemmas of Development: Reflections on the Counter-Revolution in
Development Theory and Policy. Oxford: London. United Nations Conference on Trade and Development (UNCTAD). (1998). “International
Trade in Tourism-Related Services: Issues and Options for Developing Countries.” Background Note by the UNCTAD Secretariat for the Trade and Development Board meeting held in Geneva 8-10 June 1998. Retrieved from http:www.unctad.org/EN/docs/c1em6d2.EN.pdf.
United Nations Conference on Trade and Development (UNCTAD). (2007). FDI in
Tourism: The Development Dimension. New York: United Nations Publications. United Nations World Tourism Organization (UNWTO). (2001). The Tourism Satellite
Account as an Ongoing Process: Past, Present and Future Developments: Madrid: UNWTO Publications.
United Nations World Tourism Organization (UNWTO). (2006). Tourism Highlights.
Madrid: UNWTO Publications. Walsh, M. (1996). “Demand analysis in Irish tourism.” Journal of Statistical and Social
Inquiry Society of Ireland, 27(04), 1-35. Weintraub, E. R. (2002). “Neoclassical economics.” Retrieved 16 May 2007 from
http://www.econlib.org/library/Mill/mlP/m1P.html. Wolak, R., Kalafatis, S. and Harris, P. (1998). “An investigation into the characteristics of
services.” Journal of Empirical Generalisations in Marketing Science, 3, 22-43. Wong, C. Y. P., Wu, J. and Zhang, A. (2001). “A matching model of liberalisation of trade
in services.” Preliminary draft. Department of Economics and Finance, City University of Hong Kong,
Woods, L. A., Perry, J. M., and Steagall, J. W. (1997). “Tourism, Economic growth and
Welfare of the Cuban Worker.” Paper presented at the Seventh Annual Meeting of the Association for the Study of the Cuban Economy (ASCE)

155
Woolridge, J. M. (2006). Introductory Econometrics: A Modern Approach (3 ed.). United States: Thomson South-Western.
World Bank. (1987). World Development Report. Washington DC: World Bank. World Bank. (1995). Fiji: Resolving Growth in a Changing Global Environment.
Washington DC: World Bank. World Bank. (2000). “Pacific Regional Strategy”. Retrieved 15 December 2007 from
http://www.wds.worldbank.org/servlet/WDSContentServer/WDSP/IB/2000/09/09/000094946_00051605332588/Rendered/PDF/multi_page.pdf.
World Bank. (2007). World Development Indicators Data on CD ROM. Washington DC:
World Bank. World Trade Organization. (2005). A Handbook on the GATS Agreement. United
Kingdom: Cambridge University Press. World Trade Organization. (2006). “Remarks by Mr. Pascal Lamy, WTO Director
General”. Paper presented at the 12th Session of the ACP-EU Joint Parliamentary Assembly, 23 November, 2006, Barbados.
World Trade Organization. (2008). “Time series on merchandise and commercial services
trade- interactive WTO trade statistics publication.” Retrieved 07/01/08, from World Trade Organization: http://stat.wto.org/Home/WSDBHome.aspx?Language=E