the role of beliefs in purchase decisions: a look at green
TRANSCRIPT
The Role of Beliefs in Purchase Decisions: A Look at Green Purchase Behavior and Altruism
A DISSERTATION SUBMITTED TO THE FACULTY OF THE UNIVERSITY OF MINNESOTA
BY
Tanya A. Ryan
IN PARTIAL FULFILLMENT OF THE REQUIREMENTS FOR THE DEGREE OF
DOCTOR OF PHILOSOPHY
MAY 2014

© Copyright 2014 Tanya Ryan

i
ABSTRACT This research study is focused on understanding consumer behavior in relation to the purchase of environmentally friendly products. Using the Theory of Planned Behavior as a guide, it seeks to uncover the salient beliefs regarding purchasing environmentally friendly products as well as explore the role that altruism plays in green product purchases. Findings of this multi-stage study uncover multiple beliefs about environmentally friendly products, support the Theory of Planned Behavior in regards to green purchase behavioral intent, and show a statistically significant indirect link between altruism and green purchase behavior.

ii
TABLE OF CONTENTS Abstract……………………………….………..………………………………… i Table of Contents………………………………………………………………… ii List of Tables……………………….………………….………………………… iii List of Figures……………………………………….………….………………… iv Chapter I: Introduction to the Study…………………………….………………… 1 Overview…………………………………………….………………….… 1 Statement of the Problem……………………………………………….… 2
Conceptual & Theoretical Framework…………………………….……… 3 Contribution to the Field……………….……………………….………… 6 Chapter II: Review of the Literature………………………………….…………… 8 The Role of Altruism………………...……………………….…………… 8 Strategic Research Site: Green Marketing.……………….…….….……… 14 Chapter III: Methodology of the Study………………………………….………… 21 Rationale, Central Questions & Hypotheses……………….……………… 21 Overall Study Design ………………….……………………….………… 22 Elicitation Study…………………………………………………………… 23 Main Study………………………………………………………………… 27 Chapter IV: Research Findings……………………….……………….…………… 34 Elicitation Study Findings ….……………….……………….…………… 34 Main Study Findings ….………………..…….…………….………….… 36
Purpose of the Study ………………………..…………….……………… 37 Investigating Correlations…………………………...……………..……… 38 Path Analysis Description……………………………………….………… 39 Results of the Path Analysis………………………………….…………… 43 Further Belief Investigation…………………………………..……….…… 47 Results of Additional Path Analyses…………………….…..…………..… 53 Additional Data Analysis………………………………...………...……… 57
Chapter V: Conclusion: Discussion, Implications & Limitations……………….... 64 Elicitation Study Discussion……………………………………….……… 64 Implications of the Elicitation Study…….……………………..….……… 64 Main Study Discussion…………………………………………………… 65 Implications of the Main Study…………….………………….…………… 67 Limitations………………………………………………………….……… 69 Further Research…………………………………………………………… 69 Overall Conclusion…………………………………………….…...……… 70 Bibliography……………………………………………..…………….………..… 72

iii
LIST OF TABLES Table 1. Elicitation Study Questionnaire. ……………………………………………...… 26
Table 2. Main Survey Questionnaire. ………..……………………………………..….… 32
Table 3. Beliefs about Environmentally Friendly Products. ……………………….…..… 34
Table 4. Pearson’s Correlation Coefficients between Study Variables. …………….……. 39
Table 5. Table of Fit Statistics for Path Analysis. ………………………………….….… 41
Table 6. Cronbach’s Alpha “Rule of Thumb” ………………………………………….… 42
Table 7. Calculated Cronbach’s Alpha for Current Study …………………………..…… 42
Table 8. R-Square Values for Study Variables. ……………………………………..….… 45
Table 9. Summary of Effects on Behavioral Intent (Effect / Standard Error / t-value / p-value).
…………………………………………….…………………………………………….… 46
Table 10. Pearson’s Correlation Coefficients between Study Variables (Individual Beliefs).
………………………………………………………………..………………………….… 48
Table 11. Table of Fit Statistics for Path Analysis (individual belief 1)……….................. 51
Table 12. Table of Fit Statistics for Path Analysis (individual belief 2). ………………... 52
Table 13. Table of Fit Statistics for Path Analysis (individual belief 3). …………………. 52
Table 14. Summary of Effects of Individual Belief 1 on Behavioral Intent (Effect / Standard
Error / t-value / p-value). ………………………………………………………………….. 54
Table 15. Summary of Effects of Individual Belief 2 on Behavioral Intent (Effect/Standard
Error/t-value/p-value). ………………………………………………………………….… 55
Table 16. Summary of Effects of Individual Belief 2 on Behavioral Intent (Effect/Standard
Error/t-value/p-value). …………………………………………………………………..… 56
Table 17. Specific p-values for Subjective Norm across Gender. ……………….……….. 58
Table 18. Specific p-values for Attitude across Gender. ………………………………….. 59
Table 19. Specific p-values for Beliefs across Gender. ……………………………….….. 59
Table 20. Specific p-values for Altruism across Gender. ……………………………...….. 59
Table 21. Specific p-values for Subjective Norm across Political Views. ………………... 60
Table 22. Specific p-values for Attitude across Political Views. ……………………..…... 61
Table 23. Specific p-values for Attitude across Political Views. ……………………..…... 61
Table 24. Specific p-values for Beliefs across Political Views. …………………………... 62
Table 25. Specific p-values for Behavioral Intent across Political Views. ………………... 62

iv
LIST OF FIGURES Figure 1. Conceptual Model for Green Purchase Behavior. ……….…………………….... 5
Figure 2. Conceptual Model for Green Purchase Behavior with Hypotheses…………....... 22
Figure 3. Conceptual Model for Green Purchase Behavior with Hypotheses. ……………. 38
Figure 4. Path Diagram of Conceptual Model for Green Purchase Behavior………….….. 40
Figure 5. Results of the Path Analysis. ………………………………………………….... 43
Figure 6. Conceptual Model for Individual Belief: EFPs help the environment in some way.
……………………………………………………………………………………….…….. 49
Figure 7. Conceptual Model for Individual Belief: EFPs are more expensive than other products.
……………………………………………………………………………………………... 50
Figure 8. Conceptual Model for Individual Belief: EFP purchase is encouraged by those important.
…………………………………………………………………………………………..…. 50

1
CHAPTER 1: INTRODUCTION TO THE STUDY
"There's a lot of cynicism and distrust in the world of big institutions, and companies
really need to share with people what they value, what they care about."
–Marc Pritchard, Procter & Gamble's Global Brand-Building Officer,
Association of National Advertisers Convention, 2010 (Schultz, Neff & Pollack, J 2010)
Overview
The marketplace is overripe with choices. Being authentic and building
consumer trust have never been more important. Over the past few years, business
leaders have been thinking about social problems and how social problems can fit into
their business models. The phenomenon of “pro-social” or “purpose” marketing has
become popular with companies across the nation including Panera Bread Company,
Coca-Cola, Toyota, Kashi, Whole Foods Market, and Procter & Gamble to name a few.
This type of marketing professes company beliefs and values to entice consumers to
explore and experience the product or service being advertised. Finding and making an
authentic connection with consumers through value expression is key to building not only
a loyal brand community but a community of brand advocates.
According to Erin Nelson, former CMO of Dell, “Purpose isn’t just good for the
soul, it's actually really good for the bottom line” (Schultz et al., 2010). As a growing
number of consumers claim that what a company stands for influences their purchase
decision (Elliot, 2013), brands that have authentic meaning have the potential to become
quite profitable.
2
Altruism, the practice of concern for others, is a key value tied to social or
purpose marketing. When it comes to building brand communities, how much stronger
might a brand community be if altruistic values are inserted into the branding efforts?
This research study is focused on understanding consumer behavior in relation to
social or purpose marketing. Using pro-environmental or “green” marketing as a
strategic research site, this research is unique in that it looks beyond classic cause-related
marketing research and explores the impact of underlying altruistic values via the
incorporation of social issues into the product advertising space.
Many are concerned about the future, sustainability and ethical or mindful
decision-making. This research considers the external issues brought into the buying
process. Looking specifically at mindful decision-making and how consumers think and
feel about sustainability—the creation and maintenance of conditions that support our
natural environment and the common good—this research explores what motivates
consumers to make purchases that benefit someone or something other than themselves.
Statement of the Problem
Considering that companies are spending millions of dollars launching organic
and environmentally friendly product lines, and consumers are purchasing more and more
of these products, the problem we face is the fact that we don’t know why consumers are
buying these green products. This research addresses this “why” and strives to develop a
better understanding of what type of consumers have positive attitudes toward
environmentally friendly products. Is it possible that consumers making green purchases
have more in common than a simple desire to act in an environmentally friendly manner?
3
Could their purchase behavior and behavioral intent be tied to an expression of altruistic
values or beliefs?
This leads to the formal research questions posed for this study which are RQ1:
What are the salient beliefs regarding purchasing environmentally friendly products? And
RQ2: When it comes to everyday buying behaviors, what role does altruism play?
Conceptual and Theoretical Framework
Altruism, as defined by Batson in Altruism in Humans, is “a desire to benefit
someone else for his or her sake rather than one’s own” (2011, p. 3). The term was first
used in the early 1800s by French philosopher Auguste Comte to explain a “devotion to
the interests of others as an action-guiding principle” (Paul, Miller, & Paul (eds), 1993, p.
vii) and is a phenomenon still being researched and studied.
Overall, altruism has been most frequently conceptualized and defined through
the rankings of various value statements, such as “I prefer working toward my own well-
being than toward the well-being of others,” or “It is important to me to help others”
(Ferguson, Atsma, de Kort & Veldhuizen, 2012). It has also been defined or explained as
identified emotions such as empathy (Batson, O'Quin, Fultz, Vanderplas & Isen, 1983).
In addition, reasons given for attitudes or behaviors have been cited as helping to study
and understand altruism. Reasons include showing concern for those less fortunate,
expressing compassion, doing something for a cause that is important to him/her (Briggs,
Peterson & Gregory, 2010), as well as considering something a moral obligation (Baron,
1999).
This research aims to not only improve upon these concepts and definitions, as the
current definitions of altruism are strictly human-centric, but to venture into newer
4
territory by combining prior value research and knowledge with strongly established
behavioral theories. Many of the current persuasive behavioral communication theories
and models do not incorporate a value or belief structure into their explanations of
attitude and behavior. Thus, this research will begin to explore the incorporation of
values, specifically altruism, into some vested communication theories.
The conceptual model in mind for this research is inspired by the Theory of
Reasoned Action (Fishbein & Ajzen, 1975) and the Theory of Planned Behavior (Ajzen,
1985). The Theory of Reasoned Action (TRA) and the Theory of Planned Behavior
(TPB) are similar in that they both seek to predict the potential for action or behavioral
intent. TRA posits that attitudes toward a behavior along with subjective norms or the
influence of people in one’s social environment, lead to intention, which, in turn, leads to
behavior (Fishbein & Ajzen, 1975). TPB, developed as a revision to TRA, goes a step
further and incorporates behavioral control or one’s perceived ease or difficulty in
performing a behavior, as a contributing factor to intention, and eventually behavior
(Ajzen, 1985).
The two theories taken together aid in the construction of the following
conceptual model (Figure 1), which shows that in addition to attitudes, social norms and
perceived control, personal values, specifically altruism, lead to beliefs, which affect
attitudes, subjective norms, and perceived behavioral control, which then each contribute
to green purchase behavioral intent. Altruism is considered a value, which is something
that we think is important, while beliefs are what we think is true. Altruism, then, can
lead to beliefs, which in turn, guide actions.

5
Figure 1. Conceptual Model for Green Purchase Behavior.
Note in the figure above that altruism has two paths to behavioral intent. First,
altruism is shown to indirectly effect green purchase behavior by leading to beliefs which
in turn, influence attitude, subjective norm and perceived control, which finally lead to
behavioral intent. This route is the traditional path guided by the Theory of Planned
Behavior. Second, because altruism is considered a value and people often express their
values directly through behaviors such as purchases or political action (Baron, 1999), it is
possible that altruistic values directly influence green purchase behavior; Thus, there is a
second path in the conceptual model that displays altruism directly effecting green
purchase behavioral intent.
Due to the fact that the purchase of environmentally friendly products benefits
others and impacts more than just oneself, the purchase of such products could be
Altruism) Beliefs)
A-tudes)toward)Green)
Purchase)Behavior)
Subjec;ve)Norms)
Perceived)Behavior)Control)
Green)Purchase)Behavioral)Intent)
Green)Purchase)Behavior)

6
considered an act of altruism. Thus, going forward, this conceptual model will be used to
seek further understanding of the impacts and interactions of altruistic values and beliefs
on behavioral intent related to product advertising that carries a social message,
specifically, a message of sustainability. The model considers personal values and beliefs
that consumers bring to the green purchasing process, and seeks to explore what
motivates consumers to make purchases that benefit something or someone other than
themselves.
This study consists of two phases that work together to explore social messaging
in product advertising: first a belief elicitation study designed to uncover specific
attitudes and beliefs regarding environmentally friendly products and purchasing, and
second a survey incorporating the identified attitudes and beliefs, along with measures of
altruism, in an effort to explore the potential influence of altruistic values on green
purchase behavior. This study hopes to add to the body of knowledge regarding social
marketing and green communication by opening discussion regarding the following
questions: What are the salient attitudes and beliefs regarding purchasing
environmentally friendly products? When it comes to everyday buying behaviors, what
role does altruism play?
Contribution to the Field
This study is an exploration of the potential power of consumers to motivate and
influence social change through their everyday purchasing behavior. This contribution is
important to society on two dimensions. First, it explores the potential of product
advertising to affect behavioral intent related to a social issue: sustainability. Second, it

7
considers the role that values, specifically altruism, play in everyday purchasing
decisions.
This study also contributes to advertising and marketing scholarship in two ways.
First, it will attempt to incorporate a value structure into previously established
behavioral theories. Also, because this study is uniquely different from traditional
advertising, social marketing, public relations and corporate image research, this study
has the potential to advance the scholarship on the green consumer as well as the social
effects of advertising.
8
CHAPTER II: REVIEW OF LITERATURE
The Role of Altruism
Altruism is a human value that plays a central role in one of the largest social
issues we face today: sustainability. Becoming a sustainable society will allow our planet
to continue supporting human life as we know it. As a society, our changing focus
toward goals of sustainability presents a shift, or a re-prioritization, in values. These
values are being expressed not only in homes and schools, but also in check-out lines
across America. Where once security and achievement were the universal values
influencing everyday decisions and purchases, today altruism has begun to play a more
central role.
Take for example the eco-friendly Toyota Prius. This vehicle is a “green” product
with much consumer demand. Consumers know that the money they save on gasoline
will not “make up” for the high purchase price of the vehicle; however, they choose to
buy a Prius anyway. Why? More recently, just about every automobile maker has
released a model that includes an “eco” button. This button allows the driver to switch
the vehicle into an eco-friendly mode that conserves fuel or energy in a variety of ways
depending on make and model. To date, Chevrolet, Dodge, Honda, Hyundai, Infiniti,
Nissan, Toyota, and Lexus all have a model with an “eco” button feature. This feature
has been the focus of advertising campaigns currently on television, and like the Prius,
the price tag attached to a vehicle with this “eco” button is higher than a vehicle without
the button. So what is the benefit to the consumer? One could argue that the benefit is
not to the individual purchasing the car; it is not a self-oriented benefit. Any “eco”
benefit is an other-oriented benefit, and thus tied to altruism. On the other hand, one
9
could also argue that depending on the type of product, conspicuous or inconspicuous,
the feature may benefit the individual making the purchase. One who is seen using
“green” products may be considered “cool” or “hip” or “on trend.”
The study of altruism within the field of persuasion is important because it not
only investigates a potential value shift in the population, but also because of the
potential power of product advertising to motivate and influence social change. And
specifically, in the case of this research, it points to a very current and critical social
issue: sustainability.
Altruism within the field of persuasion has been studied previously, however not
within the realm of product advertising. Recent literature has conceptually defined
altruism in great detail—identifying a variety of levels and states of altruism. For
example, Andreoni was one of the first to differentiate “pure” altruism from “impure”
altruism (1990). Pure altruism follows the definition above (selfless concern for the well-
being of others), while impure altruism allows for other influencing factors to have an
impact on an altruistic act (Andreoni, 1990). These other factors could include pleasant
feelings, or a “warm-glow,” experienced by the person performing the act, or perhaps a
personal benefit granted to the actor such as prestige in the community.
Other scholars have also contributed to the definition of altruism by expanding the
term into four dimensions: reluctant altruism, pure altruism, impure altruism and warm
glow (Ferguson et al., 2012). Pure and impure altruism hold the definitions as outlined
above by Andreoni, while reluctant altruism is identified as an altruistic motivation with
an underlying feeling of distrust of others (Ferguson et al., 2012); in other words, a
reluctant altruist will help because “no one else will do it.” Warm glow altruism is

10
considered a form of impure altruism, where the motivation to help is not strictly for the
benefit of another, but also for the positive emotional feeling gained by the simple act of
helping another (Ferguson et al., 2012).
This study conceptually defines altruism at the general level: a concern or act that
benefits the well-being of another and that may or may not also present the altruist with
any sort of personal gain. This was done because research has shown that measuring
altruism at the more general level (vs. a specific level) produces the strongest assessment
of the altruistic trait (Rushton, Chrisjohn & Fekken, 1981)
Throughout previous research, altruism has been operationally defined and
investigated in a variety of ways. Altruism and the ideas of helping have been defined
and measured as pro-social behavior, empathy, other-focus, motivations for helping, and
reasons for helping, volunteering or donating.
With regard to motivations for volunteering, donating and helping others, several
consistencies are present in the literature. Various factors have been analyzed via
semantic differential and likert scale rankings including motivations to help such as social,
career, eco-centric, ego-protective, gratitude, guilt, empathy, quest for new, quest for
oneself, and simply to achieve something positive for others (Grant & Gino, 2010; Marta,
Guglielmetti & Pozzi, 2006; Massi Lindsey, Kimo & Hill, 2007; Rehberg, 2005). The
key findings in these studies refer to the fact that there usually is not just one motivating
factor involved in helping others or behaving altruistically. A study by Faseur and
Geuens confirms this. A comparison of other-focused motivations and mixed-focus
(self/other) motivations found that mixed-focused emotions led to higher egoistic

11
motivations, whereas other-focused emotions led to greater altruistic motives (Faseur &
Geuens, 2010).
Further, scholars have worked to determine which factors or variables produce
stronger desire to help, as well as which type of appeals for help are best received. When
comparing empathy to distress, it was found that empathetic responses were related to
altruistic motivations, while personal distress responses were related to egoistic
motivations (Batson et al.,1983). In addition, a comparison of an emotional approach,
such as a reenactment of a child abuse situation, with a rational approach such as the
viewing of the paperwork for a child abuse case, indicates that an emotional approach
creates a stronger desire to help (Bagozzi & Moore, 1994). Finally, when it comes to
volunteering, other-oriented values and motivations seem to be much more influential
than self or ego-focused values and motivations (Briggs et al., 2010).
In their attempt to measure motivation to help, other scholars have framed their
research in strategic communication, creating and manipulating public service
announcements and advertisements. Results have shown a variety of findings dependent
on the variables under study. It has been shown that ones moral and personal values do
influence purchase behavior, and that consumers have moral opinions regarding their
purchasing decisions (Baron, 1999). For example, Baron states that we can expect
someone “to avoid active participation in anything that violated” their values or beliefs (p.
263). This “active participation” includes buying behavior.
Another slightly divergent, yet related study shows that higher levels of extrinsic
motivation can actually defeat or override potential underlying intrinsic motivation
(Anghelcev & Eighmey, 2007). The term “crowding out” is applicable here as well as
12
with Batson et al, and can be explained as a shift in motivation. Once the price of helping
gets too high, many tend to shy away from assisting (Batson et al., 1983). Or, once the
extrinsic value hits a tipping point, intrinsic or altruistic motivations tend to disappear
(Anghelcev & Eighmey, 2007). If these findings were to be consistent across studies,
one might predict that the monetary price of environmentally friendly products could be
an inhibiting factor with regard to intent to purchase such environmentally friendly
products.
A final site where altruism and motivation to help have been studied, beyond public
service announcements and advertisements for volunteers or donations, is the cause-
related marketing sector. Cause-related marketing can be defined as an application of
marketing strategies and techniques to the selling of social causes and ideas (rather than
products and services) (Fox & Kotler, 1980). Cause-related marketing (CRM),
sometimes referred to as social marketing and social-cause marketing, is quite prominent
in the marketplace today. Some CRM is authentic, in that its creation is motivated by
pure altruism; however, much would be considered motivated by impure altruism, in that
a benefit is gained by the creator of the message on top of the social cause or idea alone.
As stated earlier, this study will consider any and all dimensions of altruism.
CRM has been on the radar of various scholars for decades. When one receives a
request or a plea for help they have a choice to fulfill that request or not. Cause-related
marketing takes the request for help to a larger level, putting the help message on a mass
scale in an effort to reach a great number of potential “helpers.”
Research looking at cause-related marketing has focused mostly on consumer
responses to CRM (Hamlin & Wilson, 2004; Dean, 2003; Webb & Mohr, 1998).

13
Research has shown that consumers have a more favorable response to a brand or
company that puts forth a CRM message than to a brand or company that does not have a
CRM messaging strategy (Nan & Heo, 2007). Consumers are also concerned with the
authenticity of the CRM message or the effort the company puts forth. If consumers
connect altruism (vs. persuasion or egoistic motives) to the message, higher credibility is
generated for the brand (Bigne-Alcaniz, Curras-Perez & Sanchez-Garcia, 2009; Morales,
2005). And further findings indicate that altruistic driven consumers form their judgment
on brand credibility via altruistic attribution, whereas consumers who are not altruistic by
nature, base their assessment of a company’s altruism on the cause-brand fit or how
similar and compatible the cause and the brand are (Bigne-Alcaniz et al., 2009).
Grau and Folse (2007) have explored what type of CRM message (national or
local), what type of frame (positive or negative) and what type of consumer (high or low
involvement) result in the most positive CRM evaluations. Their findings include an
understanding that local causes and positive frames result in positive evaluations for low
involvement consumers (Grau & Folse, 2007).
Last, a recent survey of psychographic data analyzed consumers’ psychographics
in relation to their perceptions of cause-related marketing. Findings related to CRM and
altruism include the observation that consumers who purchase products tied to social
causes may be viewed as performing responsible behavior via consumption, and that
buying products that are supporting social causes or ideas through their cause-related
marketing may be a way for consumers to express their motivation to be more socially
responsible (Youn & Kim, 2008).
14
These findings tie directly to the study at hand and lead to the following
questions: What happens when social issues are incorporated into product advertising?
When it comes to building brand communities, how much stronger might a brand
community be if altruistic values were inserted into the branding efforts?
Strategic Research Site: Green Marketing
Since the inception of the environmental movement in the late 1960s, marketers
have been considering the possibility and potential of environmentally concerned
consumers. By the early 1990s many marketers had begun to give environmental or
“green” appeals serious consideration, if not application, within their marketing strategies.
Today, environmental or green claims made by products and services through marketing
is not unexpected; however, today’s consumers see through a simple green appeal and
often look for more of an authentic corporate value expression: a concern for
sustainability.
The definition of green marketing or green advertising varies throughout the
literature, but for this study green marketing and advertising will follow Hartmann and
Apaolaza-Ibanez’s definition and will be considered the marketing or advertising of a
product or brand through the use of environmental claims (such as environmentally
friendly, eco-safe, recycled, bio-degradable, etc) (Hartmann & Apaolaza-Ibanez, 2009).
Green marketing research began to emerge just after the onset of the
environmental movement. In 1971, Kassarjian conducted one of the first studies related
to green marketing. Kassarjian investigated concerns for air pollution in relation to
gasoline advertising and found that individuals who were concerned about air pollution
were receptive to the environmental advertising claim. He also found that individuals
15
who were not concerned about air pollution were also receptive to the environmental
advertising claim, to a lesser degree (1971). Kassarjian also examined individual factors
(age, socio-economic status, education) and found no connection between those
individual factors and preference for or against environmental advertising claims.
It wasn’t until the early 1990s that academics began to take a serious look at green
marketing as an area ripe for scholarly work. Beginning in the 1990s with an explosion
of green investigations and leading up to today, green communication research has
ranged from content analyses, experiments and surveys to exploratory studies including
textual, rhetorical, legal and historical analyses, and case studies.
Multiple content analyses have been conducted on green marketing over the past
two decades. Three were conducted in the 1990s, one in 2007, and an ethnographic
content analysis in 2012. The 1990s content analyses focused on basic underpinnings of
green advertising. Banerjee, Gulas and Iyer (1995) examined 268 green advertisements
(both print and broadcast) in an effort to categorize the types of green appeals used by
advertisers. Their findings allowed for a categorization of green advertising into three
dimensions: sponsor type (for-profit and non-profit), ad focus (advertiser or consumer),
and depth of the ad as it relates to the environmental movement. They also concluded that
green advertisers were limited in their exploration of depth of environmental issues and
opted to present more of a simple acknowledgment of concern for the environment
(Banerjee et al., 1995).
A second content analysis, also executed in the 1990s was seeking to not only
explore the type of environmental claim (using an original typology--product, process,
image or fact), but also sought the potential for deception in green advertising (Carlson,

16
Grove & Kangun, 1993). Results indicate that overall more advertising claims were
classified as image ads and fewer were process-oriented, while at the same time more
claims contained misleading or deceptive elements than those deemed acceptable
(Carlson et al., 1993).
A third and most comprehensive content analysis of the 1990s includes the study
of a twenty-five-year span of green advertisements. Easterling, Kenworthy and Nemzoff
(1996) examined environmental advertising from 1969 through 1994. In their research,
and using Carlson et al’s original typology, they determined that there is a relationship
between the country’s general mood and environmental advertising. The authors also
found that the two most common approaches to green advertising over this twenty-five-
year period were product and image oriented (Easterling et al., 1996).
More recently, an additional content analysis on green advertising was conducted.
Spears and Germain (2007) analyzed green advertising from 1900 through 2000,
specifically looking at animal-human relationships. The researchers observed that in the
early part of the century, humans were the central focus in advertisements. At this time,
if animals were shown in advertisements most were shown in cages or captivity. Near
the later years of the century, as concern for the environment increased, the green
sentiments shifted and more animals were shown in their natural settings (Spears &
Germain, 2007).
Last, the ethnographic content analysis (paired with interviews) conducted by
Fowler and Close (2012) concluded with the identification of a “green gap.” This green
gap pertains to different thoughts, ideas and agendas between advertisers and consumers
with regard to their ideas on green advertising, green products and their abilities to make

17
a difference toward saving the planet. Some of the advertisers using green messaging
appear to be truly seeking to help save the planet while others are merely using green
messages to sell their products. Consumers on the other hand often are simply trying to
avoid ruining or wasting their own personal space on the planet and feel that saving the
planet as a whole is too big of a task, or someone else’s responsibility (Fowler & Close,
2012).
Survey and experimental research has also been conducted in the area of green
marketing and advertising. Both the 1990s and 2000s have produced several studies.
Stafford, Stafford and Chowdhury (1996) examined various appeals that may have an
impact on positive reception of green advertising. The appeals investigated included
concern for individual health, concern for wildlife, concern for waste, energy awareness,
concern for popular issues, concern for environmental technology and concern for the
biosphere. Results indicate that concern for individual health was the most effective
appeal (Stafford et al., 1996).
Several more recent experiments sought to determine which type of
environmental claim or appeal was preferred by consumers and which claim type would
positively affect attitude toward the brand (Chan, 2000; Hartman & Apaolaza-Ibáñez,
2009; Montoro-Rios, Luque-MartÍnez & RodrÍguez-Molina, 2008). In these cases,
various environmental claims, such as substantive and associative, were explored. Results
of these more recent studies have been mixed most likely due to the diversity in
typologies explored.
Past surveys regarding consumer attitudes toward green marketing and
advertising have also provided scholars with a framework for building current green

18
marketing research. In 1998, Newell and Goldsmith analyzed the effects of misleading
or deceptive environmental advertising claims. They sought to answer two questions:
First, can environmentally conscious consumers identify deceptive green advertising
claims? And second, what impact does the perception of deceptive advertising have on
the perceptions of company credibility, attitude toward the ad, attitude toward the brand,
as well as potential purchase? Results of this study include multiple findings. First,
increased level of environmental concern did not lead to an increased perception of
deception (Newell & Goldsmith, 1998). Second, perceived advertising deception does
have a negative effect on advertiser credibility, attitude toward the ad, and attitude toward
the brand, while perceived advertiser credibility has a positive effect on attitude toward
the ad, and positive attitude toward the ad will have a positive effect on attitude toward
the brand (Newell & Goldsmith, 1998).
Additional surveys were executed in the 2000s to further explore green marketing
and advertising. Consumer attitudes toward green products in general were found to be
positively related to one’s natural environment orientation, overall knowledge of ecology,
as well as a personal concern for the environment (Mostafa, 2007). Further, consumers
with a more positive attitude toward green products were found to have a higher intention
to purchase green products (Mostafa, 2007).
Chen took a slightly different approach to green marketing research with his study.
His survey of over 250 consumers found that companies looking to build green brand
equity should focus on building green brand image, green brand trust and green
satisfaction (Chen, 2010).
19
A final approach to previous literature on green marketing and advertising
research has been one of different and sometimes exploratory routes. A variety of
analyses including textual, rhetorical, historical and legal have all been conducted in
examination of environmental communication.
To address the concern of deceptive green advertising appeals, Scammon and
Mayer (1995) conducted a legal analysis of environmental claim challenges brought by
US regulatory agencies. They found that many challenged claims (degradability,
recycled content, and absence of ozone depleting chemical claims) were similar and were
resolved through the regulatory agencies; however, as generality of claims and implied
claims increased, many were still unresolved. The authors conclude by summarizing that
regulation of environmental marketing claims is an effort to create a marketplace where
sellers can compete fairly with regard to environmental impact by regulating clarity and
definition of eco-terms (Scammon & Mayer, 1995). This definition of eco-terminology is
continuously under revision and clarification at regulatory agencies today.
Even further green marketing and advertising research has been conducted in an
exploratory fashion. Durham and Hancock (2003) and Smerecnik and Renegar (2010)
have analyzed the rhetoric of British Petroleum’s (BP) marketing and advertising and
have concluded that there is conflict between altruistic environmental concerns and
corporate success. Additional exploratory studies have found the environment itself has
been branded (Hansen & Machin, 2008), that green marketing and advertising has not yet
contributed to societal sustainability (Peattie & Crane, 2005), and that green advertising
in general facilitates consumption and not true ecological motives (Meister, Chamberlai,
& Brown, 2006).

20
Green advertising has been examined from a variety of perspectives: from
consumer receptivity of green messages, to the understanding the effectiveness of green
appeals, and even explorations of brands and products and their use of environmental
communication. Overall, the conclusion that can be drawn after reviewing the previous
literature on green advertising is this: Researchers of green marketing and advertising
have spent much time and energy exploring the differences between a variety of green
claims and a variety of consumer types, as well as consumer responses to a variety of
green advertising claims. However, the previous literature has yet to provide empirical
evidence of the potential impact of altruism or other-oriented values on the purchase of
everyday consumer products.
The literature on altruism presents multiple explorations of human values and
beliefs, and how these values and beliefs relate to various behaviors. This current
research seeks to combine the two fields of research, altruism and green advertising and
asks this: When it comes to everyday buying behaviors, what role does altruism play?
This dissertation takes a two-stage approach in an effort to understand the effects
of altruism on green purchasing behavior. The first stage of this research is an elicitation
study, which seeks to understand consumer attitudes and beliefs regarding
environmentally friendly products and purchases. Second, is a main survey that
incorporates the salient attitudes and beliefs identified by the elicitation study and
explores the potential influence of altruism on green purchase behavior and behavioral
intent.

21
CHAPTER III: METHODOLOGY
Rationale, Central Questions & Hypotheses
Because the purpose of the study was to explore the value of altruism and its
relationship to green purchase behavior, this design is multi-staged and exploratory. First,
in an elicitation study the goal was to explore and generate themes or patterns about
consumers general attitudes, beliefs and ideas about green purchase behavior. Next,
including the findings of the elicitation study, the main survey instrument was developed
in an effort to survey a larger sample of consumers regarding their attitudes, beliefs, and
behaviors related to green purchase behavior.
The goal of an exploratory study, such as this, includes searching for indicators
rather than causes (Tukey, 1962, 1986). The central questions being investigated in this
two-stage sequential, multi-method study are as follows: What are the salient attitudes
and beliefs among adult consumers with regard to green purchase behavior? And second,
when it comes to green purchase behavior, how does altruism affect the process?
Eight hypotheses were tested in this study. They are as follows:
H1: Altruism predicts beliefs toward green purchase behavior intent. H2: Beliefs predict attitudes toward green purchase behavior intent. H3: Beliefs predict subjective norms regarding green purchase behavior intent. H4: Beliefs predict perceived behavior control regarding green purchase behavior intent. H5: Attitudes toward green purchase behavior predict behavioral intent to purchase environmentally friendly products. H6: Subjective norms regarding green purchase behavior predict behavioral intent to purchase environmentally friendly products.

22
H7: Perceived behavior control regarding green purchase behavior predicts behavioral intent to purchase environmentally friendly products. H8: Altruism predicts green purchase behavior intent.
The following figure displays how the eight hypotheses are placed within the
conceptual model discussed in chapter 1.
Figure 2. Conceptual Model for Green Purchase Behavior with Hypotheses.
Study Design
This study is an investigation of the perceptions and behavioral intentions of
adults in the United States related to green purchase behavior. Because there is no
Altruism) Beliefs)
A-tudes)toward)Green)
Purchase)Behavior)
Subjec;ve)Norms)
Perceived)Behavior)Control)
Green)Purchase)Behavioral)Intent)
Green)Purchase)Behavior)
H1)
H2)
H3)
H4)
H5)
H6)
H7)
H8)

23
standard scale established to measure constructs of the Theory of Planned Behavior,
Ajzen (2002) recommends conducting a pilot or “elicitation” study to identify behavioral,
normative and perceived control beliefs related to a particular behavior prior to
developing the main survey instrument for the study. Thus this research uses a two-stage
design to examine the role altruism plays in green purchase decisions: the pilot, or belief
elicitation study, and the main study. Approval was requested and granted by the
Institutional Review Board (IRB) prior to both the elicitation study and the main study.
I. Elicitation Study
The purpose of the elicitation study was an exploration to determine the sample’s
salient beliefs about purchasing environmentally friendly or “green” products, which
would then be translated into belief measures related to attitudes toward green purchase
behavior, as well as social norms and perceived behavior control relative to green
purchase behavior. These beliefs were used in creation of the survey instrument for the
main study.
The elicitation survey was administered online to a random sample of adults 18+
in the United States. Seventy-one questionnaires were distributed through an online
survey company (Survey Monkey) and fifty responses were received (a response rate of
70%).
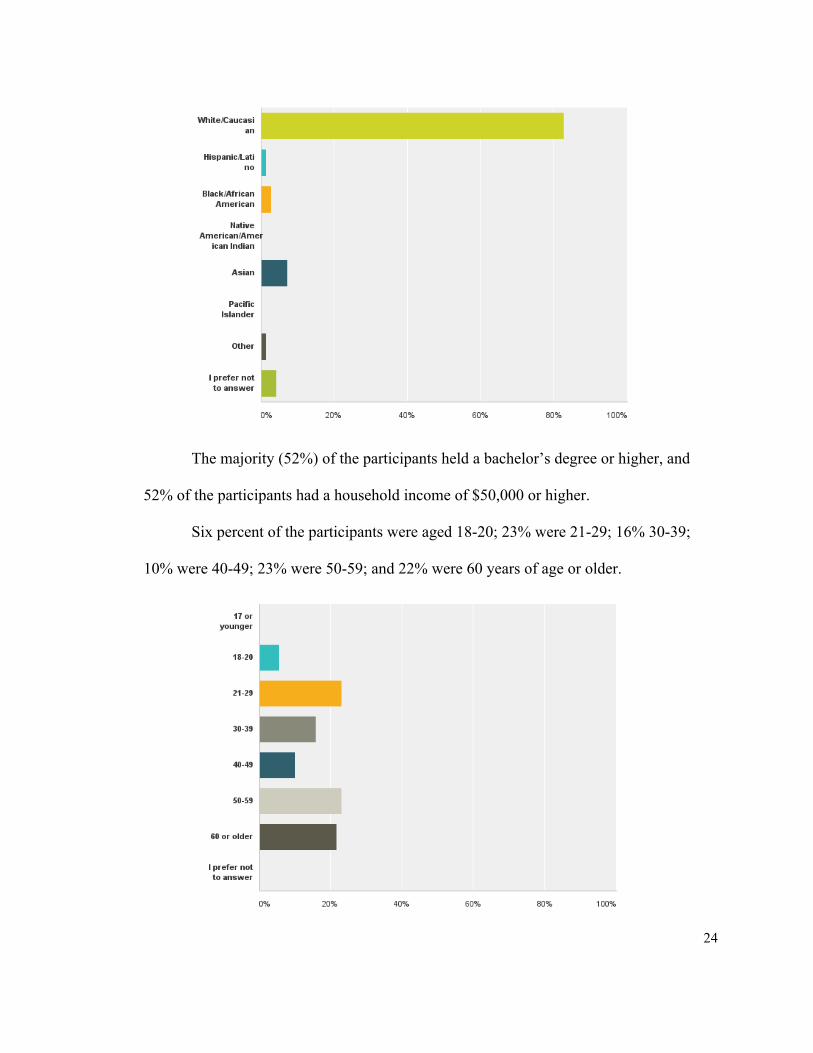
Participants: The participants were 49% female and 51% male. Eighty-three
percent of the participants identified as white/Caucasian, 7% Asian, 3% African
American, 1% Hispanic/Latino, 1% identified as “other” and 4% preferred not to answer
the ethnicity question.
24
The majority (52%) of the participants held a bachelor’s degree or higher, and
52% of the participants had a household income of $50,000 or higher.
Six percent of the participants were aged 18-20; 23% were 21-29; 16% 30-39;
10% were 40-49; 23% were 50-59; and 22% were 60 years of age or older.

25
All areas of the country were represented in the sample and nearly half of the
sample was either married or in a domestic partnership (49%).
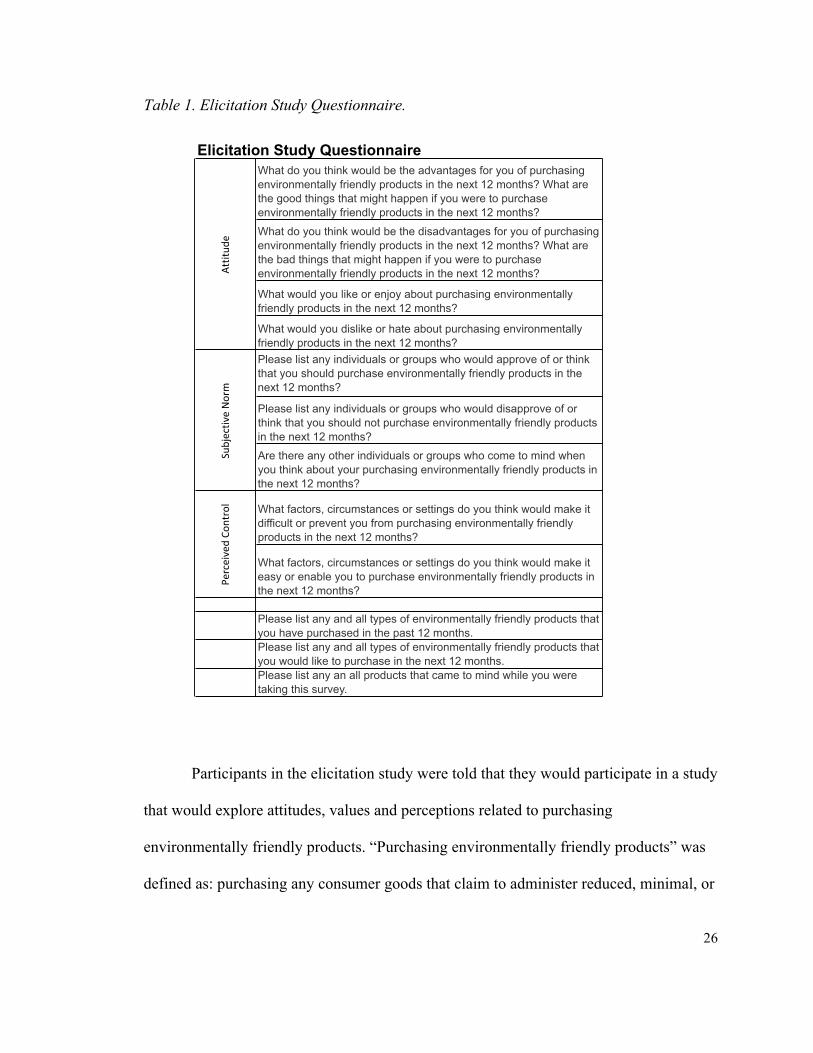
The questionnaire consisted of open-ended questions inquiring about beliefs on
environmentally friendly or “green” products and green purchase behaviors (see Table 1
below). There were nine open-ended belief-related questions. Key issues explored
include the advantages and disadvantage of buying green products (attitudes), perceptions
regarding influential sources (organizations and/or persons) pertaining to their beliefs
about green products and/or purchasing (subjective norms), as well as participant
thoughts on their ability to purchase green products (perceived control). The elicitation
study also probed for salient green products or product categories.
26
Table 1. Elicitation Study Questionnaire.
Participants in the elicitation study were told that they would participate in a study
that would explore attitudes, values and perceptions related to purchasing
environmentally friendly products. “Purchasing environmentally friendly products” was
defined as: purchasing any consumer goods that claim to administer reduced, minimal, or
Elicitation Study QuestionnaireWhat do you think would be the advantages for you of purchasing environmentally friendly products in the next 12 months? What are the good things that might happen if you were to purchase environmentally friendly products in the next 12 months?
What do you think would be the disadvantages for you of purchasing environmentally friendly products in the next 12 months? What are the bad things that might happen if you were to purchase environmentally friendly products in the next 12 months?
What would you like or enjoy about purchasing environmentally friendly products in the next 12 months?
What would you dislike or hate about purchasing environmentally friendly products in the next 12 months? Please list any individuals or groups who would approve of or think that you should purchase environmentally friendly products in the next 12 months?
Please list any individuals or groups who would disapprove of or think that you should not purchase environmentally friendly products in the next 12 months?
Are there any other individuals or groups who come to mind when you think about your purchasing environmentally friendly products in the next 12 months?
What factors, circumstances or settings do you think would make it difficult or prevent you from purchasing environmentally friendly products in the next 12 months?
What factors, circumstances or settings do you think would make it easy or enable you to purchase environmentally friendly products in the next 12 months?
Please list any and all types of environmentally friendly products that you have purchased in the past 12 months. Please list any and all types of environmentally friendly products that you would like to purchase in the next 12 months. Please list any an all products that came to mind while you were taking this survey.
Attitud
eSubjectiv
e,Norm
Perceived,Co
ntrol

27
no harm at all upon ecosystems or the environment. Examples of environmentally
friendly products were also provided to the participants and included automobiles,
cleaning supplies, clothing, appliances, office supplies, light bulbs, sporting gear/goods,
toys, and home goods. Participants were asked to write down anything and everything
that came to mind while taking the elicitation survey.
Data from the elicitation study was analyzed using a flexible coding method.
Flexible coding is defined as a type of qualitative coding that allows unique categories of
data to appear rather than using preconceived categories (Treadwell, 2014). Due to the
nature of the open-ended questions used in the elicitation study, flexible coding was
necessary to ensure that all participant beliefs were acknowledged and captured.
II. Main Study
The goal of the main survey was to measure how consumers incorporate thoughts
on environmental sustainability into their purchasing decisions, and to address the
research question regarding the potential impact of altruism on green purchase behavior.
Overall, the survey included six points of measurement: altruism, beliefs, attitude,
subjective norm, perceived behavior control, and behavioral intent.
Participants: The survey was conducted online using a random sample of 325
adults 18+ in the United States purchased through Survey Monkey. The participants were
51% female and 46% male. Eighty-two percent of the participants identified as
white/Caucasian, 6% Hispanic/Latino, 5% African American, 3% Asian, 3% Native
American/American Indian, 1% Pacific Islander, 1% “other” and 4% preferred not to
answer the ethnicity question.

28
The majority (60%) of the participants held a bachelor’s degree or higher, and
56% of the participants had a household income of $50,000 or higher. Eighteen percent
of the participants were aged 18-29, 28% were aged 30-44, 33% were aged 45-60, 21%
were over 60 years of age.
All areas of the country were represented in the sample and over half of the
sample (57%) was either married or in a domestic partnership.
����������������� �����������������������������������
�������
'�!''# ��
&!&"# ��
�!'&# �
�!3�#
�!3�#
"!��# �
"!$&# �
�!''# ��
��"�7���������)���������E ����� �!
���������"3� �������$
.� ���0������ ����"3 �
:�� E?��������
��������EC� ���
8���E��������������
,� ���������E��������+�����
�����
7������+������
- ��
7������ �������
�� ��� ��� ��� ��� ����
������?����� 0������
&!����#�-������
0��"�����/�����
5���:�4+������4�������
.���$��4��������4��������8�����
4����
���+�� �8�������
=�!��
��+�������������'��
����������������� �����������������������������������
�������
"# �
�%!'3# �
�'!��# ��
��!&3# ���
��!��# ��
�����/
������������ ��������
.� �� ���
I��'
�'A�3
�"A��
�&A$"
J�$"
�� ��� ��� ��� ��� ����
������?����� 0������
D���
��C�
��C��
�C��
E���

29
Research Measures: Theory of Planned Behavior (TPB) measures were
operationalized on the basis of previous research scales and include beliefs related and
relevant to attitudes, subjective norms, and perceived behavior control, altruism levels,
and behavioral intent, as well as the results of the belief elicitation study (stage one of
this project).
To measure levels of altruism, an abbreviated version of the previously tested
altruism scale created by Rushton, Chrisjohn and Fekken (1981) was used. A sample of
the likert scale measures used to measure altruism levels includes “I would offer my seat
on a bus or train for a stranger who was standing,” “I would voluntarily look after a
neighbor’s pets or children without being paid for it,” and “I would give money to a
charity.”
Seven-point semantic differentials were used to measure attitude. The attitude
measures included the following two likert scale statements: “My purchasing
environmentally friendly products in the next 12 months is…” extremely negative to
extremely positive, extremely good to extremely bad and extremely meaningless to
extremely worthwhile. As well as, “I find purchasing environmentally friendly
products…” extremely pleasant to extremely unpleasant, extremely annoying to
extremely enjoyable and extremely unappealing to extremely appealing.
Belief questions, captured from the pilot elicitation study, related to the purchase
of green products helping the environment, being more expensive than non-green
products, and being encouraged by people and groups that are important to the participant,
were also included in the main survey.

30
These three main beliefs were selected from the elicitation study as the most
prominent beliefs under each of the three areas examined (attitude, subjective norm,
perceived control). For example, helping the environment was the most common answer
given (58%) when asked what was an advantage or good thing about environmentally
friendly products (EFPs). Helping the environment also was the most common answer
given when asked what one would enjoy about purchasing EFPs (34%). Expense
appeared as the top belief twice under attitude, first when asked about disadvantages of
green products (60%) and second, what do you hate about EFPs (58%), as well as twice
under perceived control what would make it easier, “lower the price” (44%); and what
makes it difficult, “too expensive” (69%). The general belief included in the main survey
stating that purchasing EFPs would be “encouraged by people and groups that are
important to me,” was a summation of the variety of people and groups named in the
belief elicitation study. Beliefs, like the other variables, were measured on 7-point scales.
Likert scales and semantic differentials were also used to measure subjective
norms. Subjective norm questions include “My family thinks that I should purchase
environmentally friendly products in the next 12 months” and “My friends and/or partner
think that I should purchase environmentally friendly products in the next 12 months,” as
well as belief reflection, “I believe that my purchasing environmentally friendly products
in the next 12 months would be encouraged by people and groups that are important to
me.”
Perceived behavior control (“My purchasing environmentally friendly products in
the next 12 months is…” and “If I wanted to, I could purchase environmentally friendly
products in the next 12 months”) was again measured using likert scales and semantic

31
differentials. Questions created as a result of the elicitation study such as, “I believe that
my purchasing environmentally friendly products in the next 12 months will require me
to spend more money than if I were to purchase other non-environmentally friendly
products” were also incorporated to measure perceived behavior control.
Finally, semantic differentials were used to measure behavioral intent (“How
likely is it that you will purchase environmentally friendly products in the next 12
months?” and “I intend to purchase environmentally friendly products in the next 12
months”).
Table 2 below displays all of the measures and their operational definitions via
questions used in the survey.

32
Table 2. Main Survey Questionnaire.
Main Survey Questionnaire
Most people who are important to me think that... I should (not) purchase environmentally friendly products in the next 12 months
The people in my life whose opinions I value would... Strongly approve/disapprove of my purchasing environmentally friendly products in the next 12 months
Most groups or organizations that are important to me think that... I should (not) purchase environmentally friendly products in the next 12 monthsMy purchasing environmentally friendly products in the next 12 months is... Negative/positiveMy purchasing environmentally friendly products in the next 12 months is... Bad/goodMy purchasing environmentally friendly products in the next 12 months is... Meaningless/worthwhileI find purchasing environmentally friendly products... Unpleasant/pleasantI find purchasing environmentally friendly products... Annoying/enjoyableI find purchasing environmentally friendly products... Unappealing/appealingMy purchasing environmentally friendly products... under my control/not under my controlFor me, purchasing environmentally friendly products in the next 12 months is... Impossible/possible
For me, purchasing environmentally friendly products in the next 12 months is... Costly/economical
For me, purchasing environmentally friendly products in the next 12 months is... Convenient/InconvenientI believe that my purchasing environmentally friendly products in the next 12 months will help the environment in some way. Helping the environment in some way is... Good/BadI believe that my purchasing environmentally friendly products in the next 12 months will require me to spend more money than if I were to purchase other non-environmentally friendly products. Spending more of my money to help the environment in some way is... Bad/goodI believe that my purchasing environmentally friendly products in the next 12 months would be encouraged by people and groups that are important to me. Encouragement from people and groups that are important to me is... Essential/nonessentialI would offer my seat on a bus or train for a stranger who was standing. I would voluntarily look after a neighbor’s pets or children without being paid for it. I would give money to a charity. I would delay an elevator and hold the door for a stranger. I would make change for a stranger. I would let a neighbor, whom I don’t know very well, borrow an item of some value to me (e.g. dish, tools, etc.) I would give directions to a stranger. I would help an acquaintance move households. I would give money to a stranger who needed it (or asked me for it). I would help carry a stranger’s belongings (e.g. books, parcels, etc.) How likely is it that you will purchase environmentally friendly products in the next 12 months?
I intend to purchase environmentally friendly products in the next 12 months
Altr
uism
Sub
ject
ive
Nor
mB
ehav
iora
l In
tent
Bel
iefs
Atti
tude
Per
ceiv
ed C
ontro
l

33
Data for the main survey were collected via an online survey link administered
through an online survey company. Participants were told that they would be answering
questions related to attitudes and beliefs toward environmentally friendly products. Once
data for the main survey were collected, the data were exported from the survey company
software into JMP Pro 10 for analysis. Pearson’s Correlation and Path Analyses were
carried out to examine the data. The findings of these analyses and conclusions of the
research are discussed in the next two chapters.

34
CHAPTER IV: RESEARCH FINDINGS
I. Elicitation Study Findings
Categories of data that appeared through the flexible coding procedure, reflecting
participant attitudes and beliefs about purchasing environmentally friend products, are
displayed in the Table below.
Table 3. Beliefs about Environmentally Friendly Products.
%"of"total"responses
Advantages better"for"the"environment 58.5%
better"for"personal"health 17.0%
save"money 5.7%
better"for"future"generations 3.8%
feel"better"about"self 3.8%
other 11.3%
Disadvantages expensive 60.4%
not"effective 18.8%
potential"deception"(greenwashing) 8.3%
lack"of"desired"features 4.2%
other 8.3%
Enjoy better"for"the"environment 34.2%
feel"better"about"self 31.6%
better"for"personal"health 7.9%
convenient 5.3%
good"smell 5.3%
other 15.8%
Hate expensive 57.9%
not"effective 23.7%
potential"deception"(greenwashing) 7.9%
other 10.5%
Others"approve environmental"organizations 25.9%
friends 15.5%
family 15.5%
politicians/liberals 12.1%
environmental"companies 8.6%
mother"earth 5.2%
other 17.2%
Others"disapprove oil"companies 20.0%
politicians/conservatives 13.3%
family 13.3%
nonOenvironmental"companies 10.0%
antiOenvironmentalists 6.7%
friends 6.7%
other 30.0%
Easy lower"price 44.4%
more"convenient"location 30.6%
coupons/incentives 11.1%
improved"quality 5.6%
more"education"on"products 5.6%
other 2.8%
Difficult too"expensive 69.4%
inconvenient 19.4%
other 11.1%
Beliefs'about'Environmentally'Friendly'Products
Attitud
esSubjectiv
e'Norms
Perceived'Co
ntrol

35
The elicitation study showed that the sample under study generally believes that
the biggest advantage of purchasing environmentally friendly products (EFPs) is that they
are better for the environment than non-EFPs (46%). In response to the question, “What
do you think would be the advantages for you of purchasing environmentally friendly
products in the next 12 months? What are the good things that might happen if you were
to purchase environmentally friendly products in the next 12 months?” respondents had
the following replies:
Respondent: “I believe it would help our Eco systems and improve living on
earth.”
Respondent: “If everyone started to buy more eco friendly products, it would have
a positive effect on the planet.”
Respondent: “Do my part to not further damage the environment.”
The participants in the elicitation study also believe that the biggest disadvantage
of purchasing EFPs is that they are more expensive than non-EFPs (59%) with a concern
for the effectiveness of the product (21%). When asked, “What do you think would be
the disadvantages for you of purchasing environmentally friendly products in the next 12
months? What are the bad things that might happen if you were to purchase
environmentally friendly products in the next 12 months?” respondents replied:
Respondent: “I will be spending way more money on less efficient products.”
Respondent: “I may have to pay a little more or worse yet a lot more.”

36
Respondent: “Environmentally friendly products tend to be more expensive and
the eco-friendly cleaning products do not work as well as their non eco-friendly
counter parts.”
In addition, approximately 23% of the elicitation sample believes that
corporations and environmental organizations seem to be most concerned with whether
or not consumers purchase EFPs, followed by respondents’ families (14%), politicians
(13%), and friends (11%). With regard to perceived control, the sample believed that if
EFPs were less expensive (57%) and more readily available (25%), they would be easier
to purchase.
Other beliefs about environmentally friendly products uncovered in the elicitation
study worthy of note include advantages of purchasing EFPs such as better for personal
health (17%) and to feel better about oneself (31%); disadvantages such as
ineffectiveness (23%) and potential deception/greenwashing (8%). Participants also
believe that EFPs would be easier to purchase if they were more readily accessible or
conveniently located for sale (30%).
II. Main Survey Findings
The data set analyzed in the main survey contained responses from 325 subjects
on 31 different questions (excluding the demographic survey questions). Each of the 31
questions was a 7-point scaled item. Six new variables were then created by averaging
responses to items related to each of these variables: Altruism, Beliefs, Attitudes toward

37
Green Purchase Behavior, Subjective Norms, Perceived Behavior Control, and Green
Purchase Behavioral Intent.
The responses from two subjects were dropped from the initial data set; these two
subjects answered only a few questions on the survey, and there was some concern with
the validity of their responses to those questions. All analyses were carried out using
JMP Pro 10.
Purpose of the Study
The purpose of this study was to explore the value of altruism and its relationship
to green purchase behavior. The research hypotheses were as follows:
H1: Altruism predicts beliefs toward green purchase behavior intent.
H2: Beliefs predict attitudes toward green purchase behavior intent.
H3: Beliefs predict subjective norms regarding green purchase behavior intent.
H4: Beliefs predict perceived behavior control regarding green purchase behavior intent.
H5: Attitudes toward green purchase behavior predict behavioral intent to purchase
environmentally friendly products.
H6: Subjective norms regarding green purchase behavior predict behavioral intent to
purchase environmentally friendly products.
H7: Perceived behavior control regarding green purchase behavior predicts behavioral
intent to purchase environmentally friendly products.
H8: Altruism predicts green purchase behavior intent.
The following conceptual model (figure 3) was explained previously in chapters 1
and 3 and visually displays how the hypotheses are grounded in the Theory of Planned
Behavior.
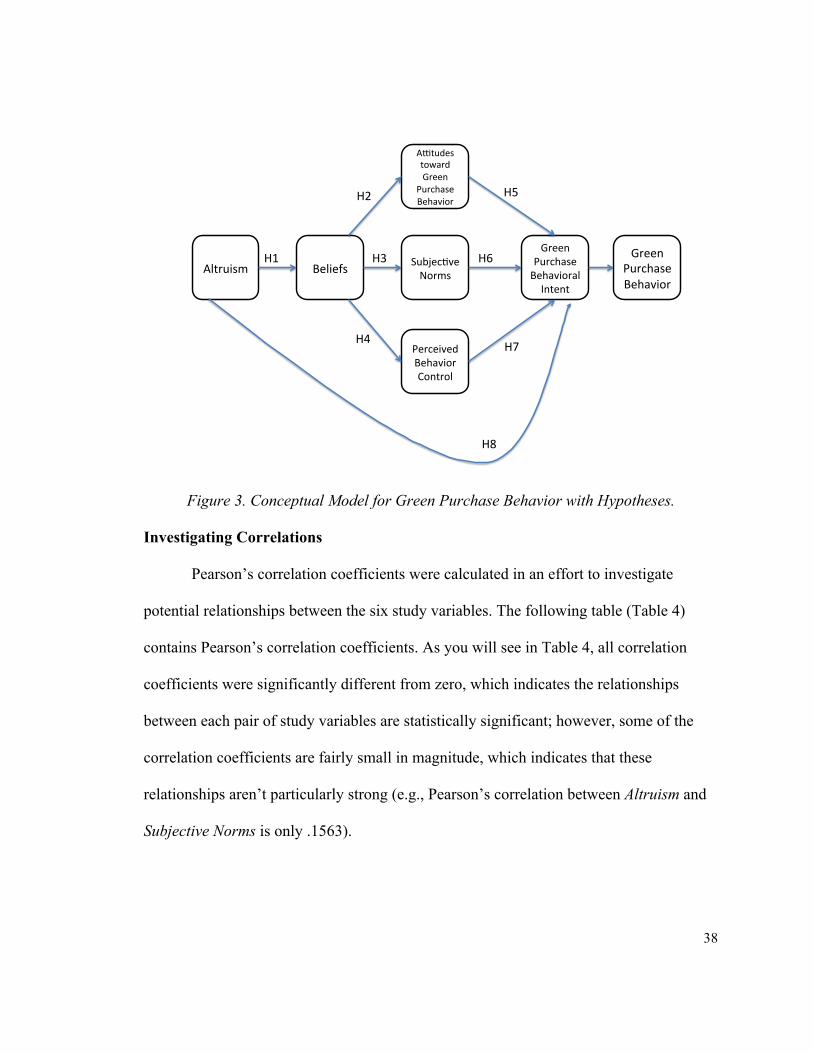
38
Figure 3. Conceptual Model for Green Purchase Behavior with Hypotheses.
Investigating Correlations
Pearson’s correlation coefficients were calculated in an effort to investigate
potential relationships between the six study variables. The following table (Table 4)
contains Pearson’s correlation coefficients. As you will see in Table 4, all correlation
coefficients were significantly different from zero, which indicates the relationships
between each pair of study variables are statistically significant; however, some of the
correlation coefficients are fairly small in magnitude, which indicates that these
relationships aren’t particularly strong (e.g., Pearson’s correlation between Altruism and
Subjective Norms is only .1563).
Altruism) Beliefs)
A-tudes)toward)Green)
Purchase)Behavior)
Subjec;ve)Norms)
Perceived)Behavior)Control)
Green)Purchase)Behavioral)Intent)
Green)Purchase)Behavior)
H1)
H2)
H3)
H4)
H5)
H6)
H7)
H8)
39
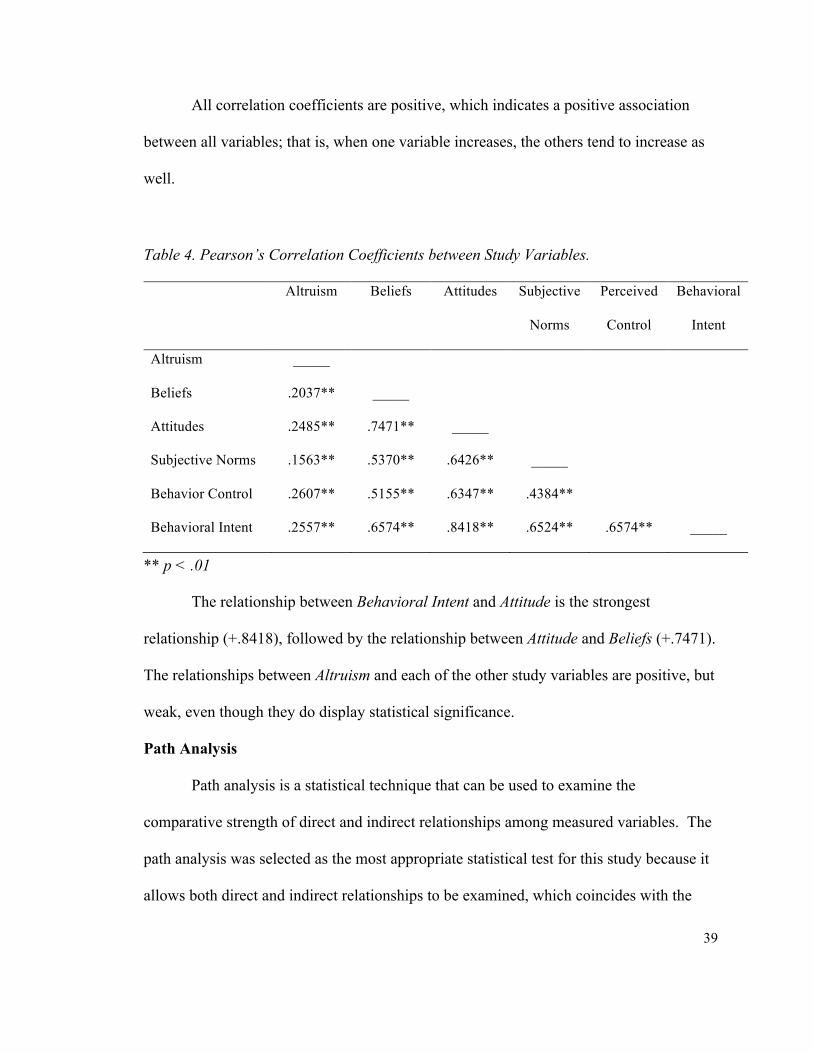
All correlation coefficients are positive, which indicates a positive association
between all variables; that is, when one variable increases, the others tend to increase as
well.
Table 4. Pearson’s Correlation Coefficients between Study Variables.
Altruism Beliefs Attitudes Subjective
Norms
Perceived
Control
Behavioral
Intent
Altruism _____
Beliefs .2037** _____
Attitudes .2485** .7471** _____
Subjective Norms .1563** .5370** .6426** _____
Behavior Control .2607** .5155** .6347** .4384**
Behavioral Intent .2557** .6574** .8418** .6524** .6574** _____
** p < .01
The relationship between Behavioral Intent and Attitude is the strongest
relationship (+.8418), followed by the relationship between Attitude and Beliefs (+.7471).
The relationships between Altruism and each of the other study variables are positive, but
weak, even though they do display statistical significance.
Path Analysis
Path analysis is a statistical technique that can be used to examine the
comparative strength of direct and indirect relationships among measured variables. The
path analysis was selected as the most appropriate statistical test for this study because it
allows both direct and indirect relationships to be examined, which coincides with the

40
theory and model under study in this present research. This particular analysis was
carried out using SAS Structural Equation Modeling 2.1 for JMP.
To begin, a path diagram was created in JMP to represent the conceptual model.
The bidirectional arrows have been included to account for the fact that Attitude,
Subjective Norms, and Perceived Behavior Control are all correlated with one another.
The unidirectional arrows indicate the paths of interest in the conceptual model.
Figure 4. Path Diagram of Conceptual Model for Green Purchase Behavior.
A total of 311 observations were used in the path analysis, since observations with
missing values for any variables in the analysis are omitted from the computations. First,
to investigate model fit, the following fit statistics were examined. Most fit statistics
indicate that the model is a good fit.
41
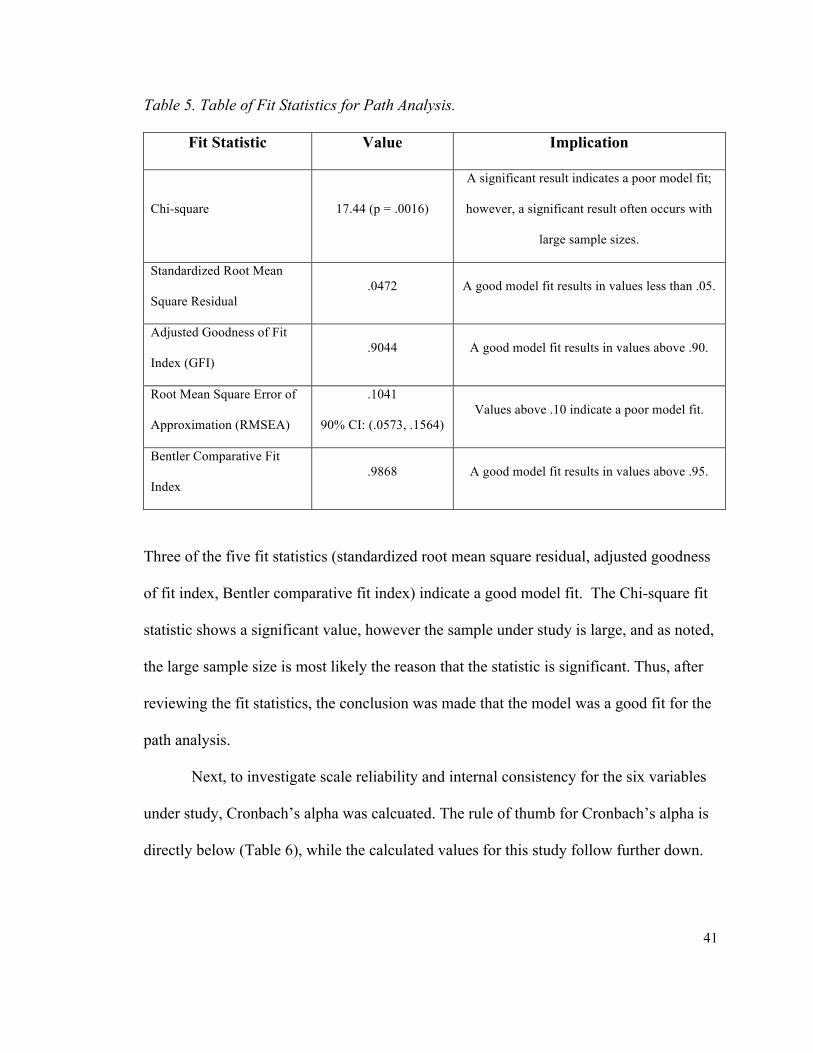
Table 5. Table of Fit Statistics for Path Analysis.
Fit Statistic Value Implication
Chi-square 17.44 (p = .0016)
A significant result indicates a poor model fit;
however, a significant result often occurs with
large sample sizes.
Standardized Root Mean
Square Residual .0472 A good model fit results in values less than .05.
Adjusted Goodness of Fit
Index (GFI) .9044 A good model fit results in values above .90.
Root Mean Square Error of
Approximation (RMSEA)
.1041
90% CI: (.0573, .1564) Values above .10 indicate a poor model fit.
Bentler Comparative Fit
Index .9868 A good model fit results in values above .95.
Three of the five fit statistics (standardized root mean square residual, adjusted goodness
of fit index, Bentler comparative fit index) indicate a good model fit. The Chi-square fit
statistic shows a significant value, however the sample under study is large, and as noted,
the large sample size is most likely the reason that the statistic is significant. Thus, after
reviewing the fit statistics, the conclusion was made that the model was a good fit for the
path analysis.
Next, to investigate scale reliability and internal consistency for the six variables
under study, Cronbach’s alpha was calcuated. The rule of thumb for Cronbach’s alpha is
directly below (Table 6), while the calculated values for this study follow further down.

42
Table 6. Cronbach’s Alpha “Rule of Thumb”
Cronbach's alpha Internal consistency α ≥ 0.9 Excellent
0.7 ≤ α < 0.9 Good
0.6 ≤ α < 0.7 Acceptable 0.5 ≤ α < 0.6 Poor
α < 0.5 Unacceptable
Table 7. Calculated Cronbach’s Alpha for Current Study
Variable Cronbach's Alpha
subjective norm 0.80
attitude 0.97
perceived control 0.58
beliefs 0.72
altruism 0.86
behavioral intent 0.89
As you can see from the tables above, five of the six variables fall in the good to
excellent rating, while perceived control (0.58) is considered (by rule of thumb) poor to
acceptable. Because the survey questions used to measure perceived control in this study
are consistent with the style of perceived control measures tested and used in previous
behavioral research (My purchasing environmentally friendly products in the next 12
months is… under my contol/not under my control; impossible/possible;

43
costly/economical; convenient/inconvenient), the scale reliability for all variables in this
study will be considered acceptable.
Results of the Path Analysis
The following diagram (Figure 5) summarizes the results of the path analysis.
Each estimated path coefficient is displayed on the path from one variable to another (the
unidirectional arrows). Any estimates that are significantly different from zero (based on
a t-test) are marked by two asterisks to indicate p < .01 and by one asterisk to indicate p
< .05.
Figure 5. Results of the Path Analysis.
Note that all path coefficients are statistically significant at the p < .01 level,
except for the path connecting Altruism to Behavioral Intent directly. For those path
coefficients that are statistically significant, the results indicate that the paths represent
Altruism) Beliefs)
A-tudes)toward)Green)
Purchase)Behavior)
Subjec;ve)Norms)
Perceived)Behavior)Control)
Green)Purchase)Behavioral)Intent)
Green)Purchase)Behavior)
0.203**)
0.744**)
0.518**)
0.029)
0.190**)
0.512**) 0.170**)
0.607**)

44
significant relationships between the variables. Moreover, the path parameters are all
positive, indicating that higher values of each predictor are associated with higher values
of the outcome.
The magnitude of the coefficients refers to how many standard deviations the
outcome variable is expected to change per standard deviation increase in the predictor
variable. For example, the standard deviations of Belief, Attitude, and Perceived
Behavior Control scores were about 1, 1.5, and 1, respectively.
The path coefficient of .744 indicates that if Belief scores were to increase by one
standard deviation (which is a 1 point increase), we expect Attitude scores to increase by
about .744 standard deviations (which is about .744*1.5 = 1.1 points). On the other hand,
if Belief scores were to increase by one standard deviation (about 1 point), we expect
Perceived Behavior Control scores to increase by .518 standard deviations (which is
about .518*1 = .518 points). In general, the larger the magnitude of the path coefficient,
the stronger the effect of the predictor on the outcome variable.
The squared multiple correlations for each outcome variable are shown in Table 7
below. These values can be interpreted as follows: About 75% of the variation in
Behavioral Intent, for example, can be explained by all of the other predictors (R-square
= .7499). Similarly, about 55% of the variation in Attitude can be explained by its
predictors in the model, Beliefs and Altruism (R-square = .5533). The other R-Square
values, however, are lower (R-square = .2685, .2617). This indicates that Beliefs and
Altruism are not as clear of predictors for Perceived Behavior Control nor Subjective
Norms. The final R-square value (.0412) indicates that Altruism is not a clear predictor of
Beliefs.

45
Table 8. R-Square Values for Study Variables.
Study Variable R-Square
Behavioral Intent .7499
Attitude .5533
Perceived Behavior Control .2685
Subjective Norms .2617
Beliefs .0412
Next, the total, direct, and indirect effects of the predictors on Behavioral Intent were
examined in more detail. The results are shown in Table 9 below.

46
Table 9. Summary of Effects on Behavioral Intent (Effect / Standard Error / t-value / p-
value).
Note that the direct effect of Altruism on Behavioral Intent was not statistically
significant (p = .3126); however, the indirect effect of Altruism on Behavioral Intent was
significant (p = .0003). The direct and indirect effects of all other variables were shown
to be statistically significant at p < .0001.
Total Effect Direct Effect Indirect Effect
Attitude .6084
.04
15.22
<.0001
.6084
.04
15.22
<.0001
0
Beliefs .6382
.0277
23.08
<.0001
0 .6382
.0277
23.08
<.0001
Perceived
Behavior
Control
.1904
.0369
5.16
<.0001
.1904
.0369
5.16
<.0001
0
Subjective
Norms
.1703
.0369
4.62
<.0001
.1703
.0369
4.62
<.0001
0
Altruism .1585
.0452
3.51
.0005
.0290
.0288
1.01
.3126
.1295
.0355
3.65
.0003
47
The correlation analysis and path analysis together indicate support for the
original research hypotheses H1-H7.
H1: Altruism predicts beliefs toward green purchase behavior intent.
H2: Beliefs predict attitudes toward green purchase behavior intent.
H3: Beliefs predict subjective norms regarding green purchase behavior intent.
H4: Beliefs predict perceived behavior control regarding green purchase behavior intent.
H5: Attitudes toward green purchase behavior predict behavioral intent to purchase
environmentally friendly products.
H6: Subjective norms regarding green purchase behavior predict behavioral intent to
purchase environmentally friendly products.
H7: Perceived behavior control regarding green purchase behavior predicts behavioral
intent to purchase environmentally friendly products.
Hypothesis 8, Altruism predicts green purchase behavior intent, was partially
supported. As indicated by the path analysis, the direct effect of Altruism on Behavioral
Intent was not found to be statistically significant (p = .3126); However, the indirect
effect of Altruism on Behavioral Intent through the other predictor variables was found to
be statistically significant (p = .003).
Further Belief Investigation
To explore the belief variable even further, supplementary analyses were
conducted. First, correlations were reviewed to investigate potential relationships
between the individual belief variables (belief that environmentally friendly products,
EFPs, help the environment in some way, belief that EFPs are more expensive than other

48
products, and belief that EFP purchases are encouraged by those people and groups that
are important) and the other five variables (Altruism, Attitude, Subjective Norm,
Perceived Control, Behavioral Intent).
Pearson’s correlation coefficients were calculated to explore these relationships.
As you will see in the below table, most, but not all of the correlation coefficients were
significantly different from zero, which indicates the relationships between each pair of
variables is statistically significant. However, similar to the original set of correlations
discussed earlier in this chapter, some of the correlations coefficients are fairly small in
magnitude—indicating that these relationships are not particularly strong.
Table 10. Pearson’s Correlation Coefficients between Study Variables (Individual Beliefs).
Altruism Belief Attitudes Subjective
Norms
Perceived
Control
Behavioral
Intent
Belief: Help
Environ
.1432* _____ .6586** .3984** .4668** .6137**
Belief: Expensive .1528** _____ .0516 .0133 -.1408* .0023
Belief: Encouraged .1194* _____ .5977** .5459** .4756** .6166**
** p < .01 * p<.05
The relationship between the belief that EFPs help the environment in some way
and attitudes is the strongest (+.6586), followed by the relationship between belief that
EFP purchases are encouraged by those people and groups that are important and
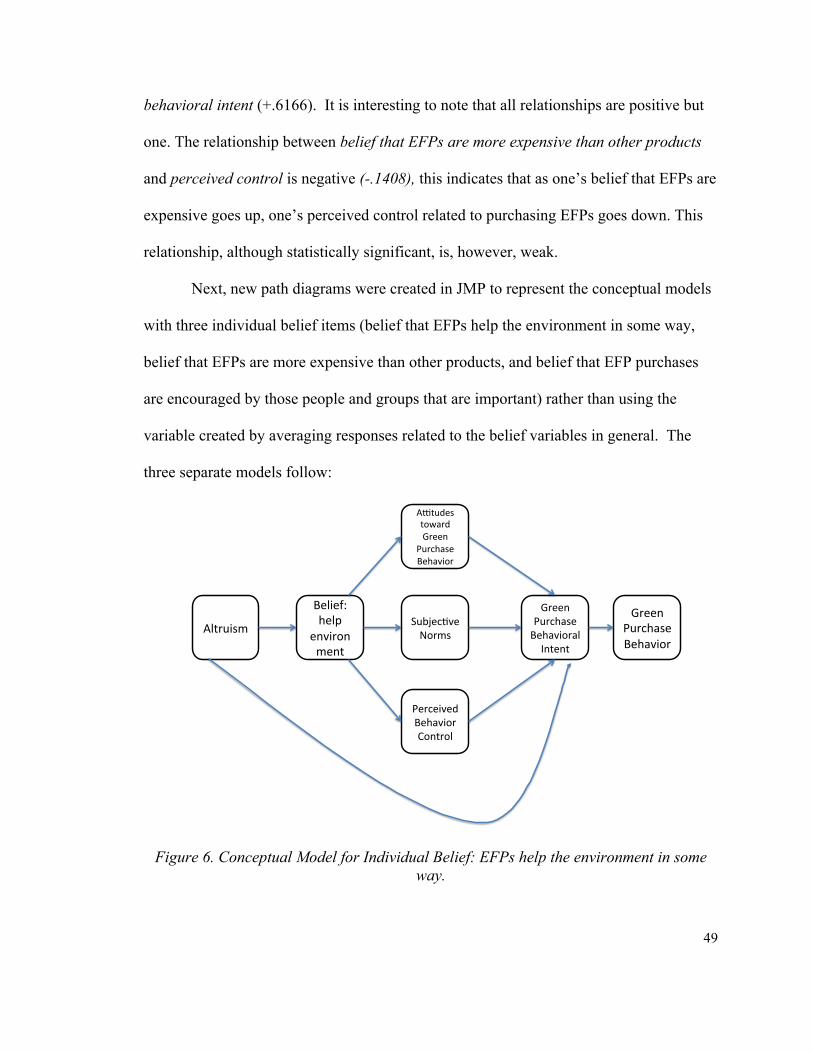
49
behavioral intent (+.6166). It is interesting to note that all relationships are positive but
one. The relationship between belief that EFPs are more expensive than other products
and perceived control is negative (-.1408), this indicates that as one’s belief that EFPs are
expensive goes up, one’s perceived control related to purchasing EFPs goes down. This
relationship, although statistically significant, is, however, weak.
Next, new path diagrams were created in JMP to represent the conceptual models
with three individual belief items (belief that EFPs help the environment in some way,
belief that EFPs are more expensive than other products, and belief that EFP purchases
are encouraged by those people and groups that are important) rather than using the
variable created by averaging responses related to the belief variables in general. The
three separate models follow:
Figure 6. Conceptual Model for Individual Belief: EFPs help the environment in some way.
Altruism)
Belief:)help)
environment)
A3tudes)toward)Green)
Purchase)Behavior)
Subjec=ve)Norms)
Perceived)Behavior)Control)
Green)Purchase)Behavioral)Intent)
Green)Purchase)Behavior)

50
Figure 7. Conceptual Model for Individual Belief: EFPs are more expensive than other products.
Figure 8. Conceptual Model for Individual Belief: EFP purchase is encouraged by those important.
Altruism) Belief:)expense)
A1tudes)toward)Green)
Purchase)Behavior)
Subjec>ve)Norms)
Perceived)Behavior)Control)
Green)Purchase)Behavioral)Intent)
Green)Purchase)Behavior)
Altruism)Belief:)
encouragement)
A3tudes)toward)Green)
Purchase)Behavior)
Subjec=ve)Norms)
Perceived)Behavior)Control)
Green)Purchase)Behavioral)Intent)
Green)Purchase)Behavior)

51
Next, fit statistics were examined to investigate model fit. Some of the below fit
statistics indicate that the model is a good fit for these three new tests; however some of
the fit statistics below show that the model may not be a good fit for these additional
analyses.
Table 11. Table of Fit Statistics for Path Analysis (individual belief 1).
Belief: EFPs help the environment in some way
Fit Statistic Value Implication
Chi-square 25.4884 (p = <.0001)
A significant result indicates a poor model fit; however, a significant result often occurs with large sample sizes.
Standardized Root Mean Square Residual
0.0675 A good model fit results in values less than .05.
Adjusted Goodness of Fit Index (GFI) 0.8632 A good model fit results in values above .90.
Root Mean Square Error of Approximation (RMSEA)
0.1316
Values above .10 indicate a poor model fit. 90% CI:
(.0858, .1826)
Bentler Comparative Fit Index 0.9772 A good model fit results in values above .95.

52
Table 12. Table of Fit Statistics for Path Analysis (individual belief 2).
Belief: EFPs are more expensive
Fit Statistic Value Implication
Chi-square 28.7908 (p = <.0001)
A significant result indicates a poor model fit; however, a significant result often occurs with large sample sizes.
Standardized Root Mean Square Residual
0.0999 A good model fit results in values less than .05.
Adjusted Goodness of Fit Index (GFI) 0.8482 A good model fit results in values above .90.
Root Mean Square Error of Approximation (RMSEA)
0.1419
Values above .10 indicate a poor model fit. 90% CI:
(.0960, .1926)
Bentler Comparative Fit Index 0.9686 A good model fit results in values above .95.
Table 13. Table of Fit Statistics for Path Analysis (individual belief 3).
Belief: EFP purchase is encouraged by those important
Fit Statistic Value Implication
Chi-square 30.3777 (p = <.0001)
A significant result indicates a poor model fit; however, a significant result often occurs with large sample sizes.
Standardized Root Mean Square Residual
0.0716 A good model fit results in values less than .05.
Adjusted Goodness of Fit Index (GFI) 0.8371 A good model fit results in values above .90.
Root Mean Square Error of Approximation (RMSEA)
0.1463
Values above .10 indicate a poor model fit. 90% CI:
(.1005, .1969)
Bentler Comparative Fit Index 0.9714 A good model fit results in values above .95.

53
For all three separate belief items, one of the five fit statistics indicates a good
model fit (Bentler comparative fit index). The Chi-square fit statistic shows a significant
value; however the sample under study is large, and as noted the large sample size is
most likely the reason that this statistic is significant. The other three fit statistics
(standardized root mean square residual, adjusted goodness of fit index and the root mean
square error or approximation) show that the model may not be a good fit. Thus, the
following results should be received with some caution.
Results of the Additional Path Analyses
Next, the total, direct, and indirect effects of the predictors, including the
individual belief variables, on Behavioral Intent were studied in more detail. The results
are shown in the tables below.
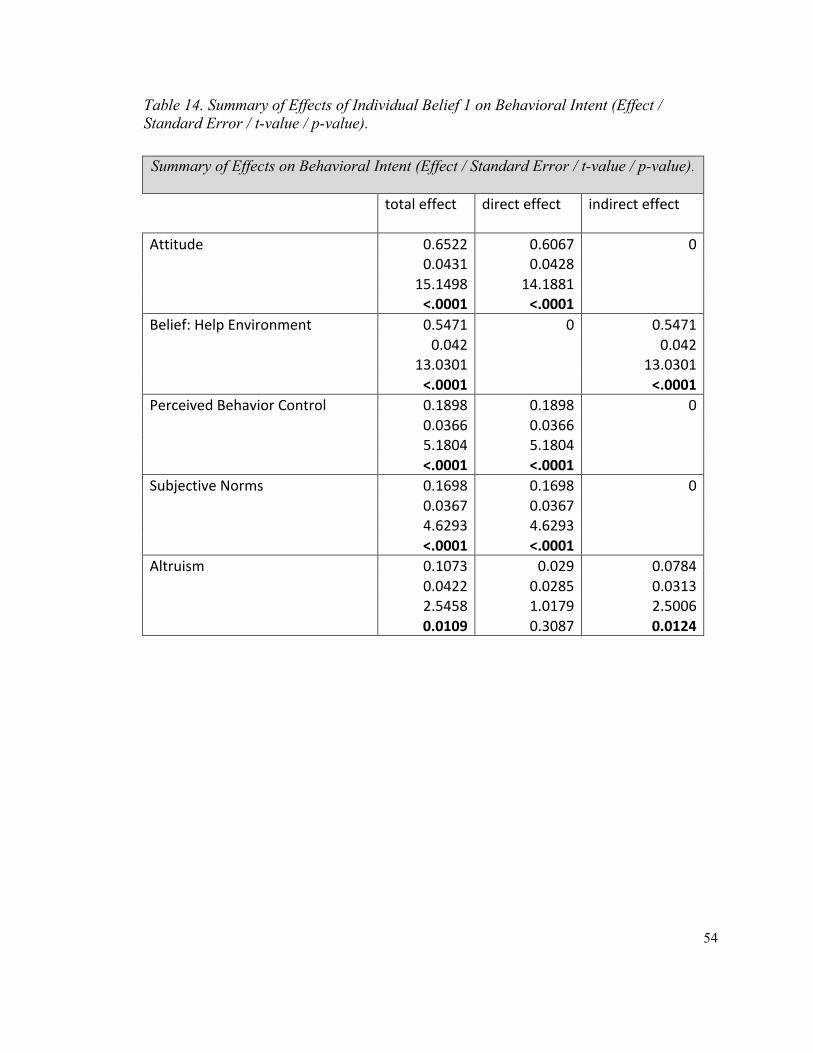
54
Table 14. Summary of Effects of Individual Belief 1 on Behavioral Intent (Effect / Standard Error / t-value / p-value). Summary of Effects on Behavioral Intent (Effect / Standard Error / t-value / p-value).
total effect direct effect indirect effect
Attitude 0.6522 0.6067 0 0.0431 0.0428 15.1498 14.1881 <.0001 <.0001 Belief: Help Environment 0.5471 0 0.5471 0.042 0.042 13.0301 13.0301 <.0001 <.0001 Perceived Behavior Control 0.1898 0.1898 0 0.0366 0.0366 5.1804 5.1804 <.0001 <.0001 Subjective Norms 0.1698 0.1698 0 0.0367 0.0367 4.6293 4.6293 <.0001 <.0001 Altruism 0.1073 0.029 0.0784 0.0422 0.0285 0.0313 2.5458 1.0179 2.5006 0.0109 0.3087 0.0124

55
Table 15. Summary of Effects of Individual Belief 2 on Behavioral Intent (Effect/Standard Error/t-‐value/p-‐value). Summary of Effects on Behavioral Intent (Effect / Standard Error / t-value / p-value).
total effect direct effect indirect effect
Attitude 0.6022 0.6022 0
0.0433 0.0433
13.9239 13.9239
<.0001 <.0001
Belief: Expense -‐0.017 0 -‐0.017
0.0493 0.0493
-‐0.3442 -‐0.3442
0.7307 0.7307
Perceived Behavior Control 0.1896 0.1896 0
0.0367 0.0367
5.1635 5.1635
<.0001 <.0001
Subjective Norms 0.1732 0.1732 0
0.0373 0.0373
4.6432 4.6432
<.0001 <.0001
Altruism 0.0287 0.0313 -‐0.002592
0.0294 0.0284 0.007593
0.9772 1.1016 -‐0.3414
0.3285 0.2706 0.7328
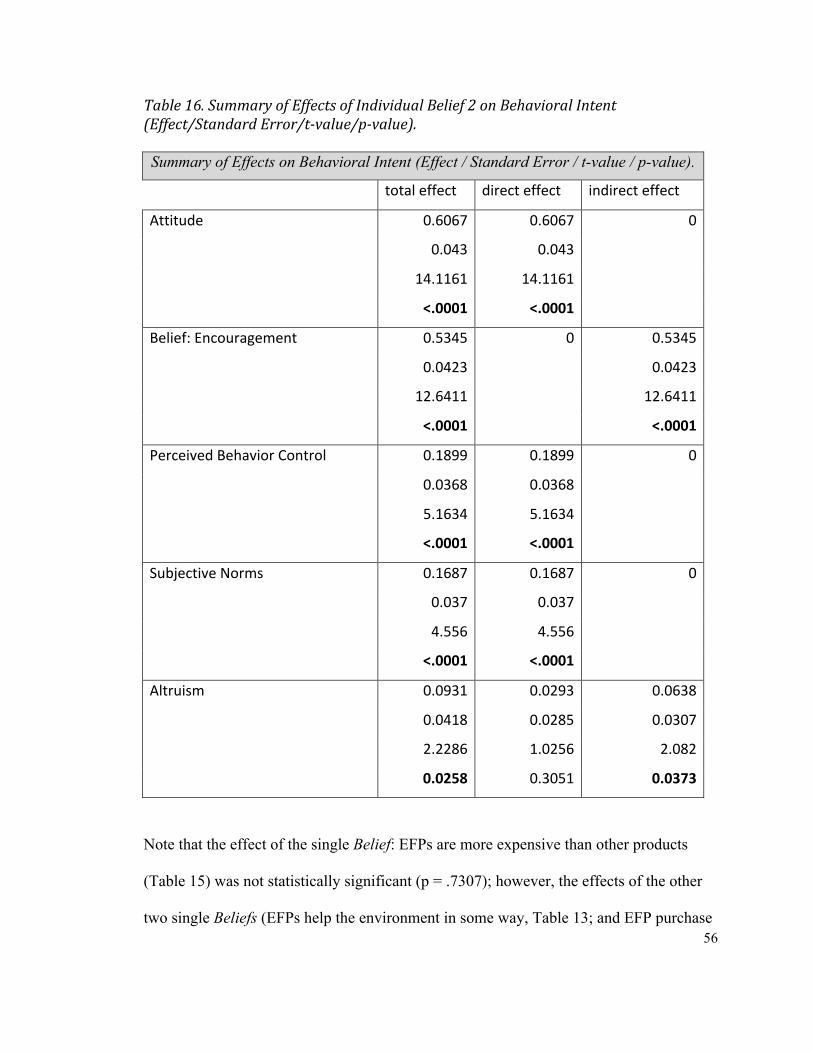
56
Table 16. Summary of Effects of Individual Belief 2 on Behavioral Intent (Effect/Standard Error/t-‐value/p-‐value). Summary of Effects on Behavioral Intent (Effect / Standard Error / t-value / p-value).
total effect direct effect indirect effect
Attitude 0.6067 0.6067 0
0.043 0.043
14.1161 14.1161
<.0001 <.0001
Belief: Encouragement 0.5345 0 0.5345
0.0423 0.0423
12.6411 12.6411
<.0001 <.0001
Perceived Behavior Control 0.1899 0.1899 0
0.0368 0.0368
5.1634 5.1634
<.0001 <.0001
Subjective Norms 0.1687 0.1687 0
0.037 0.037
4.556 4.556
<.0001 <.0001
Altruism 0.0931 0.0293 0.0638
0.0418 0.0285 0.0307
2.2286 1.0256 2.082
0.0258 0.3051 0.0373
Note that the effect of the single Belief: EFPs are more expensive than other products
(Table 15) was not statistically significant (p = .7307); however, the effects of the other
two single Beliefs (EFPs help the environment in some way, Table 13; and EFP purchase

57
is encouraged by those important, Table 16) were statistically significant (p = <.0001).
All other results are consistent with the original path analysis except for the effects of
Altruism on Behavioral Intent. In the analysis that included the single Belief: EFPs are
more expensive than other products, Table 15, neither the direct nor the indirect effects
on Behavioral Intent were statistically significant (p = .2707, p = .7328).
Additional Data Analysis
In addition to the above discussed response variables, demographic information
was also collected from the participants. This demographic data includes Current
Relationship Status, US Region of Residence, Political Views, Ethnicity, Gender, Age,
Household Income, and Level of Education. The purpose of this additional analysis was
to compare each of the response variables across each of the demographic variables to
look for overall trends in green-product-purchasing behavior.
Summaries for each of the demographic variables (Current Relationship Status,
US Region of Residence, Political Views, Ethnicity, Gender, Age, Household Income, and
Education) were created. Then the response variables (Subjective Norm, Attitude,
Perceived Control, Beliefs, Altruism, and Behavioral Intent) were compared across each
of these demographic variables.
After running multiple analyses, it was determined that while there might not be
many momentous differences in the response variables when compared across the
demographic variables, there are a few interesting differences. However, for the most part,
each demographic variable had no more than two response variables on which
participants differed. For example, the current relationship status and ethnicity of a

58
participant were significantly related to only one response variable each (Perceived
Control and Altruism, respectively). However, there were two demographic variables
with significant differences in most of the response variables: Gender and Political Views.
For the response variables compared across gender, the females scored higher
than the males for every response variable (even for those responses in which there was
no statistically-significant difference between the females and the males). Thus females
appear to have a more positive attitude toward green purchase behavior than males, and
appear to have a stronger behavioral intent as related to green purchasing than males.
Overall, there were four response variables where the females scored significantly higher
than the males: Subjective Norm, Attitude, Beliefs, and Behavioral Intent. This may
reflect some kind of general differences between males and females in green purchase
behavior.
The following figures show the significant differences between Gender and four
of the six the response variables (excluding Altruism and Perceived Control). The p-
values indicate that there was a significant difference in the means across gender.
Significant Differences for Subjective Norm
Gender
Overall p-‐value: 0.0115
Gender Count Mean SD Female 164 5.27 1.34 Male 147 4.89 1.35 Level -‐Level Mean Difference p-‐value Female Male 0.37 0.0115
Table 17. Specific p-‐values for Subjective Norm across Gender.
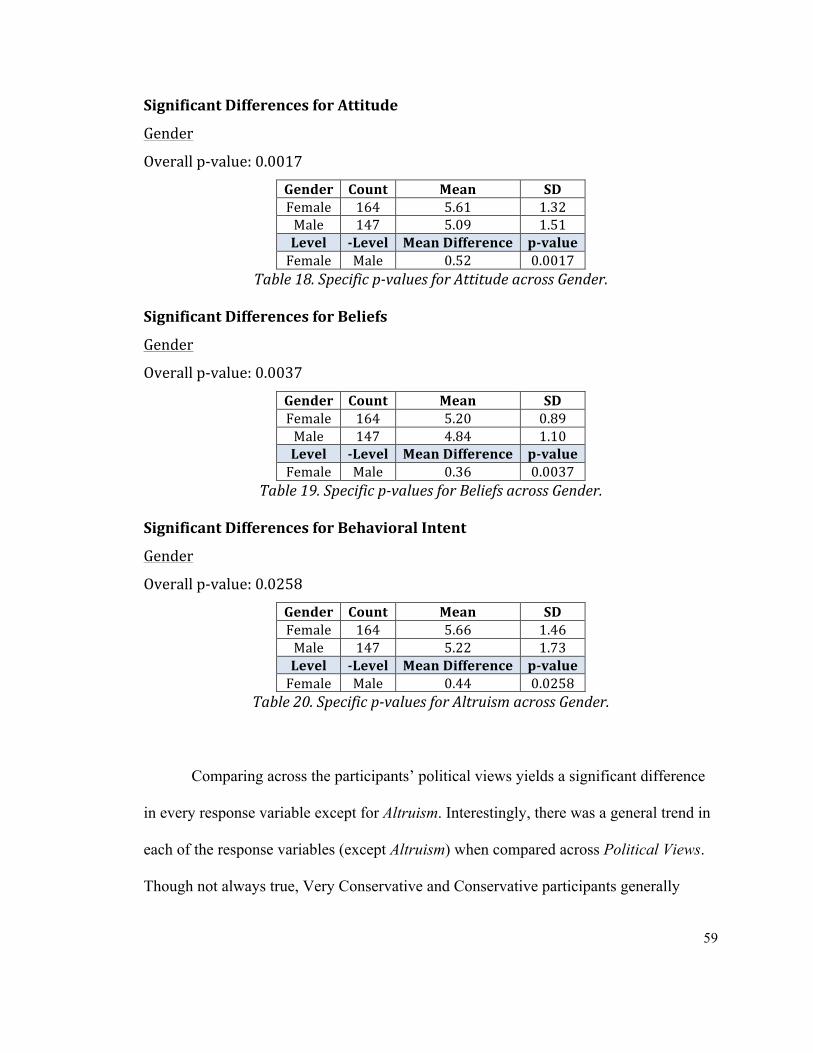
59
Significant Differences for Attitude
Gender
Overall p-‐value: 0.0017
Gender Count Mean SD Female 164 5.61 1.32 Male 147 5.09 1.51 Level -‐Level Mean Difference p-‐value Female Male 0.52 0.0017
Table 18. Specific p-‐values for Attitude across Gender.
Significant Differences for Beliefs
Gender
Overall p-‐value: 0.0037
Gender Count Mean SD Female 164 5.20 0.89 Male 147 4.84 1.10 Level -‐Level Mean Difference p-‐value Female Male 0.36 0.0037
Table 19. Specific p-‐values for Beliefs across Gender.
Significant Differences for Behavioral Intent
Gender
Overall p-‐value: 0.0258
Gender Count Mean SD Female 164 5.66 1.46 Male 147 5.22 1.73 Level -‐Level Mean Difference p-‐value Female Male 0.44 0.0258
Table 20. Specific p-‐values for Altruism across Gender.
Comparing across the participants’ political views yields a significant difference
in every response variable except for Altruism. Interestingly, there was a general trend in
each of the response variables (except Altruism) when compared across Political Views.
Though not always true, Very Conservative and Conservative participants generally

60
scored lower than Moderate participants, who generally scored lower than Liberal and
Very Liberal participants for each response variable. Often, these differences were
statistically significant. This might indicate some kind of difference in political attitudes
toward intent to purchase green products.
The next set of tables show the significant differences between Political View and
five of six the response variables (Altruism excluded). The p-values indicate that there
was a significant difference in the mean across political views. Note that only the
statistically significant pairwise differences are shown. If a pair is not shown in this table
(e.g., there is no row comparing Liberal to Very Liberal), then the average scores for that
pair were not statistically different from each other.
Significant Differences for Subjective Norm
Political Views
Overall p-‐value: 0.0006
Political Views Count Mean SD Very Conservative 21 4.46 1.59 Conservative 60 4.65 1.21 Moderate 105 5.09 1.38 Liberal 64 5.40 1.27
Very Liberal 36 5.66 1.27 Other 22 5.14 1.28 Level -‐Level Mean Difference p-‐value Liberal Conservative 0.75 0.0005
Very Liberal Conservative 1.01 0.0002 Very Liberal Moderate 0.57 0.0295 Very Liberal Very Conservative 1.2 0.0052 Liberal Very Conservative 0.94 00067
Table 21. Specific p-‐values for Subjective Norm across Political Views.

61
Significant Differences for Attitude
Political Views
Overall p-‐value: <0.0001
Political Views Count Mean SD Very Conservative 21 4.06 2.08 Conservative 60 4.84 1.31 Moderate 105 5.42 1.38 Liberal 64 5.94 1.00
Very Liberal 36 5.96 1.09 Other 22 5.20 1.44 Level -‐Level Mean Difference p-‐value Liberal Conservative 1.10 <0.0001
Very Liberal Conservative 1.12 <0.0001 Moderate Conservative 0.59 0.0027 Very Liberal Moderate 0.53 0.0429 Very Liberal Very Conservative 1.90 0.0007 Very Liberal Other 0.76 0.0479 Liberal Other 0.74 0.0456 Liberal Moderate 0.51 0.0303 Liberal Very Conservative 1.88 0.0003 Moderate Very Conservative 1.37 0.0059
Table 22. Specific p-‐values for Attitude across Political Views.
Significant Differences for Perceived Control
Political Views
Overall p-‐value: 0.0009
Political Views Count Mean SD Very Conservative 21 4.58 1.02 Conservative 60 4.52 0.98 Moderate 105 5.02 1.01 Liberal 64 5.15 0.77
Very Liberal 36 5.08 0.85 Other 22 4.73 1.08 Level -‐Level Mean Difference p-‐value Liberal Conservative 0.63 0.0001 Moderate Conservative 0.60 0.0015 Very Liberal Conservative 0.56 0.0039 Liberal Other 0.42 0.0482 Liberal Very Conservative 0.57 0.0154
Table 23. Specific p-‐values for Attitude across Political Views.

62
Significant Differences for Beliefs
Political Views
Overall p-‐value: <0.0001
Political Views Count Mean SD Very Conservative 21 4.02 1.29 Conservative 60 4.80 0.99 Moderate 105 5.06 1.00 Liberal 64 5.44 0.75
Very Liberal 36 5.30 0.85 Other 22 4.89 0.87 Level -‐Level Mean Difference p-‐value Liberal Conservative 0.64 0.0003
Very Liberal Very Conservative 1.28 0.0003 Very Liberal Conservative 0.5 0.0157 Very Liberal Other 0.41 0.0482 Conservative Very Conservative 0.78 0.0166 Liberal Other 0.55 0.0025 Liberal Moderate 0.38 0.0091 Liberal Very Conservative 1.42 <0.0001 Moderate Very Conservative 1.04 0.0010 Table 24. Specific p-‐values for Beliefs across Political Views.
Significant Differences for Behavioral Intent
Political Views
Overall p-‐value: <0.0001
Political Views Count Mean SD Very Conservative 21 4.52 2.19 Conservative 60 4.80 1.61 Moderate 105 5.44 1.57 Liberal 64 6.01 1.24
Very Liberal 36 6.22 1.23 Other 22 5.45 1.34 Level -‐Level Mean Difference p-‐value Liberal Conservative 1.21 <0.0001
Very Liberal Conservative 1.42 <0.0001 Very Liberal Moderate 0.78 0.0038 Moderate Conservative 0.64 0.0064 Very Liberal Very Conservative 1.7 0.0018 Very Liberal Other 0.77 0.0214 Liberal Very Conservative 1.49 0.0043 Liberal Moderate 0.57 0.0181
Table 25. Specific p-‐values for Behavioral Intent across Political Views.

63
As the demographic variables Gender and Political Views each had significant
differences for many of the response variables, it is likely that green purchase behavior is
strongly tied to these two demographic variables.

64
CHAPTER V: CONCLUSION: DISCUSSION, IMPLICATIONS & LIMITATIONS
The purpose of this research study was to explore and further understand the
effects of pro-social marketing, or the incorporation of social issues into product
advertising. More specifically, this project was an investigation of the potential of
altruistic values and beliefs about environmentally friendly products and their impact on
green purchase behavioral intent.
Two research questions and eight hypotheses were addressed and tested in this
research. Discussion, implications and limitations follow.
Elicitation Study Discussion
Stage one of this research project, the elicitation study, addressed the two research
questions: What are the salient beliefs regarding purchasing environmentally friendly
products? And, when it comes to everyday buying behaviors, what role does altruism
play? Several beliefs were identified including that EFPs are better for the environment
than non EFPs, more expensive than non EFPs, better for personal health, better for
future generations, the purchase makes them feel better about themselves, EFPs are not
effective products, and EFPs are not convenient to purchase. The strongest beliefs about
EFPs and those examined further in the main survey were that EFPs are better for the
environment, and that EFPs are expensive. This leads to the following implications:
Implications of the Elicitation Study
The elicitation study revealed several practical implications. First, marketers of
EFPs need to be more aware of pricing—perceived and actual—as it is a major factor
(price of EFPs is perceived as expensive and thus as a disadvantage) in the purchasing
process of EFPs.
65
Second, marketers of EFPs could begin, or continue to, focus on the impact the
purchase of EFPs has on the environment (vs. the purchase of non-EFPs). The sample of
participants in the elicitation study view this benefit as the most valuable when
considering EFP purchases. Marketing communication could focus on this message.
Finally, marketers of EFPs should evaluate the effectiveness of their products as
compared to non-EFPs. Environmentally friendly products need to deliver on their
promises to work as well as if not better than their non-EFP counterparts. Marketing
communication could focus on this message and the effectiveness of their products as
well.
Main Study Discussion
The main study addressed eight research hypotheses:
H1: Altruism predicts beliefs toward green purchase behavior intent. H2: Beliefs predict attitudes toward green purchase behavior intent. H3: Beliefs predict subjective norms regarding green purchase behavior intent. H4: Beliefs predict perceived behavior control regarding green purchase behavior intent. H5: Attitudes toward green purchase behavior predict behavioral intent to purchase environmentally friendly products. H6: Subjective norms regarding green purchase behavior predict behavioral intent to purchase environmentally friendly products. H7: Perceived behavior control regarding green purchase behavior predicts behavioral intent to purchase environmentally friendly products. H8: Altruism predicts green purchase behavior intent.
The first seven hypotheses were supported, however the eighth hypothesis found
partial support. The main study also supports the Theory of Planned Behavior as applied
to purchasing decisions related to environmentally friendly products. There are strong

66
relationships between the studied variables, Attitude, Subjective Norms and Perceived
Behavior Control with Behavioral Intent. These variables also appear to appear to affect
Behavioral Intent.
When it comes to the role of Beliefs in green purchase behavior/behavioral intent,
this study shows that Beliefs about environmentally friendly products play a significant
role, and have a statistically significant effect, on green purchase behavioral intent. In
addition, Attitude toward green purchase behavior has a stronger relationship with green
purchase Behavioral Intent than do Subjective Norms and perceived Behavioral Control
(although all are strong positive correlations). The strength of the relationship between
Beliefs and Attitudes is also worth pointing out, as it is the second strongest relationship
among the six variables.
Although statistically significant, Altruism was found to have a weak relationship
with all of the other variables, and was also found to be a weak predictor (indirectly only)
of green purchase Behavioral Intent. This is an interesting finding as in the elicitation
study, the top advantage to purchasing EFPs reported by participants was that they would
be helping the environment—which would be considered an altruistic motive. Thus the
main study does fall in line with the elicitation study as altruism was found to have
statistical significant relationships with all of the other variables and is also a statistically
significant indirect predictor of behavioral intent, however, the magnitude of these
findings is questionable.
What this means is that consumer beliefs regarding environmentally friendly
products (EFPs) are influential in their decision-making processes related to green
products. This research also shows that Attitude toward green purchase behavior is more

67
influential than Subjective Norm and perceived Behavior Control when it comes to green
purchase Behavioral Intent.
When the specific belief items were analyzed individually and in more detail, it
was found that two of the beliefs (EFPs help the environment in some way, and EFP
purchase is encouraged by those important) are statistically significant predictors of green
purchase behavioral intent, however the third belief (EFPs are more expensive than other
products) was not found to have a statistically significant effect and is thus not a strong
predictor of behavioral intent.
Implications of the Main Study
The findings in this study are adjacent to prior research that supports the Theory
of Planned Behavior in predicting consumer behavior. As expected, attitudes, subjective
norms and perceived behavior control predicted intentions to purchase environmentally
friendly products. The addition of beliefs and altruism into the theoretical model, and
thus the study, show the direct and indirect impact that additional variables (beliefs and
altruism) can play when one considers purchasing EFPs.
This research contributes to the growing literature on TPB, specifically that which
looks at the “green consumer.” In addition, this study reaches beyond previous research
in multiple ways. First, it examines thoughts about advertising and consumer behavior
related to a social issue: sustainability. Second, it considers the role values, specifically
altruism, play in everyday purchasing decisions.
This study also contributes to advertising scholarship in two ways. First, it
attempts to incorporate a value structure into a previously established behavioral theory
(TPB). Also, because this study is uniquely different from traditional advertising, social

68
marketing, public relations and corporate image research, this study has the potential to
advance the scholarship on social effects and social motivations of advertising and
consumers respectively.
In addition to theoretical implications, this research presents some additional
practical implications that those in the fields of advertising, marketing and
communications may find useful. First, marketers of EFPs should focus their marketing
communication messages on beliefs about EFPs, as belief-related messages (such as
messages regarding price, environmental impact, and effectiveness of the products) may
have a strong impact on consumers’ green purchase behavioral intent.
Second, although subjective norms and perceived control also effect green
purchase behavioral intent, marketers of EFPs should consider focusing their marketing
communication messages on attitudes toward EFPs as attitude has the strongest
relationship with behavioral intent. Attitude-related messages, such as those pointing out
that purchasing EFPs is worthwhile, enjoyable or good, will most likely have a strong
positive impact on consumers’ green purchase behavioral intent.
Lastly, this research shows that two demographic variables may be of special
interest to advertisers and marketing communication professionals: gender and political
affiliation. Female consumers and consumers who tend to have somewhat liberal views
appear to have more positive responses to environmentally friendly products than their
counterparts.
Limitations
As with all research, this study has potential limitations. Survey methodology
includes collecting self-reported data, and there is the potential that the data collected and

69
thus analyzed are exaggerated or influenced by various participant biases. Both the
elicitation study and the main study relied on self-reported data. Also, since one
researcher analyzed the data, there is the potential for researcher bias in the analysis of
the qualitative elicitation study data. Lastly, the elicitation survey questions and the main
survey questions were not formally tested for clarity and understanding, thus there is a
chance that the questions were not interpreted as intended, and thus the participant
responses could potentially be misguided.
Lastly, this research assessed behavioral intent rather than behavior. Although
most research that supports the Theory of Planned Behavior measures intent rather than
behavior itself, future research could aim at measuring behavior itself.
Further Research
In addition to obtaining measures of behavior, future research on altruism and
green consumer behavior could focus on additional and/or different potential belief or
value variables. Perhaps altruism is not the right scale or term to use –there may be a
disconnect between helping others and helping the environment—some consumers may
perceive helping the environment as helping themselves (improved personal health),
rather than helping others (aiding in the creation of a sustainable world for future
generations). Making this distinction or clarifying the differences between self help, other
help and/or environmental help may improve understanding of green consumers and the
role their beliefs play in relation to green purchase behavior.
Lastly, due to the findings related to demographic subgroups of participants,
future research could also further examine the relationships between demographic
variables (specifically Gender and Political View) and green purchase behavior. Future
70
research could also identify additional demographic variables, not examined in this study
that might be strongly associated with green purchase behavior.
Overall Conclusion
This study was about altruism and its potential link to the purchase of
environmentally friendly products. It sought answers to the question, “Why do people
buy environmentally friendly products?” Altruism was investigated as a predictor of
green behavioral intent, as were beliefs, attitude, social norm and perceived behavior
control.
In regards to altruism, what this study displayed is that altruism is not a direct
predictor of green purchase behavioral intent, however it was shown to be an indirect
predictor. This could be explained in different ways, first, buying products for oneself
(light bulbs, a car, building materials, organic foods, etc.) may not necessarily be
considered an altruistic act, even when the product of choice is environmentally friendly.
Thus the underlying motivation for purchase, because it is a purchase for one-self, begins
as a self-serving act rather than an other-serving, or altruistic, act. In turn, no matter what
the product, altruism may not be the primary driving force behind the purchase of
personal everyday product. That could explain why there is not a direct link between
altruism and green purchase behavior. Perhaps we need to look beyond the traditional
human-centric definition of altruism.
Second, multiple factors go into purchase decisions. Altruism was indirectly
shown to play a role in the decision making process of purchasing environmentally
friendly products; however, beliefs such as helping the environment, product price and
encouragement from others, contribute to the decision making process, as do attitudes,

71
social norms and perceived behavior control. Altruism alone does not predict green
purchase behavioral intent, however it cannot be ruled out as an influential force in the
process of purchasing environmentally friendly products.
72
Bibliography: Ajzen, I. (1985). From intentions to actions: A theory of planned behavior. In J. Kuhl & J. Beckmann (Eds.), Action control: From cognition to behavior. Berlin, Heidelberg, New York: Springer-Verlag. Ajzen, I. (2002). Constructing a TPB questionnaire: Conceptual and methodological considerations. Retrieved from http://libra.msra.cn/Publication/2887232/constructing-a-tpb-questionnaire-conceptual-and-methodological-considerations Andreoni, J. (1990). Impure Altruism and Donations to Public Goods: A Theory of Warm-Glow Giving. Economic Journal, 100(401), 464-477. Anghelcev, G. & Eighmey, J. (2007). Motivation Crowding: The Hidden Costs of Introducing and Incentive in Advertising to Promote Altruistic Behavior. Proceedings of the Annual Conference of the Association for Education in Journalism and Mass Communication, Washington DC. Banerjee, S., Gulas, C. S., & Iyer, E. (1995). Shades of Green: A Multidimensional Analysis of Environmental Advertising. Journal of Advertising, 24(2), 21-31. Bagozzi, R. P., & Moore, D. J. (1994). Public Service Advertisements: Emotions and Empathy Guide Prosocial Behavior. Journal of Marketing, 58(1), 56-70. Baron, J. (1999). Consumer Attitudes About Personal and Political Action. Journal of Consumer Psychology (Lawrence Erlbaum Associates), 8(3), 261-275. Batson, C. D, (2011). Altruism in Humans. New York: Oxford University Press. Batson, C., O'Quin, K., Fultz, J., Vanderplas, M., & Isen, A. M. (1983). Influence of self-reported distress and empathy on egoistic versus altruistic motivation to help. Journal of Personality And Social Psychology, 45(3), 706-718. Bigné-Alcañiz, E., Currás-Pérez, R., & Sánchez-García, I. (2009). Brand credibility in cause-related marketing: the moderating role of consumer values. Journal of Product & Brand Management, 18(6), 437-447. Briggs, E., Peterson, M., & Gregory, G. (2010). Toward a Better Understanding of Volunteering for Nonprofit Organizations: Explaining Volunteers; Pro-Social Attitudes. Journal of Macromarketing, 30(1), 61-76. Carlson, L., Grove, S. J., & Kangun, N. (1993). A Content Analysis of Environmental Advertising Claims: A Matrix Method Approach. Journal of Advertising, 22(3), 27-39.

73
Chan, R. K. (2000). The effectiveness of environmental advertising: the role of claim type and the source country green image. International Journal of Advertising, 19(3), 349-375. Chen, Y. (2010). The Drivers of Green Brand Equity: Green Brand Image, Green Satisfaction, and Green Trust. Journal of Business Ethics, 93(2), 307-319. Dean, D. (2003). Consumer Perception of Corporate Donations. Journal of Advertising, 32(4), 91-102. Durham, F., & Hancock, S. (2003). Selling the sun: Mediascapes, ideoscapes and the globalized contest over the greening of BP. Conference Papers -- International Communication Association, 1-31. Easterling, D., Kenworthy, A., & Nemzoff, R. (1996). The Greening of Advertising: a twenty-five year look at environmental advertising. Journal Of Marketing Theory & Practice, 4(1), 20. Elliot, S. (2013, February 13). Selling products by selling shared values. New York Times. Retrieved from http://www.nytimes.com/2013/02/14/business/media/panera-to-advertise-its-social-consciousness-advertising.html?pagewanted=all&_r=0 Faseur, T., & Geuens, M. (2010). Communicating the Right Emotion to Generate Help for Connected Versus Unconnected Others. Communication Research, 37(4), 498-521. Ferguson, E., Atsma, F., de Kort, W., & Veldhuizen, I. (2012). Exploring the pattern of blood donor beliefs in first-time, novice, and experienced donors: differentiating reluctant altruism, pure altruism, impure altruism, and warm glow. Transfusion, 52(2), 343-355. Fishbein, M. & Ajzen, I. (1975). Belief, attitude, intention, and behavior: An introduction to theory and research. Reading, MA: Addison-Wesley. Fowler III, A. R., & Close, A. G. (2012). It Ain’t Easy Being Green. Journal of Advertising, 41 (4), 119-132. Fox, K. A., & Kotler, P. (1980). The Marketing of Social Causes: The First 10 Years. Journal of Marketing, 44 (4), 24-33. Grant, A. M., & Gino, F. (2010). A little thanks goes a long way: Explaining why gratitude expressions motivate prosocial behavior. Journal of Personality And Social Psychology, 98(6), 946-955. Grau, S., & Folse, J. (2007). Cause-Related Marketing (CRM). Journal of Advertising, 36(4), 19-33.
74
Hamlin, R. P., & Wilson, T. T. (2004). The Impact of Cause Branding on Consumer Reactions to Products: Does Product/Cause 'Fit' Really Matter?. Journal of Marketing Management, 20(7/8), 663-681. Hansen, A., & Machin, D. (2008). Visually branding the environment: climate change as a marketing opportunity. Discourse Studies, 10(6), 777-794. Hartmann, P., & Apaolaza-Ibáñez, V. (2009). Green advertising revisited. International Journal of Advertising, 28(4), 715-739. Kassarjian, H. H. (1971). Incorporating Ecology into Marketing Strategy: The Case of Air Pollution. Journal of Marketing, 35(3), 61-65. Marta, E., Guglielmetti, C. C., & Pozzi, M. (2006). Volunteerism During Young Adulthood: An Italian Investigation into Motivational Patterns. Voluntas: International Journal Of Voluntary & Nonprofit Organizations, 17(3), 221-232. Massi Lindsey, L. L., Kimo Ah, Y., & Hill, J. B. (2007). Anticipated Guilt as Motivation to Help Unknown Others. Communication Research, 34(4), 468-480. Meister, M., Chamberlai, K., & Brown, A. (2006). CHAPTER FIVE: Rejuvenating Nature in Commercial Culture and the Implications of the Green Commodity Form. In Environmental Communication Yearbook (pp. 97-114). Taylor & Francis Ltd. Montoro-Rios, F., Luque-MartÍnez, T., & RodrÍguez-Molina, M. (2008). How Green Should You Be: Can Environmental Associations Enhance Brand Performance?. Journal of Advertising Research, 48(4), 547-563. Morales, A. C. (2005). Giving Firms an "E" for Effort: Consumer Responses to High-Effort Firms. Journal of Consumer Research, 31(4), 806-812. Mostafa, M. M. (2007). A hierarchical analysis of the green consciousness of the Egyptian consumer. Psychology & Marketing, 24(5), 445-473. Nan, X., & Heo, K. (2007). Consumer responses to corporate social responsibility (CSR) initiatives: Examining the role of brand-cause fit in cause-related marketing. Journal of Advertising, 36(2). 63-74. Newell, S. J., & Goldsmith, R. E. (1998). The Effect of Misleading Environmental Claims on Consumer Perceptions of Advertisements. Journal of Marketing Theory & Practice, 6(2), 48. Paul, E. F., Miller, F. D., & Paul, J. (1993). Altruism. Cambridge [England] ; New York, NY, USA: Cambridge University Press.

75
Rehberg, W. (2005). Altruistic Individualists: Motivations for International Volunteering Among Young Adults in Switzerland. Voluntas: International Journal of Voluntary & Nonprofit Organizations, 16(2), 109-122. Rushton, J. P., Chrisjohn, R. D., & Fekken, G. C. (1981). The Altruistic Personality and the Self-Report Altruism Scale. Personality and Individual Differences. 2(4), 293-302. Scammon, D. L., & Mayer, R. N. (1995). Agency Review of Environmental Marketing Claims: Case-by-Case Decomposition of the Issues. Journal of Advertising, 24(2), 33-43. Schultz, E. J., Neff, J., & Pollack, J. (2010). Purpose-driven marketing all the rage at ANA. (cover story). Advertising Age, 81(37), 1-22. Smerecnik, K. R., & Renegar, V. R. (2010). Capitalistic Agency: The Rhetoric of BP's Helios Power Campaign. Environmental Communication, 4(2), 152-171. Spears, N., & Germain, R. (2007). A Note on Green Sentiments and the Human-Animal Relationship in Print Advertising During the 20th Century. Journal of Current Issues & Research in Advertising, 29(2), 53-62. Stafford, M., Stafford, T. F., & Chowdhury, J. (1996). Predispositions Toward Green Issues: The Potential Efficacy of Advertising Appeals. Journal of Current Issues & Research in Advertising, 18(1), 67. Treadwell, D. (2014). Introducing communication research: Paths of inquiry. (2nd ed.). Los Angeles: Sage. Tukey, J. W. (1962). The future of data analysis. Annals of Mathematical Statistics, 33, 1-67. Tukey, J. W. (1986). The collected works of John W. Tukey, Vols III and IV. Belmont, CA: Wadsworth and Brooks/Cole. Webb, D. J., & Mohr, L. A. (1998). A Typology of Consumer Responses to Cause-Related Marketing: From Skeptics to Socially Concerned. Journal of Public Policy & Marketing, 17(2), 226-238. Youn, S., & Kim, H. (2008). Antecedents of Consumer Attitudes toward Cause-Related Marketing. Journal of Advertising Research, 48(1), 123-137.