the role of black soldier fly, hermetia illucens (l
TRANSCRIPT
University of Windsor University of Windsor
Scholarship at UWindsor Scholarship at UWindsor
Electronic Theses and Dissertations Theses, Dissertations, and Major Papers
2012
The Role of Black Soldier Fly, Hermetia illucens (L.) (Diptera: The Role of Black Soldier Fly, Hermetia illucens (L.) (Diptera:
Stratiomyidae) in Sustainable Waste Management in Northern Stratiomyidae) in Sustainable Waste Management in Northern
Climates Climates
Luis Alvarez University of Windsor
Follow this and additional works at: https://scholar.uwindsor.ca/etd
Recommended Citation Recommended Citation Alvarez, Luis, "The Role of Black Soldier Fly, Hermetia illucens (L.) (Diptera: Stratiomyidae) in Sustainable Waste Management in Northern Climates" (2012). Electronic Theses and Dissertations. 402. https://scholar.uwindsor.ca/etd/402
This online database contains the full-text of PhD dissertations and Masters’ theses of University of Windsor students from 1954 forward. These documents are made available for personal study and research purposes only, in accordance with the Canadian Copyright Act and the Creative Commons license—CC BY-NC-ND (Attribution, Non-Commercial, No Derivative Works). Under this license, works must always be attributed to the copyright holder (original author), cannot be used for any commercial purposes, and may not be altered. Any other use would require the permission of the copyright holder. Students may inquire about withdrawing their dissertation and/or thesis from this database. For additional inquiries, please contact the repository administrator via email ([email protected]) or by telephone at 519-253-3000ext. 3208.
The Role of Black Soldier Fly, Hermetia illucens (L.) (Diptera: Stratiomyidae) in Sustainable Waste Management in Northern
Climates
by
Luis Alvarez M.A.Sc., P.Eng.
A Dissertation Submitted to the Faculty of Graduate Studies through Civil and Environmental Engineering in Partial Fulfillment of the Requirements for the Degree of Doctor of Philosophy at the
University of Windsor
Windsor, Ontario, Canada
2012
© 2012 Luis Alvarez
The Role of Black Soldier Fly, Hermetia illucens (L.) (Diptera: Stratiomyidae) in Sustainable Waste Management in Northern Climates
by
Luis Alvarez
APPROVED BY:
__________________________________________________
Dr. Jeff Tomberlin, External Examiner Texas A&M University
__________________________________________________
Dr. Sherah VanLaerhoven Department of Biological Sciences
__________________________________________________
Dr. Paul Henshaw Department of Civil and Environmental Engineering
__________________________________________________
Dr. Rajesh Seth Department of Civil and Environmental Engineering
__________________________________________________
Dr. Edwin Tam, Advisor Department of Civil and Environmental Engineering

Author’s Declaration of Originality
I hereby certify that I am the sole author of this thesis and that no part of this thesis has
been previously published or submitted for publication.
I certify that, to the best of my knowledge, my thesis does not infringe upon anyone’s
copyright nor violate any proprietary rights and that any ideas, techniques, quotations,
or any other material from the work of other people included in my thesis, published or
otherwise, are fully acknowledged in accordance with standard referencing practices.
Furthermore, to the extent that I have included copyrighted material that surpasses the
bounds of fair dealing within the meaning of the Canada Copyright Act, I certify that I
have obtained a written permission from the copyright owner(s) to include such
material(s) in my thesis and have included copies of such copyright clearances in the
appendices section.
I declare that this is a true copy of my thesis, including any final revisions, as approved
by my thesis committee and the Graduate Studies office, and that this thesis has not
been submitted for a higher degree to any other University or Institution.
iii

Abstract
This research assessed the feasibility of using Black Soldier Fly, Hermetia illucens, in cold
weather climates to manage organic wastes. The goal was to determine if the flies
could be kept alive year round in a controlled facility when exterior conditions turned
inhospitable. A proof‐of‐concept experiment was undertaken by constructing a small
research facility in Windsor, Ontario, Canada at the Essex Windsor Solid Waste
Authority’s Landfill Site inside two greenhouses. Although the data collected were
highly variable, the experimental trials demonstrated that the design process was
successful overall: Hermetia illucens can be propagated successfully in controlled
environments in cold weather conditions.
Key design parameters were investigated, including the waste consumption rate per
maggot per day and the waste application rate. These parameters where then used as a
basis for the design of a prototype waste processing facility utilizing BSF as the
treatment method. A mass balance of the relevant flows and a life cycle inventory was
conducted as precursors to future life cycle assessments of this process.
A limited cost assessment was included to determine the economic feasibility of
operating a BSF waste processing facility year‐round in winter climates. The cost
analysis revealed that the current design, under research conditions, could be
economically viable and improvements to the process are necessary. These
improvements include the more efficient use of electricity, water, natural gas and three
dimensional waste processing via the use of aeration to the food pile.
iv
Acknowledgements
Where to begin? Well let’s start with Dr. Edwin Tam whose support made this whole
project possible (mad props to you Doc) and Dr. Sherah VanLaerhoven for her advice
and humour. The generous cooperation of the EWSWA by providing the location and
facility resources for this project, most notably Ralph Reiser and Dan Van Horn who
provided all manner of technical assistance and support with site issues.
Thank you to all the staff at the restaurant that had the pleasure of collecting the waste
for me to pick up every week.
To my colleagues who got suckered into going out to the research site to help me collect
samples and revise my designs; Ashley Summerfield your help during the initial
construction phase was a huge timer saver. Jennifer Rosati, your help and advice was
very much appreciated, not sure what I would have done without your fly whispering
abilities. Cassandra Brait, thanks for all the help counting and sorting those pesky
maggots. Ghada Aljannati, thank you for your help during those hot summer months
when the greenhouse felt like a tropical jungle. Mirna Jajo, thank you for helping during
the construction process at the University’s greenhouse.
A heartfelt wave of gratitude and appreciation is extended to my co‐researcher and
friend Trinh Nguyen (bmosi). You were always there when I needed you, even though I
had to trick you into helping me occasionally. Thanks for the lunches and the smells, I
think it’s your turn to buy! There is nothing quite like enjoying lunch while ruining it for
others at the restaurant with our smells. Here is the start of our friendship, on paper,
for the select few who have to read it.
Thanks to my wife Jen for her patience, understanding, patience (did I mention that
already?) and all my other friends who put up with the smells on my clothing after I got
back from the landfill site.
End Communication…
v
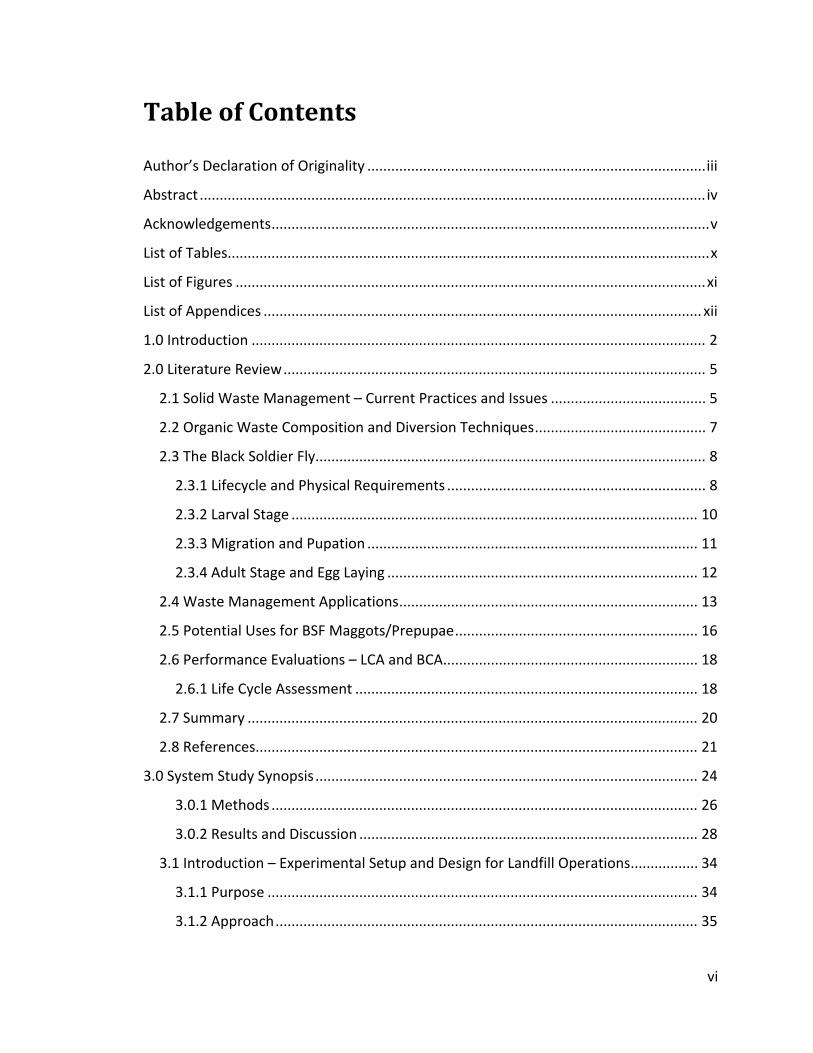
Table of Contents
Author’s Declaration of Originality ..................................................................................... iii
Abstract ............................................................................................................................... iv
Acknowledgements .............................................................................................................. v
List of Tables......................................................................................................................... x
List of Figures ...................................................................................................................... xi
List of Appendices .............................................................................................................. xii
1.0 Introduction .................................................................................................................. 2
2.0 Literature Review .......................................................................................................... 5
2.1 Solid Waste Management – Current Practices and Issues ....................................... 5
2.2 Organic Waste Composition and Diversion Techniques ........................................... 7
2.3 The Black Soldier Fly.................................................................................................. 8
2.3.1 Lifecycle and Physical Requirements ................................................................. 8
2.3.2 Larval Stage ...................................................................................................... 10
2.3.3 Migration and Pupation ................................................................................... 11
2.3.4 Adult Stage and Egg Laying .............................................................................. 12
2.4 Waste Management Applications ........................................................................... 13
2.5 Potential Uses for BSF Maggots/Prepupae ............................................................. 16
2.6 Performance Evaluations – LCA and BCA ................................................................ 18
2.6.1 Life Cycle Assessment ...................................................................................... 18
2.7 Summary ................................................................................................................. 20
2.8 References ............................................................................................................... 21
3.0 System Study Synopsis ................................................................................................ 24
3.0.1 Methods ........................................................................................................... 26
3.0.2 Results and Discussion ..................................................................................... 28
3.1 Introduction – Experimental Setup and Design for Landfill Operations ................. 34
3.1.1 Purpose ............................................................................................................ 34
3.1.2 Approach .......................................................................................................... 35
vi
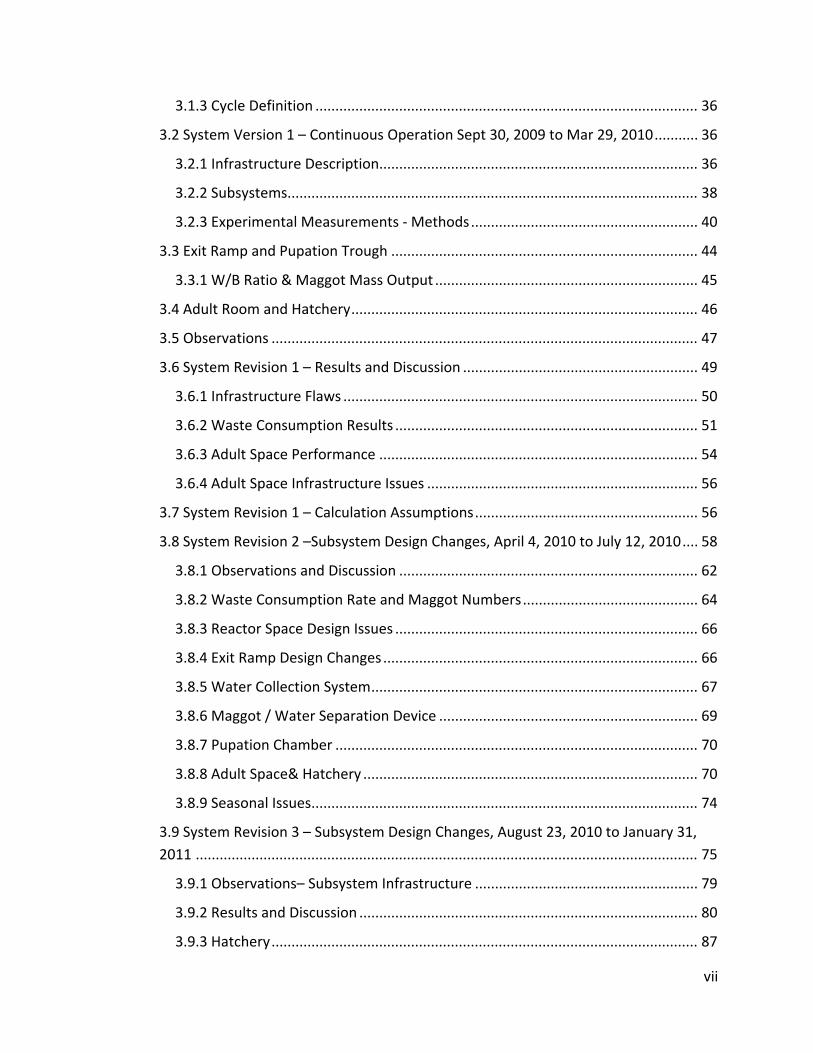
3.1.3 Cycle Definition ................................................................................................ 36
3.2 System Version 1 – Continuous Operation Sept 30, 2009 to Mar 29, 2010 ........... 36
3.2.1 Infrastructure Description................................................................................ 36
3.2.2 Subsystems ....................................................................................................... 38
3.2.3 Experimental Measurements ‐ Methods ......................................................... 40
3.3 Exit Ramp and Pupation Trough ............................................................................. 44
3.3.1 W/B Ratio & Maggot Mass Output .................................................................. 45
3.4 Adult Room and Hatchery ....................................................................................... 46
3.5 Observations ........................................................................................................... 47
3.6 System Revision 1 – Results and Discussion ........................................................... 49
3.6.1 Infrastructure Flaws ......................................................................................... 50
3.6.2 Waste Consumption Results ............................................................................ 51
3.6.3 Adult Space Performance ................................................................................ 54
3.6.4 Adult Space Infrastructure Issues .................................................................... 56
3.7 System Revision 1 – Calculation Assumptions ........................................................ 56
3.8 System Revision 2 –Subsystem Design Changes, April 4, 2010 to July 12, 2010 .... 58
3.8.1 Observations and Discussion ........................................................................... 62
3.8.2 Waste Consumption Rate and Maggot Numbers ............................................ 64
3.8.3 Reactor Space Design Issues ............................................................................ 66
3.8.4 Exit Ramp Design Changes ............................................................................... 66
3.8.5 Water Collection System .................................................................................. 67
3.8.6 Maggot / Water Separation Device ................................................................. 69
3.8.7 Pupation Chamber ........................................................................................... 70
3.8.8 Adult Space& Hatchery .................................................................................... 70
3.8.9 Seasonal Issues ................................................................................................. 74
3.9 System Revision 3 – Subsystem Design Changes, August 23, 2010 to January 31, 2011 .............................................................................................................................. 75
3.9.1 Observations– Subsystem Infrastructure ........................................................ 79
3.9.2 Results and Discussion ..................................................................................... 80
3.9.3 Hatchery ........................................................................................................... 87
vii

3.10 Major Operational Issues ...................................................................................... 88
3.11 Design Changes and Preparation for Batch Operations ....................................... 90
4.0 Batch Operations ........................................................................................................ 93
4.1 Methods .................................................................................................................. 93
4.2 Observations ........................................................................................................... 94
4.3 Results and Discussion ............................................................................................ 95
4.3.1 Reactor Space ................................................................................................... 96
4.3.2 Adult Space ...................................................................................................... 99
5.0 Overall System Evaluation ........................................................................................ 104
5.1 Reactor Space ........................................................................................................ 104
5.1.1 Average Daily Dry Waste Consumption Rate and Waste Loading Rate ........ 108
5.2 Adult Space and Hatchery ..................................................................................... 110
5.3 Continuous versus Batch Operations .................................................................... 113
5.4 Conceptual Facility Design .................................................................................... 113
5.4.1 Design Case 1 – Use of an Existing Building ................................................... 115
5.4.2 Design Case 2 – No Existing Building ............................................................. 119
5.5 Error Propagation .................................................................................................. 120
5.6 Data Variability ...................................................................................................... 121
6.0 Life Cycle Inventory and Cost Assessment ................................................................ 123
6.1 Scope ..................................................................................................................... 123
6.2 Prediction of Potential Impacts ............................................................................ 124
6.3 Resource Use ......................................................................................................... 125
6.4 Life Cycle Inventory ............................................................................................... 125
6.5 Routine Maintenance ........................................................................................... 131
6.6 LCI Metrics ............................................................................................................. 133
6.7 Example Design, EWSWA Projected Waste Tonnage 2012 .................................. 136
6.7.1 Suggested Facility Improvements .................................................................. 142
6.8 Example Design, EWSWA Projected Waste Tonnage 2012 Using Modified Data 144
7.0 Conclusions, Recommendations and Areas for Further Research ........................... 149
viii
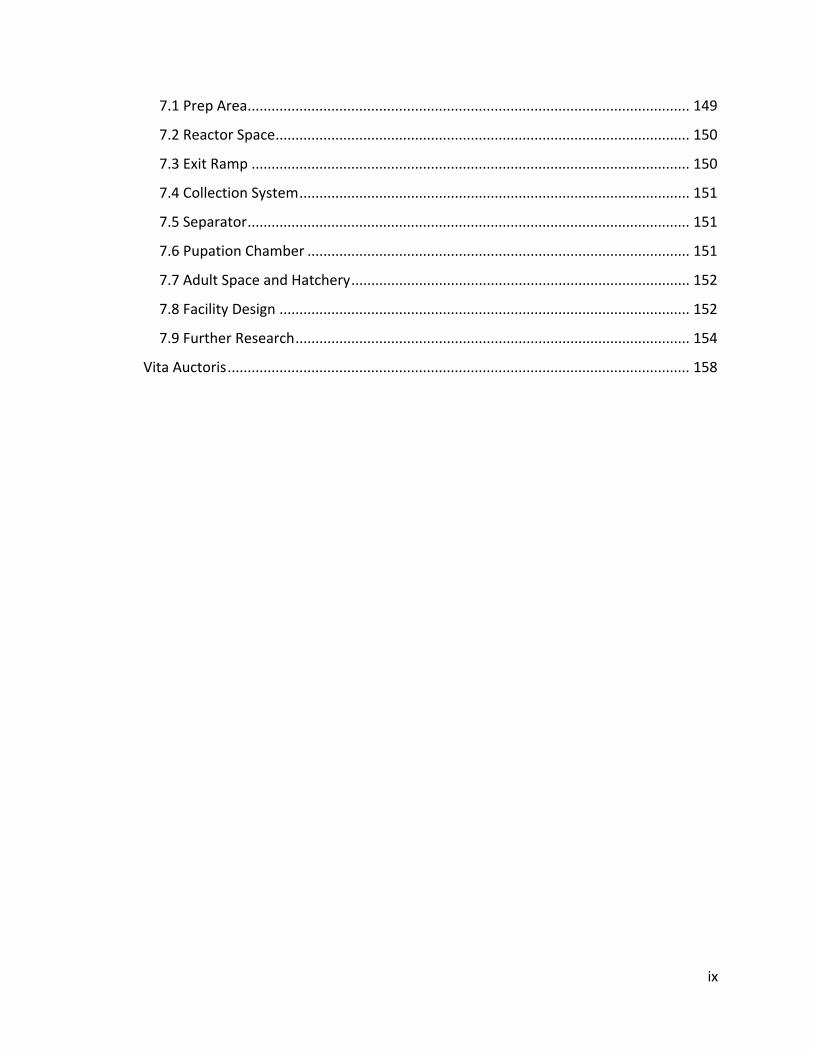
7.1 Prep Area ............................................................................................................... 149
7.2 Reactor Space ........................................................................................................ 150
7.3 Exit Ramp .............................................................................................................. 150
7.4 Collection System .................................................................................................. 151
7.5 Separator ............................................................................................................... 151
7.6 Pupation Chamber ................................................................................................ 151
7.7 Adult Space and Hatchery ..................................................................................... 152
7.8 Facility Design ....................................................................................................... 152
7.9 Further Research ................................................................................................... 154
Vita Auctoris .................................................................................................................... 158
ix
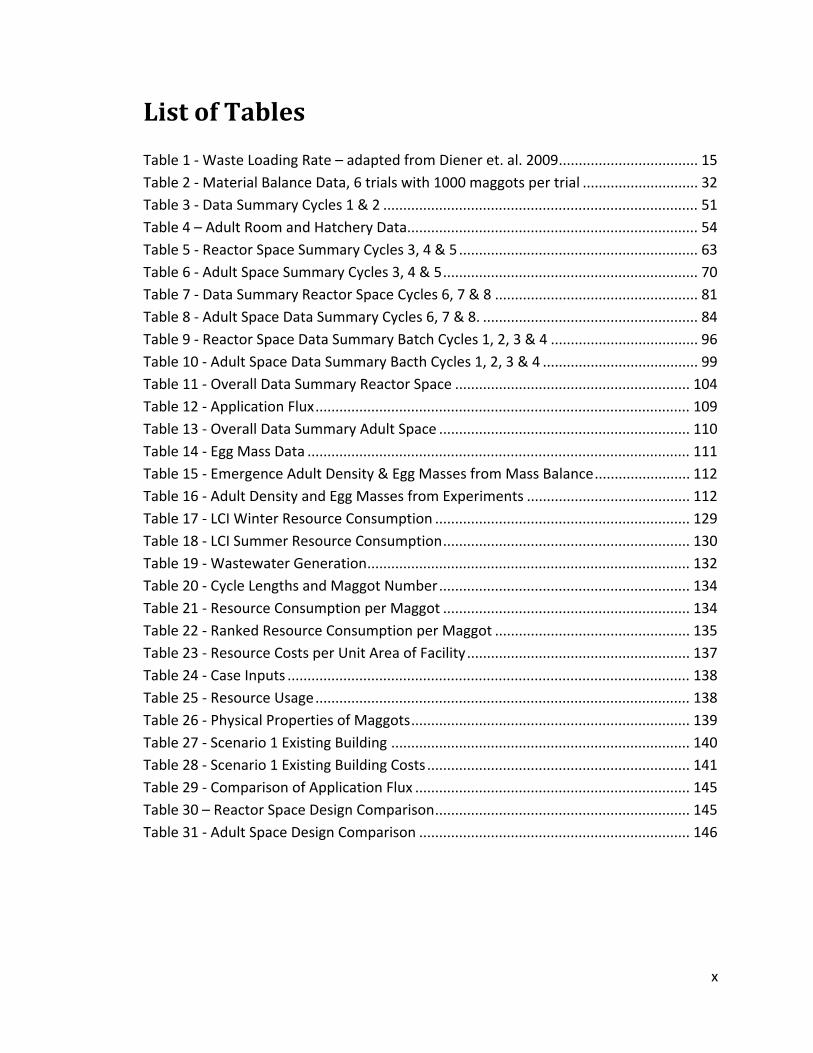
List of Tables
Table 1 ‐ Waste Loading Rate – adapted from Diener et. al. 2009 ................................... 15 Table 2 ‐ Material Balance Data, 6 trials with 1000 maggots per trial ............................. 32 Table 3 ‐ Data Summary Cycles 1 & 2 ............................................................................... 51 Table 4 – Adult Room and Hatchery Data......................................................................... 54 Table 5 ‐ Reactor Space Summary Cycles 3, 4 & 5 ............................................................ 63 Table 6 ‐ Adult Space Summary Cycles 3, 4 & 5 ................................................................ 70 Table 7 ‐ Data Summary Reactor Space Cycles 6, 7 & 8 ................................................... 81 Table 8 ‐ Adult Space Data Summary Cycles 6, 7 & 8. ...................................................... 84 Table 9 ‐ Reactor Space Data Summary Batch Cycles 1, 2, 3 & 4 ..................................... 96 Table 10 ‐ Adult Space Data Summary Bacth Cycles 1, 2, 3 & 4 ....................................... 99 Table 11 ‐ Overall Data Summary Reactor Space ........................................................... 104 Table 12 ‐ Application Flux .............................................................................................. 109 Table 13 ‐ Overall Data Summary Adult Space ............................................................... 110 Table 14 ‐ Egg Mass Data ................................................................................................ 111 Table 15 ‐ Emergence Adult Density & Egg Masses from Mass Balance ........................ 112 Table 16 ‐ Adult Density and Egg Masses from Experiments ......................................... 112 Table 17 ‐ LCI Winter Resource Consumption ................................................................ 129 Table 18 ‐ LCI Summer Resource Consumption .............................................................. 130 Table 19 ‐ Wastewater Generation ................................................................................. 132 Table 20 ‐ Cycle Lengths and Maggot Number ............................................................... 134 Table 21 ‐ Resource Consumption per Maggot .............................................................. 134 Table 22 ‐ Ranked Resource Consumption per Maggot ................................................. 135 Table 23 ‐ Resource Costs per Unit Area of Facility ........................................................ 137 Table 24 ‐ Case Inputs ..................................................................................................... 138 Table 25 ‐ Resource Usage .............................................................................................. 138 Table 26 ‐ Physical Properties of Maggots ...................................................................... 139 Table 27 ‐ Scenario 1 Existing Building ........................................................................... 140 Table 28 ‐ Scenario 1 Existing Building Costs .................................................................. 141 Table 29 ‐ Comparison of Application Flux ..................................................................... 145 Table 30 – Reactor Space Design Comparison ................................................................ 145 Table 31 ‐ Adult Space Design Comparison .................................................................... 146
x
List of Figures
Figure 1 – BSF Life Cycle ...................................................................................................... 9 Figure 2 ‐ Research Methodology Flowchart .................................................................... 26 Figure 3 – Dry Material Balance ........................................................................................ 29 Figure 4 ‐ Water Balance ................................................................................................... 30 Figure 5 ‐ Inner Greenhouse Layout ................................................................................. 38 Figure 6 ‐ Cross Sectional View of Trickling Filter Operation ............................................ 49 Figure 7 A & B ‐ Preferential Feeding Position .................................................................. 50 Figure 8 ‐ Waste Consumption Rate Cycles 1 & 2. ............................................................ 52 Figure 9 – Maggot Numbers and Cycle Length ................................................................. 53 Figure 10 ‐ BSF Movement in the System ......................................................................... 59 Figure 11 ‐ Water Collection System ................................................................................ 60 Figure 12 ‐ Separator Revision 1 ....................................................................................... 61 Figure 13 ‐ Waste Consumption Rate ............................................................................... 64 Figure 14 ‐ Estimated Maggot Number ............................................................................ 65 Figure 15 ‐ Exit Ramp Before and After Addition of Fins .................................................. 67 Figure 16 ‐ Adult Room Temperatures, Cycles 3, 4 & 5 .................................................... 72 Figure 17 ‐ Adult Room Relative Humidity, Cycles 3, 4 & 5 .............................................. 72 Figure 18 ‐ Unfavourable Egg Laying Sites in Hatchery .................................................... 74 Figure 19 A & B ‐ Hatchery Second Revision ..................................................................... 78 Figure 20 A & B ‐ Separator Second Revision ................................................................... 78 Figure 21 ‐ Separator Final Revision ................................................................................. 80 Figure 22 ‐ Waste Consumption Rate ............................................................................... 82 Figure 23 ‐ Estimated Maggot Numbers ........................................................................... 83 Figure 24 ‐ Internal and External Photon Flux .................................................................. 86 Figure 25 ‐ Proximity of Framing to Egg Flutes ................................................................. 87 Figure 26 ‐ Hatchery with Hanging Basket ........................................................................ 88 Figure 27 ‐ Batch Waste Consumption Rates ................................................................... 97 Figure 28 ‐ Estimated Maggot Number Batch Operations ............................................... 98 Figure 29 ‐ Temperatures Batch Cycles 1 & 2. ................................................................ 101 Figure 30 ‐ Temperature Batch Cycles 3 & 4. ................................................................. 101 Figure 31 ‐ Estimated Maggot Number Graphs Overlapped .......................................... 106 Figure 32 ‐ Estimated Maggot Number in Consecutive Order. ...................................... 107 Figure 33 ‐ Adult Density vs. Collected Egg Mass ........................................................... 117 Figure 34 ‐ LCI Process Material Flows ........................................................................... 131 Figure 35 ‐ Proposed Layout for Reactor Vessels & Adult Space.................................... 143
xi
xii
List of Appendices
Appendix A – Process Mass Balance Data
Appendix B – Experimental Raw Data Set
Appendix C – Calculated Reactor Space Data
Appendix D – Moisture Sample Data
Appendix E – Calculated Adult Room Data
Appendix F – Hatchery Data
Appendix G – Light Level Data
Appendix H – Data Summary
Appendix I – Maggot and Adult Body Measurement Data
Appendix J – Operational Device Timing Assumptions
Appendix K – Electricity and Water Use Calculations
Appendix L – Life Cycle Inventory Data
Appendix M – Modified Data Set Summary

Chapter 1 ‐ Introduction
1
1.0 Introduction
The push for sustainability has produced many changes to common industrial and
commercial processes. Private and public sectors alike have revised production policies
to include environmental considerations, which in turn affect the manufacture,
distribution and disposal of goods and services. Similarly, solid waste management has
also undergone policy and technological changes to use contemporary scientific
knowledge to achieve sustainability.
In this research, Hermetia illucens (L.) (Diptera: Stratiomyidae) or the Black Solider Fly
(BSF) is used as a waste management tool in a similar fashion to vermicomposting.
There are significant additional benefits: BSF can process a wider variety of organic
wastes and the larva are considered useful as a feed source for animals. BSF could also
provide potential chemical precursors to producing biodiesel (Zheng et. al. 2012). BSF
have been utilized for waste management purposes in lower latitudes where
temperatures and sunlight are well suited for the propagation of the species year‐round.
In those studies, the BSF appear well suited to process organic materials. In colder
climates the temperature daylight requirements are either not obtainable or are
significantly reduced.
The location for this research was at Essex County, Ontario, Canada approximately 300
km south of the BSF’s northern limit in their normal, outdoor environments. Although
BSF thrive in the summer, winter temperatures will kill them so they must leave, find
shelter during winter months or re‐colonize every spring. Maintaining a colony in such
inhospitable conditions would require infrastructure to ensure that environmental
variables remain within tolerable levels. This research will determine if a controlled
environment can successfully propagate the species at higher latitudes, and if so, how to
conceptually design a waste system that uses BSF effectively. In addition, it will lay the
groundwork for a sustainability assessment of the process and a comparison to current
waste disposal practices for organic wastes.
2

In cooperation with the Essex Windsor Solid Waste Authority (EWSWA) and the
University of Windsor’s Biological Sciences department, a research facility and necessary
infrastructure have been sourced, designed and constructed at the regional landfill to
house and propagate BSF in a northern climate. It is the aim of this research to:
1. Explore the feasibility of using BSF to process organic wastes in cold climates;
2. Design a proof‐of‐concept system that can propagate the BSF in a contained
environment in unfavourable climates;
3. Quantify material flows using a Life Cycle Inventory (LCI) and explore the
potential for revenue from this process; and
4. Determine a relationship of the parameters that would affect the transition from
the existing prototype to a full‐scale facility capable of processing commercial or
industrial quantities of organic waste from restaurants or food processing
industries.
3

Chapter 2 – Literature Review
4

2.0 Literature Review
2.1 Solid Waste Management – Current Practices and Issues
Solid waste management has evolved considerably since the beginning practices of open
dumping and burning. Current waste management practices include reduction, reuse,
recycling and composting. The preceding however, are not final disposal methods; in
waste management, landfilling and incineration are the most common final disposal
methods (EPA 2008). The increasing societal demands for resource efficiency and
sustainability have also produced new but not yet mainstream alternatives including
pyrolysis and plasma gasification. The landfill remains the most common final disposal
approach for non‐hazardous, non‐industrial waste – or common municipal solid waste
(MSW).
Americans generated approximately 249.6 million tonnes (mt) of MSW in 2008 (EPA
2008). Recycling and composting diverted 82.9 mt of waste from permanent disposal,
while combustion with energy recovery treated 31.6 mt of waste. The remaining 135.1
mt was delivered to landfills for final disposal. Canadian waste production totaled 34 mt
in 2008 (Statistics Canada 2008). North American MSW in 2008 consisted of organic
waste (food scraps 12.7%, wood 6.6% and yard trimmings 13.2%), paper & paper
products 31%, glass 4.9%, metals 8.4%, plastics and textiles 7.9% (EPA 2008). Although
landfills are the most common final disposal method for MSW, they can continue to
pose technical, environmental and societal issues.
A modern landfill system consists of waste cells, each containing a liner to prevent
leachate migration into the surrounding groundwater, a collection system for leachate,
and landfill gas, monitoring equipment and, upon reaching capacity, a top capping layer
to prevent infiltration. Cracks and leaks can sometimes form in the upper and lower
liners, allowing for infiltration of water and the release of contaminants into the
surrounding groundwater – improper construction hastens this scenario. Leachate
5
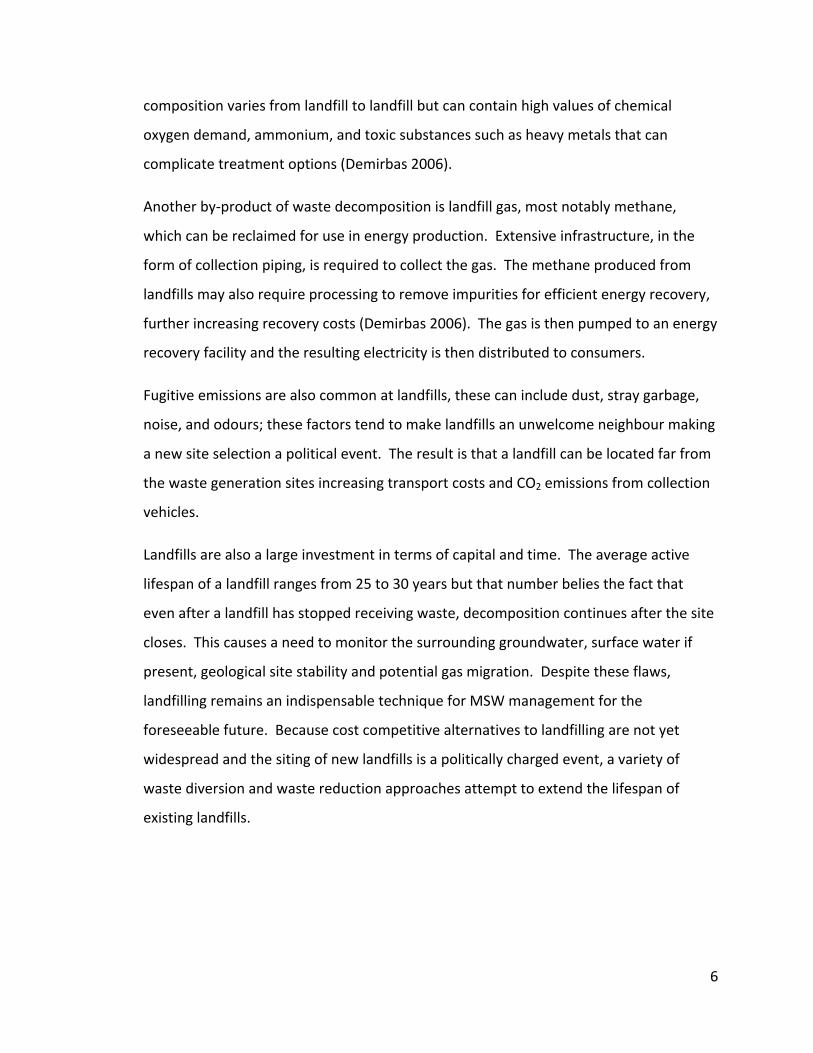
composition varies from landfill to landfill but can contain high values of chemical
oxygen demand, ammonium, and toxic substances such as heavy metals that can
complicate treatment options (Demirbas 2006).
Another by‐product of waste decomposition is landfill gas, most notably methane,
which can be reclaimed for use in energy production. Extensive infrastructure, in the
form of collection piping, is required to collect the gas. The methane produced from
landfills may also require processing to remove impurities for efficient energy recovery,
further increasing recovery costs (Demirbas 2006). The gas is then pumped to an energy
recovery facility and the resulting electricity is then distributed to consumers.
Fugitive emissions are also common at landfills, these can include dust, stray garbage,
noise, and odours; these factors tend to make landfills an unwelcome neighbour making
a new site selection a political event. The result is that a landfill can be located far from
the waste generation sites increasing transport costs and CO2 emissions from collection
vehicles.
Landfills are also a large investment in terms of capital and time. The average active
lifespan of a landfill ranges from 25 to 30 years but that number belies the fact that
even after a landfill has stopped receiving waste, decomposition continues after the site
closes. This causes a need to monitor the surrounding groundwater, surface water if
present, geological site stability and potential gas migration. Despite these flaws,
landfilling remains an indispensable technique for MSW management for the
foreseeable future. Because cost competitive alternatives to landfilling are not yet
widespread and the siting of new landfills is a politically charged event, a variety of
waste diversion and waste reduction approaches attempt to extend the lifespan of
existing landfills.
6
2.2 Organic Waste Composition and Diversion Techniques
In 2008 the most abundant component of MSW in the United States was the organic
fraction consisting of food scraps, yard trimmings and wood (EPA 2008). These organic
components represent a large amount of stored chemical energy, and mainly
responsible for the production of biogas and leachate. Instead, if this portion of the
waste stream could be partially or fully diverted from landfills and put to use on a
significantly shorter time scale, landfill life spans could be increased and pollution issues
stemming from leachate and gas production could be reduced.
Current diversion programs include the reduction of resource consumption, the reuse
and recycling of a resource, and the composting of organics. The composting process
plays the largest role in diverting organics from a landfill but it is limited; it cannot easily
accept animal protein based wastes, it must be kept aerobic through manual or
mechanical mixing, and nutrient ratios must be planned and maintained for a successful
run. Composting diverted approximately 22.1 mt from landfills in 2008 (EPA 2008).
The time required to produce finished compost is highly variable and depends on the
composition of the starting material, aeration frequency, proper nutrient ratios,
moisture content and temperature. Finished compost can be obtained in as little as one
week in mechanical composting operation to as long as six months in a static pile. In
addition, the composting end product’s uses are limited mainly to soil amending and
erosion control applications. In an effort to overcome some of the limitations of
traditional composting, organisms have been introduced into the compost pile. The
most common adaptation is vermicomposting in which a worm species, such as the red
wiggler (Eisena foetida or Eisena andrei), is added to the compost. The worm digests
the wastes and produces castings; the castings are nutrient rich and can be used as a
fertilizer or soil conditioner (Mitchell 1997).
7

2.3 The Black Soldier Fly
Another potential useful species is the black soldier fly (BSF), Hermetia illucens. It is
considered a non‐pest species native to North and South America ranging from 40
degrees north to 40 degrees south (McCallan 1974). The species is not considered a
disease vector or a nuisance to humans (Furman et. al. 1959); however there have been
reported cases of intestinal myiasis in humans (Lee et. al. 1995). Myiasis is the parasitic
consumption of tissue by fly (Diptera: two‐winged) larvae. These reports appear limited
to cases where infection occurred in equatorial zones. The likelihood of disease transfer
from BSF to humans in a waste management facility is not known, but with the use of
adequate personal protective equipment, the incidence of such transfer is not expected
to be significantly worse than current disease vectors present at a landfill.
The adult flies are not believed to congregate around human residences as a disease
spreading organism (Furman et. al. 1959). This is mostly likely because studies suggest
that the flies do not need to consume food during the adult phase of their life cycle
(Sheppard et. al. 2002, Furman et. al. 1959) and this significantly reduces the
opportunity to spread disease. Instead, the adults are pre‐occupied with mating,
egg‐laying and when necessary, acquiring water.
2.3.1 Lifecycle and Physical Requirements
The BSF has five stages in its lifecycle: egg, larvae, prepupal, pupae and adult. These are
shown in Figure 1.
8
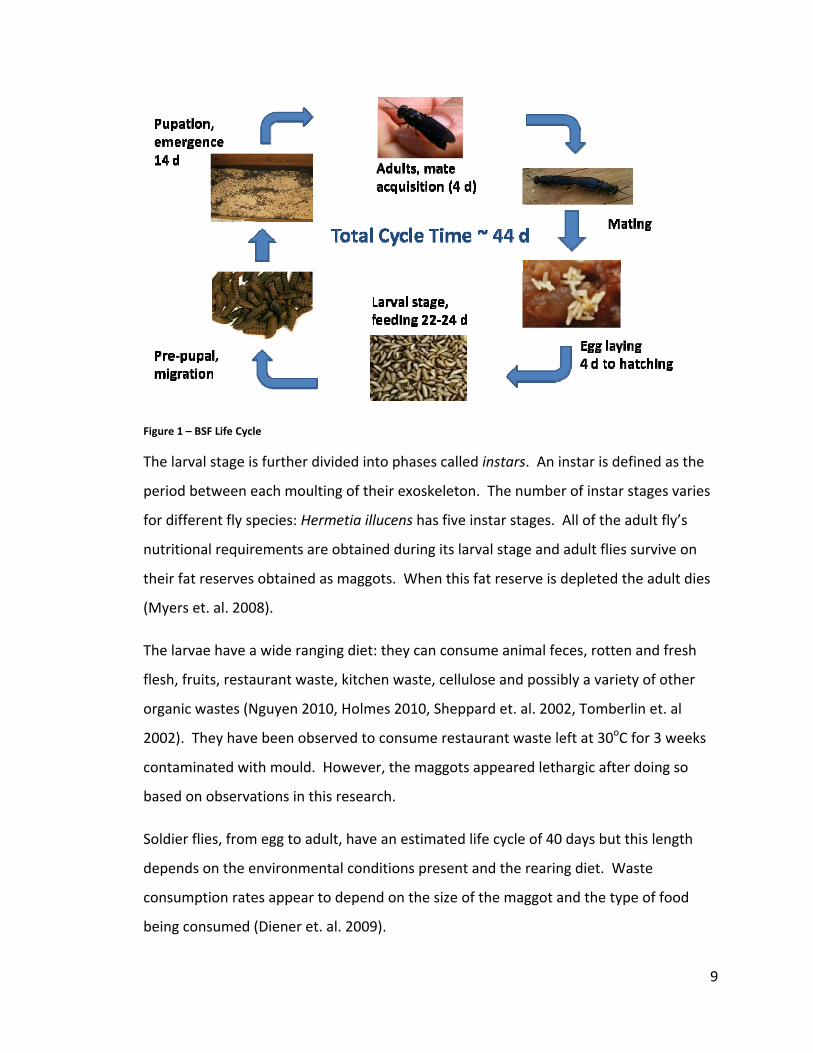
Figure 1 – BSF Life Cycle
The larval stage is further divided into phases called instars. An instar is defined as the
period between each moulting of their exoskeleton. The number of instar stages varies
for different fly species: Hermetia illucens has five instar stages. All of the adult fly’s
nutritional requirements are obtained during its larval stage and adult flies survive on
their fat reserves obtained as maggots. When this fat reserve is depleted the adult dies
(Myers et. al. 2008).
The larvae have a wide ranging diet: they can consume animal feces, rotten and fresh
flesh, fruits, restaurant waste, kitchen waste, cellulose and possibly a variety of other
organic wastes (Nguyen 2010, Holmes 2010, Sheppard et. al. 2002, Tomberlin et. al
2002). They have been observed to consume restaurant waste left at 30oC for 3 weeks
contaminated with mould. However, the maggots appeared lethargic after doing so
based on observations in this research.
Soldier flies, from egg to adult, have an estimated life cycle of 40 days but this length
depends on the environmental conditions present and the rearing diet. Waste
consumption rates appear to depend on the size of the maggot and the type of food
being consumed (Diener et. al. 2009).
9
2.3.2 Larval Stage
Immediately after hatching the new nymphs seek a food source and begin to feed. The
maggots do not sleep but they do not consume waste continuously. Optimal moisture
content for the feed ranges from 60% to 90% (Myers et. al. 2008). Optimal
temperatures for efficient food processing range from 27 to 33oC (Sheppard et. al.
2002). Lower temperatures are most likely tolerable because the maggots generate
heat as they consume food through their writhing motions. The maggots secrete
enzymes that make the food digestible prior to ingestion by liquefying the waste as they
consume it. The moisture content of the resource is important as it affects BSF
development. Moisture contents outside the optimum range will cause adverse effects.
Too much moisture will force the maggots leave the food/resource matrix they are
feeding in; and not enough will prevent efficient consumption (Fatchurochim et al.
1989). However, these moisture circumstances can be exploited to engineer a BSF
waste management system: the moisture preferences of the larvae could provide a
simple method to control and direct the maggot’s location in the system.
• The feeding site can be kept moist, and a path to a drier area (pupation medium)
can be provided to encourage migration to the desired location; and
• The development rate can be controlled, if required, by modifying the moisture
content in the resource.
It also appears that soldier fly maggots secret chemicals that warn other fly species that
a food source colonized by soldier fly maggots is not an ideal egg laying site leading to
effective reductions of the common housefly (Bradley and Sheppard 1983).
The nutrition source used in the larval stage can also affect adult fly characteristics
(Tomberlin et. al. 2002). Thus in a full scale waste processing facility the nutritional
content of the incoming waste stream may need to be monitored to ensure that the
larvae are eating a balanced diet. This would be important because the facility would
require healthy adults to maintain egg production at required levels.
10
2.3.3 Migration and Pupation
Prior to reaching the pupation stage the larva will leave the feeding site to find an
adequate pupation site. Once the larvae have consumed enough food they begin to
migrate away from the food source (Sheppard et. al. 1994). If the maggots that are
ready to pupate can be directed to a location selected by a human operator, then the
pupae are effectively harvesting themselves. The maggots have entered a wandering
stage searching for a drier and darker location than the feeding site to continue their life
cycle. Successfully exploiting this instinct means that no additional effort is necessary to
remove them from the feeding site. Maggots have been shown to migrate considerable
distances in order to find an adequate pupation site.
The maggots will also change colour, a circumstance that could be exploited to further
sort them for quality purposes. However, the maggots are accomplished burrowers and
can enter small spaces and crevices with ease and when they are wet they can attach
themselves to a wide variety of surfaces including plastics, wood, rubber and metals.
This can pose problems trying to contain them in specific feeding areas.
The time spent by each maggot in the migration stage varies but appears to be
dependent on the maggot’s ability to locate an ideal pupation site. A study suggested
that the maggots favour drier conditions for a pupation site but require ambient
humidity levels of approximately 60% to emerge as adults (Holmes 2010, Sheppard et.
al. 2002). Migrating maggots are suspected of leaving chemical trails that other
maggots follow creating a migration path.
Another characteristic of an ideal pupation site is protection from predators and
unfavourable environmental conditions, such as flooding. The pupation media itself
should be porous and loose to allow for easy burrowing of wandering maggots. A
medium with these properties should also provide adequate oxygen levels so the pupae
can breathe. If the pupation medium is too fine the spiracles, or breathing structures,
can become clogged possibly resulting in death.
11
The depth of the pupation medium is also important. If it is too deep, the emerging flies
will fail to reach the surface. If it is too shallow, the maggot may not deem the location
adequate and continue to wander, wasting its fat reserves thereby reducing its harvest
value or its chance to successfully mate. Wandering maggots have been shown to
pupate without a pupation medium if no suitable medium is present (Holmes 2010).
Studies have shown the ideal depth for a pupation medium is 15 to 20 centimeters.
Pupation can last five to seven days depending on temperature and ambient humidity.
2.3.4 Adult Stage and Egg Laying
Mating typically occurs two days after emergence from the pupal stage to the adult
stage. Temperature and ambient light levels are important in order for the flies to
initiate mating. An unpublished study by Zhang et. al. (circa 2009) reported that a
minimum irradiance of 70 micromoles/m2/s is necessary to achieve mating; the peak
numbers of mating pairs were observed at 100 micromoles/m2/s. Other literature
sources suggest an irradiance of over 200 micromoles/m2/s is optimal (Sheppard et. al.
2002). These figures have been disputed by an unpublished source to be much higher,
possibly in excess of 500 micromoles/m2/s. There is limited data available on what
specific wavelength or ranges of wavelengths are responsible for the initiation of mating
and what time exposure is necessary. All of the studies reviewed showed that mating
levels of adults were highest under natural sunlight: the use of artificial lighting should
therefore be considered supplemental when natural sunlight exposure is not adequate.
BSF mating begins in the air with aerial questing after stimulation by light (Furman et. al
1959). Aerial questing is thought to be an important aspect of the mating process, and
any facility should have enough air volume to facilitate this event; however, no
recommendation on volume and adult fly densities were found in the literature. Egg
laying usually occurs two days after mating. Females seek out an area that is close to a
food source to deposit their fertilized eggs. The mechanism for this action is believed to
be the detection of volatile chemicals from rotting wastes (Sheppard et. al. 2002).
12
Females will also leave chemical markers that attract other females to a suitable egg
laying site. Females prefer not to lay eggs directly on a food source but near it.
The ideal egg laying site should be maintained at 27oC with an ambient relative humidity
of 60% or more: at these conditions egg hatching rates of 80% or more have been
observed (Holmes 2010, Sheppard et. al. 2002).
In the majority of the studies reviewed where BSF colonies were reared, the egg laying
and waste processing activities were conducted in separate locations. Eggs were
collected in the corrugations of cardboard, or flutes, and then transferred to the testing
apparatus. This is done because eggs are fragile, small and vulnerable to changes to
environmental variables; the flutes provided protection for eggs and encouraged the
female’s ovipositor to lay eggs in the confined space. In a waste management facility, it
would be preferable to automate or remove the need for egg handling.
2.4 Waste Management Applications
The use of BSF for waste management is not new. BSF maggots have been used in
agricultural settings to stabilize problematic wastes including, swine, bovine and poultry
manures in climates that sustain BSF year round: these settings include a large chicken
farm house, pig farms and cow farms (Sheppard and Newton 1994; Axtell 1999). The
BSF’s ability to digest other wastes including the organic portions of MSW, wastewater
treatment sludge and fish rendering wastes has been studied by other researchers.
However, there are significant questions, such as: what are the optimum feed rates?
This question is actually quite complex: the optimum applied rate depends on the food
source and the age of the maggots because BSF maggots consume different wastes at
different rates at different instar phases.
In a study conducted by Nguyen (2010), five different diets, fish renderings, liver, fruits
and vegetables, poultry feed and restaurant wastes were fed to different maggot
groups. Each diet was shown to have a different waste consumption rate and the rate
increased as the maggots increased in size.
13
Diener et. al. (2009) studied the consumption rates of various organic municipal solid
wastes. Their goal was to determine the maximum amount of waste (dry mass) that BSF
maggots could process in a day while maximizing dry biomass production. Two‐
hundred, six day old larvae were fed differing rates of various wastes. Quantitative
nutritional aspects were based on the terminology outlined in Slansky and Scriber
(1981). The following quantities were defined by Slansky and Scriber:
• B – the biomass that was gained (measured by Diener et. al. as the increase in
pupae mass);
• I – the total food offered;
• F – the residue leftover in the containers (includes undigested food and
excrement);
• M – the ingested food that was incorporated into biomass (calculated by mass
balance in Diener et. al. (2009));
• AD – how much of the ingested food is digested; and
• ECD – how efficiently digested food is converted to biomass.
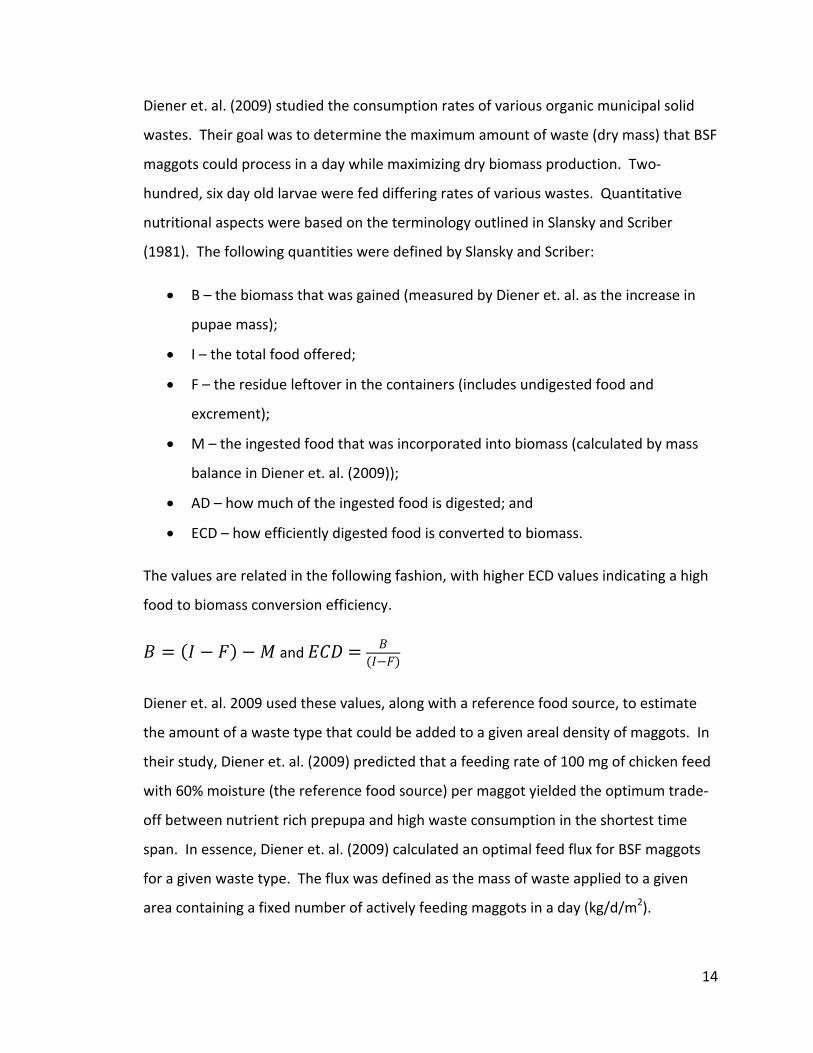
The values are related in the following fashion, with higher ECD values indicating a high
i ncy. food to biomass conversion eff cie
and
Diener et. al. 2009 used these values, along with a reference food source, to estimate
the amount of a waste type that could be added to a given areal density of maggots. In
their study, Diener et. al. (2009) predicted that a feeding rate of 100 mg of chicken feed
with 60% moisture (the reference food source) per maggot yielded the optimum trade‐
off between nutrient rich prepupa and high waste consumption in the shortest time
span. In essence, Diener et. al. (2009) calculated an optimal feed flux for BSF maggots
for a given waste type. The flux was defined as the mass of waste applied to a given
area containing a fixed number of actively feeding maggots in a day (kg/d/m2).
14

The actual calculations used to obtain the conversions were not described in the paper
and the results obtained depend on a variety of factors including the fiber content of
feed, moisture content of feed and ambient temperature. Diener et. al. (2009) did not
calculate the AD variable in their study (as suggested by Slansky and Scriber (1981))
which may have affected the accuracy of their estimates; nevertheless, the projected
conversion rates for additional waste types serve as useful starting points for operating
a waste processing facility using BSF maggots.
The estimates proposed by Diener et. al. (2009) are listed below for various feed
sources. The table assumes a maggot density of 5 larvae/cm2 but does not mention the
age of the maggots.
Table 1 ‐ Waste Loading Rate – adapted from Diener et. al. 2009
Waste Type Daily Feeding
Rate (mg/larva/day)
Waste Loading Rate (kg/d/m2)
Chicken Feed 100 5.00Kitchen Waste 61 3.05Vegetable Waste 98 4.90Green Banana 103 5.15Pig Manure 158 7.90Poultry Manure 175 8.75Human Faeces 130 6.50
In a study conducted by Sheppard (1994) BSF maggots were used to stabilize the
manure of approximately 460 cage hens. The maggots were able to convert chicken
manure into a feedstuff, larval mass, containing 42% protein and 35% fats. House fly
breeding was eliminated and manure mass was reduced by 50%.
In another study conducted by Myers et. al. (2008), BSF maggots were used to stabilize
dairy manure in a controlled laboratory setting. BSF larvae were fed four different rates
of manure to assess their development. Interestingly, the feed rate affected the
development of the larvae: the larvae that received less manure did not weigh as much
15

as their overfed counterparts and the adults of the underfed larva lived three to four
days less. However, the larvae that were fed less manure turned out to be more
efficient at reducing manure dry matter.
Myers et. al. (2008) observed that larvae fed 27 g of manure daily reduced dry matter by
58% whereas the other test subjects, receiving 70 g of manure per day, reduced dry
matter by only 33%. There was also a higher incidence of mortality (29%) among larvae
that were fed 70 g of manure when compared to the test groups fed 27 g and 54 g
(<20%). Myers et. al. (2008) also found that the phosphorus content of the manure was
reduced by 61% to 70%, and the nitrogen content was reduced by 30% to 50%
respectively, across all treatments.
In all of the reviewed studies, BSF maggots were shown to have significant beneficial
effects towards reducing dry waste mass further substantiating BSF’s potential as a
waste management agent.
2.5 Potential Uses for BSF Maggots/Prepupae
In addition to being voracious consumers of organic wastes, BSF maggots contain useful
organic compounds that have commercial and industrial value: these include1:
• 42.1% Crude protein
• 34.8% Lipids
• 7.0% Crude fibre
• 7.9% Moisture
• 1.4% Nitrogen free extract (NFE)
• 14.6% Ash
• 5.0% Calcium
• 1.5% Phosphorus
1Hhttp://www.esrint.com/pages/bioconversion.htmlH; Based on a diet of “fresh restaurant food waste”
16
The larval excretions and pupae casings can be used as a replacement for peat moss but
unlike peat moss, the casings and excretions could easily be renewable resources. The
maggots have been used as a substitute for dairy, swine and poultry feeds. In this role
the BSF maggots both stabilize problematic wastes and create a value‐added agricultural
product.
The maggots have also been fed to aquaculture systems – an industry facing a potential
shortfall of feed protein. Global aquaculture systems produced 45% of all the seafood
consumed in the world in 2007 and their production is expected to increase to 75% in
the next twenty years (Papadoyianis 2007). In order to maintain this growth, fishmeal
production must increase accordingly. However fishmeal is not only used to supply the
aquaculture industry but other animal husbandry industries as well. Cattle, poultry,
swine and mink producers all use fishmeal as the primary protein source for their animal
diets (Papadoyianis 2007).
Eighty percent of the world’s fishmeal supply is produced by 10 countries and 3 of these
countries are net importers of fishmeal. Twenty‐five percent of the global fish
production is used to produce fishmeal and fish oil. Because the production of fish is
geographically isolated, every tonne of fishmeal is transported an average of 5000 km
before reaching the consumer (Papadoyianis 2007). In addition, world fish stocks are in
decline. All of these circumstances could contribute to a shortage of fishmeal that
would inhibit the growth of the aquaculture industry. The nutritional makeup of BSF
maggots could allow them to provide an alternate protein source for animal husbandry
industries (Papadoyianis 2007).
BSF maggots have the ability to incorporate fats from their diet into their chemical
composition. In a study conducted by St. Hilliare in 2007, BSF maggots were used to
stabilize cow manure. The maggots were to be used as a feed for a trout aquaculture
industry. BSF maggots are low in omega‐3 and omega‐6 fatty acids but when the
manure feed was combined with fish offal from a rendering plant, the BSF’s omega‐3
17

and omega‐6 fatty acid content increased (St. Hilliare 2007). This suggests that BSF
larvae can be customized to provide a nutritional profile to suit a specific dietary need.
The potential benefits of mass production of BSF maggots for use as a waste
management agent and protein source have been illustrated in several studies. Most of
these studies occurred in lower latitude areas with above freezing temperatures year
round. BSF stabilization of waste appears to be a useful approach in these regions.
However, with even more northerly communities facing increasing solid waste
management challenges, could a BSF waste management facility operate at northern
latitudes where unfavourable environmental conditions exist for a majority of the year?
Although these limitations could be overcome with the use of technology, it is unknown
if this process would be a notable improvement over current waste management
practices. The literature to date does not compare BSF oriented alternatives against
other waste management practices.
2.6 Performance Evaluations – LCA and BCA
Alternatives can be compared to each other using techniques such as a life cycle
assessment (LCA) and a benefit cost analysis (BCA). Each approach delivers different
information and has differing scopes. For the purposes of this research the established
BSF production facility will be evaluated using the LCA and BCA approaches.
2.6.1 Life Cycle Assessment
The LCA approach was developed as an analytical tool to assess the environmental
impacts from products, processes, policies or services. The development of the
methodology began in the USA in the 1960’s to early 1970’s (Hauschild et. al. 2005).
The original studies focused on the environmental impacts from different types of
beverage containers (Hauschild et. al. 2005). In the 1990’s four standards were
developed for LCA and its main phases: they were issued by the international standards
organization (ISO) under the ISO‐14000 series of standards for environmental
18
management (Hauschild et. al. 2005). The harmonization provided by the ISO standards
increased the credibility of results enabling the widespread use of LCA in industrialized
countries in Europe, North America and Asia.
The LCA approach typically consists of the following stages (Hauschild et. al. 2005):
• Goals and scope definition;
• Life Cycle Inventory;
• Life Cycle Impact Assessment; and
• Interpretation and Corrective measures.
The LCA is performed as an iterative process and it is possible that each stage maybe
revised several times before the LCA is completed. With each iteration the uncertainty
in the assessment is typically reduced. The process is considered complete when the
uncertainty is reduced to a level where the initial questions posed in the goals and scope
definition stage can be adequately answered. This does not imply that the assessment
is all‐encompassing, only that the questions posed at the beginning can be reasonably
answered. The LCA approach will be used to determine the environmental impact of a
BSF facility operating in cold climates.
To assess the economic viability of the proposed system, a BCA will be conducted to
compare it against alternative disposal options for organic wastes, specifically landfilling
and composting. The methodology outlined in the Canadian Cost‐Benefit Analysis Guide
2007 will be followed as applicable. The results of the BCA will be used to determine
the economic feasibility of the BSF waste processing system in northern climates. The
combination of the LCA and BCA approaches will provide a reasonable comparison of
the BSF waste processing system’s performance when compared against existing
disposal options.
19
2.7 Summary
Hermetia illucens larvae are voracious consumers of organic matter and data indicate
that dry waste reduction values are in the vicinity of 50%, depending on the waste. The
digested waste residue from BSF larvae has been used as a replacement for compost
and has sufficient nutrients levels for use as a fertilizer and a soil amendment. The
maggots themselves are suitable substitute for feed in animal husbandry operations.
BSF have been used in waste reduction facilities in warm climates to successfully
consume organic wastes and as a feedstock. Waste consumption rates vary by waste
type, moisture content, number of maggots present, size of the maggots present and
temperature. Maggots will actively leave the feeding site and change colour when
nutritional requirements have been met so that they harvest themselves. Year round
cold weather operations were not encountered in the literature.
Successful mating by adult flies seems to depend on several factors, the intensity of light
present, the length of exposure to the light, and most likely different wavelength ranges
from the electromagnetic spectrum. Adult densities in the mating space may also play a
role. A suitable egg laying site must protect the eggs from desiccation.
To preserve the continuous nature of the BSF life cycle, the infrastructure subsystems
must be linked to the proceeding and preceding life stages while maintaining optimal
ambient conditions. Optimal ambient conditions for all life stages range from 27oC to
33oC and at least 60% relative humidity. A minimum light intensity of 100 µmol/m2/s is
required to initiate mating in adults.
It is the intent of this research to design infrastructure to propagate the species
Hermetia illucens year round in cold climates by designing subsystems to contain life
cycle stages, outline a facility design based on the waste consumption rate of the
maggots and lay the groundwork for a sustainability assessment of the facility.
20
2.8 References
Axtell, R.C., 1999. Poultry integrated pest management: status and future. Integrated Pest Management Reviews 4: p 53‐73.
Ayers, R.U., 1998. Ecology vs. Economics: Confusing production and consumption. Center of the Management of Environmental Resources, INSEAD. Fontainebleau, France.
Bradley, S.W. and. Sheppard, D.C., 1983. Housefly oviposition inhibition by larvae of Hermetia illucens, the black soldier fly. Journal of Chemical Ecology 10 (6): p 853‐859.
Cleveland, C.J. et. al., 2000. Aggregation and the role of energy in the economy. Ecol. Econ. 32: p 301‐317.
Demirbas, A., 2006. Biogas production from the organic fraction of municipal solid waste. Energy Sources, Part A (28): p 1127‐1134, Taylor and Francis
Diener, S. et. al., 2009. Conversion of organic material by black soldier fly larvae: establishing optimal feeding rates. Waste Management and Research 27: p 603‐610.
EPA 2008. Municipal Solid Waste Generation, Recycling and Disposal in the United States: Facts and Figures for 2008. http://www.epa.gov/wastes/nonhaz/municipal/msw99.htm accessed 28/09/2010.
Fatchurochim et. al., 1989. Filth fly (Diptera) oviposition and larval development in poultry manure of various moisture levels. J. Entomol. Sci. 24 (2): p 224‐231.
Furman et. al., 1959. Hermetia illucens (Linnaeus) as a factor in the natural control of Musca domestica Linnaeus. J. Econ. Entomol., 52: p 917‐921.
Hauschild, M. et. al., 2005. From life cycle assessment to sustainable production: status and perspectives. CIRP Annals – Manufacturing Technology. 54 (2): p 1‐21.
Lee, H.L. et. al., 1995. A case of human enteric myiasis due to larvae of Hermetia illucens (Family: Stratomyiadae): first report in Malaysia. Malays. J. Pathol. 17: p 109‐111.
Leslie Holmes. Role of Abiotic Factors on the Development and Life History of the Black Soldier Fly, Hermetia illucens (L.) (Diptera: Stratiomyidae). Masters thesis 2010 University of Windsor, ON, Canada
Mansson, B.A. and McGlade, J.M., 1993. Ecology, thermodynamics and H.T. Odum’s conjectures. Oecologia 93: p 582‐596.
McCallan, E., 1974. Hermetia illucens (L.) (Diptera: Stratiomyidae), a cosmopolitan American species long established in Australia and New Zealand. Entomol. Mo. Mag. 109: p 232‐234.
21
Mitchell, A., 1997. Production of Eisenia fetida and vermicompost from feed‐lot cattle manure. Soil Biol. Biochem. (29) No. 3/4: p 763‐766.
Myers, H.M. et. al., 2008. Development of black soldier fly (Diptera: Stratiomyidae) larvae fed dairy manure. Environ. Entomol. Sci. 37 (1): p 11‐15.
Nguyen T., 2010. Influence and Diet on Black Soldier Fly (Hermetia illucens Linnaeus) (Diptera: Stratiomyidae) Life History Traits. Masters Thesis. University of Windsor, ON, Canada
Papadoyianis E.D., 2007. Insects offer a promising solution to the protein bottleneck. Feed Technology Update 2 (6).
Sheppard et. al., 2002. Rearing methods for the black soldier fly (Diptera: Stratomyiadae) in a colony. J. Med. Entomol. 39: p 695‐698.
Sheppard, D.C. et. al., 1994. A value added manure management system using the black soldier fly. Biosource Technology 50: p 275‐279
Slansky, F. and Scriber, J.M., 1982. Selected bibliography and summary of quantitative food utilization by immature insects. Entomological Society of America Bulletin. 28 (1): p 43‐55.
St‐Hilliare, S., et.al., 2007. Fish offal recycling by the black soldier fly produces a foodstuff high in omega‐3 fatty acids. J. World Aquac. Soc. 38(2): p 309‐313.
Statistics Canada 2008. Waste Management Industry Survey: Business and Government Sectors. http://www.statcan.gc.ca catalogue# 16F0023X. Accessed 21/01/2011.
Tomberlin, J.K. et. al., 2002. Selected life‐history traits of black soldier flies (Diptera: Stratiomyidae) reared on three artificial diets. Annals of the Entomological Society of America, 95: p 379‐386.
Tomberlin J.K. and Sheppard D.C., 2001. Lekking behaviour of the black soldier fly (Diptera: Stratiomyidae). Florida Entomologist Vol. 84 (4).
Treasury Board of Canada Secretariat 2007. Canadian Cost‐Benefit Analysis Guide.http://www.tbs‐sct.gc.ca/ri‐qr/documents/gl‐ld/analys/analystb‐eng.asp Accessed 5/2/2011.
Zhang J. et. al., Date unknown (circa 2009). An artificial light source influences mating and oviposition of black soldier flies (Diptera: Stratiomyidae). Unpublished. State Key Laboratory of Agricultural Microbiology, National Engineering Research Center of Microbial Pesticides, Huazhong Agricultural University, Wuhan, China.
Zheng et. al. 2012. Double the biodiesel yield: Rearing black soldier fly larvae, Hermetia illucens, on solid residual fraction of restaurant waste after grease extraction for biodiesel production. Renewable Energy Vol 41. p: 75‐79.
22

Chapter 3 – Mass Balances
23
3.0 System Study Synopsis
The approach and methods used in this research involved a number of iterative steps
and experiments in order to establish a basic understanding of what was involved in
developing a proof‐of‐concept BSF‐based waste management facility. This section
provides a brief synopsis of the major phases of the research to help clarify what was
done.
During the early stages of the research, the investigation focus was on developing the
conceptual design and constructing a working model as a basis to establish a colony.
After start‐up problems were addressed and a colony could be maintained, the next
step was to develop an approach to determine system parameters that could serve as
the foundation for the design of future systems.
The larval stage of the organism’s life cycle was designated as the starting point for the
system design. This choice was made based on the reasoning that the waste
consumption rate of the larvae would determine how much waste a facility could
process, which in turn would determine the size of the reactor vessel(s) where the
waste would be consumed. Furthermore, quantifying the mass and number of larvae
that successfully migrated out of the reactor space was necessary to determine the
reactor’s productive outputs. These outputs would become inputs for the next stage of
the flies’ life cycle thereby affecting the design of adult space’s infrastructure.
The most important measurable design parameter was the average dry matter
consumption rate: the approach used to measure it was direct sampling of actively
feeding maggots. Other necessary values were not so easy to measure. The most
cumbersome was reliably measuring the number of adults present in the adult space.
Attempts were made to count the adults using a modified version of the maggot
sampling protocol but this approach eventually proved unreliable because of the high
degree of mobility exhibited by the adult flies.
24
A satisfactory approach based on direct counting was ultimately not developed: any
such approach would likely be affected by the same problems that made the original
approach unreliable because of the adults’ mobility. The method eventually used to
estimate adult fly number was an indirect approach via the mass balance experiments
and experimentally determined physical properties of eggs and adults.
The mass balances for the entire operation are presented first because the mass balance
is the source for key design parameters of the adult space and its presentation will
clarify the methods used in later parts of this thesis.
There were two balances done on two different materials in an attempt to quantify
flows: 1.) a dry matter balance, and 2.) a water balance. The first set of balances was
done on the reactor space (RS) and the second on the adult space. Raw data collected
from experiments can be viewed in Appendix A.
The study of the system was divided by infrastructure versions and modes of operation.
Three versions, defined by major overhauls to subsystems, existed at the landfill site and
each was evaluated for performance. During the first two major system versions the
facility was operated continuously: the life cycle of the flies was not interrupted and
multiple generations existed in the facility at any given time. After the last major system
revision, the facility operated in batch mode: only one generation was present in the
system at any given time.
After the system was studied by version, an overall analysis of the aggregate data was
undertaken to obtain averages of the necessary parameters for the design of a full scale
facility. The calculations and methodology used to conceptually design a full scale
facility were then determined and a process for its design is presented.
In an attempt to identify resource consumption, and to take the first step towards
conducting a life cycle assessment of the process, a life cycle inventory was carried out.
Material and energy flows were identified and quantified where possible. In addition,
25
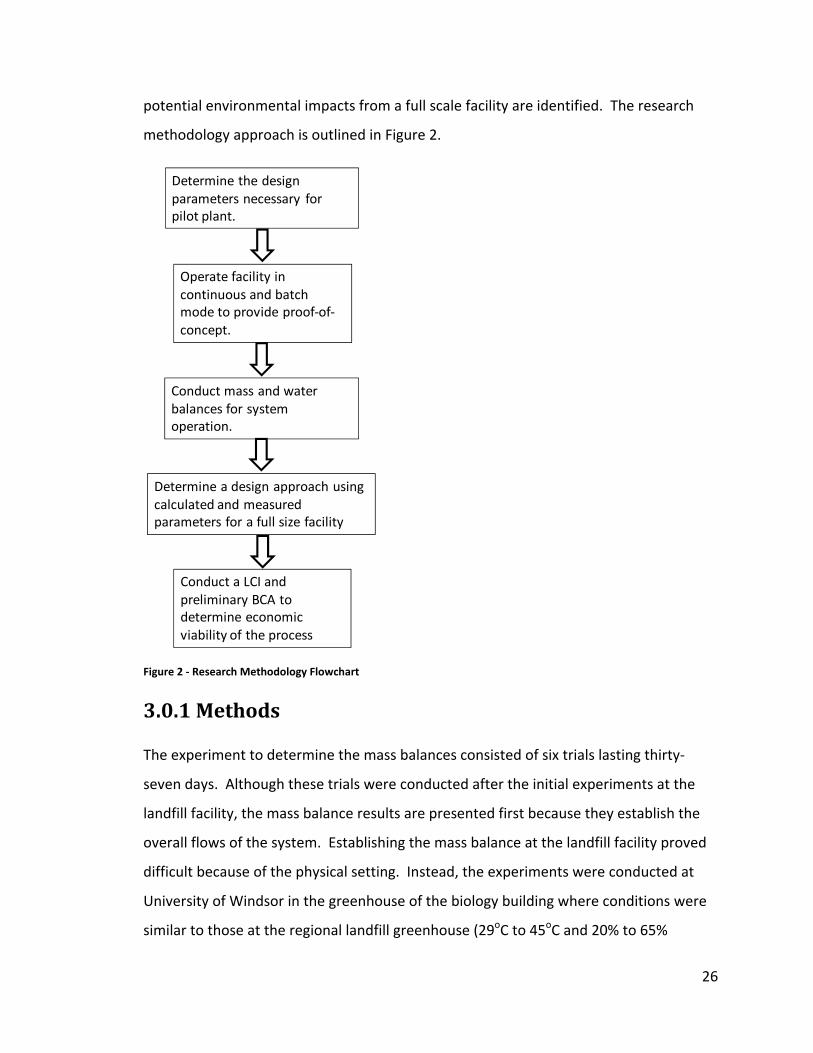
potential environmental impacts from a full scale facility are identified. The research
methodology approach is outlined in Figure 2.
Conduct a LCI and preliminary BCA to determine economic viability of the process
Determine a design approach using calculated and measured parameters for a full size facility
Determine the design parameters necessary for pilot plant.
Operate facility in continuous and batch mode to provide proof‐of‐concept.
Conduct mass and water balances for system operation.
Figure 2 ‐ Research Methodology Flowchart
3.0.1 Methods
The experiment to determine the mass balances consisted of six trials lasting thirty‐
seven days. Although these trials were conducted after the initial experiments at the
landfill facility, the mass balance results are presented first because they establish the
overall flows of the system. Establishing the mass balance at the landfill facility proved
difficult because of the physical setting. Instead, the experiments were conducted at
University of Windsor in the greenhouse of the biology building where conditions were
similar to those at the regional landfill greenhouse (29oC to 45oC and 20% to 65%
26
humidity), but were significantly more controllable. The maggots were ordered from
the Phoenixworm Store, Georgia, USA.
In each of the six trials, 1000 live BSF maggots were weighed (Precisa Model #BJ100M)
and fed a diet of commercial chicken feed mixed to 70% water and 30% dry solids by
mass. Each trial was kept separate in its own container. Chicken feed was used because
of complications with acquiring a reliable amount of restaurant waste, which was the
diet used for the main set of experiments. The effect this deviation would have on the
results was not considered significant because data from Nguyen (2010) suggested that
the maggots consume the different wastes in similar quantities. Restaurant waste was
used in all other experiments.
The initial mass of the wet feed was measured and the trials were placed in an incubator
at 29oC and 85% relative humidity. The trials were fed three times following the same
procedure as the initial feeding.
The wet mass of the leftover waste residue was measured after all the feeding episodes
were complete and the maggots had consumed all the waste. The feed was considered
stabilized to waste residue by visual inspection. Moisture samples from the waste
residue were collected from all six trials to establish an average to determine dry waste
masses; they were dried in an oven at 110oC for 24 hours. When the majority of
maggots were visually observed to turn dark (prepupa) they were separated from the
remaining waste and their mass was measured.
The prepupae were then placed into vessels that contained a pupation medium, wood
chips, and allowed to pupate. The vessels were then set in a cage to contain adults
along with a food source outfitted with egg laying sites, plastic cardboard flutes. The
cages were located in a greenhouse where the temperature and relative humidity were
maintained between 27oC and 33oC (optimal) and 25% to 50% (not optimal but
achievable). The humidity was lower than optimal conditions because of difficulties
humidifying the greenhouse.
27
Egg laying was allowed to proceed for eight days (selected from observations during the
operational experiments) for each trial after which the eggs were collected and their
wet mass was weighed. The remaining pupal casings were sorted and weighed and
these data were used to estimate the number of adults that were present in each adult
cage. Eighty‐four dried out intact adult carcasses were collected from the six cages and
their masses were measured to determine an average dry adult carcass mass. This value
was then used to estimate the number and mass of adult carcasses present in each
cage.
The water balance was obtained from data collected from the material balances. The
moisture content of all the materials was determined from moisture samples or from
measurements when it was introduced into the system boundary when dry matter was
mixed with water.
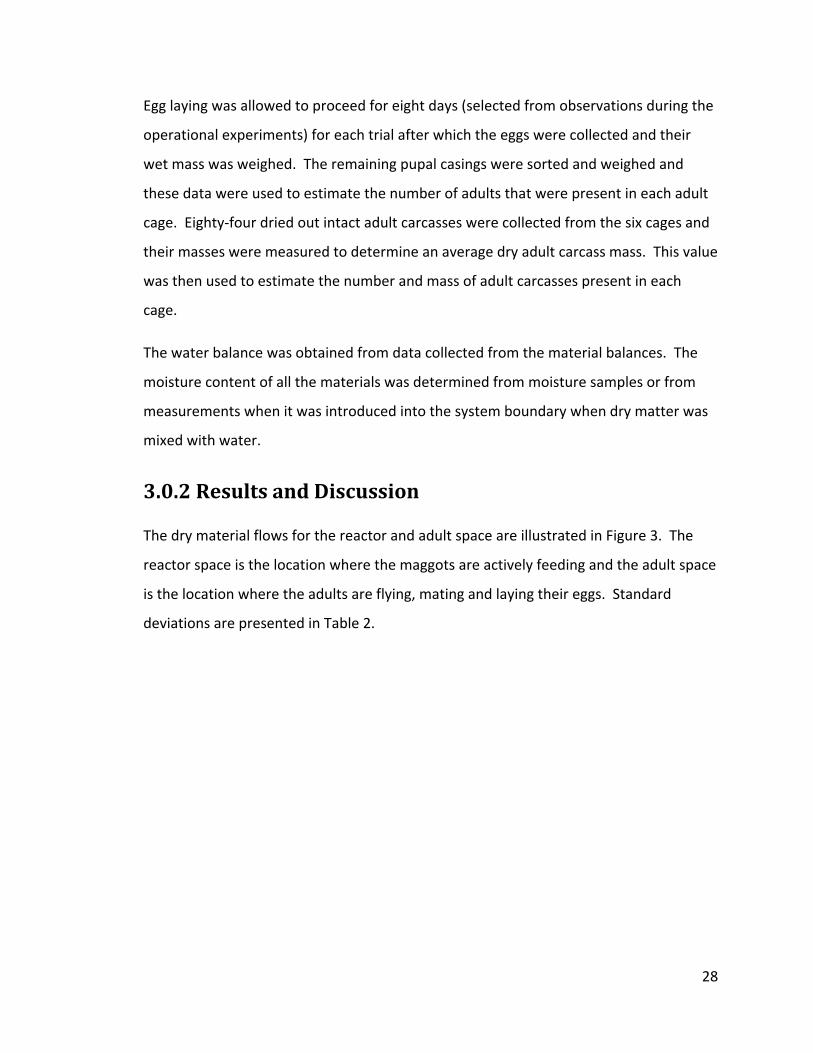
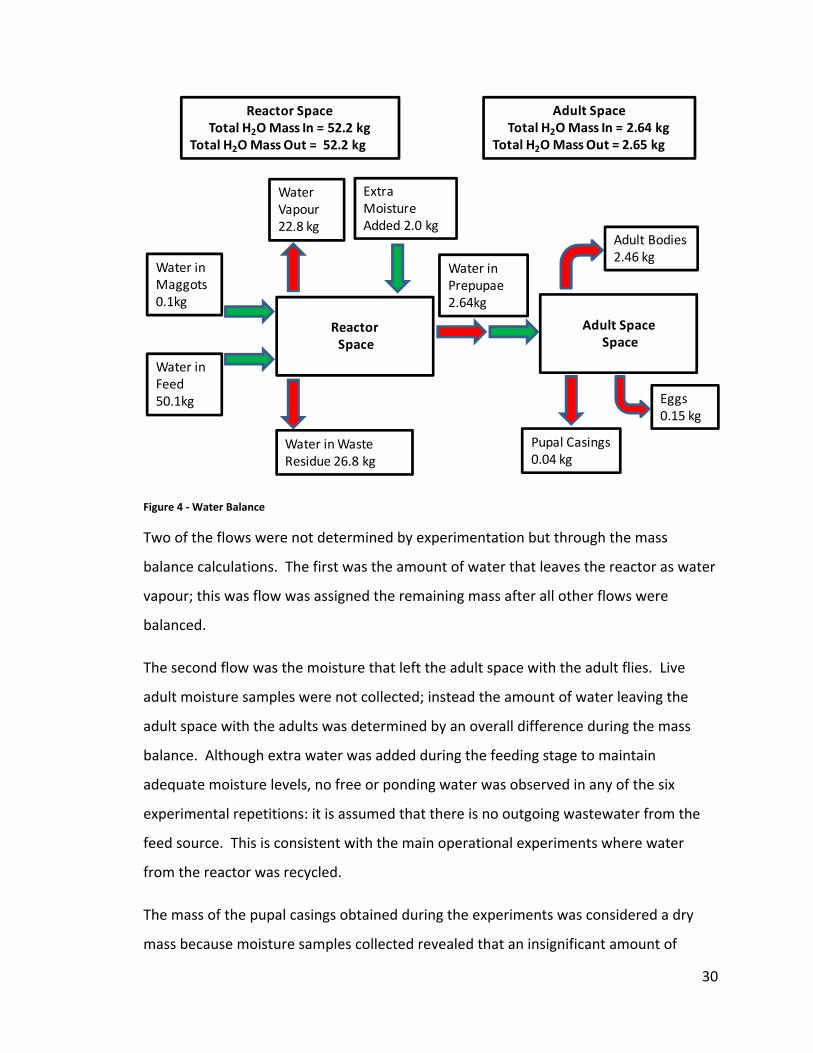
3.0.2 Results and Discussion
The dry material flows for the reactor and adult space are illustrated in Figure 3. The
reactor space is the location where the maggots are actively feeding and the adult space
is the location where the adults are flying, mating and laying their eggs. Standard
deviations are presented in Table 2.
28
ReactorSpace
Waste Residue 11.5 kg
Prepupae 15.2 kgMaggots
1.0 kg
Feed 23.7 kg
Gases ??? kg
Adult SpaceSpace
Eggs 0.2 kg
Pupal Casings 1.3 kg
Adult Bodies 1.3 kg
Reactor SpaceTotal Mass In = 24.7 kg
Total Mass Out = 26.7 kg
Adult SpaceTotal Mass In = 15.2 kg
Total Mass Out = 15.2 kg
Mass Lost via Resipiration (Fat Body ) 12.4 kg
Figure 3 – Dry Material Balance
The composition and mass of the emitted gases was not determined experimentally
during this research and an estimate could not be obtained via the mass balance: the
expected constituents include volatiles, ammonia, and water vapour.
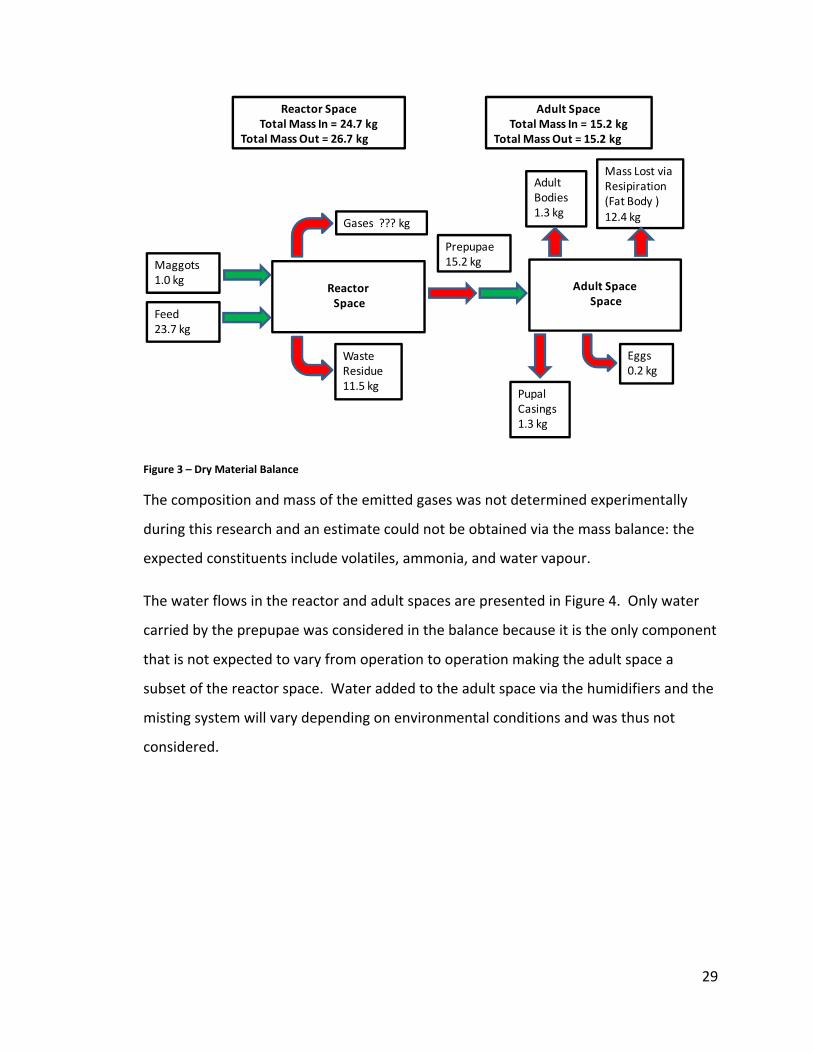
The water flows in the reactor and adult spaces are presented in Figure 4. Only water
carried by the prepupae was considered in the balance because it is the only component
that is not expected to vary from operation to operation making the adult space a
subset of the reactor space. Water added to the adult space via the humidifiers and the
misting system will vary depending on environmental conditions and was thus not
considered.
29
ReactorSpace
Water in Waste Residue 26.8 kg
Water in Prepupae 2.64kg
Water in Maggots 0.1kg
Water in Feed 50.1kg
Water Vapour 22.8 kg
Adult SpaceSpace
Eggs 0.15 kg
Pupal Casings 0.04 kg
Adult Bodies 2.46 kg
Reactor SpaceTotal H2O Mass In = 52.2 kg
Total H2O Mass Out = 52.2 kg
Adult SpaceTotal H2O Mass In = 2.64 kg
Total H2O Mass Out = 2.65 kg
Extra Moisture Added 2.0 kg
Figure 4 ‐ Water Balance
Two of the flows were not determined by experimentation but through the mass
balance calculations. The first was the amount of water that leaves the reactor as water
vapour; this was flow was assigned the remaining mass after all other flows were
balanced.
The second flow was the moisture that left the adult space with the adult flies. Live
adult moisture samples were not collected; instead the amount of water leaving the
adult space with the adults was determined by an overall difference during the mass
balance. Although extra water was added during the feeding stage to maintain
adequate moisture levels, no free or ponding water was observed in any of the six
experimental repetitions: it is assumed that there is no outgoing wastewater from the
feed source. This is consistent with the main operational experiments where water
from the reactor was recycled.
The mass of the pupal casings obtained during the experiments was considered a dry
mass because moisture samples collected revealed that an insignificant amount of
30

moisture was present, approximately 3%. Ten pupal casings were collected after egg
laying was completed and set to dry above a heat source for 48 hours; an oven was not
used because there was possibility of burning the pupal casings. The data are presented
in Table 2 along with their standard deviations to illustrate the variability. The variability
in the amount of waste fed to the maggots is the result of feeding on a demand basis.
31
Table 2 ‐ Material Balance Data, 6 trials with 1000 maggots per trial
Maggot Data Parameter StdevAverage Packing Mass with Maggots (g) 45.6 5.5Initial Average Wet Mass of 1000 Maggots (g) 14.5 5.5Final Average Wet Mass of 1000 Maggots (g) 442.3 12.6Moisture Content of Maggots (dec) 0.08Moisture Content of Feed (dec) 0.68Extra Moisture Added to Feed (g) 26.4Initial Average Dry Mass of 1000 Maggots (g) 13.4 0.7Final Average Dry Mass of 1000 Maggots (g) 203.5 11.6Moisture Content of Pupal Casings (dec) 0.03 0.02
Reactor Space DataAverage Wet Mass of Feed Given (g) 994.2 155.6Average Wet Mass of Collected Waste (g) 512.8 71.2Average Moisture Content of Waste (dec) 0.70 0.03Average Dry Mass of Feed Given (g) 317.7 49.8Average Dry Mass of Waste Collected (g) 154.3 21.9Average Wet Mass of Feed Consumed by Maggots (g) 481.3 103.9Average Dry Mass of Feed Consumed by Maggots (g) 163.4 29.5Average Dry Matter Reduction (%) 51.4
Adult Space DataAverage Wet Mass of Pupal Casings 100% Emergence (g) 17.3 4.1Average Dry Mass of Adult Carcasses 100% Emergence (g) 17.2 4.1Average Wet Mass of Eggs Collected (g) 3.7 0.9Average Dry Mass of Eggs Collected (g) 1.7 0.2Moisture Content of Eggs (dec) 0.54
Per 1 kg of Maggots Introduced into ReactorConversion Factor to 1 kg 74.7Initial Dry Mass of Maggots (kg) 1.0 0.0Average Dry Mass of Feed Given (kg) 23.7 3.7Average Dry Mass of Waste Collected (kg) 11.5 1.6Average Dry Mass of Feed Consumed by Maggots (kg) 12.2 2.2Final Average Dry Mass Maggots (kg) 15.2 0.9Average Dry Mass of Pupal Casings 100% Emergence (kg) 1.3 0.3Average Dry Mass of Adult Carcasses 100% Emergence (kg) 1.3 0.3Average Dry Mass of Eggs Collected (kg) 0.1 0.0
Water Content of Each Component per 1 kg of MaggotsInitial Mass with Maggots (kg) 0.1 0.0In Feed Given (kg) 50.5 7.9Water Vapour Leaving (kg) 23.2 8.7Waste Collected (kg) 26.8 3.7Feed Consumed by Maggots (kg) 24.5 5.3Final Mass of Maggots (kg) 2.64 0.1Pupal Casings 100% Emergence (kg) 0.04 0.0Adult Carcasses 100% Emergence (kg) 2.46 0.1Eggs Collected (kg) 0.15 0.0Extra Moisture Added to Feed (kg) 2.0
32

The established material flows were used in later analyses when collected data was not
sufficient to characterize mass flows. Carbon and nitrogen balances were not
conducted.
33
3.1 Introduction – Experimental Setup and Design for Landfill Operations
The black soldier fly (BSF) is being extensively assessed to determine its benefits for the
fields of sustainability, waste management and aquaculture protein production. The
voracious and undiscerning appetite of the BSF maggot coupled with the benign
interaction the species has with humans (when it occurs) makes it a potentially ideal
biological instrument in such fields. Processes designed around the BSF to stabilize
organic wastes and produce a value added resource have succeeded in many locations
where the climate is favourable for the year‐round propagation of the species.
However, similar installations in northern climates would face technical hurdles as they
relate to abiotic factors due to much colder climate conditions.
3.1.1 Purpose
This research focused on whether or not the life cycle of the BSF could be exported to
climates where the species could not propagate itself year round without technical
assistance. One of the goals was to design a facility that could contain the entire life
cycle of the BSF with minimal human labour inputs and yield viable future generations
of the species. The research would also identify and quantify useful design parameters
and materials that would aid in the design of future systems including: the mass loading
rate, maggot yield, waste conversion rates and the harvesting capacity for the system.
Because a key aspect of this research is to demonstrate “proof‐of‐concept”, a prototype
system for supporting the life cycle of the BSF was developed and refined through
successive experimentation. Three system versions were operated at the EWSWA
facility. The results are presented first by system revision to show the design
progression and, the results are then reviewed as a whole. A fourth revision was
constructed for operation at the University of Windsor. Raw data from all experiments
at the landfill can be viewed in Appendix B.
34
3.1.2 Approach
The different stages of the black soldier fly’s life cycle were used as a guide to
conceptualize and then develop the facility’s components. The life cycle of the BSF was
divided into the following stages for subsystem design purposes and do not necessarily
define the life cycle in a strict biological sense.
• The larval feeding stage;
• The migration stage;
• The pupation stage;
• The adult stage; and
• The egg laying stage
Each life cycle stage would be contained within a subsystem, and each subsystem would
be connected to the previous and proceeding stage to encourage the continuity of the
BSF’s life cycles. Although the current system is the result of three major revisions and
some minor adjustments, the continuity of the BSF as a functioning “unit operation” was
clearly observed.
3.1.2.1 Operational Modes
The BSF system was run in two modes: continuous operation and batch operation. In
the continuous operation mode, the life cycle of the BSF was allowed to progress from
one life stage to the next without interruption or major cleaning in between generations
(cohorts). This eventually led to a situation where multiple cohorts were present in the
system at any given time so that multiple life stages (adults, larvae and eggs) were
present all at once. It was also hypothesized that if a self‐perpetuating colony could be
established under the experimental conditions, it would demonstrate proof‐of‐concept
for a BSF facility.
35
3.1.3 Cycle Definition
The complete biological cycle of the BSF encompasses the egg, larval, pupal, and adult
stages. For the purposes of study cycles were referenced to the feeding stage ‐ the start
date of a new cycle would correspond with the addition of new maggots or the presence
of freshly eclosed maggots and would end when the outward migration of prepupae
was completed. In the continuous operation mode, establishing the start of a cycle was
difficult because freshly eclosed (hatched) maggots were hard to locate. To compensate
for this situation the start date was chosen three days prior from the first visual
observation of newly eclosed maggots for every cycle, unless the reactor was re‐started
and the start date was actually known. The end of a cycle was indentified when a
substantial portion of prepupae, a migration wave, were observed to exit the reactor
space: this was determined by visual observation.
In the batch operational mode, only one cohort was present so that only one life stage
was present at any given time. The continuous mode was operated first for eight cycles
followed by the batch mode which lasted four cycles.
3.2 System Version 1 – Continuous Operation Sept 30, 2009 to Mar 29, 2010
3.2.1 Infrastructure Description
The facility was located at the Essex County regional landfill in cooperation with the
Essex Windsor Solid Waste Authority. The research was conducted inside an 82.8 m3
rectangular inner greenhouse located inside a 1500 m3 semicircular shaped outer
greenhouse with an approximate area of 348 m2. The inner greenhouse contained a
forced air natural gas furnace to provide heat in the winter and a 0.762 m diameter fan
to ventilate the inner greenhouse in the summer.
The outer greenhouse was not heated in the winter but it contained a ventilation fan
and louvers to provide air cooling in the summer time. A direct water supply was not
36
available so water was pumped into a 1.14 m3 cylindrical tank that was filled once it
reached a preset minimum level, approximately half volume. A 550W (¾ H.P.) motor
and pump were used to supply water to the grinder and the misting pump.
A FogcoTM model # 92501, 1.7 MPa (250 psi) mister was used to supply water to the
reactor space and the adult space. This was the sole water delivery system for this
system revision. A 3‐phase 208V, 2200W (3 H.P.) electric food grinder was used to grind
organic waste into a slurry to homogenize the waste and reduce the potential for pest
attraction. The waste fed during the startup phase between September and December
of 2009 was a mix of restaurant waste, fish renderings and fruits and vegetables.
However the diet was simplified at the start of January 2010 when franchise restaurant
waste, consisting of carbohydrates, proteins and fats, was the only feed used in further
operational cycles. This system version spanned two complete generations of BSF or
cycles 1 and 2.
The inner greenhouse was divided into two volumes: one housed the feeding space,
pupation trough and preparation area, while the other contained the adult space and
hatchery. The layout is illustrated in Figure 5.
37
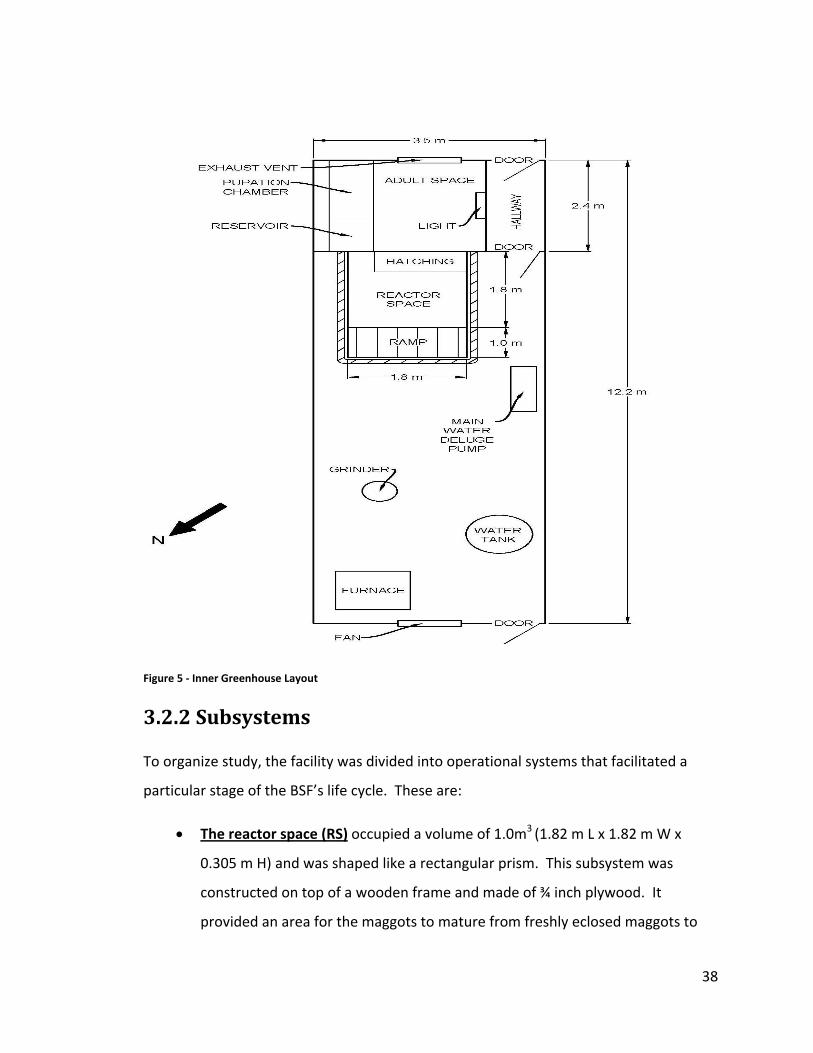
Figure 5 ‐ Inner Greenhouse Layout
3.2.2 Subsystems
To organize study, the facility was divided into operational systems that facilitated a
particular stage of the BSF’s life cycle. These are:
• The reactor space (RS) occupied a volume of 1.0m3 (1.82 m L x 1.82 m W x
0.305 m H) and was shaped like a rectangular prism. This subsystem was
constructed on top of a wooden frame and made of ¾ inch plywood. It
provided an area for the maggots to mature from freshly eclosed maggots to
38

their wandering stage. The area was lined with a waterproof membrane,
BlueSkinTM, which was attached according to the manufacturer’s instructions.
The RS was connected to the exit ramp and the hatchery. No physical border
exists between the exit ramp and the RS. Window screening was used to
separate the RS from the hatchery to contain the adults.
• The exit ramp was constructed of ¾ inch plywood and inclined at 40 degrees. It
was also covered in the BlueSkinTM membrane to provide water resistance. The
ramp provided an exit leading to the collection trough / pupation chamber
where the migrating maggots pupated.
• The collection trough was rectangular in shape (1.82 m W x 0.914 m L x
0.457 m D), constructed of plywood and filled with wood chip (0.15 m deep)
but was not lined. It was expected that the majority of the moisture from
migrating maggots would be shed on the ramp and that any remaining
moisture would be absorbed by the woodchip. It was at this location where
the woodchip was sieved and the collected maggots were weighed and
subsequently transported to the adult space.
• The adult space was a separate walled volume of approximately 14.5 m3,
(2.5 m W x 2.35 m L x 2.46 m H). The adult space consisted of four walls with
2x4 construction covered with 0.15 mm (6 mil) plastic on both sides. In an
attempt to discourage egg laying in undesired areas and escapees, all seams
and joints were coated with acrylic caulking.
From an engineering perspective the behaviour and life stage requirements of
the adults were more complex to cope with than at the larval stage. Adult
requirements included providing drinking water, a volume of space to seek
mates, exposure to light and a suitable location to deposit eggs. To address the
water needs, a misting system was installed that sprayed onto window screens
to provide drinking water in suitable particle sizes and add ambient humidity as
39
the water evaporated. To provide light requirements the room’s walls and
ceiling were made from translucent plastic. The majority of volume in the adult
room was empty space to allow for aerial questing and mating behaviours. The
entrance to the hatchery was located in the adult space.
• The hatchery was constructed of wood as a triangular prism (0.305 m L x
1.6 m W x 0.267 m H). The long side was covered by a sheet of plywood and
the remaining surfaces were covered by window screening. Window screening
was chosen because it would contain the adults in the adult room while
allowing newly hatched larva to fall down into the RS. Eggs were laid on the
screen directly.
3.2.3 Experimental Measurements Methods
A number of parameters were measured and are described in the proceeding sections.
Although the approach used in this research appears similar to those used in Diener et.
al. (2009), this study is different because of the following reasons:
• This study was not an optimization study: the goal was not to establish optimal
feeding rates but to determine the feeding rate under the conditions
experienced by this research;
• The research was conducted on a larger scale than those conducted in Diener
et. al. 2009. In this research there was only one replicate per cycle; and
• Maggots were never removed from the feed source during the resource
consumption stage for measurements; they were allowed to migrate out on
their own.
3.2.3.1 Reactor Space
In the RS, the temperature, number of maggots, weight of feed added, weight of waste
remaining, moisture content (food and waste), area and depth of the food and maggot
mixture were measured. The diet used in the study was discarded restaurant waste.
40
The diet was chosen based on experiments conducted by Nguyen (2010), which showed
that restaurant waste was one of the diets that produced the largest maggots by mass.
This diet was also available in the quantities required to sustain the expected number
maggots generated by the facility. Detailed analysis about nutritional variability as it
related to the diet choice and chemical analysis of the diet were considered outside the
scope of this research.
The temperature in the reactor was measured by a data logger (HOBO Model # U12‐
012) every 40 minutes. The weight of the food was measured after it was mixed with
water but prior to adding it to the RS using an electronic scale (Pelouze Model # 4040).
Moisture samples were also collected at this point to determine the water content in
the feed. Brief attempts were made to follow the feed application flux data (or feed
loading rate) from Diener et. al. (2009) to determine the amount of waste given to the
maggots. This approach was abandoned because the maggots could not be fed daily
and the number of maggots per cm2 could not be readily determined. Instead, the
amount of waste required was estimated based on observed maggot numbers and
previous observations of consumption.
The waste remaining after a completed cycle was measured after no visible maggots
were apparent in the RS. In later cycles some of this waste was returned to the RS if
small maggots were found to be present after a visual inspection. Separation of the
freshly eclosed maggots from the waste proved impractical and the loss of these
maggots would have negative effects on future cycles. Waste moisture samples were
also collected at this point.
To prevent reactor fouling, waste was removed from all areas of the RS except directly
underneath the connection to the hatchery as required. This done was because freshly
eclosed maggots were most likely present at this location. In the remaining areas of the
RS waste was simply scraped off the surface. Although this did result in some loss of
older maggots, a fouled reactor would pose significant problems to the long term
operability of the setup. The following calculations are available in Appendix C.
41

3.2.3.2 Moisture Content
In order to determine the moisture content of both the food and the waste, small
samples of each were collected and weighed using a scale (Precisa Model # BJ100M) and
set to dry for a minimum of 48 hours on top of a working heat source. The moisture
content was then t following equation: determined from he
Eqn. 1 – % 100
Although the standard operating procedure involves the use of an oven, no such
equipment was present at the research location. To verify the accuracy and consistency
of this approach, twenty samples of feed waste were collected. Ten were dried in an
oven and ten were dried using the above field approach. The results (see Appendix D)
indicate a 4% difference in the average of the results. The oven dried samples
consistently showed a higher content of water than their field method counterparts. To
compensate for this difference, the waste reduction values were adjusted to 96% of
their observed values.
3.2.3.3 Waste Consumption Rate
The rate of waste consumption is the important design parameter for future facility
designs. Estimating this value required estimating the number of maggots and the
quantity of food present in the reactor and the time it took for its consumption.
The sampling approach used involved collecting four 250 mL samples of the food and
maggot mixture inside the reactor space. The number of maggots present in the
samples was counted and then averaged across the four samples. Measurements of the
depth (four readings) and area of the food and maggot mixture were also collected. The
area was estimated to the nearest square or rectangle on the reactor space surface
depending on the shape and size of the food pile. These values were used to estimate
the number of maggots present in the RS according to the following equation (unit
conversion factors are omitted).
42
Eqn. 2 –
# #
This approach was developed because of the lack of literature available to guide these
experimental conditions and to manage the amount of effort put into counting the
maggots present in the RS. In order to establish consumption time the maggots were
fed only when the food was completely consumed. This was established by visual
observation: the food was considered consumed when it changed colour and texture.
Another indicator that consumption was complete was when the maggots would start
to wander away from the resource instead of remaining in it. The time between
feedings was recorded and each feeding instance was termed a feeding event.
3.2.3.4 Daily Consumption Rate
Using the dry matter weights of the feed the daily consumption rate (DCR) was
determined g e following equation: usin th
Eqn. 3 –
The rate of daily consumption on a per maggot basis (DCRM) was then calculated by the
following equation:
Eqn. 4 – #
The DCRM was calculated for each feeding event. Because the number of times a
feeding event occurred varied with each cycle, a cycle was considered complete when a
wave of migrating maggots left the RS.
43
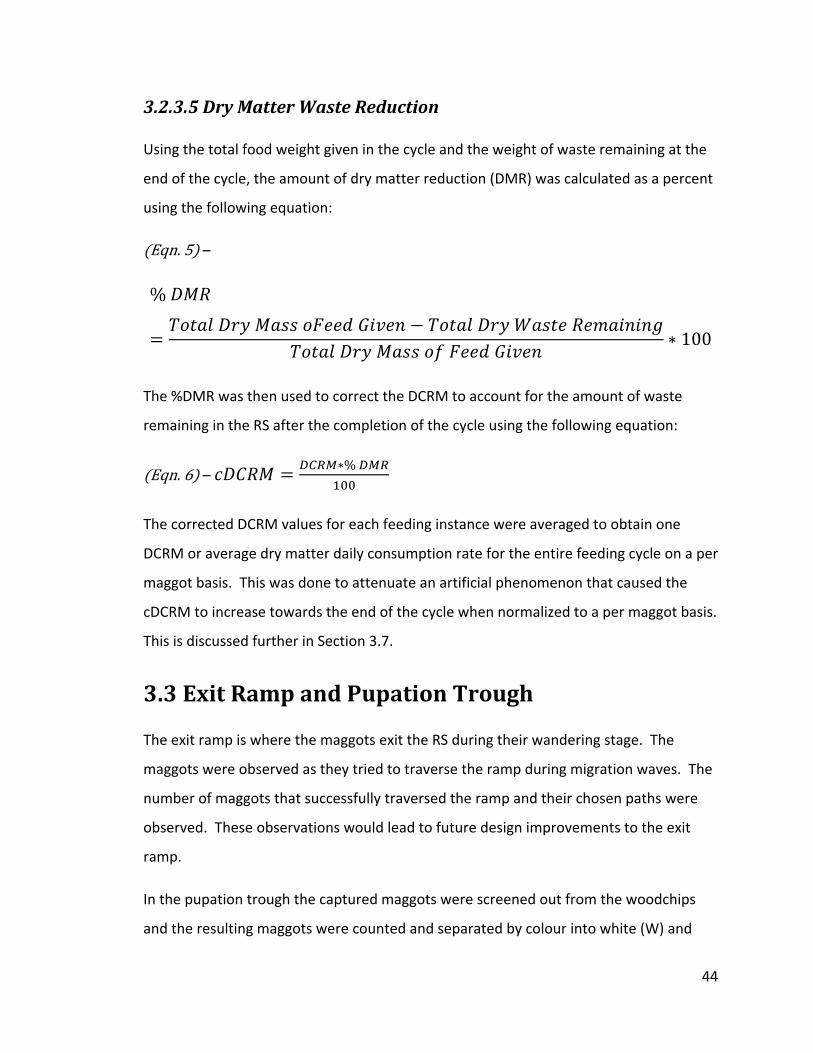
3.2.3.5 Dry Matter Waste Reduction
Using the total food weight given in the cycle and the weight of waste remaining at the
end of the cycle, the amount of dry matter reduction (DMR) was calculated as a percent
usi he following equation: ng t
Eqn. 5 –
%
100
The %DMR was then used to correct the DCRM to account for the amount of waste
remaining in the completion of the cycle using the following equation: the RS after
Eqn. 6 – %
The corrected DCRM values for each feeding instance were averaged to obtain one
DCRM or average dry matter daily consumption rate for the entire feeding cycle on a per
maggot basis. This was done to attenuate an artificial phenomenon that caused the
cDCRM to increase towards the end of the cycle when normalized to a per maggot basis.
This is discussed further in Section 3.7.
3.3 Exit Ramp and Pupation Trough
The exit ramp is where the maggots exit the RS during their wandering stage. The
maggots were observed as they tried to traverse the ramp during migration waves. The
number of maggots that successfully traversed the ramp and their chosen paths were
observed. These observations would lead to future design improvements to the exit
ramp.
In the pupation trough the captured maggots were screened out from the woodchips
and the resulting maggots were counted and separated by colour into white (W) and
44
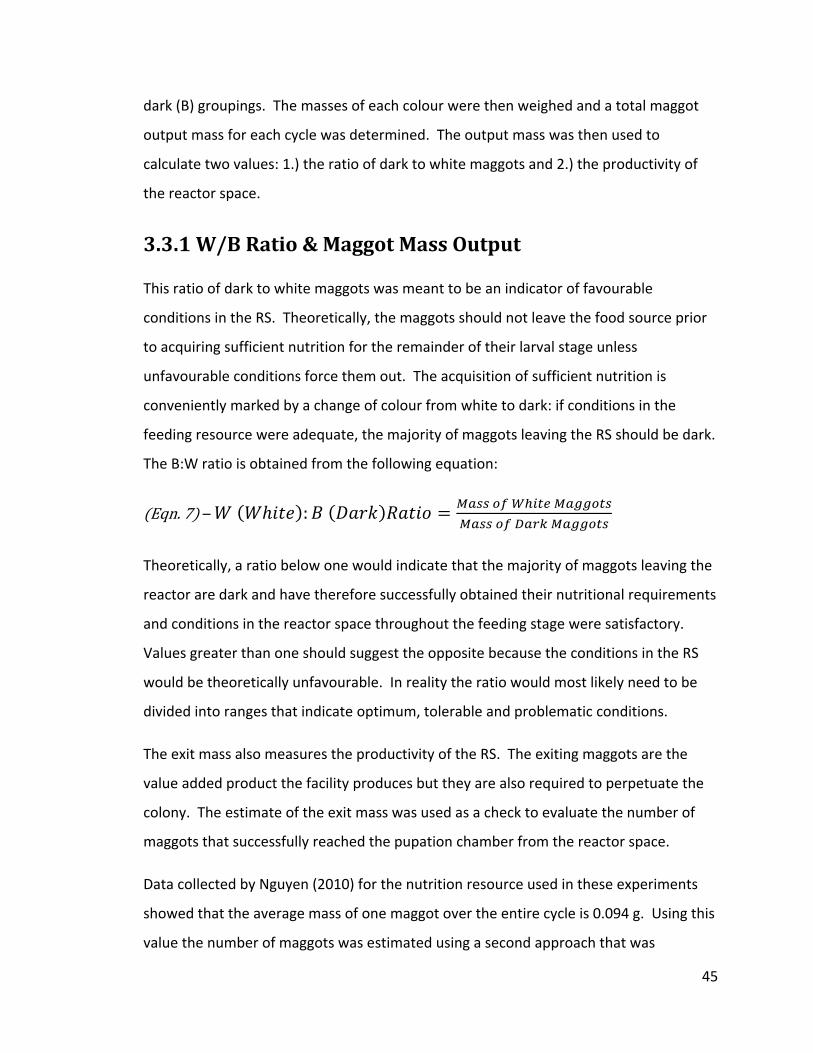
dark (B) groupings. The masses of each colour were then weighed and a total maggot
output mass for each cycle was determined. The output mass was then used to
calculate two values: 1.) the ratio of dark to white maggots and 2.) the productivity of
the reactor space.
3.3.1 W/B Ratio & Maggot Mass Output
This ratio of dark to white maggots was meant to be an indicator of favourable
conditions in the RS. Theoretically, the maggots should not leave the food source prior
to acquiring sufficient nutrition for the remainder of their larval stage unless
unfavourable conditions force them out. The acquisition of sufficient nutrition is
conveniently marked by a change of colour from white to dark: if conditions in the
feeding resource were adequate, the majority of maggots leaving the RS should be dark.
The B:W ra uation: tio is obtained from the following eq
Eqn. 7 – :
Theoretically, a ratio below one would indicate that the majority of maggots leaving the
reactor are dark and have therefore successfully obtained their nutritional requirements
and conditions in the reactor space throughout the feeding stage were satisfactory.
Values greater than one should suggest the opposite because the conditions in the RS
would be theoretically unfavourable. In reality the ratio would most likely need to be
divided into ranges that indicate optimum, tolerable and problematic conditions.
The exit mass also measures the productivity of the RS. The exiting maggots are the
value added product the facility produces but they are also required to perpetuate the
colony. The estimate of the exit mass was used as a check to evaluate the number of
maggots that successfully reached the pupation chamber from the reactor space.
Data collected by Nguyen (2010) for the nutrition resource used in these experiments
showed that the average mass of one maggot over the entire cycle is 0.094 g. Using this
value the number of maggots was estimated using a second approach that was
45
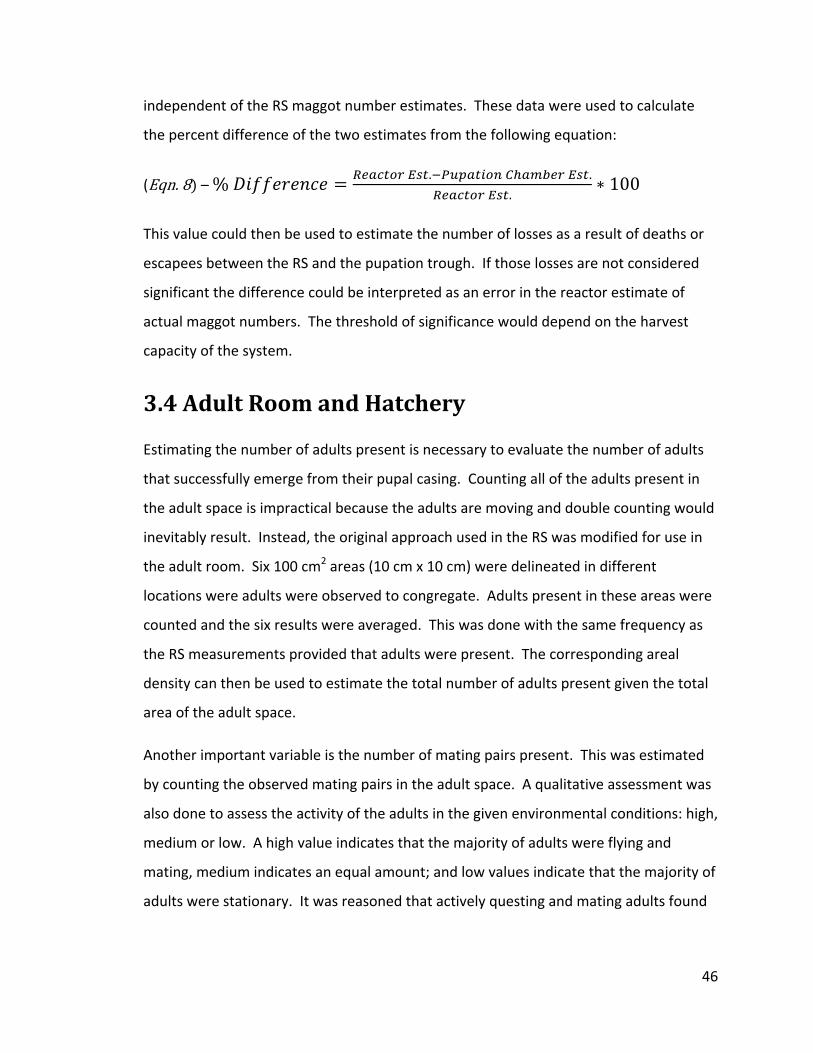
independent of the RS maggot number estimates. These data were used to calculate
the percen o estimates from the following equati nt difference of the tw o :
(Eqn. 8 – % . . .
100
This value could then be used to estimate the number of losses as a result of deaths or
escapees between the RS and the pupation trough. If those losses are not considered
significant the difference could be interpreted as an error in the reactor estimate of
actual maggot numbers. The threshold of significance would depend on the harvest
capacity of the system.
3.4 Adult Room and Hatchery
Estimating the number of adults present is necessary to evaluate the number of adults
that successfully emerge from their pupal casing. Counting all of the adults present in
the adult space is impractical because the adults are moving and double counting would
inevitably result. Instead, the original approach used in the RS was modified for use in
the adult room. Six 100 cm2 areas (10 cm x 10 cm) were delineated in different
locations were adults were observed to congregate. Adults present in these areas were
counted and the six results were averaged. This was done with the same frequency as
the RS measurements provided that adults were present. The corresponding areal
density can then be used to estimate the total number of adults present given the total
area of the adult space.
Another important variable is the number of mating pairs present. This was estimated
by counting the observed mating pairs in the adult space. A qualitative assessment was
also done to assess the activity of the adults in the given environmental conditions: high,
medium or low. A high value indicates that the majority of adults were flying and
mating, medium indicates an equal amount; and low values indicate that the majority of
adults were stationary. It was reasoned that actively questing and mating adults found
46
the conditions abiotic conditions in the adult space acceptable. Higher numbers of
active adults were assumed to indicate acceptable performance of the adult space.
Initially, the eggs laid during the continuous phase of operations were counted but this
practice was eventually abandoned because of the risk of damaging the eggs. At this
point in the research, the eggs were simply laid on the window screen separating the
hatchery and the RS and handling them safely to weigh the mass was difficult and
cumbersome. Adult space data can be viewed in Appendix E and hatchery data can be
viewed in Appendix F.
3.5 Observations
The facility began operations on September 30thof 2009. The reactor space was seeded
with one week old maggots that were mixed with chicken feed (the incubation nutrition
source) and discarded fast food (the cycle’s nutrition source). The initial mass of
maggots could not be measured because separating them from the incubation food
source was not practical. The reactor space was initially lined with a waterproofing
membrane called BlueSkinTM. A misting system provided water to the RS and no
drainage was provided in the RS in this system revision.
Twenty‐four hours after the initial start‐up it was observed that the BlueSkinTM did not
contain the feeding maggots; they easily wiggled between any seams that were present
and effectively destroyed the waterproofing membrane. The maggots were removed,
the reactor space was cleaned and a continuous piece of pond liner was used to cover
the exit ramp and the reactor bed. After the overhaul was completed (October 3rd
2009), the system was restarted. It became evident that the maggots liquefied the food
waste during consumption and the reactor bed quickly became too wet causing the
maggots to wander out.
This occurrence also revealed a design flaw: the sides of the RS were open and some of
the maggots escaped the reactor bed via the side walls and spread throughout the
greenhouse. A 2‐inch ABS drain pipe was added to the reactor bed to allow excess
47

moisture to drain into a bucket that was periodically measured to determine the
amount of waste liquids leaving the system; these volumes were found to be negligible,
less than 1.5 liters per cycle (once added moisture to the feed source was reduced). The
amount of wastewater increased in later cycles because the automated greenhouse
cooling system and the reactor misters were the operated by the same pump: the
demand for water was therefore base on cooling requirements. The situation was
rectified when the systems were separated.
The containment issue remained a problem. When wet, the maggots will stick to almost
any surface including plastic, wood and metals; these materials were easily traversed
regardless of the inclination angle. The eventual solution to this problem was to direct
migration and contain the maggots by fitting the entire open perimeter of the reactor
with collection pipes on April 1, 2010.
During the first three months of operation there were two major flooding episodes
caused by leaks in the greenhouse roofs during heavy rain events that drowned all the
maggots and forced system restarts. Although some maggots were able to complete
their life cycle, their numbers were significantly lower after the flooding.
During this three month period it was also observed that the digestibles could become
anaerobic and that the RS required some form of aeration. To alleviate this issue a
network of 12mm (½ inch) perforated CPVC piping was installed on November 25, 2009.
The network was covered by 76.2 mm of pea gravel that was capped with a galvanized
metal mesh (12mm x 12mm) so that it covered the entire surface area of the RS and
3.18 mm diameter holes were cut into the tubes to allow air to exit. A cross sectional
view of this setup is shown in Figure 6. A five gallon air compressor provided air to the
reactor bed fourteen times per day for one minute (fourteen operational cycles were
the limit of the timer’s capabilities).
Maggots preferred to feed in a position such that the head of the maggot is buried in
the food waste and the spiracle is only slightly exposed. This feeding position is possible
if the waste is viscous enough to prevent the maggots from sinking or tilting over. One
48
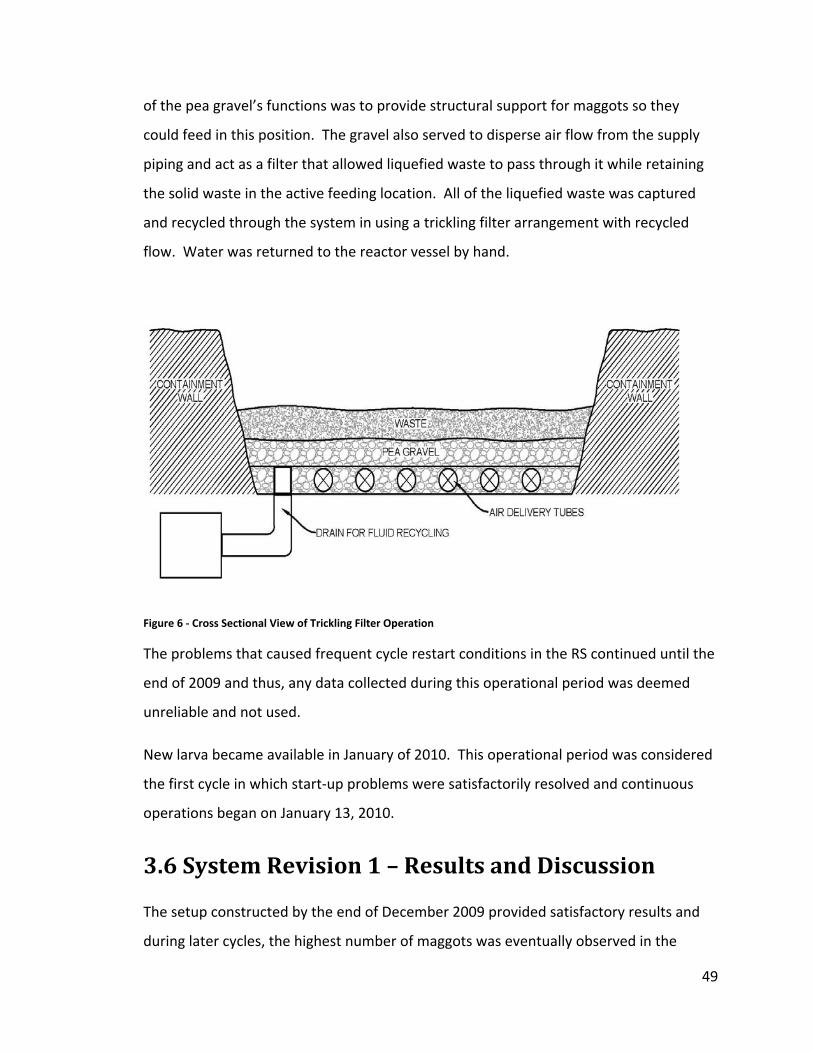
of the pea gravel’s functions was to provide structural support for maggots so they
could feed in this position. The gravel also served to disperse air flow from the supply
piping and act as a filter that allowed liquefied waste to pass through it while retaining
the solid waste in the active feeding location. All of the liquefied waste was captured
and recycled through the system in using a trickling filter arrangement with recycled
flow. Water was returned to the reactor vessel by hand.
Figure 6 ‐ Cross Sectional View of Trickling Filter Operation
The problems that caused frequent cycle restart conditions in the RS continued until the
end of 2009 and thus, any data collected during this operational period was deemed
unreliable and not used.
New larva became available in January of 2010. This operational period was considered
the first cycle in which start‐up problems were satisfactorily resolved and continuous
operations began on January 13, 2010.
3.6 System Revision 1 – Results and Discussion
The setup constructed by the end of December 2009 provided satisfactory results and
during later cycles, the highest number of maggots was eventually observed in the
49

reactor with the trickling filter approach. During their feeding the maggots liquefied the
food, which then drained through the pea gravel and into a collection bucket and the
contents of which were returned to the RS for further processing. The pea gravel also
made it easier for the maggots to maintain their preferred feeding position, as shown in
Figures 7A and 7B.
Figure 7 A & B ‐ Preferential Feeding Position
3.6.1 Infrastructure Flaws
Draining the excess moisture proved troublesome in the initial stages of the research.
The drainage pipe was located in the southeast corner of the reactor with the reactor
floor sloped towards it. The window screening used to cap the drain prevented maggots
from escaping but the small screen size would clog easily and required frequent cleaning
to prevent excess fluid pooling. A satisfactory solution to this situation was never found
but the problem was controlled indirectly by adjusting the quantity of the bulking agent
used during the consumption period (in later cycles), regulating the misting system to
supply less water when appropriate, adding less water to the feed and frequent cleaning
of the drain cap.
The migration phase of cycles one and two demonstrated design problems with the exit
ramp. The slope of the ramp proved too steep for its length and the majority of the
maggots failed to climb it successfully. In fact, the majority of the maggots did not use
50
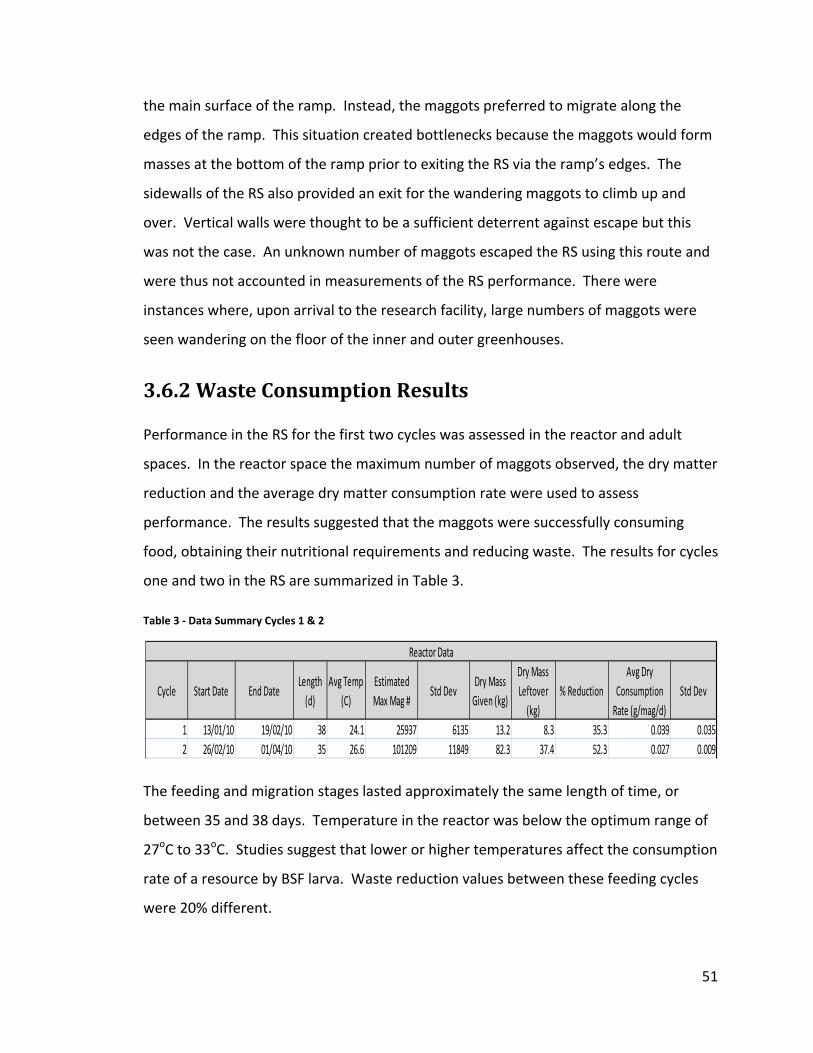
the main surface of the ramp. Instead, the maggots preferred to migrate along the
edges of the ramp. This situation created bottlenecks because the maggots would form
masses at the bottom of the ramp prior to exiting the RS via the ramp’s edges. The
sidewalls of the RS also provided an exit for the wandering maggots to climb up and
over. Vertical walls were thought to be a sufficient deterrent against escape but this
was not the case. An unknown number of maggots escaped the RS using this route and
were thus not accounted in measurements of the RS performance. There were
instances where, upon arrival to the research facility, large numbers of maggots were
seen wandering on the floor of the inner and outer greenhouses.
3.6.2 Waste Consumption Results
Performance in the RS for the first two cycles was assessed in the reactor and adult
spaces. In the reactor space the maximum number of maggots observed, the dry matter
reduction and the average dry matter consumption rate were used to assess
performance. The results suggested that the maggots were successfully consuming
food, obtaining their nutritional requirements and reducing waste. The results for cycles
one and two in the RS are summarized in Table 3.
Table 3 ‐ Data Summary Cycles 1 & 2
Cycle Start Date End DateLength (d)
Avg Temp (C)
Estimated Max Mag #
Std DevDry Mass Given (kg)
Dry Mass Leftover (kg)
% ReductionAvg Dry
Consumption Rate (g/mag/d)
Std Dev
1 13/01/10 19/02/10 38 24.1 25937 6135 13.2 8.3 35.3 0.039 0.0352 26/02/10 01/04/10 35 26.6 101209 11849 82.3 37.4 52.3 0.027 0.009
Reactor Data
The feeding and migration stages lasted approximately the same length of time, or
between 35 and 38 days. Temperature in the reactor was below the optimum range of
27oC to 33oC. Studies suggest that lower or higher temperatures affect the consumption
rate of a resource by BSF larva. Waste reduction values between these feeding cycles
were 20% different.
51
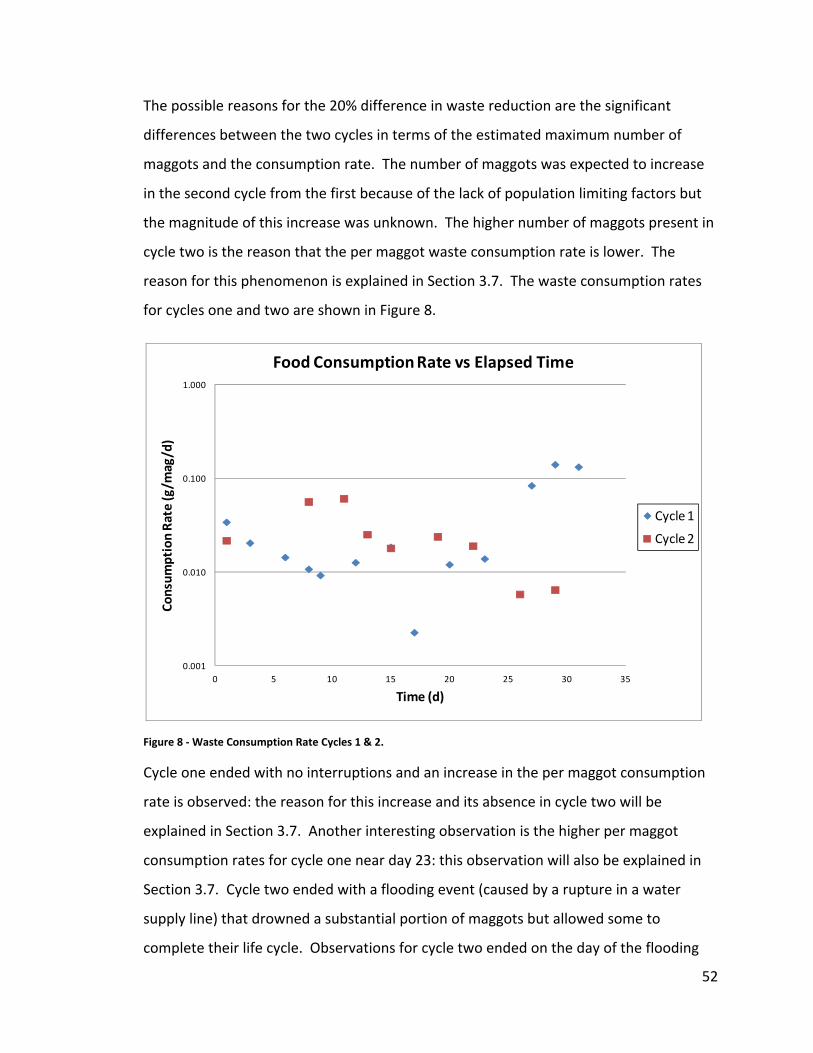
The possible reasons for the 20% difference in waste reduction are the significant
differences between the two cycles in terms of the estimated maximum number of
maggots and the consumption rate. The number of maggots was expected to increase
in the second cycle from the first because of the lack of population limiting factors but
the magnitude of this increase was unknown. The higher number of maggots present in
cycle two is the reason that the per maggot waste consumption rate is lower. The
reason for this phenomenon is explained in Section 3.7. The waste consumption rates
for cycles one and two are shown in Figure 8.
0.001
0.010
0.100
1.000
0 5 10 15 20 25 30 35
Consum
ption Rate (g/m
ag/d)
Time (d)
Food Consumption Rate vs Elapsed Time
Cycle 1
Cycle 2
Figure 8 ‐ Waste Consumption Rate Cycles 1 & 2.
Cycle one ended with no interruptions and an increase in the per maggot consumption
rate is observed: the reason for this increase and its absence in cycle two will be
explained in Section 3.7. Another interesting observation is the higher per maggot
consumption rates for cycle one near day 23: this observation will also be explained in
Section 3.7. Cycle two ended with a flooding event (caused by a rupture in a water
supply line) that drowned a substantial portion of maggots but allowed some to
complete their life cycle. Observations for cycle two ended on the day of the flooding
52
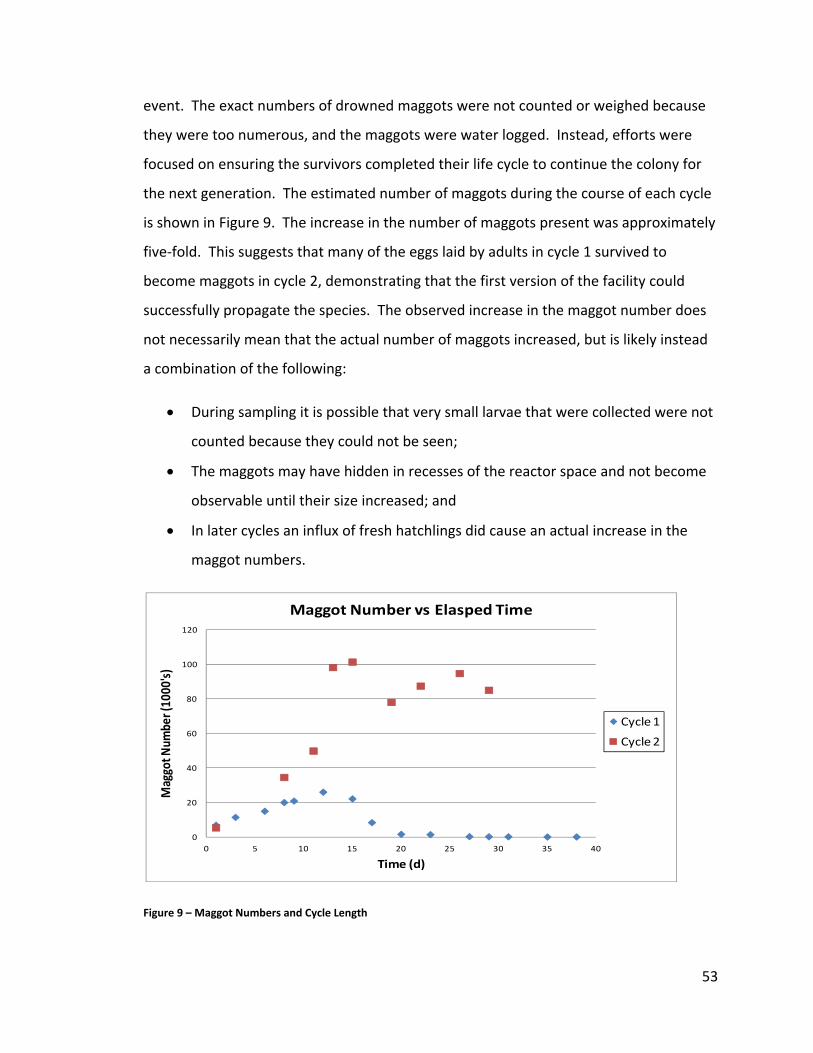
event. The exact numbers of drowned maggots were not counted or weighed because
they were too numerous, and the maggots were water logged. Instead, efforts were
focused on ensuring the survivors completed their life cycle to continue the colony for
the next generation. The estimated number of maggots during the course of each cycle
is shown in Figure 9. The increase in the number of maggots present was approximately
five‐fold. This suggests that many of the eggs laid by adults in cycle 1 survived to
become maggots in cycle 2, demonstrating that the first version of the facility could
successfully propagate the species. The observed increase in the maggot number does
not necessarily mean that the actual number of maggots increased, but is likely instead
a combination of the following:
• During sampling it is possible that very small larvae that were collected were not
counted because they could not be seen;
• The maggots may have hidden in recesses of the reactor space and not become
observable until their size increased; and
• In later cycles an influx of fresh hatchlings did cause an actual increase in the
maggot numbers.
0
20
40
60
80
100
120
0 5 10 15 20 25 30 35 40
Maggot N
umbe
r (10
00's)
Time (d)
Maggot Number vs Elasped Time
Cycle 1
Cycle 2
Figure 9 – Maggot Numbers and Cycle Length
53
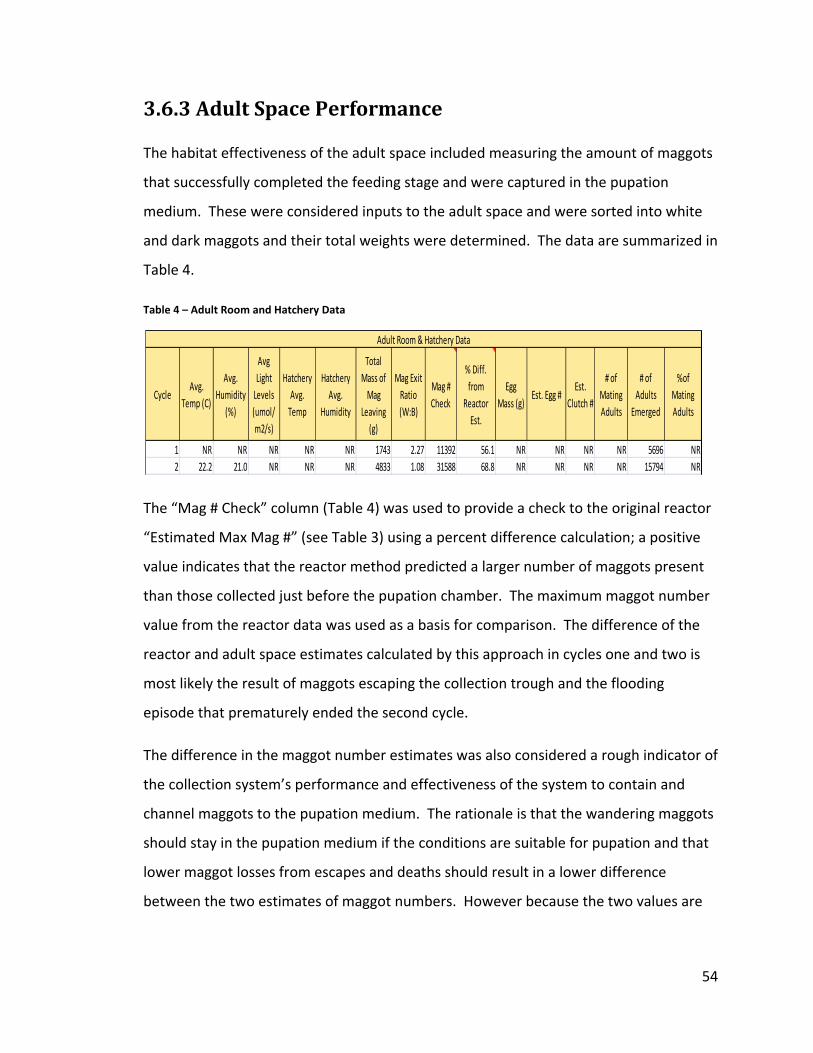
3.6.3 Adult Space Performance
The habitat effectiveness of the adult space included measuring the amount of maggots
that successfully completed the feeding stage and were captured in the pupation
medium. These were considered inputs to the adult space and were sorted into white
and dark maggots and their total weights were determined. The data are summarized in
Table 4.
Table 4 – Adult Room and Hatchery Data
CycleAvg.
Temp (C)
Avg. Humidity
(%)
Avg Light Levels (umol/m2/s)
Hatchery Avg. Temp
Hatchery Avg.
Humidity
Total Mass of Mag
Leaving (g)
Mag Exit Ratio (W:B)
Mag # Check
% Diff. from
Reactor Est.
Egg Mass (g)
Est. Egg #Est.
Clutch #
# of Mating Adults
# of Adults
Emerged
%of Mating Adults
1 NR NR NR NR NR 1743 2.27 11392 56.1 NR NR NR NR 5696 NR2 22.2 21.0 NR NR NR 4833 1.08 31588 68.8 NR NR NR NR 15794 NR
Adult Room & Hatchery Data
The “Mag # Check” column (Table 4) was used to provide a check to the original reactor
“Estimated Max Mag #” (see Table 3) using a percent difference calculation; a positive
value indicates that the reactor method predicted a larger number of maggots present
than those collected just before the pupation chamber. The maximum maggot number
value from the reactor data was used as a basis for comparison. The difference of the
reactor and adult space estimates calculated by this approach in cycles one and two is
most likely the result of maggots escaping the collection trough and the flooding
episode that prematurely ended the second cycle.
The difference in the maggot number estimates was also considered a rough indicator of
the collection system’s performance and effectiveness of the system to contain and
channel maggots to the pupation medium. The rationale is that the wandering maggots
should stay in the pupation medium if the conditions are suitable for pupation and that
lower maggot losses from escapes and deaths should result in a lower difference
between the two estimates of maggot numbers. However because the two values are
54
simply estimates, this parameter was used as a guide only to evaluate the effectiveness
of the collection system.
At this stage in the research assessment of adult performance was qualitative. Adults
were assessed on their activity level. Active flying and mating was considered
favourable to the health of the adults and by inference, a sign that the habitat was
functioning adequately.
The introduction of the pea gravel in the RS also created an unforeseen issue when fully
matured maggots began to pupate in it thereby eluding measurements. The previously
mentioned reasons are the only situations, aside from human error, that could account
for the difference in the maggot number estimation approaches. No evidence of pests,
such as mice or raccoons, which would eat the BSF maggots, was evident at this stage.
The method proposed to estimate the number of adults present in the reactor space
could not be implemented successfully. The uneven distribution of adults throughout
the three dimensional volume of the adult space made the attempts impractical. The
calculations outlined in the estimation approach relied on the assumption that the
amount of empty space could be reliably measured but this was not the case. The
amount of adults entering the system could be estimated via the amount of prepupa
entering but the number successfully emerging and mating could not.
The approach was later modified to use the estimates obtained from the mass balance
in Section 3.0.3 but this required the mass of the collected eggs. This later modification
is the reason why only cycle eight from the continuous operational mode and cycles one
to four from the batch mode have estimates of the adult number, mating pairs and
emergence. An estimate of emergence, 50%, was obtained from data found in Holmes
(2010) for an ambient relative humidity of 40%: these conditions were similar to those
found in the setup for this research.
55

3.6.4 Adult Space Infrastructure Issues
Containing the adults proved troublesome. The adults can exploit any small opening as
a means to escape. In particular, the acrylic caulking eventually failed and left open
seams throughout the adult space. Adult flies would get trapped between the two
plastic layers and eventually die. At its peak, the amount of open space appeared
sufficient for aerial questing and mating. During one instance, over 75 mating pairs
were counted, aerial questing was still occurring and many more mating pairs were
evident. Perhaps the largest problem in the adult space was the dead adults. After
mating the adults quickly die and their remains litter the floor. If not cleaned promptly,
the dead fly bodies would attract small insect pests to the facility; although sealed to the
greatest extent possible, the facility was neither sterile nor impervious.
Another issue was the amount of crevices present in the adult space. These were the
result of imperfect mating surfaces created by the construction materials and they
provided unintended egg laying sites for adults. Most of the eggs laid in these locations
died and were typically not found until they had dried out. It is unclear why adults
chose to lay their eggs in these locations when the hatchery was not visually saturated
with eggs. The lack of aromatic cues from actively feeding maggots may have
discouraged some adults from laying in the hatchery.
The adult chamber at this point in the research did not have artificial lights. Because the
adults successfully produced eggs and seeking solutions to design problems in the RS
were considered more urgent, selecting an artificial light source which could potentially
encourage BSF adult activities was delayed until the next winter season.
3.7 System Revision 1 – Calculation Assumptions
The mass of feed consumed on a per day basis was calculated as a constant value
throughout each feeding episode. For example, if 10 kg of food was given over ten days,
the calculations would show that 1 kg of food was consumed per day by a varying
56
number of maggots. One of the notable drawbacks of this approach is that the rate of
waste consumption on a per maggot basis appears to increase towards the end of the
cycle. This is because maggots are leaving the RS but the calculated per day
consumption for a feeding instance is held constant for a given feeding episode. Trying
to account for all variables to develop a variable feed consumption rate proved too
complex and was not feasible given the constraints of this research program. However,
the error introduced by this effect was attenuated by using a cycle averaged cDCRM to
calculate the waste loading rate for that cycle. These approaches were maintained
throughout the remainder of the research.
It is unlikely that the DCR remains constant for several reasons.
1. The number of maggots present in the reactor is not constant with time.
Maggots sometimes exit the food source and then return to it, while some
maggots do not return at all and are permanently lost. It was not feasible to
determine which maggots were feeding and which maggots were not.
2. Maggots die throughout the feeding cycle.
3. The mass of waste consumed per maggot changes with their size which is
itself a function of time and the individual differences between maggots. In
addition, maggot consumption rates also depend on the moisture content of
the food and temperature both of which can also vary with time.
Measuring the combined effect that these variations have on the DCR was outside the
scope of this research and the constant daily mass consumption assumption was
considered a compromise between observational accuracy and the logistics of data
collection. Unfortunately the actual number of maggots present in the RS could not be
determined at the start of a continuous cycle because the freshly eclosed maggots
would fall directly into the reactor bed and were not visible until they matured.
57
3.8 System Revision 2 –Subsystem Design Changes, April 4, 2010 to July 12, 2010
Based on the observations and lessons learned from the first two cycles the following
subsystems were changed:
• Reactor space – a cover was added to help retain moisture over the RS and the
number of mister nozzles was reduced from nine to six;
• Pupation trough – this was removed and a new pupation chamber was installed
inside the adult space;
• Exit ramp – the inclination of the ramp was changed from 40 degrees to 34
degrees and fins were added;
• Water collection system – this idea was suggested by Glen Courtright of
Enviroflight, Yellow Springs, Ohio;
• Adult space – a timer based watering system was installed so that the adults
would have access to water twice per day;
• A maggot / water separator was installed immediately upstream of the pupation
chamber;
• Sponges were added to the hatchery to provide a moist site for egg laying; and
• Misting nozzles were added to the inner greenhouse cooling fan to add humidity
and cool the greenhouse through evaporation.
The design changes did not affect how variables were measured or calculated in the RS
or the adult space. The most significant change in the second system revision was the
collection of migrating maggots. Instead of directly migrating into the pupation trough,
the maggots wandered into a system of 4‐inch ABS plastic pipes. The pipes were cut
along their axial length to create a channel. This channel was periodically filled with
water that drained by gravity to the maggot / water separator. The function of the
separator was to return water to the reservoir while allowing the migrating maggots to
58
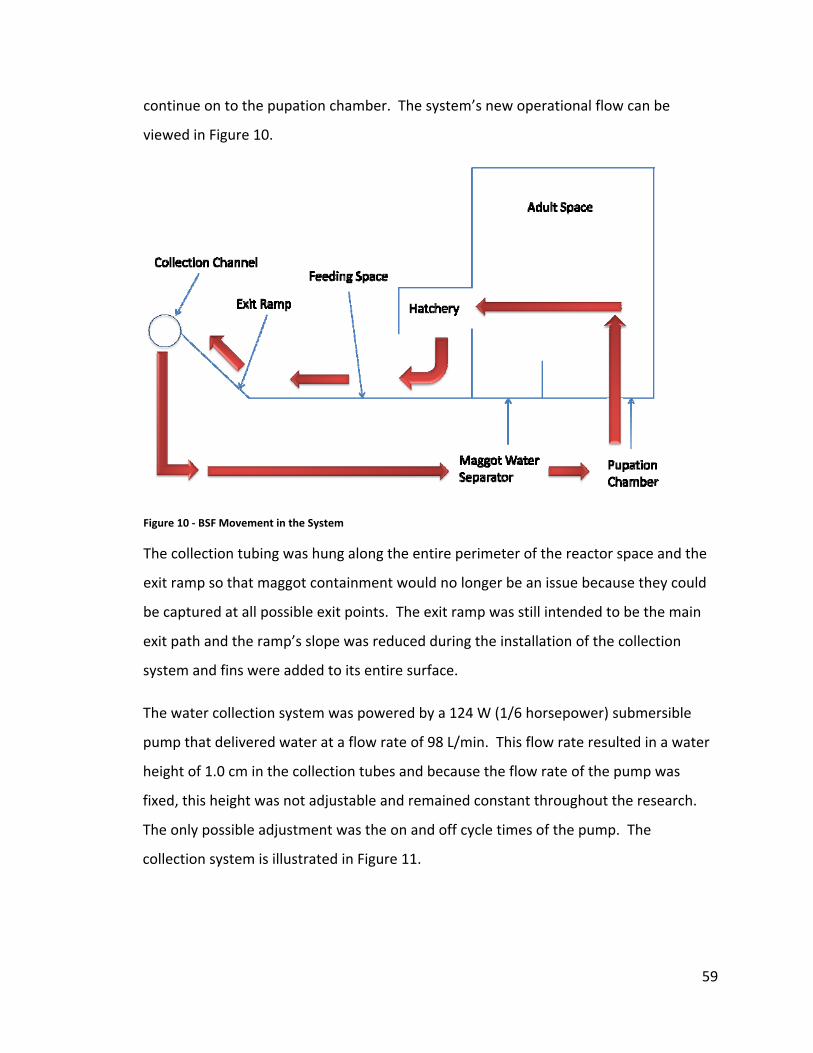
continue on to the pupation chamber. The system’s new operational flow can be
viewed in Figure 10.
Figure 10 ‐ BSF Movement in the System
The collection tubing was hung along the entire perimeter of the reactor space and the
exit ramp so that maggot containment would no longer be an issue because they could
be captured at all possible exit points. The exit ramp was still intended to be the main
exit path and the ramp’s slope was reduced during the installation of the collection
system and fins were added to its entire surface.
The water collection system was powered by a 124 W (1/6 horsepower) submersible
pump that delivered water at a flow rate of 98 L/min. This flow rate resulted in a water
height of 1.0 cm in the collection tubes and because the flow rate of the pump was
fixed, this height was not adjustable and remained constant throughout the research.
The only possible adjustment was the on and off cycle times of the pump. The
collection system is illustrated in Figure 11.
59
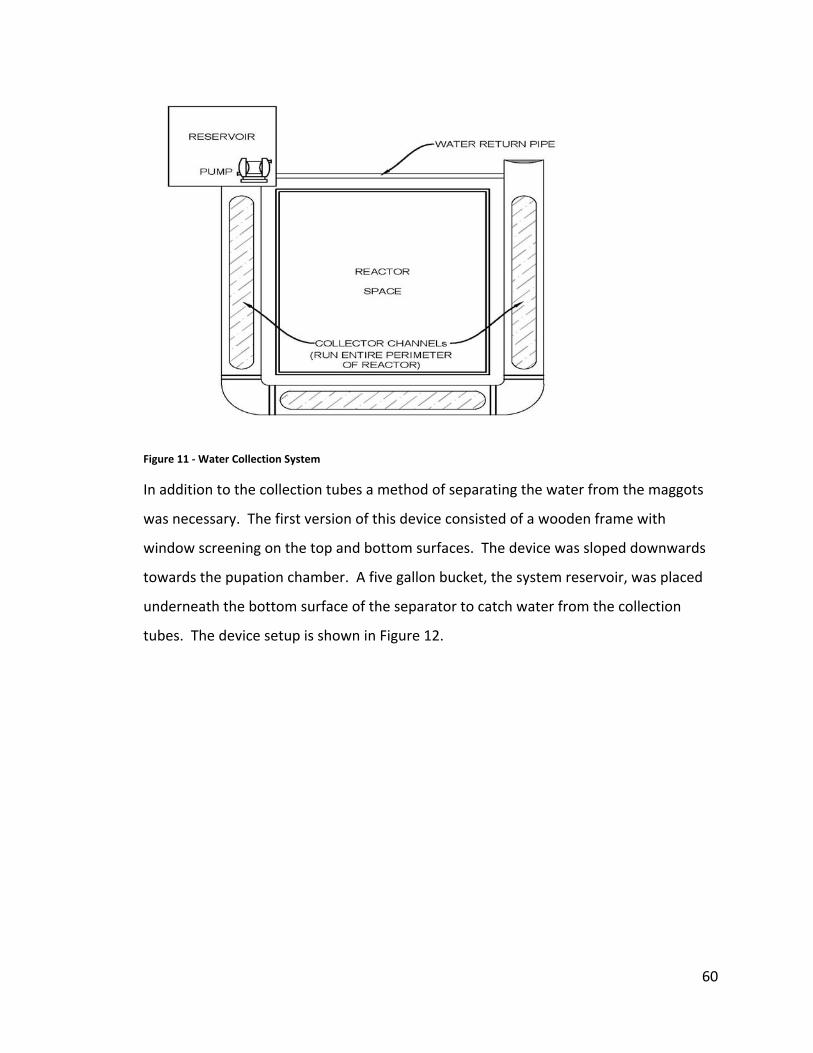
Figure 11 ‐ Water Collection System
In addition to the collection tubes a method of separating the water from the maggots
was necessary. The first version of this device consisted of a wooden frame with
window screening on the top and bottom surfaces. The device was sloped downwards
towards the pupation chamber. A five gallon bucket, the system reservoir, was placed
underneath the bottom surface of the separator to catch water from the collection
tubes. The device setup is shown in Figure 12.
60
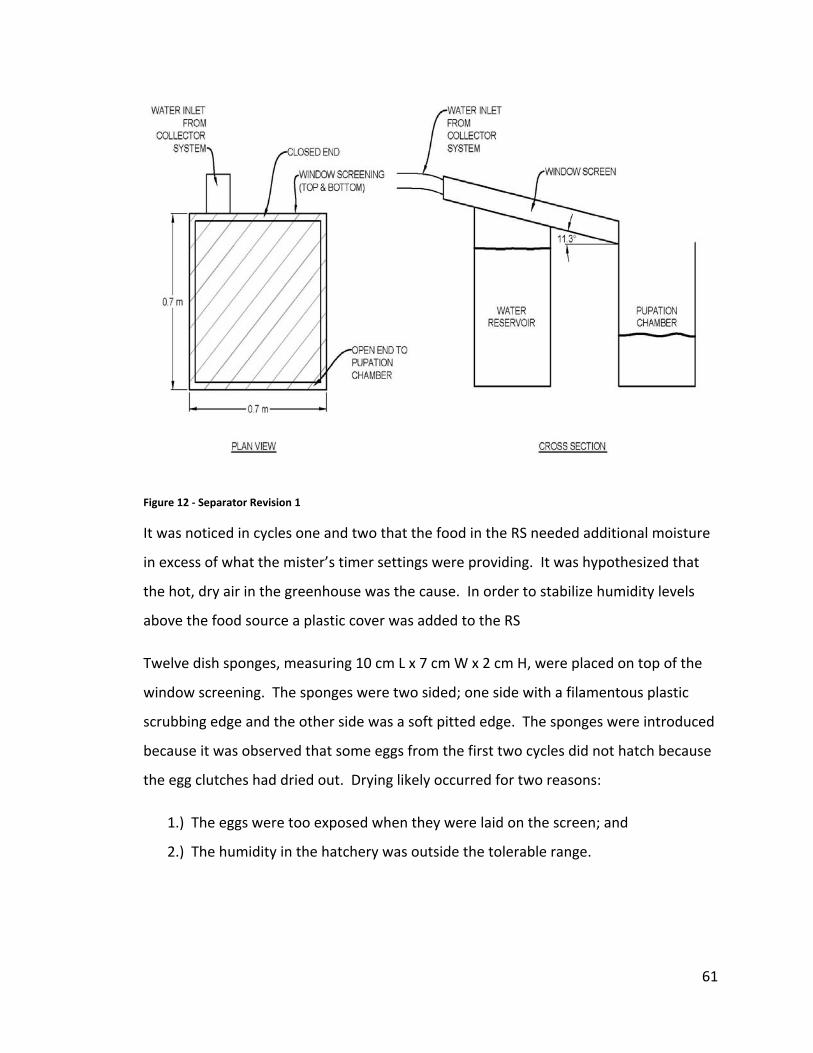
Figure 12 ‐ Separator Revision 1
It was noticed in cycles one and two that the food in the RS needed additional moisture
in excess of what the mister’s timer settings were providing. It was hypothesized that
the hot, dry air in the greenhouse was the cause. In order to stabilize humidity levels
above the food source a plastic cover was added to the RS
Twelve dish sponges, measuring 10 cm L x 7 cm W x 2 cm H, were placed on top of the
window screening. The sponges were two sided; one side with a filamentous plastic
scrubbing edge and the other side was a soft pitted edge. The sponges were introduced
because it was observed that some eggs from the first two cycles did not hatch because
the egg clutches had dried out. Drying likely occurred for two reasons:
1.) The eggs were too exposed when they were laid on the screen; and
2.) The humidity in the hatchery was outside the tolerable range.
61
The crevices in the sponges were meant to protect the eggs clutches from desiccation
and when wet, the sponges retained moisture in the hatchery. The sponges were kept
moist manually.
The main 30‐inch cooling fan for the greenhouse was fitted with six misting nozzles that
were controlled by the timer in the hatchery and the adult space.
An experimental problem arose from the change in the collection method for the
wandering maggots. The evaluation of the water separation device required that the
maggots have the freedom to pass through the device so that its effectiveness could be
assessed but if they traversed the device without being contained no reasonable
estimate of maggot production could be obtained without resorting to sieving the wood
chips in the pupation medium.
Sieving was a time consuming process and was considered inefficient. The solution was
to contain the maggots in the separation device, collect the mass data, and then re‐
insert the maggots in the collection tube and observe if they successfully traversed the
separation device. This was done every time maggots were present in the separation
device. No other performance evaluation methods were changed from those outlined
in revision one.
The system revisions were completed on April 1, 2010 and the system operated under
these conditions for cycles three, four and five.
3.8.1 Observations and Discussion
Waste processing in the RS continued successfully and with the addition of the cover the
food resource was kept moist throughout the cycles. Occasionally the food was found
to be dry but such instances were reduced from being a consistent occurrence to once
every two weeks. The performance markers were the same as in previous cycles, and
the data are summarized in Table 5.
62
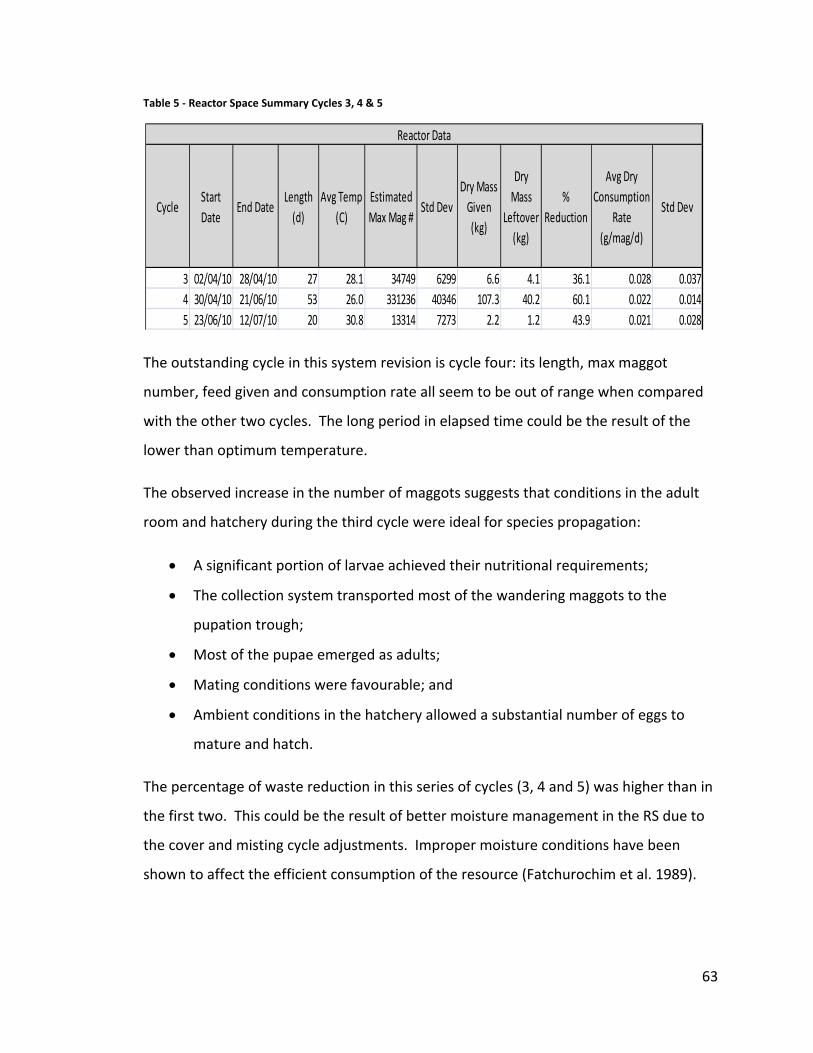
Table 5 ‐ Reactor Space Summary Cycles 3, 4 & 5
CycleStart Date
End DateLength (d)
Avg Temp (C)
Estimated Max Mag #
Std DevDry Mass Given (kg)
Dry Mass
Leftover (kg)
% Reduction
Avg Dry Consumption
Rate (g/mag/d)
Std Dev
3 02/04/10 28/04/10 27 28.1 34749 6299 6.6 4.1 36.1 0.028 0.0374 30/04/10 21/06/10 53 26.0 331236 40346 107.3 40.2 60.1 0.022 0.0145 23/06/10 12/07/10 20 30.8 13314 7273 2.2 1.2 43.9 0.021 0.028
Reactor Data
The outstanding cycle in this system revision is cycle four: its length, max maggot
number, feed given and consumption rate all seem to be out of range when compared
with the other two cycles. The long period in elapsed time could be the result of the
lower than optimum temperature.
The observed increase in the number of maggots suggests that conditions in the adult
room and hatchery during the third cycle were ideal for species propagation:
• A significant portion of larvae achieved their nutritional requirements;
• The collection system transported most of the wandering maggots to the
pupation trough;
• Most of the pupae emerged as adults;
• Mating conditions were favourable; and
• Ambient conditions in the hatchery allowed a substantial number of eggs to
mature and hatch.
The percentage of waste reduction in this series of cycles (3, 4 and 5) was higher than in
the first two. This could be the result of better moisture management in the RS due to
the cover and misting cycle adjustments. Improper moisture conditions have been
shown to affect the efficient consumption of the resource (Fatchurochim et al. 1989).
63
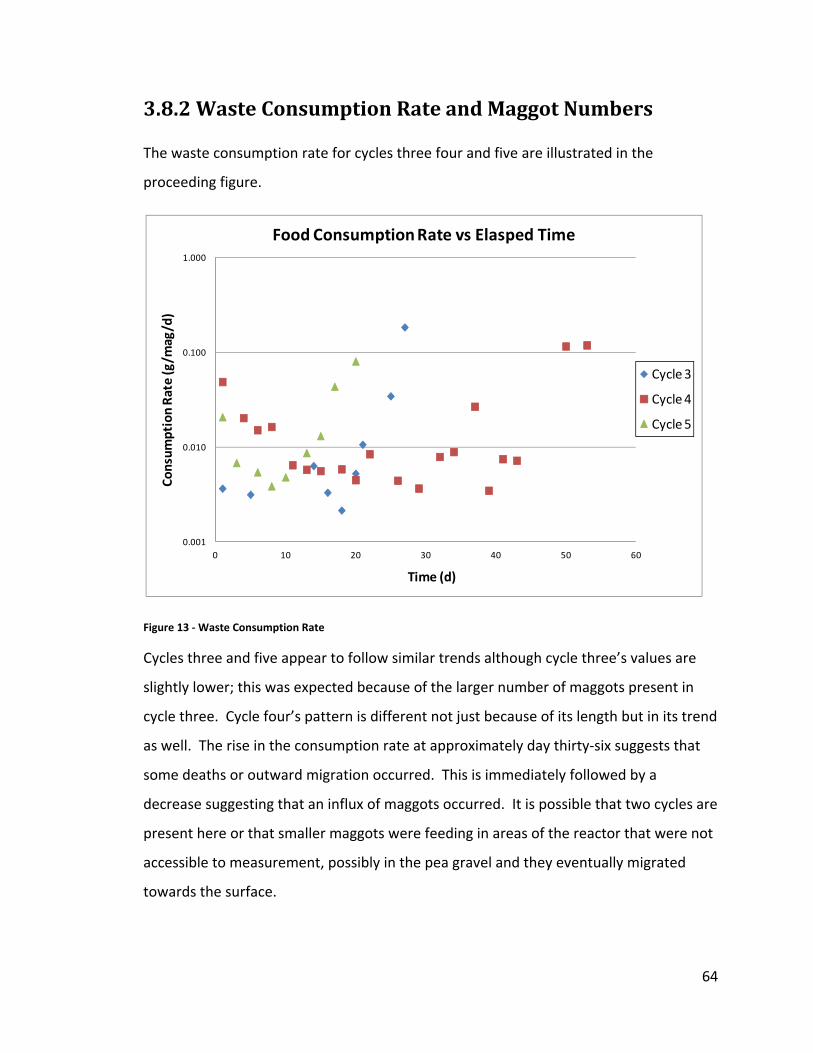
3.8.2 Waste Consumption Rate and Maggot Numbers
The waste consumption rate for cycles three four and five are illustrated in the
proceeding figure.
0.001
0.010
0.100
1.000
0 10 20 30 40 50 60
Consum
ption Rate (g/m
ag/d)
Time (d)
Food Consumption Rate vs Elasped Time
Cycle 3
Cycle 4
Cycle 5
Figure 13 ‐ Waste Consumption Rate
Cycles three and five appear to follow similar trends although cycle three’s values are
slightly lower; this was expected because of the larger number of maggots present in
cycle three. Cycle four’s pattern is different not just because of its length but in its trend
as well. The rise in the consumption rate at approximately day thirty‐six suggests that
some deaths or outward migration occurred. This is immediately followed by a
decrease suggesting that an influx of maggots occurred. It is possible that two cycles are
present here or that smaller maggots were feeding in areas of the reactor that were not
accessible to measurement, possibly in the pea gravel and they eventually migrated
towards the surface.
64
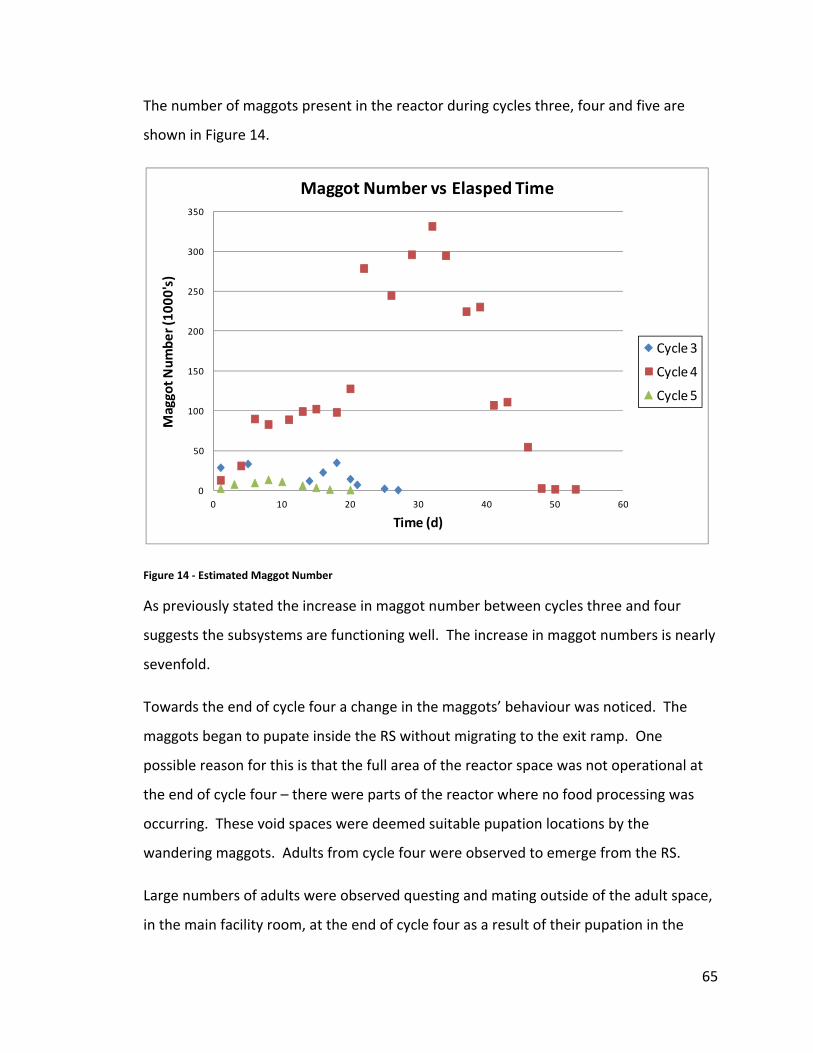
The number of maggots present in the reactor during cycles three, four and five are
shown in Figure 14.
0
50
100
150
200
250
300
350
0 10 20 30 40 50 60
Maggot N
umbe
r (10
00's)
Time (d)
Maggot Number vs Elasped Time
Cycle 3
Cycle 4
Cycle 5
Figure 14 ‐ Estimated Maggot Number
As previously stated the increase in maggot number between cycles three and four
suggests the subsystems are functioning well. The increase in maggot numbers is nearly
sevenfold.
Towards the end of cycle four a change in the maggots’ behaviour was noticed. The
maggots began to pupate inside the RS without migrating to the exit ramp. One
possible reason for this is that the full area of the reactor space was not operational at
the end of cycle four – there were parts of the reactor where no food processing was
occurring. These void spaces were deemed suitable pupation locations by the
wandering maggots. Adults from cycle four were observed to emerge from the RS.
Large numbers of adults were observed questing and mating outside of the adult space,
in the main facility room, at the end of cycle four as a result of their pupation in the
65

reactor space. The majority of adults that were outside of the adult space escaped the
greenhouse and presumably completed their life cycle elsewhere. The exact numbers of
adults lost, and therefore potential eggs, were unknown. This loss of biomass
significantly lowered the number of maggots observed in cycle five.
3.8.3 Reactor Space Design Issues
Another issue with the RS operation was the buildup of materials in the pea gravel at
the end of cycle five. The void spaces (~ 3 to 7 mm) of the pea gravel were perhaps too
small or conditions became too dry because they became clogged with semi‐solid food.
Eventually, the trapped food became anaerobic, and the maggots subsequently avoided
it, and so the system was shut down. Cleaning the void spaces proved impractical so the
gravel was removed during the second major set of system design changes and the
trickling filter setup was abandoned. Some of the waste from cycle five was lost during
the pea gravel removal process.
Although the trickling filter setup was abandoned because of clogging, it should be
possible to solve the clogging issue with a change of media from pea gravel to a
substance with a larger grain size and larger void spaces, such as using Styrofoam
“peanuts” encased in a net. The Styrofoam peanuts would have the advantage of being
low weight, inert, and could be contained as removable modular units simplifying the
cleaning task. This approach was not implemented because of time constraints.
3.8.4 Exit Ramp Design Changes
During the middle of cycle three adjustments were made to the exit ramp, the slope was
lowered and fins were added to the ramp. The lower slope proved easier for the
maggots to traverse; the number of maggots that successfully negotiated the ramp on
their first try was observed to increase. Fins were also installed on the exit ramp. The
fins covered the entire inclined length of the ramp and were 3.8 cm wide and spaced 3.8
cm apart to create channels. Prior to their installation the only vertical edges that
66
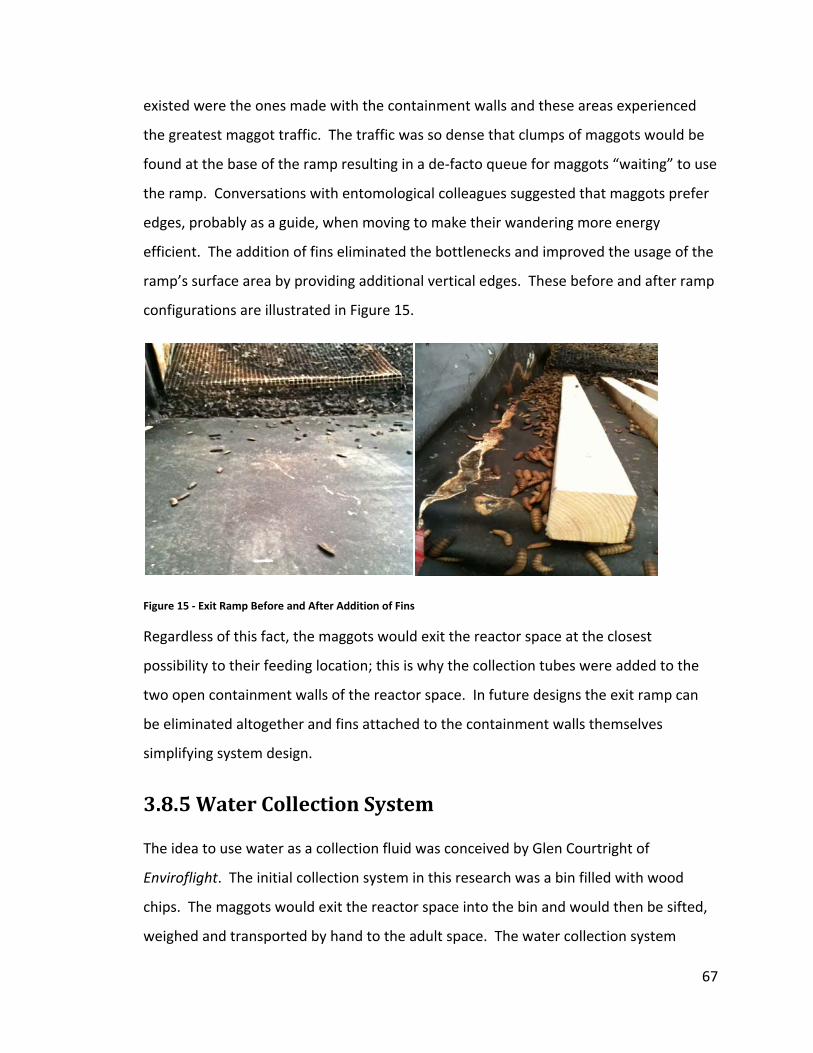
existed were the ones made with the containment walls and these areas experienced
the greatest maggot traffic. The traffic was so dense that clumps of maggots would be
found at the base of the ramp resulting in a de‐facto queue for maggots “waiting” to use
the ramp. Conversations with entomological colleagues suggested that maggots prefer
edges, probably as a guide, when moving to make their wandering more energy
efficient. The addition of fins eliminated the bottlenecks and improved the usage of the
ramp’s surface area by providing additional vertical edges. These before and after ramp
configurations are illustrated in Figure 15.
Figure 15 ‐ Exit Ramp Before and After Addition of Fins
Regardless of this fact, the maggots would exit the reactor space at the closest
possibility to their feeding location; this is why the collection tubes were added to the
two open containment walls of the reactor space. In future designs the exit ramp can
be eliminated altogether and fins attached to the containment walls themselves
simplifying system design.
3.8.5 Water Collection System
The idea to use water as a collection fluid was conceived by Glen Courtright of
Enviroflight. The initial collection system in this research was a bin filled with wood
chips. The maggots would exit the reactor space into the bin and would then be sifted,
weighed and transported by hand to the adult space. The water collection system
67
greatly reduced the labour input into this task. It also eliminated the need for the
maggots to exit at the ramp because the collection piping was installed along the entire
open perimeter of the reactor space.
The collection system consisted of three parts:
1. The collection piping;
2. A reservoir;
3. The maggot and water separation device; and
4. The pump.
The pump was set to operate on a timer 14 times per day, roughly every 2 hours for 4
minutes. These settings were usually satisfactory when a full migration wave was not
occurring. There were two instances when the collection tubes were found to be
overflowing with migrating maggots because the pump was in between operational
cycles. The temporary solution was to keep the pump operating constantly. This
approach is inefficient because when the maggots are not migrating, the electricity to
power the pump is wasted; the pump maintains water flow but there are too few, if any,
maggots to collect. In later cycles this issue was resolved using a repeat cycle timer. In
larger facilities the use of motion sensors to activate the pump would be a more
effective solution.
The collection system also had an added benefit: the water used to transport the
maggots through the collection system also cleaned them of residue. Interestingly
residue accumulating in the collection pipes, the separation device and the water
reservoir appears to be nutrient rich and encouraged algae growth. This collection
water could be conceivably used for irrigation, particularly if the BSF facility is to be
located near other agricultural operations.
In the previous system revision maggots exiting the RS would be covered in a film of
liquefied food. This sticky film and would cause the wood chip to stick to the maggots.
It is unknown if this situation had detrimental effects on the pupae but residue began to
68
build up in the pupation chamber which necessitated removing the clumping wood
chips.
The collection system was cleaned, using water, once or twice per run, depending on
the number of migrating maggots. This helped maintain flow characteristics in the
collection piping, efficient operation of the separation device and prevented damage to
the pump by debris.
The reservoir of the system at this stage of the research was not modified. It housed a
submergible pump that rested on top of a metal screen to prevent clogging of the intake
manifold. The pump then returns water to the start of the collection piping via half pipe
of CPVC.
3.8.6 Maggot / Water Separation Device
The performance of the separation device was poor; the setup separated the maggots
from the water but there were some unacceptable drawbacks. The downward slope
was not a favourable condition; the maggots were observed to prefer crawling upwards.
This caused a situation where the maggots formed masses in the upper corners of the
separation device; eventually the maggots destroyed the screening and were able to
escape.
In addition, the downward slope allowed water to enter the pupation chamber because
the window screening, which functioned as the separation material, allowed the water
to form a film across it that in turn allowed incoming water to drain into the pupation
chamber. The introduction of excess moisture created conditions that attracted other
insects to the pupation chamber. Samples of the insects were collected and taken to
the lab for identification; most were identified as benign so no initial efforts were made
to remove them at the end of cycle three. Instead, efforts concentrated on preventing
the water from entering the pupation chamber through the use of a baffle. While this
approach helped, it was not considered a solution and the separation device was
redesigned in the next system revision.
69
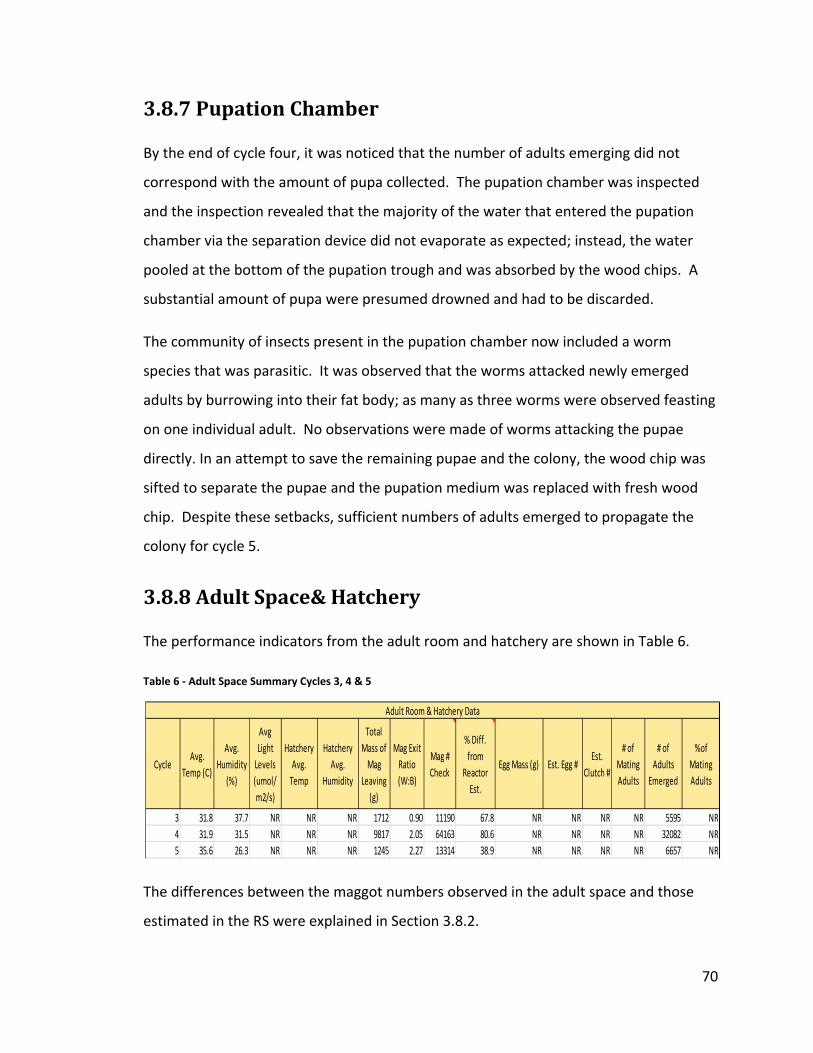
3.8.7 Pupation Chamber
By the end of cycle four, it was noticed that the number of adults emerging did not
correspond with the amount of pupa collected. The pupation chamber was inspected
and the inspection revealed that the majority of the water that entered the pupation
chamber via the separation device did not evaporate as expected; instead, the water
pooled at the bottom of the pupation trough and was absorbed by the wood chips. A
substantial amount of pupa were presumed drowned and had to be discarded.
The community of insects present in the pupation chamber now included a worm
species that was parasitic. It was observed that the worms attacked newly emerged
adults by burrowing into their fat body; as many as three worms were observed feasting
on one individual adult. No observations were made of worms attacking the pupae
directly. In an attempt to save the remaining pupae and the colony, the wood chip was
sifted to separate the pupae and the pupation medium was replaced with fresh wood
chip. Despite these setbacks, sufficient numbers of adults emerged to propagate the
colony for cycle 5.
3.8.8 Adult Space& Hatchery
The performance indicators from the adult room and hatchery are shown in Table 6.
Table 6 ‐ Adult Space Summary Cycles 3, 4 & 5
CycleAvg.
Temp (C)
Avg. Humidity
(%)
Avg Light Levels (umol/m2/s)
Hatchery Avg. Temp
Hatchery Avg.
Humidity
Total Mass of Mag
Leaving (g)
Mag Exit Ratio (W:B)
Mag # Check
% Diff. from
Reactor Est.
Egg Mass (g) Est. Egg #Est.
Clutch #
# of Mating Adults
# of Adults
Emerged
%of Mating Adults
3 31.8 37.7 NR NR NR 1712 0.90 11190 67.8 NR NR NR NR 5595 NR4 31.9 31.5 NR NR NR 9817 2.05 64163 80.6 NR NR NR NR 32082 NR5 35.6 26.3 NR NR NR 1245 2.27 13314 38.9 NR NR NR NR 6657 NR
Adult Room & Hatchery Data
The differences between the maggot numbers observed in the adult space and those
estimated in the RS were explained in Section 3.8.2.
70
Light levels were not yet measured but because mating and egg laying were occurring
successfully, light conditions were not investigated immediately. Despite adjustments
made to the misting system’s timer to correct humidity levels, the ambient humidity
was outside the optimum range. When coupled with high temperatures, these
circumstances were thought to be responsible for the desiccation of an unknown
number of eggs.
A snap shot of the temperature and humidity levels for the periods in question are
illustrated in Figures 16 and 17. From these figures it can be seen that optimal ranges
were difficult to maintain.
71

Figure 16 ‐ Adult Room Temperatures, Cycles 3, 4 & 5
0
10
20
30
40
50
60
70
80
90
100
0 10 20 30 40 50 60
Humidity
%
Time Days
Relative Humidity vs Time
Cycle 3
Cycle 4
Cycle 5
OptimalRange
Figure 17 ‐ Adult Room Relative Humidity, Cycles 3, 4 & 5
72
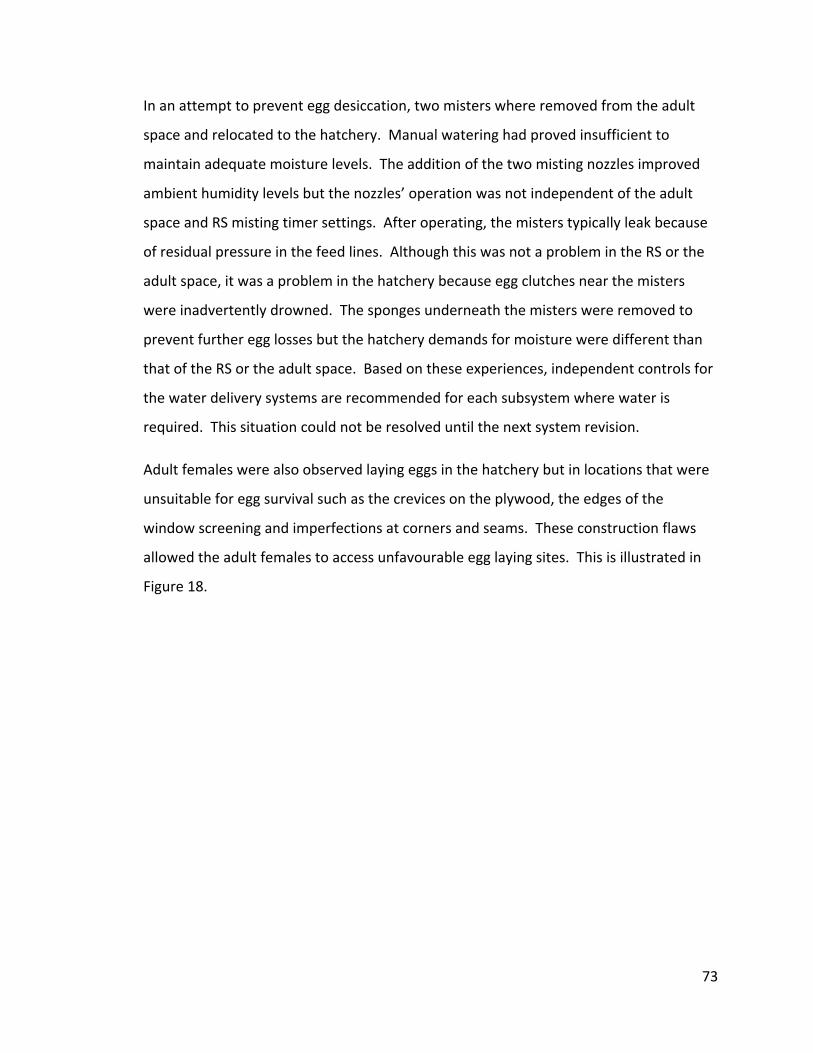
In an attempt to prevent egg desiccation, two misters where removed from the adult
space and relocated to the hatchery. Manual watering had proved insufficient to
maintain adequate moisture levels. The addition of the two misting nozzles improved
ambient humidity levels but the nozzles’ operation was not independent of the adult
space and RS misting timer settings. After operating, the misters typically leak because
of residual pressure in the feed lines. Although this was not a problem in the RS or the
adult space, it was a problem in the hatchery because egg clutches near the misters
were inadvertently drowned. The sponges underneath the misters were removed to
prevent further egg losses but the hatchery demands for moisture were different than
that of the RS or the adult space. Based on these experiences, independent controls for
the water delivery systems are recommended for each subsystem where water is
required. This situation could not be resolved until the next system revision.
Adult females were also observed laying eggs in the hatchery but in locations that were
unsuitable for egg survival such as the crevices on the plywood, the edges of the
window screening and imperfections at corners and seams. These construction flaws
allowed the adult females to access unfavourable egg laying sites. This is illustrated in
Figure 18.
73

Egg Losses
Figure 18 ‐ Unfavourable Egg Laying Sites in Hatchery
Many egg clutches appeared desiccated, most likely because of their location in the
hatchery. Hatchlings from these eggs were unable to reach the RS and consume the
nutrition source. These losses were considered avoidable and therefore the hatchery
was redesigned in the next system revision. Further losses were observed with the
freshly emerged hatchlings. The scrubbing face of the sponges consisted of a plastic
mesh that allowed the hatchlings to become trapped and eventually drown. The
number of hatchlings lost in this fashion could not be determined. A temporary solution
was to remove the scrubbing edge from the sponges. This approach was met with
limited success because the hatchlings would burrow into the sponge itself and become
trapped. This situation was not repaired until the next system revision so the system
operated with these losses.
3.8.9 Seasonal Issues
Summertime operation presented new issues. During the winter months exchange with
the outside air was limited and as a result, maintaining environmental conditions was
not overly problematic. In the summertime the double greenhouse effect caused
74
temperatures to reach intolerable levels without active cooling. The greenhouse relied
on a constant flow of outside air, coupled with evaporative cooling, to maintain
tolerable temperatures. This constant influx of external air made internal humidity
levels the same as external levels: when external humidity levels were adequate the
circumstances were not detrimental but when they were inadequate, there was little
that could be done to stabilize humidity to optimum levels.
3.9 System Revision 3 – Subsystem Design Changes, August 23, 2010 to January 31, 2011
After completion of cycle five the system was shutdown, eggs were collected and
incubated at the University’s Biology lab and the following second set of major revisions
were implemented:
• The trickling filter setup was abandoned and the use of a potentially digestible
bulking agent was introduced;
• The air compressor and its associated piping were removed;
• A new cover was constructed for the exit ramp to deflect air from the
greenhouse cooling fan away from the RS and the cover over the RS was
replaced;
• A separate misting system for the RS was installed and the number of nozzles
was reduced from six to five. The adult space and hatchery misters were still
controlled by the same timer;
• The water maggot separator was removed and redesigned;
• The collection system’s reservoir was replaced with another container of larger
volume;
• The hatchery was torn down and completely redesigned to remove unwanted
egg laying sites;
• New plastic egg cartridges were introduced;
• Separate temperature and humidity sensors were installed in the hatchery;
75
• Light levels were measured in the adult space and outside; and
• Lights were installed in the adult space.
The removal of the trickling filter setup eliminated problems with clogging but because
the maggots used the gravel’s void spaces for support, the use of a bulking agent
became necessary. Straw was chosen for this task because it was abundant, inexpensive
and potentially digestible by the maggots. Even if the maggots did not digest the straw,
its presence in the finished residue was not expected to affect its usability in agricultural
applications. The straw was purchased from local suppliers and was ground up prior to
use in the grinder to reduce its size.
The waste was ground to the consistency of oatmeal for storage. This was controlled by
the careful addition of water during the grinding process. Exact records of the required
quantity of water to achieve this grind were not kept. The bailed straw was too long for
direct addition into the feed. The straw was ground so that the individual stalks
measured approximately 1 to 3 cm in length.
Aeration was replaced by hand turning of the waste to provide oxygen. This was not
done on a scheduled basis but only when odours became a problem. Odours were
generally not an issue because the maggots would consume the waste before odours
became a significant problem.
However during the course of the experiments foul odours were observed four times.
The generation of odours originates with anaerobic bacteria. The maggots and the
bacteria are thought to be in direct competition with each other for the waste food. In
three of the cases the odours were observed during the initial startup period between
September 2009 and December 2009. In all three cases the odours were present on a
Monday after a weekend. The last case of odours occurred on Monday October 18,
2010 during cycle 7. The site was visited every other day unless holidays, bad weather
or site access issues prevented it. This suggests that the time before odours become a
76
problem is in the range of 2 to 3 days without any aeration for the feed used in this
research.
The old reactor space cover was replaced because of damage it sustained during the
previous cycles and to accommodate the water collection system. The old cover would
sometimes fall into the collection piping clogging the system and causing spillage of the
collection fluid. The separate misting controls for the RS and adult room and hatchery
allowed for more efficient use of the water: the water supply demands could now be
met separately for each subsystem.
The most extensive design changes were implemented on the hatchery. No part of the
old hatchery was saved. The shape of the hatchery was changed from triangular to
rectangular. The walls of the new hatchery were constructed from high density
polyethylene instead of plywood. The smooth surfaces were meant to discourage egg
laying in unwanted locations. Any imperfections or joints were sealed with acrylic
caulking.
The hatchery was also divided into two separate areas each measuring 0.762 m L x
0.305 m D. These areas were the openings that separated the hatchery from the RS that
was located below. It is into these openings that the egg laying cartridges were placed.
The cartridges were made of plastic cardboard from advertising signs. The plastic was
cut into 0.305 m L x 0.003 m W x 0.0254 m D pieces to expose their inner channeled
edge. Each cartridge had two holes drilled into their smooth side so that two threaded
steel rods could be inserted to join all the cartridges together. The channel openings
measured 5 mm L x 3 mm W. After both egg laying units were assembled, they were
installed in the hatchery and the setup was checked to ensure that no openings existed
that could allow adults to escape. The two misting nozzles were reinstalled to provide
moisture. The comparatively hard surface of the plastic was expected to prevent
hatchlings from becoming entangled or trapped in the hatchery infrastructure.
77
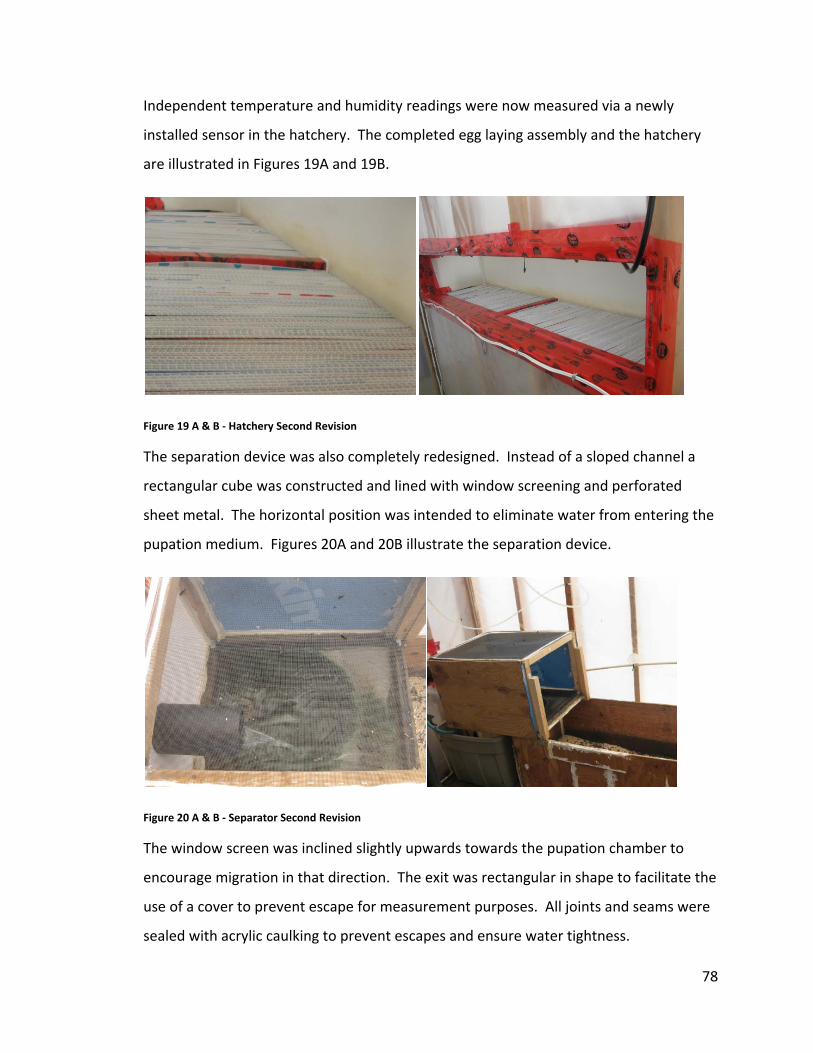
Independent temperature and humidity readings were now measured via a newly
installed sensor in the hatchery. The completed egg laying assembly and the hatchery
are illustrated in Figures 19A and 19B.
Figure 19 A & B ‐ Hatchery Second Revision
The separation device was also completely redesigned. Instead of a sloped channel a
rectangular cube was constructed and lined with window screening and perforated
sheet metal. The horizontal position was intended to eliminate water from entering the
pupation medium. Figures 20A and 20B illustrate the separation device.
Figure 20 A & B ‐ Separator Second Revision
The window screen was inclined slightly upwards towards the pupation chamber to
encourage migration in that direction. The exit was rectangular in shape to facilitate the
use of a cover to prevent escape for measurement purposes. All joints and seams were
sealed with acrylic caulking to prevent escapes and ensure water tightness.
78
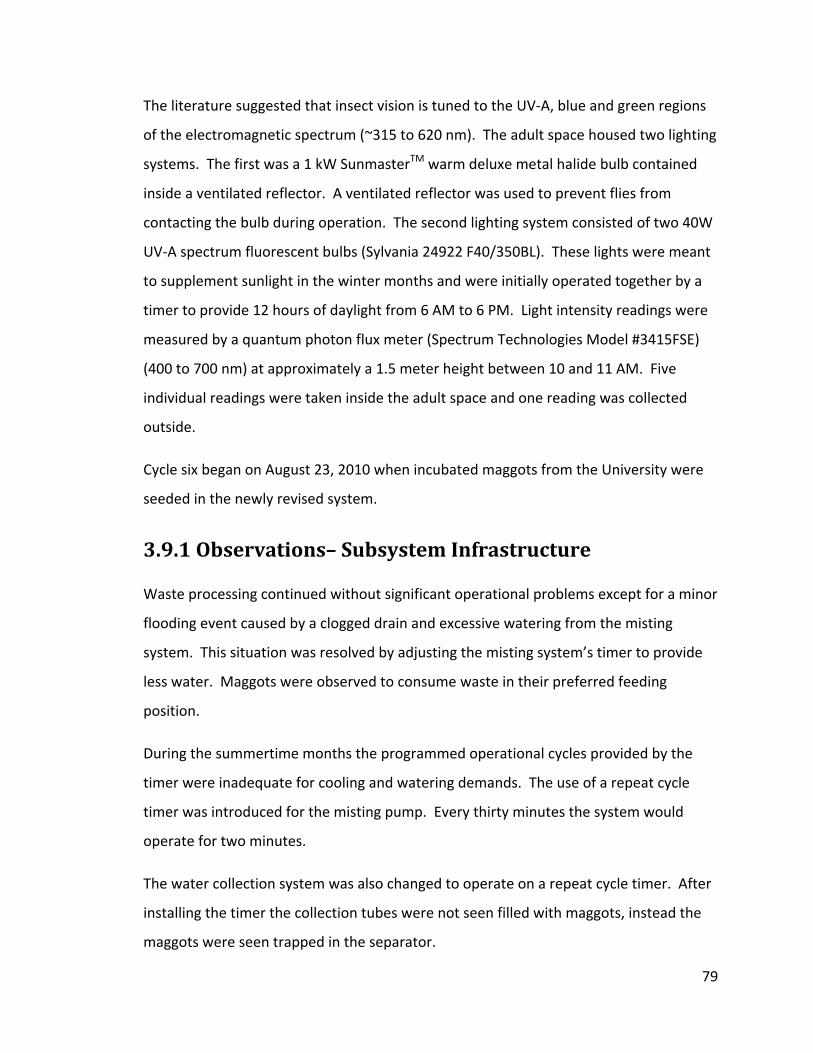
The literature suggested that insect vision is tuned to the UV‐A, blue and green regions
of the electromagnetic spectrum (~315 to 620 nm). The adult space housed two lighting
systems. The first was a 1 kW SunmasterTM warm deluxe metal halide bulb contained
inside a ventilated reflector. A ventilated reflector was used to prevent flies from
contacting the bulb during operation. The second lighting system consisted of two 40W
UV‐A spectrum fluorescent bulbs (Sylvania 24922 F40/350BL). These lights were meant
to supplement sunlight in the winter months and were initially operated together by a
timer to provide 12 hours of daylight from 6 AM to 6 PM. Light intensity readings were
measured by a quantum photon flux meter (Spectrum Technologies Model #3415FSE)
(400 to 700 nm) at approximately a 1.5 meter height between 10 and 11 AM. Five
individual readings were taken inside the adult space and one reading was collected
outside.
Cycle six began on August 23, 2010 when incubated maggots from the University were
seeded in the newly revised system.
3.9.1 Observations– Subsystem Infrastructure
Waste processing continued without significant operational problems except for a minor
flooding event caused by a clogged drain and excessive watering from the misting
system. This situation was resolved by adjusting the misting system’s timer to provide
less water. Maggots were observed to consume waste in their preferred feeding
position.
During the summertime months the programmed operational cycles provided by the
timer were inadequate for cooling and watering demands. The use of a repeat cycle
timer was introduced for the misting pump. Every thirty minutes the system would
operate for two minutes.
The water collection system was also changed to operate on a repeat cycle timer. After
installing the timer the collection tubes were not seen filled with maggots, instead the
maggots were seen trapped in the separator.
79
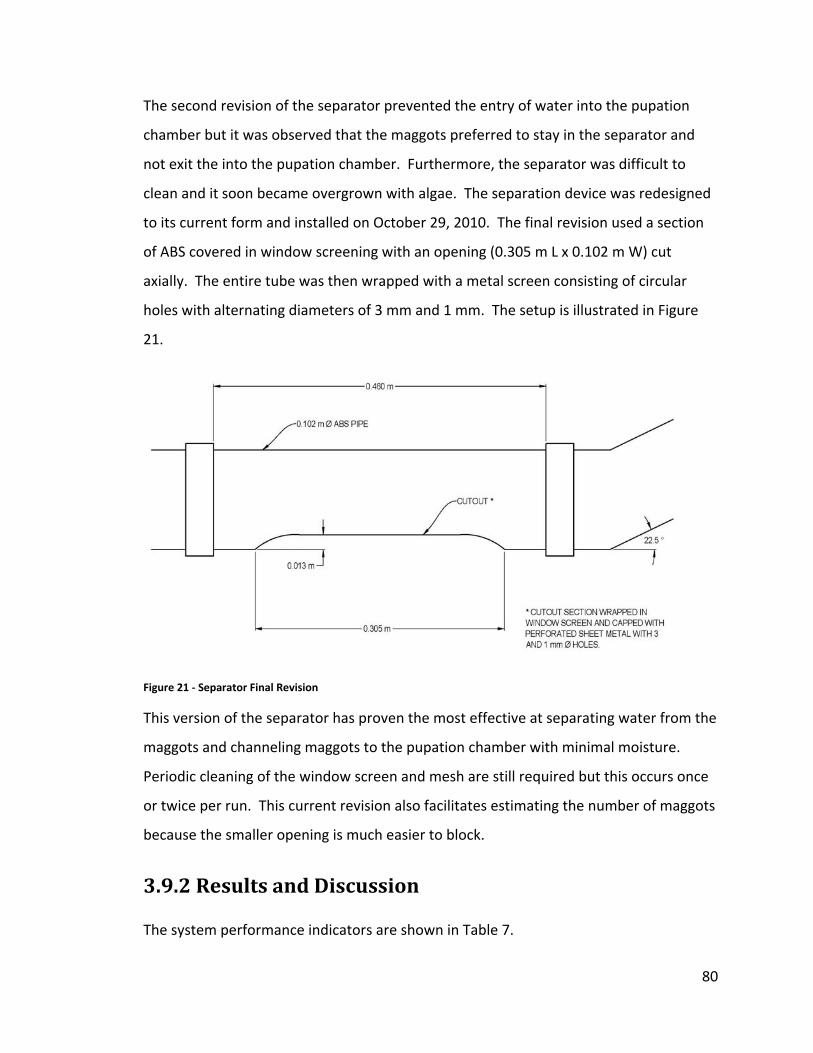
The second revision of the separator prevented the entry of water into the pupation
chamber but it was observed that the maggots preferred to stay in the separator and
not exit the into the pupation chamber. Furthermore, the separator was difficult to
clean and it soon became overgrown with algae. The separation device was redesigned
to its current form and installed on October 29, 2010. The final revision used a section
of ABS covered in window screening with an opening (0.305 m L x 0.102 m W) cut
axially. The entire tube was then wrapped with a metal screen consisting of circular
holes with alternating diameters of 3 mm and 1 mm. The setup is illustrated in Figure
21.
Figure 21 ‐ Separator Final Revision
This version of the separator has proven the most effective at separating water from the
maggots and channeling maggots to the pupation chamber with minimal moisture.
Periodic cleaning of the window screen and mesh are still required but this occurs once
or twice per run. This current revision also facilitates estimating the number of maggots
because the smaller opening is much easier to block.
3.9.2 Results and Discussion
The system performance indicators are shown in Table 7.
80
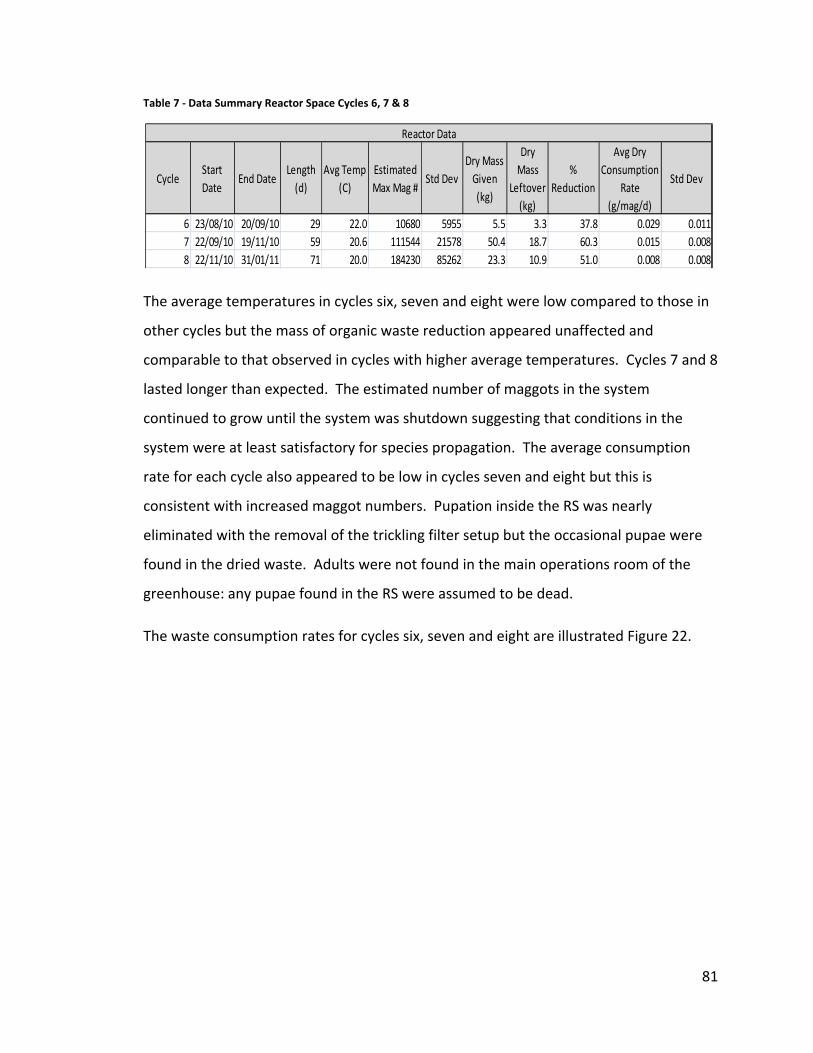
Table 7 ‐ Data Summary Reactor Space Cycles 6, 7 & 8
CycleStart Date
End DateLength (d)
Avg Temp (C)
Estimated Max Mag #
Std DevDry Mass Given (kg)
Dry Mass
Leftover (kg)
% Reduction
Avg Dry Consumption
Rate (g/mag/d)
Std Dev
6 23/08/10 20/09/10 29 22.0 10680 5955 5.5 3.3 37.8 0.029 0.0117 22/09/10 19/11/10 59 20.6 111544 21578 50.4 18.7 60.3 0.015 0.0088 22/11/10 31/01/11 71 20.0 184230 85262 23.3 10.9 51.0 0.008 0.008
Reactor Data
The average temperatures in cycles six, seven and eight were low compared to those in
other cycles but the mass of organic waste reduction appeared unaffected and
comparable to that observed in cycles with higher average temperatures. Cycles 7 and 8
lasted longer than expected. The estimated number of maggots in the system
continued to grow until the system was shutdown suggesting that conditions in the
system were at least satisfactory for species propagation. The average consumption
rate for each cycle also appeared to be low in cycles seven and eight but this is
consistent with increased maggot numbers. Pupation inside the RS was nearly
eliminated with the removal of the trickling filter setup but the occasional pupae were
found in the dried waste. Adults were not found in the main operations room of the
greenhouse: any pupae found in the RS were assumed to be dead.
The waste consumption rates for cycles six, seven and eight are illustrated Figure 22.
81

0.001
0.010
0.100
1.000
0 10 20 30 40 50 60 70 80
Consum
ption Rate (g/m
ag/d)
Time (d)
Food Consumption Rate vs Elasped Time
Cycle 6
Cycle 7
Cycle 8
Figure 22 ‐ Waste Consumption Rate
Although the average waste consumption rate for cycles seven and eight differ, the
trends for both appear similar. Cycle six follows a similar shape but because the overall
number of maggots is less, its values are somewhat larger. Cycle six is about half the
length of cycles 7 and 8. The number of maggots present in the reactor for cycles six,
seven and eight are shown in the Figure 23.
82
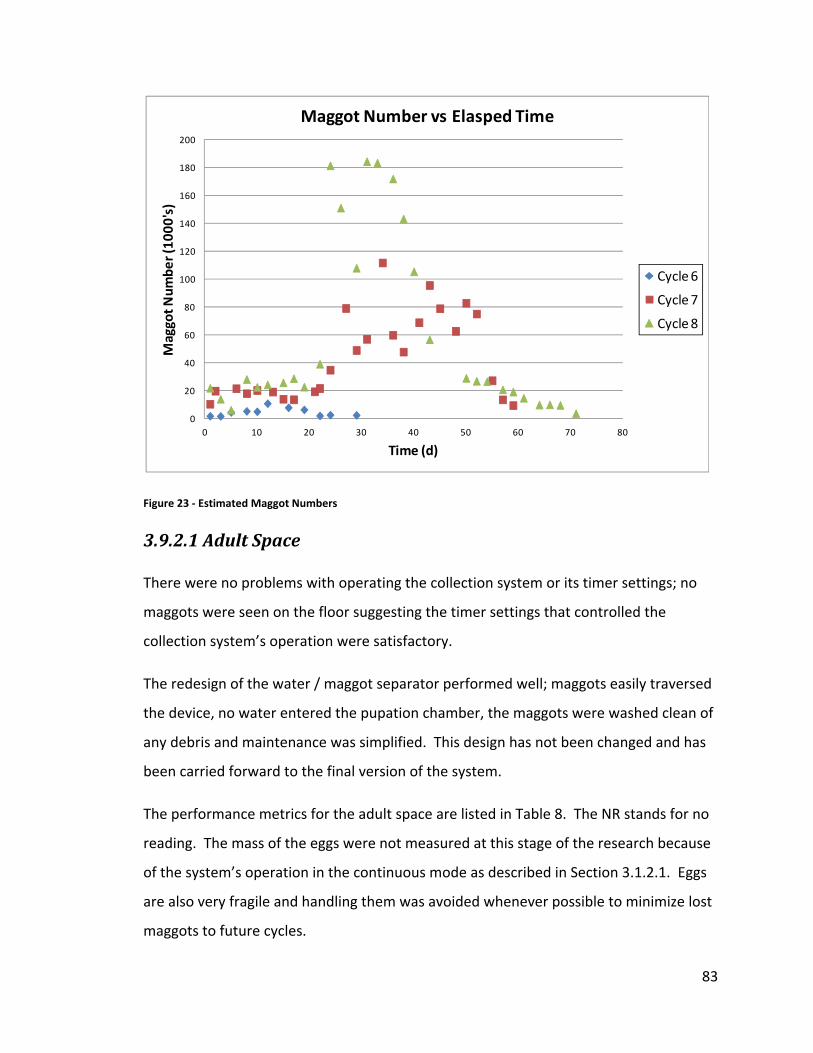
0
20
40
60
80
100
120
140
160
180
200
0 10 20 30 40 50 60 70 80
Maggot N
umbe
r (10
00's)
Time (d)
Maggot Number vs Elasped Time
Cycle 6
Cycle 7
Cycle 8
Figure 23 ‐ Estimated Maggot Numbers
3.9.2.1 Adult Space
There were no problems with operating the collection system or its timer settings; no
maggots were seen on the floor suggesting the timer settings that controlled the
collection system’s operation were satisfactory.
The redesign of the water / maggot separator performed well; maggots easily traversed
the device, no water entered the pupation chamber, the maggots were washed clean of
any debris and maintenance was simplified. This design has not been changed and has
been carried forward to the final version of the system.
The performance metrics for the adult space are listed in Table 8. The NR stands for no
reading. The mass of the eggs were not measured at this stage of the research because
of the system’s operation in the continuous mode as described in Section 3.1.2.1. Eggs
are also very fragile and handling them was avoided whenever possible to minimize lost
maggots to future cycles.
83
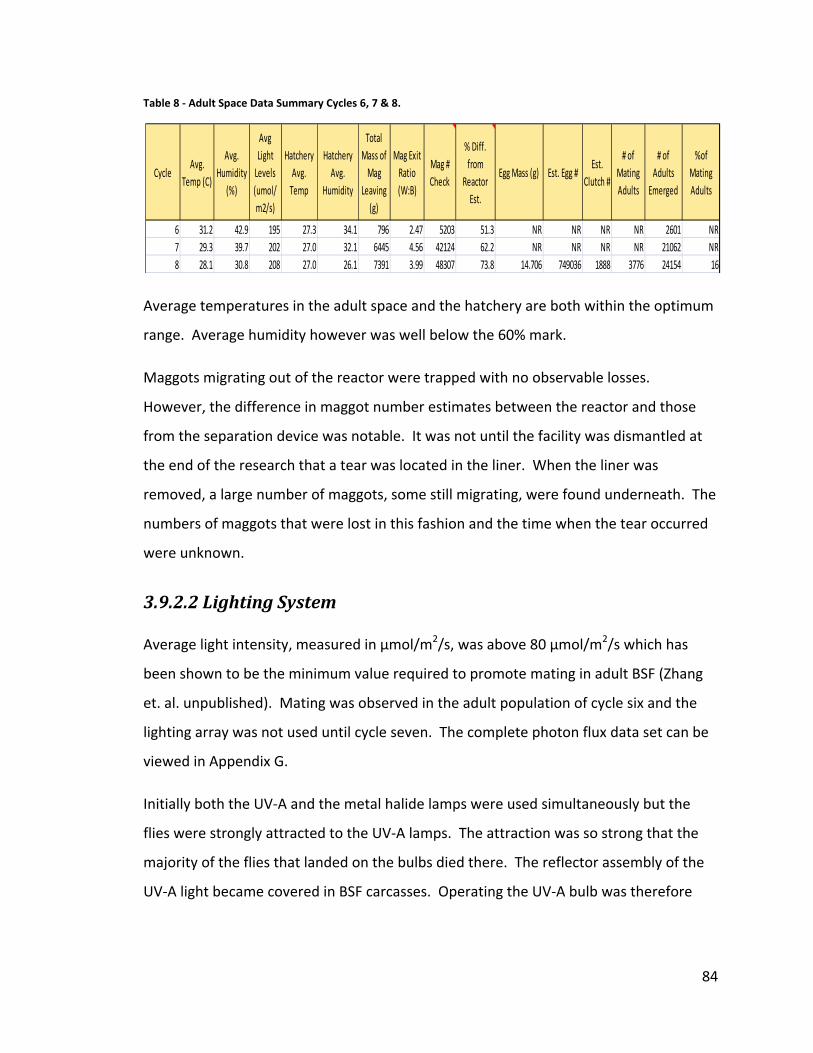
Table 8 ‐ Adult Space Data Summary Cycles 6, 7 & 8.
CycleAvg.
Temp (C)
Avg. Humidity
(%)
Avg Light Levels (umol/m2/s)
Hatchery Avg. Temp
Hatchery Avg.
Humidity
Total Mass of Mag
Leaving (g)
Mag Exit Ratio (W:B)
Mag # Check
% Diff. from
Reactor Est.
Egg Mass (g) Est. Egg #Est.
Clutch #
# of Mating Adults
# of Adults
Emerged
%of Mating Adults
6 31.2 42.9 195 27.3 34.1 796 2.47 5203 51.3 NR NR NR NR 2601 NR7 29.3 39.7 202 27.0 32.1 6445 4.56 42124 62.2 NR NR NR NR 21062 NR8 28.1 30.8 208 27.0 26.1 7391 3.99 48307 73.8 14.706 749036 1888 3776 24154 16
Average temperatures in the adult space and the hatchery are both within the optimum
range. Average humidity however was well below the 60% mark.
Maggots migrating out of the reactor were trapped with no observable losses.
However, the difference in maggot number estimates between the reactor and those
from the separation device was notable. It was not until the facility was dismantled at
the end of the research that a tear was located in the liner. When the liner was
removed, a large number of maggots, some still migrating, were found underneath. The
numbers of maggots that were lost in this fashion and the time when the tear occurred
were unknown.
3.9.2.2 Lighting System
Average light intensity, measured in µmol/m2/s, was above 80 µmol/m2/s which has
been shown to be the minimum value required to promote mating in adult BSF (Zhang
et. al. unpublished). Mating was observed in the adult population of cycle six and the
lighting array was not used until cycle seven. The complete photon flux data set can be
viewed in Appendix G.
Initially both the UV‐A and the metal halide lamps were used simultaneously but the
flies were strongly attracted to the UV‐A lamps. The attraction was so strong that the
majority of the flies that landed on the bulbs died there. The reflector assembly of the
UV‐A light became covered in BSF carcasses. Operating the UV‐A bulb was therefore
84
discontinued shortly after adult emergence during cycle seven. After discontinuing the
UV‐A light, the adults seemed to behave normally.
Insect vision is known to be faster than human vision so it is possible that the
fluorescent light source used, cycling at 60 Hz, did not appear as a continuous source of
light to the adult BSF causing unintended behaviours. Another possibility is that the
light source wattage was too high for its location: 80 watts at less than 1 meter could be
too intense for the adult BSF. This could not be measured with the photon flux meter
because it was limited to the visible light range.
The wattage of the UV‐A light source was selected based on the percentage of UV‐A
light in sunlight, approximately 8.5%2, and because the light source was a 1000 watt
bulb, an 80 watt UV‐A light source was selected. There was no guidance in the literature
about the intensity or range of UV wavelengths that stimulate BSF mating behaviours.
Although the use of the UV‐A light source was discontinued, the documented role of
UV‐A in insect vision and the strong response of the adults to the light source suggests
that further research is necessary to determine the particular wavelengths of light in the
UV‐A spectrum and their intensity that positively affect adult BSF mating behaviour.
This knowledge could greatly facilitate mating in commercial facilities and would
eliminate the reliance on sunlight, which is greatly reduced during winter months in
northern climates and can be obscured by cloud cover, to stimulate mating. Because
newly emerged adults only have a narrow time span to mate, a system that could
stimulate their mating behaviour with artificial light sources would be more reliable
than one based on sunlight.
The 1 kW bulb continued operating throughout the winter months on a 12‐hour cycle
without interruption. Adults were observed to quest, mate and eventually lay eggs. The
average photon flux observed by the meter varied in each cycle but the levels appeared
adequate to propagate the colony. Not further lighting adjustments were made and
2Hhttp://www.apogeeinstruments.com/spectroradiometer/improvinguv.html
85
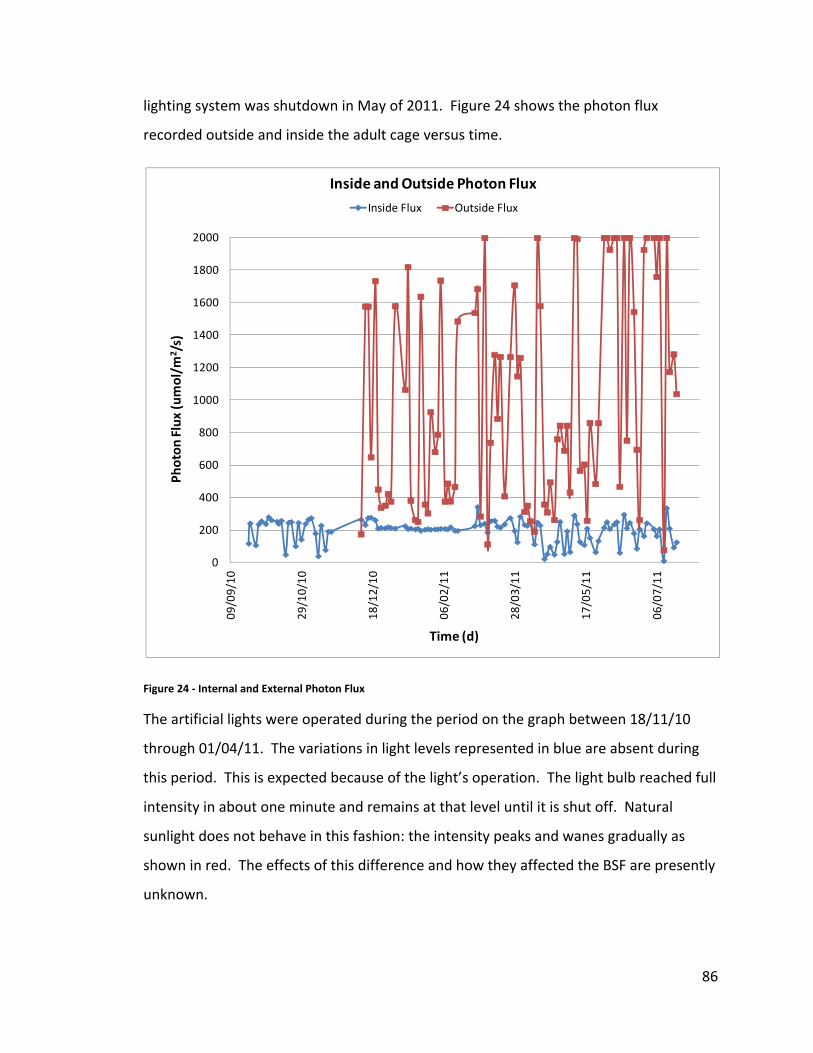
lighting system was shutdown in May of 2011. Figure 24 shows the photon flux
recorded outside and inside the adult cage versus time.
0
200
400
600
800
1000
1200
1400
1600
1800
200009
/09/10
29/10/10
18/12/10
06/02/11
28/03/11
17/05/11
06/07/11
Photon
Flux (umol/m
2 /s)
Time (d)
Inside and Outside Photon Flux
Inside Flux Outside Flux
Figure 24 ‐ Internal and External Photon Flux
The artificial lights were operated during the period on the graph between 18/11/10
through 01/04/11. The variations in light levels represented in blue are absent during
this period. This is expected because of the light’s operation. The light bulb reached full
intensity in about one minute and remains at that level until it is shut off. Natural
sunlight does not behave in this fashion: the intensity peaks and wanes gradually as
shown in red. The effects of this difference and how they affected the BSF are presently
unknown.
86
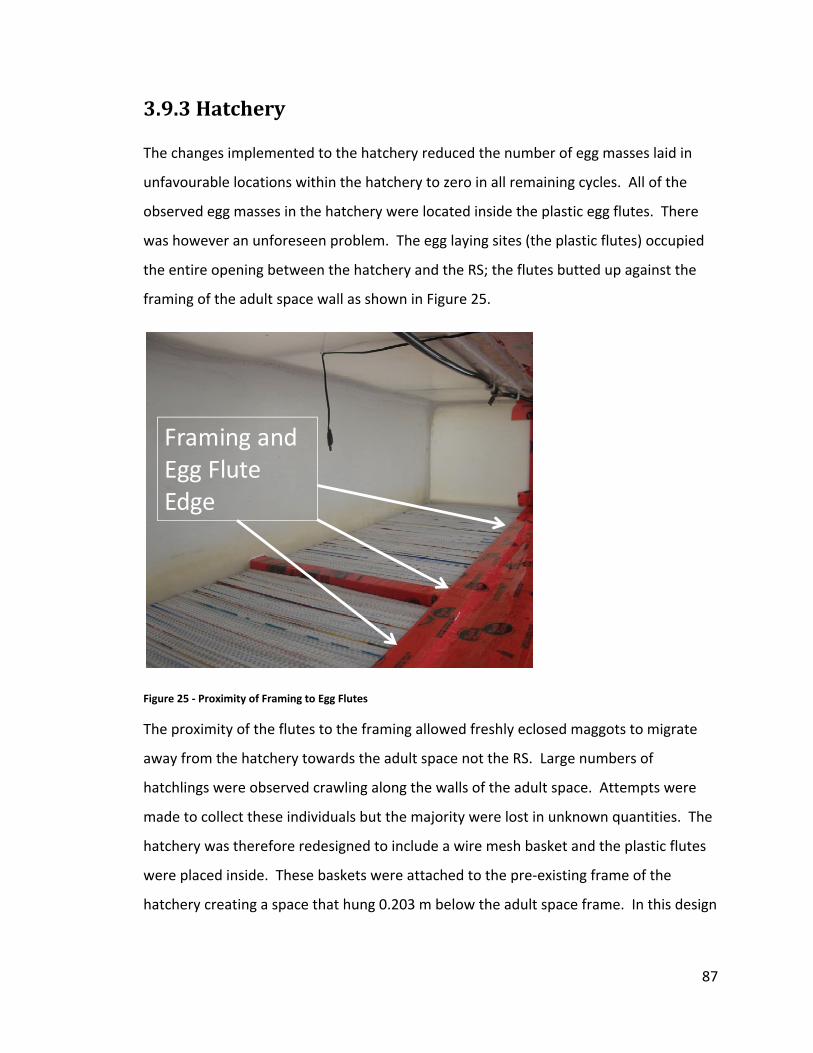
3.9.3 Hatchery
The changes implemented to the hatchery reduced the number of egg masses laid in
unfavourable locations within the hatchery to zero in all remaining cycles. All of the
observed egg masses in the hatchery were located inside the plastic egg flutes. There
was however an unforeseen problem. The egg laying sites (the plastic flutes) occupied
the entire opening between the hatchery and the RS; the flutes butted up against the
framing of the adult space wall as shown in Figure 25.
Framing and Egg Flute Edge
Figure 25 ‐ Proximity of Framing to Egg Flutes
The proximity of the flutes to the framing allowed freshly eclosed maggots to migrate
away from the hatchery towards the adult space not the RS. Large numbers of
hatchlings were observed crawling along the walls of the adult space. Attempts were
made to collect these individuals but the majority were lost in unknown quantities. The
hatchery was therefore redesigned to include a wire mesh basket and the plastic flutes
were placed inside. These baskets were attached to the pre‐existing frame of the
hatchery creating a space that hung 0.203 m below the adult space frame. In this design
87

the freshly eclosed maggots would fall into the RS before they had a chance to escape
into the adult space. The cage design is shown in Figure 26.
Figure 26 ‐ Hatchery with Hanging Basket
The old egg cartridges were cut in half and placed in an upright triangular position (as
opposed to horizontally) exposing both sides of the flutes to the adults (not shown).
This setup was employed for cycles seven and eight.
No further escapes were observed with the new system design. Placing the eggs flutes
at an incline (~45o) also increased the available egg laying sites and allowed excess
water from the misters to drain instead of collecting on top of the egg cartridges. The
egg cartridges should be oriented vertically in any future versions.
3.10 Major Operational Issues
Although the system functioned as intended there were some operational issues that
prevented ideal conditions and presumably peak efficiencies. Optimal environmental
conditions were difficult to maintain over the course of this research. Temperatures
were often outside of the optimum range in the summer months and optimal humidity
88
levels were difficult to maintain year round, this was most likely the result of the
greenhouse construction. The variability in temperature caused by the double
greenhouse infrastructure was the cause of many setbacks.
The location of the system, inside two greenhouses, greatly complicated efforts to cool
the facility in the summer. The greenhouse scenario was chosen because of its
availability but exposure to sunlight is only relevant for the adults; in fact, a “full"
greenhouse enclosure is not necessary. Even in the adult room, full transparency to
light likely is not required; observations of adult behaviour showed that adults will
actively seek out a light source. Instead of full greenhouse construction all that is likely
required is a window permitting sunlight to enter throughout the day. The size of this
window would depend on the number of adults present and the space available: the
design relationships for this window were not researched. Based on these observations
the ideal housing structure could be a hybrid facility consisting of a greenhouse for the
adult space and a separate covered and insulated building for the maggots to process
waste.
The change in construction should improve energy efficiency and help stabilize
environmental conditions from those experienced in the double greenhouse setup
which caused of most the BSF maggot and adult casualties and subsequent problems.
It was also challenging to contain both the maggots and the adults. The water collection
system ultimately contained the maggots effectively. To improve maggot containment
the feeding space should be constructed as one solid piece from a corrosion resistant
material, preferably from non‐reactive plastic or a corrosion resistant non‐leaching
metal.
The adults can be contained with proper construction materials and techniques. The
adult space will require the use of materials that have smooth surfaces and can form
seamless joints with other surfaces to prevent egg laying in unwanted locations and to
permit easy cleaning. This smooth crevice‐free surface requirement should also be
applied to any equipment or structures within the adult space. Plastic in rolls, such as
89
those used in vapour barriers, were found to perform satisfactorily for this purpose.
Seams and joints should be sealed with silicone or another sealant that remains flexible
throughout its lifespan. Acrylic caulking is not recommended because it cracks and
forms crevices.
Mammalian and avian pests were originally expected to pose problems but did not
during the course of study. Proper processing and handling of the food waste prevented
such nuisance elements. The food waste was ground up, mixed with water and stored
in five gallon air tight buckets. This deterred cats, rats, mice and raccoons– which were
all present at the landfill – from seeking out the food waste. Parasitic pests were not
seen to attack the feeding maggots and housefly populations were non‐existent, except
when the BSF maggots suddenly died from environmental variables. This further
demonstrated the ability of BSF maggots to exclude other fly species from a food source
and thereby restrict their propagation.
However, several pest species did eventually saturate the pupation medium. The
pupating maggots, and the remaining pupal casings, are a food source for various other
organisms including beetles, worms, aphids and spiders. Repeated observations suggest
that only the worms were detrimental to the pupa and the emerging adults.
Plant life should also be considered in the adult space. Adult males have been shown to
claim spaces on plants and use them as a launching pad during aerial questing
(Tomberlin and Sheppard 2001). A natural setting will likely encourage and assist the
effectiveness of the mating cycle.
3.11 Design Changes and Preparation for Batch Operations
The end of cycle eight marked the end of the system’s operation in the continuous
mode. After its end all of the BSF biomass was removed from the facility. The system
was cleaned and any eggs in the cartridges were weighed which provided the first
90
isolated opportunity to estimate the mass of eggs produced by a cycle. It also revealed
a difficulty with the data collection method: the egg cartridge assemblies were too
heavy and large to measure with the available scale. Because no other scale was readily
available, new and smaller egg cartridges were assembled measuring 50 mm L x 50 mm
W x 25 mm H. The flute dimensions were not affected. Sixty‐four cartridges were
installed in total, 32 in each of the hatchery divisions.
A humidification system that was controlled separately from the greenhouse
humidification system was installed in the hatchery to help maintain hospitable
conditions. This system used the hot exhaust air from the 1 kW light’s cooling fan. The
air was circulated through a plenum where two ultrasonic misters atomized water
adding moisture to the air which was then redirected back to the hatchery via a 2‐inch
diameter ABS perforated tube. These changes made the hatchery more hospitable in
the winter for the sensitive eggs and reduced the need for frequent operator
intervention, such as adding moisture, moving eggs and so forth, which could impact the
system.
After cycle eight the system was shut down, cleaned and minor overhauls were made to
subsystems. No significant design changes were implemented.
91

Chapter 4 Batch Operations
92

4.0 Batch Operations
Operating the system in the continuous mode demonstrated that the BSF species could
be propagated in artificial conditions during the winter months in northern climates. In
many ways, this would emulate a working system that processed waste and generated
BSF maggots which could then be used for secondary application, such as livestock feed.
The next set of experiments operated the system in “batch” mode – or one BSF
grouping (or cohort) at a time to determine if the species was more efficient at waste
reduction with only one cohort present at any given time in the reactor and if operation
of a facility would be more practical using this approach. A batch operation allowed for
easier measurement of operational variables because life cycle stages were easier to
identify with little to no overlap between different cohorts.
4.1 Methods
The data collected from the RS and the methods used to collect them were same as
those in the continuous set of experiments. One notable difference in this operation
was the way eggs were handled.
After eggs were laid in the cartridges they were brought to the University lab for
measurements and incubation until they hatched; this operation typically lasted one
week before they were returned to the landfill facility. During this one‐week period the
newly hatched maggots were fed a diet of chicken feed. This change in procedure was
necessary to accurately measure the mass of eggs obtained from each cycle. The eggs
were then incubated to minimize their handling before returning the one week old larva
to the landfill.
The first of four batch runs commenced on February 2, 2011 with the addition of freshly
eclosed larva.
93
4.2 Observations
No significant differences were noted from previous operations. Maggots continued to
consume waste and migration was observed as expected. The collection of waste
residue proved simpler and it was easier to determine when the feeding and migration
cycles ended. As expected, the population increased between cycles one and two
because of the nature of the flies’ reproductive strategy but the increase was modest.
Adult behaviour appeared normal (aerial questing and mating pairs were observed) at
the end of cycle one but no eggs were visible during the time when eggs were expected
to be laid. It was originally thought that the ambient conditions (high temperatures and
low humidity) were forcing the gravid (egg carrying) females to delay egg laying until
favourable conditions were present.
Searching the adult space revealed that egg laying had in fact been occurring but not in
the hatchery. Instead, the majority of eggs were found in the crevices around the
pupation medium and in the southeast corner of the adult space on the floor. By the
time the eggs were discovered, some of them had already hatched and reached their
second or third instar phase. The nutrition source used by these hatchlings was not
determined. All of the found eggs were collected and taken to the university lab for
processing; the hatched maggots were also collected but many escaped or were killed
during this attempt. The survivors were placed in the reactor space.
Cycles one and two appeared to operate normally although the number of maggots
present was less than expected. Cycle three began on May 24, 2011. During this cycle
the number of maggots and eggs recovered decreased despite searches in the adult
space for eggs. Because there did not appear to be any other explanation, it was
assumed that the exceedingly high temperatures reached in the facility (>50oC) and the
inability of the cooling systems to dissipate heat affected the amount of eggs collected
in cycle three.
94
This trend continued into cycle four when the colony crashed and died after
approximately two years of successful operation. The immediate cause of the crash was
a failure in the ventilation system towards the end of batch cycle four. The main inner
greenhouse fan suffered a bearing failure causing the fan to stop operating which in
turn allowed the temperature in the inner greenhouse to exceed 60oC. Although some
adults remained alive and eggs were found, the temperatures reached were too great
for the colony to recover. The collected eggs were incubated but none hatched and the
remaining adults failed to lay new eggs. The amount of eggs collected suggest that if the
mechanical failure had not occurred the colony may have rebounded from the losses
suffered in batch cycle three.
4.3 Results and Discussion
The operation of the system in batch mode meant that only one cohort was present in
the subsystem at any given time. Cycles one and two operated with few issues during
the feeding and migration stage. During the adult phase of cycle one, for the first time
in the system’s operation, egg laying was observed in areas outside the hatchery in
significant quantities. It was originally thought that egg laying was not occurring at all
due to variances in ambient conditions. This was determined to be incorrect after eggs
were found outside the hatchery in various locations in the adult room including the
floor, the pupation chamber and in crevices. Another possible reason for the change in
the egg laying location was thought to be the absence of an attractant in suitable
quantities below the hatchery. During continuous operation maggots were actively
feeding underneath the hatchery and it was presumed that this activity would draw
female adults to the area to lay more eggs.
Approximately 12.7 kg of food waste was added underneath the hatchery during cycle
two but this did not affect the egg laying preference of the adult flies. Although some
eggs were laid in the hatchery, most were located near the pupation chamber in the
seams of its construction. A suitable explanation for the adult’s avoidance of the
95
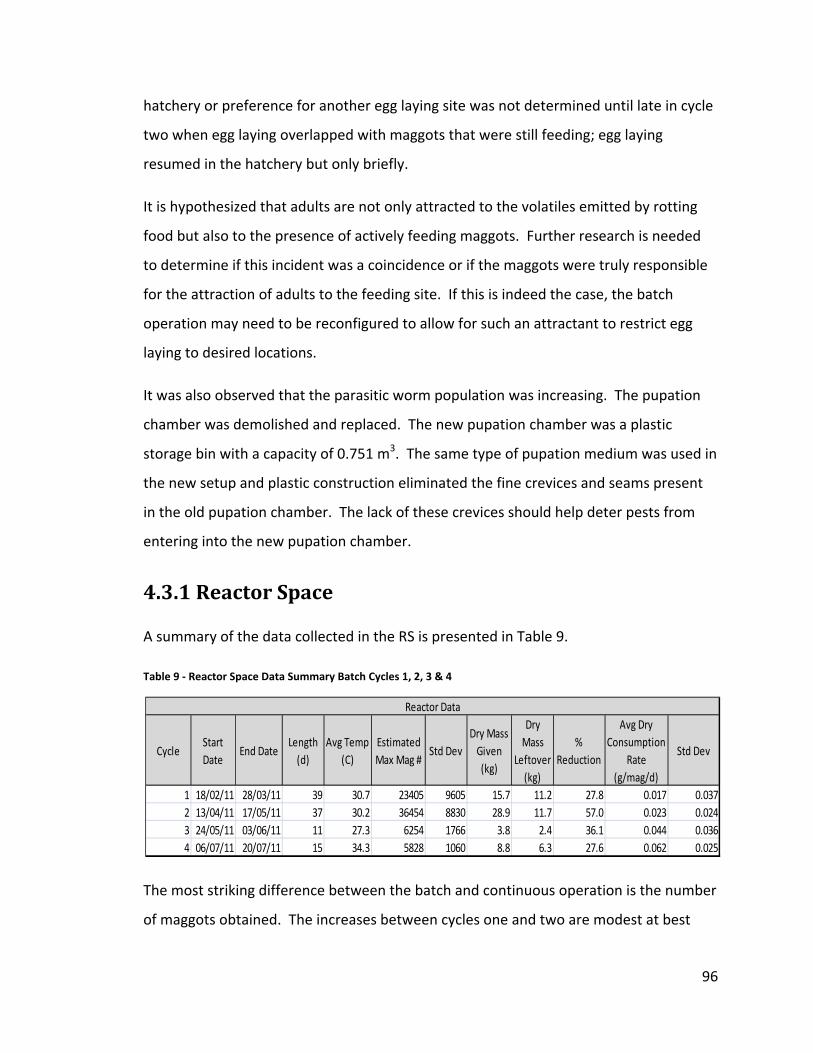
hatchery or preference for another egg laying site was not determined until late in cycle
two when egg laying overlapped with maggots that were still feeding; egg laying
resumed in the hatchery but only briefly.
It is hypothesized that adults are not only attracted to the volatiles emitted by rotting
food but also to the presence of actively feeding maggots. Further research is needed
to determine if this incident was a coincidence or if the maggots were truly responsible
for the attraction of adults to the feeding site. If this is indeed the case, the batch
operation may need to be reconfigured to allow for such an attractant to restrict egg
laying to desired locations.
It was also observed that the parasitic worm population was increasing. The pupation
chamber was demolished and replaced. The new pupation chamber was a plastic
storage bin with a capacity of 0.751 m3. The same type of pupation medium was used in
the new setup and plastic construction eliminated the fine crevices and seams present
in the old pupation chamber. The lack of these crevices should help deter pests from
entering into the new pupation chamber.
4.3.1 Reactor Space
A summary of the data collected in the RS is presented in Table 9.
Table 9 ‐ Reactor Space Data Summary Batch Cycles 1, 2, 3 & 4
CycleStart Date
End DateLength (d)
Avg Temp (C)
Estimated Max Mag #
Std DevDry Mass Given (kg)
Dry Mass
Leftover (kg)
% Reduction
Avg Dry Consumption
Rate (g/mag/d)
Std Dev
1 18/02/11 28/03/11 39 30.7 23405 9605 15.7 11.2 27.8 0.017 0.0372 13/04/11 17/05/11 37 30.2 36454 8830 28.9 11.7 57.0 0.023 0.0243 24/05/11 03/06/11 11 27.3 6254 1766 3.8 2.4 36.1 0.044 0.0364 06/07/11 20/07/11 15 34.3 5828 1060 8.8 6.3 27.6 0.062 0.025
Reactor Data
The most striking difference between the batch and continuous operation is the number
of maggots obtained. The increases between cycles one and two are modest at best
96
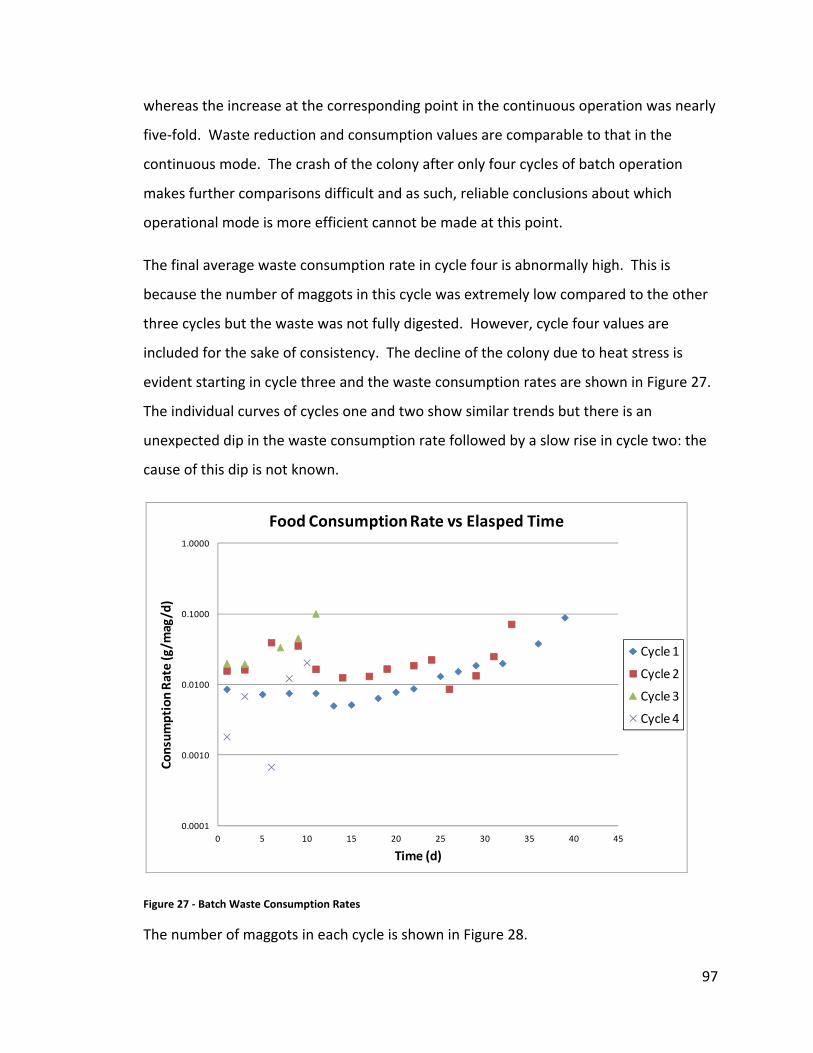
whereas the increase at the corresponding point in the continuous operation was nearly
five‐fold. Waste reduction and consumption values are comparable to that in the
continuous mode. The crash of the colony after only four cycles of batch operation
makes further comparisons difficult and as such, reliable conclusions about which
operational mode is more efficient cannot be made at this point.
The final average waste consumption rate in cycle four is abnormally high. This is
because the number of maggots in this cycle was extremely low compared to the other
three cycles but the waste was not fully digested. However, cycle four values are
included for the sake of consistency. The decline of the colony due to heat stress is
evident starting in cycle three and the waste consumption rates are shown in Figure 27.
The individual curves of cycles one and two show similar trends but there is an
unexpected dip in the waste consumption rate followed by a slow rise in cycle two: the
cause of this dip is not known.
0.0001
0.0010
0.0100
0.1000
1.0000
0 5 10 15 20 25 30 35 40 45
Consum
ption Rate (g/m
ag/d)
Time (d)
Food Consumption Rate vs Elasped Time
Cycle 1
Cycle 2
Cycle 3
Cycle 4
Figure 27 ‐ Batch Waste Consumption Rates
The number of maggots in each cycle is shown in Figure 28.
97

0
5
10
15
20
25
30
35
40
0 5 10 15 20 25 30 35 40 45
Maggot N
umbe
r (10
00's)
Time(d)
Maggot Number vs Elasped Time
Cycle 1
Cycle 2
Cycle 3
Cycle 4
Figure 28 ‐ Estimated Maggot Number Batch Operations
The trend in the batch operational mode is different from that of the continuous
operation mode: maggot numbers start high and gradually decrease because of outward
maggot migration. This is a different profile than that in the continuous operations
graphs of maggot numbers. Possible explanations for the observed maggot number
trends in the continuous operational phase were described in Section 3.6.2. During
batch operations the experiments were better controlled and the reactor was
thoroughly cleaned between cycles so that elusive maggots had no places to hide. Also,
because the hatchlings were incubated at the University’s lab and not placed in the
reactor space until they reached a readily visible size, sampling and counting errors were
reduced significantly. This profile is therefore expected to more accurately represent
the maggot number trend in a reactor when no additional influx of maggots from
hatchlings is present.
98
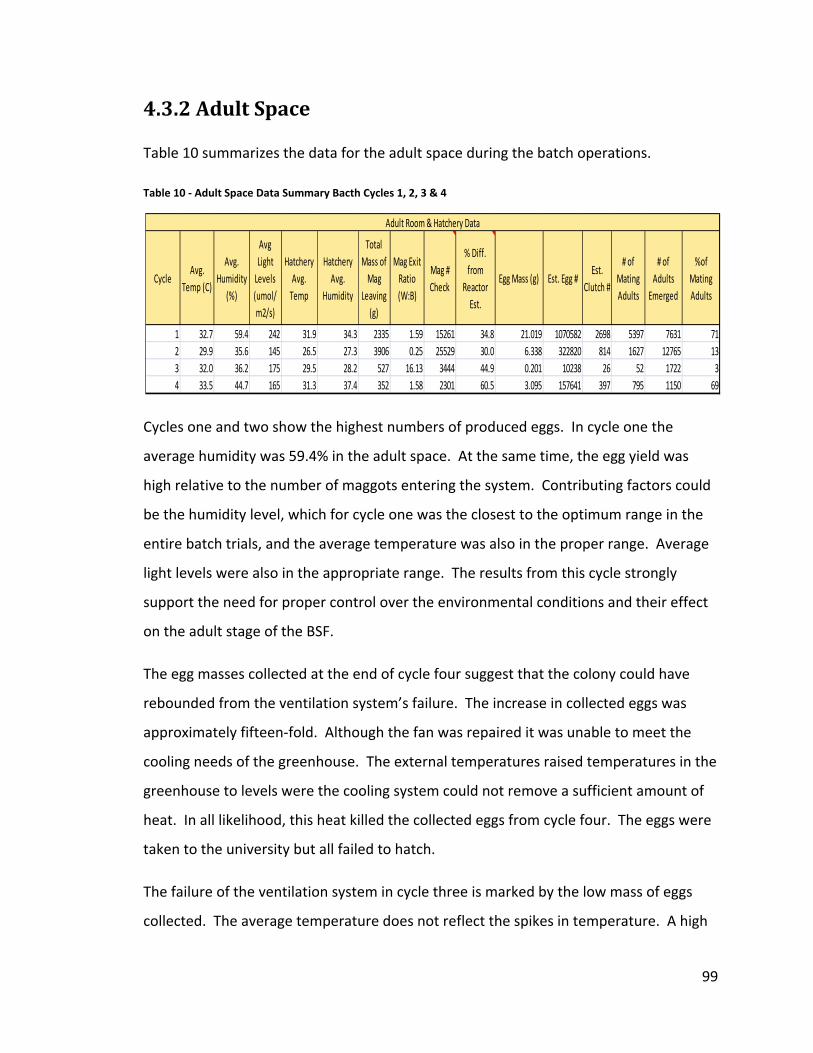
4.3.2 Adult Space
Table 10 summarizes the data for the adult space during the batch operations.
Table 10 ‐ Adult Space Data Summary Bacth Cycles 1, 2, 3 & 4
CycleAvg.
Temp (C)
Avg. Humidity
(%)
Avg Light Levels (umol/m2/s)
Hatchery Avg. Temp
Hatchery Avg.
Humidity
Total Mass of Mag
Leaving (g)
Mag Exit Ratio (W:B)
Mag # Check
% Diff. from
Reactor Est.
Egg Mass (g) Est. Egg #Est.
Clutch #
# of Mating Adults
# of Adults
Emerged
%of Mating Adults
1 32.7 59.4 242 31.9 34.3 2335 1.59 15261 34.8 21.019 1070582 2698 5397 7631 712 29.9 35.6 145 26.5 27.3 3906 0.25 25529 30.0 6.338 322820 814 1627 12765 133 32.0 36.2 175 29.5 28.2 527 16.13 3444 44.9 0.201 10238 26 52 1722 34 33.5 44.7 165 31.3 37.4 352 1.58 2301 60.5 3.095 157641 397 795 1150 69
Adult Room & Hatchery Data
Cycles one and two show the highest numbers of produced eggs. In cycle one the
average humidity was 59.4% in the adult space. At the same time, the egg yield was
high relative to the number of maggots entering the system. Contributing factors could
be the humidity level, which for cycle one was the closest to the optimum range in the
entire batch trials, and the average temperature was also in the proper range. Average
light levels were also in the appropriate range. The results from this cycle strongly
support the need for proper control over the environmental conditions and their effect
on the adult stage of the BSF.
The egg masses collected at the end of cycle four suggest that the colony could have
rebounded from the ventilation system’s failure. The increase in collected eggs was
approximately fifteen‐fold. Although the fan was repaired it was unable to meet the
cooling needs of the greenhouse. The external temperatures raised temperatures in the
greenhouse to levels were the cooling system could not remove a sufficient amount of
heat. In all likelihood, this heat killed the collected eggs from cycle four. The eggs were
taken to the university but all failed to hatch.
The failure of the ventilation system in cycle three is marked by the low mass of eggs
collected. The average temperature does not reflect the spikes in temperature. A high
99

temperature outside the tolerable range cannot be tolerated by the adult for a long
time – a short duration is sufficient to inflict damage. The maggot exit ratio also
suggests that the maggots in the RS suffered during the temperature spikes.
The ambient conditions in the adult space between the first two cycles and the final two
are illustrated in Figures 29 and 30. Figure 29 shows some instances where the
temperature exceeded 45oC, which is above the high range (33oC ) of the optimal
temperature range. This occurred at least five times during batch cycles one and two.
Despite these temperature exceedances the adults were able to complete their life cycle
and provide eggs for cycle three. Figure 30 shows that the temperature in cycles three
and four. Cycle four had more instances where the temperature exceeded 45oC and
50oC.
100

10
15
20
25
30
35
40
45
50
55
16/2/11 26/2/11 8/3/11 18/3/11 28/3/11 7/4/11 17/4/11 27/4/11 7/5/11 17/5/11
Tempe
rature Celsius
Date
Temperature vs Time Cycles 1 & 2
Figure 29 ‐ Temperatures Batch Cycles 1 & 2.
10
15
20
25
30
35
40
45
50
55
27/5/11 6/6/11 16/6/11 26/6/11 6/7/11 16/7/11 26/7/11
Tempe
rature Celsius
Date
Temperature vs Time Cycles 3 & 4
Figure 30 ‐ Temperature Batch Cycles 3 & 4.
101

The end of cycle four marked the end of the colony and operations at the EWSWA
facility.
102

Chapter 5 Overall System Evaluation and Conceptual Design
103
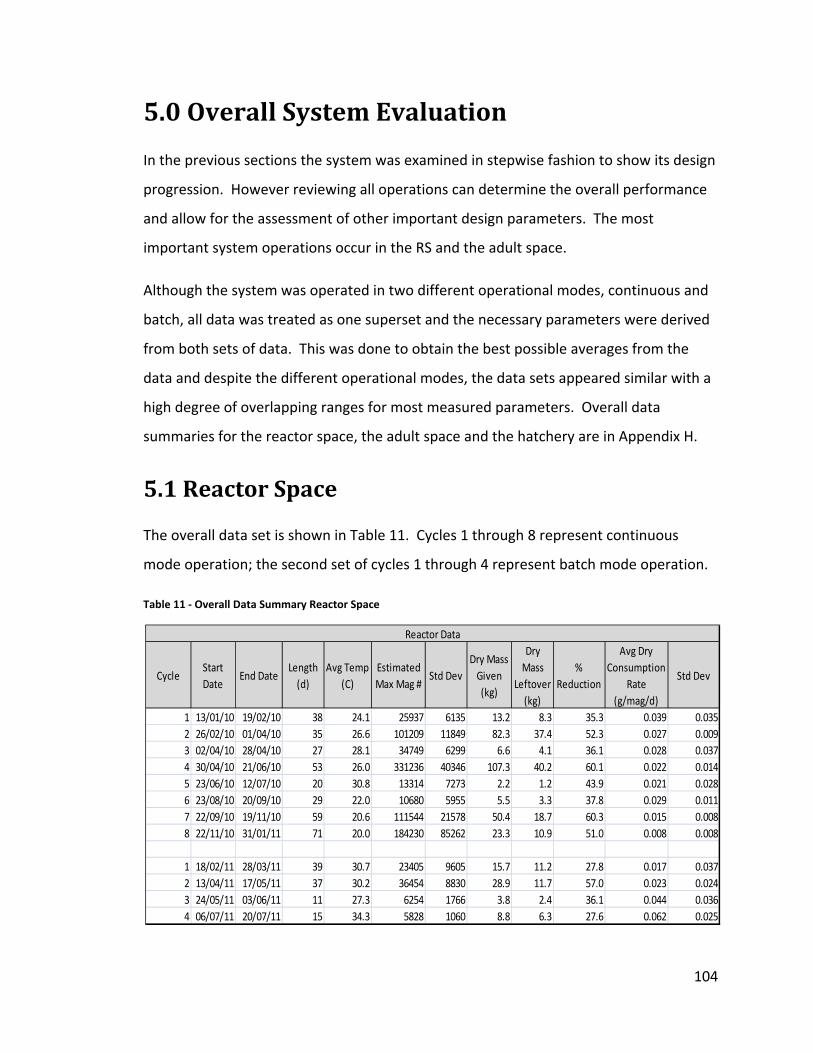
5.0 Overall System Evaluation
In the previous sections the system was examined in stepwise fashion to show its design
progression. However reviewing all operations can determine the overall performance
and allow for the assessment of other important design parameters. The most
important system operations occur in the RS and the adult space.
Although the system was operated in two different operational modes, continuous and
batch, all data was treated as one superset and the necessary parameters were derived
from both sets of data. This was done to obtain the best possible averages from the
data and despite the different operational modes, the data sets appeared similar with a
high degree of overlapping ranges for most measured parameters. Overall data
summaries for the reactor space, the adult space and the hatchery are in Appendix H.
5.1 Reactor Space
The overall data set is shown in Table 11. Cycles 1 through 8 represent continuous
mode operation; the second set of cycles 1 through 4 represent batch mode operation.
Table 11 ‐ Overall Data Summary Reactor Space
CycleStart Date
End DateLength (d)
Avg Temp (C)
Estimated Max Mag #
Std DevDry Mass Given (kg)
Dry Mass
Leftover (kg)
% Reduction
Avg Dry Consumption
Rate (g/mag/d)
Std Dev
1 13/01/10 19/02/10 38 24.1 25937 6135 13.2 8.3 35.3 0.039 0.0352 26/02/10 01/04/10 35 26.6 101209 11849 82.3 37.4 52.3 0.027 0.0093 02/04/10 28/04/10 27 28.1 34749 6299 6.6 4.1 36.1 0.028 0.0374 30/04/10 21/06/10 53 26.0 331236 40346 107.3 40.2 60.1 0.022 0.0145 23/06/10 12/07/10 20 30.8 13314 7273 2.2 1.2 43.9 0.021 0.0286 23/08/10 20/09/10 29 22.0 10680 5955 5.5 3.3 37.8 0.029 0.0117 22/09/10 19/11/10 59 20.6 111544 21578 50.4 18.7 60.3 0.015 0.0088 22/11/10 31/01/11 71 20.0 184230 85262 23.3 10.9 51.0 0.008 0.008
1 18/02/11 28/03/11 39 30.7 23405 9605 15.7 11.2 27.8 0.017 0.0372 13/04/11 17/05/11 37 30.2 36454 8830 28.9 11.7 57.0 0.023 0.0243 24/05/11 03/06/11 11 27.3 6254 1766 3.8 2.4 36.1 0.044 0.0364 06/07/11 20/07/11 15 34.3 5828 1060 8.8 6.3 27.6 0.062 0.025
Reactor Data
104

Throughout the course of the research approximately 350 kilos of food (dry weight)
were consumed by the maggots over twelve operational cycles. The maggots generated
approximately 156 kg of dry residue. The overall average food (waste) reduction was
approximately 44% +/‐ 12. The average dry matter consumption rate for the system’s
operation was estimated to be 0.028 (g/mag/d) +/‐ 0.023. The high spread of the data is
likely due to the variability introduced by the changing number of maggots between
each cycle and the area measurements of the feed pile.
This variability is hypothesized to be an intrinsic characteristic of a naturally propagating
the colony. Under ideal conditions the population would continue to increase unless a
certain amount of prepupae were removed from the system in a controlled setting. In
natural surroundings, external factors (predation, disease, etc.) would limit population
growth. Observed increases suggest that this prepupae harvest could be as high as 97%
of all prepupae collected. This is advantageous because it suggests that the bulk of the
prepupae can be used as removable, value‐added product and not needed to propagate
the next generation.
This circumstance is most likely the result of the BSF’s reproductive strategy; in natural
conditions large numbers of eggs are laid to improve the chances of successful gene
transfer to the next generation and not all prepupae will survive. The harvest capacity
estimate was meant to quantify this value. However, further research is needed to
adequately quantify the harvesting capacity or sustainable yield of this system.
To determine if any similarities in maggot number trends existed during a cycle’s
progression, all eight continuous mode cycles were graphed as shown in Figure 31.
Batch mode cycles are not included.
105
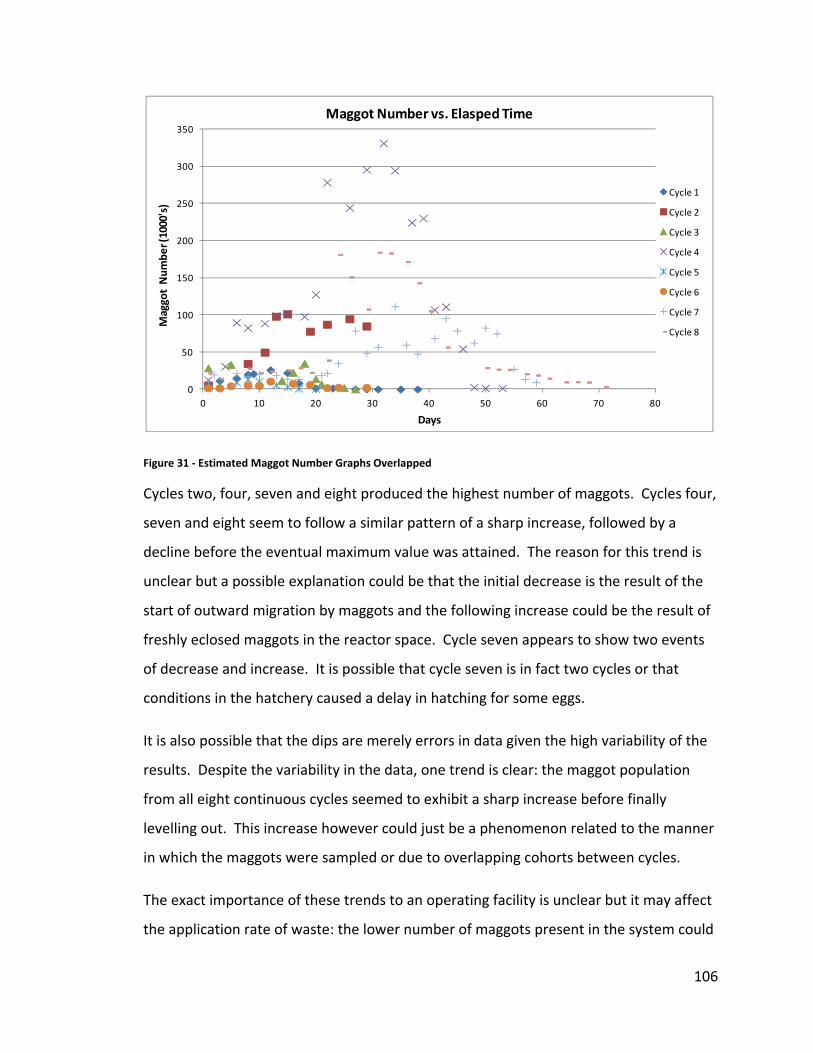
0
50
100
150
200
250
300
350
0 10 20 30 40 50 60 70 80
Maggot Num
ber (1000's)
Days
Maggot Number vs. Elasped Time
Cycle 1
Cycle 2
Cycle 3
Cycle 4
Cycle 5
Cycle 6
Cycle 7
Cycle 8
Figure 31 ‐ Estimated Maggot Number Graphs Overlapped
Cycles two, four, seven and eight produced the highest number of maggots. Cycles four,
seven and eight seem to follow a similar pattern of a sharp increase, followed by a
decline before the eventual maximum value was attained. The reason for this trend is
unclear but a possible explanation could be that the initial decrease is the result of the
start of outward migration by maggots and the following increase could be the result of
freshly eclosed maggots in the reactor space. Cycle seven appears to show two events
of decrease and increase. It is possible that cycle seven is in fact two cycles or that
conditions in the hatchery caused a delay in hatching for some eggs.
It is also possible that the dips are merely errors in data given the high variability of the
results. Despite the variability in the data, one trend is clear: the maggot population
from all eight continuous cycles seemed to exhibit a sharp increase before finally
levelling out. This increase however could just be a phenomenon related to the manner
in which the maggots were sampled or due to overlapping cohorts between cycles.
The exact importance of these trends to an operating facility is unclear but it may affect
the application rate of waste: the lower number of maggots present in the system could
106
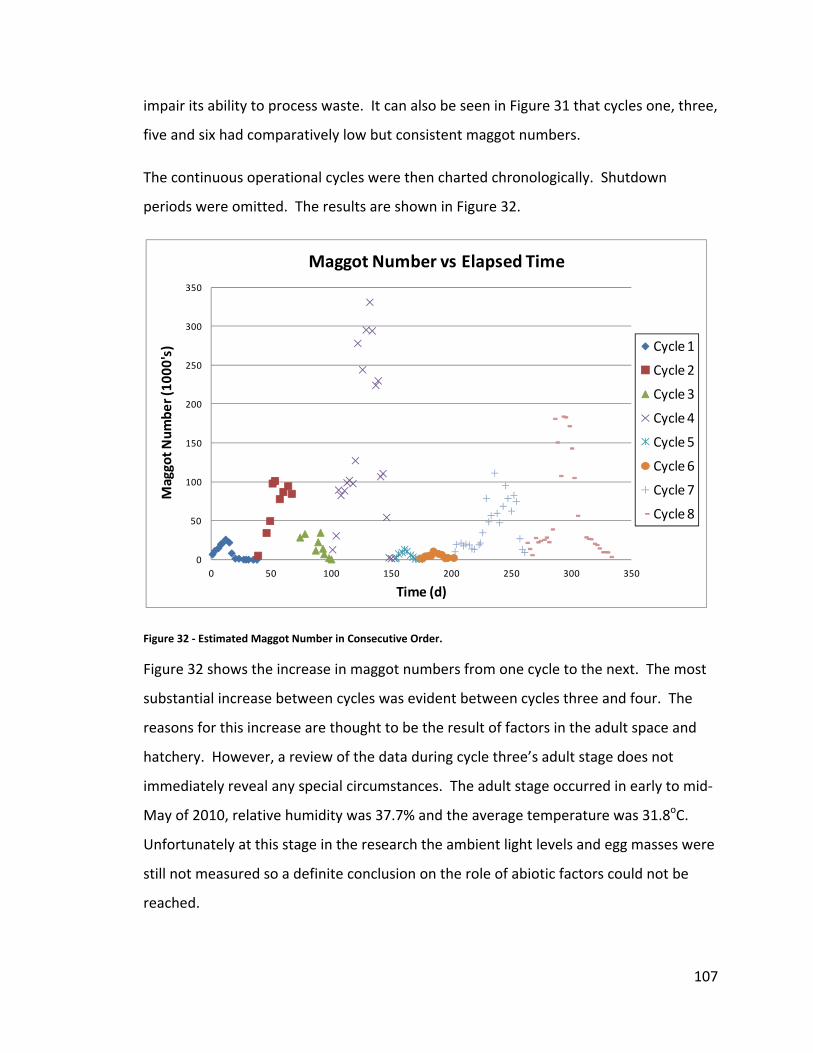
impair its ability to process waste. It can also be seen in Figure 31 that cycles one, three,
five and six had comparatively low but consistent maggot numbers.
The continuous operational cycles were then charted chronologically. Shutdown
periods were omitted. The results are shown in Figure 32.
0
50
100
150
200
250
300
350
0 50 100 150 200 250 300 350
Maggot N
umbe
r (10
00's)
Time (d)
Maggot Number vs Elapsed Time
Cycle 1
Cycle 2
Cycle 3
Cycle 4
Cycle 5
Cycle 6
Cycle 7
Cycle 8
Figure 32 ‐ Estimated Maggot Number in Consecutive Order.
Figure 32 shows the increase in maggot numbers from one cycle to the next. The most
substantial increase between cycles was evident between cycles three and four. The
reasons for this increase are thought to be the result of factors in the adult space and
hatchery. However, a review of the data during cycle three’s adult stage does not
immediately reveal any special circumstances. The adult stage occurred in early to mid‐
May of 2010, relative humidity was 37.7% and the average temperature was 31.8oC.
Unfortunately at this stage in the research the ambient light levels and egg masses were
still not measured so a definite conclusion on the role of abiotic factors could not be
reached.
107
There is another modest increase that occurs between cycles seven and eight but it is
only two‐fold. The average ambient visible light level for this adult stage was 202
µmol/m2/s and relative humidity was 39.7% and temperature was 29.3oC. Egg masses
were not collected at this stage. What is also unclear is the role of genetic variability
and inbreeding; the colony was never mixed with outside BSF for the entire course of
the research. After several successive generations, the effects of inbreeding may have
hampered the ability of the colony to propagate itself with the same vigour in later
cycles as it did in earlier cycles.
5.1.1 Average Daily Dry Waste Consumption Rate and Waste Loading Rate
The average daily dry waste consumption rate is the basis of the design for the reactor
space and by consequence, any future facility. The basis for the consumption rate was
the estimate of the maggot number and how much waste they consumed in a certain
amount of time. However, the metrics used to calculate the consumption rate varied
substantially. The number of maggots present in the reactor space at any given time is
not static. The area and depth of the food waste were also not static and changes were
observed daily. The number of maggots also differed from one cycle to the next. This
variability was carried forward to all other design parameters that depended on the
waste consumption rate. For future studies that attempt to refine the food
consumption measurement, the experiments should use smaller reactor vessels that
allow the food to cover the entire surface area. In this way, a single dimensional
reading, the depth of the food pile, can be more easily managed and measured.
In addition to the system’s waste reduction capabilities, a waste‐loading rate should also
be specified. Before this value can be calculated however, some basic assumptions
were made.
1.) Based on observations from this research the maggots were observed to feed in
a single layer in what was termed the preferential feeding position. As a result,
108
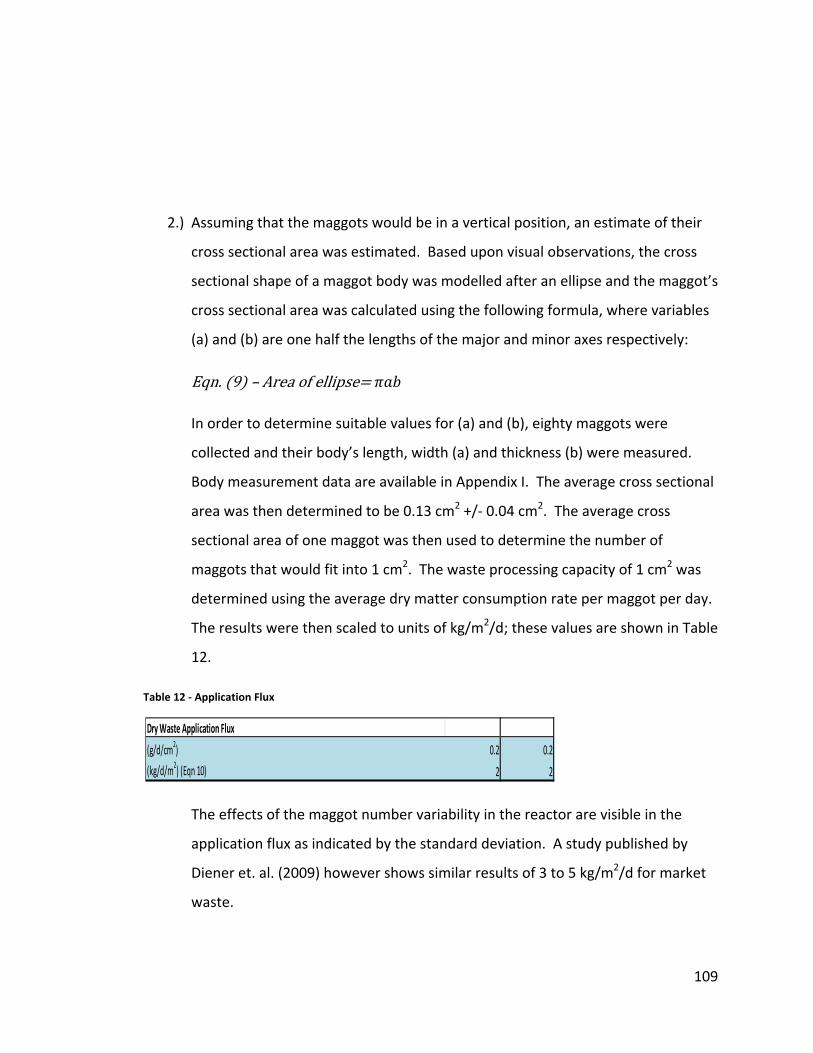
2.) Assuming that the maggots would be in a vertical position, an estimate of their
cross sectional area was estimated. Based upon visual observations, the cross
sectional shape of a maggot body was modelled after an ellipse and the maggot’s
cross sectional area was calculated using the following formula, where variables
(a) e of the major and minor axes respectively: and (b) are one half th lengths
Eqn. 9 – Area of ellipse
In order to determine suitable values for (a) and (b), eighty maggots were
collected and their body’s length, width (a) and thickness (b) were measured.
Body measurement data are available in Appendix I. The average cross sectional
area was then determined to be 0.13 cm2 +/‐ 0.04 cm2. The average cross
sectional area of one maggot was then used to determine the number of
maggots that would fit into 1 cm2. The waste processing capacity of 1 cm2 was
determined using the average dry matter consumption rate per maggot per day.
The results were then scaled to units of kg/m2/d; these values are shown in Table
12.
Table 12 ‐ Application Flux
Dry Waste Application Flux
(g/d/cm2) 0.2 0.2
(kg/d/m2) (Eqn 10) 2 2
The effects of the maggot number variability in the reactor are visible in the
application flux as indicated by the standard deviation. A study published by
Diener et. al. (2009) however shows similar results of 3 to 5 kg/m2/d for market
waste.
109
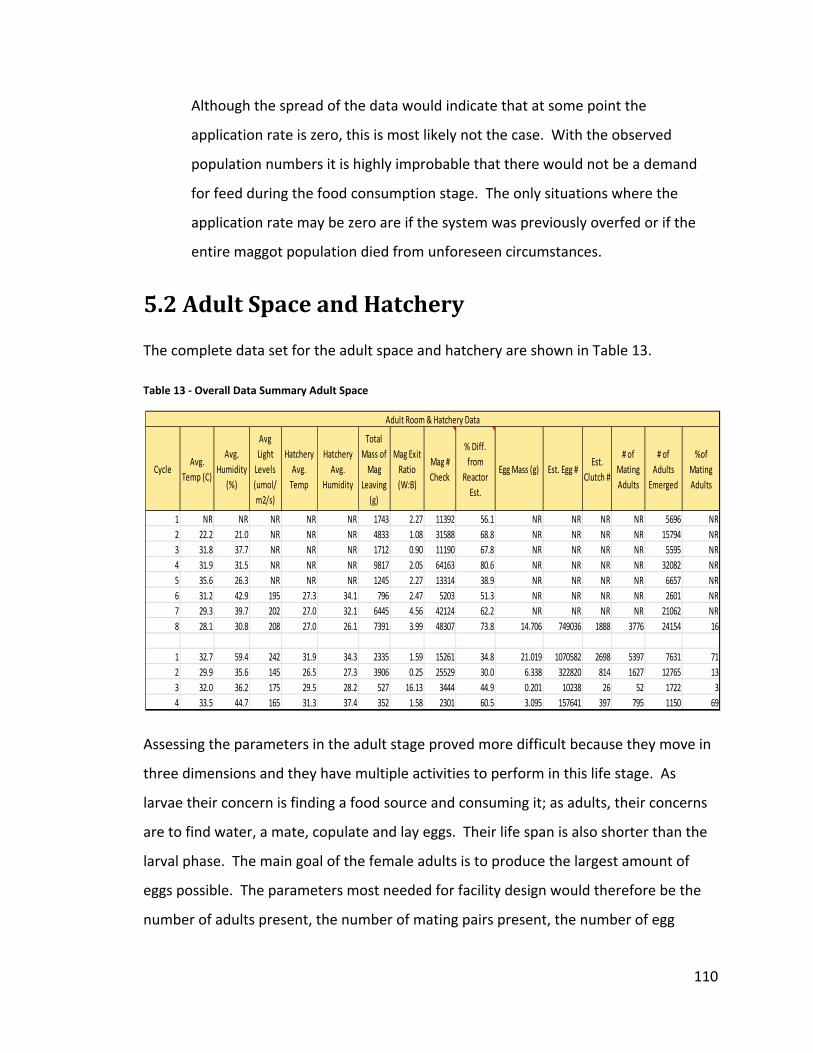
Although the spread of the data would indicate that at some point the
application rate is zero, this is most likely not the case. With the observed
population numbers it is highly improbable that there would not be a demand
for feed during the food consumption stage. The only situations where the
application rate may be zero are if the system was previously overfed or if the
entire maggot population died from unforeseen circumstances.
5.2 Adult Space and Hatchery
The complete data set for the adult space and hatchery are shown in Table 13.
Table 13 ‐ Overall Data Summary Adult Space
CycleAvg.
Temp (C)
Avg. Humidity
(%)
Avg Light Levels (umol/m2/s)
Hatchery Avg. Temp
Hatchery Avg.
Humidity
Total Mass of Mag
Leaving (g)
Mag Exit Ratio (W:B)
Mag # Check
% Diff. from
Reactor Est.
Egg Mass (g) Est. Egg #Est.
Clutch #
# of Mating Adults
# of Adults
Emerged
%of Mating Adults
1 NR NR NR NR NR 1743 2.27 11392 56.1 NR NR NR NR 5696 NR2 22.2 21.0 NR NR NR 4833 1.08 31588 68.8 NR NR NR NR 15794 NR3 31.8 37.7 NR NR NR 1712 0.90 11190 67.8 NR NR NR NR 5595 NR4 31.9 31.5 NR NR NR 9817 2.05 64163 80.6 NR NR NR NR 32082 NR5 35.6 26.3 NR NR NR 1245 2.27 13314 38.9 NR NR NR NR 6657 NR6 31.2 42.9 195 27.3 34.1 796 2.47 5203 51.3 NR NR NR NR 2601 NR7 29.3 39.7 202 27.0 32.1 6445 4.56 42124 62.2 NR NR NR NR 21062 NR8 28.1 30.8 208 27.0 26.1 7391 3.99 48307 73.8 14.706 749036 1888 3776 24154 16
1 32.7 59.4 242 31.9 34.3 2335 1.59 15261 34.8 21.019 1070582 2698 5397 7631 712 29.9 35.6 145 26.5 27.3 3906 0.25 25529 30.0 6.338 322820 814 1627 12765 133 32.0 36.2 175 29.5 28.2 527 16.13 3444 44.9 0.201 10238 26 52 1722 34 33.5 44.7 165 31.3 37.4 352 1.58 2301 60.5 3.095 157641 397 795 1150 69
Adult Room & Hatchery Data
Assessing the parameters in the adult stage proved more difficult because they move in
three dimensions and they have multiple activities to perform in this life stage. As
larvae their concern is finding a food source and consuming it; as adults, their concerns
are to find water, a mate, copulate and lay eggs. Their life span is also shorter than the
larval phase. The main goal of the female adults is to produce the largest amount of
eggs possible. The parameters most needed for facility design would therefore be the
number of adults present, the number of mating pairs present, the number of egg
110
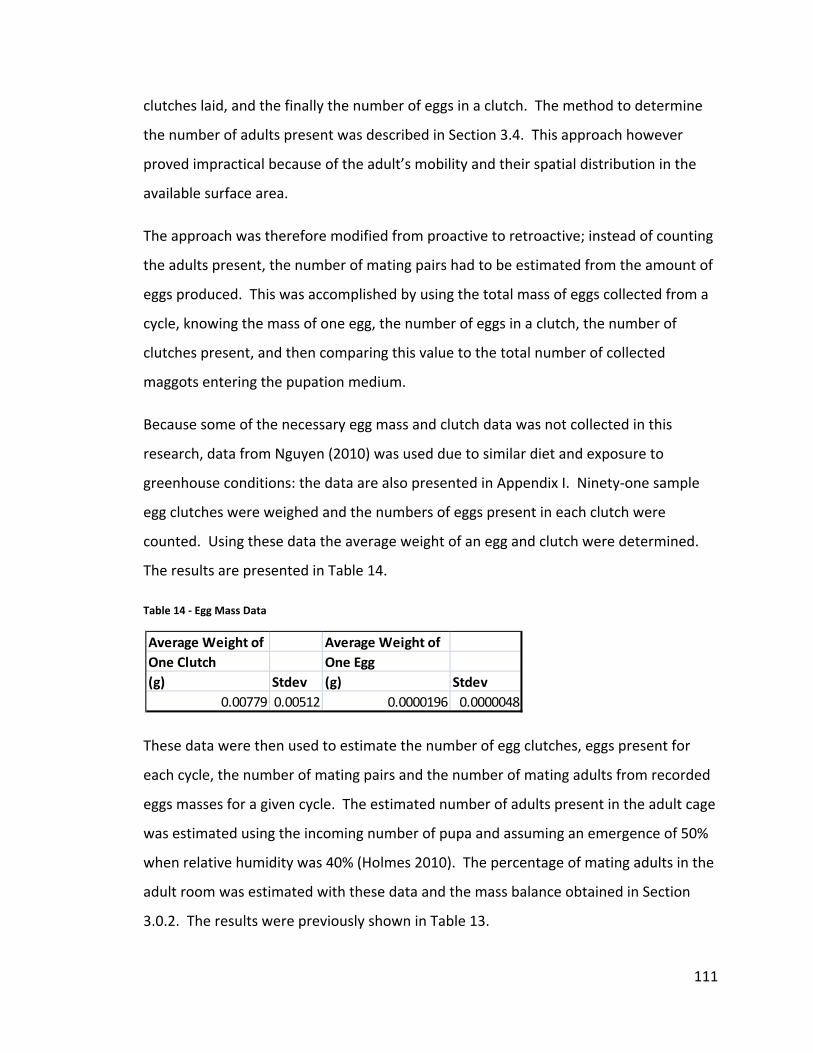
clutches laid, and the finally the number of eggs in a clutch. The method to determine
the number of adults present was described in Section 3.4. This approach however
proved impractical because of the adult’s mobility and their spatial distribution in the
available surface area.
The approach was therefore modified from proactive to retroactive; instead of counting
the adults present, the number of mating pairs had to be estimated from the amount of
eggs produced. This was accomplished by using the total mass of eggs collected from a
cycle, knowing the mass of one egg, the number of eggs in a clutch, the number of
clutches present, and then comparing this value to the total number of collected
maggots entering the pupation medium.
Because some of the necessary egg mass and clutch data was not collected in this
research, data from Nguyen (2010) was used due to similar diet and exposure to
greenhouse conditions: the data are also presented in Appendix I. Ninety‐one sample
egg clutches were weighed and the numbers of eggs present in each clutch were
counted. Using these data the average weight of an egg and clutch were determined.
The results are presented in Table 14.
Table 14 ‐ Egg Mass Data
Average Weight of Average Weight of One Clutch One Egg(g) Stdev (g) Stdev
0.00779 0.00512 0.0000196 0.0000048
These data were then used to estimate the number of egg clutches, eggs present for
each cycle, the number of mating pairs and the number of mating adults from recorded
eggs masses for a given cycle. The estimated number of adults present in the adult cage
was estimated using the incoming number of pupa and assuming an emergence of 50%
when relative humidity was 40% (Holmes 2010). The percentage of mating adults in the
adult room was estimated with these data and the mass balance obtained in Section
3.0.2. The results were previously shown in Table 13.
111
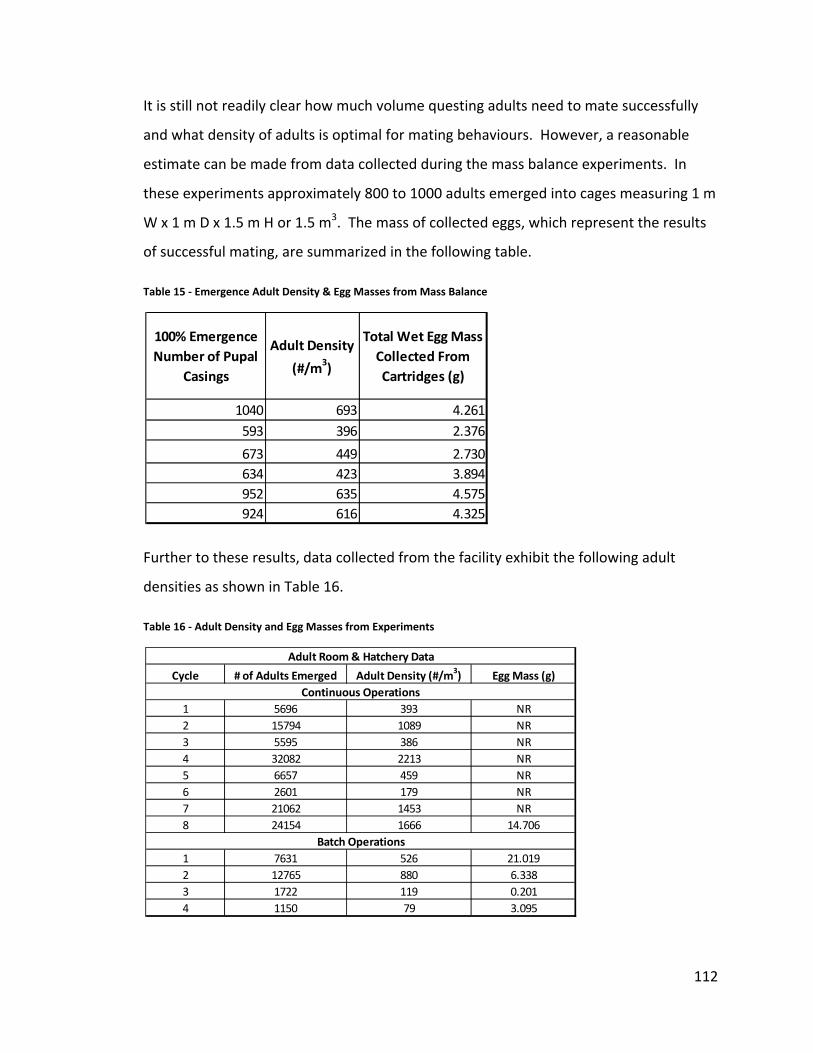
It is still not readily clear how much volume questing adults need to mate successfully
and what density of adults is optimal for mating behaviours. However, a reasonable
estimate can be made from data collected during the mass balance experiments. In
these experiments approximately 800 to 1000 adults emerged into cages measuring 1 m
W x 1 m D x 1.5 m H or 1.5 m3. The mass of collected eggs, which represent the results
of successful mating, are summarized in the following table.
Table 15 ‐ Emergence Adult Density & Egg Masses from Mass Balance
100% Emergence Number of Pupal
Casings
Adult Density
(#/m3)
Total Wet Egg Mass Collected From Cartridges (g)
1040 693 4.261593 396 2.376
673 449 2.730634 423 3.894952 635 4.575924 616 4.325
Further to these results, data collected from the facility exhibit the following adult
densities as shown in Table 16.
Table 16 ‐ Adult Density and Egg Masses from Experiments
Cycle # of Adults Emerged Adult Density (#/m3) Egg Mass (g)
1 5696 393 NR2 15794 1089 NR3 5595 386 NR4 32082 2213 NR5 6657 459 NR6 2601 179 NR7 21062 1453 NR8 24154 1666 14.706
1 7631 526 21.0192 12765 880 6.3383 1722 119 0.2014 1150 79 3.095
Continuous Operations
Adult Room & Hatchery Data
Batch Operations
112
It appears that the largest recorded egg yields happened with adult densities of 526 and
1666 adults per m3. These values were averaged and the result was used in design
calculations for the adult space. It is noteworthy to mention that this is a cursory
estimate; abiotic factors were not considered in this estimation and further research is
needed to determine optimal adult densities.
The shape of the adult space volume also remains in question although in both
experimental setups, the mass balance and the facility experiments, the adult spaces
were cube‐like, other shapes may improve mating success. It is also hypothesized that
the height of the adult space should allow for the upward flight patterns that males
exhibit (Tomberlin 2001) during aerial questing for females. The role of flora in the
adult space also deserves more study because no plants were used in these
experiments.
5.3 Continuous versus Batch Operations
The optimal operational mode – continuous versus batch – could not be determined
based on performance indicators studied in these experiments. However there are
some advantages to batch mode (one cohort at a time). Maintenance for the system is
greatly simplified in the absence of maggots. Although the maggots are robust, they
have limits on their toxicity tolerance.
For example, during the processing of protein rich feeds the production of ammonia is
evident and it must be removed to maintain optimal feeding conditions. Another
advantage is the ability to isolate problems. For example, if a disease were to enter the
reactor space, its effects could be contained to a single generation of BSF. These
circumstances favour the batch operational mode over continuous operations.
5.4 Conceptual Facility Design
The following illustrates the conceptual design of a waste processing facility using BSF
and is meant to outline how the various systems would be sized based on the
113
information collected during this research. The design equations are first presented in
their most generic form and a case example using collected data follows. An example
using collected data is deferred until the end of Chapter 6 after resource consumption is
quantified.
Two conceptual design cases were considered:
1.) Where a building already exists; and
2.) Where a new building must be constructed.
These two design cases were considered because a retrofit of an existing building to
serve as a BSF waste processing facility could be a common circumstance; this was the
case at the EWSWA. However, the design of a new facility is also a possible
circumstance and since the design approach would not change significantly, both
circumstances were explored.
The basis for both designs is the dry matter waste consumption rate but the physical
dimensions of the maggots, pupa, adults and eggs also affected the design of some of
the subsystems. A spreadsheet that calculates the size requirements for the subsystems
was constructed to facilitate the design of future systems: it can be viewed in Appendix
H. To introduce flexibility and customization into the design, the survival rates of the
maggots, the emergence rate of the adults, the mating percentage of the adults and the
eclosion rate of the eggs are all adjustable parameters. The mass of one prepupa at the
end of a cycle was assumed to be 0.153 g and is based on data collected by Nguyen
(2010).
The facility design and its required parameters are based on the average cycle length of
the feeding maggots. Although designs are typically done on a per day basis the cycle
length was preferred for the following reasons:
• The high variability of the data, the effects of which were averaged out over the
duration of the cycle;
• The system would not receive waste on a daily basis but on an as needed basis;
114
• Maggots do not continuously consume food: they can migrate away from the
food source and return at a later time; and
• The facility’s outputs would only be produced at the end of a cycle.
5.4.1 Design Case 1 – Use of an Existing Building
In the case where a building is already present and can be retrofitted for BSF to process
waste, the application flux was calculated from the dry matter consumption rate and
the number of maggots that would fit in one square meter (Eqn. 10). The application
flux, or loading rate, was then used to determine the area required to process one ton
of waste (Eqn. 11). The mass of maggots produced from this area was then calculated
(Eqn. 12).
Eqn. 10 – Application Flux AF kg/d/m2 Avg. Dry Matter Cons. Rate per Mag * # of Maggots per Unit Area
Eqn. 11 – Area Req. to Process 1 ton of Waste ARPW m2 1000 kg / AF * Cycle time
Eqn. 12 – Dry Mass of Mag. Prod. / Ton of Waste Processed DMMPW kg #
/
The area required to produce one ton of maggots was also calculated: this area was
termed a “reactor cell” (Eqn. 13). A one ton mass was chosen because maggots would
be sold by the ton.
/
Next, the number of maggots that are present in one ton of maggots was calculated
using (Eqn. 14).
115
Eqn. 14 – Maggot Number per dry ton MP 1 Cell #
#/ /
The result from Eqn. 14 is also the number of maggots produced from one cell. To
determine the number of reactor cells that a given building area can house, an estimate
of the adult space area requirement for one cell is necessary. The sum of these areas
was termed a “system”. The result from Eqn. 14 was used to estimate the number of
eggs required to sustain one reactor cell given the expected survival rate of the eggs.
The calculation is shown in Eqn. 15.
Eqn. 15 – Req. Egg # RE #
In order to proceed with the design an estimate of the average number of eggs in an egg
clutch is necessary. Data collected by Nguyen (2010) indicates that this value is
approximately 400 eggs per clutch +/‐ 252. Knowing that the average number of egg
clutches is equal to the number of adult mating pairs, and that the number of mating
pairs is one half the number of mating adults, an estimate of the number of adults
required to produce the eggs can be calculated (Eqns. 16a, 16b, 16c & 17). This
calculation also includes an estimate of the percentage of mating adults in a given
population.
Eqn. 16a – # of Egg Clutches for 1 Cell EC # #
Eqn. 16b – # of Mating Pairs for 1 Cell # EC
# 2*Eqn. 16c – # of Mating Adults for 1 Cell MA
Eqn. 17 – Req. # of Adults for 1 Cell RA #
EC
116
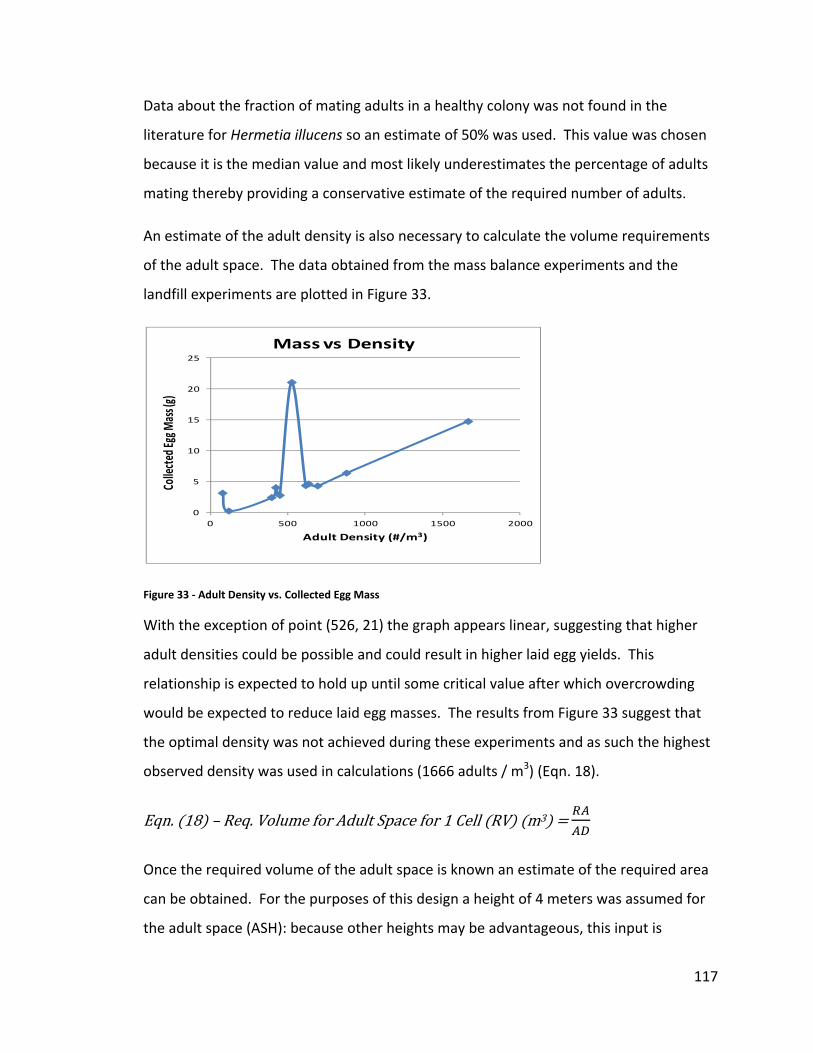
Data about the fraction of mating adults in a healthy colony was not found in the
literature for Hermetia illucens so an estimate of 50% was used. This value was chosen
because it is the median value and most likely underestimates the percentage of adults
mating thereby providing a conservative estimate of the required number of adults.
An estimate of the adult density is also necessary to calculate the volume requirements
of the adult space. The data obtained from the mass balance experiments and the
landfill experiments are plotted in Figure 33.
0
5
10
15
20
25
0 500 1000 1500 2000
Collected
Egg M
ass (g)
Adult Density (#/m3)
Mass vs Density
Figure 33 ‐ Adult Density vs. Collected Egg Mass
With the exception of point (526, 21) the graph appears linear, suggesting that higher
adult densities could be possible and could result in higher laid egg yields. This
relationship is expected to hold up until some critical value after which overcrowding
would be expected to reduce laid egg masses. The results from Figure 33 suggest that
the optimal density was not achieved during these experiments and as such the highest
observed density was used in calculations (1666 adults / m3) (Eqn. 18).
Eqn. 18 – Req. Volume for Adult Space for 1 Cell RV m3
Once the required volume of the adult space is known an estimate of the required area
can be obtained. For the purposes of this design a height of 4 meters was assumed for
the adult space (ASH): because other heights may be advantageous, this input is
117
adjustable in the design spreadsheet. The required area for one cell is calculated from
Eqn. 19.
Eqn. 19 – Req. Area for Adult Space for 1 Cell m2
The required hatchery area was then calculated; this calculation is dependent upon
number of eggs (or egg clutches) that can fit into the egg laying structures. During this
research, the females laid their eggs in cartridges with channels whose area measured
15 mm2. The depth of these cartridges was kept constant throughout the research at
25.4 mm. This length was chosen because it allowed the females to insert their
ovipositor into the channel mimicking the crevices where females prefer to deposit
eggs.
Because this depth may not be the optimum channel depth, only the exposed surface
area was considered in the design equations. Based on experimental observations, it
was assumed that 2 clutches or 800 eggs could fit in the surface area of an egg laying
channel. If deeper channels are used, the number of eggs (or egg clutches) that could fit
in the channel would also change. Eqn. 20 sh ws the calculation. o
Eqn. 20 – Hatchery Area for 1 Cell m2 #
The area requirement for a system can now be determined by summing the area
req lt sp c uirements for a cell and its corresponding adu a e as shown in Eqn. 21.
Eqn. 21 – System Area Requirement SAR m2
The number of systems that can fit into a facility can now be determined as shown in
Eqn. 22.
Eqn. 22 – # of Systems in Building Area #
118
The facility’s waste handling capacity was calculated from the ARPW, the number of
sys ). tems that the facility can house, and the DMMPW (Eqn. 23
Eqn. 23 – Facility Waste Capacity FC ton/cycle time
These values were then used to estimate the diversion percentage of the facility on a
yearly basis (Eqn. 24).
Eqn. 24 – Tonnes Diverted ton
FC
At this point, the facility’s maggot output for a given cycle time could be estimated. This
val ls th lity (Eue is equal to the number of cel at can be housed in the faci qn. 25).
Eqn. 25 – Facility Maggot Output FMO ton of mag System # in Building Area
To determine the actual parameters in the adult space for the facility, Equations 14 to
20 were multiplied by the result obtained from Equation 22. The proceeding formulas
assume this operation has occurred.
An estimate of harvest capacity for the facility can be calculated after the number of
prepupa needed to sustain the colony is calcula n. 26). ted (Eq
Eqn. 26 – Harvest Capacity % 100
The facility’s maggot number output can be determined using the product of Eqns. 14
and 22.
5.4.2 Design Case 2 – No Existing Building
In the case where a building does not exist and a new facility must be constructed, the
spreadsheet example assumes that all of the daily waste will be collected for processing
once per cycle length but this assumption can be changed. The calculations begin by
119
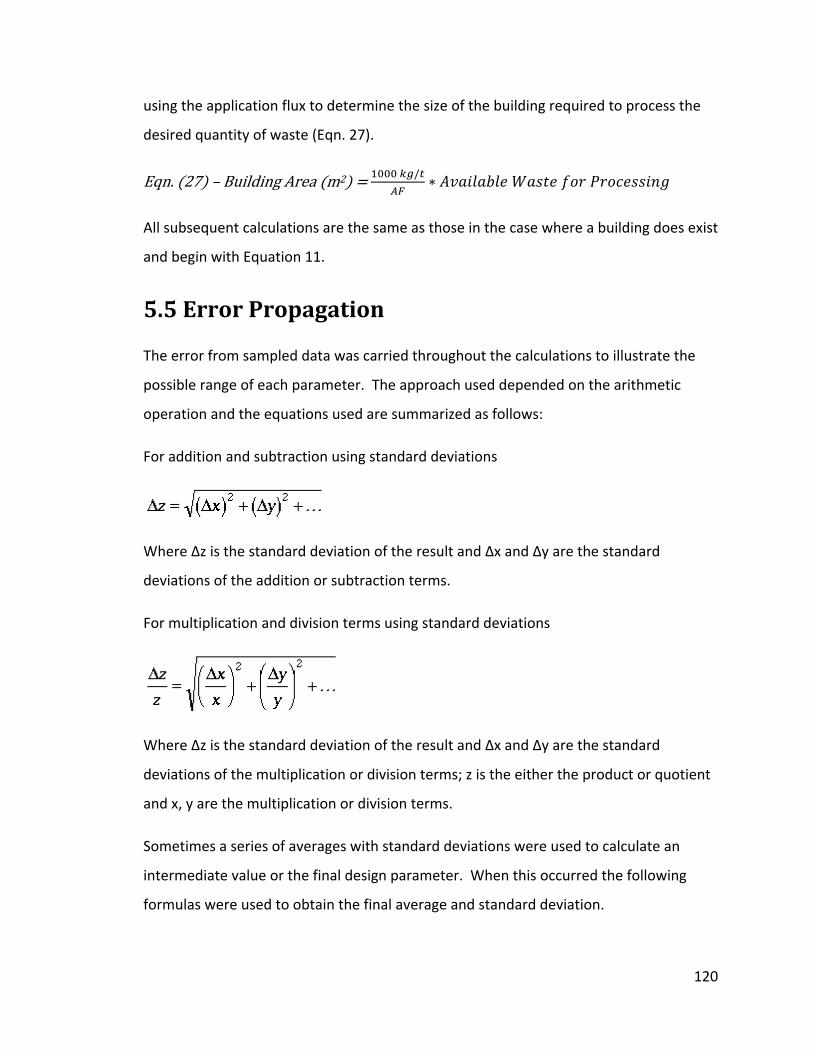
using the application flux to determine the size of the building required to process the
desired quantity of waste (Eqn. 27).
Eqn. 27 – Building Area m2 /
All subsequent calculations are the same as those in the case where a building does exist
and begin with Equation 11.
5.5 Error Propagation
The error from sampled data was carried throughout the calculations to illustrate the
possible range of each parameter. The approach used depended on the arithmetic
operation and the equations used are summarized as follows:
For addition and subtraction using standard deviations
Where Δz is the standard deviation of the result and Δx and Δy are the standard
deviations of the addition or subtraction terms.
For multiplication and division terms using standard deviations
Where Δz is the standard deviation of the result and Δx and Δy are the standard
deviations of the multiplication or division terms; z is the either the product or quotient
and x, y are the multiplication or division terms.
Sometimes a series of averages with standard deviations were used to calculate an
intermediate value or the final design parameter. When this occurred the following
formulas were used to obtain the final average and standard deviation.
120
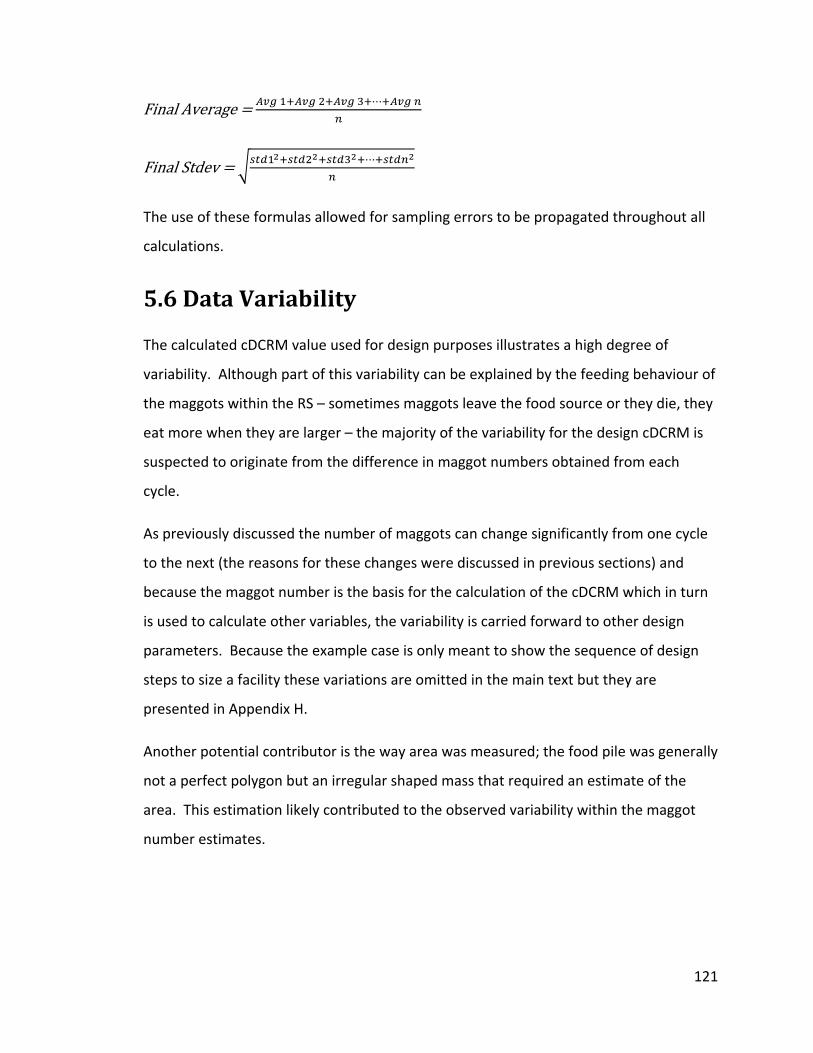
Final Average
Final Stdev
The use of these formulas allowed for sampling errors to be propagated throughout all
calculations.
5.6 Data Variability
The calculated cDCRM value used for design purposes illustrates a high degree of
variability. Although part of this variability can be explained by the feeding behaviour of
the maggots within the RS – sometimes maggots leave the food source or they die, they
eat more when they are larger – the majority of the variability for the design cDCRM is
suspected to originate from the difference in maggot numbers obtained from each
cycle.
As previously discussed the number of maggots can change significantly from one cycle
to the next (the reasons for these changes were discussed in previous sections) and
because the maggot number is the basis for the calculation of the cDCRM which in turn
is used to calculate other variables, the variability is carried forward to other design
parameters. Because the example case is only meant to show the sequence of design
steps to size a facility these variations are omitted in the main text but they are
presented in Appendix H.
Another potential contributor is the way area was measured; the food pile was generally
not a perfect polygon but an irregular shaped mass that required an estimate of the
area. This estimation likely contributed to the observed variability within the maggot
number estimates.
121

Chapter 6 – Life Cycle Inventory and Cost Assessment
122
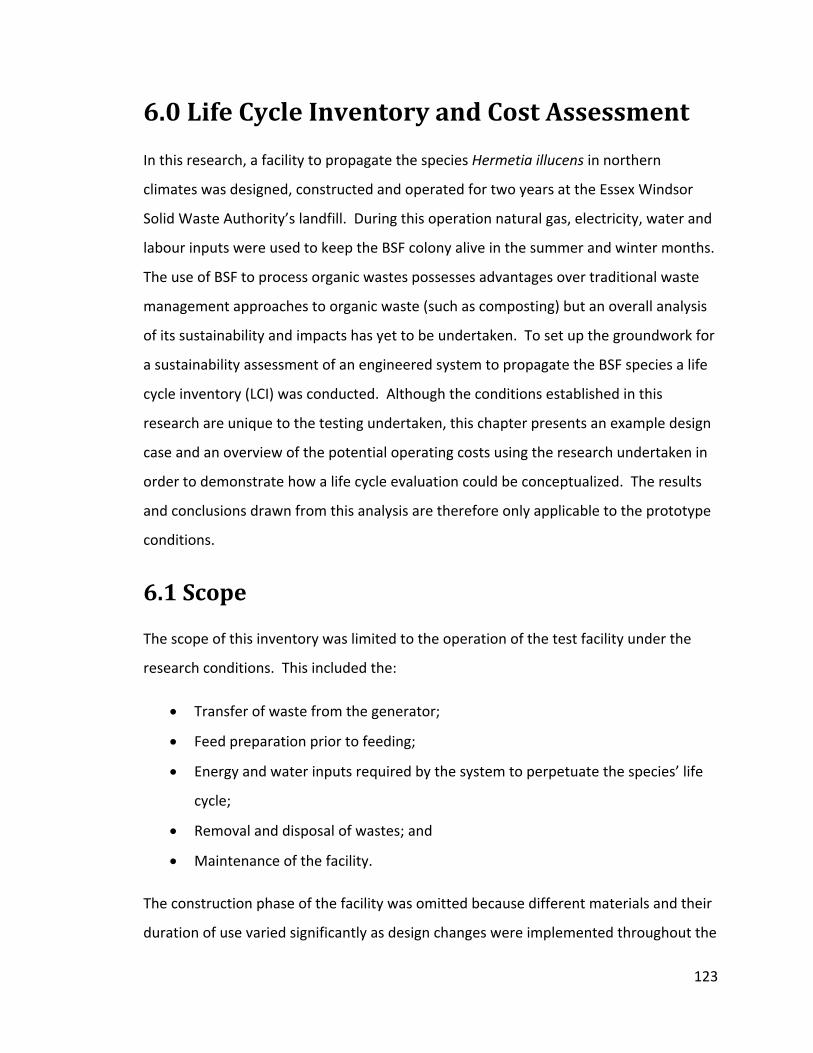
6.0 Life Cycle Inventory and Cost Assessment
In this research, a facility to propagate the species Hermetia illucens in northern
climates was designed, constructed and operated for two years at the Essex Windsor
Solid Waste Authority’s landfill. During this operation natural gas, electricity, water and
labour inputs were used to keep the BSF colony alive in the summer and winter months.
The use of BSF to process organic wastes possesses advantages over traditional waste
management approaches to organic waste (such as composting) but an overall analysis
of its sustainability and impacts has yet to be undertaken. To set up the groundwork for
a sustainability assessment of an engineered system to propagate the BSF species a life
cycle inventory (LCI) was conducted. Although the conditions established in this
research are unique to the testing undertaken, this chapter presents an example design
case and an overview of the potential operating costs using the research undertaken in
order to demonstrate how a life cycle evaluation could be conceptualized. The results
and conclusions drawn from this analysis are therefore only applicable to the prototype
conditions.
6.1 Scope
The scope of this inventory was limited to the operation of the test facility under the
research conditions. This included the:
• Transfer of waste from the generator;
• Feed preparation prior to feeding;
• Energy and water inputs required by the system to perpetuate the species’ life
cycle;
• Removal and disposal of wastes; and
• Maintenance of the facility.
The construction phase of the facility was omitted because different materials and their
duration of use varied significantly as design changes were implemented throughout the
123
system’s operation. Decommissioning issues were also omitted from the LCI as these
were specific to the research requirements as opposed to operational requirements.
6.2 Prediction of Potential Impacts
Although the research was conducted at an operating landfill, an actual waste
processing facility using BSF does not need to be located at a landfill. The
environmental impacts from an operating BSF facility would be similar to those of
landfill or composting facility. The following issues would be relevant during the
operation of a BSF facility:
• Noise – due to vehicles and possibly machinery used in daily operations;
• Odours – if properly managed odours should be minimized. However, the
sensitivity to odours and their acceptable limits varies by individuals so
complaints would be expected;
• Surface water and groundwater impacts – the facility is not expected to
generate wastewater in appreciable quantities. However, if wastewater is
generated it could cause unacceptable discharges to surface and sub‐surface
waters if not properly managed;
• Pests – although the BSF themselves are not considered pests or disease vectors,
BSF are, or can be, a food source to pests and / or disease vectors; and
• Solid wastes – the BSF process produces a waste residue that has value as a
fertilizer and soil additive but unless there is a demand for such a material, it
may require disposal or storage. Storage outdoors could lead to issues affecting
surface and sub‐surface waters and possibly odour complaints.
In choosing a location for a facility, the area’s sensitivity to the preceding, and other
location relevant issues, should be evaluated.
124
6.3 Resource Use
The predominant resources used by the research facility were electricity, water and to
some extent, manual labour. Manual labour was excluded in the LCI because it is
common to many waste management options, and the activities undertaken in this
research project are specific to the needs of demonstrating the proof‐of‐concept. In
addition to these resources, natural gas was also consumed during the winter months to
heat the facility. No other resource inputs were required during the facility’s operation
in significant quantities.
The consumption pattern of resources varied during the winter and summer weather
seasons. For the purposes of this analysis, the winter season began on the first day
when the furnace was turned on (typically mid‐October) and ended when it was turned
off (typically mid‐May). The main differences between these two operational seasons
were as follows:
• During the winter period natural gas was used to heat the facility and the use of
supplemental lighting was necessary; and
• During the summer period larger amounts of water were required and two fans
were operated to help cool the facility.
Transportation of the waste to the processing location did not change throughout the
facility’s operation. Waste produced from operations was disposed at the EWSWA’s
landfill for the duration of the study.
6.4 Life Cycle Inventory
The facility’s operations were organized into processes for analysis. The first process
considered was transporting the restaurant waste to the facility. In this case the
generation source was a restaurant located approximately 36 km from the facility. This
distance was travelled three times per week. The round trip distance was used to
estimate fuel requirements for the vehicle’s operation.
125
The fuel consumption required to transport the facility’s solid wastes for disposal was
low because the final disposal site was located on the same property and the facility’s
waste residues were not disposed continuously, but rather only once per cycle, on
average once every 36 days. The only other routine use for the vehicle was the
transportation of water from the source to the facility; this operation was done once
every two weeks for the duration of the research.
The first process inside the facility was defined as the preparation phase in which the
waste food was ground up and stored for future use. A 2.2 kW grinder, water and
manual labour were utilized for this task and its associated cleaning operations. After
this stage was complete the actual waste processing and life cycle propagation stages
began.
The BSF propagation system required various machinery to maintain its operation: these
included pumps, solenoids, lighting systems and fans. All of these systems were set to
operate in periodic fashion that was controlled by timers. The only machine that
operated independently of a timer was the main water delivery pump; the pump’s
on / off cycles was controlled by a pressure switch.
The main water pump’s operation was connected to the operation of dependent
devices; for example, if the misting pump operated the main pump would also operate
for a given amount of time. This operational time of the main pump varied depending
on the device being used.
In an attempt to quantify the main pump’s operational times, the dependent devices,
(the mister, grinder, collection system etc.) were set to operate continuously for five
minutes. The main pump’s operation was then timed so that a time ratio of the
dependent device’s run time to the main pump's run time could be estimated. Once
this ratio was known the amount of electricity used by the main pump could be
estimated for each minute of the dependent device’s operation.
126
The flow rate of every device was also obtained to determine how much water was used
for a given task. When this was not possible, the water usage was estimated. All water
consumption values were normalized to a volume per day basis.
Electrical power consumption was either obtained directly from specifications printed
on the device or calculated given the supplied voltage, current ratings and time of
operation. All devices operated on timers or continuously. Electricity consumption was
normalized to kWh per day.
The use of natural gas was tracked via a meter located outside the outer greenhouse.
The readings were collected on a monthly or bi‐monthly period. The heating system
was the only use of natural gas required by the facility’s operation.
The following subsystems list describes the use of required devices that were necessary
to maintain the life cycle of the BSF during this research:
• Outer greenhouse – during the winter no systems are used. In the summer season,
the outer greenhouse fan and the ventilation louvers were required to maintain
operational temperatures;
• Inner greenhouse – during the winter, the furnace maintained the temperature. In
the summer season the inner greenhouse fan operated in conjunction with the
misting system to cool the facility. A recirculation fan and four humidifiers operated
in both seasons. The main water pump provided pressure for the water supply. A
grinder was used to process waste prior to feeding;
• Reactor space – operations did not change in either season. The only direct use of
energy was a misting system connected to a solenoid that was controlled by a
timer;
• Exit ramp – no energy was consumed by this subsystem;
• Water collection system – an electric pump was used to circulate water through the
collection tubes under the control of a timer;
• Water / maggot separator – no energy was consumed by this subsystem;
127
• Pupation chamber ‐ no energy was consumed by this subsystem;
• Adult space – operations in winter required a lighting system that included a cooling
fan to supplement sunlight. Water for the adults was provided by the same mister
that cooled the inner greenhouse; and
• The hatchery – operations did not change in the winter or summer seasons.
Humidification is powered by two fogging units. Hot air was provided by the fan
that cooled the lighting system in the adult space.
The use of each resource by each device was calculated and tabulated to obtain a usage
value on a per day basis. Because resource use changed between summer and winter,
separate values were calculated for each season. The estimates provided were based
on operational times that were sometimes specific to each device. A list of these
assumptions can viewed in Appendix J. Because the timers were assumed to operate in
a consistent fashion, standard deviations for each resource used were assumed to be
negligible.
The following tables outline water and electricity usage during the winter and summer
periods for the various systems. The complete tables can be viewed in Appendix K.
128
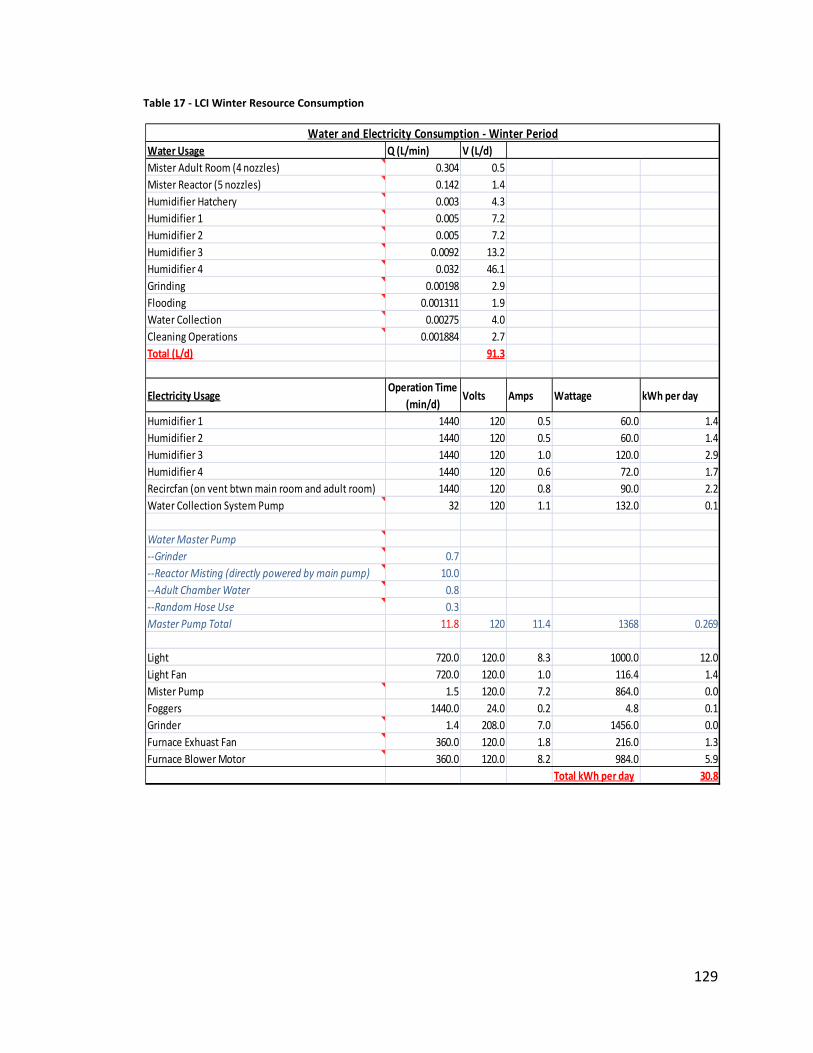
Table 17 ‐ LCI Winter Resource Consumption
Water and Electricity Consumption ‐ Winter PeriodWater Usage Q (L/min) V (L/d)Mister Adult Room (4 nozzles) 0.304 0.5Mister Reactor (5 nozzles) 0.142 1.4Humidifier Hatchery 0.003 4.3Humidifier 1 0.005 7.2Humidifier 2 0.005 7.2Humidifier 3 0.0092 13.2Humidifier 4 0.032 46.1Grinding 0.00198 2.9Flooding 0.001311 1.9Water Collection 0.00275 4.0Cleaning Operations 0.001884 2.7Total (L/d) 91.3
Electricity UsageOperation Time
(min/d)Volts Amps Wattage kWh per day
Humidifier 1 1440 120 0.5 60.0 1.4Humidifier 2 1440 120 0.5 60.0 1.4Humidifier 3 1440 120 1.0 120.0 2.9Humidifier 4 1440 120 0.6 72.0 1.7Recircfan (on vent btwn main room and adult room) 1440 120 0.8 90.0 2.2Water Collection System Pump 32 120 1.1 132.0 0.1
Water Master Pump‐‐Grinder 0.7‐‐Reactor Misting (directly powered by main pump) 10.0‐‐Adult Chamber Water 0.8‐‐Random Hose Use 0.3Master Pump Total 120 11.4 1368 0.269
Light 720.0 120.0 8.3 1000.0 12.0Light Fan 720.0 120.0 1.0 116.4 1.4Mister Pump 1.5 120.0 7.2 864.0 0.0Foggers 1440.0 24.0 0.2 4.8 0.1Grinder 1.4 208.0 7.0 1456.0 0.0Furnace Exhuast Fan 360.0 120.0 1.8 216.0 1.3Furnace Blower Motor 360.0 120.0 8.2 984.0 5.9
11.8
Total kWh per day 30.8
129

Table 18 ‐ LCI Summer Resource Consumption
Water and Electricity Consumption ‐ Summer PeriodWater Usage Q (L/min) V (L/d)Mister Adult Room and GH Cooling (10 nozzles) 0.76 35.3Mister Reactor (5 nozzles) 0.142 1.4Humidifier Hatchery 0.003 4.3Humidifier 1 0.005 7.2Humidifier 2 0.005 7.2Humidifier 3 0.0092 13.2Humidifier 4 0.032 46.1Grinding 0.00198 2.9Flooding 0.001311 1.9Water Collection 0.00275 4.0Cleaning Operations 0.001884 2.7Total (L/d) 126.2
Electricity UsageOperation Time
(min/d)Volts Amps Wattage kWh per day
Outer Greenhouse Fan 1200 120 13.4 1608 32.2Inner Greenhouse Fan 1440 120 3.5 420 10.1Ventilation Louvres 1440 120 1.5 180 4.3Humidifier 1 1440 120 0.5 60 1.4Humidifier 2 1440 120 0.5 60 1.4Humidifier 3 1440 120 1.0 120 2.9Humidifier 4 1440 120 0.6 72 1.7Recircfan (on vent btwn main room and adult room) 1440 120 0.8 90 2.2Water Collection System Pump 32 120 1.1 132 0.070
Water Master Pump‐‐Grinder 0.7‐‐Reactor Mister 10.0‐‐Adult Chamber Water and GH cooling water 23.3‐‐Random Hose Use 0.3Master Pump Total 120 11.4 1368 0.8
Light 0.0 120 8.3 1000.0 0.0Mister Pump 46.5 120 7.2 864.0 0.7Foggers 1440.0 24 0.2 4.8 0.1Grinder 1.4 208 7.0 1456.0 0.035
34.3
Total kWh per day 57.9
The entire facility process can be viewed in the following flow chart. Inputs to each
stage are listed in the green boxes and wastes are listed in the red boxes. The blue
arrows show the progression from stage to the next. The following list explains the
abbreviations:
130
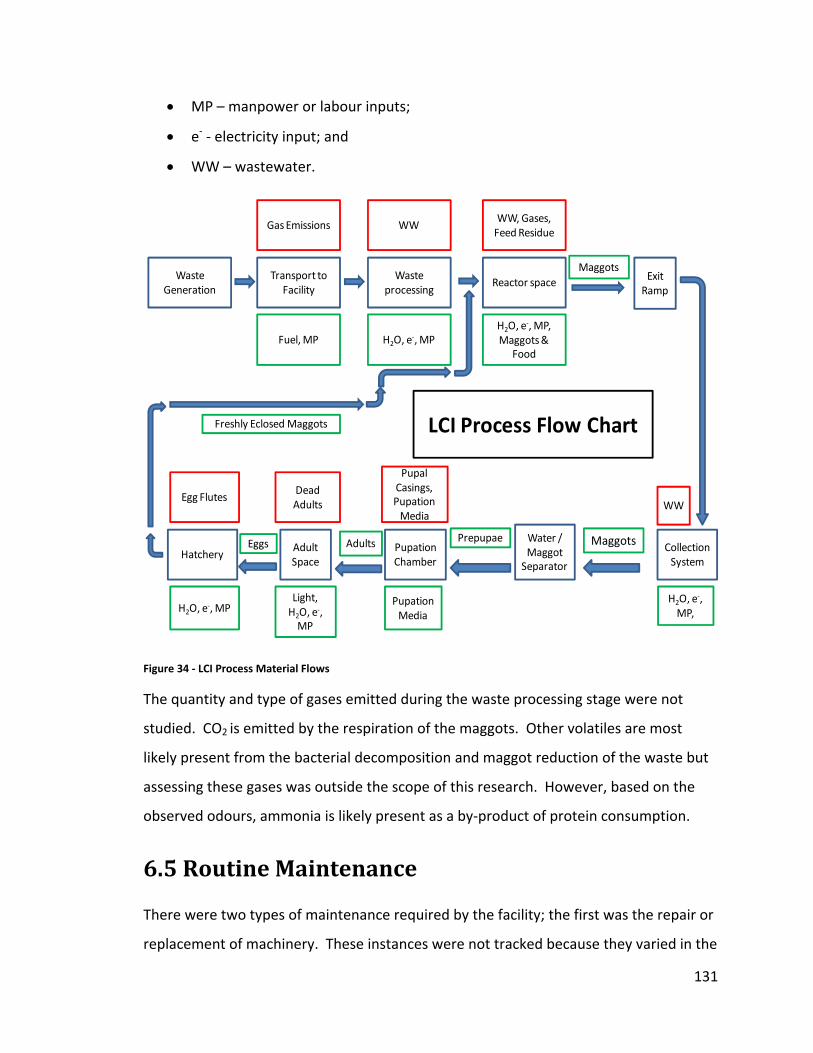
• MP – manpower or labour inputs;
• e‐ ‐ electricity input; and
• WW – wastewater.
Waste Generation
Transport to Facility
Fuel, MP
Gas Emissions
Waste processing
H2O, e‐, MP
WW
Reactor space
H2O, e‐, MP, Maggots &
Food
WW, Gases, Feed Residue
Exit Ramp
Maggots
Collection System
H2O, e‐, MP,
WW
Water / Maggot Separator
Pupal Casings, Pupation Media
Pupation Chamber
Pupation Media
Adult Space
Light, H2O, e‐, MP
Dead Adults
Hatchery
H2O, e‐, MP
Egg Flutes
Freshly Eclosed Maggots LCI Process Flow Chart
AdultsEggs Prepupae Maggots
Figure 34 ‐ LCI Process Material Flows
The quantity and type of gases emitted during the waste processing stage were not
studied. CO2 is emitted by the respiration of the maggots. Other volatiles are most
likely present from the bacterial decomposition and maggot reduction of the waste but
assessing these gases was outside the scope of this research. However, based on the
observed odours, ammonia is likely present as a by‐product of protein consumption.
6.5 Routine Maintenance
There were two types of maintenance required by the facility; the first was the repair or
replacement of machinery. These instances were not tracked because they varied in the
131
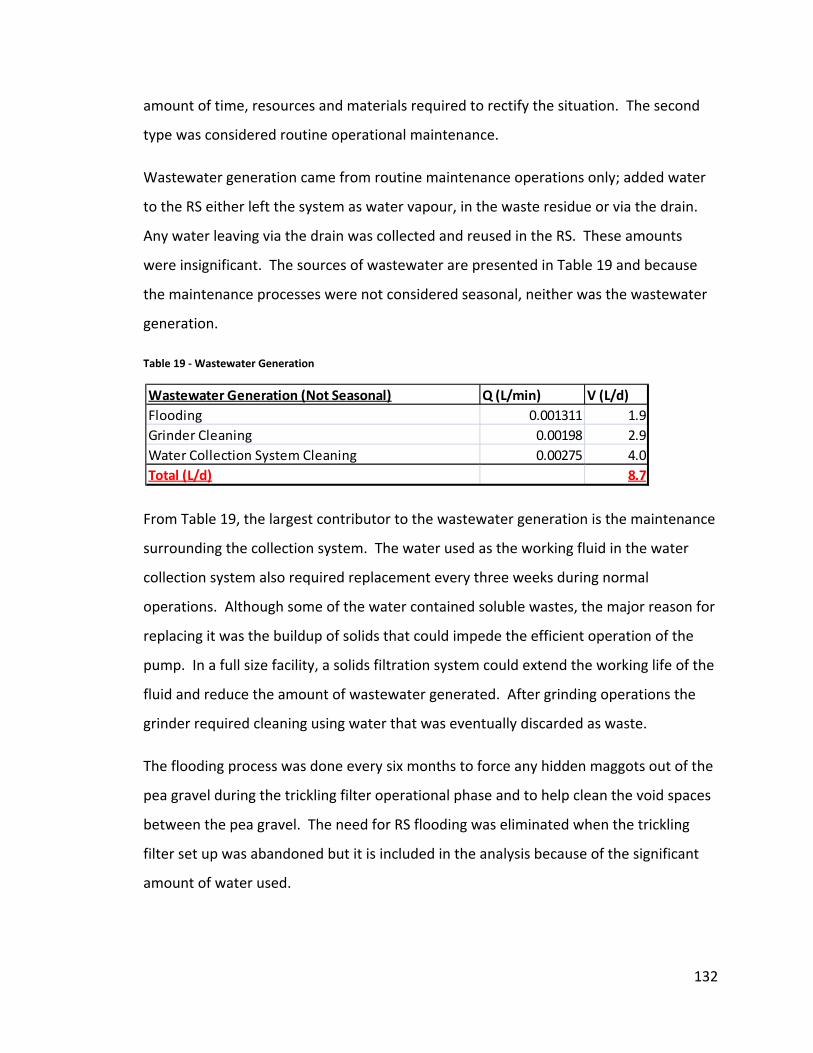
amount of time, resources and materials required to rectify the situation. The second
type was considered routine operational maintenance.
Wastewater generation came from routine maintenance operations only; added water
to the RS either left the system as water vapour, in the waste residue or via the drain.
Any water leaving via the drain was collected and reused in the RS. These amounts
were insignificant. The sources of wastewater are presented in Table 19 and because
the maintenance processes were not considered seasonal, neither was the wastewater
generation.
Table 19 ‐ Wastewater Generation
Wastewater Generation (Not Seasonal) Q (L/min) V (L/d)Flooding 0.001311 1.9Grinder Cleaning 0.00198 2.9Water Collection System Cleaning 0.00275 4.0
Total (L/d) 8.7
From Table 19, the largest contributor to the wastewater generation is the maintenance
surrounding the collection system. The water used as the working fluid in the water
collection system also required replacement every three weeks during normal
operations. Although some of the water contained soluble wastes, the major reason for
replacing it was the buildup of solids that could impede the efficient operation of the
pump. In a full size facility, a solids filtration system could extend the working life of the
fluid and reduce the amount of wastewater generated. After grinding operations the
grinder required cleaning using water that was eventually discarded as waste.
The flooding process was done every six months to force any hidden maggots out of the
pea gravel during the trickling filter operational phase and to help clean the void spaces
between the pea gravel. The need for RS flooding was eliminated when the trickling
filter set up was abandoned but it is included in the analysis because of the significant
amount of water used.
132
In both circumstances the water was discarded into the wetland system of the outer
greenhouse. Prior to this research, the outer greenhouse was used to treat leachate
from the landfill with the aid of plants. When the BSF research first began, the plants in
the polishing stage of the artificial wetland were in poor condition and growth was
scarce.
After approximately four months of operation the plants’ condition improved and their
numbers increased. All other sources of water except infiltration were absent
suggesting that the wastewater contained nutrients that the plants were able to use for
growth and could function as a fertilizer. Nutrient testing of the grinder’s cleaning water
and the collection system’s waste water as well as the wetland’s effluent was not
conducted to determine the extent of nutrient uptake by the plants. As stated
previously however, this process wastewater could conceivably be used for agricultural
purposes.
The last form of maintenance was disposing of the pupation medium. The medium
replacement time varied depending on the amount of infestation of undesirable species
present, typically once every six to seven months. This task was done after emergence
of the adults so that all the materials could be discarded at once. This maintenance is
most likely avoidable in preliminary systems because there is no reason to remove the
pupation medium if infestations are not present. No other forms of maintenance were
required.
6.6 LCI Metrics
In total twelve cycles were run during the course of this research each producing a
differing amount of maggots. These data are listed in Table 20.
133
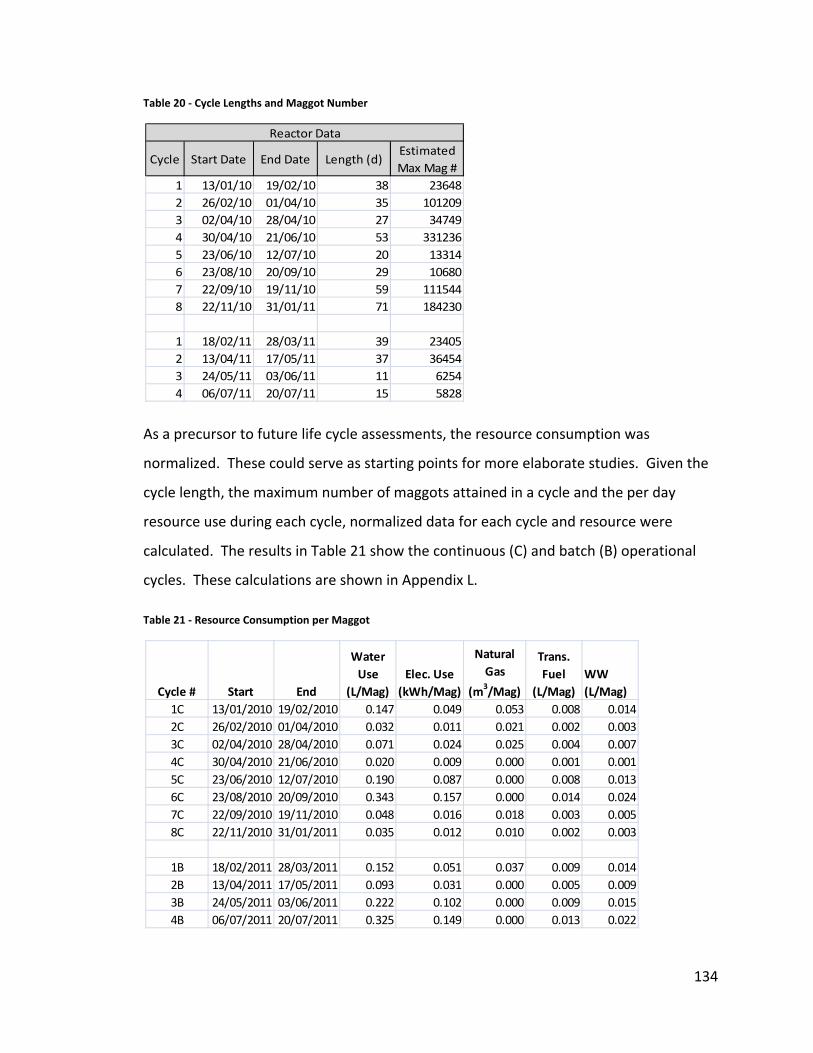
Table 20 ‐ Cycle Lengths and Maggot Number
Cycle Start Date End Date Length (d)Estimated Max Mag #
1 13/01/10 19/02/10 38 236482 26/02/10 01/04/10 35 1012093 02/04/10 28/04/10 27 347494 30/04/10 21/06/10 53 3312365 23/06/10 12/07/10 20 133146 23/08/10 20/09/10 29 106807 22/09/10 19/11/10 59 1115448 22/11/10 31/01/11 71 184230
1 18/02/11 28/03/11 39 234052 13/04/11 17/05/11 37 364543 24/05/11 03/06/11 11 62544 06/07/11 20/07/11 15 5828
Reactor Data
As a precursor to future life cycle assessments, the resource consumption was
normalized. These could serve as starting points for more elaborate studies. Given the
cycle length, the maximum number of maggots attained in a cycle and the per day
resource use during each cycle, normalized data for each cycle and resource were
calculated. The results in Table 21 show the continuous (C) and batch (B) operational
cycles. These calculations are shown in Appendix L.
Table 21 ‐ Resource Consumption per Maggot
Cycle # Start End
Water Use
(L/Mag)Elec. Use
(kWh/Mag)
Natural Gas
(m3/Mag)
Trans. Fuel
(L/Mag)WW (L/Mag)
1C 13/01/2010 19/02/2010 0.147 0.049 0.053 0.008 0.0142C 26/02/2010 01/04/2010 0.032 0.011 0.021 0.002 0.0033C 02/04/2010 28/04/2010 0.071 0.024 0.025 0.004 0.0074C 30/04/2010 21/06/2010 0.020 0.009 0.000 0.001 0.0015C 23/06/2010 12/07/2010 0.190 0.087 0.000 0.008 0.0136C 23/08/2010 20/09/2010 0.343 0.157 0.000 0.014 0.0247C 22/09/2010 19/11/2010 0.048 0.016 0.018 0.003 0.0058C 22/11/2010 31/01/2011 0.035 0.012 0.010 0.002 0.003
1B 18/02/2011 28/03/2011 0.152 0.051 0.037 0.009 0.0142B 13/04/2011 17/05/2011 0.093 0.031 0.000 0.005 0.0093B 24/05/2011 03/06/2011 0.222 0.102 0.000 0.009 0.0154B 06/07/2011 20/07/2011 0.325 0.149 0.000 0.013 0.022
134

The cycles were then ranked by the lowest water and electricity consumption and the
results are shown in Table 22.
Table 22 ‐ Ranked Resource Consumption per Maggot
Cycle # Start End
Water Use
(L/Mag)Elec. Use
(kWh/Mag)
Natural Gas
(m3/Mag)
Trans. Fuel
(L/Mag)WW (L/Mag)
4C 30/04/2010 21/06/2010 0.020 0.009 0.000 0.001 0.0012C 26/02/2010 01/04/2010 0.032 0.011 0.021 0.002 0.0038C 22/11/2010 31/01/2011 0.035 0.012 0.010 0.002 0.0037C 22/09/2010 19/11/2010 0.048 0.016 0.018 0.003 0.0053C 02/04/2010 28/04/2010 0.071 0.024 0.025 0.004 0.0072B 13/04/2011 17/05/2011 0.093 0.031 0.000 0.005 0.0091C 13/01/2010 19/02/2010 0.147 0.049 0.053 0.008 0.0141B 18/02/2011 28/03/2011 0.152 0.051 0.037 0.009 0.0145C 23/06/2010 12/07/2010 0.190 0.087 0.000 0.008 0.0133B 24/05/2011 03/06/2011 0.222 0.102 0.000 0.009 0.0154B 06/07/2011 20/07/2011 0.325 0.149 0.000 0.013 0.0226C 23/08/2010 20/09/2010 0.343 0.157 0.000 0.014 0.024
The results of the ranking can be explained by the amount of maggots produced by each
cycle. Cycles two, four and eight produced the greatest amount of maggots for the
amount resources used. Cycle four is the only cycle in the top five that occurred in the
summer: the other cycles occurred in the winter season and therefore also required the
use of natural gas for heating. This suggests that, because of the greenhouse setup, it
was easier to maintain habitable conditions in the winter than in the summer time. A
greenhouse setup that is operationally sound is therefore critical to the success of any
overall BSF facility, and will probably better serve the needs of the BSF’s rather
extensive intervention technologies (e.g., heating or cooling).
What is missing from this LCI is a characterization of the gases released during this
process. The composition of these gases and therefore the greenhouse gas contribution
of this process are not known.
Direct comparison of the BSF process to a landfilling operation is difficult. Both facilities
are designed to manage incoming waste streams but a landfill is considered final
disposal because nothing comes out of it with the exception of potential groundwater
135

pollutants and methane gas. Although methane gas can be collected and used as a fuel,
the end result is CO2 emissions.
The BSF process is designed to be cyclical in nature keeping nutrients and materials as a
part of the food chain.
6.7 Example Design, EWSWA Projected Waste Tonnage 2012
In order to determine the process’s commercial viability a conceptual cost analysis of
the operations was completed. The scenario describes the use of the large greenhouse
structure at the EWSWA.
In this case study the organic portion of municipal solid waste (MSW) was assumed to
be equal in nutritional content as the restaurant waste used in the experiments.
Although this is most likely not the case, the emphasis of the case study is to show how
the design process would be applied to a waste management scenario. It is
recommended that small waste consumption test studies should be conducted with the
desired food source to determine the waste loading rate for a given food source.
The content of municipal solid waste is also a concern because it can contain materials
and substances that could kill the maggots or could be bio‐amplified in their fat
reserves. Source separation of the MSW will most likely be necessary and costs
associated with this process have been omitted. In addition, prepupae generated by the
facility will need to be preserved for transport – possibly freeze dried. Costs associated
this process have also been omitted.
Transportation costs have been omitted because waste must be transported from the
generation sites to a disposal site regardless of the final disposal method but these
savings would likely be offset by the necessity to sort out the organic portion of the
waste stream. Construction or retrofitting costs and capital expenditures are also
unknown and have therefore been omitted. It was assumed that if the facility can
136

generate revenue after its operating expenses, then construction and capital costs can
be recuperated.
For illustrative purposes, the unit cost of water, electricity and natural gas, were
normalized to a “cost per unit area” to determine the operational costs under the
research conditions: these costs were then used to estimate the operational costs of a
larger building. The unit costs are summarized in Table 23. It was assumed that the
heat transfer rate of the outer greenhouse and the inner greenhouse was the same on a
unit area basis to facilitate analysis. Cost calculations are available in Appendix L.
Table 23 ‐ Resource Costs per Unit Area of Facility
Resource Costs ($/m2)Water 0.03Electricity 0.48Natural Gas 3.72
When used as a nutrition source for the production of other animal species the value of
the produced maggots ranges between $1500 to $2000 USD per ton3. The middle range
of this value, $1750, was used for a cursory monetary analysis of the process using the
research scenario at the EWSWA. Other potential revenue sources from the operation
such as the waste residue and the left over chitin were not considered, only the
potential value of the maggots.
The value of the maggots was also restricted to their use as a protein source for other
forms of livestock or aquaculture. Harvesting the maggots as a source for industrial
chemicals or their precursors was not considered.
The expected tonnage of waste to the EWSWA regional landfill in 2012 was used as an
example design case. The expected tonnage value was obtained from the EWSWA
budget projections for 2012. The example spreadsheet follows and results are shown in
3Hhttp://www.organicvaluerecovery.com/our_process/our_process.htm
137

Tables 24 to 28. The cycle time used was the average of the observed cycle times
throughout the research, 36 days. When calculating the hatchery area requirements, it
was assumed that 2 egg clutches or approximately 800 eggs would fit into the egg
cartridge channels with dimensions of 15 mm by 15 mm by 25.4 mm deep. This value
was based on observations obtained during the course of the research. Values in red
are customizable to reflect changes in real world applications.
Table 24 ‐ Case Inputs
Case Inputs ValuesExpected Tonnage EWSWA 2012(ton/year) 170000(ton/day) 466Landfill Tiping Fee ($/ton) 58.00$
Waste CharacteristicsMoisture Content of Waste (decimal) 0.6Organic Fraction of Waste Stream (decimal) 0.4
Table 25 ‐ Resource Usage
Resource UsageUsage in 36 days ParameterAverage Water Use per Cycle (L) 3828Average Electricity Use per Cycle (kWh) 1522
Average Natural Gas Use Per Cycle (m3) 6
CostsWater Cost ($/L) 0.0003Electricity Use ($/kWh) 0.11
Natural Gas ($/m3) 0.2
Average Costs per Resource in 36 days ($)Water 1Electricity 167Natural Gas 125
Research Resource Costs per Unit Area per 36 days ($/m2)Water 0.03Electricity 0.48Natural Gas 3.72
26
138
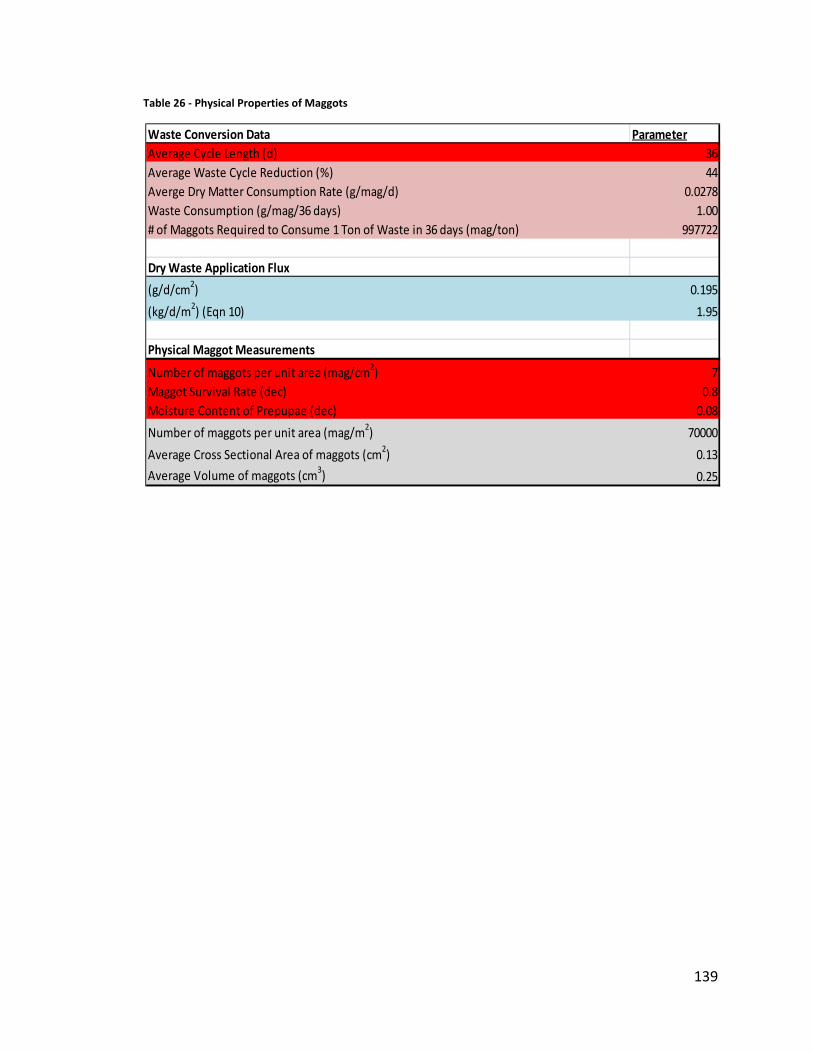
Table 26 ‐ Physical Properties of Maggots
Waste Conversion Data ParameterAverage Cycle Length (d) 36Average Waste Cycle Reduction (%) 44Averge Dry Matter Consumption Rate (g/mag/d) 0.0278Waste Consumption (g/mag/36 days) 1.00# of Maggots Required to Consume 1 Ton of Waste in 36 days (mag/ton) 997722
Dry Waste Application Flux
(g/d/cm2) 0.195
(kg/d/m2) (Eqn 10) 1.95
Physical Maggot Measurements
Number of maggots per unit area (mag/cm2) 7Maggot Survival Rate (dec) 0.8Moisture Content of Prepupae (dec) 0.08
Number of maggots per unit area (mag/m2) 70000
Average Cross Sectional Area of maggots (cm2) 0
Average Volume of maggots (cm3) 0.25
.13
139

Table 27 ‐ Scenario 1 Existing Building
If Building Exists ParameterReactor Dimensions
Building Area (m2) 348
Reactor Area Required to Process One Ton of Dry Waste (m2) (Eqn 11) 14Dry Mass of Maggots Produced From 1 Ton of Dry Waste (kg) (Eqn 12) 113
Cell Size ‐ Reactor Area Required to Produce One Dry Ton of Maggots (m2) (Eqn 13) 126Number of Maggots in One Dry Ton of Maggots (Eqn 14) 7,072,191 System Area Requirement (1 Reactor Cell & Adult Space for 1 Cell) (m2) (Eqn 21) 162Number of Systems That Can Fit in Building (Eqn 22) 2.2Facility Waste Capacity (ton/36 days) (Eqn 23) 19Organic Waste Diverted (ton/year) (Eqn 24) 193Facility Maggot Output (ton/36 days) (Eqn 25) 2.2Dry Organic Waste Diverted (%) 0.71
Egg Survival Rate (dec) 0.6Average Number of Eggs per Clutch (#) 400Percentage of Mating Adults (dec) 0.5Percentage of Emergence (dec) 0.5# of Egg Clutches Per Egg Laying Crevice 800
Egg Laying Crevice Area (m2) 0.000015Adult Space Height (m) 4Adult Density (#/m3) 1666
Adult Room Size for 1 CellNumber of Prepupae from 1 Cell (#) (Eqn 14) 7,072,191 Number of Eggs Required from to Sustain 1 Cell (#) (Eqn 15) 11,786,986 Equivalent Number of Clutches 1 Cell (#) (Eqn 16a) 29,467 Number of Mating Pairs 1 Cell (#) (Eqn 16b) 29,467 Number of Mating Adults 1 Cell (#) (Eqn 16c) 58,935 Required Number of Adults 1 Cell(#) (Eqn 17) 235,740 Volume of Adult Space for 1 Cell (m3) (Eqn 18) 142Floor Area of Adult Space 1 Cell (m2) (Eqn 19) 35Hatchery Area for 1 Cell (located inside adult space area) (m2) (Eqn 20) 0.22
Adult Room Size for FacilityPrepupae Produced by Facility (#) 15,223,667 Number of Eggs Required to Sustain Facility (#) 25,372,779 Equivalent Number of Clutches for Facility (#) 63,432 Number of Mating Pairs for Facility (#) 63,432 Number of Mating Adults for Facility (#) 126,864 Required Number of Adults for Facility (#) 507,456 Volume of Adult Space for Facility (m3) 3Floor Area of Adult Space for Facility (m2) 7Hatchery Area for Facility (located inside adult space area) (m2) 0Facility Harvest Capacity (%) (Eqn 26) 97Number of Prepupae Available for Harvest (#) 14,716,212 Prepupae Produced by Facility for Harvest (ton) 2.1
056
.48
140
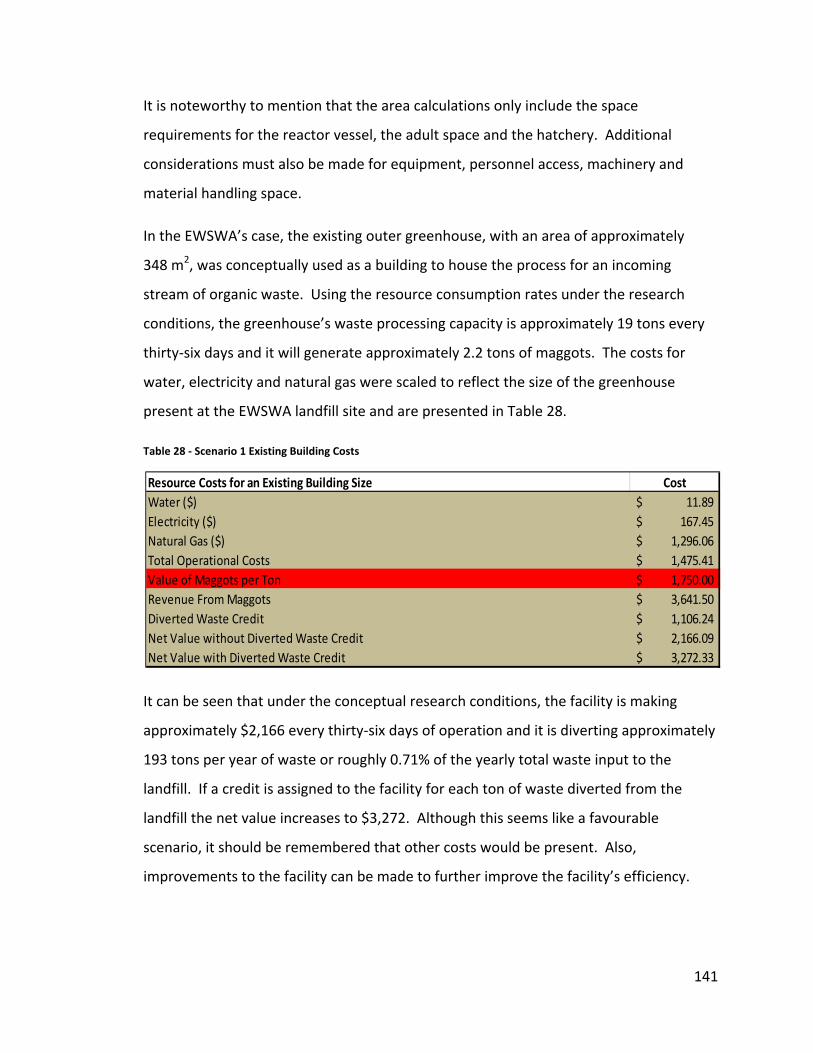
It is noteworthy to mention that the area calculations only include the space
requirements for the reactor vessel, the adult space and the hatchery. Additional
considerations must also be made for equipment, personnel access, machinery and
material handling space.
In the EWSWA’s case, the existing outer greenhouse, with an area of approximately
348 m2, was conceptually used as a building to house the process for an incoming
stream of organic waste. Using the resource consumption rates under the research
conditions, the greenhouse’s waste processing capacity is approximately 19 tons every
thirty‐six days and it will generate approximately 2.2 tons of maggots. The costs for
water, electricity and natural gas were scaled to reflect the size of the greenhouse
present at the EWSWA landfill site and are presented in Table 28.
Table 28 ‐ Scenario 1 Existing Building Costs
Resource Costs for an Existing Building Size CostWater ($) 11.89$ Electricity ($) 167.45$ Natural Gas ($) 1,296.06$ Total Operational Costs 1,475.41$ Value of Maggots per Ton 1,750.00$ Revenue From Maggots 3,641.50$ Diverted Waste Credit 1,106.24$ Net Value without Diverted Waste Credit 2,166.09$ Net Value with Diverted Waste Credit 3,272.33$
It can be seen that under the conceptual research conditions, the facility is making
approximately $2,166 every thirty‐six days of operation and it is diverting approximately
193 tons per year of waste or roughly 0.71% of the yearly total waste input to the
landfill. If a credit is assigned to the facility for each ton of waste diverted from the
landfill the net value increases to $3,272. Although this seems like a favourable
scenario, it should be remembered that other costs would be present. Also,
improvements to the facility can be made to further improve the facility’s efficiency.
141
When compared to the current waste processing option of landfilling, which charges a
tipping fee of $58 per tonne, the use of the BSF facility may be commercially viable
under current operational parameters. The use of BSF as a treatment option could be
viable and suitable. Improvements should be made to the process: these improvements
include efficient energy usage via operation in a building designed or retrofitted for
energy efficiency and increasing the amount of waste that can be processed per unit
area.
6.7.1 Suggested Facility Improvements
There are two major improvements that can be made:
1.) The application flux of the waste must be improved. Under the research
conditions the temperature and humidity variations most likely prevented
optimal waste consumption rates. An improved application flux, such as those
achieved under more controlled conditions by Diener et. al. (2009), 3 to 5
kg/d/m2, would make the reactor vessel smaller so that less space would be
required to process waste. The stabilization of abiotic conditions through the
use of adequate heating, cooling and humidification should increase the
application flux values to those observed by Diener et. al. (2009).
2.) The physical distribution of maggots in the reactor vessel should be improved.
During the research only one layer of maggots was observed during active
feeding in the food pile. No significant numbers of maggots were observed to
feed under this primary layer, which was typically 2.54 to 3.8 cm in depth. This
was most likely a consequence of oxygen availability at the surface and the lack
of it at greater depths. If aeration could be provided the number of maggots
that could “fit” under a given unit area could be increased thereby increasing the
system’s consumption rate and the number of maggots produced for a given
reactor size. This would in turn increase revenues.
142

Further research and experimentation is necessary to determine the feasibility of these
improvements.
The configuration of the reactor cells is also an important consideration. The area
maybe broken up into manageable sizes given space constraints within a particular
building but special attention should be paid to redundancy. One unit is not
recommended for the entire cell area or the adult space. In order to minimize potential
problems from disease or toxicity the required cell area should be divided into sections.
The adult space and hatchery area requirements can also be divided into sections.
Ideally multiple reactor vessels would supply adults to an adult area as illustrated in
Figure 35. Although not shown, the perimeter of the adult space can be increased to
allow for maintenance access.
Adult Space
R.S. R.S.
R.S.
R.S.
Figure 35 ‐ Proposed Layout for Reactor Vessels & Adult Space
It is expected that modest improvements to the application flux and the physical
distribution of maggot density in the reactor space would make the operation more
profitable and desirable. The practicality of realizing and applying these improvements
143
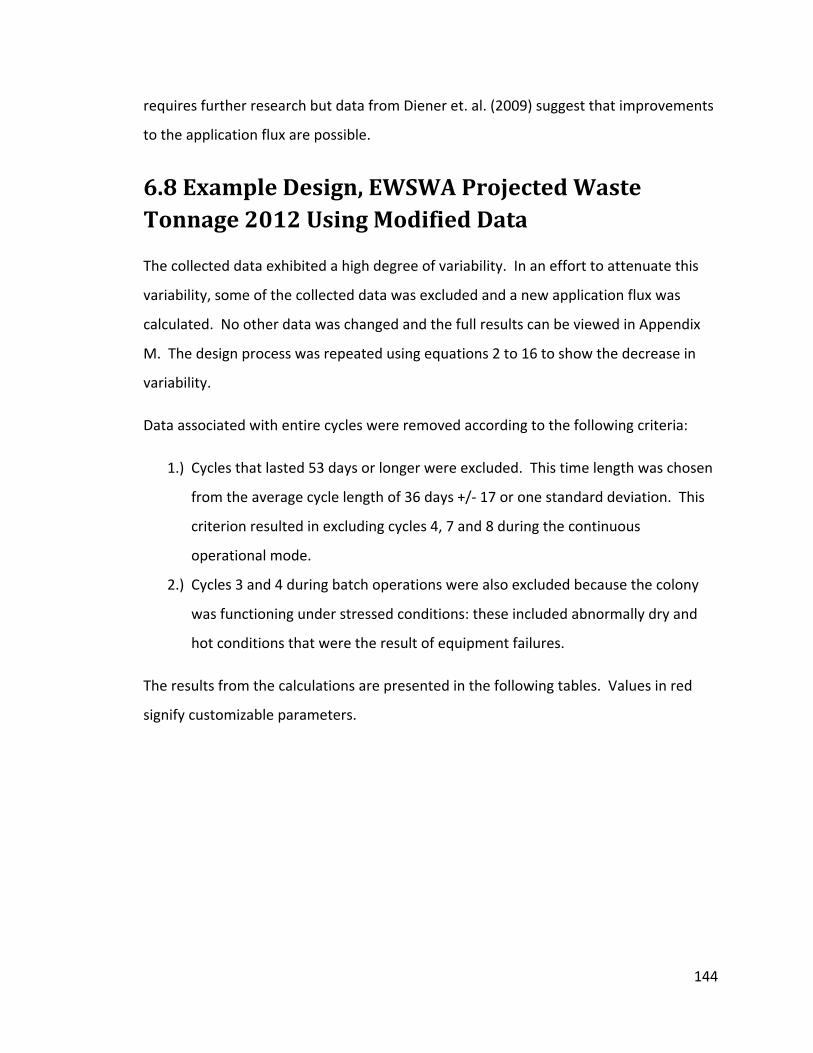
requires further research but data from Diener et. al. (2009) suggest that improvements
to the application flux are possible.
6.8 Example Design, EWSWA Projected Waste Tonnage 2012 Using Modified Data
The collected data exhibited a high degree of variability. In an effort to attenuate this
variability, some of the collected data was excluded and a new application flux was
calculated. No other data was changed and the full results can be viewed in Appendix
M. The design process was repeated using equations 2 to 16 to show the decrease in
variability.
Data associated with entire cycles were removed according to the following criteria:
1.) Cycles that lasted 53 days or longer were excluded. This time length was chosen
from the average cycle length of 36 days +/‐ 17 or one standard deviation. This
criterion resulted in excluding cycles 4, 7 and 8 during the continuous
operational mode.
2.) Cycles 3 and 4 during batch operations were also excluded because the colony
was functioning under stressed conditions: these included abnormally dry and
hot conditions that were the result of equipment failures.
The results from the calculations are presented in the following tables. Values in red
signify customizable parameters.
144

Table 29 ‐ Comparison of Application Flux
Dry Waste Application Flux Parameter Stdev (+/‐) Parameter Stdev (+/‐)(g/d/cm2) 0.195 0.2 0.184 0.0(kg/d/m2) (Eqn 10) 1.95 2 1.84 0
Physical Maggot Measurements Parameter Stdev (+/‐) Parameter Stdev (+/‐)
Number of maggots per unit area (mag/cm2) 7 0.2Maggot Survival Rate (dec) 0.8 0.00 0.8 0.00
Moisture Content of Prepupae (dec) 0.08 0.00 0.08 0.00
Number of maggots per unit area (mag/m2) 70000 2514 70000 2514
Average Cross Sectional Area of maggots (cm2) 0.13 0.04 0.13 0.04
Average Volume of maggots (cm3) 0.25 0.09 0.25 0.09
Case 1 ‐ Entire Data Set
Case 1 ‐ Entire Data Set
Case 2 ‐ Modified Data Set
Case 2 ‐ Modified Data Set
5 7 0.25
As can be seen in Table 29 the application flux does not change by a significant amount
but the standard deviation is much smaller.
Table 30 – Reactor Space Design Comparison
If Building Exists Parameter Stdev (+/‐) Parameter Stdev (+/‐)
Reactor Dimensions
Building Area (m2) 348 0 348 0
Reactor Area Required to Process One Ton of Dry Waste (m2) (Eqn 11) 14 13 15 4Dry Mass of Maggots Produced From 1 Ton of Dry Waste (kg) (Eqn 12) 113 104 120 33Cell Size ‐ Reactor Area Required to Produce One Dry Ton of Maggots (m2) (Eqn 13) 126 164 126 49Number of Maggots in One Dry Ton of Maggots (Eqn 14) 7,072,191 427,938 7,072,191 427,938
System Area Requirement (1 Reactor Cell & Adult Space for 1 Cell) (m2) (Eqn 21) 162 165 162 54Number of Systems That Can Fit in Building (Eqn 22) 2.2 2.8 2.2 0.8Facility Waste Capacity (ton/36 days) (Eqn 23) 19 17 18 5Organic Waste Diverted (ton/year) (Eqn 24) 193 201 182 61Facility Maggot Output (ton/36 days) (Eqn 25) 2.2 2.8 2.2 0.8Dry Organic Waste Diverted (%) 0.71 0.74 0.67 0.22
Case 2 ‐ Modified Data SetCase 1 ‐ Entire Data Set
The reactor space’s design is also not significantly affected by the subtle change in the
application flux but the design is now bound by more reasonable limits.
145
Table 31 ‐ Adult Space Design Comparison
Adult Room Parameters Parameter Stdev (+/‐) Parameter Stdev (+/‐)Egg Survival Rate (dec) 0.6 0 0.6 0
Average Number of Eggs per Clutch (#) 400 252 400 252Percentage of Mating Adults (dec) 0.5 0 0.5 0Percentage of Emergence (dec) 0.5 0 0.5 0# of Egg Clutches Per Egg Laying Crevice 800 0 800 0
Egg Laying Crevice Area (m2) 0.000015 0 0.000015 0Adult Space Height (m) 4 0 4 0
Adult Density (#/m3) 1666 0 1666 0
Adult Room Size for 1 Cell Parameter Stdev (+/‐) Parameter Stdev (+/‐)Number of Prepupae from 1 Cell (#) (Eqn 14) 7,072,191 427,938 7,072,191 427,938 Number of Eggs Required from to Sustain 1 Cell (#) (Eqn 15) 11,786,986 713,231 11,786,986 713,231 Equivalent Number of Clutches 1 Cell (#) (Eqn 16a) 29,467 18,658 29,467 18,658 Number of Mating Pairs 1 Cell (#) (Eqn 16b) 29,467 18,658 29,467 18,658 Number of Mating Adults 1 Cell (#) (Eqn 16c) 58,935 37,316 58,935 37,316 Required Number of Adults 1 Cell(#) (Eqn 17) 235,740 149,262 235,740 149,262 Volume of Adult Space for 1 Cell (m3) (Eqn 18) 142 90 142 90
Floor Area of Adult Space 1 Cell (m2) (Eqn 19) 35 22 35 22
Hatchery Area for 1 Cell (located inside adult space area) (m2) (Eqn 20) 0.22 0.01 0.22 0.01
Adult Room Size for Facility Parameter Stdev (+/‐) Parameter Stdev (+/‐)Prepupae Produced by Facility (#) 15,223,667 19,757,700 15,223,667 5,929,300 Number of Eggs Required to Sustain Facility (#) 25,372,779 32,893,690 25,372,779 9,762,174 Equivalent Number of Clutches for Facility (#) 63,432 91,518 63,432 46,997 Number of Mating Pairs for Facility (#) 63,432 91,518 63,432 46,997 Number of Mating Adults for Facility (#) 126,864 183,036 126,864 93,993 Required Number of Adults for Facility (#) 507,456 732,143 507,456 375,973 Volume of Adult Space for Facility (m3) 305 439 305 226
Floor Area of Adult Space for Facility (m2) 76 110 76 56
Hatchery Area for Facility (located inside adult space area) (m2) 0.48 0.617 0.48 0.185Facility Harvest Capacity (%) (Eqn 26) 97 181 97 54Number of Prepupae Available for Harvest (#) 14,716,212 19,771,261 14,716,212 5,941,208 Prepupae Produced by Facility for Harvest (ton) 2.1 2.8 2.1 0.8
Resource Costs for an Existing Building Size Cost CostWater ($) 11.89$ 11.89$ Electricity ($) 167.45$ 167.45$ Natural Gas ($) 1,296.06$ 1,296.06$ Total Operational Costs 1,475.41$ 1,475.41$ Value of Maggots per Ton 1,750.00$ 1,750.00$ Revenue From Maggots 3,641.50$ 3,641.50$ Diverted Waste Credit 1,106.24$ 1,042.29$ Net Value without Diverted Waste Credit 2,166.09$ 2,166.09$
Net Value with Diverted Waste Credit 3,272.33$ 3,208.38$
Case 2 ‐ Modified Data Set
Case 2 ‐ Modified Data Set
Case 2 ‐ Modified Data Set
Case 2 ‐ Modified Data Set
Case 1 ‐ Entire Data Set
Case 1 ‐ Entire Data Set
Case 1 ‐ Entire Data Set
Case 1 ‐ Entire Data Set
The design of the adult space is also affected in a similar fashion as the reactor space;
the spread of the data is lower. Based on the comparison carried out in this section the
physical design of the system was not significantly affected. Costs are also not affected
146

significantly. The spread of the data however was affected significantly and these new
bounds seem to constrain the design of the subsystems within more reasonable limits.
147

Chapter 7 – Conclusions, Recommendations and Avenues for Further Research
148
7.0 Conclusions, Recommendations and Areas for Further Research
In this research, the Black Solider Fly (Hermetia illucens) or “BSF” is used as a waste
management tool in a similar fashion to vermicomposting. This research also
determined that a controlled environment can successfully propagate the species at
higher latitudes. The conceptual design of a waste facility that could use BSF as the
primary waste processing agent was completed. In addition, the groundwork for a
sustainability assessment of the process and a comparison to current waste disposal
practices for organic wastes was established.
This research propagated a colony of BSF for two years despite some mechanical
problems with equipment. A facility was designed, constructed and revised for two
years. During these two years, data from eight continuous mode cycles and four batch
cycles was collected. This operation included all life cycle stages of the BSF and proved
that the flies can be propagated successfully in northern climates.
This research also established a method and identified necessary parameters to design a
waste management facility based on the physical properties of the BSF larva. A waste
application rate was used to design the primary reactor space and other required
infrastructure.
7.1 Prep Area
A suitable food processing area will be required in a full sized facility. During this
research the food source was ground up to promote homogeneity of the resource and
to discourage pests from entering the facility. A grinder capable of processing waste in
the full sized facility could be too costly (capital and operational) for the provided
benefits. The option to use a large scale grinder must be further evaluated before use in
a large scale facility. The logistics of handling tonnes of waste were not considered in
this research but the use of heavy machinery is anticipated.
149

7.2 Reactor Space
The construction of the reactor space would ideally consist of a material that is resistant
to oxidation but based on the size of the required reactor cells this would most likely
prove too expensive. Careful attention should be paid to maggot containment; any
small crevices must be sealed. The only sealant used in this research that withstood the
maggots was expanding insulation foam. The maggots destroyed acrylic caulking and
silicone.
The walls of the reactor should be inclined at 30o to facilitate outward migration and fins
should be attached spaced no more than 4 cm apart, their thickness is not relevant but
more fins are expected to facilitate outward migration. The walls should be roughened
to give the maggots a gripping surface. Aeration of the food pile must be provided
either by mechanical mixing or via an aeration system. This will allow for higher maggot
densities, resulting in a higher feed application flux and therefore a more efficient
system operation. The use of a bulking agent may not be required if the feed is not
ground.
The use of real‐time monitoring equipment, O2 sensors, humidity sensors and
temperature sensors is highly recommended. Feedback based control of the water and
heating systems will make the operation more efficient and cost effective. Operations
should be run in batch mode: this will facilitate maintenance and cleaning operations
and build facility resiliency by isolating negative effects to one production cycle.
7.3 Exit Ramp
This subsystem can be removed; the containment walls of the reactor vessel can be
adapted to serve the same function as the exit ramp.
150

7.4 Collection System
The collection system piping can remain as four‐inch ABS provided that a sufficient flow
of water is present to prevent clogging by maggots. A solids removal system should be
incorporated into the water reservoir to extended the life of the fluid and reduce
wastewater production. The pump should be sized to maintain a fluid depth of at least
1 cm. The slope of the tubing should be sufficient to promote gravity drainage: in this
research a slope of 1.5% was used.
7.5 Separator
The design of the separator may be subject to change given the number of maggots
generated by a full sized facility. The piping diameter may need to be increased to
prevent bottlenecks or more than one separator may need installation. It has been
suggested that maggots do not like the light. In addition to providing a sufficient
amount of water flow to force the maggots out of the separator, the use of lighting in
the separation device should be explored to encourage maggots to leave the separation
device.
7.6 Pupation Chamber
The pupation chamber must be kept at a suitable moisture level, 60% to 70%, to prevent
desiccation of the pupa. It would also be practical if the medium grain size was smaller
than the pupae but larger than the spiracle to allow mechanical sieving. The reason for
the sieving is that the pupal casings that adults leave behind after they emerge are a
food source for pests and could be valuable product for industrial processes that require
chitin. The removal of these casings will also become necessary as they build up over
the course of time. The depth of the pupation medium must be kept at a depth
between 15 to 20 centimetres. Wood chips appear to be the most successful pupation
medium (Homes 2010).
151
7.7 Adult Space and Hatchery
The construction of the adult space must be done with special attention so that crevices
are minimized and seams are sealed. This is vital to ensure that eggs are laid only the
designated areas. Open floor space is important because many adults were observed to
mate on the ground and cleaning up the dead adult carcasses will prevent other pests
from entering the space. The use of plant life is recommended because males like to
claim territories on leaves during mating. The adult space should have its own
independent environmental controls and separate ventilation.
The hatchery should also have its own environmental controls to prevent the
desiccation of eggs. The same attention paid to the minimization of seams and crevices
in the adult space must also be used in the hatchery because any eggs laid outside of the
intended location represent a loss in productivity and it will encourage other flies to lay
eggs in those locations.
The use of disposable flutes is recommended. Research suggests that egg laying sites
can become saturated with pheromones that will discourage females from laying their
eggs there. The use of new cardboard flutes should prevent this occurrence.
7.8 Facility Design
The research conducted at the EWSWA landfill had mixed results. Although the values
were obtained for key design parameters the methods used to sample the maggot
number at any given time produced data with a high degree of variability. Contributing
factors to this variability include the following:
• The maggot population within a given space is naturally highly variable, the
number of live maggots changes constantly and is a function of the death rate,
outward migration rate and the rate of incoming new maggots; and
• The nature of the sampling approach, using four 250 mL samples, could have
missed some maggots or some maggots may have been too small to see and
152

therefore count. It was also observed that maggots changed location in the
waste pile. Further investigations should reduce volume measurements to one
dimension, the food pile depth while keeping the area constant.
Despite these setbacks the relationships between design parameters were characterized
and a design process was elucidated. The primary design parameter was the average
dry daily consumption rate (cDCRM) which allowed for the calculation of the application
flux.
The conceptual design results reveal that a large facility size is required to process all of
the daily waste amounts. In the EWSWA example case, the amount of waste that is
diverted from burial in the landfill site is extremely low. The system may be better
suited to agricultural applications where waste quantities and types result in shorter
processing times allowing for higher diversion values. Despite this fact the use of BSF
may still be a viable option for the production of a high quality protein animal feed. The
estimated harvest rate of the system appears to be very high and the prepupae sell for
$1500 to $2000 per ton.
The use of the maggot‐exit ratio was limited or else non‐existent and no conclusion
could be made based on available data concerning its reliability at describing conditions
in the reactor. Further research is needed determine if this ratio has any descriptive
value.
Overall it would appear that BSF can be successfully cultivated year round at higher
latitudes; however, under the specific research conditions explored the benefit exceeds
the costs by a small margin. There are two possible ways to improve this situation. The
first approach involves making improvements to the application flux – it must be higher
than those attained in these trials.
This can be accomplished by increasing the number of maggots that can reside under a
given area by increasing the depth of the resource and providing aeration; this will
increase the magnitude of the application flux and reduce the area required to process
153
one ton of waste, boosting efficiencies to commercially viable levels by reducing
building area requirements.
With the use of aeration maggots can be “stacked” on top of each other. Given that a
single maggot is two centimeters long, it is conceivable that up to ten layers of maggots
can fit into one square centimeter for a depth of twenty centimeters. Aeration may also
increase the depths at which maggots can consume waste effectively.
The other approach is to improve the efficiency of resource consumption. The research
was not conducted in an energy efficient setting. The greenhouse construction did not
provide adequate insulation and maintaining suitable environmental conditions was
difficult and costly. Full greenhouse construction is not recommended. The use of
timers to control the resource delivery machinery was inefficient but had low capital
costs. The use of sensors and software to control the resource delivery machinery will
also improve the efficient use of resources which will in turn drive costs down.
7.9 Further Research
The area requirement for the facility stems from the assumption that only one layer of
maggots can feed in a given area. This assumption was made to facilitate calculations
because stratification was not observed to a great degree in the EWSWA facility during
experiments. This is most likely the result of the lower oxygen availability at the deeper
levels of the food resource. This is perhaps the most significant area for improvement; if
oxygen can be delivered to these areas, stratification may become more common
increasing the value of the application flux which would allow for smaller reactor sizes
thereby decreasing the facility size.
Pre and post processing logistical issues require further research. If the facility is to be
used for the processing of MSW, costs associated with source separation and
transportation to the facility must be addressed. Costs associated with preserving the
prepupae that are produced will also require further economic analysis to determine if
the process is economically viable.
154

Another consideration is the type of waste being consumed. Fats and proteins can be
difficult for BSF to consume and the experimental diet, restaurant waste, was high in
these constituents. Small‐scale waste consumption trials are recommended with the
incoming waste stream to determine the average dry daily waste consumption rate
prior to any system design.
The effects of temperature on the waste consumption rate should be further studied.
The temperatures during these trials varied despite the attempts to control them.
Carefully controlled studies done at different temperature would help determine the
extent of temperature effects on the dry waste consumption rate and establish feeding
kinetics.
Another potentially useful parameter is the amount of heat generated by a given
volume of maggots. In the winter months this heat could be a helpful contributor to the
design of heating systems. In the summer months this information would aid in the
design of cooling systems.
In order to gain a more complete view of the process’s sustainability, greenhouse gas
contribution and potential adult fly attractants, the gases emitted by feeding maggots
should be determined. An LCI characterized the flow of resources in the experiments
but an LCA was not conducted.
The use of the trickling filter approach proved the most effective method of cultivating
maggots but this could just be a consequence of the waste being ground up. If the feed
stream is not ground this approach may lose its effectiveness. There were also
problems with cleaning and maintenance issues that would be compounded in a full‐
scale facility. More experimentation is required to determine is this setup would be
functional.
A constant consumption model was assumed to determine the average dry daily
consumption rate. As previously stated, this is most likely not the case. A study that
155
considers all of the factors that affect the waste consumption rate would be useful for
predictive purposes.
The nutritional requirements of the BSF larvae is an area for future research. The
nutrients obtained by the larvae affect adult characteristics. In this research restaurant
waste was the only diet fed to the developing larvae. Although this single diet source
allowed for very good control measure, this lack of variability could have affected the
reproductive success of the adults and other adult characteristics. Further research to
determine when the larvae need changes to their diet would further aid the effective
operation of a BSF waste management facility.
The most cost effective use of the produced resources should be further explored.
Although the clearest use for the maggots is as a protein supplement in animal
husbandry and aquaculture, the chemicals contained within the maggots could be used
as an input in industrial production processes. The chitin leftover by the adults after
they emerge may also have commercial value. The waste residue itself may also have
use as a fertilizer and soil conditioner. It could be mixed with existing compost to add
nitrogen; this would depend on the food source used by the maggots.
There are still many unknowns surrounding the adult BSF’s mating behaviours. It is
known that light plays a role and its intensity is an important factor. What is not known
is the range of wavelengths that stimulate mating behaviours. Since electricity costs are
a significant contributor to operational expenses, precise knowledge of the stimulating
wavelengths could allow for the use of supplemental LED lighting which could result in
significant power savings.
The optimal adult density for mating is also a variable that needs further study. In
designs based on this research the optimal density was considered the highest observed
value based on experiments. This assumption was necessary to complete calculations
but it may not be the optimal density and since this value directly influences space
requirements for the adult space, further study is necessary.
156

A means to accurately count adult numbers in real time would assist further research
efforts into adult BSF behaviour. The attempted method used here proved impractical
and unreliable. Instead, estimates were made from data collected during the mass
balance experiments but this was done after the adults had completed their life stage.
The use of BSF presents an innovative and unique approach to waste solid waste
management. With modest improvements, the process could generate a revenue
stream, generate a value‐added product and reduce the amount of organic waste that is
disposed in landfills.
157

158
Vita Auctoris
Luis Alvarez was born in 1976 in San Miguel, El Salvador. He immigrated to Canada in 1983. He is holds a bachelor’s degree in Biology and Environmental Engineering. He is a professional engineer in Ontario. He is interested in environmental issues and hopes to pursue work in that field.